citizens talk ii a citizen satisfaction survey report ... report... · a citizen satisfaction...
TRANSCRIPT

PUBLIC SERVICE COMMISSION
CITIZENS TALK II
A Citizen Satisfaction Survey
Report
MARCH 2012
PUBLIC SERVICE COMMISSION
CITIZENS TALK II: A CITIZEN SATISFACTION SURVEY REPORT Page i
FOREWORD
Citizens as users of public services increasingly expect more from government. In order to
improve citizens’ level of satisfaction with public services, it is critical that government
delivers more personalized services and on terms that better suit the service users’ needs.
For this reason, one of government’s outcome objectives emphasises the need for an
efficient, effective and development oriented public service and an empowered, fair and
inclusive citizenship. Therefore, a Citizen Satisfaction Survey is one methodology that
provides an opportunity to engage citizens on their views regarding government services.
The Public Service Commission (PSC) has, through its Constitutional mandate of promoting
good governance in the Public Service, been conducting Citizen Satisfaction Surveys as one
of its mechanisms to consult citizens and to determine their views on service delivery. The
2011/12 Citizen Satisfaction Survey departs slightly from the previous surveys as it included
the local sphere of government in its sample. The PSC is of the view that a responsive,
accountable, effective and efficient local government system will, amongst others, be judged
by the satisfaction levels of the members of the communities who depend on government
services on daily basis.
The findings of the 2011/12 Citizen Satisfaction Survey show that there are pockets of
excellence in the government as much as there are areas that require improvement in
service delivery cutting across all the institutions that participated in the survey. The findings
show that service users were most satisfied with the fairness and equity displayed by
public servants during service delivery and least satisfied with redress mechanisms. The
findings also show that comparatively, the lowest level of overall citizen satisfaction was with
services provided by the Emfuleni Local Municipality and the highest level was with the
services provided by uMlalazi Municipality.
The PSC wishes to thank the South African Social Security Agency, Nelson Mandela Bay
and Mangaung Metropolitan Municipalities as well as the Emfuleni, Madibeng and uMlalazi
Local Municipalities for participating in the study. We also wish to thank the German
International Cooperation (GIZ) for their contribution and for funding the study.
I trust that the findings and recommendations emanating from this report will assist the
institutions that participated in this survey in improving the much needed services to citizens.
MR B MTHEMBU
CHAIRPERSON: PUBLIC SERVICE COMMISSION
PUBLIC SERVICE COMMISSION
CITIZENS TALK II: A CITIZEN SATISFACTION SURVEY REPORT Page ii
TABLE OF CONTENTS
FOREWORD ......................................................................................................................... i
LIST OF TABLES ................................................................................................................ vi
LIST OF FIGURES ............................................................................................................. vii
EXECUTIVE SUMMARY ...................................................................................................... x
CHAPTER ONE: INTRODUCTION ...................................................................................... 1
1.1 BACKGROUND....................................................................................................................... 1
1.2 OBJECTIVES OF THE STUDY .............................................................................................. 1
1.3 STRUCTURE OF THE REPORT ............................................................................................ 2
CHAPTER TWO: METHODOLOGY .................................................................................... 3
2.1 INTRODUCTION ..................................................................................................................... 3
2.2 SCOPE OF THE STUDY ........................................................................................................ 3
2.3 METHODOLOGY .................................................................................................................... 3
2.4 DATA COLLECTION ............................................................................................................... 5
2.5 DATA ANALYSIS .................................................................................................................... 6
2.6 LIMITATIONS OF THE STUDY .............................................................................................. 6
CHAPTER THREE: OVERVIEW OF THE KEY FINDINGS ................................................. 7
3.1 INTRODUCTION ..................................................................................................................... 7
3.2 SERVICE USER’S LEVEL OF SATISFACTION WITH SERVICES RENDERED BY THE
INSTITUTIONS ....................................................................................................................... 7
CHAPTER FOUR: KEY FINDINGS: SOUTH AFRICAN SOCIAL SECURITY AGENCY
(SASSA)............................................................................................................... 13
4.1 INTRODUCTION ................................................................................................................... 13
4.2 DEMOGRAPHIC PROFILE ................................................................................................... 13
4.3 KEY FINDINGS ..................................................................................................................... 13
4.4 ACCESS ................................................................................................................................ 14
4.5 COURTESY .......................................................................................................................... 16
4.6 TIMELINESS ......................................................................................................................... 18
4.7 INFORMATION ..................................................................................................................... 19
4.8 KNOWLEDGE AND COMPETENCE .................................................................................... 21
4.9 FACILITIES ........................................................................................................................... 23
4.10 FAIRNESS AND EQUITY ..................................................................................................... 24
4.11 VALUE FOR MONEY ............................................................................................................ 26
4.12 REDRESS ............................................................................................................................. 27

PUBLIC SERVICE COMMISSION
CITIZENS TALK II: A CITIZEN SATISFACTION SURVEY REPORT Page iii
4.13 OUTCOME ............................................................................................................................ 30
4.14 RECOMMENDATIONS ......................................................................................................... 31
CHAPTER FIVE: KEY FINDINGS: NELSON MANDELA BAY METROPOLITAN
MUNICIPALITY .................................................................................................................. 33
5.1 INTRODUCTION ................................................................................................................... 33
5.2 DEMOGRAPHIC PROFILE ................................................................................................... 33
5.3 KEY FINDINGS ..................................................................................................................... 33
5.4 ACCESS ................................................................................................................................ 34
5.5 COURTESY .......................................................................................................................... 35
5.6 TIMELINESS ......................................................................................................................... 36
5.7 INFORMATION ..................................................................................................................... 37
5.8 KNOWLEDGE AND COMPETENCE .................................................................................... 38
5.9 FACILITIES ........................................................................................................................... 39
5.10 FAIRNESS AND EQUITY ..................................................................................................... 40
5.11 VALUE FOR MONEY ............................................................................................................ 41
5.12 REDRESS ............................................................................................................................. 42
5.13 OUTCOME ............................................................................................................................ 45
5.14 RECOMMENDATIONS ......................................................................................................... 46
CHAPTER SIX: KEY FINDINGS: MANGAUNG METROPOLITAN MUNICIPALITY ......... 48
6.1 INTRODUCTION ................................................................................................................... 48
6.2 DEMOGRAPHIC PROFILE ................................................................................................... 48
6.3 KEY FINDINGS ..................................................................................................................... 48
6.4 ACCESS ................................................................................................................................ 49
6.5 COURTESY .......................................................................................................................... 50
6.6 TIMELINESS ......................................................................................................................... 51
6.7 INFORMATION ..................................................................................................................... 52
6.8 KNOWLEDGE AND COMPETENCE .................................................................................... 53
6.9 FACILITIES ........................................................................................................................... 55
6.10 FAIRNESS AND EQUITY ..................................................................................................... 56
6.11 VALUE FOR MONEY ............................................................................................................ 57
6.12 REDRESS ............................................................................................................................. 58
6.13 OUTCOME ............................................................................................................................ 60
6.14 RECOMMENDATIONS ......................................................................................................... 61
CHAPTER SEVEN: KEY FINDINGS: EMFULENI LOCAL MUNICIPALITY ...................... 63
7.1 INTRODUCTION ................................................................................................................... 63
7.2 DEMOGRAPHIC PROFILE ................................................................................................... 63

PUBLIC SERVICE COMMISSION
CITIZENS TALK II: A CITIZEN SATISFACTION SURVEY REPORT Page iv
7.3 KEY FINDINGS ..................................................................................................................... 63
7.4 ACCESS ................................................................................................................................ 64
7.5 COURTESY .......................................................................................................................... 65
7.6 TIMELINESS ......................................................................................................................... 66
7.7 INFORMATION ..................................................................................................................... 67
7.8 KNOWLEDGE AND COMPETENCE .................................................................................... 68
7.9 FACILITIES ........................................................................................................................... 70
7.10 FAIRNESS AND EQUITY ..................................................................................................... 71
7.11 VALUE FOR MONEY ............................................................................................................ 72
7.12 REDRESS ............................................................................................................................. 73
7.13 OUTCOME ............................................................................................................................ 75
7.14 RECOMMENDATIONS ......................................................................................................... 76
CHAPTER EIGHT: KEY FINDINGS: MADIBENG LOCALMUNICIPALITY ....................... 79
8.1 INTRODUCTION ................................................................................................................... 79
8.2 DEMOGRAPHIC PROFILE ................................................................................................... 79
8.3 KEY FINDINGS ..................................................................................................................... 79
8.4 ACCESS ................................................................................................................................ 80
8.5 COURTESY .......................................................................................................................... 81
8.6 TIMELINESS ......................................................................................................................... 82
8.7 INFORMATION ..................................................................................................................... 83
8.8 KNOWLEDGE AND COMPETENCE .................................................................................... 85
8.9 FACILITIES ........................................................................................................................... 86
8.10 FAIRNESS AND EQUITY ..................................................................................................... 87
8.11 VALUE FOR MONEY ............................................................................................................ 88
8.12 REDRESS ............................................................................................................................. 89
8.13 OUTCOME ............................................................................................................................ 91
8.14 RECOMMENDATIONS ......................................................................................................... 92
CHAPTER NINE: KEY FINDINGS: UMLALAZI LOCAL MUNICIPALITY ......................... 95
9.1 INTRODUCTION ................................................................................................................... 95
9.2 DEMOGRAPHIC PROFILE ................................................................................................... 95
9.3 KEY FINDINGS ..................................................................................................................... 95
9.4 ACCESS ................................................................................................................................ 96
9.5 COURTESY .......................................................................................................................... 97
9.6 TIMELINESS ......................................................................................................................... 98
9.7 INFORMATION ..................................................................................................................... 99
9.8 KNOWLEDGE AND COMPETENCE .................................................................................. 100

PUBLIC SERVICE COMMISSION
CITIZENS TALK II: A CITIZEN SATISFACTION SURVEY REPORT Page v
9.9 FACILITIES ......................................................................................................................... 101
9.10 FAIRNESS AND EQUITY ................................................................................................... 102
9.11 VALUE FOR MONEY .......................................................................................................... 103
9.12 REDRESS ........................................................................................................................... 105
9.13 OUTCOME .......................................................................................................................... 107
9.14 RECOMMENDATIONS ....................................................................................................... 108
CHAPTER TEN: CONCLUSION AND RECOMMENDATIONS ....................................... 110

PUBLIC SERVICE COMMISSION
CITIZENS TALK II: A CITIZEN SATISFACTION SURVEY REPORT Page vi
LIST OF TABLES
Table 1: Overall satisfaction rate with services rendered by SASSA and municipalities.......................xii
Table 2: List of selected entity and municipalities .................................................................................. 3
Table 3: Number of service users interviewed per entity and the service delivery points visited .......... 4
Table 4: South African-specific drivers of citizen satisfaction ................................................................ 5
Table 5: Service users' level of satisfaction with services rendered by the selected institutions .......... 7
Table 6: Service user's level of satisfaction with services rendered by SASSA .................................. 14
Table 7: Provincial comparisons – Accessibility to facilities ................................................................ 16
Table 8: Provincial comparison - Courtesy .......................................................................................... 17
Table 9: Provincial comparisons - Timeliness...................................................................................... 19
Table 10: Provincial comparison - Information...................................................................................... 21
Table 11: Provincial comparison – Knowledge and Competence ........................................................ 22
Table 12: Provincial comparison – SASSA Facilities ............................................................................ 24
Table 13: Provincial comparison – Fairness and Equity ....................................................................... 25
Table 14: Provincial comparison – Value for Money ............................................................................ 27
Table 15: Reasons for not lodging a complaint, SASSA ...................................................................... 29
Table 16: Provincial comparison – Outcome ........................................................................................ 31
Table 17: Service users' level of satisfaction with services rendered by Nelson Mandela Bay Metro
Municipality ........................................................................................................................... 34
Table 18: Reason for not lodging a complaint, Nelson Mandela Bay ................................................... 44
Table 19: Service users' level of satisfaction with services rendered by Mangaung Municipality ........ 49
Table 20: Reason for not lodging a complaint, Mangaung ................................................................... 60
Table 21: Service users' level of satisfaction with services rendered by Emfuleni Local Municipality . 63
Table 22: Reason for not lodging a complaint, Emfuleni ...................................................................... 75
Table 23: Service users' level of satisfaction with services rendered by Madibeng Local Municipality 80
Table 24: Reason for not lodging a complaint – Madibeng .................................................................. 91
Table 25: Service users' level of satisfaction with services rendered by uMlalazi Local Municipality .. 95
Table 26: Reasons for not lodging a complaint .................................................................................. 107
Table 27: Overall satisfaction rate with services rendered by SASSA and municipalities ................. 110
Table 28: Number of respondents at each SASSA Service Point ...................................................... 112
PUBLIC SERVICE COMMISSION
CITIZENS TALK II: A CITIZEN SATISFACTION SURVEY REPORT Page vii
LIST OF FIGURES
Figure 1: Rating the experience pertaining to accessibility of public services ..................................... 15
Figure 2: Rating the experience pertaining to courtesy displayed by public officials in service delivery
.............................................................................................................................................................. 17
Figure 3: Rating the experience pertaining to timeliness in the delivery of public services ................. 18
Figure 4: Rating the experience pertaining to the provision of information in public services ............. 20
Figure 5: Rating the experience pertaining to the knowledge and competence of government officials
.............................................................................................................................................................. 22
Figure 6: Rating the experience pertaining to the condition of public facilities .................................... 23
Figure 7: Rating the experience pertaining to fairness and equity displayed by officials .................... 25
Figure 8: Rating the experience pertaining to value for money in service delivery ............................. 26
Figure 9: Have you ever experienced problems with other products of service? ................................ 28
Figure 10: How often have you experienced problems with the service? ............................................ 28
Figure 11: Satisfaction with problem resolution .................................................................................... 29
Figure 12: Rating the experience pertaining to obtaining outcome in service delivery......................... 30
Figure 13: Rating the experience pertaining to accessibility to public services .................................... 35
Figure 14: Rating the experience pertaining to courtesy displayed by public officials in service delivery
.............................................................................................................................................................. 36
Figure 15: Rating the experience pertaining to timeliness in the delivery of public services ................ 37
Figure 16: Rating the experience pertaining to the provision of information in public service .............. 38
Figure 17: Rating the experience pertaining to the knowledge and competence of government officials
.............................................................................................................................................................. 39
Figure 18: Rating the experience pertaining to the condition of public facilities ................................... 40
Figure 19: Rating the experience pertaining to fairness and equity displayed by officials ................... 41
Figure 20: Rating the experience pertaining to value for money in service delivery ............................ 42
Figure 21: Have you ever experienced problems with the products or service? .................................. 43
Figure 22: How often have you experienced problems with the service? ............................................ 43
Figure 23: Rating users’ satisfaction with how the problem was resolved ........................................... 44
Figure 24: Rating the experience pertaining to obtaining outcome in service delivery......................... 45
Figure 25: Rating the experience pertaining to accessibility to public services .................................... 50
Figure 26: Rating the experience pertaining to courtesy displayed by public officials in service delivery
.............................................................................................................................................................. 51
Figure 27: Rating the experience pertaining to timeliness in the delivery of public services ................ 52
Figure 28: Rating the experience pertaining to the provision of information in public service .............. 53
Figure 29: Rating the experience pertaining to the knowledge and competence of government officials
.............................................................................................................................................................. 54
Figure 30: Rating the experience pertaining to the condition of public services................................... 55
Figure 31: Rating the experience to fairness and equity displayed by officials .................................... 56

PUBLIC SERVICE COMMISSION
CITIZENS TALK II: A CITIZEN SATISFACTION SURVEY REPORT Page viii
Figure 32: Rating the experience pertaining to value for money in service delivery ............................ 57
Figure 33: Have you experienced problems with the products or service? .......................................... 58
Figure 34: How often have you experienced problems with the service? ............................................ 59
Figure 35: Rating the satisfaction with how problem was resolved ...................................................... 59
Figure 36: Rating the experience pertaining to obtaining outcome in service delivery......................... 61
Figure 37: Rating the experience pertaining to accessibility to public services .................................... 64
Figure 38: Rating the experience pertaining to courtesy displayed by public officials in service delivery
.............................................................................................................................................................. 66
Figure 39: Rating the experience pertaining to timeliness in the delivery of public services ................ 67
Figure 40: Rating the experience pertaining to the provision of information in public services ............ 68
Figure 41: Rating the experience pertaining to the knowledge and competence of government officials
.............................................................................................................................................................. 69
Figure 42: Rating the experience pertaining to the condition of public facilities ................................... 70
Figure 43: Rating the experience pertaining to fairness and equity displayed by officials ................... 71
Figure 44: Rating the experience pertaining to value for money in service delivery ............................ 72
Figure 45: Have you ever experienced problems with the products or services? ................................ 73
Figure 46: How often have you experienced problems with the service? ............................................ 74
Figure 47: Rating the satisfaction with how problem was resolved ...................................................... 75
Figure 48: Rating the experience pertaining to obtaining outcome in service delivery......................... 76
Figure 49: Rating the experience pertaining to accessibility to public services .................................... 81
Figure 50: Rating the experience pertaining to courtesy displayed by public officials in service delivery
.............................................................................................................................................................. 82
Figure 51: Rating the experience pertaining to timeliness in the delivery of public services ................ 83
Figure 52: Rating the experience pertaining to the provision of information in public service .............. 84
Figure 53: Rating the experience pertaining to the knowledge and competence of government officials
.............................................................................................................................................................. 85
Figure 54: Rating the experience pertaining to the condition of public facilities ................................... 86
Figure 55: Rating the experience pertaining to fairness and equity displayed by officials ................... 87
Figure 56: Rating the experience pertaining to value for money in service delivery ............................ 88
Figure 57: Have you ever experienced problems with the products or service? .................................. 89
Figure 58: How often have you experienced problems with the service? ............................................ 90
Figure 59: Rating the satisfaction with how problem was resolved ...................................................... 91
Figure 60: Rating the experience pertaining to obtaining outcome in service delivery......................... 92
Figure 61: Rating the experience pertaining to accessibility of public services .................................... 97
Figure 62: Rating the experience pertaining to courtesy displayed by public officials in service delivery
.............................................................................................................................................................. 98
Figure 63: Rating the experience pertaining to timeliness in the delivery of public service ................. 99
Figure 64: Rating the experience pertaining to the provision of information in public services .......... 100

PUBLIC SERVICE COMMISSION
CITIZENS TALK II: A CITIZEN SATISFACTION SURVEY REPORT Page ix
Figure 65: Rating the experience pertaining to the knowledge and competence of government officials
............................................................................................................................................................ 101
Figure 66: Rating the experience pertaining to the condition of public facilities ................................. 102
Figure 67: Rating the experience pertaining to fairness and equity displayed by officials ................. 103
Figure 68: Rating the experience pertaining to value for money in service delivery .......................... 104
Figure 69: Have you experienced problems with the products or service? ........................................ 105
Figure 70: How often have you experienced problems with the service? .......................................... 106
Figure 71: Rating the satisfaction with how problem was solved ....................................................... 106
Figure 72: Rating the experience pertaining to obtaining outcome in service delivery....................... 108
PUBLIC SERVICE COMMISSION
CITIZENS TALK II: A CITIZEN SATISFACTION SURVEY REPORT Page x
EXECUTIVE SUMMARY
INTRODUCTION
This report presents findings of the Public Service Commission’s 2011 Citizen Satisfaction
Survey conducted amongst the service users of government services. It is the view of the
democratic government that active participation by citizens in government processes will
improve the government-rendered services, thereby contributing to the citizen satisfaction
with such services.
OBJECTIVES OF THE STUDY
The objectives of the study were to:
Measure the level of citizen satisfaction of service users based on key drivers of
citizen satisfaction.
Determine areas of service which service users are not satisfied with for improved
service delivery.
Provide recommendations on how service delivery in the identified areas could be
improved.
SCOPE OF THE STUDY
The scope of the study included one national entity, namely the South African Social
Security Agency (SASSA), two Metropolitan Municipalities, namely, Nelson Mandela Bay
and Mangaung as well as three local Municipalities, namely, Emfuleni, Madibeng and
uMlalazi.
METHODOLOGY
Sampling
The study applied a purposive sampling procedure in selecting the institutions that
participated in the study and their selected service delivery sites. Service users were
sampled according to the random sampling method, which affords every service user an
equal opportunity of being sampled.
DATA COLLECTION PROCESS
A PSC-developed tool was used for collecting both qualitative and quantitative data during

PUBLIC SERVICE COMMISSION
CITIZENS TALK II: A CITIZEN SATISFACTION SURVEY REPORT Page xi
face-to-face interviews with 3146 service users in 56 service delivery sites of SASSA and the
sampled municipalities.
The data collection tool was informed by the PSC’s 10 drivers of citizen satisfaction. The
drivers are Accessibility of public services, treating the citizens with Courtesy and
consideration, Timeliness in the provision of services, availability of Information on public
services, the Knowledge and Competence of officials, the condition of the Facilities in
which services are delivered, Fairness and Equity in service delivery, Value for Money in
service delivery, providing Redress where a promised standard of service has not been met
and Outcome of the encounter with the Public Service.
DATA ANALYSIS
Quantitative data was analysed using both Excel and the Statistical Package for the Social
Sciences (SPSS), and themes to analyse the qualitative data were also developed in line
with the objectives of the study.
LIMITATIONS OF THE STUDY
The following were the limitations of the study:
Comparison with previous studies may be compromised as different service points
were selected. However, if previous and current samples are representative of the
general population of service users, this limitation is mitigated.
The sample sizes vary by municipality with the lowest at 126 for uMlalazi and the
highest 517 for Nelson Mandela Bay Metropolitan Municipality. Trying to compare
statistical differences across the results may be unfair especially for the
municipalities with smaller sizes.
The majority of the service users were not aware of the participating institutions’
service delivery targets/standards. Therefore, their satisfaction ratings were not
informed by much pre-set standards. In loco visits also showed that for the majority
of the sites visited, service delivery charters were not displayed.
KEY FINDINGS
As guided by the objectives of the study, various aspects of the South African-specific
drivers of citizen satisfaction were used to determine service users’ level of satisfaction with
the services rendered by the selected Departments. Table 1 below shows that the average
rating of the service user’s level of satisfaction with the sampled services rendered by all the
selected institutions was 62.3%.

PUBLIC SERVICE COMMISSION
CITIZENS TALK II: A CITIZEN SATISFACTION SURVEY REPORT Page xii
Table 1: Overall satisfaction rate with services rendered by SASSA and Municipalities
INSTITUTIONS
Driver of citizen
satisfaction
SASSA Nelson
Mandela
Bay
Mangaung Emfuleni Madibeng uMlalazi All
Institutions
Fairness and
equity
88.8% 93.4% 91.3% 75.3% 90.9% 94.4% 89.0%
Outcome 83.% 80.3% 72.8% 68% 81.8% 92.1% 79.7%
Courtesy 78.9% 77.5% 81.1% 57.1% 68.6% 92% 75.9%
Knowledge and
competence
73.7% 64.9% 73.5% 50.3% 61.7% 89.9% 69.0%
Facilities 65.5% 86.3% 80.1% 59.7% 35.9% 81.4% 68.2%
Value for money 86.0% 53.3% 71.4% 52.4% 76% 61.3% 66.7%
Timeliness 52.7% 69.8% 70.3% 34.2% 55.6% 74.6% 59.5%
Access 48.6% 43.2% 58% 52.8% 48.4% 57.7% 51.5%
Information 40.2% 49.3% 45.8% 39.9% 27.5% 55.5% 43.0%
Redress 28.7% 15.3% 9.8% 8.2% 18.5% 44.4% 20.8%
Average 64.6% 63.3% 65.4% 49.8% 56.5% 74.3% 62.3%
Table 1 above shows that overall, service users were satisfied with fairness and equity
displayed by officials (89%), followed by outcome of service delivery (79.7%) and courtesy
displayed by officials (75.9%). However, service users were least satisfied with accessibility
(51.5%), provision of accurate information (43%) and redress (20.8%) in service delivery.
The findings further show that comparatively, with regard to the overall level of satisfaction
with the institutions’ services, service users of uMlalazi Local Municipality were most
satisfied (74.3%) while those of Emfuleni Local Municipality were the least satisfied (49.8%).
GENERAL RECOMMENDATIONS
The following are the general recommendations of the survey. Specific recommendations in
relation to the selected institutions are contained at the end of each chapter.
REDRESS
An effective, formal complaints mechanism with multiple channels for lodging one’s
complaints should be available to dissatisfied service users. The complaints process should
be made clear, step by step. Trust should be built around the complaints mechanism to
ensure that customers are not discouraged from using it because they do not see it as
effective.

PUBLIC SERVICE COMMISSION
CITIZENS TALK II: A CITIZEN SATISFACTION SURVEY REPORT Page xiii
INFORMATION
Accurate, comprehensive and current information about products and services on offer
should be provided to service users so that they can make informed choices. Signage
should be clear and legible for all to see. Information on how to complain and where to
complain about poor service should also be clearly displayed. Information desks should be
staffed and attend to customer queries within a reasonable time.
ACCESSIBILITY
Accessibility is one of the key issues that need attention to ensure that targeted service
users use the service without any hindrance. Operating hours should be flexible to
accommodate service users so that customers are not disadvantaged. Service points should
have disability access in line with government building regulations. In addition to direct
access to the service delivery points, customers should be able to call in with queries which
would save time and transport costs. The telephone numbers with hours of availability
should be clearly displayed at the service point and advertised widely in the community.
TIMELINESS
Public services should be offered efficiently and without delay as service users often spend a
considerable amount of time to have their queries and needs attended to. Some even take
time off from work to come to the service point. It is therefore important that the provision of
services is timeous and prompt.
PUBLIC SERVICE COMMISSION
CITIZENS TALK II: A CITIZEN SATISFACTION SURVEY REPORT Page 1
CHAPTER ONE: INTRODUCTION
1.1 BACKGROUND
All over the World, governments have realised the importance of soliciting the views of their
citizens during their policy formulation process. Citizen are not only consumers or
beneficiaries of government services, but are also active role players in determining services
to be delivered and the manner in which such services can be delivered. It is always hoped
that with active participation of the citizens during policy development and service delivery
processes, responsive policies would be developed. In South Africa, the democratic
government has since 1994 encouraged departments to have strategies to allow active
participation by the citizens. It has been the view of the democratic government that active
participation by the citizens in government processes would improve accessibility to the
government-rendered services thereby contributing to the citizen satisfaction with such
services.
The PSC has since 2001, annually conducted Citizen Satisfaction Surveys to establish the
level of citizen’s satisfaction with government services. A Citizen Satisfaction Survey looks
into whether citizens are satisfied with the level and quality of services provided and if the
services and the manner in which they have provided met their expectations. The Public
Service Commission (PSC) derives its mandate to conduct citizen satisfaction surveys from
the Section 196 of the Constitution of South Africa which states that among other things, the
powers and functions of the Commission are to propose measures to ensure effective and
efficient performance within the Public Service.
Unlike the previous surveys which mainly focused on the services provided by national and
provincial departments, this current survey has also included services that are provided by
the local sphere of government. The PSC is of the view that local government is the sphere
of government that is closest to the citizens and the manner in which it provides services is
critical to the improvement of the conditions of their lives.
1.2 OBJECTIVES OF THE STUDY
The overall aim of the study was to assess the level of satisfaction of service users based on
the key drivers of citizen satisfaction at the SASSA and selected municipalities.
The specific objectives of the study were therefore to:
Measure the level of citizen satisfaction of service users based on the key drivers of
citizen satisfaction.

PUBLIC SERVICE COMMISSION
CITIZENS TALK II: A CITIZEN SATISFACTION SURVEY REPORT Page 2
Determine areas of service which service users are not satisfied with for improved
service delivery.
Provide recommendations on how service delivery in the identified areas could be
improved.
1.3 STRUCTURE OF THE REPORT
The report is structured as follows:
Chapter Two outlines the research methodology applied in the study.
Chapter Three presents the overview of the key findings.
Chapter Four presents the key findings on SASSA.
Chapter Five presents key findings on the Nelson Mandela Bay Metropolitan
Municipality.
Chapter Six presents the key findings on Mangaung Municipality.
Chapter Seven present the key findings on Emfuleni Local Municipality.
Chapter Eight presents the key findings on Madibeng Local Municipality.
Chapter Nine presents the key findings on uMlalazi Local Municipality.
Chapter Ten presents the conclusion and recommendations of the study.

PUBLIC SERVICE COMMISSION
CITIZENS TALK II: A CITIZEN SATISFACTION SURVEY REPORT Page 3
CHAPTER TWO: METHODOLOGY
2.1 INTRODUCTION
This chapter presents the research methodology that was adopted for the study. It also
presents the scope of the study, processes followed in sampling the services in the selected
entity/ municipalities and service delivery sites. The chapter also presents the data collection
methods and data analysis approach applied in the study. The limitations of the study are
also presented.
2.2 SCOPE OF THE STUDY
The scope of the study included one national public entity, two metropolitan and three local
municipalities. The following table shows the selected public entity (SASSA) and the
municipalities that were included in the sample of the survey:
Table 2: List of selected entity and municipalities NATIONAL ENTITY MUNICIPALITIES
South African Social Security Agency
(SASSA)
Nelson Mandela Bay Metropolitan Municipality
Mangaung Metropolitan Municipality
Emfuleni Local Municipality
Madibeng Local Municipality
uMlalazi Local Municipality
2.3 METHODOLOGY
2.3.1 Sampling
A purposive sampling procedure was applied in selecting the public entity (SASSA) and local
municipalities and their service delivery sites that were included in the study. Such sampling
is useful in selecting a section of the research population which in the researcher’s judgment
will provide the most useful information for the study.
The public entity (SASSA) and local municipalities included in the sample for the study were
carefully selected based on their contribution towards the realization of the goals and
objectives of the country’s 2009-2014 Medium Term Strategic Framework (MTSF), the
priorities of government and outcomes approach. The Medium Term Strategic Framework
(2009-2014) highlights economic growth, cohesive, caring and sustainable communities. In
particular, a need for a responsive, accountable, effective and efficient local government
system is emphasized in the outcomes approach. It is therefore paramount that government
PUBLIC SERVICE COMMISSION
CITIZENS TALK II: A CITIZEN SATISFACTION SURVEY REPORT Page 4
is seen to be delivering on this outcome to ensure sustainable livelihoods for all the people
of South Africa.
Furthermore, a total of 44 service delivery points of SASSA and 12 municipal service
delivery points were sampled across the country. Annexure A shows the service delivery
sites visited. For SASSA, the majority of service points (30) were located in urban areas
with only 31.8% (14) in rural areas.
A random sampling procedure was applied to select the service users to be interviewed
during the in loco visits at the service deliver sites. This sampling procedure affords every
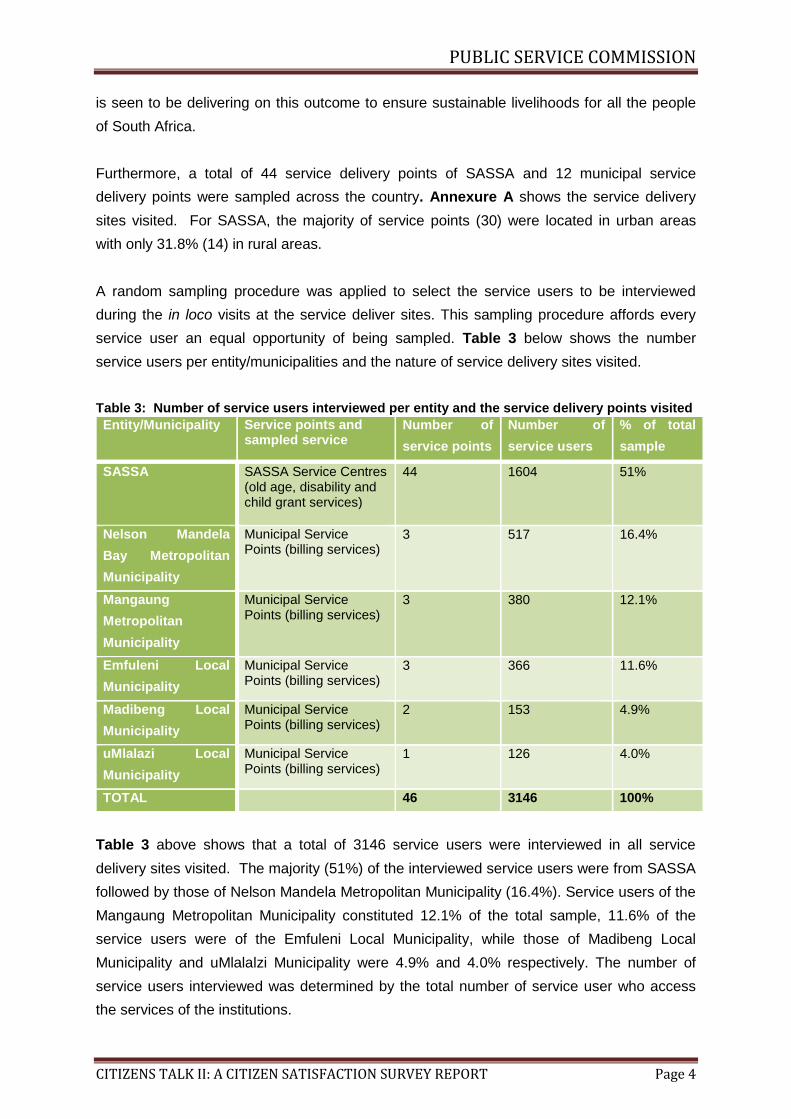
service user an equal opportunity of being sampled. Table 3 below shows the number
service users per entity/municipalities and the nature of service delivery sites visited.
Table 3: Number of service users interviewed per entity and the service delivery points visited
Entity/Municipality Service points and sampled service
Number of
service points
Number of
service users
% of total
sample
SASSA SASSA Service Centres (old age, disability and child grant services)
44 1604 51%
Nelson Mandela
Bay Metropolitan
Municipality
Municipal Service Points (billing services)
3 517 16.4%
Mangaung
Metropolitan
Municipality
Municipal Service Points (billing services)
3 380 12.1%
Emfuleni Local
Municipality
Municipal Service Points (billing services)
3 366 11.6%
Madibeng Local
Municipality
Municipal Service Points (billing services)
2 153 4.9%
uMlalazi Local
Municipality
Municipal Service Points (billing services)
1 126 4.0%
TOTAL 46 3146 100%
Table 3 above shows that a total of 3146 service users were interviewed in all service
delivery sites visited. The majority (51%) of the interviewed service users were from SASSA
followed by those of Nelson Mandela Metropolitan Municipality (16.4%). Service users of the
Mangaung Metropolitan Municipality constituted 12.1% of the total sample, 11.6% of the
service users were of the Emfuleni Local Municipality, while those of Madibeng Local
Municipality and uMlalalzi Municipality were 4.9% and 4.0% respectively. The number of
service users interviewed was determined by the total number of service user who access
the services of the institutions.
PUBLIC SERVICE COMMISSION
CITIZENS TALK II: A CITIZEN SATISFACTION SURVEY REPORT Page 5
2.4 DATA COLLECTION
2.4.1 Data collection instrument
A PSC-developed data collection tool in the form of a questionnaire was used to collect data
during the study (Annexure B). The questionnaire contained both open-ended and closed-
ended questions. Open-ended questions were used to gather qualitative data on the
respondents’ views regarding the challenges that they experience when accessing public
services. Closed-ended questions were used to gather quantitative data regarding service
users’ level of satisfaction as well as their experience of service delivery at the service
points.
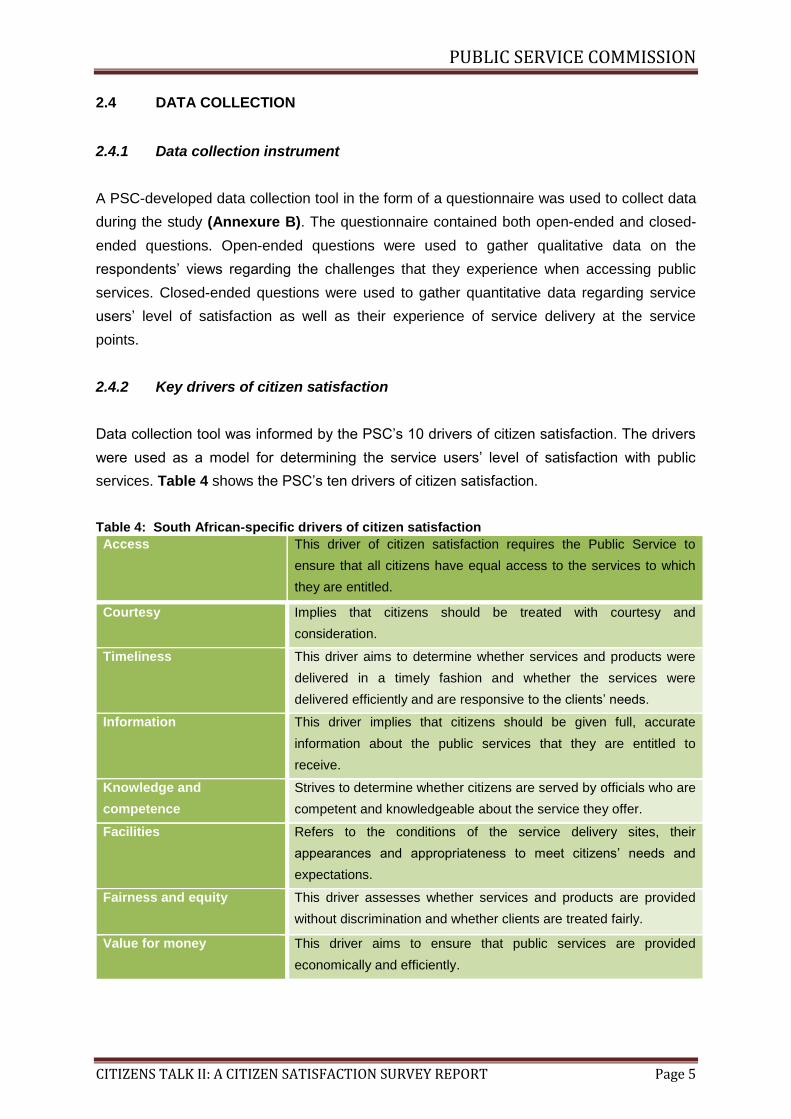
2.4.2 Key drivers of citizen satisfaction
Data collection tool was informed by the PSC’s 10 drivers of citizen satisfaction. The drivers
were used as a model for determining the service users’ level of satisfaction with public
services. Table 4 shows the PSC’s ten drivers of citizen satisfaction.
Table 4: South African-specific drivers of citizen satisfaction
Access This driver of citizen satisfaction requires the Public Service to
ensure that all citizens have equal access to the services to which
they are entitled.
Courtesy Implies that citizens should be treated with courtesy and
consideration.
Timeliness
This driver aims to determine whether services and products were
delivered in a timely fashion and whether the services were
delivered efficiently and are responsive to the clients’ needs.
Information This driver implies that citizens should be given full, accurate
information about the public services that they are entitled to
receive.
Knowledge and
competence
Strives to determine whether citizens are served by officials who are
competent and knowledgeable about the service they offer.
Facilities
Refers to the conditions of the service delivery sites, their
appearances and appropriateness to meet citizens’ needs and
expectations.
Fairness and equity This driver assesses whether services and products are provided
without discrimination and whether clients are treated fairly.
Value for money This driver aims to ensure that public services are provided
economically and efficiently.

PUBLIC SERVICE COMMISSION
CITIZENS TALK II: A CITIZEN SATISFACTION SURVEY REPORT Page 6
Redress Implies that if the promised standard of service is not delivered,
citizens should be offered an apology, a full explanation and a
speedy and effective remedy.
Outcome Seeks to determine if in the end, the citizens got the services they
needed.
2.4.3 Data collection
Face-to-face interviews were conducted with service users to collect data. An interview as
data collection method provides an opportunity for the researcher to probe for further
information on critical areas with the respondents where necessary.
2.5 DATA ANALYSIS
Data gained from the questionnaires was subjected to statistical analysis using Statistical
Package for the Social Sciences (SPSS). This software package allows for the graphic
display of data by means of, amongst others, bar charts, pie charts, frequency tables. On the
other hand, qualitative data was analysed using Atlas Ti software package. The software
package enables the researchers to organise and generate data according to the themes
which were developed in line with the objectives of the study.
2.6 LIMITATIONS OF THE STUDY
The following limitations were experienced during the study:
Comparison with previous studies may be compromised as different service points
were selected. However, if previous and current samples are representative of the
general population of service users, this limitation is mitigated.
The samples sizes vary by municipalities with the lowest at 126 for uMlalazi and the
highest 517 for Nelson Mandela Bay Metropolitan Municipality. Trying to compare
statistical differences across the results might be unfair especially for the
municipalities with smaller sizes.
The majority of the service users were not aware of the participating institutions’
service delivery targets. Therefore, their satisfaction ratings were not informed by
what the participating institutions had set to achieve during service delivery. In loco
visits also showed that in the majority of the sites visited, service delivery charters
were not displayed.

PUBLIC SERVICE COMMISSION
CITIZENS TALK II: A CITIZEN SATISFACTION SURVEY REPORT Page 7
CHAPTER THREE: OVERVIEW OF THE KEY FINDINGS
3.1 INTRODUCTION
Chapter three presents the overview of the key findings of the citizen satisfaction survey
conducted in the South African Social Security Agency (SASSA), the Nelson Mandela Bay
and Mangaung Metropolitan Municipalities as well as the Emfuleni, Madibeng and uMlalalzi
Local Municipalities. The findings are presented according to the objectives of the study
which were used to assess the service user’s level of satisfaction with the sampled services
rendered by the institutions and the challenges thereof.
3.2 SERVICE USER’S LEVEL OF SATISFACTION WITH SERVICES RENDERED
BY THE INSTITUTIONS
Various aspects of the ten South African-specific drivers of citizen satisfaction were used to
determine service user’s level of satisfaction with the sampled services rendered by the
selected institutions. Table 5 below shows the overall rating of the service user’s level of
satisfaction with the services rendered by the selected institutions.
Table 5: Service users' level of satisfaction with services rendered by the selected institutions
INSTITUTIONS
Driver of citizen
satisfaction
SASSA Nelson
Mandela
Bay
Mangaung Emfuleni Madibeng uMlalazi All
Institutions
Access 48.6% 43.2% 58% 52.8% 48.4% 57.7% 51.5%
Courtesy 78.9% 77.5% 81.1% 57.1% 68.6% 92% 75.9%
Timeliness 52.7% 69.8% 70.3% 34.2% 55.6% 74.6% 59.5%
Information 40.2% 49.3% 45.8% 39.9% 27.5% 55.5% 43.0%
Knowledge and
competence
73.7% 64.9% 73.5% 50.3% 61.7% 89.9% 69.0%
Facilities 65.5% 86.3% 80.1% 59.7% 35.9% 81.4% 68.2%
Fairness and
equity
88.8% 93.4% 91.3% 75.3% 90.9% 94.4% 89.0%
Value for money 86.0% 53.3% 71.4% 52.4% 76% 61.3% 66.7%
Redress 28.7% 15.3% 9.8% 8.2% 18.5% 44.4% 20.8%
Outcome 83.% 80.3% 72.8% 68% 81.8% 92.1% 79.7%
Average 64.6% 63.3% 65.4% 49.8% 56.5% 74.3% 62.3%
Table 5 above shows that on average, 62.3% of service users across all the six institutions
were satisfied with the sampled services rendered by the six institutions. Service users of
uMlalazi Local Municipality (74.3%) were the most satisfied with the sampled services

PUBLIC SERVICE COMMISSION
CITIZENS TALK II: A CITIZEN SATISFACTION SURVEY REPORT Page 8
provided by the institutions, whereas service users of Emfuleni Local Municipality (49.8%),
were the least satisfied with the sampled services rendered by the municipality.
The findings further show that service users of Mangaung Metropolitan Municipality were the
second most satisfied, with an average of 65.4% of them expressing their level of
satisfaction with sampled services.
With regard to the performance of the institutions on the drivers of citizen satisfaction, the
survey shows that in general, service users were most satisfied with fairness and equity
displayed by officials (89%), outcome of service delivery (79.7%) and courtesy (75.9%).
However, service users were least satisfied with access to services (51.5%), provision of
accurate information (43%) and redress (20.8%). This suggests the need to improve
access to service delivery sites, the level of information provided to service users as well as
the redress mechanisms of the sampled institutions. The ratings of all the key drivers
according to the service users’ level of satisfaction are presented below:
3.2.1 Citizens’ level of satisfaction with accessibility to public services
The study probed into the accessibility of service points in order to establish service users’
level of satisfaction with accessibility to public services. To this end, four aspects relating to
the accessibility of services were assessed by the service users, namely, “accessibility of
facility”, “convenience of operating hours”, “disability and elderly access” and “ability to
contact the service point telephonically”.
The findings show that overall, 51.5% of the service users across all the six institutions were
satisfied with this driver. Service users of Mangaung and uMlalazi were the most satisfied
with this driver with 58% and 57.7% of them rating it good to excellent respectively. The
findings also show that 52.8% of service users of Emfuleni were satisfied with all aspects of
the driver. Furthermore, only under half of all service users of SASSA (48.6%), Madibeng
(48.4%) and Nelson Mandela Bay (43.2%) respectively, were satisfied with the driver. The
findings suggest that in general, there are challenges relating to the accessibility of services,
implying that it is not easy for service users to access the services of these institutions
3.2.2 Citizens’ level of satisfaction with courtesy displayed by officials
The study wanted to establish the service users’ level of satisfaction with the courtesy
displayed by the officials of all the institutions. Overall, 75.9% of the service users across all
the six institutions were satisfied with the driver. Service users of uMlalazi (92%) and
Mangaung (81.1%) were most satisfied with courtesy displayed by officials, followed by
78.9% and 77.5% of SASSA and Nelson Mandela, respectively. The findings further show

PUBLIC SERVICE COMMISSION
CITIZENS TALK II: A CITIZEN SATISFACTION SURVEY REPORT Page 9
that 68.6% and 57.1% of service users of Madibeng and Emfuleni, respectively, were also
satisfied with this driver. The findings suggest that service users across all the six institutions
were happy with the courtesy shown by the officials at the various institutions, implying that
in general, officials were treating service users with respect.
3.2.3 Citizens’ level of satisfaction with timeliness in service delivery
The study further sought to establish the service users’ level of satisfaction with timeliness
experienced during the delivery of the services of the sampled institutions. The findings
show that overall, 59.5% of service users were satisfied with timeliness in the delivery of
services. Service users of uMlalazi (74.6%) were the most satisfied with the driver, followed
by 70.3% of Mangaung. Furthermore, 69.8% of the service users of Nelson Mandela Bay
were also satisfied with the driver. Just over half of service users, 55.6% and 52.7% of
Madibeng and SASSA, respectively, were satisfied with the driver as well. Service users of
Emfuleni were the least satisfied with the driver with only 34.2% showing their satisfaction
with this driver. The finding shows that whilst there are pockets of excellence, there is a
room for improving the speed at which services are rendered.
3.2.4 Citizens’ level of satisfaction with the provision of information in service
delivery
The study sought to establish service users’ level of satisfaction with their experience on the
accuracy of information provided by the officials of the sampled institutions. Four aspects
relating to the accuracy of information were assessed, namely, “signage/information boards”,
“information desk”, “posters/flyers/pamphlets”, and “information on level and quality of
service”.
The findings show that overall, 43% of the service users across all six institutions indicated
that they were satisfied with accurate information provided by the institutions. Fifty five
(55.5%) of service users of uMlalazi rated their satisfaction with the provision of accurate
information. The majority of service users from the other five institutions, that is, SASSA,
Nelson Mandela Bay, Mangaung, Emfuleni and Madibeng were dissatisfied with the driver
with only 40.2%, 49.3%, 45.8%, 39.9% and 27.5%, respectively, showing their satisfaction
with this driver. The findings suggest that in general, service user were of the opinion that
they were not always provided with the accurate information they required to facilitate
access to services.
PUBLIC SERVICE COMMISSION
CITIZENS TALK II: A CITIZEN SATISFACTION SURVEY REPORT Page 10
3.2.5 Citizens’ level of satisfaction with the knowledge and competency of officials
The study further wanted to determine service users’ level of satisfaction with the knowledge
and competence displayed by officials of institutions. Three aspects relating to knowledge
and competence of staff were assessed, namely, “officials’ knowledge about services
offered”, “officials’ ability to understand your requirements”, and “officials’ ability to accurately
perform the services rendered’.
The findings show that on average 69% of the service users were satisfied with the
knowledge and competency of officials at service points. The findings further show that
service users of uMlalazi were the most satisfied with this driver with 89.9% showing their
satisfaction with the driver. Service users of SASSA and Mangaung were the second most
satisfied with the driver with 73.7% and 73.5% respectively, satisfied with this driver. The
finding also show that service users of Nelson Mandela Bay (64.9%) and Madibeng (61.7%)
were also satisfied with knowledge and competence displayed by officials. Only 50.3% of
service users at Emfuleni were satisfied with the driver. These findings suggest that whilst in
general service users across all the six institutions were satisfied with the knowledge and
competence of staff, service users of Emfuleni were least satisfied.
3.2.6 Citizens’ level of satisfaction with the condition of public facilities
The study sought to determine service users’ level of satisfaction with the condition of the
facilities at the institutions. Three aspects relating to the conditions of the facilities were
assessed, namely, “waiting area”, “cleanliness of facilities”, and “security and safety”.
The findings show that the average satisfaction with the condition of facilities is 68.2% for all
the entities surveyed. Service users of uMlalazi and Mangaung were the most satisfied with
the conditions of facilities with 81.4% and 80.1% respectively, showing their satisfaction. The
findings further show that 65.5% of SASSA service users were satisfied with the driver,
followed by 59.7% of service users at Mangaung. Services users of Madibeng municipality
were the least satisfied with the driver with only 35.9% indicating their satisfaction with the
conditions of the facilities in their municipality. These findings suggest that whilst in general
service users across all the six institutions were satisfied with the conditions of the facilities,
service users of Madibeng were, however least satisfied.
3.2.7 Citizens’ level of satisfaction with the display of fairness and equity by
officials when interacting with service users
The study aimed to determine service users’ level of satisfaction with regard to the fairness
and equity displayed by the officials of the sampled institutions. Service users had to indicate

PUBLIC SERVICE COMMISSION
CITIZENS TALK II: A CITIZEN SATISFACTION SURVEY REPORT Page 11
to what extent they agree with the following statements, namely, “you were treated fairly by
officials” and “the service was rendered without favour”.
The findings show that overall, 89% of service users in all six institutions were satisfied with
fairness and equity displayed by the officials. Ninety four percent (94.4%) of the service
users of uMlalazi were satisfied with all aspects of this driver, followed by 93.4% and 91.3%
of service users of Nelson Mandela Bay and Mangaung, respectively. The level of
satisfaction for service users of Madibeng and SASSA was 90.9% and 88.8%, respectively.
The findings also show that 75.3% of service users of Emfuleni were satisfied with the driver.
In general, the findings of this study show that service users believed that they were treated
with fairness and equity by officials at the six institutions that participated in the study.
3.2.8 Citizens’ level of satisfaction with value for money in service delivery
The study further wanted to determine service users’ level of satisfaction with their
experience on value for money in service delivery. In this regard, service users had to
indicate to what extent they agree with the following statements, namely, “officials rendered
services efficiently”, “the cost of services was reasonable”, and “the service is an example of
good value for money”.
The findings show that on average, 66.7% of service users of all the six institutions were
satisfied with this driver. Eighty six percent (86%) of service users of SASSA were satisfied
with value for money in service delivery. The findings further show that the level of
satisfaction for the service users of Madibeng and Mangaung was 76% and 71.4%,
respectively, followed by 61.3% of service users of uMlalazi. Just over half of service users
of Nelson Mandela and Emfuleni were satisfied, with 53.3% and 52.4% of them showing
satisfaction with all aspect of this driver, respectively. Overall, the findings demonstrate that
in general, service users across all six institutions were satisfied that there was value for
money in the delivery of services, however, those of Emfuleni were least satisfied.
3.2.9 Citizen’s level of satisfaction with obtaining redress to raised problems in
service delivery and products
The study further sought to establish the institutions’ mechanisms of handling redress,
especially where the promised standard of service was found to have not been met. The
findings show that overall, only 20.8% of the service users in all the six institutions were
satisfied with mechanisms of handling redress. In this regard, 44.4% of service users of
uMlalazi were satisfied with redress mechanisms and only 28.7% of those of SASSA were
also satisfied. The finding further show that only 18.5% and 15.3% of the service users of
Madibeng and Nelson Mandela Bay, respectively, were satisfied with the redress
PUBLIC SERVICE COMMISSION
CITIZENS TALK II: A CITIZEN SATISFACTION SURVEY REPORT Page 12
mechanisms. Furthermore, only 9.8% and 8.2% of the service users of Mangaung and
Emfuleni were also satisfied with this driver. The findings suggest that in general, service
users across all the six institution were dissatisfied with the provision of redress where
service standards have not been met.
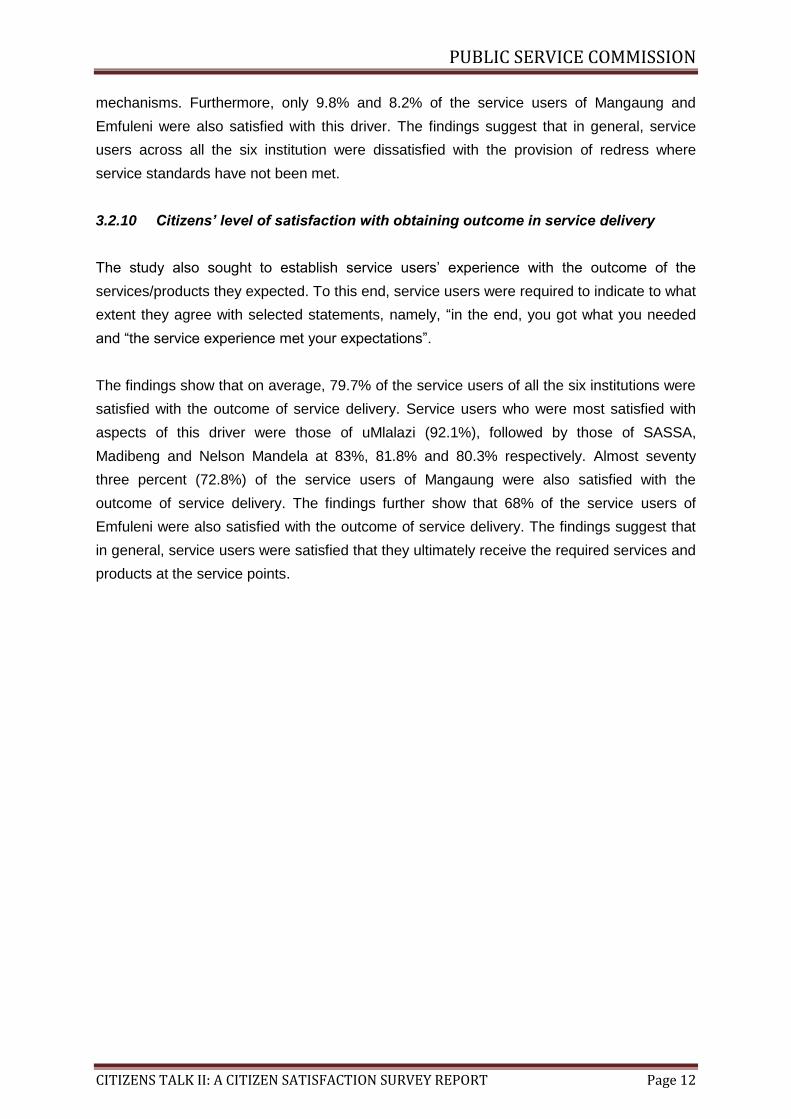
3.2.10 Citizens’ level of satisfaction with obtaining outcome in service delivery
The study also sought to establish service users’ experience with the outcome of the
services/products they expected. To this end, service users were required to indicate to what
extent they agree with selected statements, namely, “in the end, you got what you needed
and “the service experience met your expectations”.
The findings show that on average, 79.7% of the service users of all the six institutions were
satisfied with the outcome of service delivery. Service users who were most satisfied with
aspects of this driver were those of uMlalazi (92.1%), followed by those of SASSA,
Madibeng and Nelson Mandela at 83%, 81.8% and 80.3% respectively. Almost seventy
three percent (72.8%) of the service users of Mangaung were also satisfied with the
outcome of service delivery. The findings further show that 68% of the service users of
Emfuleni were also satisfied with the outcome of service delivery. The findings suggest that
in general, service users were satisfied that they ultimately receive the required services and
products at the service points.

PUBLIC SERVICE COMMISSION
CITIZENS TALK II: A CITIZEN SATISFACTION SURVEY REPORT Page 13
CHAPTER FOUR: KEY FINDINGS: SOUTH AFRICAN SOCIAL SECURITY
AGENCY (SASSA)
4.1 INTRODUCTION
This chapter presents the key findings of the survey in relation to the services rendered by
the South African Social Security Agency (SASSA) specifically with a focus on the old age,
disability and child grants services. A demographic profile of the service users that
participated in the study is presented first, followed by the key findings of the survey. The
key findings are presented according to the South African-specific drivers of citizen
satisfaction model described in Chapter Two of this report. In this regard, the service users’
ratings of satisfaction with services of the SASSA and the challenges experienced are
presented. The chapter concludes with a set of recommendations.
4.2 DEMOGRAPHIC PROFILE
A total of 1604 service users were interviewed at the sampled service delivery sites of
SASSA in all nine provinces. The majority of the service users (78%) were female whilst only
22% were male. This may be the indication of the role that women play in managing
households, such as making application for grants and the collection thereof.
With regard to the age of the service users, 27.4% were between the ages 35-49, 24.2%
were between the ages 25-34, 23.4% were between the ages 50-64, 14.4% were between
the ages 16-24 and 10.5% were 65 years and older. Over a third of service users (39.7%)
had some secondary education, just under a quarter had some primary school education
(23.5%) and those with matric made up 21.5% of the SASSA sample. The number of service
users with tertiary qualifications was very low, with only 0.6% in possession of a degree. The
majority of service users (67.9%) were unemployed, 3.9% were in full time and part time
employment respectively, while 18.6% were pensioners.
4.3 KEY FINDINGS
The findings show that on average 64.6% of the service users were satisfied (combination of
good and excellent ratings) with the services rendered by SASSA. Table 6 below highlights
service users’ level of satisfaction with services rendered by SASSA according to the key
drivers of citizen satisfaction.
PUBLIC SERVICE COMMISSION
CITIZENS TALK II: A CITIZEN SATISFACTION SURVEY REPORT Page 14
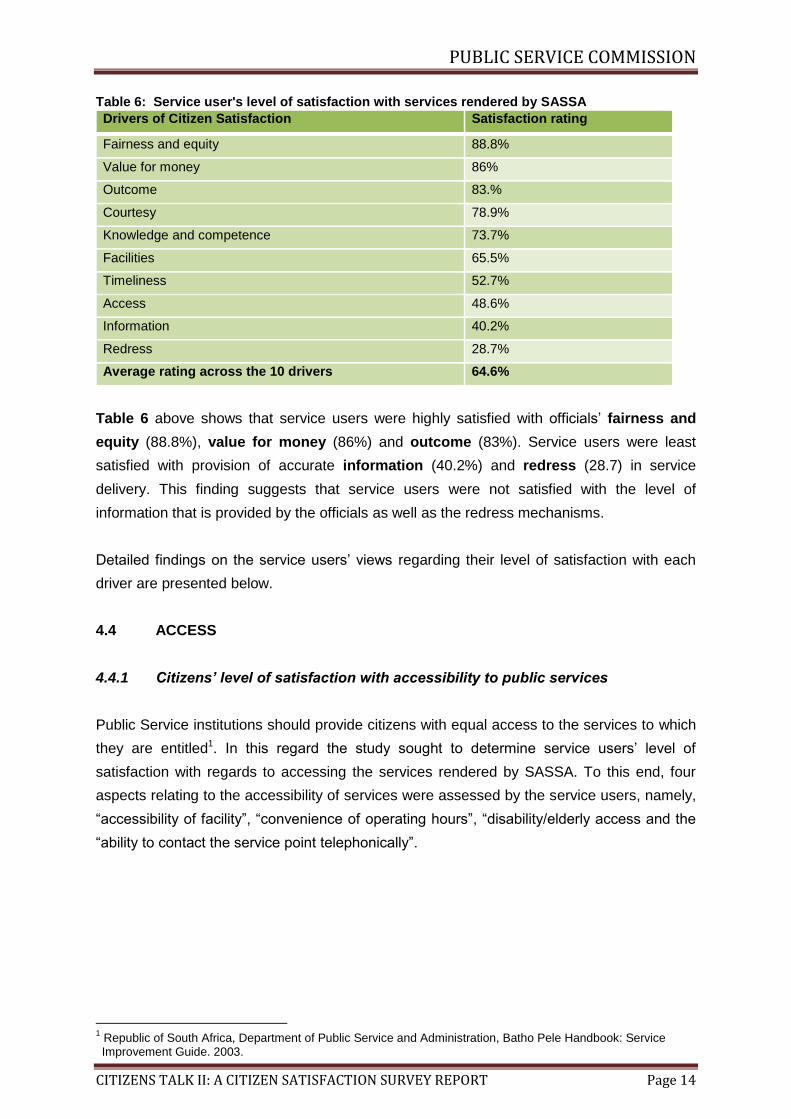
Table 6: Service user's level of satisfaction with services rendered by SASSA
Drivers of Citizen Satisfaction Satisfaction rating
Fairness and equity 88.8%
Value for money 86%
Outcome 83.%
Courtesy 78.9%
Knowledge and competence 73.7%
Facilities 65.5%
Timeliness 52.7%
Access 48.6%
Information 40.2%
Redress 28.7%
Average rating across the 10 drivers 64.6%
Table 6 above shows that service users were highly satisfied with officials’ fairness and
equity (88.8%), value for money (86%) and outcome (83%). Service users were least
satisfied with provision of accurate information (40.2%) and redress (28.7) in service
delivery. This finding suggests that service users were not satisfied with the level of
information that is provided by the officials as well as the redress mechanisms.
Detailed findings on the service users’ views regarding their level of satisfaction with each
driver are presented below.
4.4 ACCESS
4.4.1 Citizens’ level of satisfaction with accessibility to public services
Public Service institutions should provide citizens with equal access to the services to which
they are entitled1. In this regard the study sought to determine service users’ level of
satisfaction with regards to accessing the services rendered by SASSA. To this end, four
aspects relating to the accessibility of services were assessed by the service users, namely,
“accessibility of facility”, “convenience of operating hours”, “disability/elderly access and the
“ability to contact the service point telephonically”.
1 Republic of South Africa, Department of Public Service and Administration, Batho Pele Handbook: Service Improvement Guide. 2003.

PUBLIC SERVICE COMMISSION
CITIZENS TALK II: A CITIZEN SATISFACTION SURVEY REPORT Page 15
Figure 1: Rating the experience pertaining to accessibility of public services
Figure 1 above shows that 58.4% of the service users rated “convenience of operating
hours” good to excellent, followed by 57.8% who rated “disability/elderly access” good to
excellent, 40.5% rated “accessibility of facility” good to excellent, and 37.6% rated “ability to
access service point telephonically” good to excellent.
When compared to the 2010/11 PSC’s survey, the findings show that “convenience of
operating hours” was rated good to excellent by 52.0% which shows an improvement of
6.4% (percentage point), “disability/elderly access was 47.3% showing an improvement of
10.5% (percentage point), “accessibility of facility” was rated good to excellent by 53.3%,
showing a decline of 12.8% (percentage point) and “ability to access service point
telephonically” was rated good to excellent by 41.1% showing a decline of 3.5% (percentage
point). The findings suggest that accessing the facilities of SASSA and the ability to obtain
assistance through phone remains a challenge for the service users of SASSA.
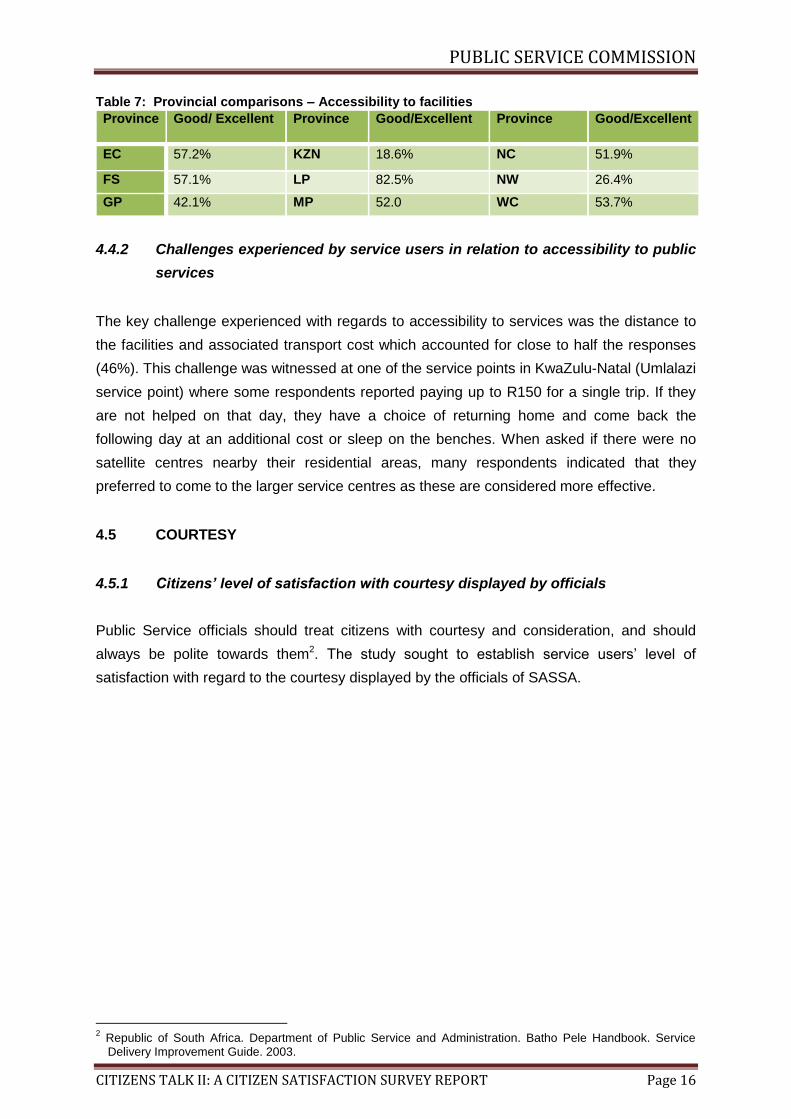
The findings further show that (82.5%) of the service users interviewed in the Limpopo
province rated aspects of access to services good to excellent well ahead of other provinces,
and only (18.6%) of those interviewed in KwaZulu-Natal rated accessibility to services good
to excellent. This finding suggests that there are serious challenges with accessibility to
services in KwaZulu-Natal. Table 7 illustrates findings from all provinces
11.4%
21.2%
26.9%
34.8%
5.7% 4.2%
10.7%
26.6%
51.8%
6.6%
3.9%
9.1%
29.1%
50.7%
7.1%
14.8%
19.9%
27.8%
34.6%
3.0%
Poor Below average Average Good ExcellentAccessibility of facility Convenience of operating hours
Disability/Elderly access Ability to access service point telephonically
PUBLIC SERVICE COMMISSION
CITIZENS TALK II: A CITIZEN SATISFACTION SURVEY REPORT Page 16
Table 7: Provincial comparisons – Accessibility to facilities
Province Good/ Excellent Province Good/Excellent Province Good/Excellent
EC 57.2% KZN 18.6% NC 51.9%
FS 57.1% LP 82.5% NW 26.4%
GP 42.1% MP 52.0 WC 53.7%
4.4.2 Challenges experienced by service users in relation to accessibility to public
services
The key challenge experienced with regards to accessibility to services was the distance to
the facilities and associated transport cost which accounted for close to half the responses
(46%). This challenge was witnessed at one of the service points in KwaZulu-Natal (Umlalazi
service point) where some respondents reported paying up to R150 for a single trip. If they
are not helped on that day, they have a choice of returning home and come back the
following day at an additional cost or sleep on the benches. When asked if there were no
satellite centres nearby their residential areas, many respondents indicated that they
preferred to come to the larger service centres as these are considered more effective.
4.5 COURTESY
4.5.1 Citizens’ level of satisfaction with courtesy displayed by officials
Public Service officials should treat citizens with courtesy and consideration, and should
always be polite towards them2. The study sought to establish service users’ level of
satisfaction with regard to the courtesy displayed by the officials of SASSA.
2 Republic of South Africa. Department of Public Service and Administration. Batho Pele Handbook. Service
Delivery Improvement Guide. 2003.

PUBLIC SERVICE COMMISSION
CITIZENS TALK II: A CITIZEN SATISFACTION SURVEY REPORT Page 17
Figure 2: Rating the experience pertaining to courtesy displayed by public officials in service delivery
Figure 2 above shows that the majority of respondents (78.9%) rated courtesy displayed by
SASSA officials good to excellent while only 21.1% rated it poor to average. In comparison
with the findings of the PSC’s 2010/11 survey where 60.5% respondents rated courtesy
good to excellent, an increase of 18.4% (percentage point) can be detected. In this regard,
SASSA should be commended for the improvement in the manner in which service users
are treated.
The findings further show that majority of service users (93.7%) in Limpopo rated the aspect
of courtesy good to excellent whilst only 61.4% of the service users in North West were
satisfied. Table 8 illustrates findings from all provinces.
Table 8: Provincial comparison - Courtesy
Province Good/Excellent Province Good/Excellent Province Good/Excellent
EC 81.5% KZN 68.5% NC 80.1%
FS 83.7% LP 93.7% NW 61.4%
GP 92.0% MP 73.6% WC 74.1%
5.2 Challenges experienced by service users in relation to the officials’ display of
courtesy
Key challenges identified by service users were:
Discrimination was allegedly rife, with white people being treated better.
While some officials were perceived to be polite, others were not.
2.4% 5.4%
13.3%
70.3%
8.6%
Poor Below average Average Good Excellent

PUBLIC SERVICE COMMISSION
CITIZENS TALK II: A CITIZEN SATISFACTION SURVEY REPORT Page 18
Some officials were said to be rude/unfriendly towards citizens.
4.6 TIMELINESS
4.6.1 Citizens’ level of satisfaction with timeliness in service delivery
Public services should be delivered swiftly, efficiently, within reasonable time and be
responsive to the client’s needs. To this end, the study sought to establish the service users’
level of satisfaction with timeliness during the delivery of the services of SASSA.
Figure 3: Rating the experience pertaining to timeliness in the delivery of public services
Figure 3 shows that just over half (52.7%) of service users rated timeliness good to
excellent. When compared with PSC’s 2010/11 survey, the finding shows an improvement of
8.8% (percentage points), where only 43.9% of the service users rated timeliness good to
excellent.
Overall, the findings show that the majority of service users interviewed in KwaZulu-Natal,
North West and Free State were the most dissatisfied with timeliness in the delivery of
services, with only 18.2%, 27.5% and 39% of them rating timeliness good to excellent
respectively, while those in Limpopo (90.2%) and Eastern Cape (88.7%) were the most
satisfied with timeliness in service delivery. Table 9 illustrates findings from all provinces.
10.1%
16.8%
20.5%
47.0%
5.7%
Poor Below average Average Good Excellent

PUBLIC SERVICE COMMISSION
CITIZENS TALK II: A CITIZEN SATISFACTION SURVEY REPORT Page 19
Table 9: Provincial comparisons - Timeliness
Province Good/ Excellent Province Good/Excellent Province Good/Excellent
EC 88.7% KZN 18.2% NC 41.5%
FS 39.0% LP 90.2% NW 27.5%
GP 64.9% MP 52.3% WC 45.6%
4.6.2 Challenges experienced by service users in relation to timeliness in service
delivery
The key challenge identified by the service users was the insufficient number of officials to
serve clients (understaffing) or computers being off-line. Service users further indicated that
service tends to be slow, especially month end when there are many people at service
points, resulting in long queues and long waiting times.
4.7 INFORMATION
4.7.1 Citizens’ level of satisfaction with the provision of information in service
delivery
Comprehensive and accurate information should be provided to citizens on where and how
services can be accessed3. This includes information on the applicable requirements prior to
accessing services. In this regard, the study sought to establish the service users’ level of
satisfaction with their experience on the accuracy of information provided by SASSA. To this
end, four aspects relating to information were assessed by service users, namely,
“signage/information boards”, “information desk”, “posters/flyers/pamphlets” and “information
on the level and quality of service” provided.
3 Republic of South Africa. Department of Public Service and Administration. Batho Pele Handbook. Service
Delivery Improvement Guide. 2003.
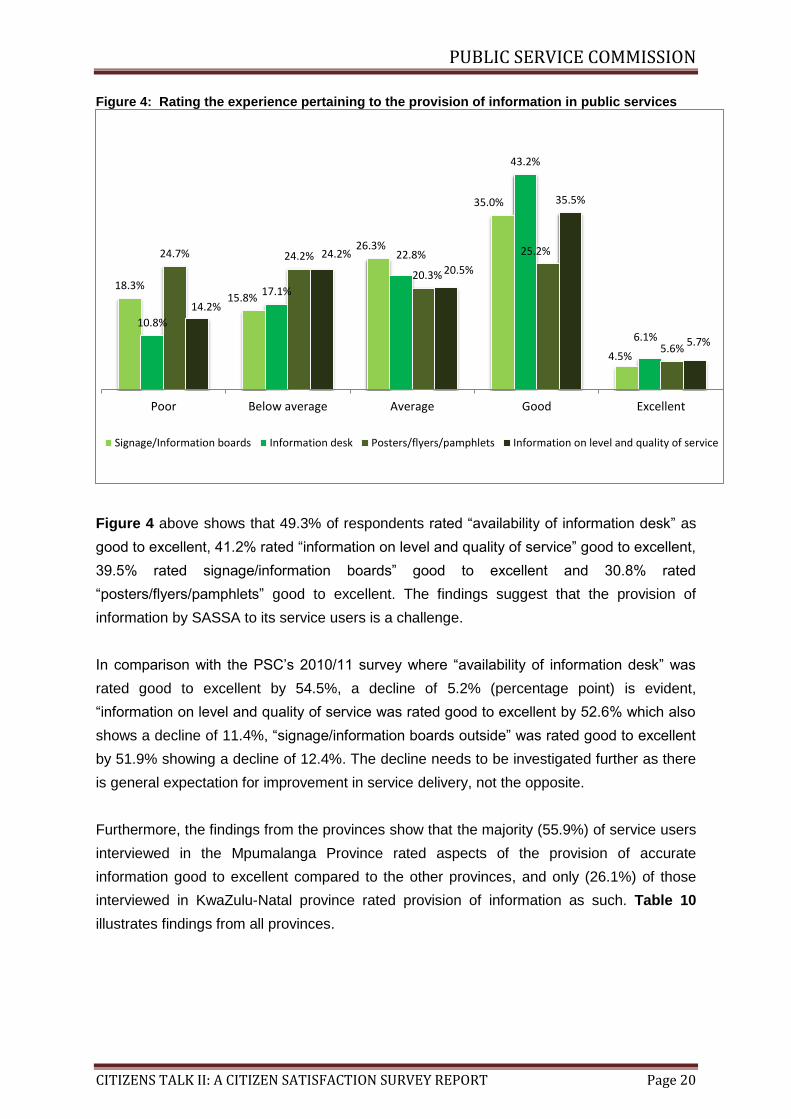
PUBLIC SERVICE COMMISSION
CITIZENS TALK II: A CITIZEN SATISFACTION SURVEY REPORT Page 20
Figure 4: Rating the experience pertaining to the provision of information in public services
Figure 4 above shows that 49.3% of respondents rated “availability of information desk” as
good to excellent, 41.2% rated “information on level and quality of service” good to excellent,
39.5% rated signage/information boards” good to excellent and 30.8% rated
“posters/flyers/pamphlets” good to excellent. The findings suggest that the provision of
information by SASSA to its service users is a challenge.
In comparison with the PSC’s 2010/11 survey where “availability of information desk” was
rated good to excellent by 54.5%, a decline of 5.2% (percentage point) is evident,
“information on level and quality of service was rated good to excellent by 52.6% which also
shows a decline of 11.4%, “signage/information boards outside” was rated good to excellent
by 51.9% showing a decline of 12.4%. The decline needs to be investigated further as there
is general expectation for improvement in service delivery, not the opposite.
Furthermore, the findings from the provinces show that the majority (55.9%) of service users
interviewed in the Mpumalanga Province rated aspects of the provision of accurate
information good to excellent compared to the other provinces, and only (26.1%) of those
interviewed in KwaZulu-Natal province rated provision of information as such. Table 10
illustrates findings from all provinces.
18.3% 15.8%
26.3%
35.0%
4.5%
10.8%
17.1%
22.8%
43.2%
6.1%
24.7% 24.2%
20.3%
25.2%
5.6%
14.2%
24.2%
20.5%
35.5%
5.7%
Poor Below average Average Good Excellent
Signage/Information boards Information desk Posters/flyers/pamphlets Information on level and quality of service

PUBLIC SERVICE COMMISSION
CITIZENS TALK II: A CITIZEN SATISFACTION SURVEY REPORT Page 21
Table 10: Provincial comparison - Information
Province Good/Excellent Province Good/Excellent Province Good/Excellent
EC 42.4% KZN 26.1% NC 40.6%
FS 38.5% LP 33.8% NW 40.2%
GP 31.9% MP 55.9% WC 55.2%
4.7.2 Challenges experienced by service users in obtaining accurate information
Key challenges identified by service users were:
Information was provided only in English, with respondents pointing to a need to use
other languages
Information boards were old and not legible
No posters, pamphlets, flyers, etc. displayed
Unavailability of information desk on site
Unavailability of sign boards outside service points.
4.8 KNOWLEDGE AND COMPETENCE
4.8.1 Citizens’ level of satisfaction with knowledge and competence of official
Competence is a standard requirement for an individual to perform a specific job, and it
encompasses the knowledge utilised to improve performance. The study sought to
determine service users’ level of satisfaction with the knowledge and competence of officials
of SASSA. In this regard, three aspects relating to knowledge and competence of officials
were assessed by service users, namely, “officials’ knowledge about services offered”,
“officials’ ability to understand your requirements”, and “officials’ ability to accurately perform
services”.
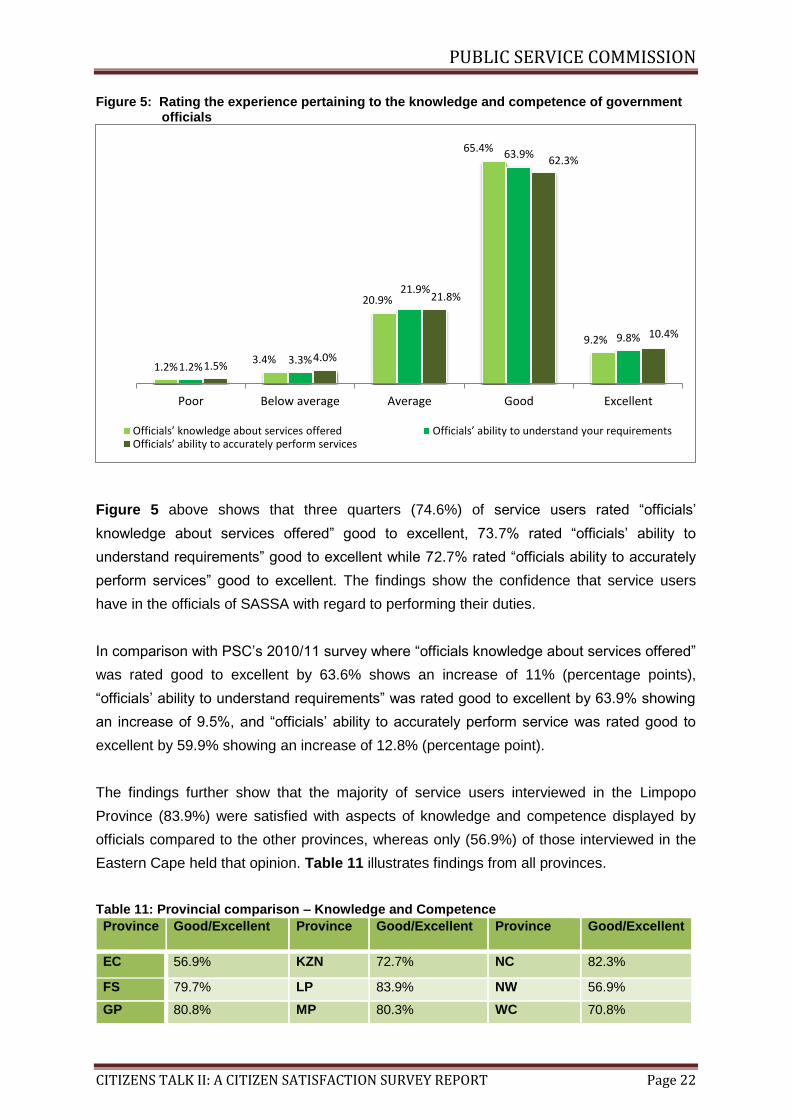
PUBLIC SERVICE COMMISSION
CITIZENS TALK II: A CITIZEN SATISFACTION SURVEY REPORT Page 22
Figure 5: Rating the experience pertaining to the knowledge and competence of government officials
Figure 5 above shows that three quarters (74.6%) of service users rated “officials’
knowledge about services offered” good to excellent, 73.7% rated “officials’ ability to
understand requirements” good to excellent while 72.7% rated “officials ability to accurately
perform services” good to excellent. The findings show the confidence that service users
have in the officials of SASSA with regard to performing their duties.
In comparison with PSC’s 2010/11 survey where “officials knowledge about services offered”
was rated good to excellent by 63.6% shows an increase of 11% (percentage points),
“officials’ ability to understand requirements” was rated good to excellent by 63.9% showing
an increase of 9.5%, and “officials’ ability to accurately perform service was rated good to
excellent by 59.9% showing an increase of 12.8% (percentage point).
The findings further show that the majority of service users interviewed in the Limpopo
Province (83.9%) were satisfied with aspects of knowledge and competence displayed by
officials compared to the other provinces, whereas only (56.9%) of those interviewed in the
Eastern Cape held that opinion. Table 11 illustrates findings from all provinces.
Table 11: Provincial comparison – Knowledge and Competence
Province Good/Excellent Province Good/Excellent Province Good/Excellent
EC 56.9% KZN 72.7% NC 82.3%
FS 79.7% LP 83.9% NW 56.9%
GP 80.8% MP 80.3% WC 70.8%
1.2% 3.4%
20.9%
65.4%
9.2%
1.2% 3.3%
21.9%
63.9%
9.8%
1.5% 4.0%
21.8%
62.3%
10.4%
Poor Below average Average Good Excellent
Officials’ knowledge about services offered Officials’ ability to understand your requirements Officials’ ability to accurately perform services

PUBLIC SERVICE COMMISSION
CITIZENS TALK II: A CITIZEN SATISFACTION SURVEY REPORT Page 23
4.8.2 Challenges pertaining to knowledge and competence of Staff
The key challenge identified by service users was that while the majority of the officials were
found to understand client’s requirements and needs, others did not.
4.9 FACILITIES
4.9.1 Citizens’ level of satisfaction with the condition of public facilities
The condition of public facilities should be welcoming and cater for the needs of the citizens.
It is important for citizens to feel that contact with government is taking place in a clean, quiet
and safe environment. To this end, the study sought to establish the service users’ level of
satisfaction with the condition of SASSA facilities. In this regard three aspects relating to the
condition of public facilities were assessed by service users, namely, “waiting area”,
“cleanliness of facilities” and “safety/security”.
Figure 6: Rating the experience pertaining to the condition of public facilities
Figure 6 above shows that 75.6% of the service users rated “security/safety” good to
excellent, 67.2% rated “cleanliness of facility” good to excellent and 53.6% rated “waiting
area” good to excellent. The findings suggest that the waiting areas of the facilities of
SASSA require improvement.
In comparison with PSC’s 2010/ survey, the findings show that “security/safety” was rated
good to excellent by 67.7% showing an increase of 7.9% (percentage point), “cleanliness of
facility” was rated good to excellent by 59.7% showing an increase of 7.5% (percentage
point) and “waiting area” was rated good to excellent by 52.6% showing a slight increase of
1%(percentage point) in respondents who rated “waiting area” good to excellent.
16.6%
9.3%
20.5%
46.2%
7.4% 10.6%
8.2%
14.0%
50.6%
16.6%
3.9% 4.9%
15.6%
58.2%
17.4%
Poor Below average Average Good Excellent
Waiting area Cleanliness of facility Security/Safety

PUBLIC SERVICE COMMISSION
CITIZENS TALK II: A CITIZEN SATISFACTION SURVEY REPORT Page 24
The findings further show that the majority of service users (84.1%) interviewed in the
Limpopo province rated aspects of the condition of public facilities good to excellent
compared to other provinces, whilst only (18.3%) of those interviewed in KwaZulu-Natal
rated the condition of facilities good to excellent. Table 12 provide findings from all
provinces.
Table 12: Provincial comparison – SASSA Facilities
Province Good/Excellent Province Good/Excellent Province Good/Excellent
EC 69.6% KZN 18.3% NC 75.6%
FS 58.2% LP 84.1% NW 58.5%
GP 81.3% MP 80.3% WC 62.6%
4.9.2 Challenges experienced by service users with regard to the condition of
public facilities
Key challenges identified by service users were:
That in some instances, there was no permanent building, therefore clients were
served from tents
Construction/renovations at the building caused inconvenience in the delivery of
services
Outside areas of the sites were dirty
Insufficient chairs in the waiting area, service users have to stand before being
served
Most waiting areas were crowded and too small.
4.10 FAIRNESS AND EQUITY
4.10.1 Citizens’ level of satisfaction with the display of fairness and equity by
government officials when interacting with service users
Public services should be rendered equally and fairly without prejudice or favour. In this
regard, the study sought to establish service users’ experience with regard to the fairness
and equity displayed by officials. To this end, service users were requested to indicate the
extent to which they agree with the following statements, namely, “you were treated fairly by
officials” and “the service was rendered without favour”.

PUBLIC SERVICE COMMISSION
CITIZENS TALK II: A CITIZEN SATISFACTION SURVEY REPORT Page 25
Figure 7: Rating the experience pertaining to fairness and equity displayed by officials
Figure 7 above shows that 88.9% of service users agreed and strongly agreed that they
were treated fairly by officials while 88.7% agreed or strongly agreed that officials rendered
the service without favour. Whilst in general, service users seemed happy with the aspects
of the driver, it was established that about 11.1% of the service users felt that they have
been unfairly treated by the officials of the municipality and 11.3% indicated that there has
been some preferential treatment in receiving services. This is a cause for concern as such
incidents may a potential to lead to nepotism, favouritism or corruption which is not a good
practice.
In comparison with the PSC’s 2010/11 survey where 81.4% of respondents agreed or
strongly agreed that they were treated fairly by officials, an increase of 7.5% (percentage
point) is evident. Further, 77.7% of service users agreed or strongly agreed that officials
rendered services without favour, thus showing an increase of 11%.
The findings further show that (96.1%) of service users interviewed in Gauteng, rated both
aspects of fairness and equity displayed by officials positively (agreed/strongly agreed)
compared to the other provinces. The lowest ratings were provided by KwaZulu-Natal
respondents (76.2%) and even then, three out of four respondents still agreed or strongly
agreed with the two statements on fairness and equity. Table 13 illustrates findings from all
provinces.
Table 13: Provincial comparison – Fairness and Equity
Province Agree/Strongly
Agree
Province Agree/Strongly
Agree
Province Agree/Strongly
Agree
EC 94.1% KZN 76.2% NC 87.1%
FS 87.1% LP 97.1% NW 86.6%
GP 95.2% MP 86.2% WC 88.8%
3.2% 7.9%
75.9%
13.0%
3.10% 8.20%
74.90%
13.80%
Strongly disagree Disagree Agree Strongly agree
Fair treatment by officials Service rendered without favour

PUBLIC SERVICE COMMISSION
CITIZENS TALK II: A CITIZEN SATISFACTION SURVEY REPORT Page 26
4.10.2 Challenges pertaining to fairness and equity displayed by officials
The key challenge identified by service users who experienced challenges in this area was
that they were not treated equally and fairly. Officials were allegedly accused of
discrimination, treating white people better and serving their families and friends first.
4.11 VALUE FOR MONEY
4.11.1 Citizens’ level of satisfaction with value for money in service delivery
Public services have to be delivered economically and efficiently in order to give citizens the
best value for money. In this regard, the survey sought to establish service users’ level of
satisfaction with their experience on value for money in service delivery. To this end, service
users had to indicate the extent to which they agree with the following statements “officials
rendered services efficiently”, “cost of services was reasonable” and “the service is an
example of good value for money”.
Figure 8: Rating the experience pertaining to value for money in service delivery
Figure 8 above shows that 90.1% of the service users either agreed or strongly agreed that
“officials rendered service efficiently”, 84% agreed to strongly agreed that the cost of
services was reasonable and that service was an example of value for money respectively.
When compared to the PSC’s 2010/11 survey, the findings show that 83.0% agreed to
strongly agree that “officials rendered service efficiently” which indicates an increase of 7.1%
(percentage point), 86.1% agreed to strongly agree that “cost of service being reasonable”
2.5% 7.4%
79.7%
10.4% 9.7% 6.3%
73.7%
10.3% 9.7%
6.3%
73.7%
10.3%
Strongly disagree Disagree Agree Strongly Agree
Officials rendered service efficiently Cost of services being reasonable
Service an example of value for money
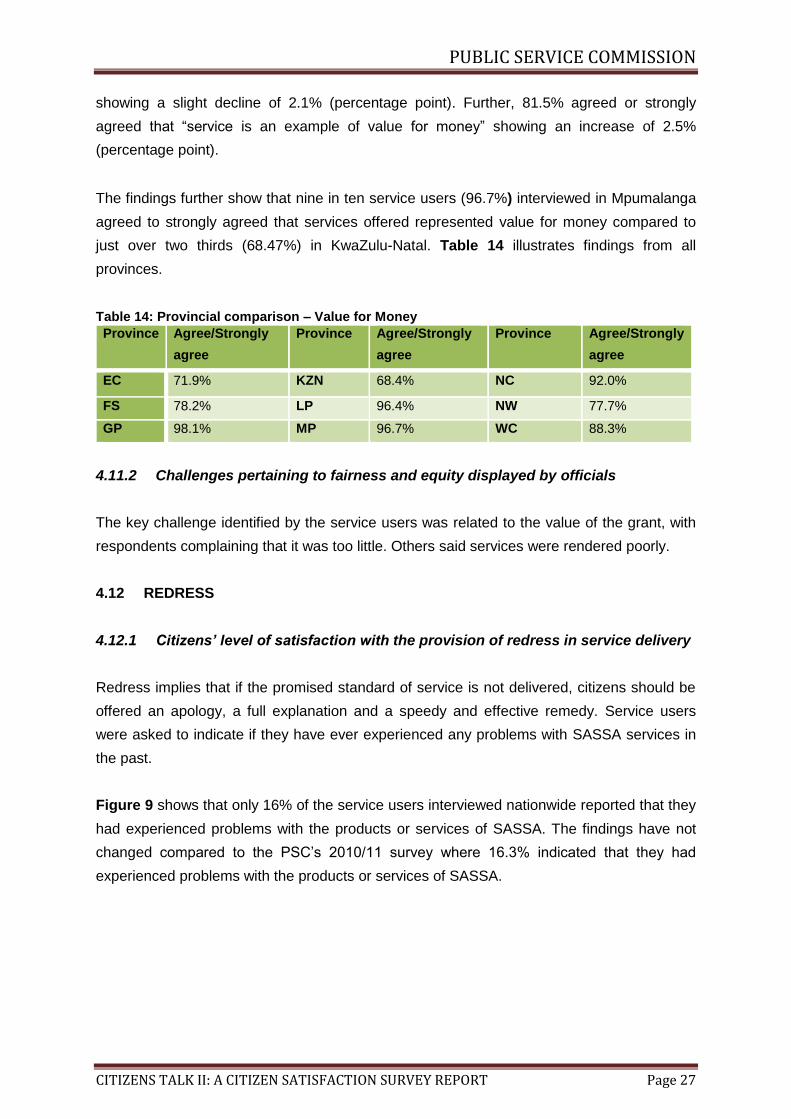
PUBLIC SERVICE COMMISSION
CITIZENS TALK II: A CITIZEN SATISFACTION SURVEY REPORT Page 27
showing a slight decline of 2.1% (percentage point). Further, 81.5% agreed or strongly
agreed that “service is an example of value for money” showing an increase of 2.5%
(percentage point).
The findings further show that nine in ten service users (96.7%) interviewed in Mpumalanga
agreed to strongly agreed that services offered represented value for money compared to
just over two thirds (68.47%) in KwaZulu-Natal. Table 14 illustrates findings from all
provinces.
Table 14: Provincial comparison – Value for Money
Province Agree/Strongly
agree
Province Agree/Strongly
agree
Province Agree/Strongly
agree
EC 71.9% KZN 68.4% NC 92.0%
FS 78.2% LP 96.4% NW 77.7%
GP 98.1% MP 96.7% WC 88.3%
4.11.2 Challenges pertaining to fairness and equity displayed by officials
The key challenge identified by the service users was related to the value of the grant, with
respondents complaining that it was too little. Others said services were rendered poorly.
4.12 REDRESS
4.12.1 Citizens’ level of satisfaction with the provision of redress in service delivery
Redress implies that if the promised standard of service is not delivered, citizens should be
offered an apology, a full explanation and a speedy and effective remedy. Service users
were asked to indicate if they have ever experienced any problems with SASSA services in
the past.
Figure 9 shows that only 16% of the service users interviewed nationwide reported that they
had experienced problems with the products or services of SASSA. The findings have not
changed compared to the PSC’s 2010/11 survey where 16.3% indicated that they had
experienced problems with the products or services of SASSA.

PUBLIC SERVICE COMMISSION
CITIZENS TALK II: A CITIZEN SATISFACTION SURVEY REPORT Page 28
Figure 9: Have you ever experienced problems with other products of service?
Of the 16% who experienced problems, the nature of problems experienced included:
Grants being stopped without notice
The application being rejected for unknown reasons
Waiting too long at the service sites to be served
Service points not operating daily or offering different services on different days
which mean service users have to return home and come back on the day that a
particular service is being offered.
Service users who experienced problems were further requested to indicate the frequency of
experiencing problems.
Figure 10: How often have you experienced problems with the service?
Figure 10 above shows that 68.4% of the service users seldom experienced the problems,
Yes 16%
No 84%
68.4%
24.8%
6.8%
Seldom Often Very often

PUBLIC SERVICE COMMISSION
CITIZENS TALK II: A CITIZEN SATISFACTION SURVEY REPORT Page 29
24.8% experienced these problems often, while 6.8% experienced problems very often.
Of the service users who experienced problems with the services of SASSA, 46.3% lodged a
complaint. The findings show that services users were reluctant to lodge complaints formally
(in writing) with officials as the majority of them lodged verbal complaints. This may be an
indication of lack of awareness of complaint mechanisms and associated processes or a
simple lack of confidence that problems would be satisfactorily resolved.
Furthermore the findings show that 71.2% of the service users were least satisfied with the
manner in which problems were resolved, thus rating SASSA average to poor in this area,
whilst 28,7% were satisfied and rated SASSA good to excellent. Figure 11 below is an
illustration of the service users’ responses in this regard.
Figure 11: Satisfaction with problem resolution
In addition, amongst those who did not lodge a complaint, the following were provided as
reasons for not doing so.
Table 15: Reasons for not lodging a complaint, SASSA
Reasons for not lodging a complaint Percentage
Felt it was not worthwhile 66%
Did not know where to lodge a complaint 28%
Afraid of staff/Avoiding trouble 6%
4.12.2 Challenges experienced by service users with the provision of redress
The key challenges identified by service users were:
15.8%
27.3% 28.1%
23.7%
5.0%
Poor Below Average Average Good Excellent

PUBLIC SERVICE COMMISSION
CITIZENS TALK II: A CITIZEN SATISFACTION SURVEY REPORT Page 30
No explanation or valid explanation of how problem will be solved
Problems were not solved/problem yet to be resolved
It takes long for problem to be resolved.
4.13 OUTCOME
4.13.1 Citizens’ level of satisfaction with obtaining outcome in service delivery
Government Institutions should ensure that the products/services that citizens visit their
service delivery point to obtain are available and provided to them within reasonable time. In
this regard, the study sought to establish service users’ level of satisfaction with the receipt
of outcome during service delivery. To this end, service users had to indicate to what extent
they agree with selected statements, namely “in the end, you got what you needed” and “the
service experience met your expectations”’. Figure 12 below shows service users’ views in
this regard.
Figure 12: Rating the experience pertaining to obtaining outcome in service delivery
Figure 12 above shows that 84.2% of respondents agreed to strongly agree with the
statement “in the end you got what you needed” and 82% agree to strongly agree that
“service met your expectations.
In comparison with PSC’s 2010/11 survey where 83.3% of respondents agreed with the
statement “in the end you got what you needed” a slight increase of 0.9% (percentage point)
while 76.5% agreed with the statement “service experience met your expectations” showing
an increase of 5.5% (percentage point).
Overall, the findings show that (93%) of service users interviewed in the Limpopo, 91.4% in
4.6%
11.1%
73.8%
10.4% 5.9%
12.1%
71.3%
10.7%
Strongly disagree Disagree Agree Strongly agree
In the end, you got what you needed (n=1484) Service experience met your expectations (n=1482)
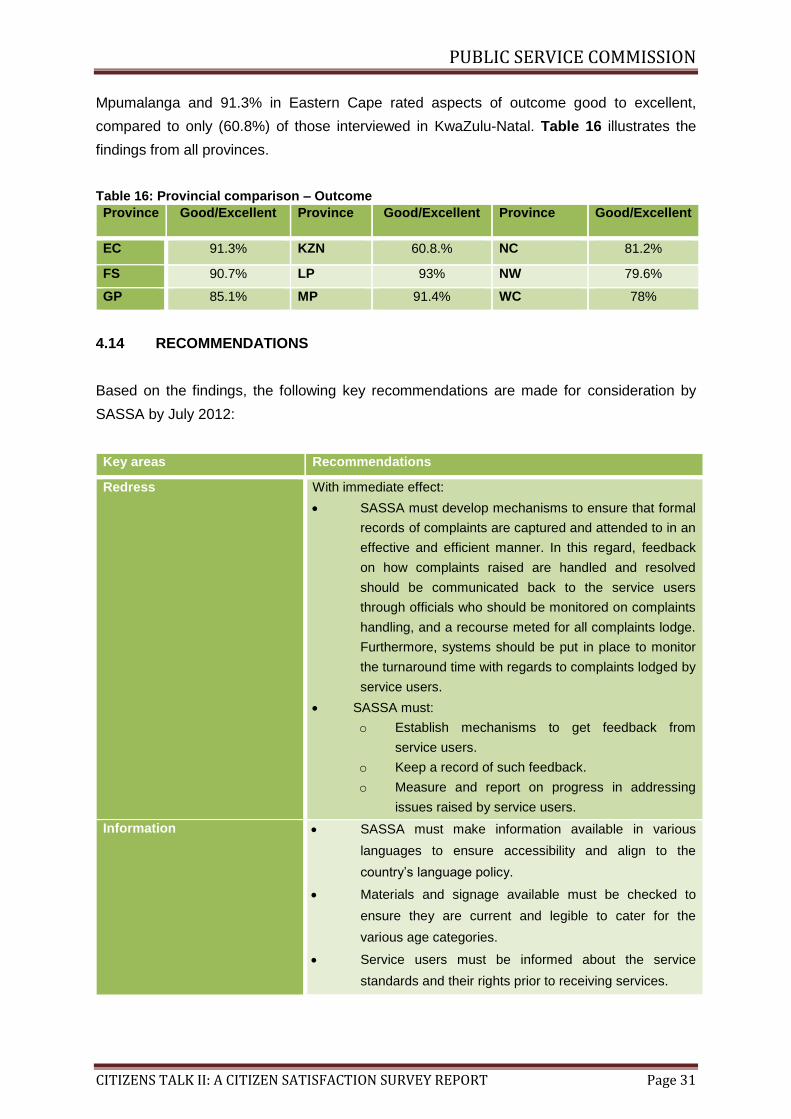
PUBLIC SERVICE COMMISSION
CITIZENS TALK II: A CITIZEN SATISFACTION SURVEY REPORT Page 31
Mpumalanga and 91.3% in Eastern Cape rated aspects of outcome good to excellent,
compared to only (60.8%) of those interviewed in KwaZulu-Natal. Table 16 illustrates the
findings from all provinces.
Table 16: Provincial comparison – Outcome
Province Good/Excellent Province Good/Excellent Province Good/Excellent
EC 91.3% KZN 60.8.% NC 81.2%
FS 90.7% LP 93% NW 79.6%
GP 85.1% MP 91.4% WC 78%
4.14 RECOMMENDATIONS
Based on the findings, the following key recommendations are made for consideration by
SASSA by July 2012:
Key areas Recommendations
Redress With immediate effect:
SASSA must develop mechanisms to ensure that formal
records of complaints are captured and attended to in an
effective and efficient manner. In this regard, feedback
on how complaints raised are handled and resolved
should be communicated back to the service users
through officials who should be monitored on complaints
handling, and a recourse meted for all complaints lodge.
Furthermore, systems should be put in place to monitor
the turnaround time with regards to complaints lodged by
service users.
SASSA must:
o Establish mechanisms to get feedback from
service users.
o Keep a record of such feedback.
o Measure and report on progress in addressing
issues raised by service users.
Information SASSA must make information available in various
languages to ensure accessibility and align to the
country’s language policy.
Materials and signage available must be checked to
ensure they are current and legible to cater for the
various age categories.
Service users must be informed about the service
standards and their rights prior to receiving services.

PUBLIC SERVICE COMMISSION
CITIZENS TALK II: A CITIZEN SATISFACTION SURVEY REPORT Page 32
Access SASSA must review the levels of service at satellite
offices and align these to service user requirements and
needs.
Service users’ ability to access service point through
telephone must be improved.
Timeliness With immediate effect service delivery processes must
be reviewed to eliminate long queues at service points.
The issue can be addressed by increasing the number of
staff at service points which service more people.

PUBLIC SERVICE COMMISSION
CITIZENS TALK II: A CITIZEN SATISFACTION SURVEY REPORT Page 33
CHAPTER FIVE: KEY FINDINGS: NELSON MANDELA BAY METROPOLITAN
MUNICIPALITY
5.1 INTRODUCTION
Chapter five presents the key findings of the survey in relation to the services rendered by
the Nelson Mandela Bay Metropolitan Municipality. A demographic profile of the service
users that participated in the study is presented first, followed by the key findings of the
survey. The key findings are presented according to the South African-specific drivers of
citizen satisfaction model described in Chapter Two of this report. In this regard, the service
users’ ratings of satisfaction with services of Nelson Mandela Bay Metro Municipality and the
challenges experienced are presented. The chapter concludes with a set of
recommendations.
5.2 DEMOGRAPHIC PROFILE
A total of 517 service users were interviewed at the sampled service delivery sites of the
Nelson Mandela Metropolitan Municipality in the Eastern Cape Province. The majority of the
service users (63%) were female and 37 were male. Forty percent (40%) of the service
users were between the ages of 35-49, 27% were between the ages of 25-34, 21% were
between the ages of 50-64, 9% were between the ages of 16-24 and 2% were 65 years old
and above.
In terms of educational attainment, 43.3% of the service users had a matric/Grade 12
certificate, followed by over a quarter (26.5%) with some secondary education and 14.7%
with a diploma. Fewer services users (5.2%) had a degree and the same proportion (5.2%)
had some primary education. An even lesser number (3.9%) had no formal schooling.
Employment levels were found to be low considering the high educational attainment rates.
Only one in four (44.3%) were in full time employment and a tenth (9.9%) were employed on
part time basis. Over a quarter (26.3%) of service users were unemployed, a tenth (10.6%)
were retired or pensioned while scholars make up a small proportion (5.4%).
5.3 KEY FINDINGS
The overall findings show that on average 63.3% of the service users were satisfied with the
services rendered by Nelson Mandela Bay Metro Municipality. Table 17 highlights service
users’ level of satisfaction with services rendered by Nelson Mandela Bay Metro according
to the key drivers of citizen satisfaction.

PUBLIC SERVICE COMMISSION
CITIZENS TALK II: A CITIZEN SATISFACTION SURVEY REPORT Page 34
Table 17: Service users' level of satisfaction with services rendered by Nelson Mandela Bay Metro Municipality
Drivers of Citizen Satisfaction Satisfaction Rating
Fairness and Equity 93.4%
Facilities 86.3%
Outcome 80.3%
Courtesy 77.5%
Timeliness 69.8%
Knowledge and Competence 64.9%
Value for money 53.3%
Information 49.3%
Access 43.2%
Redress 15.3%
Average rating across the 10 drivers 63.3%
Table 17 above shows that service users were highly satisfied with fairness and equity
(93.4) displayed by officials and least satisfied with access (43.2%) to service delivery points
and redress (15.3%) mechanisms. This finding suggests that service users that participated
in the survey were not satisfied with the various aspect of accessibility to service delivery
points of the Nelson Mandela Bay Metropolitan Municipality and the redress mechanisms
available.
5.4 ACCESS
5.4.1 Citizens’ level of satisfaction with accessibility to public services
Public Service institutions should provide citizens with equal access to the services to which
they are entitled4. In this regard the study sought to determine service users’ level of
satisfaction with regards to accessing the services rendered by Nelson Mandela Bay Metro
Municipality. To this end, four aspects relating to the accessibility of services were assessed
by the service users, namely, “accessibility of facility”, “convenience of operating hours”,
“disability/elderly access” and the “ability to contact the service point telephonically”.
4 Republic of South Africa, Department of Public Service and Administration, Batho Pele Handbook: Service
Improvement Guide. 2003.

PUBLIC SERVICE COMMISSION
CITIZENS TALK II: A CITIZEN SATISFACTION SURVEY REPORT Page 35
Figure 13: Rating the experience pertaining to accessibility to public services
Figure 13 above shows that 61.9% of the service users rated “convenience of operating
hours” good to excellent, 43.4% rated “disability/elderly access” good to excellent, 35.5%
rated “ability to access service point telephonically” good to excellent and only 32.1% rated
“accessibility of facility” good to excellent. The findings show that accessing the facilities of
the Nelson Mandela Bay Municipality and obtaining assistance by phone is a challenge for
service users.
5.4.2 Challenges experienced by service users in relation to accessibility to public
services
The key challenge identified by service users was the distance travelled to the service
points. The Nelson Mandela Bay municipality is a predominantly urban municipality. Despite
the municipal service points being located in urban areas, some respondents mentioned
distance to the facility and associated transport costs as the main critical challenge with
regards accessibility which accounted for close to half the responses (45%).
5.5 COURTESY
5.5.1 Citizens’ level of satisfaction with courtesy displayed by officials
Public Service officials should treat citizens with courtesy and consideration, and should
always be polite towards them5. The study sought to establish service users’ level of
satisfaction with regard to the courtesy displayed by the officials of Nelson Mandela Bay
5 Republic of South Africa. Department of Public Service and Administration. Batho Pele Handbook. Service
Delivery Improvement Guide. 2003.
30.6%
22.2%
15.1%
30.2%
1.9%
10.1% 8.7%
19.3%
59.4%
2.5% 2.9% 5.6%
48.2%
42.4%
1.0%
12.8%
8.3%
43.4%
34.3%
1.2%
Poor Below average Average Good Excellent
Accessibility of facility Convenience of operating hours
Disability/Elderly access Ability to access service point telephonically

PUBLIC SERVICE COMMISSION
CITIZENS TALK II: A CITIZEN SATISFACTION SURVEY REPORT Page 36
Metro Municipality.
Figure 14: Rating the experience pertaining to courtesy displayed by public officials in service delivery
Figure 14 above shows that 77.5% of the service users rated courtesy displayed by officials
good to excellent. The finding shows that the majority of service users were satisfied with
the manner in which they were treated by officials of the Nelson Mandela Bay Municipality.
5.4.2 Challenges experienced by service users in relation to courtesy displayed by
officials
The key challenge identified by service users was that some officials were rude and
unfriendly towards service users
5.6 TIMELINESS
5.6.1 Citizens’ level of satisfaction with timeliness in service delivery
Public services should be delivered swiftly, efficiently, within reasonable time and be
responsive to the client’s needs. To this end, the study sought to establish the service users’
level of satisfaction with timeliness during the delivery of the services of Nelson Mandela Bay
Metro Municipality.
3.9% 3.9%
14.7%
69.4%
8.1%
Poor Below average Average Good Excellent
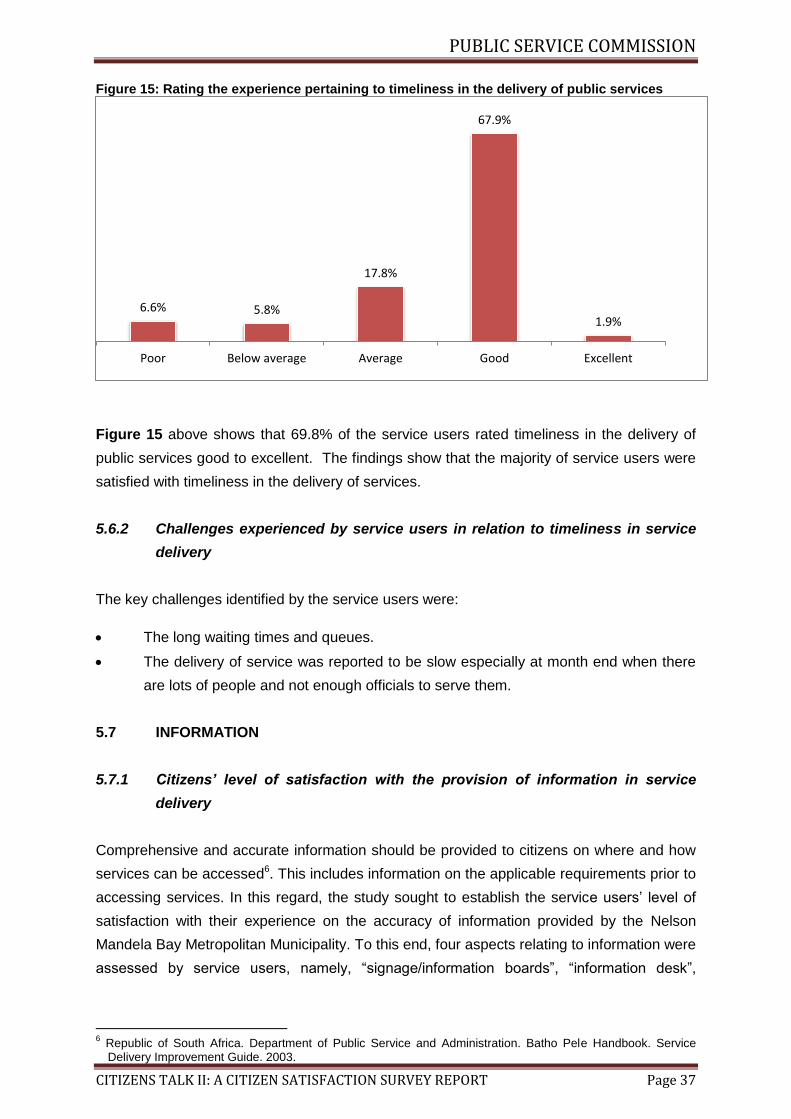
PUBLIC SERVICE COMMISSION
CITIZENS TALK II: A CITIZEN SATISFACTION SURVEY REPORT Page 37
Figure 15: Rating the experience pertaining to timeliness in the delivery of public services
Figure 15 above shows that 69.8% of the service users rated timeliness in the delivery of
public services good to excellent. The findings show that the majority of service users were
satisfied with timeliness in the delivery of services.
5.6.2 Challenges experienced by service users in relation to timeliness in service
delivery
The key challenges identified by the service users were:
The long waiting times and queues.
The delivery of service was reported to be slow especially at month end when there
are lots of people and not enough officials to serve them.
5.7 INFORMATION
5.7.1 Citizens’ level of satisfaction with the provision of information in service
delivery
Comprehensive and accurate information should be provided to citizens on where and how
services can be accessed6. This includes information on the applicable requirements prior to
accessing services. In this regard, the study sought to establish the service users’ level of
satisfaction with their experience on the accuracy of information provided by the Nelson
Mandela Bay Metropolitan Municipality. To this end, four aspects relating to information were
assessed by service users, namely, “signage/information boards”, “information desk”,
6 Republic of South Africa. Department of Public Service and Administration. Batho Pele Handbook. Service
Delivery Improvement Guide. 2003.
6.6% 5.8%
17.8%
67.9%
1.9%
Poor Below average Average Good Excellent

PUBLIC SERVICE COMMISSION
CITIZENS TALK II: A CITIZEN SATISFACTION SURVEY REPORT Page 38
availability of posters/ flyers or pamphlets and “information on level of quality and service”
provided.
Figure 16: Rating the experience pertaining to the provision of information in public service
Figure 16 above shows that 57.3% rated “information on level and quality of service” good
to excellent, 53% rated “posters/flyers/pamphlets” good to excellent, 47% rated “information
desk” good to excellent and 40% rated “signage/information boards” good to excellent. This
finding suggests that the provision of information via information desk was not helpful to the
majority of service users.
5.7.2 Challenges experienced by service users in obtaining accurate information
The key challenges identified by the service users were:
Information boards were old and not legible
There was no information desk
There were no posters, pamphlets, flyers, etc.
There was no signage or information boards outside service sites.
5.8 KNOWLEDGE AND COMPETENCE
5.8.1 Citizens’ level of satisfaction with knowledge and competence of official
Competence is a standard requirement for an individual to perform a specific job, and it
encompasses the knowledge utilised to improve performance. The study sought to
18.2%
21.5% 20.3%
37.7%
2.3%
8.3%
23.0% 21.7%
44.5%
2.5%
16.8%
12.8%
17.4%
49.9%
3.1% 3.1%
9.9%
29.8%
53.2%
4.1%
Poor Below average Average Good Excellent
Signage/Information boards Information desk
Posters/flyers/pamphlets Information on level and quality of service

PUBLIC SERVICE COMMISSION
CITIZENS TALK II: A CITIZEN SATISFACTION SURVEY REPORT Page 39
determine service users’ level of satisfaction with the knowledge and competence of officials
of Nelson Mandela Bay Metro. In this regard, three aspects relating to knowledge and
competence of officials were assessed by service users, namely, “officials’ knowledge about
services offered”, “officials’ ability to understand your requirements”, “officials’ ability to
accurately perform services”.
Figure 17: Rating the experience pertaining to the knowledge and competence of government officials
Figure 17 above shows that 66.3% of the service users rated “officials knowledge about
services offered” good to excellent, 65.9% rated “officials’ ability to understand your
requirements” good to excellent and 62.6% rated “officials’ ability to accurately perform
services” good to excellent.
5.8.2 Challenges pertaining to knowledge and competence of Staff
The key challenge identified by the service users was that while some officials were found to
understand client’s requirements and needs, others did not.
5.9 FACILITIES
5.9.1 Citizens’ level of satisfaction with the condition of public facilities
The condition of public facilities should be welcoming and cater for the needs of the citizens.
It is important for citizens to feel that contact with government is taking place in a clean, quiet
and safe environment. To this end, the study sought to establish the service users’ level of
satisfaction with the condition of the Nelson Mandela Bay Metro Municipality facilities. In this
3.5% 5.5%
24.8%
58.5%
7.8%
3.9% 5.7%
24.6%
56.9%
9.0%
4.9% 6.8%
25.7%
54.2%
8.4%
Poor Below average Average Good Excellent
Officials’ knowledge about services offered Officials’ ability to understand your requirements
Officials’ ability to accurately perform services

PUBLIC SERVICE COMMISSION
CITIZENS TALK II: A CITIZEN SATISFACTION SURVEY REPORT Page 40
regard three aspects relating to the condition of public facilities were assessed by service
users, namely, “waiting area”, “cleanliness of facilities” and “safety/security”.
Figure 18: Rating the experience pertaining to the condition of public facilities
Figure 18 above shows that 94.7% of the service users rated “cleanliness of facility” good to
excellent, 87.8% rated “security/safety” good to excellent while 76.4% rated “waiting area”
good to excellent. In general, the findings show that the facilities at the Nelson Mandela Bay
Municipality are conducive for provision of public services and the municipality should be
commended for this.
5.9.2 Challenges experienced by service users with regard to the condition of
public facilities
The key challenges identified by the service users were:
Security was inadequate at service sites
Insufficient chairs in the waiting area and service users had to stand before being
served
The outside area of the service point was dirty.
5.10 FAIRNESS AND EQUITY
5.10.1 Citizens’ level of satisfaction with the display of fairness and equity by
government officials when interacting with service users
Public services should be rendered equally and fairly without prejudice or favour. In this
regard, the study sought to establish service users’ experience with regard to the fairness
12.6%
3.5%
7.5%
55.1%
21.3%
0.6% 0.6%
4.1%
60.7%
34.0%
0.6% 2.1%
9.5%
64.7%
23.1%
Poor Below average Average Good Excellent
Waiting area Cleanliness of facility Security/Safety

PUBLIC SERVICE COMMISSION
CITIZENS TALK II: A CITIZEN SATISFACTION SURVEY REPORT Page 41
and equity displayed by officials. To this end, service users were requested to indicate the
extent to which they agree with the following statements, namely, “you were treated fairly by
officials” and “the service was rendered without favour”. Figure 19 below demonstrates
service users’ views with regard to the above-mentioned statements.
Figure 19: Rating the experience pertaining to fairness and equity displayed by officials
Figure 19 indicates that 93.4% of the service users agreed to strongly agree that service
was rendered without favour and 93.3% agree to strongly agree that they were treated fairly
by officials. The findings suggest that in general, service users were satisfied with the
aspects of fairness and equity displayed by the officials of the Nelson Mandela Bay
Municipality. However, it should be noted that 6.8% of the service users felt that they have
been unfairly treated by the officials of the municipality and 6.6% indicated that there has
been some preferential treatment in receiving services. This is a cause for concern as such
incidents may a potential to lead to nepotism, favouritism or corruption which is not a good
practice.
5.11 VALUE FOR MONEY
5.11.1 Citizens’ level of satisfaction with value for money in service delivery
Public services have to be delivered economically and efficiently in order to give citizens the
best value for money. In this regard, the survey sought to establish service users’ level of
satisfaction with their experience on value for money in service delivery. To this end, service
users had to indicate the extent to which they agree with the following statements “officials
rendered services efficiently”, “cost of services was reasonable” and “the service is an
example of good value for money”. Figure 20 below presents the service users’ views with
the above-mentioned statements.
3.1% 3.7%
78.3%
15.0%
2.9% 3.7%
78.4%
15.0%
Strongly disagree Disagree Agree Strongly agree
Fair treatment by officials Service rendered without favour
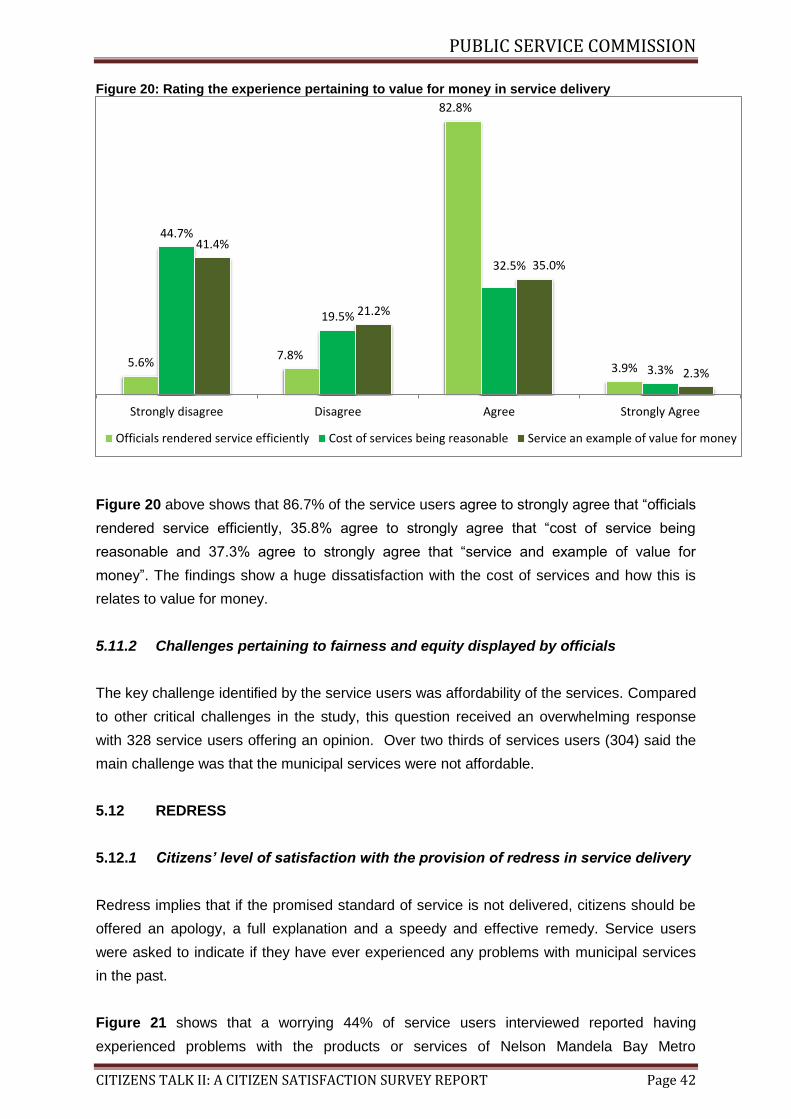
PUBLIC SERVICE COMMISSION
CITIZENS TALK II: A CITIZEN SATISFACTION SURVEY REPORT Page 42
Figure 20: Rating the experience pertaining to value for money in service delivery
Figure 20 above shows that 86.7% of the service users agree to strongly agree that “officials
rendered service efficiently, 35.8% agree to strongly agree that “cost of service being
reasonable and 37.3% agree to strongly agree that “service and example of value for
money”. The findings show a huge dissatisfaction with the cost of services and how this is
relates to value for money.
5.11.2 Challenges pertaining to fairness and equity displayed by officials
The key challenge identified by the service users was affordability of the services. Compared
to other critical challenges in the study, this question received an overwhelming response
with 328 service users offering an opinion. Over two thirds of services users (304) said the
main challenge was that the municipal services were not affordable.
5.12 REDRESS
5.12.1 Citizens’ level of satisfaction with the provision of redress in service delivery
Redress implies that if the promised standard of service is not delivered, citizens should be
offered an apology, a full explanation and a speedy and effective remedy. Service users
were asked to indicate if they have ever experienced any problems with municipal services
in the past.
Figure 21 shows that a worrying 44% of service users interviewed reported having
experienced problems with the products or services of Nelson Mandela Bay Metro
5.6% 7.8%
82.8%
3.9%
44.7%
19.5%
32.5%
3.3%
41.4%
21.2%
35.0%
2.3%
Strongly disagree Disagree Agree Strongly Agree
Officials rendered service efficiently Cost of services being reasonable Service an example of value for money

PUBLIC SERVICE COMMISSION
CITIZENS TALK II: A CITIZEN SATISFACTION SURVEY REPORT Page 43
Municipality.
Figure 21: Have you ever experienced problems with the products or service?
Service users who had experienced problems with the services and products at Nelson
Mandela Bay Metro indicated the following as their problems:
Wrong meter readings and estimations instead of providing actual readings
Services (water and electricity) cut off, often without notice
Frequent water leakages
Statements sent to wrong address and not receiving billing statements
Not receiving the allocated free units for services as per policy
Service users were also requested to indicate the frequency of experiencing the problems.
The findings are shown on Figure 22 below.
Figure 22: How often have you experienced problems with the service?
Yes 44%
No 56%
39.5%
48.4%
12.1%
Seldom Often Very often
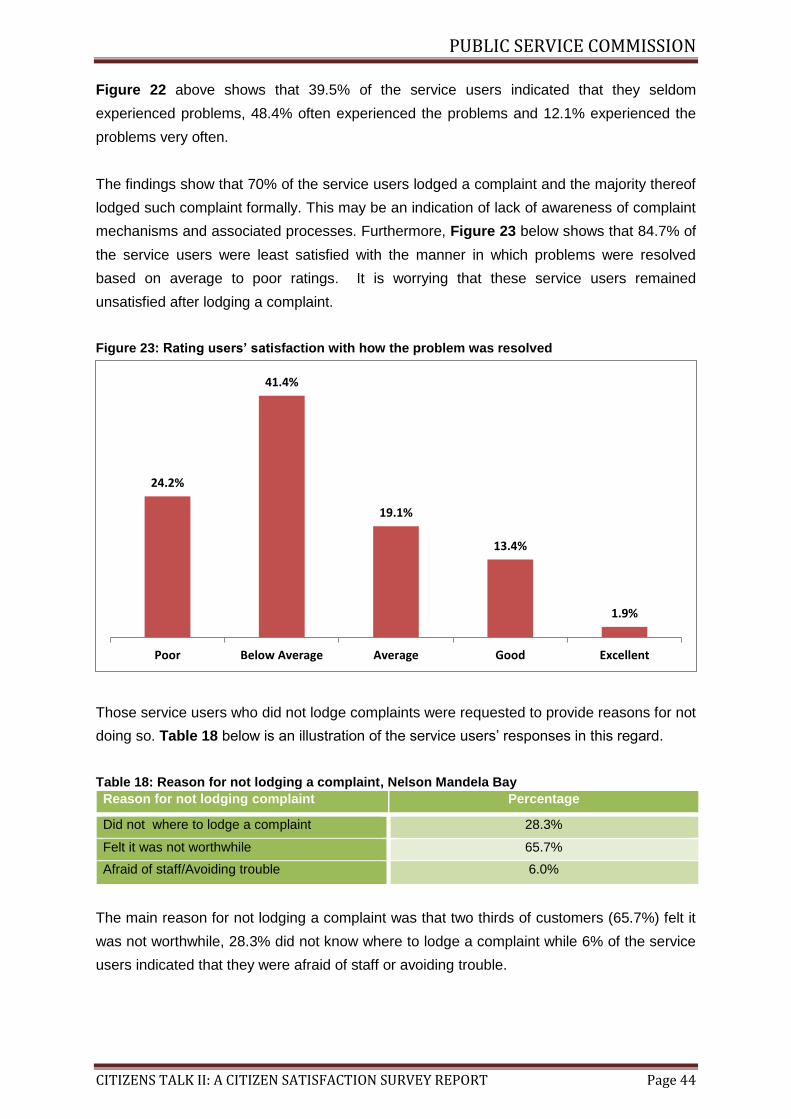
PUBLIC SERVICE COMMISSION
CITIZENS TALK II: A CITIZEN SATISFACTION SURVEY REPORT Page 44
Figure 22 above shows that 39.5% of the service users indicated that they seldom
experienced problems, 48.4% often experienced the problems and 12.1% experienced the
problems very often.
The findings show that 70% of the service users lodged a complaint and the majority thereof
lodged such complaint formally. This may be an indication of lack of awareness of complaint
mechanisms and associated processes. Furthermore, Figure 23 below shows that 84.7% of
the service users were least satisfied with the manner in which problems were resolved
based on average to poor ratings. It is worrying that these service users remained
unsatisfied after lodging a complaint.
Figure 23: Rating users’ satisfaction with how the problem was resolved
Those service users who did not lodge complaints were requested to provide reasons for not
doing so. Table 18 below is an illustration of the service users’ responses in this regard.
Table 18: Reason for not lodging a complaint, Nelson Mandela Bay
Reason for not lodging complaint Percentage
Did not where to lodge a complaint 28.3%
Felt it was not worthwhile 65.7%
Afraid of staff/Avoiding trouble 6.0%
The main reason for not lodging a complaint was that two thirds of customers (65.7%) felt it
was not worthwhile, 28.3% did not know where to lodge a complaint while 6% of the service
users indicated that they were afraid of staff or avoiding trouble.
24.2%
41.4%
19.1%
13.4%
1.9%
Poor Below Average Average Good Excellent
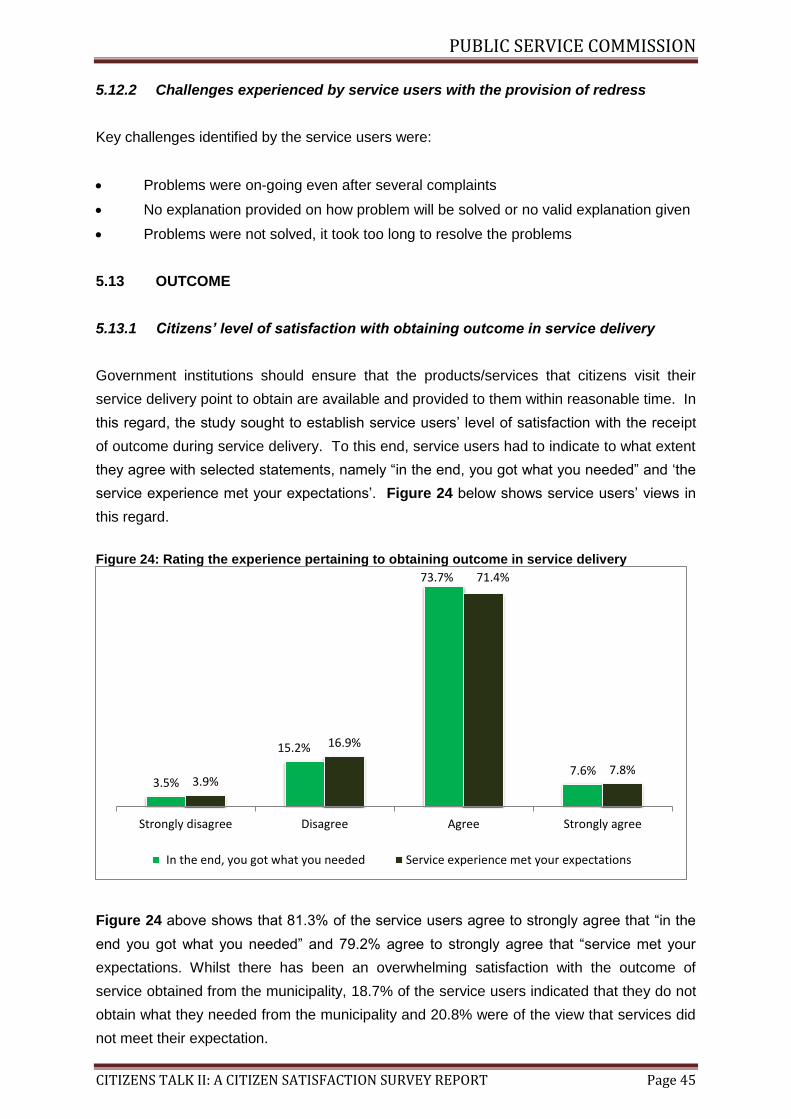
PUBLIC SERVICE COMMISSION
CITIZENS TALK II: A CITIZEN SATISFACTION SURVEY REPORT Page 45
5.12.2 Challenges experienced by service users with the provision of redress
Key challenges identified by the service users were:
Problems were on-going even after several complaints
No explanation provided on how problem will be solved or no valid explanation given
Problems were not solved, it took too long to resolve the problems
5.13 OUTCOME
5.13.1 Citizens’ level of satisfaction with obtaining outcome in service delivery
Government institutions should ensure that the products/services that citizens visit their
service delivery point to obtain are available and provided to them within reasonable time. In
this regard, the study sought to establish service users’ level of satisfaction with the receipt
of outcome during service delivery. To this end, service users had to indicate to what extent
they agree with selected statements, namely “in the end, you got what you needed” and ‘the
service experience met your expectations’. Figure 24 below shows service users’ views in
this regard.
Figure 24: Rating the experience pertaining to obtaining outcome in service delivery
Figure 24 above shows that 81.3% of the service users agree to strongly agree that “in the
end you got what you needed” and 79.2% agree to strongly agree that “service met your
expectations. Whilst there has been an overwhelming satisfaction with the outcome of
service obtained from the municipality, 18.7% of the service users indicated that they do not
obtain what they needed from the municipality and 20.8% were of the view that services did
not meet their expectation.
3.5%
15.2%
73.7%
7.6% 3.9%
16.9%
71.4%
7.8%
Strongly disagree Disagree Agree Strongly agree
In the end, you got what you needed Service experience met your expectations

PUBLIC SERVICE COMMISSION
CITIZENS TALK II: A CITIZEN SATISFACTION SURVEY REPORT Page 46
5.13.2 Challenges experienced by service users with the outcome of services
provided
Key challenges identified by the service users were
Results were unsatisfactory
Billing issues were not resolved
No feedback was provided to service users about outcome of service
5.14 RECOMMENDATIONS
Based on the findings, the following recommendations are made for consideration by the
Nelson Mandela Metropolitan Bay Municipality by July 2012:
Key areas Recommendations
Redress With immediate effect:
The Nelson Mandela Bay Municipality must develop
mechanisms to ensure that formal records of
complaints are captured and attended to in an effective
and efficient manner. In this regard, feedback on how
complaints raised are handled and resolved should be
communicated back to the service users through
officials who should be monitored on complaints
handling, and a recourse meted for all complaints
lodge. Furthermore, systems should be put in place to
monitor the turnaround time with regards to complaints
lodged by service users.
With immediate effect the Municipality must:
o Establish mechanisms to get feedback from
service users.
o Keep a record of such feedback.
o Measure and report on progress in addressing
issues raised by service users.
Access The municipality must investigate the proximity of
service sites to where service users live to address
accessibility of services.
Officials at all service sites must ensure that telephone
numbers of services are visibly displayed and officials
must strive to assist service users telephonically.
With immediate effect officials must give attention to
the needs of the disabled and elderly in accessing
service delivery sites.
Information Officials must ensure that the functioning of help desks
at all service sites is improved and that the help desks
PUBLIC SERVICE COMMISSION
CITIZENS TALK II: A CITIZEN SATISFACTION SURVEY REPORT Page 47
are stocked well with posters/flyers/pamphlets. This
must be done immediately.
Value for money Officials must communicate how the cost of various
services is arrived at so that service users are not
caught by surprise. Increases and the rationale behind
them must be communicated well in advance of their
implementation using innovative methods such as
SMS as well as on radio and regional TV broadcasts.
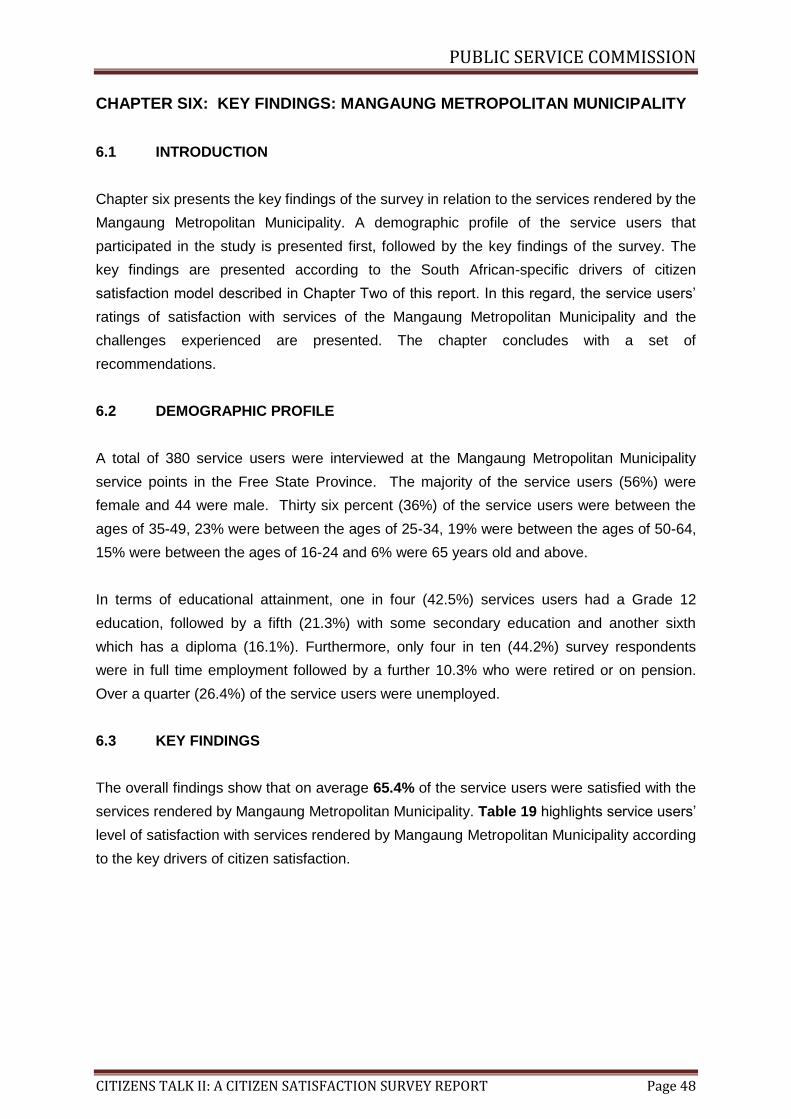
PUBLIC SERVICE COMMISSION
CITIZENS TALK II: A CITIZEN SATISFACTION SURVEY REPORT Page 48
CHAPTER SIX: KEY FINDINGS: MANGAUNG METROPOLITAN MUNICIPALITY
6.1 INTRODUCTION
Chapter six presents the key findings of the survey in relation to the services rendered by the
Mangaung Metropolitan Municipality. A demographic profile of the service users that
participated in the study is presented first, followed by the key findings of the survey. The
key findings are presented according to the South African-specific drivers of citizen
satisfaction model described in Chapter Two of this report. In this regard, the service users’
ratings of satisfaction with services of the Mangaung Metropolitan Municipality and the
challenges experienced are presented. The chapter concludes with a set of
recommendations.
6.2 DEMOGRAPHIC PROFILE
A total of 380 service users were interviewed at the Mangaung Metropolitan Municipality
service points in the Free State Province. The majority of the service users (56%) were
female and 44 were male. Thirty six percent (36%) of the service users were between the
ages of 35-49, 23% were between the ages of 25-34, 19% were between the ages of 50-64,
15% were between the ages of 16-24 and 6% were 65 years old and above.
In terms of educational attainment, one in four (42.5%) services users had a Grade 12
education, followed by a fifth (21.3%) with some secondary education and another sixth
which has a diploma (16.1%). Furthermore, only four in ten (44.2%) survey respondents
were in full time employment followed by a further 10.3% who were retired or on pension.
Over a quarter (26.4%) of the service users were unemployed.
6.3 KEY FINDINGS
The overall findings show that on average 65.4% of the service users were satisfied with the
services rendered by Mangaung Metropolitan Municipality. Table 19 highlights service users’
level of satisfaction with services rendered by Mangaung Metropolitan Municipality according
to the key drivers of citizen satisfaction.

PUBLIC SERVICE COMMISSION
CITIZENS TALK II: A CITIZEN SATISFACTION SURVEY REPORT Page 49
Table 19: Service users' level of satisfaction with services rendered by Mangaung Municipality
Drivers of Citizen Satisfaction Satisfaction Rating
Fairness and equity 91.3%
Courtesy 81.1%
Facilities 80.1%
Knowledge and competence 73.5%
Outcome 72.8%
Value for money 71.4%
Timeliness 70.3%
Access 58%
Information 45.8%
Redress 9.8%
Average rating across the 10 drivers 65.4%
Table 19 above shows that service users were mostly satisfied with fairness and equity
(91.3%) displayed by officials and least satisfied with provision of accurate and
comprehensive information (45.8%) and redress (9.8%). The finding suggests that service
users that participated in this survey were not satisfied with the provision of information and
redress mechanisms at the service delivery sites of Mangaung Municipality.
6.4 ACCESS
6.4.1 Citizens’ level of satisfaction with accessibility to public services
Public Service institutions should provide citizens with equal access to the services to which
they are entitled7. In this regard the study sought to determine service users’ level of
satisfaction with regards to accessing the services rendered by Mangaung Metropolitan
Municipality. To this end, four aspects relating to the accessibility of services were assessed
by the service users, namely, “accessibility of facility”, “convenience of operating hours”,
“disability/elderly access and the “ability to contact the service point telephonically”.
7 Republic of South Africa, Department of Public Service and Administration, Batho Pele Handbook: Service Improvement Guide. 2003.

PUBLIC SERVICE COMMISSION
CITIZENS TALK II: A CITIZEN SATISFACTION SURVEY REPORT Page 50
Figure 25: Rating the experience pertaining to accessibility to public services
Figure 25 above shows that 68.4% service users rated “convenience of operating hours”
good to excellent, 61% rated “disability/elderly access” good to excellent, 54.7% rated
“accessibility of facility” good to excellent and 47.9% rated “ability to access service point by
phone” good to excellent. The finding shows that obtaining assistance through phone is a
challenge for the majority of service users.
6.4.2 Challenges experienced by service users in relation to accessibility to public
services
Key challenges identified by the service users were:
• Distance travelled to the service site was long and transport costs were high
• Operating hours were limited and early closure during week
• Telephone lines were not answered.
6.5 COURTESY
6.5.1 Citizens’ level of satisfaction with courtesy displayed by officials
Public Service officials should treat citizens with courtesy and consideration, and should
always be polite towards them8. The study sought to establish service users’ level of
8 Republic of South Africa. Department of Public Service and Administration. Batho Pele Handbook. Service
Delivery Improvement Guide. 2003.
5.8% 9.2%
30.3%
49.2%
5.5% 3.2% 4.2%
24.2%
65.5%
2.9% 1.6% 3.7%
33.7%
60.5%
0.5%
7.4% 6.8%
37.9%
46.3%
1.6%
Poor Below average Average Good Excellent
Accessibility of facility Convenience of operating hours Disability/Elderly access Ability to access service point by phone

PUBLIC SERVICE COMMISSION
CITIZENS TALK II: A CITIZEN SATISFACTION SURVEY REPORT Page 51
Satisfaction with regard to the courtesy displayed by the officials of Mangaung Local
Municicipality.
Figure 26: Rating the experience pertaining to courtesy displayed by public officials in service delivery
Figure 26 above shows that 81.1% of the service users rated their experience of courtesy as
good to excellent. However, 18.9% of them found the courtesy displayed by officials as
average to poor.
6.5.2 Challenges experienced by service users in relation to the officials’ display of
courtesy
The key challenge identified by service users was that while some officials were polite,
others were rude or unfriendly towards citizens.
6.6 TIMELINESS
6.6.1 Citizens’ level of satisfaction with timeliness in service delivery
Public services should be delivered swiftly, efficiently, within reasonable time and be respon-
sive to the client’s needs. To this end, the study sought to establish the service users’ level
of satisfaction with timeliness during the delivery of the services of Mangaung Metropolitan
Municipality.
2.4% 3.9%
12.6%
60.0%
21.1%
Poor Below average Average Good Excellent
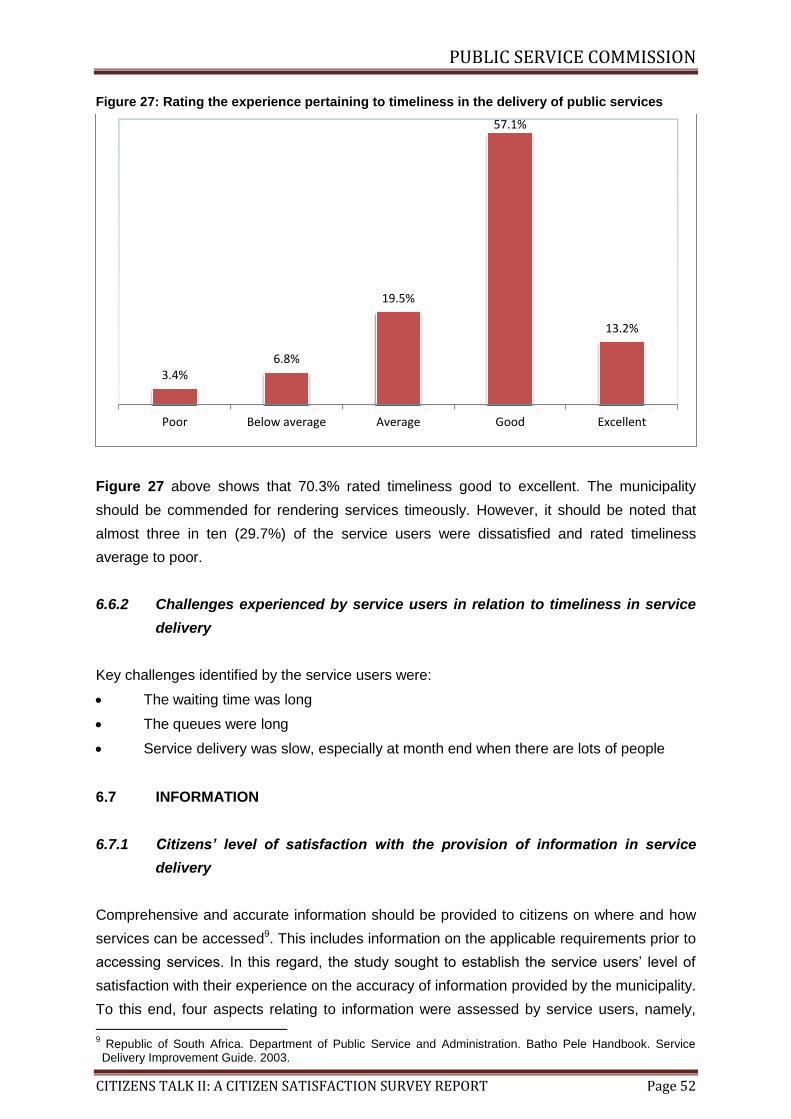
PUBLIC SERVICE COMMISSION
CITIZENS TALK II: A CITIZEN SATISFACTION SURVEY REPORT Page 52
Figure 27: Rating the experience pertaining to timeliness in the delivery of public services
Figure 27 above shows that 70.3% rated timeliness good to excellent. The municipality
should be commended for rendering services timeously. However, it should be noted that
almost three in ten (29.7%) of the service users were dissatisfied and rated timeliness
average to poor.
6.6.2 Challenges experienced by service users in relation to timeliness in service
delivery
Key challenges identified by the service users were:
The waiting time was long
The queues were long
Service delivery was slow, especially at month end when there are lots of people
6.7 INFORMATION
6.7.1 Citizens’ level of satisfaction with the provision of information in service
delivery
Comprehensive and accurate information should be provided to citizens on where and how
services can be accessed9. This includes information on the applicable requirements prior to
accessing services. In this regard, the study sought to establish the service users’ level of
satisfaction with their experience on the accuracy of information provided by the municipality.
To this end, four aspects relating to information were assessed by service users, namely,
9 Republic of South Africa. Department of Public Service and Administration. Batho Pele Handbook. Service Delivery Improvement Guide. 2003.
3.4% 6.8%
19.5%
57.1%
13.2%
Poor Below average Average Good Excellent
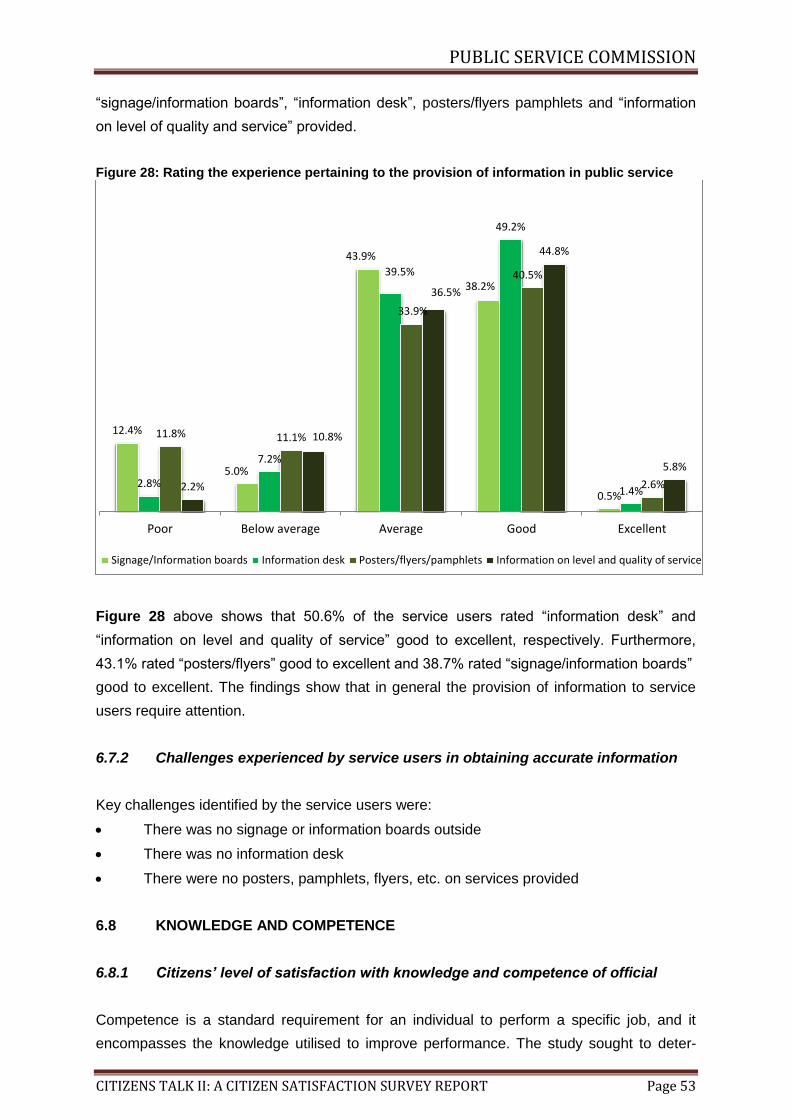
PUBLIC SERVICE COMMISSION
CITIZENS TALK II: A CITIZEN SATISFACTION SURVEY REPORT Page 53
“signage/information boards”, “information desk”, posters/flyers pamphlets and “information
on level of quality and service” provided.
Figure 28: Rating the experience pertaining to the provision of information in public service
Figure 28 above shows that 50.6% of the service users rated “information desk” and
“information on level and quality of service” good to excellent, respectively. Furthermore,
43.1% rated “posters/flyers” good to excellent and 38.7% rated “signage/information boards”
good to excellent. The findings show that in general the provision of information to service
users require attention.
6.7.2 Challenges experienced by service users in obtaining accurate information
Key challenges identified by the service users were:
There was no signage or information boards outside
There was no information desk
There were no posters, pamphlets, flyers, etc. on services provided
6.8 KNOWLEDGE AND COMPETENCE
6.8.1 Citizens’ level of satisfaction with knowledge and competence of official
Competence is a standard requirement for an individual to perform a specific job, and it
encompasses the knowledge utilised to improve performance. The study sought to deter-
12.4%
5.0%
43.9%
38.2%
0.5% 2.8%
7.2%
39.5%
49.2%
1.4%
11.8% 11.1%
33.9%
40.5%
2.6% 2.2%
10.8%
36.5%
44.8%
5.8%
Poor Below average Average Good Excellent
Signage/Information boards Information desk Posters/flyers/pamphlets Information on level and quality of service
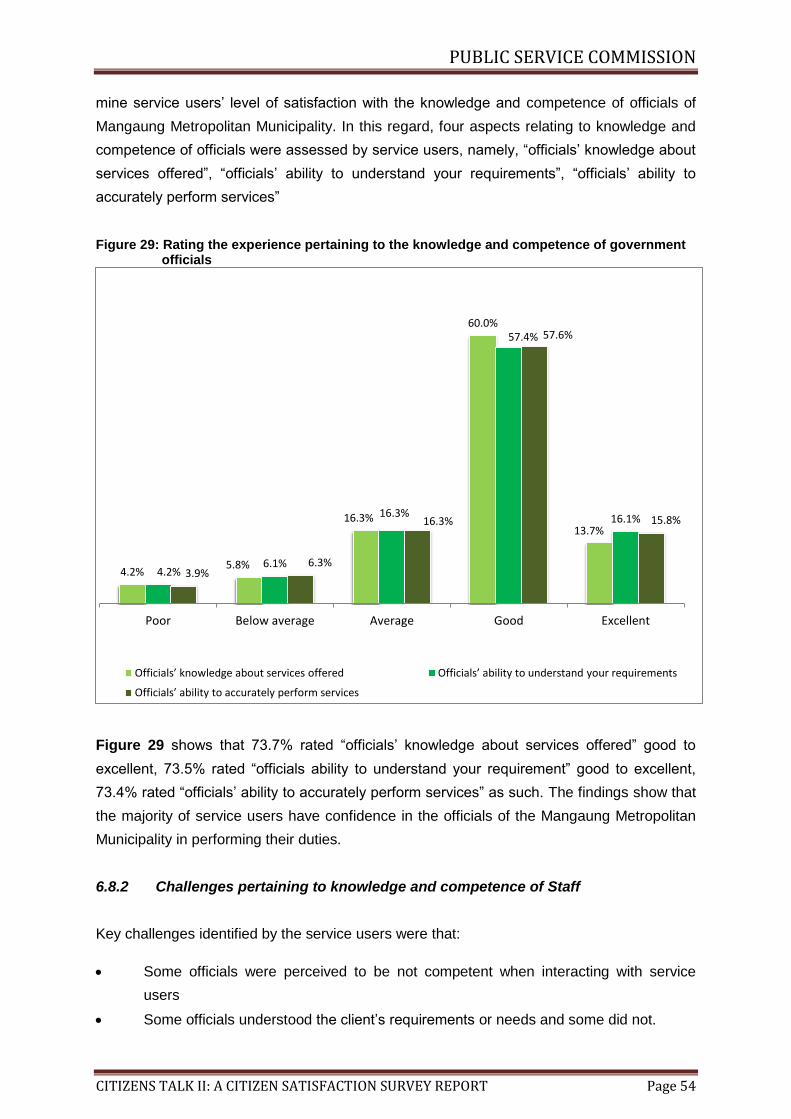
PUBLIC SERVICE COMMISSION
CITIZENS TALK II: A CITIZEN SATISFACTION SURVEY REPORT Page 54
mine service users’ level of satisfaction with the knowledge and competence of officials of
Mangaung Metropolitan Municipality. In this regard, four aspects relating to knowledge and
competence of officials were assessed by service users, namely, “officials’ knowledge about
services offered”, “officials’ ability to understand your requirements”, “officials’ ability to
accurately perform services”
Figure 29: Rating the experience pertaining to the knowledge and competence of government officials
Figure 29 shows that 73.7% rated “officials’ knowledge about services offered” good to
excellent, 73.5% rated “officials ability to understand your requirement” good to excellent,
73.4% rated “officials’ ability to accurately perform services” as such. The findings show that
the majority of service users have confidence in the officials of the Mangaung Metropolitan
Municipality in performing their duties.
6.8.2 Challenges pertaining to knowledge and competence of Staff
Key challenges identified by the service users were that:
Some officials were perceived to be not competent when interacting with service
users
Some officials understood the client’s requirements or needs and some did not.
4.2% 5.8%
16.3%
60.0%
13.7%
4.2% 6.1%
16.3%
57.4%
16.1%
3.9% 6.3%
16.3%
57.6%
15.8%
Poor Below average Average Good Excellent
Officials’ knowledge about services offered Officials’ ability to understand your requirements
Officials’ ability to accurately perform services

PUBLIC SERVICE COMMISSION
CITIZENS TALK II: A CITIZEN SATISFACTION SURVEY REPORT Page 55
6.9 FACILITIES
6.9.1 Citizens’ level of satisfaction with the condition of public facilities
The condition of public facilities should be welcoming and cater for the needs of the citizens.
It is important for citizens to feel that contact with government is taking place in a clean, quiet
and safe environment. To this end, the study sought to establish the service users’ level of
satisfaction with the condition of Mangaung Metropolitan Municipality’s facilities. In this
regard three aspects relating to the condition of public facilities were assessed by service
users, namely, “waiting area”, “cleanliness of facilities” and “safety/security”.
Figure 30: Rating the experience pertaining to the condition of public services
Figure 30 shows that 88.7% of the service users rated “cleanliness of facility” good to
excellent, 81.6% rated “security/safety” good to excellent and 70.1% rated “waiting area”
good to excellent. In general, the condition of the public facilities at Mangaung service points
was rated positively by the majority of service users, with the best scores given to the
cleanliness of the facility. The municipality should be commended for such effort as it implies
that citizens are treated with human dignity.
6.9.2 Challenges experienced by service users with regard to the condition of
public facilities
Key challenges identified by service users were:
The size of the waiting area was small, thus leading to overcrowding.
9.5%
3.2%
17.2%
59.0%
11.1%
0.3% 0.3%
10.8%
68.4%
20.3%
0.5% 1.1%
16.8%
67.4%
14.2%
Poor Below average Average Good Excellent
Waiting area Cleanliness of facility Security/Safety

PUBLIC SERVICE COMMISSION
CITIZENS TALK II: A CITIZEN SATISFACTION SURVEY REPORT Page 56
Shortage of chairs in the waiting areas was a challenge leading to customers having
to stand before being served.
6.10 FAIRNESS AND EQUITY
6.10.1 Citizens’ level of satisfaction with the display of fairness and equity by
government officials when interacting with service users
Public services should be rendered equally and fairly without prejudice or favour. In this
regard, the study sought to establish service users’ experience with regard to the fairness
and equity displayed by officials. To this end, service users were requested to indicate the
extent to which they agree with the following statements, namely, “you were treated fairly by
officials” and “the service was rendered without favour”. Figure 31 demonstrates service
users’ views with regard to the above-mentioned statements.
Figure 31: Rating the experience to fairness and equity displayed by officials
Figure 31 above shows that 91.5% agree to strongly agree “fair treatment by officials”,
91.1% agree to strongly agree “service rendered without favour”. Mangaung Metropolitan
Municipality scored favourably under the fairness and equity, with only less than one in ten
strongly disagreeing or disagreeing with statements. Whilst in general, service users seemed
happy with the aspects of the driver, it was established that about 8.4% of the service users
felt that they have been unfairly treated by the officials of the municipality and 9% indicated
that there has been some preferential treatment in receiving services. This is a cause for
concern as such incidents may a potential to lead to nepotism, favouritism or corruption
which is not a good practice.
3.4% 5.0%
69.7%
21.8%
3.7% 5.3%
68.2%
22.9%
Strongly disagree Disagree Agree Strongly agree
Fair treatment by officials Service rendered without favour

PUBLIC SERVICE COMMISSION
CITIZENS TALK II: A CITIZEN SATISFACTION SURVEY REPORT Page 57
6.10.2 Challenges pertaining to fairness and equity displayed by officials
In line with the good ratings under fairness and equity, only a few respondents mentioned
critical challenges in terms of fairness and equity demonstrated by officials at service point.
The main critical challenge mentioned was that discrimination was rife with respondents
saying white people are treated better.
6.11 VALUE FOR MONEY
6.11.1 Citizens’ level of satisfaction with value for money in service delivery
Public services have to be delivered economically and efficiently in order to give citizens the
best value for money. In this regard, the survey sought to establish service users’ level of
satisfaction with their experience on value for money in service delivery. To this end, service
users had to indicate the extent to which they agree with the following statements “officials
rendered services efficiently”, “cost of services was reasonable” and “the service is an
example of good value for money”. Figure 32 presents the service users’ views with the
above-mentioned statements.
Figure 32: Rating the experience pertaining to value for money in service delivery
Figure 32 shows that 77.3% rated “officials rendered service efficiently” good to excellent,
69.2% rated “service an example of value for money” good to excellent and 67.6% rated
“cost of service being reasonable” good to excellent.
6.8%
15.8%
65.5%
11.8%
15.5% 16.8%
54.7%
12.9% 14.2% 16.6%
55.8%
13.4%
Strongly disagree Disagree Agree Strongly Agree
Officials rendered service efficiently Cost of services being reasonable Service an example of value for money

PUBLIC SERVICE COMMISSION
CITIZENS TALK II: A CITIZEN SATISFACTION SURVEY REPORT Page 58
6.11.2 Challenges pertaining to obtaining value for money
Key challenges identified by service users were:
Services were unaffordable and most people were unemployed
Meters were not read, amounts were due were based on estimations
6.12 REDRESS
6.12.1 Citizens’ level of satisfaction with the provision of redress in service delivery
Redress implies that if the promised standard of service is not delivered, citizens should be
offered an apology, a full explanation and a speedy and effective remedy. Service users
were asked to indicate if they have ever experienced any problems with hospital services in
the past.
Over a third of services users (35.3%) in Mangaung Metropolitan Municipality reported
having experienced problems with services and products while the majority (64.7%) had not.
Figure 33: Have you experienced problems with the products or service?
In general, the nature of the problems on the municipal services and products experienced
by service users related to wrong meter readings or the estimation thereof.
Service users who experienced problems were further requested to indicate the frequency of
experiencing problems. Figure 34 below is an illustration of the frequency of experiencing
problems.
Yes 35.3%
No 64.7%
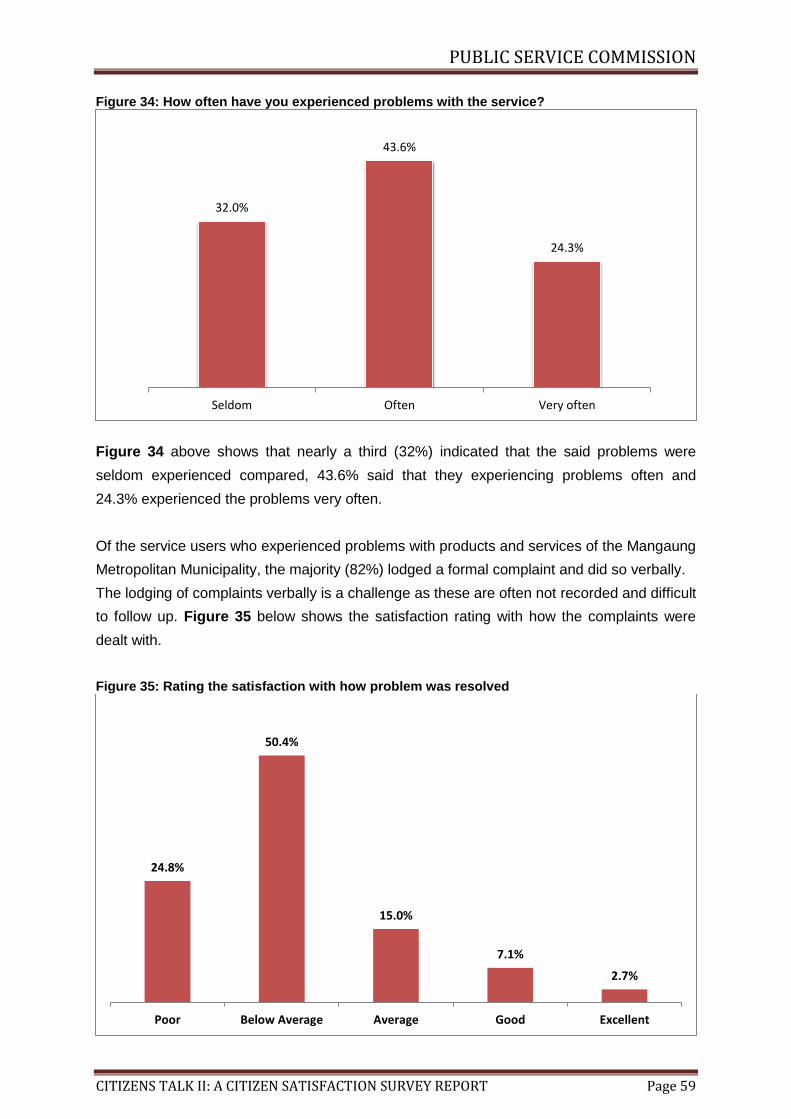
PUBLIC SERVICE COMMISSION
CITIZENS TALK II: A CITIZEN SATISFACTION SURVEY REPORT Page 59
Figure 34: How often have you experienced problems with the service?
Figure 34 above shows that nearly a third (32%) indicated that the said problems were
seldom experienced compared, 43.6% said that they experiencing problems often and
24.3% experienced the problems very often.
Of the service users who experienced problems with products and services of the Mangaung
Metropolitan Municipality, the majority (82%) lodged a formal complaint and did so verbally.
The lodging of complaints verbally is a challenge as these are often not recorded and difficult
to follow up. Figure 35 below shows the satisfaction rating with how the complaints were
dealt with.
Figure 35: Rating the satisfaction with how problem was resolved
32.0%
43.6%
24.3%
Seldom Often Very often
24.8%
50.4%
15.0%
7.1%
2.7%
Poor Below Average Average Good Excellent

PUBLIC SERVICE COMMISSION
CITIZENS TALK II: A CITIZEN SATISFACTION SURVEY REPORT Page 60
Figure 35 above shows that 90.2% of the service users who had lodged a complaint rated
their satisfaction with how their problem was resolved average to poor. This rating is of
concern as it serves as an indication of poor resolution of issues and lack of redress.
Service users who did not lodge a complaint were requested to provide reasons for not
doing so. Table 20 below illustrates the service users’ responses.
Table 20: Reason for not lodging a complaint, Mangaung
Reason for not lodging a complaint Percentage
It was not worthwhile 74.2%
Did not know where to lodge a complaint 21.0%
Afraid of staff or wanted to avoid trouble 4.8%
The findings show that the main reasons for not lodging a complaint reflect lack of faith in the
system with three quarters (74.2%) of service users not lodging a complaint because they
felt it is not worthwhile to do so. This was followed by 21% who did not know where to lodge
a complaint and 4.8% said that they were afraid of staff or they were avoiding trouble.
6.12.2 Challenges experienced by service users with the provision of redress
Key challenges identified by service users were:
It took too long for problems to be resolved
Problems were on-going even after lodging several complaints
No explanation on how problem will be solved was given or there was simply no valid
explanation
No feedback was provided on complaint lodged.
6.13 OUTCOME
6.13.1 Citizens’ level of satisfaction with obtaining outcome in service delivery
Government institutions should ensure that the products/services that citizens visit their
service delivery point to obtain are available and provided to them within reasonable time. In
this regard, the study sought to establish service users’ level of satisfaction with the receipt
of outcome during service delivery. To this end, service users had to indicate to what extent
they agree with selected statements, namely “in the end, you got what you needed” and ‘the
service experience met your expectations’. Figure 36 below shows service users’ views in
this regard

PUBLIC SERVICE COMMISSION
CITIZENS TALK II: A CITIZEN SATISFACTION SURVEY REPORT Page 61
Figure 36: Rating the experience pertaining to obtaining outcome in service delivery
Figure 36 above shows that 73.2% of the service users agreed to strongly agreed that “in
the end you got what you needed”, 72.4% agreed to strongly agreed that “service
experience met your expectations”. Scores in the outcome driver are encouraging in that
three out of four service users were satisfied as reflected by their agreement or strong
agreement to the posed statements. Impressive as the scores may seem, there is concern
about the quarter that did not seem satisfied as indicated by their disagreement or strong
disagreement ratings to the posed statements.
6.13.2 Challenges experienced by service users with the outcome of services
provided
Key challenges identified by the service users were:
Results were unsatisfactory
Billing issue were not resolved
No feedback was provided.
6.14 RECOMMENDATIONS
Bases on the findings, the following key recommendations are made for consideration by the
Mangaung Metropolitan Municipality by July 2012:
Key areas Recommendations
Redress With immediate effect:
The Mangaung Metropolitan Municipality must develop mechanisms
12.9% 13.9%
65.3%
7.9%
13.2% 14.5%
64.5%
7.9%
Strongly agree Disagree Agree Strongly disagree
In the end, you got what you needed Service experience met your expectations

PUBLIC SERVICE COMMISSION
CITIZENS TALK II: A CITIZEN SATISFACTION SURVEY REPORT Page 62
to ensure that formal records of complaints are captured and attended
to in an effective and efficient manner. In this regard, feedback on
how complaints raised are handled and resolved should be
communicated back to the service users through officials who should
be monitored on complaints handling, and a recourse meted for all
complaints lodge. Furthermore, systems should be put in place to
monitor the turnaround time with regards to complaints lodged by
service users.
With immediate effect the Municipality must:
o Establish mechanisms to get feedback from service users.
o Keep a record of such feedback.
o Measure and report on progress in addressing issues raised
by service users.
o Disseminate and display progress charts at service delivery
points.
Information Clear and visible outside and inside signage must be displayed at all
service delivery sites of the municipality.
With immediate effect officials must ensure that information desks at all
service sites are well stocked with posters/flyers/pamphlets.
Service users must be informed about the municipality’s service
standards and their rights prior to receiving services.
Access Officials at all service sites must ensure that telephone numbers of
services are visibly displayed and officials should strive to assist service
users telephonically.
The proximity of service sites to where service users live must be a
major consideration by the municipality.

PUBLIC SERVICE COMMISSION
CITIZENS TALK II: A CITIZEN SATISFACTION SURVEY REPORT Page 63
CHAPTER SEVEN: KEY FINDINGS: EMFULENI LOCAL MUNICIPALITY
7.1 INTRODUCTION
Chapter seven presents the key findings of the survey in relation to the services rendered by
the Emfuleni Local Municipality. A demographic profile of the service users that participated
in the study is presented first, followed by the key findings of the survey. The key findings
are presented according to the South African-specific drivers of citizen satisfaction model
described in Chapter Two of this report. In this regard, the service users’ ratings of
satisfaction with services of Emfuleni Local Municipality and the challenges experienced are
presented. The chapter concludes with a set of recommendations.
7.2 DEMOGRAPHIC PROFILE
A total of 366 respondents were surveyed at the Emfuleni Local Municipality in Gauteng
Province. Over half the survey (54%) respondents were female and 46% were male. Forty
one (41.4%) of the service users were aged between 35 and 49 years, s an equal proportion
(22.5%) of service users were in the 25-34 years and 50-64 years age categories,
respectively, while 7.7% were aged 16-24 and 6% were 56 years and above.
In terms of educational attainment, over two thirds, (37%) of services users had a Grade 12
education. This is followed by a fifth which had some secondary education (20.3%) and
those with a diploma (19.5%). Furthermore, 57.7% were in full time employment and a
further 7.1% working part time. The unemployment rate was low (13.4%).
7.3 KEY FINDINGS
The findings show that on average 49.8% of the service users were satisfied with the
services rendered by Emfuleni Local Municipality. Table 21 highlights service users’ level of
satisfaction with services and the proportion of satisfied users at Emfuleni Local Municipality
according to the key drivers of citizen satisfaction.
Table 21: Service users' level of satisfaction with services rendered by Emfuleni Local Municipality
Drivers of Citizen Satisfaction Satisfaction Rating
Fairness and equity 75.3%
Outcome 68%
Facilities 59.7%
Courtesy 57.1%
Access 52.8%
Value for money 52.4%
Knowledge and competence 50.3%

PUBLIC SERVICE COMMISSION
CITIZENS TALK II: A CITIZEN SATISFACTION SURVEY REPORT Page 64
Information 39.9%
Timeliness 34.2%
Redress 8.2%
Average rating across the 10 drivers 49.8%
Table 26 above shows that service users were most satisfied with fairness and equity
(75.3%) displayed by officials and least satisfied with the provision of comprehensive and
accurate information (39.9%) by officials, timeliness (34.2%) and redress (8.2%) in the
sampled services. This finding suggests that service users that participated in this survey
were not satisfied with the time it took to receive services and the redress mechanisms at
the service delivery sites of the municipality as well as the level of information provided by
officials.
7.4 ACCESS
7.4.1 Citizens’ level of satisfaction with accessibility to public services
Public Service institutions should provide citizens with equal access to the services to which
they are entitled10. In this regard the study sought to determine service users’ level of
satisfaction with regards to accessing the services rendered by Emfuleni Local Municipality.
To this end, four aspects relating to the accessibility of services were assessed by the
service users, namely, “accessibility of facility”, “convenience of operating hours”,
“disability/elderly access and the “ability to contact the service point telephonically”.
Figure 37: Rating the experience pertaining to accessibility to public services
Figure 37 above shows that 63.3% of the service users rated “convenience of operating
10
Republic of South Africa, Department of Public Service and Administration, Batho Pele Handbook: Service Improvement Guide. 2003.
10.7% 8.8%
21.2%
54.7%
4.7% 5.2%
10.1%
21.4%
61.4%
1.9% 2.8%
15.1%
31.4%
49.9%
0.8%
24.4%
18.3% 19.4%
37.1%
0.8%
Poor Below average Average Good Excellent
Accessibility of facility Convenience of operating hours
Disability/Elderly access Ability to access service point telephonically

PUBLIC SERVICE COMMISSION
CITIZENS TALK II: A CITIZEN SATISFACTION SURVEY REPORT Page 65
hours” good to excellent, 59.4% rated “accessibility of facility” good to excellent, 50.7% rated
disability/elderly access” good to excellent and 37.9% rated “ability to access service point
telephonically” good to excellent. The findings suggest that obtaining assistance through
phone is a challenge for the service users of the Emfuleni Local Municipality. Furthermore,
attention should be given to improving access to facilities by those with disabilities.
7.4.2 Challenges experienced by service users in relation to accessibility to public
services
Key challenges identified by the service users were:
Distance travelled to the service sites and the associated high transport costs
Telephones were not answered
Operating hours were limited, with early closure during week at some sites
Access for the elderly and disabled was a problem or not catered for
Service sites were closed on weekends
The telephone number provided was not known
7.5 COURTESY
7.5.1 Citizens’ level of satisfaction with courtesy displayed by officials
Public Service officials should treat citizens with courtesy and consideration, and should
always be polite towards them11. The study sought to establish service users’ level of
satisfaction with regard to the courtesy displayed by the officials of Emfuleni Local
Municipality.
11
Republic of South Africa. Department of Public Service and Administration. Batho Pele Handbook. Service Delivery Improvement Guide. 2003.

PUBLIC SERVICE COMMISSION
CITIZENS TALK II: A CITIZEN SATISFACTION SURVEY REPORT Page 66
Figure 38: Rating the experience pertaining to courtesy displayed by public officials in service delivery
Figure 38 above shows that 57.1% of the service users rated the courtesy displayed by
public officials as good to excellent. The findings show that there is a room for improvement
on the manner in which officials of the municipality treats service users.
7.5.2 Challenges experienced by service users in relation to courtesy displayed by
officials
The key challenge experienced by the service users was that some officials were perceived
as rude and unfriendly towards citizens.
7.6 TIMELINESS
7.6.1 Citizens’ level of satisfaction with timeliness in service delivery
Public services should be delivered swiftly, efficiently, within reasonable time and be
responsive to the client’s needs. To this end, the study sought to establish the service users’
level of satisfaction with timeliness during the delivery of the services of Emfuleni Local
Municipality.
13.1%
9.3%
20.5%
54.4%
2.7%
Poor Below average Average Good Excellent

PUBLIC SERVICE COMMISSION
CITIZENS TALK II: A CITIZEN SATISFACTION SURVEY REPORT Page 67
Figure 39: Rating the experience pertaining to timeliness in the delivery of public services
Figure 39 above shows that only 34.2% of the service users rated timelines good to
excellent, whereas 65.8% rated timeliness poor to average. It is of concern that four in ten
service users in Emfuleni Local Municipality rated their experience of timeliness as poor or
below average. This is an area that seems to need urgent attention.
7.6.2 Challenges experienced by service users in relation to timeliness in service
delivery
The key challenge identified by service users was the long waiting times and associated
queues. The problem was said to be worse especially at month end when there are many
service users on site. Few service users also complained about computers that were often
off line and the understaffing at service points.
7.7 INFORMATION
7.7.1 Citizens’ level of satisfaction with the provision of information in service
delivery
Comprehensive and accurate information should be provided to citizens on where and how
services can be accessed12. This includes information on the applicable requirements prior
to accessing services. In this regard, the study sought to establish the service users’ level of
satisfaction with their experience on the accuracy of information provided by the municipality.
To this end, four aspects relating to information were assessed by service users, namely,
12
Republic of South Africa. Department of Public Service and Administration. Batho Pele Handbook. Service Delivery Improvement Guide. 2003.
20.0% 22.5% 23.3%
33.4%
0.8%
Poor Below average Average Good Excellent

PUBLIC SERVICE COMMISSION
CITIZENS TALK II: A CITIZEN SATISFACTION SURVEY REPORT Page 68
“signage/information boards”, “information desk”, posters/flyers/ pamphlets and “information
on level of quality and service” provided.
Figure 40: Rating the experience pertaining to the provision of information in public services
Figure 40 above shows that 43.1% of the service users rated “signage/information boards”
good to excellent, 41.1% rated “convenience of operating hours” good to excellent, 39.6%
rated “information on level and quality of service” good to excellent and 35.8% rated
“posters/flyers/pamphlets” good to excellent. The finding shows that in general the provision
of information to the service users is a challenge.
7.7.2 Challenges experienced by service users in obtaining accurate information
Key challenges experienced by service users were:
There were no signage and information boards outside
There was no information desk
There were no posters, pamphlets, flyers, etc. on products and services provided.
7.8 KNOWLEDGE AND COMPETENCE
7.8.1 Citizens’ level of satisfaction with knowledge and competence of official
Competence is a standard requirement for an individual to perform a specific job, and it
23.6%
9.9%
23.4%
39.8%
3.3%
13.2% 12.4%
33.3%
39.4%
1.7%
19.0% 17.1%
28.1%
33.9%
1.9%
12.7%
17.1%
30.6%
36.6%
3.0%
Poor Below average Average Good Excellent
Signage/Information boards Information deskPosters/flyers/pamphlets Information on level and quality of service

PUBLIC SERVICE COMMISSION
CITIZENS TALK II: A CITIZEN SATISFACTION SURVEY REPORT Page 69
encompasses the knowledge utilised to improve performance. The study sought to
determine service users’ level of satisfaction with the knowledge and competence of officials
of Emfuleni Local Municipality. In this regard, four aspects relating to knowledge and
competence of officials were assessed by service users, namely, “officials’ knowledge about
services offered”, “officials’ ability to understand your requirements”, “officials’ ability to
accurately perform services”.
Figure 41: Rating the experience pertaining to the knowledge and competence of government officials
Figure 41 above shows that 56.1% rated “officials’ ability to understand requirements” good
to excellent, 48.5% rated “officials knowledge about services offered” good to excellent and
46.4% rated “officials’ ability to accurately perform services” good to excellent. In general,
the findings show that service users’ views on the knowledge and competence of officials
require attention.
7.8.2 Challenges pertaining to knowledge and competence of Staff
The key challenge identified by the service users was that officials did not seem to
understand service users’ needs
11.0% 13.4%
27.1%
46.0%
2.5%
9.3% 12.1%
22.5%
53.6%
2.5%
11.5% 12.9%
29.1%
44.2%
2.2%
Poor Below average Average Good Excellent
Officials’ knowledge about services offered Officials’ ability to understand your requirements
Officials’ ability to accurately perform services
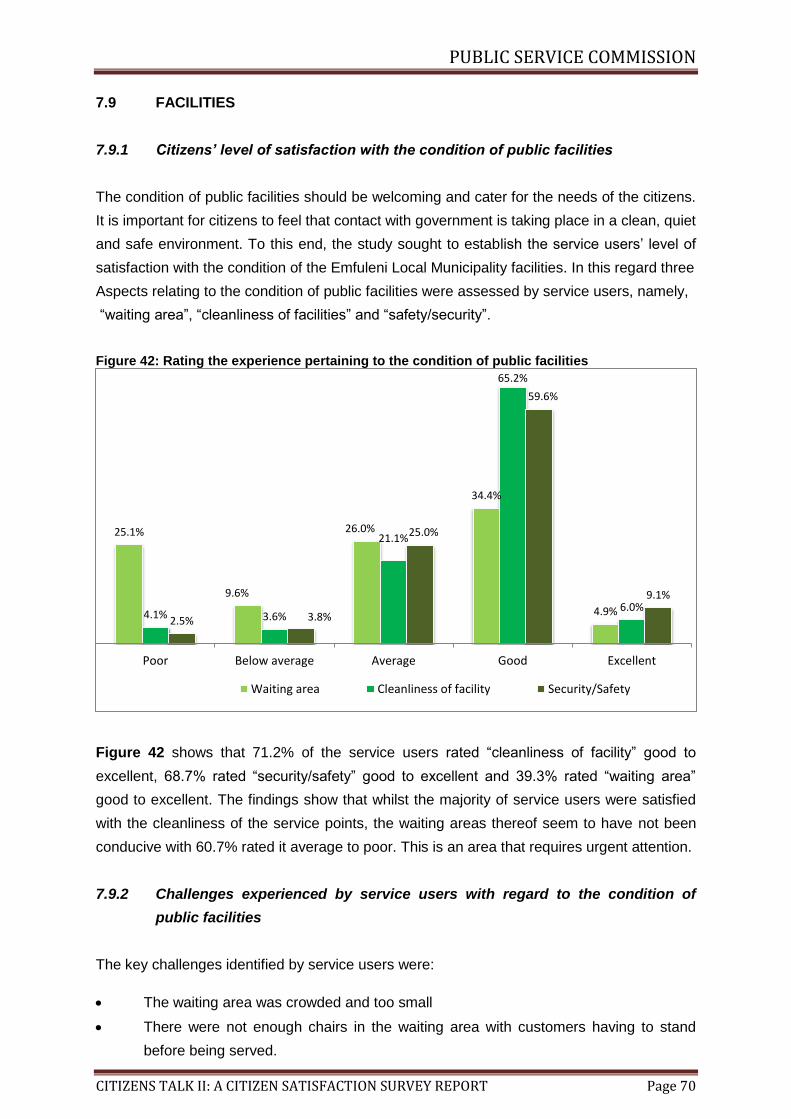
PUBLIC SERVICE COMMISSION
CITIZENS TALK II: A CITIZEN SATISFACTION SURVEY REPORT Page 70
7.9 FACILITIES
7.9.1 Citizens’ level of satisfaction with the condition of public facilities
The condition of public facilities should be welcoming and cater for the needs of the citizens.
It is important for citizens to feel that contact with government is taking place in a clean, quiet
and safe environment. To this end, the study sought to establish the service users’ level of
satisfaction with the condition of the Emfuleni Local Municipality facilities. In this regard three
Aspects relating to the condition of public facilities were assessed by service users, namely,
“waiting area”, “cleanliness of facilities” and “safety/security”.
Figure 42: Rating the experience pertaining to the condition of public facilities
Figure 42 shows that 71.2% of the service users rated “cleanliness of facility” good to
excellent, 68.7% rated “security/safety” good to excellent and 39.3% rated “waiting area”
good to excellent. The findings show that whilst the majority of service users were satisfied
with the cleanliness of the service points, the waiting areas thereof seem to have not been
conducive with 60.7% rated it average to poor. This is an area that requires urgent attention.
7.9.2 Challenges experienced by service users with regard to the condition of
public facilities
The key challenges identified by service users were:
The waiting area was crowded and too small
There were not enough chairs in the waiting area with customers having to stand
before being served.
25.1%
9.6%
26.0%
34.4%
4.9% 4.1% 3.6%
21.1%
65.2%
6.0% 2.5% 3.8%
25.0%
59.6%
9.1%
Poor Below average Average Good Excellent
Waiting area Cleanliness of facility Security/Safety
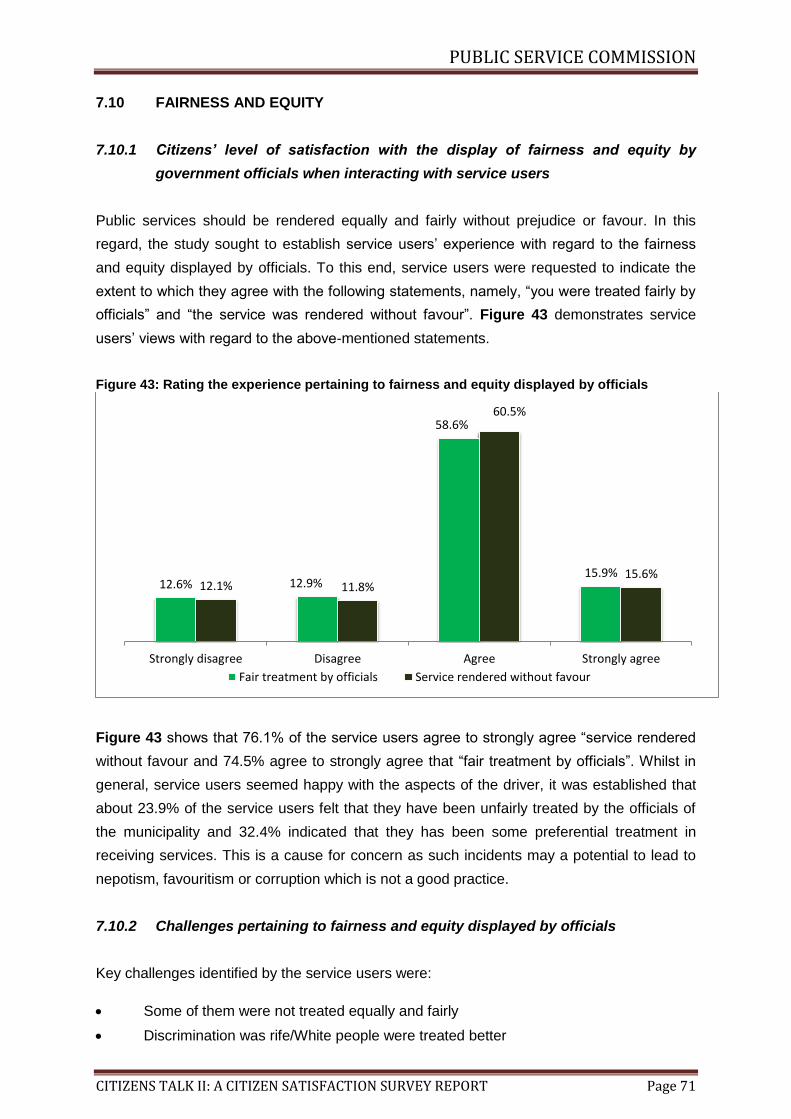
PUBLIC SERVICE COMMISSION
CITIZENS TALK II: A CITIZEN SATISFACTION SURVEY REPORT Page 71
7.10 FAIRNESS AND EQUITY
7.10.1 Citizens’ level of satisfaction with the display of fairness and equity by
government officials when interacting with service users
Public services should be rendered equally and fairly without prejudice or favour. In this
regard, the study sought to establish service users’ experience with regard to the fairness
and equity displayed by officials. To this end, service users were requested to indicate the
extent to which they agree with the following statements, namely, “you were treated fairly by
officials” and “the service was rendered without favour”. Figure 43 demonstrates service
users’ views with regard to the above-mentioned statements.
Figure 43: Rating the experience pertaining to fairness and equity displayed by officials
Figure 43 shows that 76.1% of the service users agree to strongly agree “service rendered
without favour and 74.5% agree to strongly agree that “fair treatment by officials”. Whilst in
general, service users seemed happy with the aspects of the driver, it was established that
about 23.9% of the service users felt that they have been unfairly treated by the officials of
the municipality and 32.4% indicated that they has been some preferential treatment in
receiving services. This is a cause for concern as such incidents may a potential to lead to
nepotism, favouritism or corruption which is not a good practice.
7.10.2 Challenges pertaining to fairness and equity displayed by officials
Key challenges identified by the service users were:
Some of them were not treated equally and fairly
Discrimination was rife/White people were treated better
12.6% 12.9%
58.6%
15.9% 12.1% 11.8%
60.5%
15.6%
Strongly disagree Disagree Agree Strongly agree
Fair treatment by officials Service rendered without favour
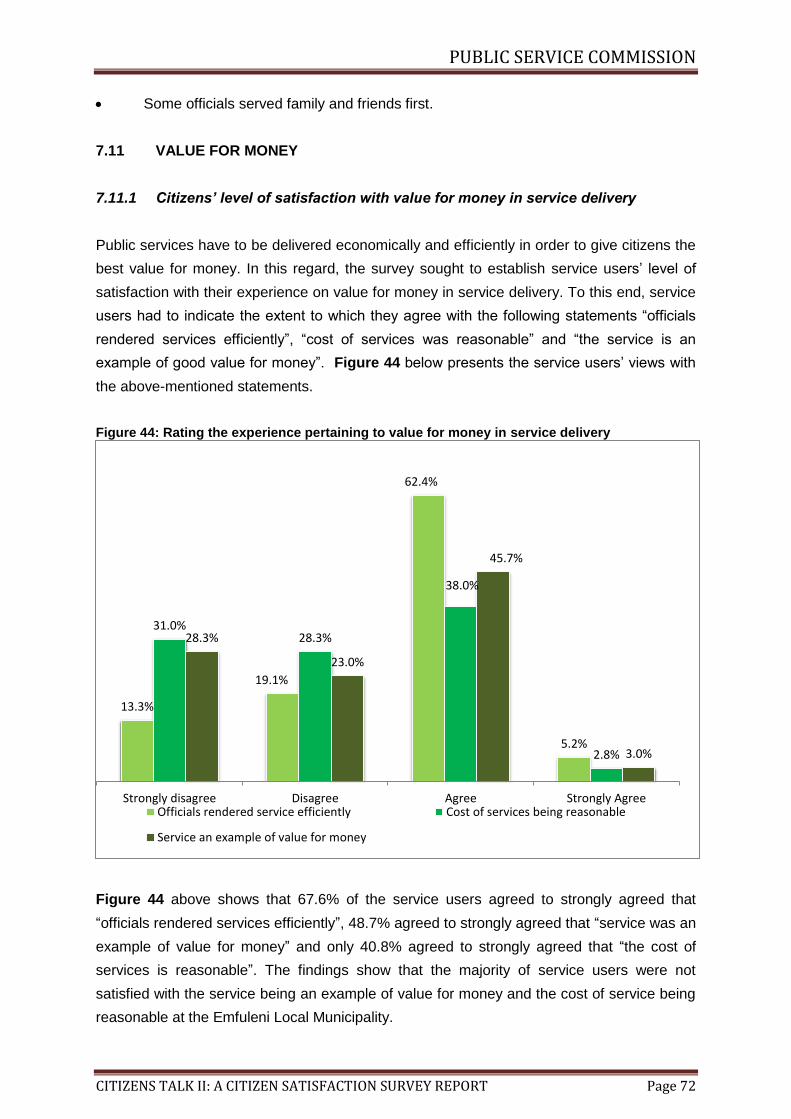
PUBLIC SERVICE COMMISSION
CITIZENS TALK II: A CITIZEN SATISFACTION SURVEY REPORT Page 72
Some officials served family and friends first.
7.11 VALUE FOR MONEY
7.11.1 Citizens’ level of satisfaction with value for money in service delivery
Public services have to be delivered economically and efficiently in order to give citizens the
best value for money. In this regard, the survey sought to establish service users’ level of
satisfaction with their experience on value for money in service delivery. To this end, service
users had to indicate the extent to which they agree with the following statements “officials
rendered services efficiently”, “cost of services was reasonable” and “the service is an
example of good value for money”. Figure 44 below presents the service users’ views with
the above-mentioned statements.
Figure 44: Rating the experience pertaining to value for money in service delivery
Figure 44 above shows that 67.6% of the service users agreed to strongly agreed that
“officials rendered services efficiently”, 48.7% agreed to strongly agreed that “service was an
example of value for money” and only 40.8% agreed to strongly agreed that “the cost of
services is reasonable”. The findings show that the majority of service users were not
satisfied with the service being an example of value for money and the cost of service being
reasonable at the Emfuleni Local Municipality.
13.3%
19.1%
62.4%
5.2%
31.0% 28.3%
38.0%
2.8%
28.3%
23.0%
45.7%
3.0%
Strongly disagree Disagree Agree Strongly AgreeOfficials rendered service efficiently Cost of services being reasonable
Service an example of value for money

PUBLIC SERVICE COMMISSION
CITIZENS TALK II: A CITIZEN SATISFACTION SURVEY REPORT Page 73
7.11.2 Challenges pertaining to fairness and equity displayed by officials
Key challenges identified by service users were:
Services were unaffordable and most people were unemployed
Services were poorly rendered
Meters were not read and amounts due were based on estimations.
7.12 REDRESS
7.12.1 Citizens’ level of satisfaction with the provision of redress in service delivery
Redress implies that if the promised standard of service is not delivered, citizens should be
offered an apology, a full explanation and a speedy and effective remedy. Service users
were asked to indicate if they have ever experienced any problems with hospital services in
the past.
The findings show that half (50%) of users interviewed reported that they had experienced
problems with the products or services of Emfuleni Local Municipality.
Figure 45: Have you ever experienced problems with the products or services?
Figure 45 shows that half the services users in Emfuleni had experienced problems with
services and products while the other half had not. Problems experienced were:
Wrong meter readings
Meter readings were based on estimations
Statements were sent to wrong address
Yes 50%
No 50%

PUBLIC SERVICE COMMISSION
CITIZENS TALK II: A CITIZEN SATISFACTION SURVEY REPORT Page 74
Customers did not receive statements.
Furthermore, service users were asked about the frequency of experiencing problems.
Figure 46 presents the results thereof.
Figure 46: How often have you experienced problems with the service?
Among those who reported having experienced problems with services and products, 67.9%
of the service users reported having experienced these often or very often. Further analysis
of the service users that had experienced problems with products and services indicates that
the majority (86%) lodged a formal complaint. Similar to Nelson Mandela Bay complainants,
nine out of ten times, the complaint was lodged verbally (95.5%). Service users were asked
about their satisfaction rating with how their complaints were dealt with and the results are
shown below.
32%
43.6%
24.3%
Seldom Often Very often

PUBLIC SERVICE COMMISSION
CITIZENS TALK II: A CITIZEN SATISFACTION SURVEY REPORT Page 75
Figure 47: Rating the satisfaction with how problem was resolved
Figure 47 above shows that nine in ten of services users (91.9%) were not satisfied with the
manner in which problems are resolved and only 8.2% were satisfied with the resolution of
their problems. Service users who did not lodge a complaint provided the following as
reasons thereof.
Table 22: Reason for not lodging a complaint, Emfuleni
Reason for not lodging a complaint Percentage
It was not worthwhile 81%
Did not know where to lodge a complaint 16%
Afraid of staff or wanted to avoid trouble 3%
7.12.2 Challenges experienced by service users with the provision of redress
Key challenges identified by service users were:
It took too long for problems to be resolved
Problems were on-going even after several complaints
No explanation on how problem will be solved given or there was no valid
explanation.
7.13 OUTCOME
7.13.1 Citizens’ level of satisfaction with obtaining outcome in service delivery
Government departments should ensure that the products/services that citizens visit their
service delivery point to obtain are available and provided to them within reasonable time. In
this regard, the study sought to establish service users’ level of satisfaction with the receipt
32.6%
38.4%
20.9%
7.0%
1.2%
Poor Below Average Average Good Excellent
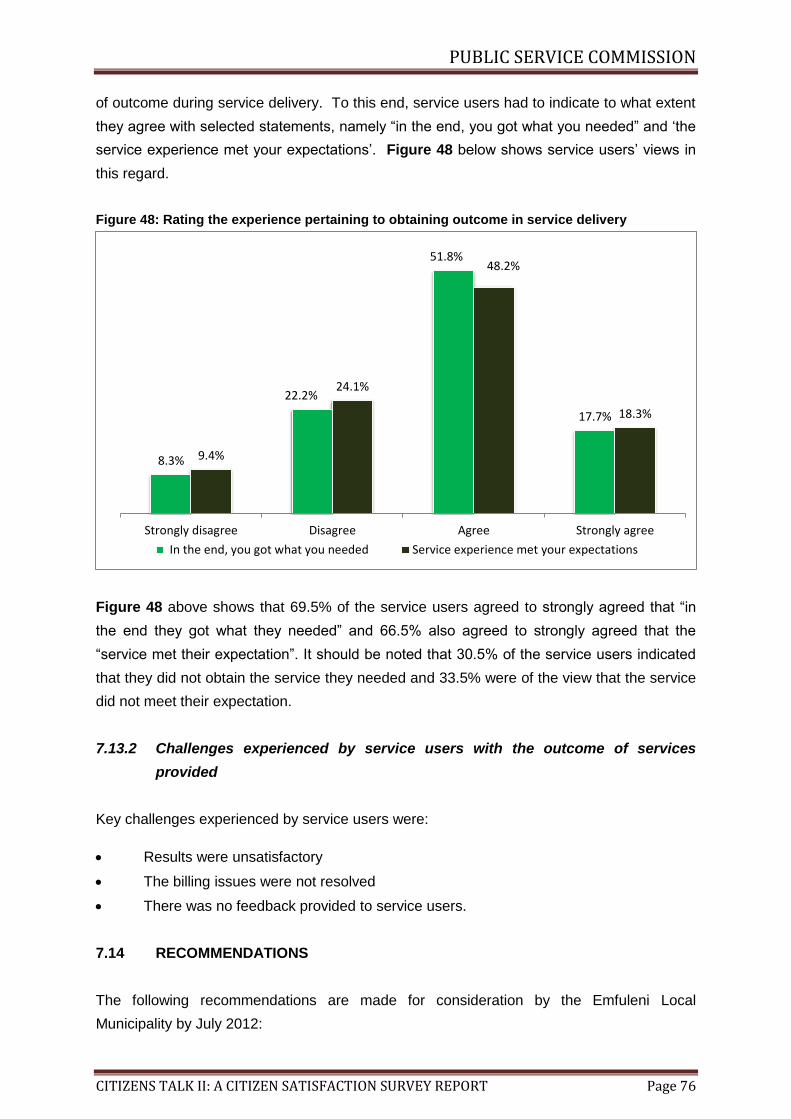
PUBLIC SERVICE COMMISSION
CITIZENS TALK II: A CITIZEN SATISFACTION SURVEY REPORT Page 76
of outcome during service delivery. To this end, service users had to indicate to what extent
they agree with selected statements, namely “in the end, you got what you needed” and ‘the
service experience met your expectations’. Figure 48 below shows service users’ views in
this regard.
Figure 48: Rating the experience pertaining to obtaining outcome in service delivery
Figure 48 above shows that 69.5% of the service users agreed to strongly agreed that “in
the end they got what they needed” and 66.5% also agreed to strongly agreed that the
“service met their expectation”. It should be noted that 30.5% of the service users indicated
that they did not obtain the service they needed and 33.5% were of the view that the service
did not meet their expectation.
7.13.2 Challenges experienced by service users with the outcome of services
provided
Key challenges experienced by service users were:
Results were unsatisfactory
The billing issues were not resolved
There was no feedback provided to service users.
7.14 RECOMMENDATIONS
The following recommendations are made for consideration by the Emfuleni Local
Municipality by July 2012:
8.3%
22.2%
51.8%
17.7%
9.4%
24.1%
48.2%
18.3%
Strongly disagree Disagree Agree Strongly agree
In the end, you got what you needed Service experience met your expectations
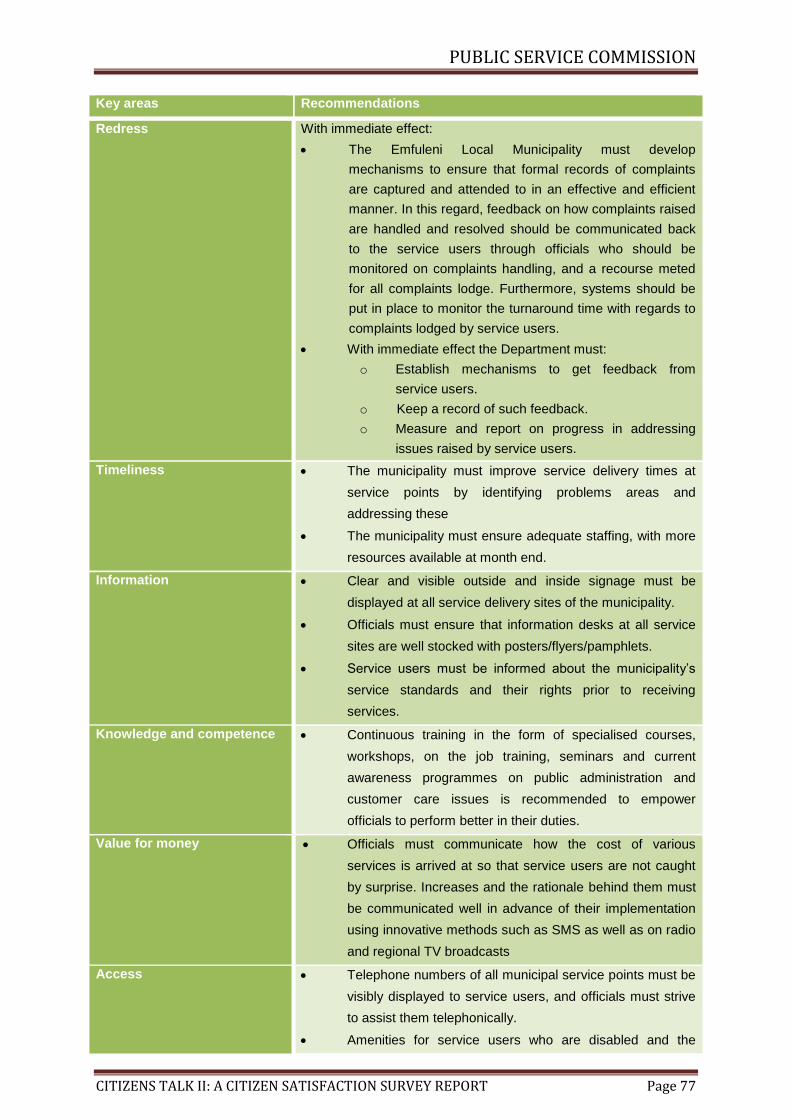
PUBLIC SERVICE COMMISSION
CITIZENS TALK II: A CITIZEN SATISFACTION SURVEY REPORT Page 77
Key areas Recommendations
Redress With immediate effect:
The Emfuleni Local Municipality must develop
mechanisms to ensure that formal records of complaints
are captured and attended to in an effective and efficient
manner. In this regard, feedback on how complaints raised
are handled and resolved should be communicated back
to the service users through officials who should be
monitored on complaints handling, and a recourse meted
for all complaints lodge. Furthermore, systems should be
put in place to monitor the turnaround time with regards to
complaints lodged by service users.
With immediate effect the Department must:
o Establish mechanisms to get feedback from
service users.
o Keep a record of such feedback.
o Measure and report on progress in addressing
issues raised by service users.
Timeliness The municipality must improve service delivery times at
service points by identifying problems areas and
addressing these
The municipality must ensure adequate staffing, with more
resources available at month end.
Information Clear and visible outside and inside signage must be
displayed at all service delivery sites of the municipality.
Officials must ensure that information desks at all service
sites are well stocked with posters/flyers/pamphlets.
Service users must be informed about the municipality’s
service standards and their rights prior to receiving
services.
Knowledge and competence Continuous training in the form of specialised courses,
workshops, on the job training, seminars and current
awareness programmes on public administration and
customer care issues is recommended to empower
officials to perform better in their duties.
Value for money Officials must communicate how the cost of various
services is arrived at so that service users are not caught
by surprise. Increases and the rationale behind them must
be communicated well in advance of their implementation
using innovative methods such as SMS as well as on radio
and regional TV broadcasts
Access Telephone numbers of all municipal service points must be
visibly displayed to service users, and officials must strive
to assist them telephonically.
Amenities for service users who are disabled and the
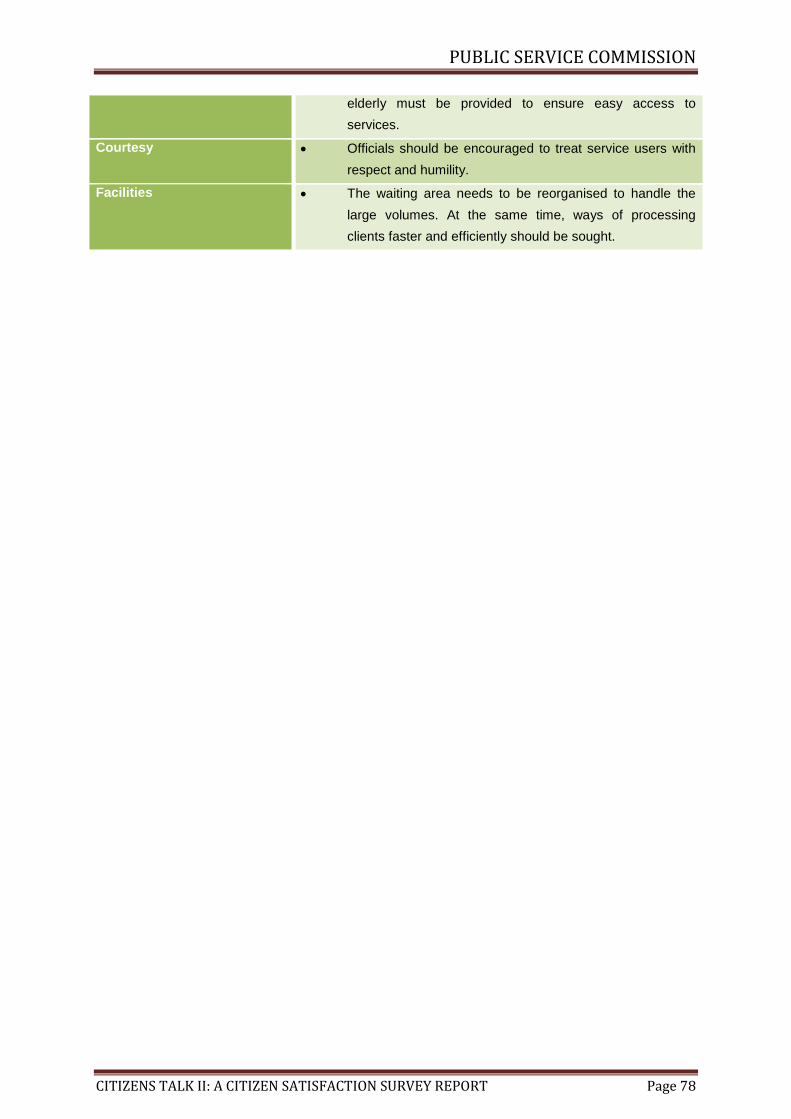
PUBLIC SERVICE COMMISSION
CITIZENS TALK II: A CITIZEN SATISFACTION SURVEY REPORT Page 78
elderly must be provided to ensure easy access to
services.
Courtesy Officials should be encouraged to treat service users with
respect and humility.
Facilities The waiting area needs to be reorganised to handle the
large volumes. At the same time, ways of processing
clients faster and efficiently should be sought.

PUBLIC SERVICE COMMISSION
CITIZENS TALK II: A CITIZEN SATISFACTION SURVEY REPORT Page 79
CHAPTER EIGHT: KEY FINDINGS: MADIBENG LOCALMUNICIPALITY
8.1 INTRODUCTION
Chapter Eight presents the key findings of the survey in relation to the services rendered by
the Madibeng Local Municipality. A demographic profile of the service users that participated
in the study is presented first, followed by the key findings of the survey. The key findings
are presented according to the South African-specific drivers of citizen satisfaction model
described in Chapter Two of this report. In this regard, the service users’ ratings of
satisfaction with services of the Madibeng Local Municipality and the challenges experienced
are presented. The chapter concludes with a set of recommendations.
8.2 DEMOGRAPHIC PROFILE
A total of 153 service users were interviewed at the Madibeng Local Municipality in the North
West Province. The majority of the service users (52%) were male and 48% were female.
Over a third (37.3%) of service users were aged between 35 and 49 years, 32.7% were
between 25-34 years, 19% were between 50-64 years, 9.8% were between 16-24 years and
1.3% were 65 years and above.
The highest proportion of services users (38.6%) had a matric or Grade 12 education, with
24.5% in possession of a diploma and 19.6% had attained some secondary education. The
proportions of service users without any schooling in Madibeng Local Municipality was lower
(2%), whilst those with a degree were 6.5%. Furthermore, only four in ten (43.8%) service
users were in full time employment followed by 9.8% who work part time. Scholars who
participated in the study were 8.5%. In addition, two in ten service users (21.6%) were
unemployed.
8.3 KEY FINDINGS
The findings of the survey show that on average 56.5% of the service users were satisfied
with the services rendered by Madibeng Local Municipality. Table 23 highlights service
users’ level of satisfaction with services rendered by Madibeng Local Municipality according
to the key drivers of citizen satisfaction.

PUBLIC SERVICE COMMISSION
CITIZENS TALK II: A CITIZEN SATISFACTION SURVEY REPORT Page 80
Table 23: Service users' level of satisfaction with services rendered by Madibeng Local Municipality
Drivers of Citizen Satisfaction Satisfaction Rating
Fairness and equity 90.9%
Outcome 81.8%
Value for money 76%
Courtesy 68.6%
Knowledge and competence 61.7%
Timeliness 55.6%
Access 48.4%
Facilities 35.9%
Information 27.5%
Redress 18.5%
Average rating across the 10 drivers 56.5%
Table 23 above shows that service users were most satisfied with fairness and equity
(90.9%) displayed by officials and least satisfied with access (48.4%) to service, the
provision of comprehensive and accurate information 27.5%) by the officials and redress
mechanisms (18.5%). This finding suggest that service users that participated in this survey
were not satisfied with level of information provided by officials as well as the redress
mechanisms at the sampled service delivery sites of the municipality.
8.4 ACCESS
8.4.1 Citizens’ level of satisfaction with accessibility to public services
Public Service institutions should provide citizens with equal access to the services to which
they are entitled13. In this regard the study sought to determine service users’ level of
satisfaction with regards to accessing the services rendered by Madibeng Local Municipality.
To this end, four aspects relating to the accessibility of services were assessed by the
service users, namely, “accessibility of facility”, “convenience of operating hours”,
“disability/elderly access and the “ability to contact the service point telephonically”.
13
Republic of South Africa, Department of Public Service and Administration, Batho Pele Handbook: Service Improvement Guide. 2003.

PUBLIC SERVICE COMMISSION
CITIZENS TALK II: A CITIZEN SATISFACTION SURVEY REPORT Page 81
Figure 49: Rating the experience pertaining to accessibility to public services
Figure 49 above shows that 61% of the service users rated “disability/elderly access” good
to excellent, 60.7% rated “accessibility of facility” good to excellent, 51.6% rated
“convenience of operating hours” good to excellent and only 20.4% rated “ability to access
service point by phone” good/excellent. The findings suggest that obtaining services through
a phone is a challenge for the majority of the service users.
8.4.2 Challenges experienced by service users in relation to accessibility to public
services
Key challenges identified by service users were:
Distance travelled was long
Telephones were not answered
Operating hours were limited with early closure during week
Telephone numbers were not known.
8.5 COURTESY
8.5.1 Citizens’ level of satisfaction with courtesy displayed by officials
Public Service officials should treat citizens with courtesy and consideration, and should
9.8%
29.4%
54.2%
6.5%
1.3%
9.2%
37.9%
49.0%
2.6% 1.6% 3.7%
33.7%
60.5%
0.5%
15.50% 16.20%
47.90%
20.40%
Poor Below average Average Good Excellent
Accessibility of facility Convenience of operating hours
Disability/Elderly access Ability to access service point by phone

PUBLIC SERVICE COMMISSION
CITIZENS TALK II: A CITIZEN SATISFACTION SURVEY REPORT Page 82
always be polite towards them14. The study sought to establish service users’ level of
satisfaction with regard to the courtesy displayed by the officials of Madibeng Local
Municipality.
Figure 50: Rating the experience pertaining to courtesy displayed by public officials in service delivery
Figure 50 above shows that 68.6% of the service users rated courtesy displayed by officials
good to excellent. Although the findings show that the majority were treated with courtesy, it
of worrying that 31.4% of the service users were not satisfied with the manner in which they
were treated by the officials of the municipality.
8.5.2 Challenges experienced by service users in relation to the officials’ display of
courtesy
A key challenge identified by service users was that some officials were polite while others
remain rude and unfriendly
8.6 TIMELINESS
8.6.1 Citizens’ level of satisfaction with timeliness in service delivery
Public services should be delivered swiftly, efficiently, within reasonable time and be
responsive to the client’s needs. To this end, the study sought to establish the service users’
14
Republic of South Africa. Department of Public Service and Administration. Batho Pele Handbook. Service Delivery Improvement Guide. 2003.
2.0% 2.6%
26.8%
62.1%
6.5%
Poor Below average Average Good Excellent

PUBLIC SERVICE COMMISSION
CITIZENS TALK II: A CITIZEN SATISFACTION SURVEY REPORT Page 83
level of satisfaction with timeliness during the delivery of the services of Madibeng Local
Municipality.
Figure 51: Rating the experience pertaining to timeliness in the delivery of public services
Figure 51 above shows that 55.6% rated timeliness good to excellent. The finding shows
that 44.5% of the service users did not support the view that services were rendered
timeously by the officials of the municipality.
8.6.2 Challenges experienced by service users in relation to timeliness in service
delivery
Key challenges identified by service users were:
Queues were long
Service delivery was slow, especially month end when there are lots of people
Waiting time was long.
8.7 INFORMATION
8.7.1 Citizens’ level of satisfaction with the provision of information in service
delivery
Comprehensive and accurate information should be provided to citizens on where and how
services can be accessed15. This includes information on the applicable requirements prior
15
Republic of South Africa. Department of Public Service and Administration. Batho Pele Handbook. Service Delivery Improvement Guide. 2003.
9.2% 7.2%
28.1%
48.4%
7.2%
Poor Below average Average Good Excellent

PUBLIC SERVICE COMMISSION
CITIZENS TALK II: A CITIZEN SATISFACTION SURVEY REPORT Page 84
to accessing services. In this regard, the study sought to establish the service users’ level of
satisfaction with their experience on the accuracy of information provided by the municipality.
To this end, six aspects relating to information were assessed by service users, namely,
“signage/information boards”, “information desk”, posters/flyers/ pamphlets and “information
on level of quality and service” and “information about one’s rights” with regards to the
services provided.
Figure 52: Rating the experience pertaining to the provision of information in public service
Figure 52 shows that 36.6% of the service users rated “information desk” good to excellent,
26.8% rated “signage/information boards” good to excellent, 25% rated “information on level
and quality of service” good to excellent and 21% rated “posters/flyers/pamphlets” good to
excellent. The findings show that in general, the provision of information to service users
was a challenge. As a result this driver requires urgent attention.
8.7.2 Challenges experienced by service users in obtaining accurate information
Key challenges identified by the service users were:
There were no posters, pamphlets, flyers, etc.
The information boards were old and not legible
There was no information desk
16.3%
19.0%
37.9%
24.8%
2.0%
22.9% 21.6%
19.0%
33.3%
3.3%
24.8%
30.1%
24.2%
20.3%
0.7%
28.3%
25.7%
21.1%
23.7%
1.3%
Poor Below average Average Good Excellent
Signage/Information boards Information desk
Posters/flyers/pamphlets Information on level and quality of service

PUBLIC SERVICE COMMISSION
CITIZENS TALK II: A CITIZEN SATISFACTION SURVEY REPORT Page 85
There were no signs and information boards outside.
8.8 KNOWLEDGE AND COMPETENCE
8.8.1 Citizens’ level of satisfaction with knowledge and competence of official
Competence is a standard requirement for an individual to perform a specific job, and it
encompasses the knowledge utilised to improve performance. The study sought to
determine service users’ level of satisfaction with the knowledge and competence of officials
of Madibeng Local Municipality. In this regard, four aspects relating to knowledge and
competence of officials were assessed by service users, namely, “officials’ knowledge about
services offered”, “officials’ ability to understand your requirements”, “officials’ ability to
accurately perform services” and “service users’ overall experience with regard to knowledge
and competence of officials”.
Figure 53: Rating the experience pertaining to the knowledge and competence of government officials
Figure 53 above shows that 66% of the service users rated “officials’ knowledge about
services offered” good to excellent, 59.8% rated “officials’ ability to accurately perform
services”, 59.2% rated “officials’ ability to understand requirements” good to excellent.
1.3% 2.0%
30.7%
61.4%
4.6% 1.3%
3.9%
35.5%
50.0%
9.2%
3.9% 5.9%
30.3%
52.6%
7.2%
Poor Below average Average Good Excellent
Officials’ knowledge about services offered Officials’ ability to understand your requirements
Officials’ ability to accurately perform services

PUBLIC SERVICE COMMISSION
CITIZENS TALK II: A CITIZEN SATISFACTION SURVEY REPORT Page 86
8.8.2 Challenges pertaining to knowledge and competence of Staff
Key challenges identified by service users was that whilst some officials understood the
client’s requirements and needs but some did not.
8.9 FACILITIES
8.9.1 Citizens’ level of satisfaction with the condition of public facilities
The condition of public facilities should be welcoming and cater for the needs of the citizens.
It is important for citizens to feel that contact with government is taking place in a clean, quiet
and safe environment. To this end, the study sought to establish the service users’ level of
satisfaction with the condition of Madibeng Local Municipality’s facilities. In this regard three
aspects relating to the condition of public facilities were assessed by service users, namely,
“waiting area”, “cleanliness of facilities” and “safety/security”.
Figure 54: Rating the experience pertaining to the condition of public facilities
Figure 54 above shows that about half of service users (49%) rated “security/safety” good to
excellent, a third (32.7%) rated “waiting area” good and only just over a quarter (26.1%)
rated “cleanliness of facility” good. In general, the findings show that the conditions under
which the Madibeng Local Municipality renders services are deemed unsuitable by the
majority of the service users. The finding applies to all aspects of the driver with cleanliness
rated the worst by many service users.
2.0%
11.1%
54.2%
32.7%
6.5%
15.0%
52.3%
26.1%
0.7%
5.2%
45.1% 43.1%
5.9%
Poor Below average Average Good Excellent
Waiting area Cleanliness of facility Security/Safety

PUBLIC SERVICE COMMISSION
CITIZENS TALK II: A CITIZEN SATISFACTION SURVEY REPORT Page 87
8.9.2 Challenges experienced by service users with regard to the condition of
public facilities
Key challenges identified by service users were:
There were not enough chairs in the waiting area and service users have to stand
before being served
Security was inadequate
Toilets were dirty.
8.10 FAIRNESS AND EQUITY
8.10.1 Citizens’ level of satisfaction with the display of fairness and equity by
government officials when interacting with service users
Public services should be rendered equally and fairly without prejudice or favour. In this
regard, the study sought to establish service users’ experience with regard to the fairness
and equity displayed by officials. To this end, service users were requested to indicate the
extent to which they agree with the following statements, namely, “you were treated fairly by
officials” and “the service was rendered without favour”. Figure 55 below reflects service
users’ views with regard to the above-mentioned statements.
Figure 55: Rating the experience pertaining to fairness and equity displayed by officials
Figure 55 shows that 92.2% agree to strongly agree “treated fairly by officials, 89.5% agree
to strongly agree “service was rendered without favour”. Whilst in general, service users
seemed happy with the aspects of the driver, it was established that about 8.1% of the
0.7% 7.2%
83.6%
8.6%
0.7%
9.9%
80.3%
9.2%
Strongly disagree Disagree Agree Strongly agree
Fair treatment by officials Service rendered without favour

PUBLIC SERVICE COMMISSION
CITIZENS TALK II: A CITIZEN SATISFACTION SURVEY REPORT Page 88
service users felt that they have been unfairly treated by the officials of the municipality and
10.1% indicated that there has been some preferential treatment in receiving services. This
is a cause for concern as such incidents may a potential to lead to nepotism, favouritism or
corruption which is not a good practice.
8.10.2 Challenges pertaining to fairness and equity displayed by officials
A key challenge identified by service users was that discrimination is rife with service users
indicating that white people are treated better
8.11 VALUE FOR MONEY
8.11.1 Citizens’ level of satisfaction with value for money in service delivery
Public services have to be delivered economically and efficiently in order to give citizens the
best value for money. In this regard, the survey sought to establish service users’ level of
satisfaction with their experience on value for money in service delivery. To this end, service
users had to indicate the extent to which they agree with the following statements “officials
rendered services efficiently”, “cost of services was reasonable” and “the service is an
example of good value for money”. Figure 56 presents the service users’ views with the
above-mentioned statements.
Figure 56: Rating the experience pertaining to value for money in service delivery
Figure 56 above shows that 76.2% of the service users agreed or strongly agreed that
3.5%
20.3%
74.8%
1.4%
7.0%
17.5%
72.7%
2.8% 7.0%
16.8%
73.4%
2.8%
Strongly disagree Disagree Agree Strongly Agree
Officials rendered service efficiently Cost of services being reasonable Service an example of value for money

PUBLIC SERVICE COMMISSION
CITIZENS TALK II: A CITIZEN SATISFACTION SURVEY REPORT Page 89
“officials render services efficiently” and that the services offered being “an example of
value for money”, respectively, while 75.5% found the found the cost of services reasonable.
8.11.2 Challenges pertaining to obtaining value for money
Key challenges identified by the service users were:
Services were unaffordable and most people are unemployed
Services were poorly rendered.
8.12 REDRESS
8.12.1 Citizens’ level of satisfaction with the provision of redress in service delivery
Redress implies that if the promised standard of service is not delivered, citizens should be
offered an apology, a full explanation and a speedy and effective remedy. Service users
were asked to indicate if they have ever experienced any problems with hospital services in
the past.
The findings show that a third of service users (37.5%) interviewed at Madibeng Local
Municipality had experienced problems with the products or services of the municipality.
Figure 57: Have you ever experienced problems with the products or service?
Types of problems experienced by service users relate to:
Service interruption was long during maintenance
Wrong meter readings and estimation thereof
Yes 37.50%
No 62.50%

PUBLIC SERVICE COMMISSION
CITIZENS TALK II: A CITIZEN SATISFACTION SURVEY REPORT Page 90
Frequent water leakages.
Service users were further asked how often they experienced these problems. Figure 58
below demonstrates service users’ frequency of experiencing problems.
Figure 58: How often have you experienced problems with the service?
Figure 58 shows that over half (56.1%) of service users often experienced problems. On the
positive side, the number of service users who had experienced problems very often is less
than one in ten (8.8%), with nearly a third (32%) saying problems are seldom experienced.
The municipality should be commended for the low percentage of service users that has
experienced problems very often. This may suggest an effective way of dealing with
problems, something which other institutions can learn from.
Furthermore, the findings show that of those who had experienced problems with products
and services of the municipality, just under half (47.4%) managed to lodge a formal
complaint. Of the services users who had lodged a complaint, a majority (96.1%) did so
verbally, a trend similar to other municipalities. Only one person out of the entire group put
their complaint in writing. Service users were asked about their satisfaction rating with how
the problems were resolved. Figure 59 below is an illustration of service users’ satisfaction
with the resolution of their problems.
35.1%
56.1%
8.8%
Seldom Often Very often

PUBLIC SERVICE COMMISSION
CITIZENS TALK II: A CITIZEN SATISFACTION SURVEY REPORT Page 91
Figure 59: Rating the satisfaction with how problem was resolved
The findings show that 81.4% of service users who had lodged a complaint were least
satisfied with how their problem was resolved. Consequently, they rated problem resolution
average to poor. While this rate is still better than what was recorded in Mangaung (75.2%),
there is still reason for concern with how the municipality has handled complaints. Those
who did not lodge complaints offered the following reasons for not lodging complaints:
Table 24: Reason for not lodging a complaint – Madibeng
Reason for not lodging complaint Percentage
Felt it was not worthwhile 73.5%
Did not know where to lodge a complaint 26.5%
8.12.2 Challenges experienced by service users with the provision of redress
Key challenges identified by service users were:
Problems were on-going even after several complaints
There was no explanation of how problem will be solved or there is no valid
explanation provided
No feedback provided on how problems were being handled
It took too long for problems to be resolved.
8.13 OUTCOME
8.13.1 Citizens’ level of satisfaction with obtaining outcome in service delivery
Government institutions should ensure that the products/services that citizens visit their
33.3%
29.6%
18.5%
14.8%
3.7%
Poor Below Average Average Good Excellent
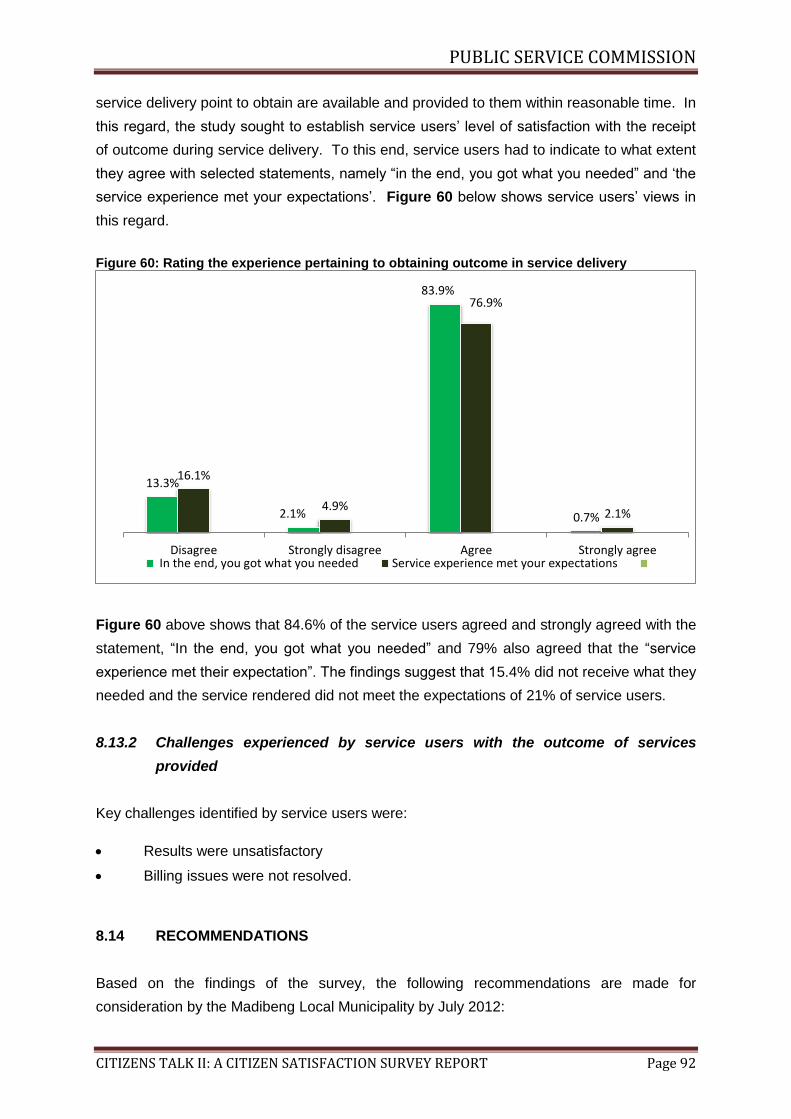
PUBLIC SERVICE COMMISSION
CITIZENS TALK II: A CITIZEN SATISFACTION SURVEY REPORT Page 92
service delivery point to obtain are available and provided to them within reasonable time. In
this regard, the study sought to establish service users’ level of satisfaction with the receipt
of outcome during service delivery. To this end, service users had to indicate to what extent
they agree with selected statements, namely “in the end, you got what you needed” and ‘the
service experience met your expectations’. Figure 60 below shows service users’ views in
this regard.
Figure 60: Rating the experience pertaining to obtaining outcome in service delivery
Figure 60 above shows that 84.6% of the service users agreed and strongly agreed with the
statement, “In the end, you got what you needed” and 79% also agreed that the “service
experience met their expectation”. The findings suggest that 15.4% did not receive what they
needed and the service rendered did not meet the expectations of 21% of service users.
8.13.2 Challenges experienced by service users with the outcome of services
provided
Key challenges identified by service users were:
Results were unsatisfactory
Billing issues were not resolved.
8.14 RECOMMENDATIONS
Based on the findings of the survey, the following recommendations are made for
consideration by the Madibeng Local Municipality by July 2012:
13.3%
2.1%
83.9%
0.7%
16.1%
4.9%
76.9%
2.1%
Disagree Strongly disagree Agree Strongly agree In the end, you got what you needed Service experience met your expectations

PUBLIC SERVICE COMMISSION
CITIZENS TALK II: A CITIZEN SATISFACTION SURVEY REPORT Page 93
Key Areas Recommendations
Redress With immediate effect:
The Madibeng Local Municipality must develop mechanisms
to ensure that formal records of complaints are captured
and attended to in an effective and efficient manner. In this
regard, feedback on how complaints raised are handled and
resolved should be communicated back to the service users
through officials who should be monitored on complaints
handling, and a recourse meted for all complaints lodge.
Furthermore, systems should be put in place to monitor the
turnaround time with regards to complaints lodged by
service users.
With immediate effect the Municipality must:
o Establish mechanisms to get feedback from
service users.
o Keep a record of such feedback.
o Measure and report on progress in addressing
issues raised by service users.
Information With immediate effect outside and inside signage must be
improved so that service users are aware of the kind of
services offered and during which periods (opening and
closing times).
The level and standard of service must be specified so that
service users have some standard against which the
performance of officials can be measured. This assessment
can also serve as a proxy for service delivery standards and
performance.
Officials must ensure that information desks at all service
sites are well stocked with posters/flyers/pamphlets.
Service users must be informed about interruption of
services (water and electricity) so that they can plan
accordingly.
Facilities Officials must ensure that the waiting areas in all service
points are kept clean inside and outside with cleaners
working overnight or starting earlier than the offices open.
Outside maintenance also requires attention.
Attention must be paid to the level of security at all service
delivery points.
Accessibility Telephone access must be improved. This would reduce
the numbers at service points as some queries get
addressed through this channel.
Timeliness Consider additional resources at month end for service
points to cope with demand. Alternatively, increased
working hours, publicised well in advance could deal with
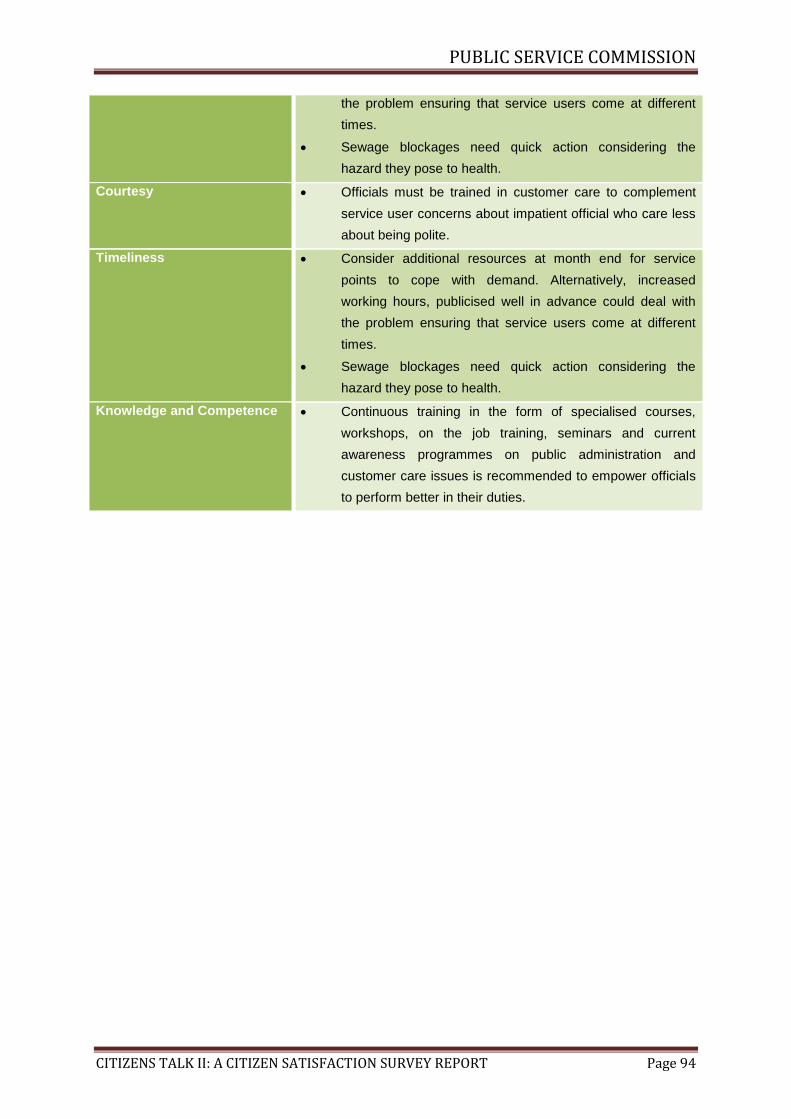
PUBLIC SERVICE COMMISSION
CITIZENS TALK II: A CITIZEN SATISFACTION SURVEY REPORT Page 94
the problem ensuring that service users come at different
times.
Sewage blockages need quick action considering the
hazard they pose to health.
Courtesy Officials must be trained in customer care to complement
service user concerns about impatient official who care less
about being polite.
Timeliness Consider additional resources at month end for service
points to cope with demand. Alternatively, increased
working hours, publicised well in advance could deal with
the problem ensuring that service users come at different
times.
Sewage blockages need quick action considering the
hazard they pose to health.
Knowledge and Competence Continuous training in the form of specialised courses,
workshops, on the job training, seminars and current
awareness programmes on public administration and
customer care issues is recommended to empower officials
to perform better in their duties.

PUBLIC SERVICE COMMISSION
CITIZENS TALK II: A CITIZEN SATISFACTION SURVEY REPORT Page 95
CHAPTER NINE: KEY FINDINGS: UMLALAZI LOCAL MUNICIPALITY
9.1 INTRODUCTION
Chapter nine presents the key findings of the survey in relation to the services rendered by
the uMlalazi Local Municipality. A demographic profile of the service users that participated in
the study is presented first, followed by the key findings of the survey. The key findings are
presented according to the South African-specific drivers of citizen satisfaction model
described in Chapter Two of this report. In this regard, the service users’ ratings of
satisfaction with services of uMlalazi Local Municipality and the challenges experienced are
presented. The chapter concludes with a set of recommendations.
9.2 DEMOGRAPHIC PROFILE
A total of 126 respondents were interviewed at the uMlalazi Municipality in KwaZulu-Natal
Province. The majority of service users 59% were female and 41% were male. Thirty eight
(38.1%) of the service users were between the ages of 35-49, 28.6% were between the ages
of 25-34, 19% were between the ages of 50-64, 9.5% were between 16-24 years and 4.8%
were 65years and above. In terms of educational attainment, one in four (40.5%) of services
users had a Grade 12 education. This is followed by 22.2% with a diploma, 19% with some
secondary education, whilst 11.9% had a degree. Furthermore, half of the service users were
in full time employment, 21.4% were unemployed.
9.3 KEY FINDINGS
The findings show that on average 74.3% of service users were satisfied with the services
rendered by uMlalazi Local Municipality. Table 25 highlights service users’ level of
satisfaction with services rendered by uMlalazi Local Municipality according to the key drivers
of citizen satisfaction.
Table 25: Service users' level of satisfaction with services rendered by uMlalazi Local Municipality
Drivers of Citizen Satisfaction Satisfaction Rating
Fairness and equity 94.4%
Outcome 92.1%
Courtesy 92%
Knowledge and competence 89.9%
Facilities 81.4%
Timeliness 74.6%
Value for money 61.3%
Access 57.7%

PUBLIC SERVICE COMMISSION
CITIZENS TALK II: A CITIZEN SATISFACTION SURVEY REPORT Page 96
Information 55.5%
Redress 44.4%
Average rating across the 10 drivers 74.3%
Table 25 above shows that service users were highly satisfied with fairness and equity
(94.4%) displayed by the officials, outcome (92.1%) of service and courtesy (92%) shown to
service users by officials at uMlalazi Municipality’s service points and least satisfied with
redress (44.4%) in service delivery. This finding suggest that service users who participated
in this survey were happy with fairness and equity and courtesy displayed by officials of the
municipality as well as the outcome of the services rendered.
Detailed findings on the service users’ views regarding their level of satisfaction with each
driver are presented below.
9.4 ACCESS
9.4.1 Citizens’ level of satisfaction with accessibility to public services
Public Service institutions should provide citizens with equal access to the services to which
they are entitled16. In this regard the study sought to determine service users’ level of
satisfaction with regards to accessing the services rendered by uMlalazi Local Municipality.
To this end, four aspects relating to the accessibility of services were assessed by the
service users, namely, “accessibility of facility”, “convenience of operating hours”,
“disability/elderly access and the “ability to contact the service point telephonically”.
16
Republic of South Africa, Department of Public Service and Administration, Batho Pele Handbook: Service Improvement Guide. 2003.

PUBLIC SERVICE COMMISSION
CITIZENS TALK II: A CITIZEN SATISFACTION SURVEY REPORT Page 97
Figure 61: Rating the experience pertaining to accessibility of public services
Figure 61 above shows that 64.3% of the service users rated “convenience of operating
hours” good to excellent, 57.9% rated “accessibility to facility” good to excellent, 54.7% rated
“disability/elderly access” good to excellent and 53.9% rated “ability to access service point
by phone” good to excellent. The findings show that there is a room for improving the
physical structures of service points to enable those with disabilities access to the buildings
and provide assistance through a telephone.
9.4.2 Challenges experienced by service users in relation to accessibility of public
service
A key challenge identified by service users was the distance travelled to the service points of
the municipality.
9.5 COURTESY
9.5.1 Citizens’ level of satisfaction with courtesy displayed by officials
Public Service officials should treat citizens with courtesy and consideration, and should
2.4%
14.3%
25.4%
51.6%
6.3%
1.6%
10.3%
23.8%
62.7%
1.6% 1.6%
6.3%
37.3%
47.6%
7.1%
2.4%
13.5%
30.2%
44.4%
9.5%
Poor Below average Average Good Excellent
Accessibility of facility Convenience of operating hours
Disability/Elderly access Ability to access service point by phone
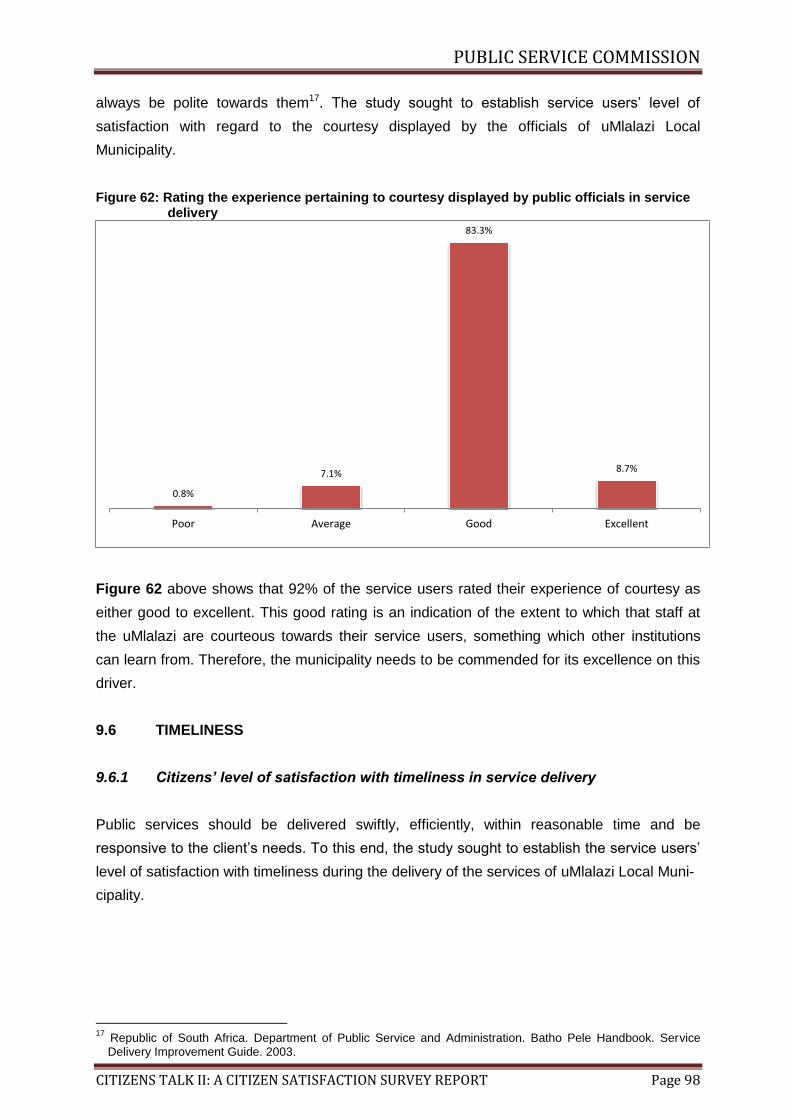
PUBLIC SERVICE COMMISSION
CITIZENS TALK II: A CITIZEN SATISFACTION SURVEY REPORT Page 98
always be polite towards them17. The study sought to establish service users’ level of
satisfaction with regard to the courtesy displayed by the officials of uMlalazi Local
Municipality.
Figure 62: Rating the experience pertaining to courtesy displayed by public officials in service delivery
Figure 62 above shows that 92% of the service users rated their experience of courtesy as
either good to excellent. This good rating is an indication of the extent to which that staff at
the uMlalazi are courteous towards their service users, something which other institutions
can learn from. Therefore, the municipality needs to be commended for its excellence on this
driver.
9.6 TIMELINESS
9.6.1 Citizens’ level of satisfaction with timeliness in service delivery
Public services should be delivered swiftly, efficiently, within reasonable time and be
responsive to the client’s needs. To this end, the study sought to establish the service users’
level of satisfaction with timeliness during the delivery of the services of uMlalazi Local Muni-
cipality.
17
Republic of South Africa. Department of Public Service and Administration. Batho Pele Handbook. Service Delivery Improvement Guide. 2003.
0.8%
7.1%
83.3%
8.7%
Poor Average Good Excellent

PUBLIC SERVICE COMMISSION
CITIZENS TALK II: A CITIZEN SATISFACTION SURVEY REPORT Page 99
Figure 63: Rating the experience pertaining to timeliness in the delivery of public service
Figure 63 above shows that 74.6% of the services users rated timeliness in the delivery of
public services at uMlalazi Municipality as either good to excellent. None of the service users
rated the delivery of services in terms of timeliness as poor.
7.6.2 Challenges experienced by service users in relation to timeliness in service
delivery
Key challenges identified by service users were:
Waiting time was long
Queues were long
Service was slow, especially month end when there are lots of people.
9.7 INFORMATION
9.7.1 Citizens’ level of satisfaction with the provision of information in service
delivery
Comprehensive and accurate information should be provided to citizens on where and how
services can be accessed18. This includes information on the applicable requirements prior to
accessing services. In this regard, the study sought to establish the service users’ level of
satisfaction with their experience on the accuracy of information provided by the municipality.
To this end, six aspects relating to information were assessed by service users, namely,
18
Republic of South Africa. Department of Public Service and Administration. Batho Pele Handbook. Service Delivery Improvement Guide. 2003.
7.9
17.5
65.1
9.5
Below average Average Good Excellent

PUBLIC SERVICE COMMISSION
CITIZENS TALK II: A CITIZEN SATISFACTION SURVEY REPORT Page 100
“signage/information boards”, “information desk”, posters/flyers/pamphlets, “information on
level of quality and service” and “information about one’s rights” with regards to the services
provided.
Figure 64: Rating the experience pertaining to the provision of information in public services
Figure 64 above shows that 59.5% rated “signage/information board” good to excellent,
55.2% rated “information on level and quality of service” good to excellent, 53.9% rated
“information desk” good to excellent, 53.2% rated “posters/flyers/pamphlets” good to
excellent. The findings show that in general there is a room for improving the provision of
information to the service users.
9.7.2 Challenges experienced by service users in obtaining accurate information
Key challenges identified by service users were:
There was no signage or information board outside service points
There were no posters, pamphlets, flyers at service points.
9.8 KNOWLEDGE AND COMPETENCE
9.8.1 Citizens’ level of satisfaction with knowledge and competence of official
Competence is a standard requirement for an individual to perform a specific job, and it
7.1%
17.5% 15.9%
51.6%
7.9% 5.6%
25.4%
15.1%
44.4%
9.5%
5.6%
24.6%
16.7%
42.1%
11.1%
4.8%
21.6% 18.4%
41.6%
13.6%
Poor Below average Average Good Excellent
Signage/Information boards Information desk Posters/flyers/pamphlets Information on level and quality of service

PUBLIC SERVICE COMMISSION
CITIZENS TALK II: A CITIZEN SATISFACTION SURVEY REPORT Page 101
encompasses the knowledge utilised to improve performance. The study sought to determine
service users’ level of satisfaction with the knowledge and competence of officials of uMlalazi
Local Municipality. In this regard, three aspects relating to knowledge and competence of
officials were assessed by service users, namely, “officials’ knowledge about services
offered”, “officials’ ability to understand your requirements”, “officials’ ability to accurately
perform services”.
Figure 65: Rating the experience pertaining to the knowledge and competence of government officials
Figure 65 shows that 90.4% rated “officials’ ability to understand requirements” and “officials’
ability to accurately perform services” good to excellent, respectively, while 88.9% rated
“officials’ knowledge about services offered” good to excellent. In general, the findings show
service users’ overwhelming confidence on the officials of the municipality in rendering
services.
9.8.2 Challenges pertaining to knowledge and competence of Staff
A key challenges identified by service users was that some officials understood service
users’ requirements/needs and some did not
9.9 FACILITIES
9.9.1 Citizens’ level of satisfaction with the condition of public facilities
The condition of public facilities should be welcoming and cater for the needs of the citizens.
1.6% 0.0%
9.5%
77.0%
11.9%
0.8% 0.8%
8.0%
78.4%
12.0%
1.6% 0.0%
8.0%
76.0%
14.4%
Poor Below average Average Good Excellent
Officials’ knowledge about services offered Officials’ ability to understand your requirements Officials’ ability to accurately perform services

PUBLIC SERVICE COMMISSION
CITIZENS TALK II: A CITIZEN SATISFACTION SURVEY REPORT Page 102
It is important for citizens to feel that contact with government is taking place in a clean, quiet
and safe environment. To this end, the study sought to establish the service users’ level of
satisfaction with the condition of the uMlalazi Local Municipality facilities. In this regard three
aspects relating to the condition of public facilities were assessed by service users, namely,
“waiting area”, “cleanliness of facilities” and “safety/security”.
Figure 66: Rating the experience pertaining to the condition of public facilities
Figure 66 above shows that 87.2% rated “cleanliness of facility” good to excellent, 80.8%
rated “security/safety” good to excellent and 76.2% rated “waiting area” good to excellent.
The condition of the public facilities at the uMlalazi service point was rated positively by a
majority of service users, with the best scores given to the cleanliness of the facility.
9.9.2 Challenges experienced by service users with regard to the condition of
public facilities
Key challenges identified by service users were:
Inadequate security at service points
Shortage of chairs in the waiting areas leading to customers having to stand before
being served.
9.10 FAIRNESS AND EQUITY
9.10.1 Citizens’ level of satisfaction with the display of fairness and equity by
government officials when interacting with service users
Public services should be rendered equally and fairly without prejudice or favour. In this
5.6% 6.3%
11.9%
61.1%
15.1%
2.4% 0.8%
9.6%
72.0%
15.2%
7.2% 3.2%
8.8%
64.0%
16.8%
Poor Below average Average Good Excellent
Waiting area Cleanliness of facility Security/Safety

PUBLIC SERVICE COMMISSION
CITIZENS TALK II: A CITIZEN SATISFACTION SURVEY REPORT Page 103
regard, the study sought to establish service users’ experience with regard to the fairness
and equity displayed by officials. To this end, service users were requested to indicate the
extent to which they agree with the following statements, namely, “you were treated fairly by
officials” and “the service was rendered without favour”. Figure 67 below demonstrates
service users’ views with regard to the above-mentioned statements.
Figure 67: Rating the experience pertaining to fairness and equity displayed by officials
Figure 67 above shows that 95.2% of the service users agreed to strongly agreed that
“service rendered without favour”, 93.6% agreed to strongly agreed to “fair treatment by
officials”. Whilst in general, service users seemed happy with the aspects of the driver, it was
established that about 6.4% of the service users felt that they have been unfairly treated by
the officials of the municipality and 4.8% indicated that there has been some preferential
treatment in receiving services. This is a cause for concern as such incidents may a potential
to lead to nepotism, favouritism or corruption which is not a good practice.
9.10.2 Challenges pertaining to fairness and equity displayed by officials
A key challenge identified by service users was that discrimination was rife, with white people
are treated better.
9.11 VALUE FOR MONEY
9.11.1 Citizens’ level of satisfaction with value for money in service delivery
Public services have to be delivered economically and efficiently in order to give citizens the
2.4% 4.0%
82.5%
11.1%
2.4% 2.4%
81.7%
13.5%
Strongly disagree Disagree Agree Strongly agree
Fair treatment by officials Service rendered without favour

PUBLIC SERVICE COMMISSION
CITIZENS TALK II: A CITIZEN SATISFACTION SURVEY REPORT Page 104
best value for money. In this regard, the survey sought to establish service users’ level of
satisfaction with their experience on value for money in service delivery. To this end, service
users had to indicate the extent to which they agree with the following statements “officials
rendered services efficiently”, “cost of services was reasonable” and “the service is an
example of good value for money”. Figure 68 below presents the service users’ views with
the above-mentioned statements.
Figure 68: Rating the experience pertaining to value for money in service delivery
Figure 68 above shows that 83.1% of the service users agreed to strongly agreed that
“officials rendered services efficiently”, 50.8% agreed to strongly agreed that “the cost of
service being reasonable” and half (50%) agreed to strongly agreed that the “service was a
good example of value for money”. The findings suggest that service users had concerns
around the cost of services as a result half of them were not convinced that the service
offered was a good example of value for money.
9.11.2 Challenges pertaining to fairness and equity displayed by officials
Key challenges identified by service users were:
Services were unaffordable and most people are unemployed
Services were poorly rendered
Meters were not read and amounts due were based on estimations.
3.2%
13.7%
62.9%
20.2%
29.8%
19.4%
40.3%
10.5%
30.6%
19.4%
30.6%
19.4%
Strongly disagree Disagree Agree Strongly Agree
Officials rendered service efficiently Cost of services being reasonable Service an example of value for money
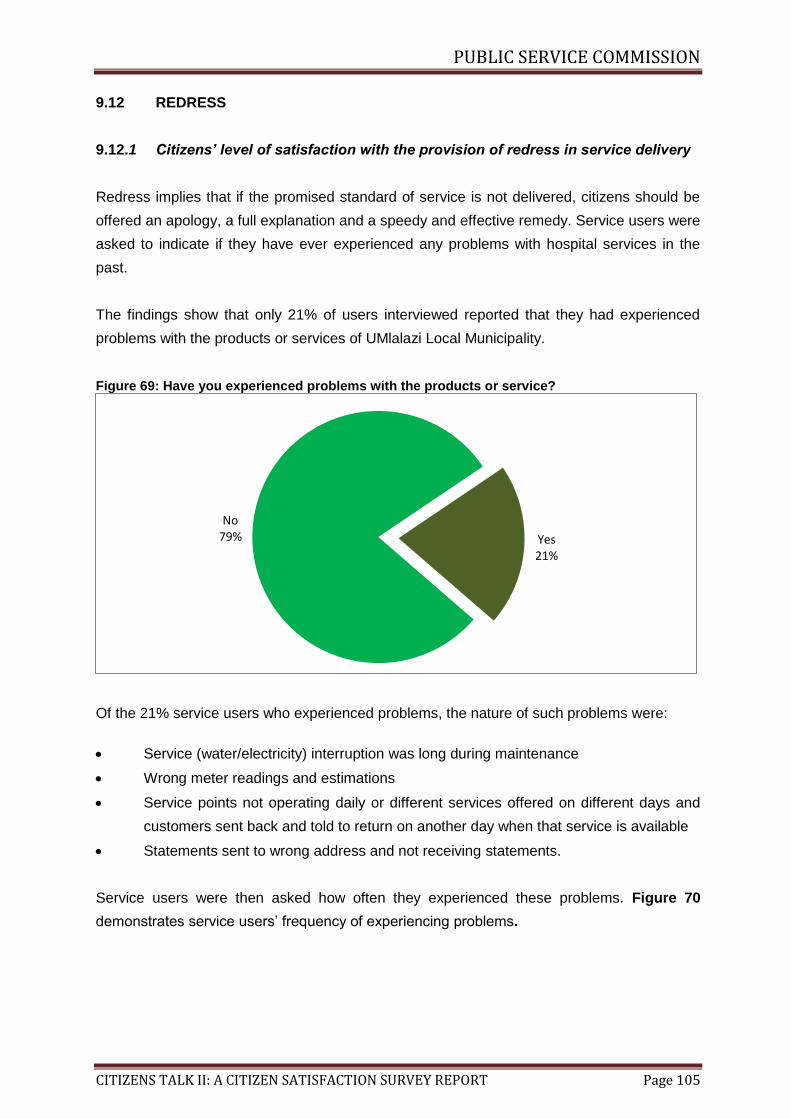
PUBLIC SERVICE COMMISSION
CITIZENS TALK II: A CITIZEN SATISFACTION SURVEY REPORT Page 105
9.12 REDRESS
9.12.1 Citizens’ level of satisfaction with the provision of redress in service delivery
Redress implies that if the promised standard of service is not delivered, citizens should be
offered an apology, a full explanation and a speedy and effective remedy. Service users were
asked to indicate if they have ever experienced any problems with hospital services in the
past.
The findings show that only 21% of users interviewed reported that they had experienced
problems with the products or services of UMlalazi Local Municipality.
Figure 69: Have you experienced problems with the products or service?
Of the 21% service users who experienced problems, the nature of such problems were:
Service (water/electricity) interruption was long during maintenance
Wrong meter readings and estimations
Service points not operating daily or different services offered on different days and
customers sent back and told to return on another day when that service is available
Statements sent to wrong address and not receiving statements.
Service users were then asked how often they experienced these problems. Figure 70
demonstrates service users’ frequency of experiencing problems.
Yes 21%
No 79%

PUBLIC SERVICE COMMISSION
CITIZENS TALK II: A CITIZEN SATISFACTION SURVEY REPORT Page 106
Figure 70: How often have you experienced problems with the service?
The findings show that 56% of the service users seldom experienced problems compared to
only a quarter (24%) that reported experiencing problems very often.
Of the service users who indicated that they had experienced problems with products and
services of the municipality, 60% indicated that they had lodged a formal complaint and the
majority did so verbally (85.7%) while only 14.3% had lodged their complaint in writing.
Furthermore, service users who had lodged complaints were requested to indicate their level
of satisfaction with how the problem was resolved. Figure 71 below gives an illustration of
the service users responses in this regard.
Figure 71: Rating the satisfaction with how problem was solved
Figure 71 above shows that 44.4% of the service users rated their satisfaction with the
56%
20.0% 24.0%
Seldom Often Very often
16.7% 16.7%
22.2%
33.3%
11.1%
Poor Below Average Average Good Excellent

PUBLIC SERVICE COMMISSION
CITIZENS TALK II: A CITIZEN SATISFACTION SURVEY REPORT Page 107
resolution of their problems by the municipality as good to excellent while over half (55.6%)
were dissatisfied with how their problems were resolved. Service user who did not lodge a
complaint were asked the reasons for not doing so and Table 26 below is an illustration of
their responses.
Table 26: Reasons for not lodging a complaint
Reason for not lodging complaint Percentage
It was not worthwhile 89.7%
Did not know where to lodge it 10.3%
9.12.2 Challenges experienced by service users with the provision of redress
Key challenges experienced by service users were:
Problems were still on-going even after several complaints
There was no explanation given on how problem will be solved
There was no feedback provided.
9.13 OUTCOME
9.13.1 Citizens’ level of satisfaction with obtaining outcome in service delivery
Government institutions should ensure that the products/services that citizens visit their
service delivery point to obtain are available and provided to them within reasonable time. In
this regard, the study sought to establish service users’ level of satisfaction with the receipt of
outcome during service delivery. To this end, service users had to indicate to what extent
they agree with selected statements, namely “in the end, you got what you needed” and ‘the
service experience met your expectations’. Figure 72 below shows service users’ views in
this regard.

PUBLIC SERVICE COMMISSION
CITIZENS TALK II: A CITIZEN SATISFACTION SURVEY REPORT Page 108
Figure 72: Rating the experience pertaining to obtaining outcome in service delivery
Figure 72 above shows that 93.3% of the service users agreed to strongly agreed that “in
the end you got what you needed”, 90.8% agreed to strongly agreed that “service
experience met your expectations”. It should however, be noted that 6.6% of the service
users did not obtain the service they needed and 9.1% were of the view that the service
rendered did not meet their expectation.
9.13.2 Challenges experienced by service users with the outcome of services
provided
A key challenges identified by service users was unsatisfactory results
9.14 RECOMMENDATIONS
Based on the findings, the following key recommendations are made for consideration by the
uMlalazi municipality by July 2012:
Key areas Recommendations
Redress With immediate effect:
The uMlalazi Local Municipality must develop mechanisms
to ensure that formal records of complaints are captured
and attended to in an effective and efficient manner. In this
regard, feedback on how complaints raised are handled
and resolved should be communicated back to the service
users through officials who should be monitored on
complaints handling, and a recourse meted for all
complaints lodge. Furthermore, systems should be put in
place to monitor the turnaround time with regards to
complaints lodged by service users.
3.3% 3.3%
90.8%
2.5% 3.3% 5.8%
88.3%
2.5%
Strongly disagree Disagree Agree Strongly agree
In the end, you got what you needed Service experience met your expectations

PUBLIC SERVICE COMMISSION
CITIZENS TALK II: A CITIZEN SATISFACTION SURVEY REPORT Page 109
With immediate effect the Department must:
o Establish mechanisms to get feedback from
service users.
o Keep a record of such feedback.
o Measure and report on progress in addressing
issues raised by service users.
Information Clear and visible outside and inside signage must be
displayed at all service delivery sites of the municipality.
Officials must ensure that information desks at all service
sites are well stocked with posters/flyers/pamphlets.
Service users must be informed about the municipality’s
service standards and their rights prior to receiving
services.
Access Amenities for service users who are disabled and the
elderly must be provided to ensure easy access to
services.
Telephone numbers of all municipal service points must
be visibly displayed to service users, and officials must
strive to assist them telephonically.
The proximity of service sites to where service users live
must be a major consideration by the municipality.
Value for money Officials must communicate how the price of various
services is arrived at so that service users are not caught
by surprise.
Increases and the rationale behind them must be
communicated well in advance of their implementation
using innovative methods such as SMS as well as on radio
and regional TV broadcasts.

PUBLIC SERVICE COMMISSION
CITIZENS TALK II: A CITIZEN SATISFACTION SURVEY REPORT Page 110
CHAPTER TEN: CONCLUSION AND RECOMMENDATIONS
10.1 INTRODUCTION
Measuring the citizen satisfaction with services rendered by government institutions is one of
the key areas of performance management. The key objective of providing government
services to the citizens is to improve their quality of life and therefore citizens are better
positioned to provide feedback on whether government services satisfied their needs. This
chapter presents the general conclusion and recommendations of the survey conducted in
the five selected Departments.
10.2 CONCLUSION
The citizens’ level of satisfaction with services rendered by the selected institutions was
assessed through the use of the ten South African-specific drivers of citizen satisfaction. In
this regard, various aspects of the ten drivers were applied to determine the citizens’ views
on the performance of the selected institutions with regard to the services they offer. Table
27 below shows the service users’ overall level of satisfaction with the services rendered by
the institutions that participated in this study.
Table 27: Overall satisfaction rate with services rendered by SASSA and municipalities
INSTITUTIONS
Driver of citizen
satisfaction
SASSA Nelson
Mandela
Bay
Mangaung Emfuleni Madibeng UMlalazi All
Institutions
Access 48.6% 43.2% 58% 52.8% 48.4% 57.7% 51.5%
Courtesy 78.9% 77.5% 81.1% 57.1% 68.6% 92% 75.9%
Timeliness 52.7% 69.8% 70.3% 34.2% 55.6% 74.6% 59.5%
Information 40.2% 49.3% 45.8% 39.9% 27.5% 55.5% 43.0%
Knowledge and
competence
73.7% 64.9% 73.5% 50.3% 61.7% 89.9% 69.0%
Facilities 65.5% 86.3% 80.1% 59.7% 35.9% 81.4% 68.2%
Fairness and
equity
88.8% 93.4% 91.3% 75.3% 90.9% 94.4% 89.0%
Value for money 86.0% 53.3% 71.4% 52.4% 76% 61.3% 66.7%
Redress 28.7% 15.3% 9.8% 8.2% 18.5% 44.4% 20.8%
Outcome 83.% 80.3% 72.8% 68% 81.8% 92.1% 79.7%
Average 64.6% 63.3% 65.4% 49.8% 56.5% 74.3% 62.3%
Table 35 above shows that overall, service users were satisfied with fairness and equity
displayed by officials (89%), followed by outcome of service delivery (79.7%) and courtesy

PUBLIC SERVICE COMMISSION
CITIZENS TALK II: A CITIZEN SATISFACTION SURVEY REPORT Page 111
displayed by officials (75.9%). However, service users were least satisfied with accessibility
(51.5%), provision of accurate information (43%) and redress (20.8%) in service delivery.
The findings further show that with regard to the overall level of satisfaction with the
institutions’ services, service users of UMlalazi Local Municipality were most satisfied
(74.3%) with the institution’s performance on various key drivers while those of Emfuleni
Local Municipality were the least satisfied (49.8%).
10.3 GENERAL RECOMMENDATIONS
REDRESS
An effective, formal complaint mechanism with multiple channels for lodging one’s complaints
should be available to dissatisfied service users. The complaint process should be made
clear, step by step. Trust should be built around the complaint mechanism to ensure that
customers’ are not discouraged from using it because they do not see it as effective.
INFORMATION
Accurate, comprehensive and current information about products and services on offer
should be provided to service users so that they can make informed choices. Signage should
be clear and legible for all to see. Information on how to complain and where to complain
about poor service should also be clearly displayed. Information desks should be staffed and
attend to customer queries within a reasonable time.
ACCESSIBILITY
Accessibility is one of the key issues that need to attention to ensure that targeted service
users use the service without any hindrance. Operating hours should be flexible to
accommodate service users so that customers are not disadvantaged. Service points should
have disability access in line with government building regulations. In addition to direct
access to the service delivery points, customers should be able to call in with queries which
would save time and transport costs. The telephone numbers with hours of availability should
be clearly displayed at the service point and advertised widely in the community.
TIMELINESS
Public services should be offered efficiently and without delay as service users often spend a
considerable amount of time to have their queries and needs attended to. Some even take
time off from work to come to the service point. It is therefore important that the provision of
services is timeous and prompt.

PUBLIC SERVICE COMMISSION
CITIZENS TALK II: A CITIZEN SATISFACTION SURVEY REPORT Page 112
Annexure A: SERVICE DELIVERY SITES VISITED
Table 28: Service delivery sites visited
SASSA
Eastern Cape (185) Service Point Total
UITENHAGE 56
ZWIDE 69
MOTHERWELL 30
MOTHERWELL SATELITE 30
Free State (173)
BLOEMFONTEIN 1
BOTSHABELO 92
BOTSHABELO SATELITE 17
ROCKLANDS 63
Gauteng (185)
BOITSHEPOVILLE 22
EMFULENI 50
HOUTKOP 8
MEYERTON 29
SEBOKENG 35
TSHEPISO PHASE 3 41
KZN (180)
INKANYEZI 84
KING DINIZULU 28
MELMOTH 23
ONGOYE 45
Limpopo (175)
ELIM HALL PAYPOINT 30
MANKWENG 37
MOGOTO VILLAGE PAY POINT 21
MOKOTOPONG 15
MOTHIBA 6
POLOKWANE 31
SESHEGO 35
Mpumalanga (175)
EHLAZENI 17
KABOKWENI 56
LYDENBURG 19
MBOMBELA 37
NELSPRUIT 33
SABIE 8
SIMILE 5
Northern Cape (172)
BEACONSFIELD 9
TLHOKOMELO 138
ONE STOP 25
North West (173)
KGETLENG 14
KLIPGAT 42
MADIBENG 84
RUSTENBURG 33

PUBLIC SERVICE COMMISSION
CITIZENS TALK II: A CITIZEN SATISFACTION SURVEY REPORT Page 113
Western Cape (173)
CAPE TOWN 22
EERSTE RIVIER 25
HOUTKOP 69
KHAYELITSHA 25
NYANGA 32
NELSON MANDELA BAY METROPOLITAN MUNICIPALITY (517)
MUNICIPALITIES MFANASEKHAYA QGOBOSE 177 UITENHAGE 210 ZWIDE 130
MANGAUNG METROPOLITAN MUNICIPALITY (380)
BLOEMFONTEIN 235 BOTSHABELO 103 THABA NCHU 42
EMFULENI LOCAL MUNICIPALITY (366)
VEREENIGING 216 VANDERBIJL PARK 134 SEBOKENG 16
MADIBENG LOCAL MUNICIPALITY (153)
MADIBENG 119 LEHLABILE 34
UMLALAZI LOCAL MUNICIPALITY (126)
UMLALAZI 126
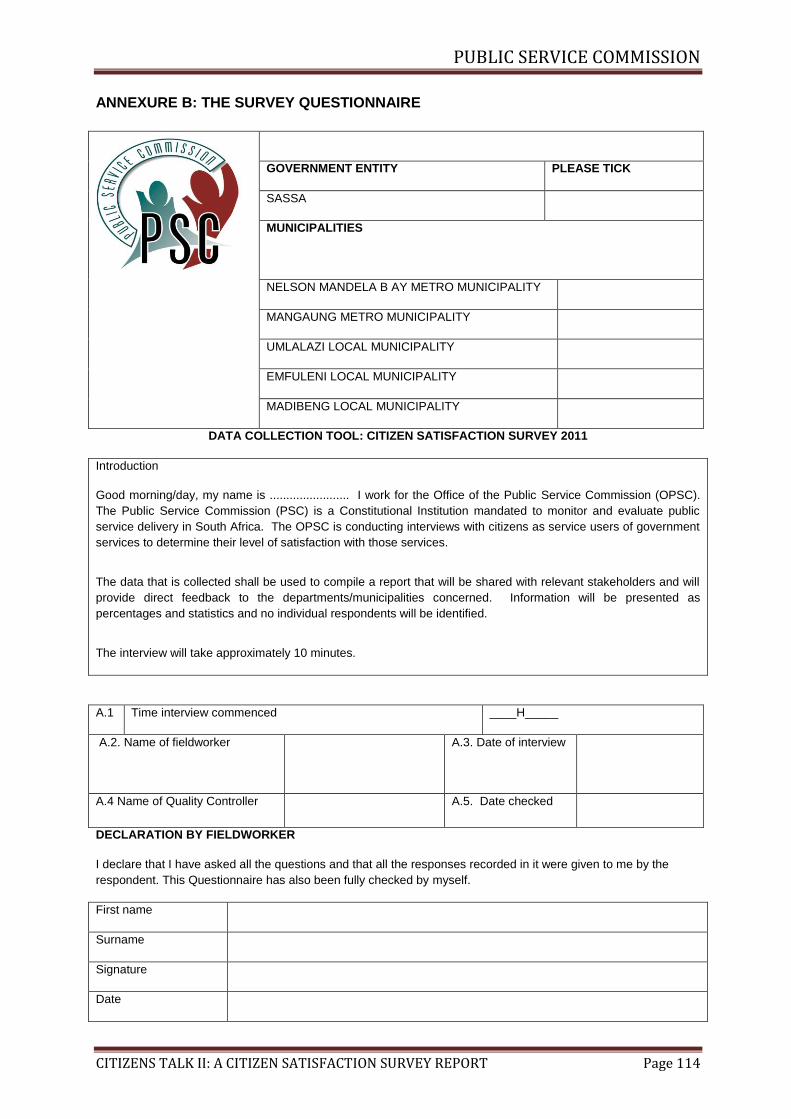
PUBLIC SERVICE COMMISSION
CITIZENS TALK II: A CITIZEN SATISFACTION SURVEY REPORT Page 114
ANNEXURE B: THE SURVEY QUESTIONNAIRE
GOVERNMENT ENTITY PLEASE TICK
SASSA
MUNICIPALITIES
NELSON MANDELA B AY METRO MUNICIPALITY
MANGAUNG METRO MUNICIPALITY
UMLALAZI LOCAL MUNICIPALITY
EMFULENI LOCAL MUNICIPALITY
MADIBENG LOCAL MUNICIPALITY
DATA COLLECTION TOOL: CITIZEN SATISFACTION SURVEY 2011
Introduction
Good morning/day, my name is ........................ I work for the Office of the Public Service Commission (OPSC).
The Public Service Commission (PSC) is a Constitutional Institution mandated to monitor and evaluate public
service delivery in South Africa. The OPSC is conducting interviews with citizens as service users of government
services to determine their level of satisfaction with those services.
The data that is collected shall be used to compile a report that will be shared with relevant stakeholders and will
provide direct feedback to the departments/municipalities concerned. Information will be presented as
percentages and statistics and no individual respondents will be identified.
The interview will take approximately 10 minutes.
A.1 Time interview commenced ____H_____
A.2. Name of fieldworker
A.3. Date of interview
A.4 Name of Quality Controller A.5. Date checked
DECLARATION BY FIELDWORKER
I declare that I have asked all the questions and that all the responses recorded in it were given to me by the
respondent. This Questionnaire has also been fully checked by myself.
First name
Surname
Signature
Date

PUBLIC SERVICE COMMISSION
CITIZENS TALK II: A CITIZEN SATISFACTION SURVEY REPORT Page 115
DEMOGRAPHICS
1.1 Gender of respondent:
Male 1
Female 2
1.2 What is your age?
16 – 24 yrs 1
25 – 34 yrs 2
35 – 49 yrs 3
50 – 64 yrs 4
65+ yrs 5
1.3 Province:
Eastern Cape 1
Free State 2
Gauteng 3
Kwazulu-Natal 4
Limpopo 5
Mpumalanga 6
Northern Cape Province 7
North West 8
Western Cape 9
1.4 Location
Urban 1
Rural 2
1.5 Name of Service point

PUBLIC SERVICE COMMISSION
CITIZENS TALK II: A CITIZEN SATISFACTION SURVEY REPORT Page 116
1.6 Population group:
Black 1
Coloured 2
Indian/Asian 3
White 4
Other (specify) 5
1.7 Educational level:
No schooling 1
Some primary school 2
Some secondary school 3
Grade 12/Matric 4
Diploma 5
Degree 6
Other (specify) 7
1.8 Employment status:
Full time 1
Part time 2
Student/Scholar 3
Retired/pension 4
Unemployed 5
Other (specify) 6

PUBLIC SERVICE COMMISSION
CITIZENS TALK II: A CITIZEN SATISFACTION SURVEY REPORT Page 117
DRIVERS OF CITIZEN SATISFACTION WITH PUBLIC SERVICES
2 ACCESS
Access is one of the Batho Pele principles, and it requires the Public Service to ensure that all citizens have equal
access to the services to which they are entitled.
Please rate your experience with regard to: READ OUT OPTIONS
Item
Poor
Below
average
Average
Good Excellent
2.1 Accessibility/ proximity of facility 1
2 3
4 5
2.2 Convenience of operating hours 1
2 3
4 5
2.3 Disability/elderly access 1
2 3
4 5
2.4 Ability to contact the service point telephonically 1
2 3
4 5
2.5. What is the most critical challenge you have experienced in Accessing public services?
_______________________________________________________________________________________
_______________________________________________________________________________________
_________________________________________________________________________________________
______________________________________________________________________________________
3 COURTESY
Public Service officials should treat citizens with courtesy and consideration, and should always be polite towards
them.
3.1 Please rate your experience with regard to the courtesy displayed by public service officials:
Poor Below average Average Good Excellent
1 2 3 4 5
3.2 What is the most critical challenge you have experienced regarding Courtesy at the service delivery point?
_________________________________________________________________________________________
__________________________________________________________________________________________
__________________________________________________________________________________________

PUBLIC SERVICE COMMISSION
CITIZENS TALK II: A CITIZEN SATISFACTION SURVEY REPORT Page 118
4 TIMELINESS
Public services should be provided swiftly and within reasonable time.
4.1 Please rate your experience with regard to timeliness in the delivery of public services:
Poor Below average Average Good Excellent
1 2 3 4 5
4.2 What is the most critical challenge you have experienced regarding Timeliness at the service delivery point?
__________________________________________________________________________________________
__________________________________________________________________________________________
_________________________________________________________________________________________
5 INFORMATION
Comprehensive and accurate information should be provided to citizens on where and how services can be
accessed.
Please rate your experience with regard to:
Item
Poor
Below
average
Average
Good Excellent
5.1 Signage: information boards (outside/etrance) 1
2 3
4 5
5.2 Availability of information desk 1
2 3
4 5
5.3 Availability of posters, flyers, pamphlets, etc. 1
2 3
4 5
5.4 Information on level and quality of service/Being
open and clear about what you can expect
1
2 3
4 5
5.6 What is the most critical challenge you have experienced regarding Information at the service delivery point?
__________________________________________________________________________________________
__________________________________________________________________________________________
__________________________________________________________________________________________
6 KNOWLEDGE AND COMPTENENCE OF STAFF
Citizens need to be served by staff that is knowledgeable about the services they provide.

PUBLIC SERVICE COMMISSION
CITIZENS TALK II: A CITIZEN SATISFACTION SURVEY REPORT Page 119
Please rate your experience with regard to:
Item Poor Below
average
Average Good excellent
6.1 Officials’ knowledge about services offered 1 2 3 4 5
6.2 Officials’ ability to understand your
requirements
1 2 3 4 5
6.3 Officials’ ability to accurately perform services 1 2 3 4 5
6.5 What is the most critical challenge you have experienced regarding officials’ Knowledge and
Competence in their work at the service delivery point?
__________________________________________________________________________________________
__________________________________________________________________________________________
__________________________________________________________________________________________
7 FACILITIES The condition of public facilities should always be welcoming and cater for the needs of citizens.
Please rate your experience with regard to:
Item Poor
Below
average Average Good Excellent
7.1 Waiting area 1 2 3 4 5
7.2 Cleanliness of facility 1 2 3 4 5
7.3 Security/safety 1 2 3 4 5
7.4 What is the most critical challenge you have experienced regarding the conditions of the Facilities at the
service delivery point?
________________________________________________________________________________________
_________________________________________________________________________________________
_________________________________________________________________________________________
8 FAIRNESS AND EQUITY
Public services should be rendered equally and fairly without prejudice or favour.
Please rate your experience with regard to the fairness and equity displayed by officials:
Item Strongly disagree Disagree Agree
Strongly
disagree
8.1 Fair treatment by officials 1
2 3 4
8.2 Service rendered without favour 1
2 3 4

PUBLIC SERVICE COMMISSION
CITIZENS TALK II: A CITIZEN SATISFACTION SURVEY REPORT Page 120
8.3 What is the most critical challenge you have experienced regarding Fairness and Equity at the service
delivery point?
______________________________________________________________________________________
_______________________________________________________________________________________
_______________________________________________________________________________________
9 VALUE FOR MONEY
Public services have to be delivered economically and efficiently in order to give citizens the best value for money.
Please rate your experience with regard to:
Item
Strongly
disagree Disagree Agree
Strongly
agree
9.1 Officials rendered service efficiently 1 2 3 4
9.2 Cost of services being reasonable 1 2 3 4
9.3 Service an example of value for money 1 2 3 4
9.4 What is the most critical challenge you have experienced regarding Value for Money at the service delivery
point?
__________________________________________________________________________________________
__________________________________________________________________________________________
__________________________________________________________________________________________
10 REDRESS
Public Service institutions should ensure that a swift and sympathetic response through apology and full
explanation is offered to citizens where a promised standard of service is not delivered.
10.1 Have you ever experienced any problems with the products/services of the department?
Yes 1
No 2
10.2 If yes, how often would you say you have experienced problems?
Seldom 1
Often 2
Very often 3

PUBLIC SERVICE COMMISSION
CITIZENS TALK II: A CITIZEN SATISFACTION SURVEY REPORT Page 121
10.3 What problems did you experience?
__________________________________________________________________________________________
__________________________________________________________________________________________
__________________________________________________________________________________________
10.4 Did you lodge a complaint?
Yes 1
No 2 ( if no, go to Q 10.7)
10.5 If Yes, how did you lodge your complaint?
Verbally 1
In writing 2
10.6 Please rate your satisfaction level with how the problem was resolved
Poor Below average Average Good Excellent
1 2 3 4 5
10.7 If no, what was your reason for not lodging a complaint?
10.7.1 did not know where to lodge a complaint 1
10.7.2 felt it was not worthwhile 2
10.7.4 afraid of staff/ scared to get into trouble 3
10.8. What is the most critical challenge you have experienced regarding Redress at the service delivery point?
________________________________________________________________________________________
_________________________________________________________________________________________
_________________________________________________________________________________________
11 OUTCOME
Government Departments should ensure that the products/services are available and provided to citizens within
reasonable time.
Please rate your experience with regard to:
Item Strongly agree Disagree Agree
Strongly disagree
11.1 In the end, you got what you needed 1 2 3 4

PUBLIC SERVICE COMMISSION
CITIZENS TALK II: A CITIZEN SATISFACTION SURVEY REPORT Page 122
11.2 Service experience met your expectations
1 2 3
4
11.3 What is the most critical challenge you have experienced regarding receipt of Outcome at the service
delivery point?
_________________________________________________________________________________________
_________________________________________________________________________________________
_________________________________________________________________________________________
THANK YOU FOR YOUR PARTICIPATION

PUBLIC SERVICE COMMISSION
CITIZENS TALK II: A CITIZEN SATISFACTION SURVEY REPORT Page 123