a citizen-satisfaction survey in rimini -...
TRANSCRIPT

Statistica Applicata - Italian Journal of Applied Statistics Vol. 26 (1) 51
A CITIZEN-SATISFACTION SURVEY IN RIMINI
Carlo Cusatelli
Ionian Department, University “Aldo Moro”, Bari, Italy
Massimiliano Giacalone
Economics and Statistics Department, University “Federico II”, Naples, Italy
Antonio De Lorenzo
Institute of Studies on Mediterranean Societies, National Council of Research,Naples, Italy.
Abstract. This article presents a perspective analysis of performance improvement, in termsof customer satisfaction, with reference to the public sector. The survey was carried outthrough a questionnaire divided in two main areas, 24 variables with 118 answer modes,on a proportional stratified sample of 322 residents in the city of Rimini, according to dataprovided by the Territorial Information Service in order to measure the degree ofsatisfaction in public services, and how it is positioned with respect to expectations, Thisstudy was made also to understand what are the variables affecting citizen satisfaction andthat therefore reflect on the quality of the services provided.
Keywords: quality of public services, citizen customer satisfaction.
1. INTRODUCTION
The quality of services is an important aspect characterizing the performance ofpublic institutions, such as the capacity to operate with efficiency and effectiveness.The needs of citizen-users should be considered through the techniques of customersatisfaction, allowing the administration to identify possible differences betweenthe current needs and expectations of the community, in order to improve the qualityof services.
Quality consists of both an objective part (i.e. tangible aspects) and asubjective one (i.e. the intangible aspects), especially as in case of services. Today,the concept of quality is technically defined as a pattern made up of four differentsubsystems as mentioned below (Cantieri, 2007):– Expected quality: relates to expectations and therefore to the user. The goal is
to identify what the user wants; i.e. the implicit, explicit and latent needs;

52 Cusatelli C., Giacalone M., De Lorenzo A.
– Designed quality: refers to performance provided by the Administration, withthe aim to identify what it intends to give and the modality in providing service;
– Given quality: is also applicable to performance, determining what theAdministration effectively supplies compared to the standard services;
– Perceived quality: relates to the users’ expectations, with the aim to evaluatecitizen satisfaction in terms of received service.
1.1 THE LINK BETWEEN QUALITY AND CUSTOMER SATISFACTION
The quality of a service can be defined as the sum of all the aspects andcharacteristics on which depend its capacity in satisfying a given need. There is aclose link between customer satisfaction and quality of service (Margheri, 2002);therefore the prior knowledge of the customers’ expectations and needs becomes anecessary step in developing indicators for quality measurement, as well as the ratiobetween the supplied benefits and satisfied needs.
Customer satisfaction takes on the strategical role in identifying any differenceswhich exist between the levels of expectation and perception. This gap expresses,in turn, the level of non-quality, and the direction of corrective actions according tothe classification of deviations as described below:– Deviations between needs and provided services (i.e. expected and given
quality): it occurs when the needs are not fully understood by the Administrationor in the case when different priorities are assigned;
– Deviations between expectations and designed service standards (i.e. expectedand designed quality): it occurs when there is a time lag between the citizenexpectations and the standard services provided by the Administration;
– Deviations from standard facilities and services effectively performed (i.e.between designed and given quality): this happens when the provided servicedoes not reach the intended standards;
– Deviations between delivered effective performance and the perception of thecitizen-user (i.e. given and perceived quality): this occurs when the providedservice is different from the expectations.
Once the deviations are identified, the competency of the Administration toguarantee citizen satisfaction is connected with a continual improvement, that isthinking in terms of systemic solutions, in order to find the causes which preventan effective performance and to promptly intervene in overcoming them: it must betaken under consideration that citizen satisfaction is relative (depending on thecontext where it belongs) and dynamic (varying in time).
Therefore the development of public institutions, follows a pattern that

A Citizen-satisfaction survey in Rimini 53
alternates improvement and maintenance actions. In this context, customersatisfaction represents an excellent indicator because on the one hand it canmeasure the degree of satisfaction of the users’ needs and expectations, and on theother hand, provides the extent of efficiency level related to a particular correctiveaction (Zanella, 2002).
1.2 CUSTOMER SATISFACTION IN PUBLIC ADMINISTRATION
All organizations operating under a competitive market are induced to seekcompetitiveness and develop a greater consumer orientated policy, because itbecomes necessary for them to have a satisfied and loyal customer. In fact,marketing research shows that it is much more difficult and costly for companiesto gain new clients than keeping the old ones. For this reason, improving customersatisfaction becomes a profitable investment and one of the main targets forcompanies in maintaining and expanding their market shares.
The relationship between citizen and Administration is based on the necessityto fulfil and resolve collective needs and problems, and these aspects are felt as aright on the part of the citizen and a duty on the part of the Administration(Gramigna, 2005). So, in theory, the latter should simply perform the functions andactivities in serving efficiently the citizen, but in reality, the relationship betweencitizen and Administration is more complex and problematic. In fact the citizenrepresents a customer of the public service, and the quality of service depends onthe established relation with that particular office at that specific time. There is nota significant difference between the concept of citizen satisfaction with respect tothe same definition used in the private sector, except for the objectives (Fontana,2005). In the public area, the target is to fulfil the collective demands, listen andunderstand in-depth the needs that the citizen requests, while developing andimproving dialogue and relationship skills. In this case, CS allows to define publicpolicies, improve service supply systems and involvement of customers in the threephases of the system: pre-service, interaction and post-service.
The assessment of citizen satisfaction plays a significant role in front-officeservices, since it is where the local Administration and citizen-user interactallowing access to the provided service and establishing a mutual relation with thepublic (Bezzi, 2007). The front office can be defined as the last line of theAdministration, but also the first point of contact with the citizen. In this sense, itsdistinction is twofold: on the one hand it is identifiable with the Administration, itsvalues and rules, while on the other hand it should support the citizens’ perspective,respecting their rights and satisfying their needs.
The concept of front-office in the past referred only to direct interaction,

54 Cusatelli C., Giacalone M., De Lorenzo A.
meaning that the citizen went personally to the relevant office for information andthen request the proper documents or certificates and/or other services. Today thisassessment must be integrated with the current role that technology has taken onwithin front-office services, both in Administration and citizen-service relationsand management (Zani et al., 2007). In fact, technology allows the citizen-user todirectly interact with some phases in the supply of services, or to have a partialsupport from the administration staff.
2. STATISTICAL ANALYSIS OF PUBLIC UTILITIES IN RIMINI
The survey was carried out in June 2013 on a sample of 322 citizen-users to firstlymeasure the degree of perceived satisfaction of the services supplied by the publicadministrative offices in the city of Rimini, assessing any deviations from the initialexpectations, and secondly to comprehend which were the elements of the providedservice and their impact on the citizen-user’s level of satisfaction or dissatisfaction.The questionnaire was divided into two main different parts consisting of 24 closedquestions with the following five response levels: Not at all, Not much, Neutral,Good, Excellent. The first macro area consisted of six variables related in outliningthe features of the average user profile, while the second area is made up of theremaining eighteen variables, in relation to the aspects of the public servicereceived, in terms of user satisfaction and quality of service levels. The opinionswere collected through filling in a questionnaire given anonymously to a sample ofcitizen-users, with the aid of team of collaborators in charge of assisting them in thecompletion of the required information.
The reference population was that of adult residents in the city of Rimini,according to official data provided by the Territorial Information Service (SIT) andto the demographic situation in 2012. The data provided by the SIT of Riminiconcerns adult male and female residents divided by each populated district in themunicipality: 127 residential areas. It was decided to group these residential areasin only six districts, which until 2011 were officially recognized by the city ofRimini and the Emilia-Romagna region but, as a result of the national and regionalpublic costs spending review, such districts were abolished. From this grouping, weobtained the total of adult residents for each district listed in columns 2 and 3 ofTable 1.
The calculation of sample size was determined through the formula:
nd p p z
dp p z
N
=+ −
+−
( / ) ( )
( / )( )
/
/
2 1
21
22
2
2 22α
α
A Citizen-satisfaction survey in Rimini 55
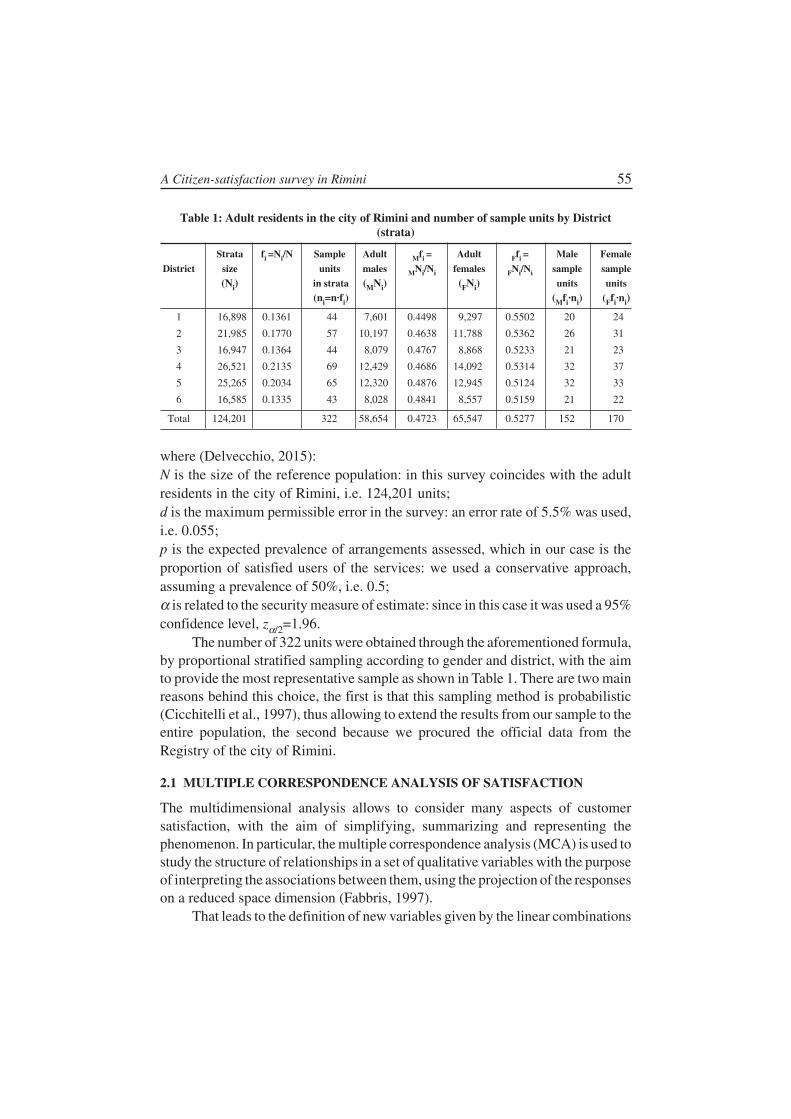
where (Delvecchio, 2015):N is the size of the reference population: in this survey coincides with the adultresidents in the city of Rimini, i.e. 124,201 units;d is the maximum permissible error in the survey: an error rate of 5.5% was used,i.e. 0.055;p is the expected prevalence of arrangements assessed, which in our case is theproportion of satisfied users of the services: we used a conservative approach,assuming a prevalence of 50%, i.e. 0.5;α is related to the security measure of estimate: since in this case it was used a 95%confidence level, zα/2=1.96.
The number of 322 units were obtained through the aforementioned formula,by proportional stratified sampling according to gender and district, with the aimto provide the most representative sample as shown in Table 1. There are two mainreasons behind this choice, the first is that this sampling method is probabilistic(Cicchitelli et al., 1997), thus allowing to extend the results from our sample to theentire population, the second because we procured the official data from theRegistry of the city of Rimini.
2.1 MULTIPLE CORRESPONDENCE ANALYSIS OF SATISFACTION
The multidimensional analysis allows to consider many aspects of customersatisfaction, with the aim of simplifying, summarizing and representing thephenomenon. In particular, the multiple correspondence analysis (MCA) is used tostudy the structure of relationships in a set of qualitative variables with the purposeof interpreting the associations between them, using the projection of the responseson a reduced space dimension (Fabbris, 1997).
That leads to the definition of new variables given by the linear combinations
Table 1: Adult residents in the city of Rimini and number of sample units by District(strata)
Strata fi =Ni/N Sample Adult Mfi = Adult Ffi = Male Female
District size units males MNi/Ni females FNi/Ni sample sample
(Ni) in strata (MNi) (FNi) units units
(ni=n·fi) (Mfi·ni) (Ffi·ni)
1 16,898 0.1361 44 7,601 0.4498 9,297 0.5502 20 24
2 21,985 0.1770 57 10,197 0.4638 11,788 0.5362 26 31
3 16,947 0.1364 44 8,079 0.4767 8,868 0.5233 21 23
4 26,521 0.2135 69 12,429 0.4686 14,092 0.5314 32 37
5 25,265 0.2034 65 12,320 0.4876 12,945 0.5124 32 33
6 16,585 0.1335 43 8,028 0.4841 8,557 0.5159 21 22
Total 124,201 322 58,654 0.4723 65,547 0.5277 152 170
56 Cusatelli C., Giacalone M., De Lorenzo A.
of the responses in the binary encoding of the Z disjunctive complete matrix, so asto maximize the projection of each of the column vectors on those new dimensions.The solution is given in terms of the eigenvalues λ and eigenvectors of the Burtmatrix B, in which the eigenvectors identify the directions of maximum elongationof the cloud of points and the eigenvalues measure the variability of the same cloudalong those directions. The new factors, used to represent the responses and thecases, are projected as points in the space factor perpendicular to each other, ascombinations of the responses included in the analysis, each showing the maximumdispersion B, in descending order. The sum of eigenvalues (so-called total inertia)is equal to the trace of B: it follows that the ratios λi / ∑λi between each eigenvalueand the trace are the proportions of dispersion reproduced from the correspondingfactor. If the values are close, there is a high association between the modes of thevariables (correlation), whereas if they are distant, there is a high dispersionbetween such modes (discrimination).
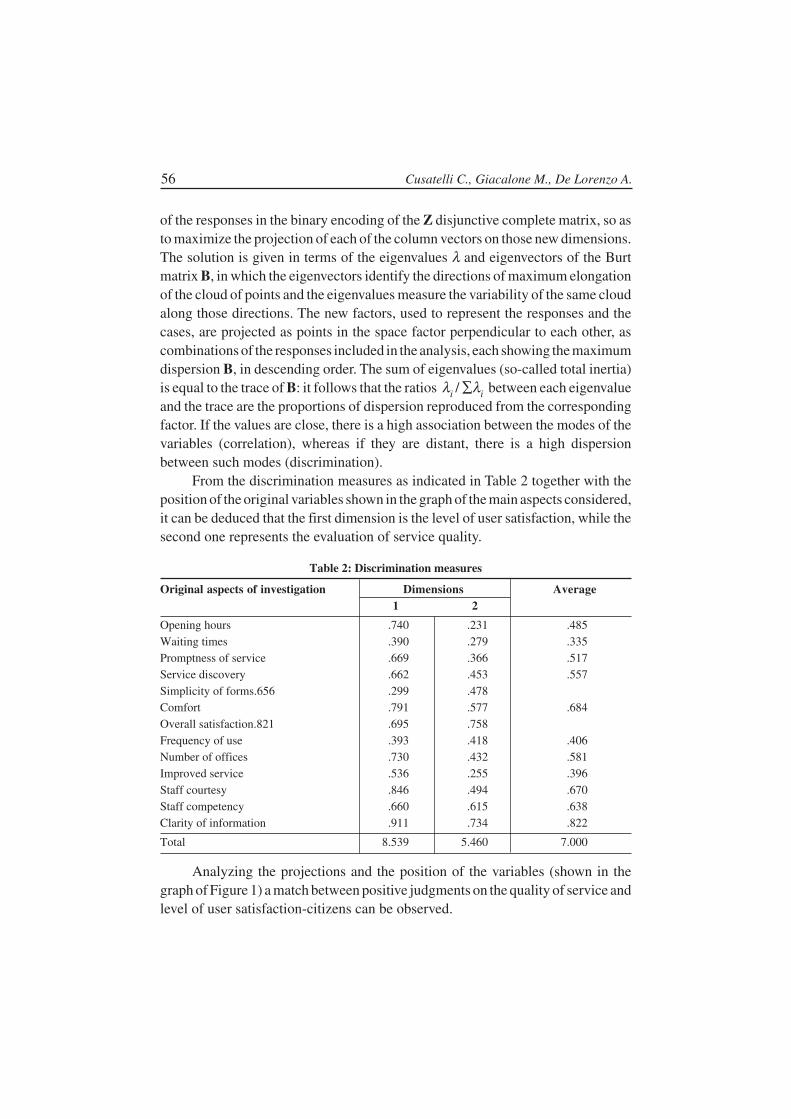
From the discrimination measures as indicated in Table 2 together with theposition of the original variables shown in the graph of the main aspects considered,it can be deduced that the first dimension is the level of user satisfaction, while thesecond one represents the evaluation of service quality.
Table 2: Discrimination measures
Original aspects of investigation Dimensions Average1 2
Opening hours .740 .231 .485Waiting times .390 .279 .335Promptness of service .669 .366 .517Service discovery .662 .453 .557Simplicity of forms.656 .299 .478Comfort .791 .577 .684Overall satisfaction.821 .695 .758Frequency of use .393 .418 .406Number of offices .730 .432 .581Improved service .536 .255 .396Staff courtesy .846 .494 .670Staff competency .660 .615 .638Clarity of information .911 .734 .822
Total 8.539 5.460 7.000
Analyzing the projections and the position of the variables (shown in thegraph of Figure 1) a match between positive judgments on the quality of service andlevel of user satisfaction-citizens can be observed.

A Citizen-satisfaction survey in Rimini 57
This relates to the elements of staff courtesy, clarity and competency,confirming that the human aspect is what matters most in quantifying the qualityof public service and therefore the level of satisfaction of the customers includingvariables such as waiting times, improved service, opening times and promptnessof service have a high value of discrimination on the first dimension, much greaterthan that associated with the second dimension, showing a misalignment betweenquality and level of satisfaction.
The average of the discrimination measures for each dimension is equal to itseigenvalue, expressed in terms of the total explained variance (Table 3): dimensionsare ordered according to descending eigenvalues, for which the first dimensioncorresponds to the highest average discrimination, and so on.
Figure 1: Response scores
Table 3: Eigenvalues summary
Dimension Cronbach Alfa Explained variance
Total (eigenvalue) Inertia
1 .956 8.539 .6572 .885 5.460 .420
Total 13.999 1.077
Average .929 7.000 .538
Since the quantifications of the categories are the average scores of objectsgrouped in that category, Figure 1 shows associations between responses of thevarious variables, with position determined on the basis of their coordinates relative
Qua
lity
of s
ervi
ce
Level of satisfaction
SexAgeProfessionOpening hoursWaiting timesClarity of the informationCompetence of staffCourtesy of staffService discoverySimplicity of formsComfortable environmentOverall satisfactionFrequency of useNumber of officesImproved serviceSpeed of delivery

58 Cusatelli C., Giacalone M., De Lorenzo A.
to the identified dimensions.The respondents who are in the positive part of first semi-axis form a very
homogeneous group. Their profile is primarily female belonging to a central ageband (20-60 years), expressing a mainly positive satisfaction level concerning thehuman aspect of the service received in terms of public administration staff courtesyand competency.
The respondents who are in the negative part of first semi-axis result in aheterogeneous group among themselves. They consist of young (<20 years) orelderly (>60 years) males who appear to be totally or moderately dissatisfied,mainly for the disservice received in terms of waiting times, promptness of serviceand clarity of forms.
2.2 CLUSTER ANALYSIS
The aim was to classify the 322 users on the basis of the perceived quality of publicservices, in order to identify critical aspects of the level of satisfaction to be treateddifferently. In this analysis, the Euclidean distance measure with aggregationcriterion of Ward were chosen (Gherghi et al., 2011).
The phases of this study, have at first involved the evaluation of the optimalnumber of groups in which the population under study were divided in (Table 4).
Table 4: Distances between groups for solutions from 1 to 10
Cluster Distance between groups % change of the distance(absolute value) compared to the preceding stage
10 46.877 10.30
9 60.136 10.708 70.146 11.097 78.156 12.366 118.069 16.625 210.277 25.384 251.077 24.173 1151.446 89.262 2251.393 92.221 4422.432 94.24
Passing from group 4 to group 3, a considerable increase of distance can beobserved; in other words it should join the groups that are very distant from eachother and thus the optimal number of clusters is equal to 4, consisting of 149customers in cluster 1, 57 customers in cluster 2, 28 customers in cluster 3, 87customers in cluster 4, that have similar levels of satisfaction and are different fromthe other groups (given by the Ward criterion).

A Citizen-satisfaction survey in Rimini 59
To understand their pattern, and therefore characterize the profiles of thecitizens-consumers, an analysis of the partial distributions to which the differentgroups were associated was made according to the different variables in thequestionnaire.
The first group (Table 5) is the largest and represents 46.4% of the total; it ismade up of respondents with a high level of education who are mainly professionals,age included in the two central bands, and a lesser presence of women if comparedto the whole sample. This group generally focuses on a level of positive opinionfeedback, and are absolutely positive only on factors such as clarity of informationand promptness of service (Table 6).
Table 5: Distributions of cluster 1 by gender, age and profession
Gender Frequency Percentage
Females 77 51.6Males 72 48.4
Age20-35 14 9.736-45 67 45.246-60 54 35.5> 60 14 9.7
ProfessionFreelancer/Entrepreneur 134 90.3Self-employed 15 9.7
Total 149 100.0
Table 6: Response rates in cluster 1
Aspects of investigation Non- Negative Regular Positiveresponse feedback feedback feedback
Opening hours - - 11.1 93.5Waiting times - 22.6 3.2 74.2Promptness of service - - - 100.0Clarity of the information - - - 100.0Staff competency - - 12.9 87.1Staff courtesy - - 6.5 93.5Service discovery - 1.6 1.6 96.8Simplicity of forms - - 3.2 96.8Comfortable environment - - 3.2 96.8Overall satisfaction - - 3.2 96.8Frequency of use - - 3.2 96.8Number of offices - - 3.2 96.8Improved service - 12.9 - 87.1
60 Cusatelli C., Giacalone M., De Lorenzo A.
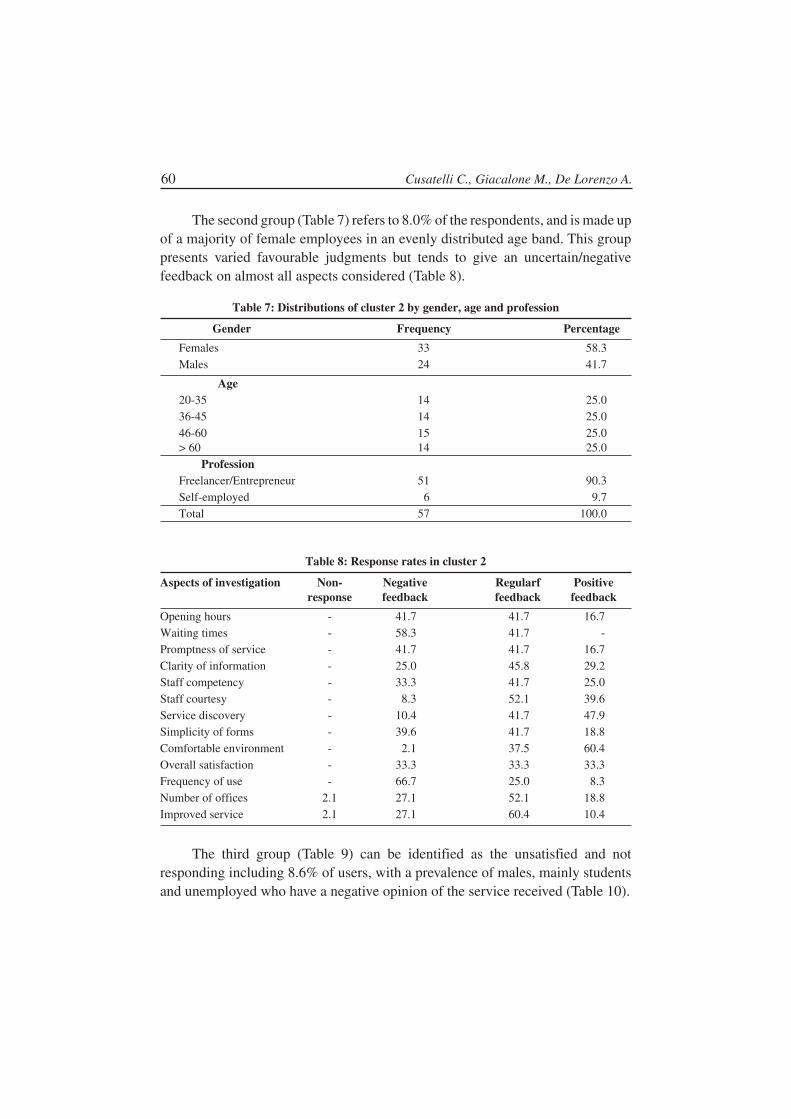
The second group (Table 7) refers to 8.0% of the respondents, and is made upof a majority of female employees in an evenly distributed age band. This grouppresents varied favourable judgments but tends to give an uncertain/negativefeedback on almost all aspects considered (Table 8).
Table 7: Distributions of cluster 2 by gender, age and profession
Gender Frequency Percentage
Females 33 58.3Males 24 41.7
Age20-35 14 25.036-45 14 25.046-60 15 25.0> 60 14 25.0
ProfessionFreelancer/Entrepreneur 51 90.3Self-employed 6 9.7Total 57 100.0
Table 8: Response rates in cluster 2
Aspects of investigation Non- Negative Regularf Positiveresponse feedback feedback feedback
Opening hours - 41.7 41.7 16.7Waiting times - 58.3 41.7 -Promptness of service - 41.7 41.7 16.7Clarity of information - 25.0 45.8 29.2Staff competency - 33.3 41.7 25.0Staff courtesy - 8.3 52.1 39.6Service discovery - 10.4 41.7 47.9Simplicity of forms - 39.6 41.7 18.8Comfortable environment - 2.1 37.5 60.4Overall satisfaction - 33.3 33.3 33.3Frequency of use - 66.7 25.0 8.3Number of offices 2.1 27.1 52.1 18.8Improved service 2.1 27.1 60.4 10.4
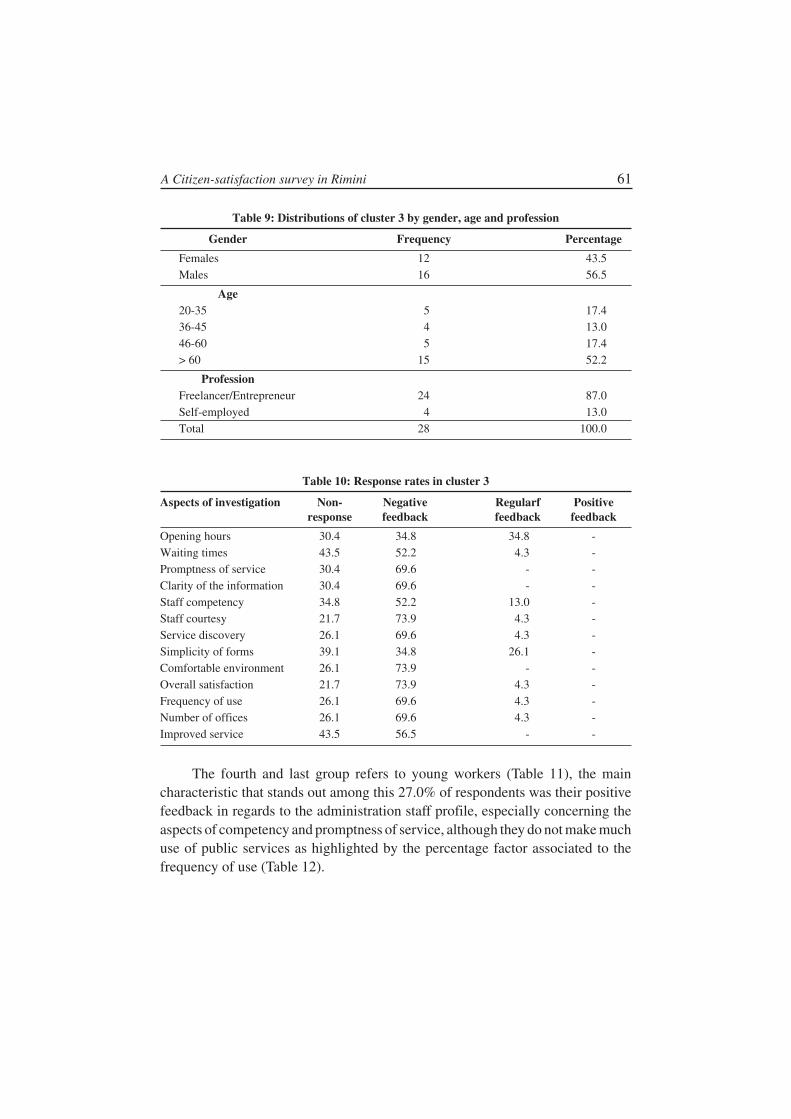
The third group (Table 9) can be identified as the unsatisfied and notresponding including 8.6% of users, with a prevalence of males, mainly studentsand unemployed who have a negative opinion of the service received (Table 10).
A Citizen-satisfaction survey in Rimini 61
Table 9: Distributions of cluster 3 by gender, age and profession
Gender Frequency Percentage
Females 12 43.5Males 16 56.5
Age20-35 5 17.436-45 4 13.046-60 5 17.4> 60 15 52.2
ProfessionFreelancer/Entrepreneur 24 87.0Self-employed 4 13.0Total 28 100.0
Table 10: Response rates in cluster 3
Aspects of investigation Non- Negative Regularf Positiveresponse feedback feedback feedback
Opening hours 30.4 34.8 34.8 -Waiting times 43.5 52.2 4.3 -Promptness of service 30.4 69.6 - -Clarity of the information 30.4 69.6 - -Staff competency 34.8 52.2 13.0 -Staff courtesy 21.7 73.9 4.3 -Service discovery 26.1 69.6 4.3 -Simplicity of forms 39.1 34.8 26.1 -Comfortable environment 26.1 73.9 - -Overall satisfaction 21.7 73.9 4.3 -Frequency of use 26.1 69.6 4.3 -Number of offices 26.1 69.6 4.3 -Improved service 43.5 56.5 - -
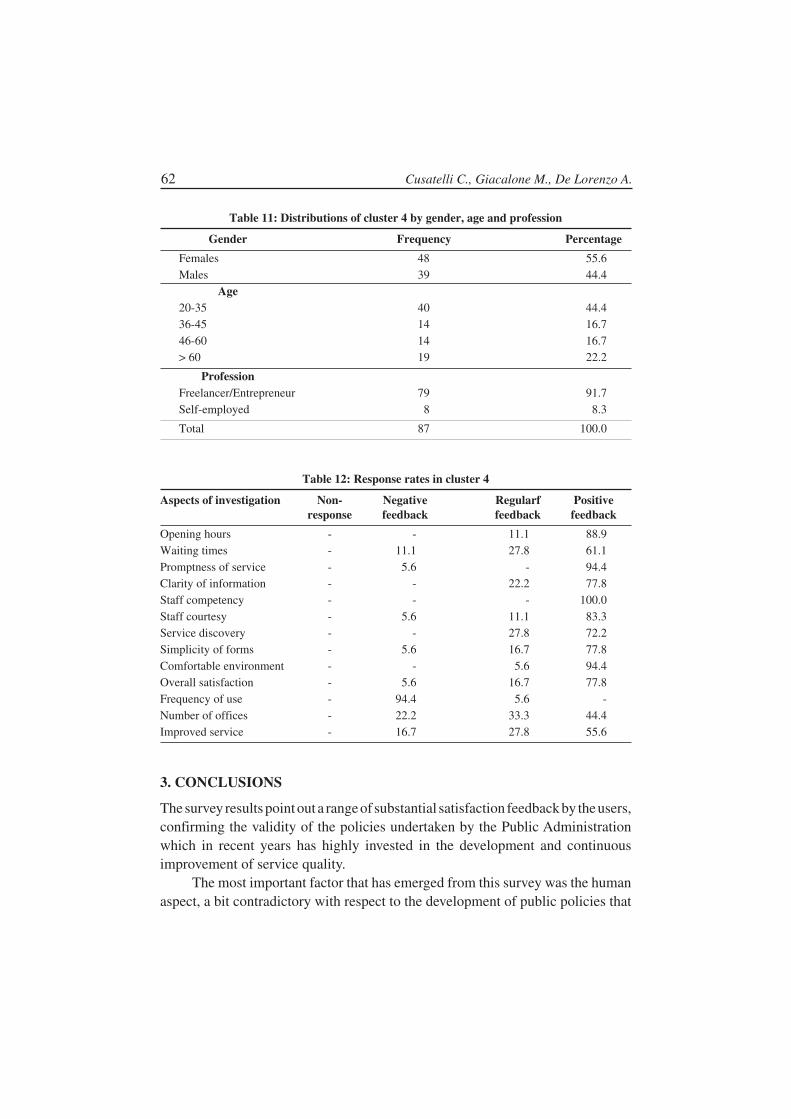
The fourth and last group refers to young workers (Table 11), the maincharacteristic that stands out among this 27.0% of respondents was their positivefeedback in regards to the administration staff profile, especially concerning theaspects of competency and promptness of service, although they do not make muchuse of public services as highlighted by the percentage factor associated to thefrequency of use (Table 12).
62 Cusatelli C., Giacalone M., De Lorenzo A.
Table 11: Distributions of cluster 4 by gender, age and profession
Gender Frequency Percentage
Females 48 55.6Males 39 44.4
Age20-35 40 44.436-45 14 16.746-60 14 16.7> 60 19 22.2
ProfessionFreelancer/Entrepreneur 79 91.7Self-employed 8 8.3
Total 87 100.0
Table 12: Response rates in cluster 4
Aspects of investigation Non- Negative Regularf Positiveresponse feedback feedback feedback
Opening hours - - 11.1 88.9Waiting times - 11.1 27.8 61.1Promptness of service - 5.6 - 94.4Clarity of information - - 22.2 77.8Staff competency - - - 100.0Staff courtesy - 5.6 11.1 83.3Service discovery - - 27.8 72.2Simplicity of forms - 5.6 16.7 77.8Comfortable environment - - 5.6 94.4Overall satisfaction - 5.6 16.7 77.8Frequency of use - 94.4 5.6 -Number of offices - 22.2 33.3 44.4Improved service - 16.7 27.8 55.6
3. CONCLUSIONS
The survey results point out a range of substantial satisfaction feedback by the users,confirming the validity of the policies undertaken by the Public Administrationwhich in recent years has highly invested in the development and continuousimprovement of service quality.
The most important factor that has emerged from this survey was the humanaspect, a bit contradictory with respect to the development of public policies that
A Citizen-satisfaction survey in Rimini 63
in recent years have aimed only to introduce computerized systems to improve thequality of service. In conclusion, the Administration should both continue innovatingonline service, but also take concrete steps towards a political development throughstaff updating and training, while increasing the awareness of the importance oftheir role in citizen-user satisfaction, and consequentially rendering the quality ofservice provided the final purpose of their responsibilities.
REFERENCES
Bezzi, C. (2007). Cos’è la valutazione. Un’introduzione ai concetti, le parole chiave e i problemimetodologici. Franco Angeli, Milano.
Cantieri, A. (2007). Customer satisfaction: a che punto siamo. Indagine sulle rilevazioni dellaqualità dei servizi percepita dagli utenti. Rubbettino, Soveria Mannelli.
Cicchitelli, G., Herzel, A., Montanari, G.E. (1997). Il Campionamento Statistico. Il Mulino,Bologna.
Delvecchio, F. (2015). Statistica per lo studio dei fenomeni sociali. Cleup, Padova.
Fabbris, L. (1997). Statistica multivariata - analisi esplorativa dei dati. McGraw-Hill Education(Italy), Milano.
Fontana, F. and Rossi, M. (2005). La rilevazione della customer satisfaction negli enti locali. Halley,Matelica.
Gherghi, M., Lauro, C. (2011). Appunti di Analisi dei Dati Multidimensionali, metodologia edesempi. RCE Multimedia, Napoli.
Gramigna, A. (2005). Amministrazioni in ascolto. Esperienze di customer satisfaction nelleamministrazioni pubbliche. Edizioni Scientifiche Italiane, Napoli.
Margheri, A. (2002). Qualità e customer satisfaction negli enti pubblici. Cedam, Padova.
Zanella, A. (2002). Qualità, normativa e certificazione: il ruolo della statistica. Carocci, Roma.
Zani, S., Cerioli, A. (2007). Analisi dei dati e data mining per le decisioni aziendali. Giuffrè, Milano.