city and county of honolulu · source: city and county of honolulu, department of environmental...
TRANSCRIPT
City and County of HonoluluWastewater System Revenue BondsInvestor Presentation
July 19, 2012
Timothy Houghton, Executive Assistant, City and County of Honolulu, Department of Environmental Services

1
Wastewater System Overview
The Department serves nine wastewater basins on the island of Oahu
Service Area: Nearly 600 sq. miles
Population Served: Approximately 640,000 (73% of the City and County)*
Customer Accounts: Approximately 144,400 (95% of which are residential)
Major Facilities:
9 wastewater treatment plants (combined FY 2012 average flow of 100 MGD)
70 pump stations
Approximately 2,100 miles of collection lines
N
S
EW
Each of the Department’s 10 treatment facilities has adequate capacity to meet projected flows
____________________Source: City and County of Honolulu, Department of Environmental Services. As of June 30, 2011.* As of 2010 census.
2
Treatment Plants
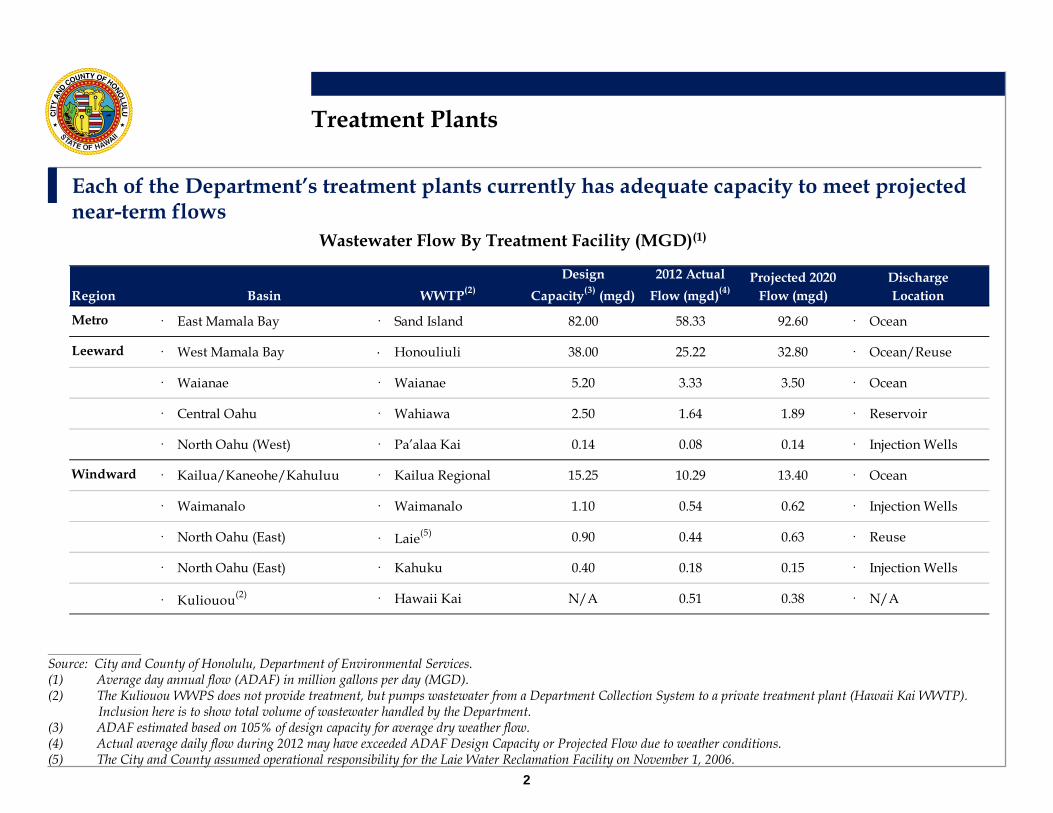
Each of the Department’s treatment plants currently has adequate capacity to meet projected near-term flows
Region Basin WWTP(2)Design
Capacity(3) (mgd)2012 Actual
Flow (mgd)(4)Projected 2020
Flow (mgd)Discharge Location
Metro · East Mamala Bay · Sand Island 82.00 58.33 92.60 · Ocean
Leeward · West Mamala Bay · Honouliuli 38.00 25.22 32.80 · Ocean/Reuse
· Waianae · Waianae 5.20 3.33 3.50 · Ocean
· Central Oahu · Wahiawa 2.50 1.64 1.89 · Reservoir
· North Oahu (West) · Pa’alaa Kai 0.14 0.08 0.14 · Injection Wells
Windward · Kailua/Kaneohe/Kahuluu · Kailua Regional 15.25 10.29 13.40 · Ocean
· Waimanalo · Waimanalo 1.10 0.54 0.62 · Injection Wells
· North Oahu (East) · Laie(5) 0.90 0.44 0.63 · Reuse
· North Oahu (East) · Kahuku 0.40 0.18 0.15 · Injection Wells
· Kuliouou(2) · Hawaii Kai N/A 0.51 0.38 · N/A
Wastewater Flow By Treatment Facility (MGD)(1)
____________________Source: City and County of Honolulu, Department of Environmental Services. (1) Average day annual flow (ADAF) in million gallons per day (MGD).(2) The Kuliouou WWPS does not provide treatment, but pumps wastewater from a Department Collection System to a private treatment plant (Hawaii Kai WWTP).
Inclusion here is to show total volume of wastewater handled by the Department. (3) ADAF estimated based on 105% of design capacity for average dry weather flow.(4) Actual average daily flow during 2012 may have exceeded ADAF Design Capacity or Projected Flow due to weather conditions.(5) The City and County assumed operational responsibility for the Laie Water Reclamation Facility on November 1, 2006.

137.0136.6136.0134.5133.9133.0132.1131.7130.2128.8
7.47.57.57.77.77.87.47.47.3
6.9
100.0
105.0
110.0
115.0
120.0
125.0
130.0
135.0
140.0
145.0
150.0
Thou
sand
s
Residential Non-Residential
Fiscal Year
135.7137.5 139.1 139.5 140.9 141.6 142.2 143.5 144.1 144.4
2003 2004 2005 2006 2007 2008 2009 2010 2011 2012
3
Historical Customer Base
The Department’s customer base is predominately residential and stable
Historical Accounts by Customer Type FY 2003 to 2012
Growth in Equivalent Single-Family Dwelling Units is projected at 0.5% per annum through 2035, and it is not a significant driver of projected revenues or capital needs
____________________Source: City and County of Honolulu, Department of Environmental Services.
4
Diversity of Customer Base
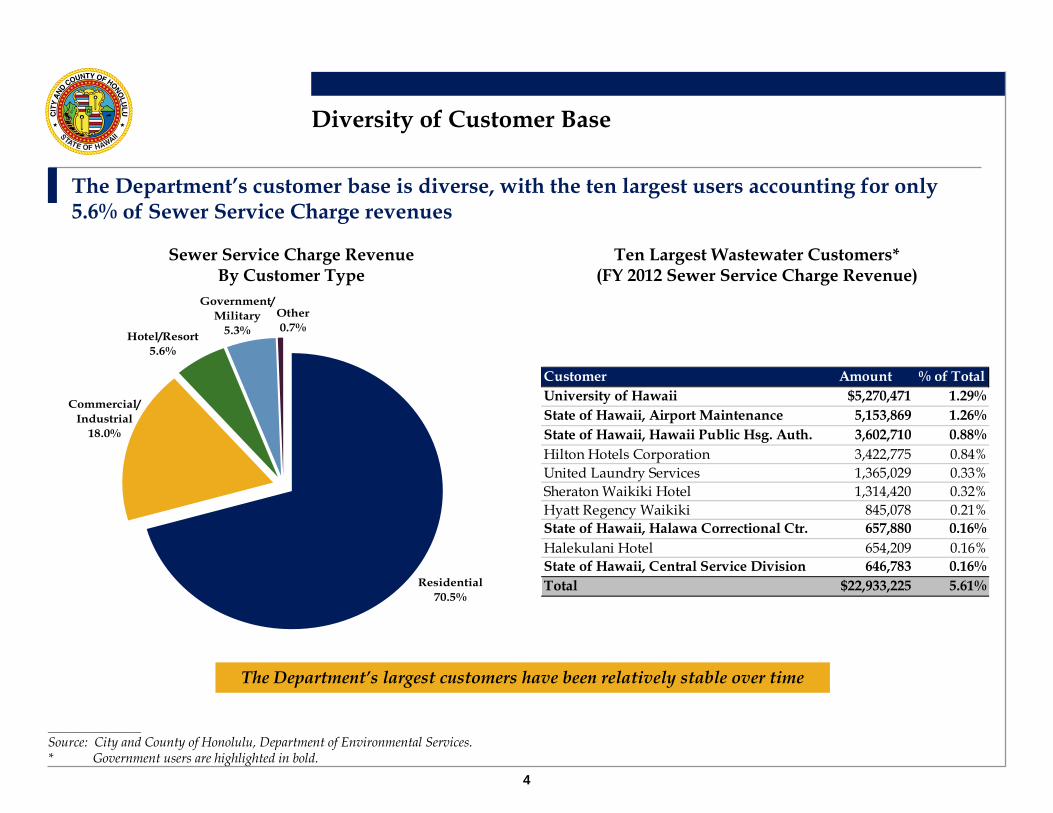
The Department’s customer base is diverse, with the ten largest users accounting for only 5.6% of Sewer Service Charge revenues
Ten Largest Wastewater Customers*(FY 2012 Sewer Service Charge Revenue)
Sewer Service Charge Revenue By Customer Type
The Department’s largest customers have been relatively stable over time
Customer Amount % of TotalUniversity of Hawaii $5,270,471 1.29%State of Hawaii, Airport Maintenance 5,153,869 1.26%State of Hawaii, Hawaii Public Hsg. Auth. 3,602,710 0.88%Hilton Hotels Corporation 3,422,775 0.84%United Laundry Services 1,365,029 0.33%Sheraton Waikiki Hotel 1,314,420 0.32%Hyatt Regency Waikiki 845,078 0.21%State of Hawaii, Halawa Correctional Ctr. 657,880 0.16%Halekulani Hotel 654,209 0.16%State of Hawaii, Central Service Division 646,783 0.16%Total $22,933,225 5.61%
____________________Source: City and County of Honolulu, Department of Environmental Services. * Government users are highlighted in bold.
Other0.7%
Government/Military
5.3%Hotel/Resort5.6%
Commercial/ Industrial
18.0%
Residential70.5%
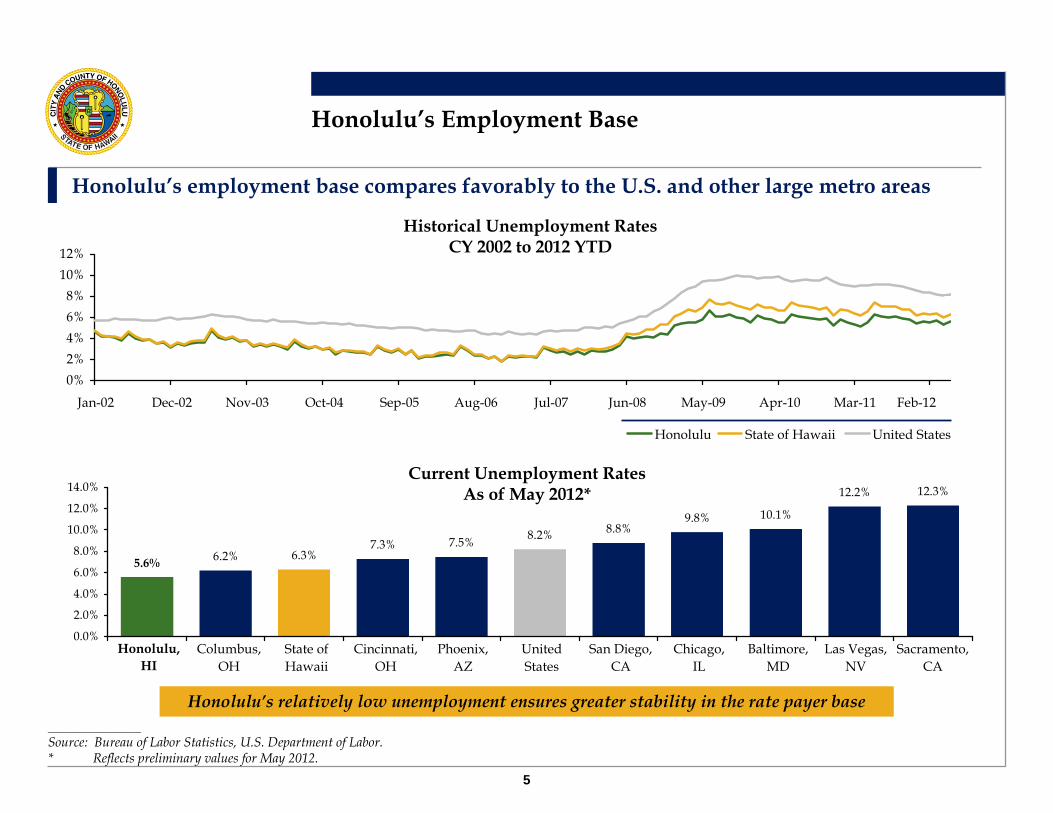
5.6% 6.2% 6.3%7.3% 7.5% 8.2% 8.8%
9.8% 10.1%
12.2% 12.3%
0.0%
2.0%
4.0%
6.0%
8.0%
10.0%
12.0%
14.0%
Honolulu, HI
Columbus, OH
State of Hawaii
Cincinnati, OH
Phoenix, AZ
United States
San Diego, CA
Chicago, IL
Baltimore, MD
Las Vegas, NV
Sacramento, CA
0%2%4%6%8%
10%12%
Honolulu State of Hawaii United States
Jan-02 Dec-02 Nov-03 Oct-04 Sep-05 Aug-06 Jul-07 Jun-08 May-09 Apr-10 Mar-11 Feb-12
5
Honolulu’s Employment Base
Honolulu’s employment base compares favorably to the U.S. and other large metro areas
Historical Unemployment Rates CY 2002 to 2012 YTD
Honolulu’s relatively low unemployment ensures greater stability in the rate payer base
Current Unemployment Rates As of May 2012*
____________________Source: Bureau of Labor Statistics, U.S. Department of Labor. * Reflects preliminary values for May 2012.
6
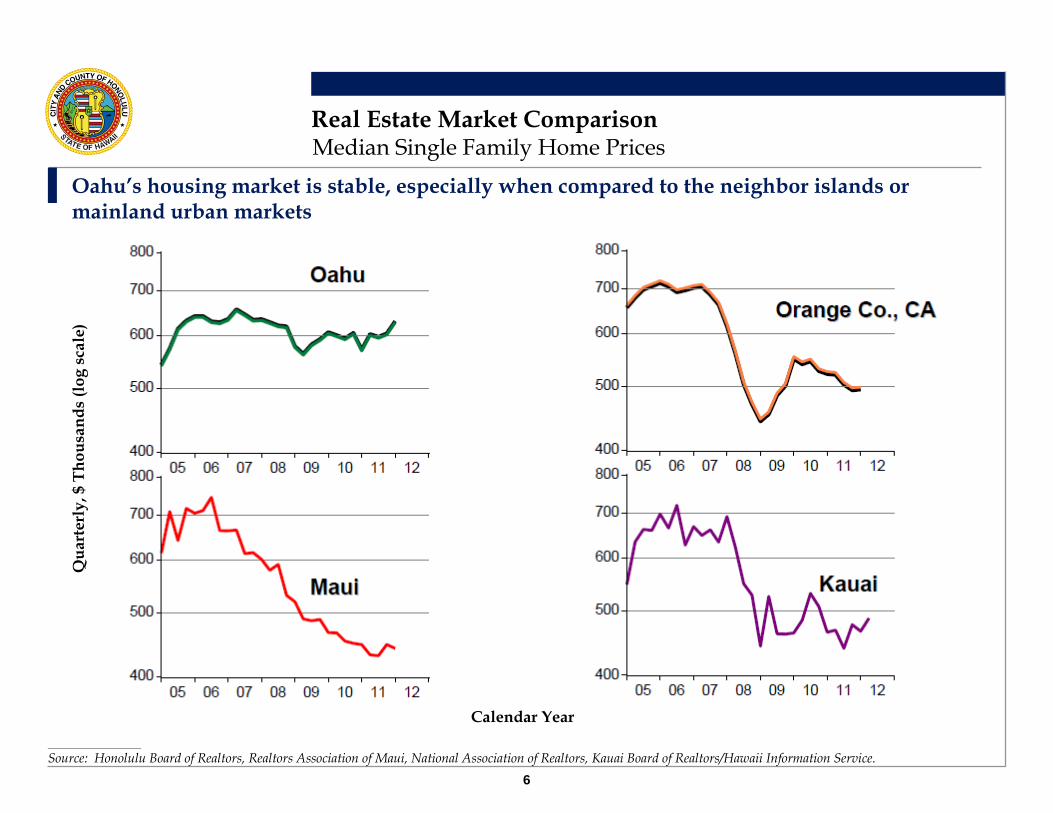
Real Estate Market ComparisonMedian Single Family Home Prices
Oahu’s housing market is stable, especially when compared to the neighbor islands or mainland urban markets
____________________Source: Honolulu Board of Realtors, Realtors Association of Maui, National Association of Realtors, Kauai Board of Realtors/Hawaii Information Service.
Calendar Year
Qua
rter
ly, $
Tho
usan
ds (l
og s
cale
)

0.48%
0.36%0.35%
0.30%
0.24%0.23%0.21%
0.15%
0.11%
0.04%0.03%0.01%
0.00%
0.10%
0.20%
0.30%
0.40%
0.50%
0.60%
Honolulu, HI
State of Hawaii
Baltimore, MD (1)
Portland, OR (2)
United States
Cincinnati, OH (3)
San Diego, CA
Columbus, OH (4)
Chicago, IL
Phoenix, AZ
Las Vegas, NV
Sacramento, CA
7
Stability of Honolulu’s Housing Base
Honolulu’s foreclosure rates are lower than many comparable large metropolitan areas
Foreclosure Comparison (Per Total Homes)As of June 2012
Honolulu has a strong culture of financial responsibility____________________Source: www.realtytrac.com.(1) Reflects Baltimore County.(2) Reflects Multnomah County. (3) Reflects Hamilton County.(4) Reflects Franklin County.
8
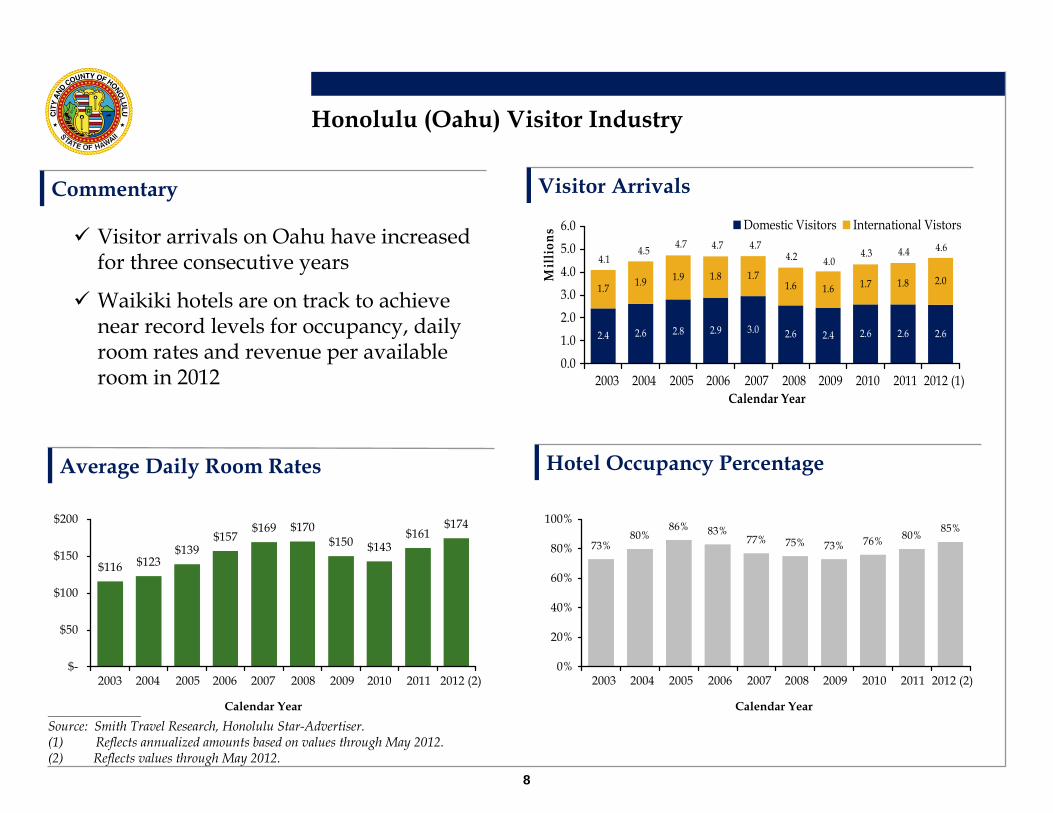
Honolulu (Oahu) Visitor Industry
Average Daily Room Rates Hotel Occupancy Percentage
Commentary Visitor Arrivals
Visitor arrivals on Oahu have increased for three consecutive years
Waikiki hotels are on track to achieve near record levels for occupancy, daily room rates and revenue per available room in 2012
____________________Source: Smith Travel Research, Honolulu Star-Advertiser.(1) Reflects annualized amounts based on values through May 2012. (2) Reflects values through May 2012.
2.4 2.6 2.8 2.9 3.0 2.6 2.4 2.6 2.6 2.6
1.7 1.9 1.9 1.8 1.71.6 1.6 1.7 1.8 2.0
0.0
1.0
2.0
3.0
4.0
5.0
6.0
Mill
ions
Domestic Visitors International Vistors
Calendar Year
4.14.5 4.7 4.7 4.7
4.2 4.04.3 4.4 4.6
2003 2004 2005 2006 2007 2008 2009 2010 2011 2012 (1)
73%80%
86% 83%77% 75% 73% 76% 80% 85%
0%
20%
40%
60%
80%
100%
2003 2004 2005 2006 2007 2008 2009 2010 2011 2012 (2)
$116 $123$139
$157$169 $170
$150 $143$161
$174
$-
$50
$100
$150
$200
2003 2004 2005 2006 2007 2008 2009 2010 2011 2012 (2)
Calendar Year Calendar Year

60.05%26.04%
3.19%5.01% 5.72%
Future Revenue Bonds Net RevenuesFacility Charges Subordinate Obligations2012 Revenue Bonds
3.30%3.71%
34.10%
58.89%
9
Funding Sources for Long-Term CIP
The Department projects a mix of funding sources to meet CIP requirements*
FY 2018-2020 AppropriationsFY 2013-2017 Appropriations
The Department obtained $142 million in low-cost State Revolving Fund (“SRF”) loans over the past three fiscal years (including $30.9 million in FY 2011), has a commitment for an additional $67 million
in FY 2012, and anticipates $10 million per year thereafter____________________Source: City and County of Honolulu, Department of Environmental Services.* Preliminary, subject to change.
Total: $1,713,965,795 Total: $908,971,038

10
2010 Consent Decree
The First Amended Consent Decree provides the framework for implementation of the Department’s long-term CIP
Defines collection system and treatment plant improvements through 2035
Certainty, long-term stability and protection against future regulatory requirements
Provides timing of future capital and O&M expenditures
A set schedule for implementation of required improvements
Maximizes investments in already completed designs for collection system projects
Allows adequate time to complete value engineering assessments and to benefit potentially from advances in future treatment technologies
Priorities for implementation of critical collection system improvements over the first 10-years, followed by treatment plant upgrades over a long-term horizon
Protects against third-party actions
Simplifies and streamlines the coordination and implementation of future projects
Consolidation of all other outstanding Consent Orders and regulatory compliance actions
The Wastewater CIP becomes largely "non-discretionary“
Political impetus for future required rate increasesA legal basis for the required improvements
Benefits to CityConsent Decree Results

10.0%10.0%10.0%10.0%10.0%
25.0% 5.0%8.0%8.0%
15.0%
8.0%5.0%4.0%4.0%4.0%4.0%
0.0%
5.0%
10.0%
15.0%
20.0%
25.0%
30.0%
Adopted in June 2005 Adopted in June 2007 Adopted in July 2011
Fiscal Year2006 2007 2008 2009 2010 2011 2012 2013 2014 2015 2016 2017
11
Historical Sewer Service Charges
The City has demonstrated its strong commitment to the Wastewater System by repeatedly passing and implementing multi-year rate increases
Adopted Sewer Service Charge Increases
The City has adjusted rates as needed to meet funding requirements for its 20-year Capital Improvement Program – including those projects mandated in its 2010 Consent Decree with the United States EPA
____________________Source: City and County of Honolulu, Department of Environmental Services.
FY 2006 to 2017

$-
$50.0
$100.0
$150.0
$200.0
$250.0
$300.0
$350.0
$400.0
Mill
ions
Sewer Service Charges Interest Earnings Wastewater System Facility Charges*
Fiscal Year
2002 2003 2004 2005 2006 2007 2008 2009 2010 2011
$118.5 $117.7 $116.5 $119.7
$155.2$179.4
$243.0$258.9
$307.1
$348.0
12
Predictability of Rates and Revenues
The monthly Base Charge comprises approximately 70% of Sewer Service Charge revenues
System Revenues by Major Component
____________________Source: City and County of Honolulu, Department of Environmental Services. * Wastewater System Facility Charges are not included in Revenues when calculating debt service coverage on Senior and Subordinate Obligations.
FY 2002 to 2011

13
Comparative Utility Rates
Honolulu’s water & wastewater rates compare favorably to other metropolitan utilities
____________________Source: Respective utility websites.* Monthly bill figures are current for calendar year 2012 or FYE 2013. Comparison of residential water & wastewater bills is based on minimum meter size and
average billable flows of 10,000 gallons per month or 13 hundred cubic feet (HCF).
$77.71$70.85$73.51$69.24$58.99$69.56
$37.01$43.32$45.32$31.80
$192.31
$142.77$113.13
$109.22
$75.55$63.43
$94.90$83.87$72.05$75.56
$-
$50.00
$100.00
$150.00
$200.00
$250.00
$300.00
Monthly Water Bill Monthly Wastewater Bill
$107.36$117.37
$127.19 $131.91 $132.99 $134.54
$178.46$186.65
$213.62
$270.02
Detroit, MI
New York City, NY
Austin, TX Honolulu, HI
San Diego, CA
Boston, MA
Portland, OR
San Francisco, CA
Seattle, WA
Atlanta, GA
Average Monthly Residential Bill*
0.80%0.79%0.83%0.90%0.97%
0.00%
0.50%
1.00%
1.50%
2.00%
2.50%
3.00%
3.50%
4.00%
4.50%
5.00%
Fiscal Year
Average: 0.84%
2008 2009 2010 2011 2012
14
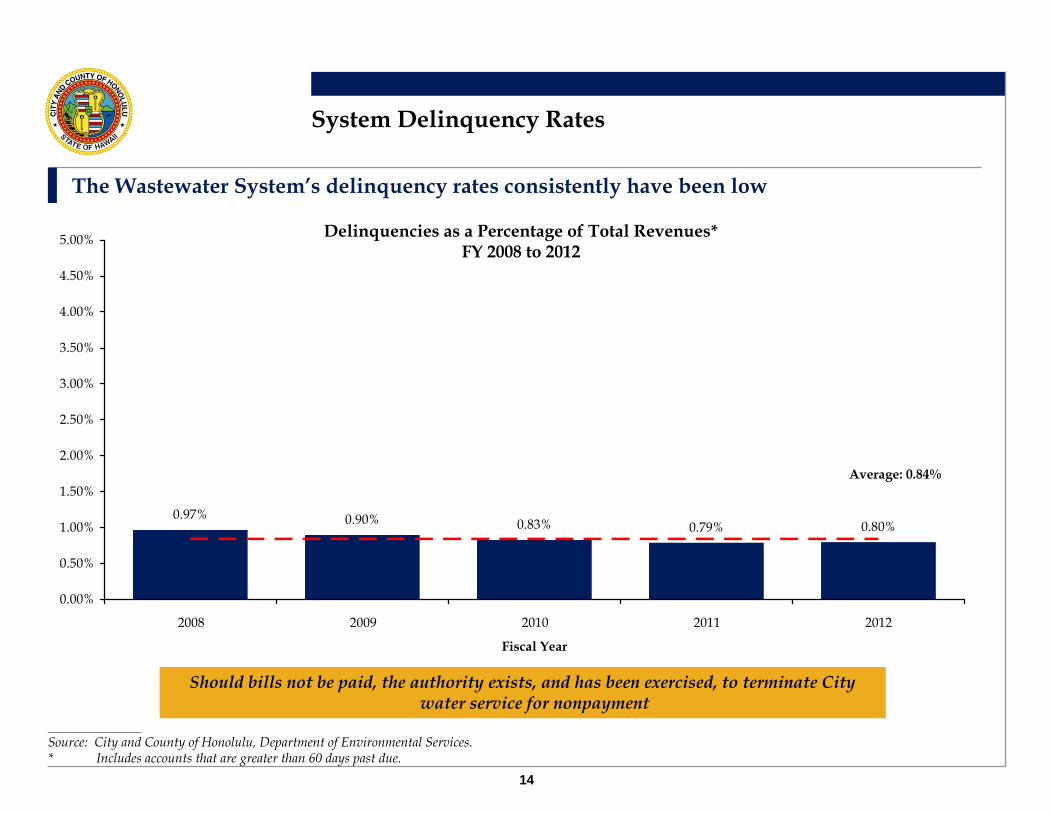
System Delinquency Rates
The Wastewater System’s delinquency rates consistently have been low
Delinquencies as a Percentage of Total Revenues* FY 2008 to 2012
Should bills not be paid, the authority exists, and has been exercised, to terminate City water service for nonpayment
____________________Source: City and County of Honolulu, Department of Environmental Services.* Includes accounts that are greater than 60 days past due.
0.00x
2.00x
4.00x
6.00x
Coverage Ratio Policy Target (1.60x) Legal Requirement (1.20x)
2009 2010 2011 2012 2013 2014 2015 2016
0.00x
1.00x
2.00x
3.00x
4.00x
Coverage Ratio Policy Target (1.25x) Legal Requirement (1.10x)
2009 2010 2011 2012 2013 2014 2015 2016Fiscal Year
15
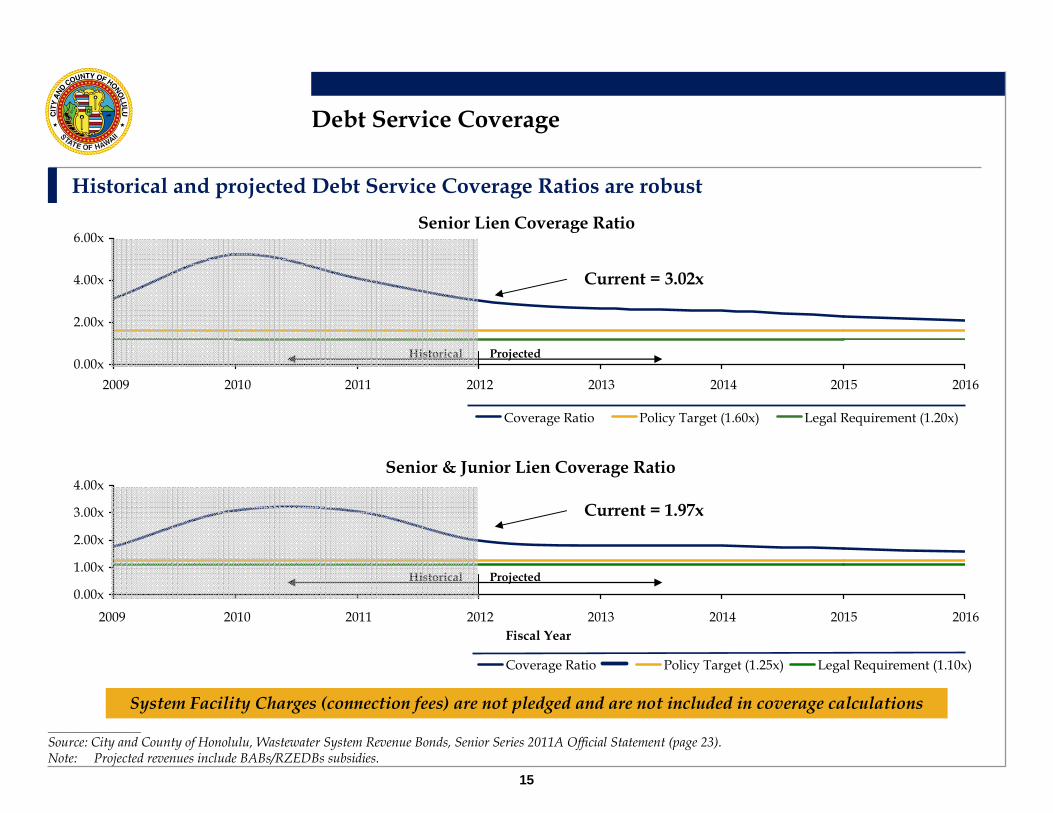
Debt Service Coverage
Historical and projected Debt Service Coverage Ratios are robustSenior Lien Coverage Ratio
Senior & Junior Lien Coverage Ratio
Current = 1.97x
System Facility Charges (connection fees) are not pledged and are not included in coverage calculations
Current = 3.02x
____________________Source: City and County of Honolulu, Wastewater System Revenue Bonds, Senior Series 2011A Official Statement (page 23).Note: Projected revenues include BABs/RZEDBs subsidies.
Historical Projected
Historical Projected

$241.1$260.9
$140.9
$41.5
$34.5$26.1
$26.3
$28.7
$69.1$60.1
$51.7
$46.8
$114.9$100.6
$93.8
$86.7
$0.0
$50.0
$100.0
$150.0
$200.0
$250.0
$300.0
$350.0
$400.0
$450.0
$500.0
Mill
ions
Fiscal Year
Unrestricted Reserve (1) Operating Reserve (2) Bond Payment Account (3) Common and Series DSRFs (4)
$203.7
$312.7
$447.7 $459.6
2009 2010 2011 2012 (Budgeted)
16
System Reserves
Strong financial margins have allowed the Department to build liquidity
The Department has increased the use of net income for capital projects going forward____________________Source: City and County of Honolulu, Department of Environmental Services. (1) Equal to ending cash balance less operating and bond reserves. Includes federal BABs/RZEDBs subsidy in the rate stabilization fund.(2) Equal to 3 months of current year operating expenses (as required by policy).(3) Equal to 50 percent of following fiscal year’s debt service obligation (due July 1).(4) The amount shown represents cash deposits in the common and series debt service reserve funds.
$-
$50
$100
$150
$200
$250
$300
$350
$400
Mill
ions
O&M Debt Service (1) Revenues (2)
Fiscal Year
2002 2003 2004 2005 2006 2007 2008 2009 2010 2011
17
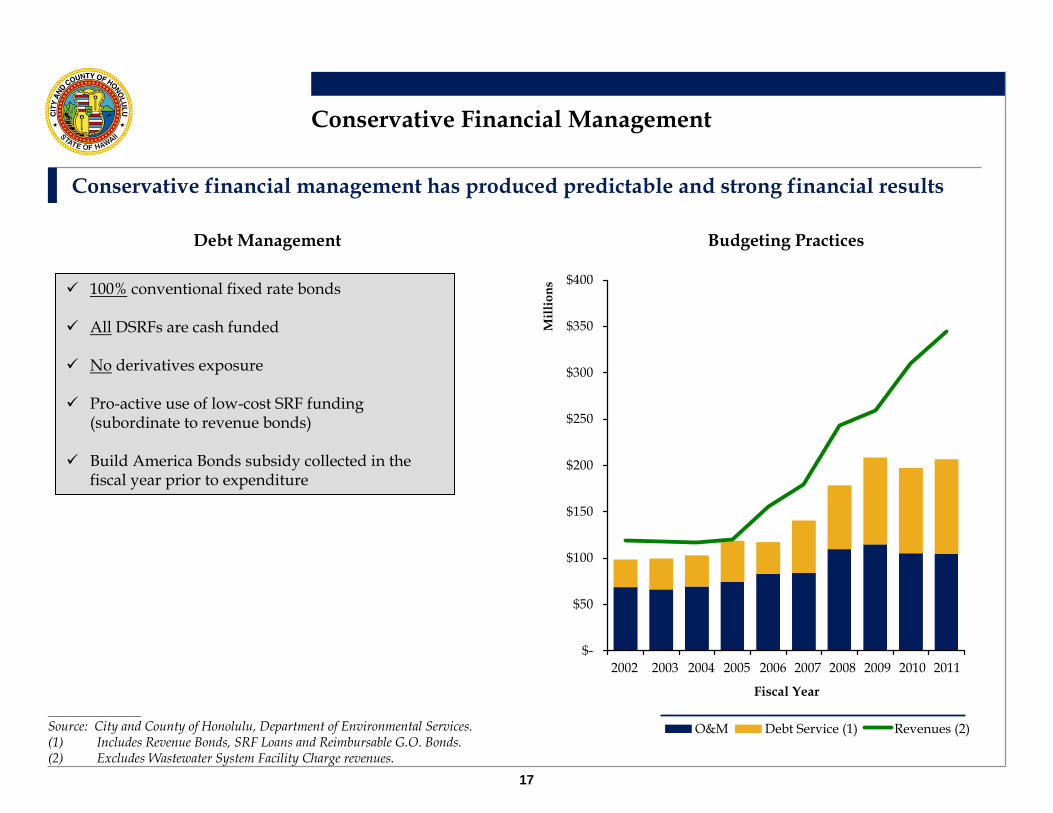
Conservative Financial Management
Conservative financial management has produced predictable and strong financial results
100% conventional fixed rate bonds
All DSRFs are cash funded
No derivatives exposure
Pro-active use of low-cost SRF funding (subordinate to revenue bonds)
Build America Bonds subsidy collected in the fiscal year prior to expenditure
Budgeting PracticesDebt Management
____________________Source: City and County of Honolulu, Department of Environmental Services. (1) Includes Revenue Bonds, SRF Loans and Reimbursable G.O. Bonds.(2) Excludes Wastewater System Facility Charge revenues.

18
Outstanding System Debt
Wastewater System Debt Service Profile
____________________Source: City and County of Honolulu, Department of Environmental Services. Note: Debt service shown is gross of BABs subsidy. SRF Loans as of September 2011. Reimbursable City G.O. bonds are outstanding in the amount of $1,275,799.
Fiscal Year
$-
$20
$40
$60
$80
$100
$120
$140
$160
Mill
ions
SRF Loans ($150,000,000)
Junior Lien Debt Service ($422,684,910)Senior Lien Debt Service ($1,170,430,000)
2013 2015 2017 2019 2021 2023 2025 2027 2029 2031 2033 2035 2037 2039 2041
19
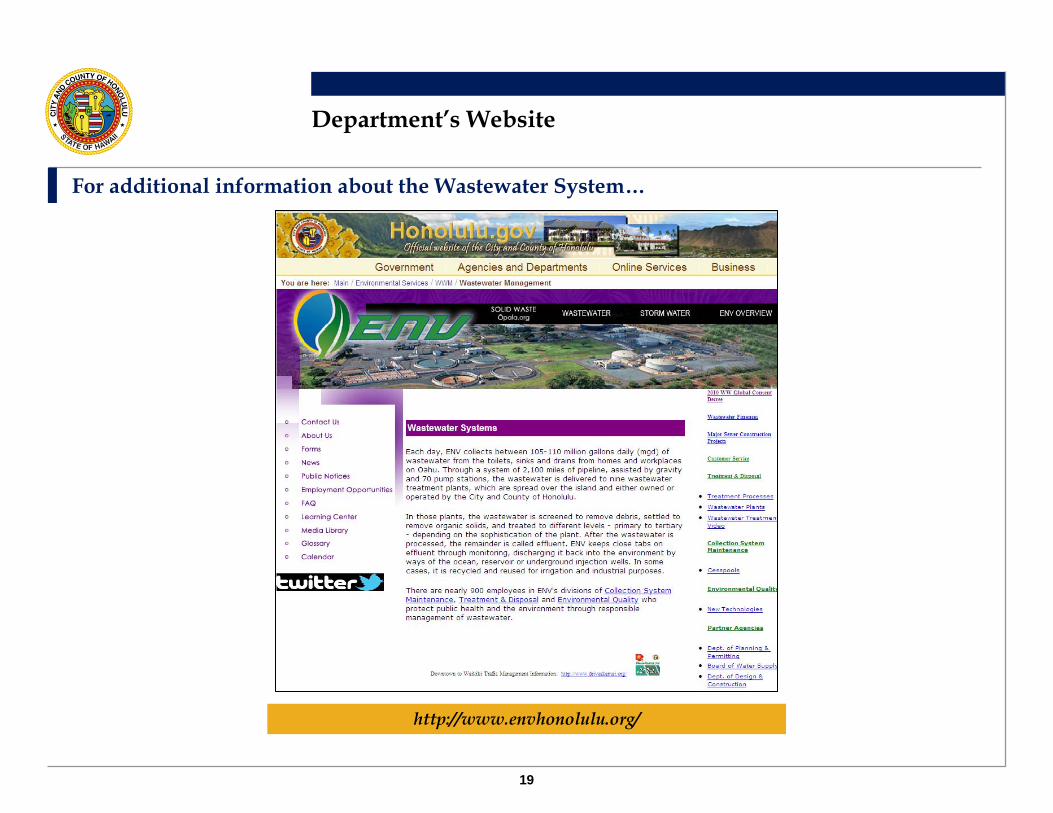
Department’s Website
For additional information about the Wastewater System…
http://www.envhonolulu.org/
20
Contact Information
Issuer
Mr. Frank LauterburManaging Director
Bank of America Merrill LynchTel: 213-345-9575
E-Mail: [email protected]
Investment Banking
Mr. Tim HoughtonExecutive Assistant
City and County of Honolulu(Department of Environmental Services)
Tel: 808-768-3475E-Mail: [email protected]
Department
Ms. Edlyn TaniguchiChief of Treasury
City and County of Honolulu(Department of Budget & Fiscal Services)
Tel: 808-768-3993E-Mail: [email protected]
City and County
Senior Manager