city of cocoa beach, florida rpts/2018 cocoa... · 2019. 11. 3. · port canaveral has a favorable...
TRANSCRIPT

City of Cocoa Beach, Florida
Comprehensive Annual Financial Report
Fiscal Year Ended
September 30, 2018
2 S. Orlando Avenue, Cocoa Beach, Florida 32931

COMPREHENSIVE
ANNUAL
FINANCIAL REPORT
City of Cocoa Beach, Florida
For the Fiscal Year Ended September 30, 2018
Prepared by: Finance Department

i
Intr
oduc
tory
Sec
tion
Table of Contents Letter of Transmittal
City Officials and Management Staff
City Organization Chart
Certificate of Achievement

Page intentionally blank
ii

City of Cocoa Beach, Florida Comprehensive Annual Financial Report
Table of Contents For the Year Ended September 30, 2018
Page
iii
INTRODUCTORY SECTION
Table of Contents iii Letter of Transmittal vii City Officials & Management Staff xv City Organization Chart xvi Certificate of Achievement xvii
FINANCIAL SECTION Independent Auditor’s Report 3 Management’s Discussion and Analysis 5 Basic Financial Statements:
Government-wide Financial Statements: Statement of Net Position 23 Statement of Activities 24
Fund Financial Statements: Balance Sheet - Governmental Funds 26 Statement of Revenues, Expenditures, and Changes in Fund
Balances - Governmental Funds 27 Reconciliation of the Statement of Revenues, Expenditures, and
Changes in Fund Balances of Governmental Funds to the Statement of Activities 29
Statement of Revenues, Expenditures, and Changes in Fund Balances - Budget and Actual - General Fund 30
Statement of Revenues, Expenditures, and Changes in Fund Balances – Budget and Actual – Community Redevelopment Agency Fund 33
Statement of Net Position - Proprietary Funds 34 Statement of Revenues, Expenses, and Changes in Fund Net
Position - Proprietary Funds 37 Statement of Cash Flows - Proprietary Funds 38 Statement of Fiduciary Net Position - Fiduciary Funds 40 Statement of Changes in Fiduciary Net Position - Fiduciary Funds 41 Notes to the Financial Statements 43
Required Supplementary Information (RSI): Schedule of Changes in Net Pension Liability and Related Ratios
(All Pension Plans) 96 Schedule of Pension Contributions (All Pension Plans) 96 Plan Changes in Benefit Terms 99 Changes of Assumptions 99

City of Cocoa Beach, Florida Comprehensive Annual Financial Report
Table of Contents For the Year Ended September 30, 2018
Page
iv
Methods and Assumptions Used to Determine Contribution Rates 99 Money-Weighted Rate of Return (All Pension Plans) 100 Schedule of Changes in Net OPEB Liability and Related Ratios 101 Schedule of City OPEB Contributions 102 Money-Weighted Rate of Return (OPEB Plan) 102
Other Supplemental Information: Combining Balance Sheet - Non-major Governmental Funds 104 Combining Statement of Revenues, Expenditures, and Changes
in Fund Balances - Non-major Governmental Funds 105 Schedule of Revenues, Expenditures, and Changes in Fund
Balances - Budget and Actual - Metered Parking Special Revenue Fund 106
Schedule of Revenues, Expenditures, and Changes in Fund Balances - Budget and Actual - Confiscated Property Special Revenue Fund 107
Combining Statement of Fiduciary Net Position – Pension (and Other Employee Benefit) Trust Funds 108
Combining Statement of Changes in Fiduciary Net Position - Pension (and Other Employee Benefit) Trust Funds 109
STATISTICAL SECTION (Unaudited) Table of Contents & Additional Notes 111
Financial Trends: Net Position by Component 113 Changes in Net Position 114 Fund Balances - Governmental Funds 116 Changes in Fund Balances - Governmental Funds 117
Revenue Capacity: Value of Taxable Property 118 Direct and Overlapping Property Tax Rates 119 Principal Property Taxpayers 120 Property Tax Levies and Collections 121
Debt Capacity: Ratios of Outstanding Debt by Type 122 Direct and Overlapping Governmental Activities Debt 123 Pledged Revenue Coverage 124
Demographic and Economic Information Financial Trends: Demographic and Economic Statistics 125 Principal Employers 126

City of Cocoa Beach, Florida Comprehensive Annual Financial Report
Table of Contents For the Year Ended September 30, 2018
Page
v
Operating Information:
Full-time Equivalent City Government Employees by Function/Program
127
Operating Indicators by Function/Program 128 Capital Asset Statistics by Function/Program 129
COMPLIANCE SECTION Independent Auditor’s Report on Internal Control Over Financial
Reporting and on Compliance and Other Matters Based on an Audit of Financial Statements Performed in Accordance with Government Auditing Standards 133
Independent Auditor’s Management Letter 135 Independent Accountant’s Report 137

Page intentionally blank
vi

vii
March 14, 2019
To the Honorable Mayor, City Commissioners and Citizens of the City of Cocoa Beach: The Comprehensive Annual Financial Report (CAFR) of the City of Cocoa Beach, Florida for the fiscal year ended September 30, 2018 is submitted pursuant to Florida Statutes Chapters 11.45 and 218.39, and Section 3.03(4) of the City Charter. Responsibility for both the accuracy of the data and the completeness and fairness of the presentation, including all disclosures, rests with the City. We consider the enclosed data to be accurate in all material respects and it is reported in a manner designed to present fairly the financial position and results of operations of the City. All disclosures necessary to enable the reader to gain an understanding of the City's financial activities are included. The report complies in all material respects with the authoritative promulgations by the Governmental Accounting Standards Board (GASB). An explanation of the City’s accounting policies is contained in the Notes to Financial Statements, which are an integral part of this Report. These Notes explain the basis of accounting, funds and accounts used, and other significant accounting information. Internal Controls This report consists of management’s representations concerning the finances of the City. Consequently, management assumes full responsibility for the completeness and reliability of all the information presented. To provide a reasonable basis for making these representations, management of the City has established a comprehensive internal control framework that is designed both to protect the government’s assets from loss, theft or misuse and to compile sufficient reliable information for the preparation of the City’s financial statements in conformity with generally accepted accounting principles (GAAP). The internal control structure is intended to provide reasonable, but not absolute, assurance that these objectives are met. The inherent limitations of internal control are that:
1. Cost considerations will prevent management from ever installing a “perfect” system. Management will properly and deliberately choose to run certain risks because the cost of preventing such risks cannot be justified, (i.e. costs should not exceed benefits);
2. Control related policies and procedures are subject to management override; and
3. Internal controls may be circumvented by collusion between employees.
City of Cocoa Beach P.O. Box 322430, 2 South Orlando Avenue
Cocoa Beach, Florida 32932-2430 www.cityofcocoabeach.com
viii
Independent Audit Chapter 218.39, Florida Statutes requires that the financial statements of the City be audited by an independent Certified Public Accountant, licensed to practice in Florida. This audit has been completed by the City’s independent Certified Public Accountants, Moore Stephens Lovelace, P.A., and their opinion is included in their report. Management Discussion and Analysis Generally Accepted Accounting Principles (GAAP) requires management to provide a narrative introduction, overview, and analysis to accompany the basic financial statements. This information is referred to as Management’s Discussion and Analysis (MD&A). This letter of transmittal is designed to complement the MD&A and should be read in conjunction with it. The City of Cocoa Beach’s MD&A can be found immediately following the independent auditor’s report. Profile of the Government The City of Cocoa Beach has a Commission/Manager form of government. The five member Commission consists of a Mayor and four Commissioners who are elected at large and serve for a period of four years. In the governance of the City, the Commission is charged with the responsibility of establishing policies and enacting ordinances and resolutions. The City Manager is appointed by the Commission, and is charged with the responsibility of administering daily operations and implementing Commission directives. The City provides a range of services normally associated with a municipality, including police, fire, emergency medical services, parks and recreational activities, streets and parks maintenance, traffic engineering and metered parking, sanitation, wastewater treatment, stormwater improvements, community redevelopment, building inspections, code enforcement, planning and zoning, and general administration. Wastewater treatment services are also provided to the adjacent unincorporated areas, including Port Canaveral and Patrick Air Force Base. The City also operates a twenty-seven hole golf course. All monies required to support these services are reflected in this report. Budgeting Process and Controls The City maintains budgetary control as part of its fiscal management techniques. The objective of these budgetary controls is to ensure compliance with legal provisions embodied in the annual appropriated budget approved by the governing body. Annual budgets are prepared for those funds that require them. Budgetary integration is established in the accounting records with a uniform chart of accounts as required by the state. The government also maintains an encumbrance accounting system as one technique of accomplishing budgetary control. Encumbered amounts lapse at year end. As demonstrated by the statements and schedules included in the financial section of this report, the government continues to meet its responsibility for sound financial management. Note C of the financial statements contains a more complete discussion of the budget process.

ix
Community Background The City of Cocoa Beach was incorporated in 1925, but really began growing residentially during the height of the Space Program in the 1960’s. As a small oceanfront/riverfront community with six miles of highly accessible beaches and river access, lying in between the Banana River and the Atlantic Ocean, the City focuses on being a family-oriented tourist destination; however, the community has a solid residential component with 2,419 single family homes and 5,594 condominiums as of 2018. The diversity of the economy is driven by a mix of hotels/motels and businesses that are supportive of the tourism industry while also supporting the needs of the local residents. Cocoa Beach population (for State shared review purposes in Fiscal Year 2019) is 11,292, but seasonally the population more than doubles. Other factors are the estimated 2.4 million day visitors to the city annually, reflecting the relative proximity to the Orlando Metro area. Of the 2,700 acres that comprise Cocoa Beach, 900 acres are known as the Thousand Islands with a northern area jointly held by the City, County and State of Florida. The south area Thousand Islands are under the control of the Brevard County Environmentally Endangered Land Program. The City has invested in the purchase of these islands and seeks to conserve and protect these valuable natural resources. For the most part, the City is built out with only a few exceptions. The primary focus moving forward will be redevelopment in specified areas. It should be noted that industrial uses are not permitted in the city limits. Economic Condition and Outlook The financial condition and economic vitality of the Cocoa Beach area are influenced by the activities at the Kennedy Space Center and Port Canaveral to the north, and Patrick Air Force Base to the south. The Kennedy Space Center (KSC) is both a tourist attraction and a major employment center, with several space and defense contractors located there, supported by numerous local suppliers and support services. KSC was adversely impacted by the elimination of the space shuttle program. Facilities at KSC have since been reconfigured for private space endeavors. With rocket launches scheduled on an ongoing basis, KSC has reclaimed its status as the most active rocket launch facility in the world. The economic outlook for Brevard County is gradually improving and the unemployment rate has fallen from 3.7% (December 2017) to 3.3% (December 2018).1 As of the date of this writing, the economic outlook continues to steadily improve. Port Canaveral has a favorable area impact with its growth in cruise ship services, port facilities, tonnage processed, and recreational activities. The Port is one of the busiest cruise ports in the world, with ten cruise terminals. The Port continues to add cruise ships and currently hosts ships from most major cruise lines. It has evolved into a major deep water port of entry with first-class berthing facilities, a marine commercial park and foreign trade zone. It is the world’s first quadra-modal hub, interchanging freight among sea, land, air and space transportation modes. The Port continues to increase cargo ship activity, with the combined port costs for tug boats, piloting, line handling, dockage and water among the lowest in the Southeast. Annual cargo tonnage exceeds two million tons with two liquid bulk facilities and nine dry cargo berths with 6,976 feet of berthing space, including a Roll On/Roll Off ramp. The Exploration Tower, a seven story welcome center at the Port, is designed to serve as a focal point for the community and to enhance the cruise passenger experience while in port. 1 FRED Economic Data, St. Louis Fed. https://fred.stlouisfed.org/series/FLBREV3URN

x
Patrick Air Force Base, home to the 45th Space Wing, is one of the area’s major employers, as well as a provider of services to active military personnel, veterans and retirees. State shared revenues (sales tax and fuel tax) in general, have remained flat or declined since Fiscal Year 2008. Although fuel tax revenues have continued to remain flat, we’ve seen an overall increase of 6% in sales tax revenue in Fiscal Year 2018. Low interest rates have reduced revenues earned by our pooled funds and investment accounts. With the Federal Reserve decision to continue lifting its eight year near zero interest rate and move gradually in raising rates further in coming years, we should see corresponding increases in interest rate revenue. Fuel prices are currently decreasing, a trend expected to continue in the near term (Fiscal Year 2019). Taxable property values increased 7.60% from Fiscal Year 2017 to Fiscal Year 2018. Property values are projected to continue to increase in Brevard County for 2019. Total ad valorem tax collections for Fiscal Year 2018 are $9,743,132. Although revenue is trending upward, the cumulative revenue loss through recessionary times was significant. Through a combination of rising property values and increased millage rates, the gap on the revenue losses have narrowed, however, in constant dollars, adjusting for inflation, the loss exceeds $8.9M; thereby reducing the purchasing power that otherwise would have been generated by collections. Page A–24 of the FY 2019 Budget has a detailed explanation of ten years of tax collection history. The current session of the Legislature is considering changes in some tax measures. Florida is one of the lowest tax states2 already, and previous recessionary times will make tax increases or revenue enhancements politically difficult. At the county level a half-cent sales tax was approved by the voters in 2016 for the Brevard County school system and another half-cent sales tax for the Indian River Lagoon (IRL) was approved by the voters for 2017. The City has successfully developed projects and submitted them for funding with proceeds from the IRL sales tax. Long-term Financial Planning With a stable population base, the City does not face the issue of adding significant infrastructure and related staffs to accommodate growth. Since the City is essentially fully developed, there is little potential for major additions to the tax roll. Such increases will come primarily from property redevelopment and re-evaluations. The stable (and slightly lower3) population base restricts growth in state shared revenue (allocated on a per capita basis). See additional subsequent event details related to building height limitation revisions in Note N of the financial statements. The City Commission has an ambitious goal to develop Cocoa Beach by making the City a notable tourist destination as well as a desirable place to live. This development will require extensive planning as it must be accompanied by the revenues required to facilitate this development.
2 Tax Foundation: Background Paper, October 2013, No. 68. 3 Population in Fiscal Year 2007 = 12,785; Population in Fiscal Year 2018 = 11,292; per state shared revenue allocations.

xi
The financial position of the City has remained strong and sound with a stable economic base. It is influenced by the proximity of both the major tourist attractions such as the beaches and Port Canaveral, as well as the proximity to major employers such as the Kennedy Space Center and Patrick Air Force Base. The tourist business, affected by a declining economic environment, is expected to recover in the coming years. The extent of the increase in property values from the above activities will also be a factor.
Construction of the new Downtown Parking Garage in the Community Redevelopment Agency (CRA) began in September 2018 and is scheduled to be completed in summer of 2019. The 241-space parking garage will provide parking for visitors and businesses in the downtown area and include an informational area for visitors and public restrooms. Debt payments on Revenue Bond 2017B will be made with CRA tax increment financing (TIF)4. The Tourist Development Council (TDC) has provided $90,000 of the project funding. The garage construction is part of the continued implementation of elements of the downtown parking plan recommendations in the parking study completed in Fiscal Year 2015.
Downtown Parking Garage Final Design
Aging infrastructure has long been of a concern and was further brought to the forefront in September of 2017 when wind and rain initiated by Hurricane Irma caused extensive damage to City Hall and the Police Station as the roof of the building partially peeled off. The north area Fire Station also experienced storm damage. These facilities date from the 1950s – 1960s and require extensive renovation and/or replacement. The order of magnitude (i.e. plus/minus thirty (+ 30%) percent) estimate for the City Hall/Police facilities is $14,000,000. An additional $2,000,000 is estimated as the replacement cost for the north area fire station. The main Fire Station was replaced in Fiscal Year 2015, (see Note H of the financial statements for debt schedule).
4 Tax Increment Financing (often referred to as "TIF") is a method to pay for redevelopment of a slum or blighted area through the increased ad valorem tax revenue resulting from that redevelopment.

xii
Accumulating and setting aside funding sources for debt service in the face of rising operating costs while maintaining current service levels is challenging. The Commission has addressed this by adopting Resolution 2016 – 22 which commits $1,000,000 in tax collections to help facilitate funding of construction of new municipal facilities. Consideration of an energy and facility improvement plan to minimize annual cost volatility is also under review. Focused reductions in positions and expenditure accounts have too been made. However, these reductions are partially offset by rising direct and indirect costs.
Over the last several years, the wastewater treatment plant required extensive capital upgrades to comply with increased regulatory requirements. These projects were funded with two state revolving fund (SRF) loans. The projects are discussed in more detail in Note H of the financial statements. Improvements to the collection systems to increase efficiency and manage peak flows (as experienced during and after Hurricanes Matthew and Irma) continue to be addressed and additional SRF funding is being sought for such projects. Rate increases based on studies by outside consultants as well as in-house comparisons to surrounding communities have been adopted by the Commission. These include increases in golf rates, pool and other recreation fees, permit rates, stormwater fees, sewer fees, and fire inspection fees. In Fiscal Year 2018, the budget was amended to incorporate the Special Revenue Metered Parking Fund into the General Fund with the adoption of Resolution 2018-13 all of the parking fees were condensed into Resolution 2018-24. Ongoing fee reviews represent the steps to develop a master fee review schedule where useful. Other revenue enhancements will be required as our needs are better defined. Fiduciary Funds - Pension Trust Funds and OPEB Trust Fund The City provides three separate pension plans: general employees, police, and firefighters. Each plan is a contributory defined benefit plan administered by its own Board of Trustees. Each plan maintains separate investment pools, although the same investment manager is used by the police and firefighters. Specific details are addressed in Note L of the financial statements and Required Supplementary Information. The City provides other non-pension benefits, collectively referred to as other post-employment benefits (OPEB). A fiduciary trust fund is used to aid in accounting for these benefits. In fiscal year 2018, the City implemented GASB Statement No. 75, Accounting and Financial Reporting for Postemployment Benefits Other Than Pensions. GASB Statement No. 75 specifies that governments must recognize their total OPEB liability and related deferred outflows of resources, deferred inflows of resources, and OPEB expense in the financial statements based on the actuarial present value of projected benefit payments, rather than the smaller net OPEB obligation based on contribution requirements, under GASB Statement No. 45. Specific details are addressed in Note M of the financial statements.


Page intentionally blank
xiv

xv
Fisc
al Y
ear
2018
M
anag
emen
t Sta
ff
Elec
ted
Offi
cial
s
Mayor Ben Malik
Vice Mayor Skip Williams
Commissioners Michael Miller
Ed Martinez
Karalyn Woulas
City Manager James P. McKnight
Chief Financial Officer Eileen Clark
City Clerk Loredana Kalaghchy
Director Development Services Randy Stevenson
Dir. Information Technology Kevin Perez
Director Leisure Services Laird McLean
Director Economic Dev./CRA Melissa Byron
Director Personnel Natalie Harmon
Director Public Works Robert Torres
Director Water Reclamation Scott Barber
Fire Chief Ryan Duckworth
Police Chief Scott Rosenfeld
Stormwater Utility Manager Joanie Regan

xvi
City of Cocoa Beach Organization Chart
City Commission
Community Redevelopment City Manager
Utilities General Fund
City Clerk Finance
MeteredParking
Personnel Information Technology
GIS
Police Dept
Comm.
Beach Rangers
Fire Dept. Public Works
Field Ops
Buillding Maint
Grounds Maint
Solid Waste
Development Services
PlanningZoning
InspectionsPermits
Code Enforcement
Leisure Services
Recreation Ctr
Parks
Skate Park
Tennis
Auditorium
Aquatic Ctr
Golf
Economic Development
GeneralApproprations
Stormwater
City Attorney Advisory Boards

xvii

Page intentionally blank
xviii

Fina
ncia
l Sec
tion Independent Auditor’s Report
Management’s Discussion and Analysis
Basic Financial Statements
Required Supplementary Information (RSI)
Other Supplemental Information
1

Page intentionally blank
2

INDEPENDENT AUDITOR’S REPORT Honorable Mayor and Members of the City Commission Cocoa Beach, Florida Report on the Financial Statements We have audited the accompanying financial statements of the governmental activities, the business-type activities, each major fund, and the aggregate remaining fund information of the City of Cocoa Beach, Florida (the “City”) as of and for the year ended September 30, 2018, and the related notes to the financial statements, which collectively comprise the City’s basic financial statements, as listed in the table of contents.
Management’s Responsibility for the Financial Statements Management is responsible for the preparation and fair presentation of these financial statements in accordance with accounting principles generally accepted in the United States of America; this includes the design, implementation, and maintenance of internal control relevant to the preparation and fair presentation of financial statements that are free from material misstatement, whether due to fraud or error.
Auditor’s Responsibility Our responsibility is to express opinions on these financial statements based on our audit. We conducted our audit in accordance with auditing standards generally accepted in the United States of America and the standards applicable to financial audits contained in Government Auditing Standards issued by the Comptroller General of the United States. Those standards require that we plan and perform the audit to obtain reasonable assurance about whether the financial statements are free of material misstatement.
An audit involves performing procedures to obtain audit evidence about the amounts and disclosures in the financial statements. The procedures selected depend on the auditor’s judgment, including the assessment of the risks of material misstatement of the financial statements, whether due to fraud or error. In making those risk assessments, the auditor considers internal control relevant to the City’s preparation and fair presentation of the financial statements in order to design audit procedures that are appropriate in the circumstances, but not for the purpose of expressing an opinion on the effectiveness of the City’s internal control. Accordingly, we express no such opinion. An audit also includes evaluating the appropriateness of accounting policies used and the reasonableness of significant accounting estimates made by management, as well as evaluating the overall presentation of the financial statements.
We believe that the audit evidence we have obtained is sufficient and appropriate to provide a basis for our audit opinions.
Opinions In our opinion, the financial statements referred to above present fairly, in all material respects, the respective financial position of the governmental activities, the business-type activities, each major fund, and the aggregate remaining fund information of the City as of September 30, 2018, and the respective changes in financial position, and, where applicable, cash flows thereof, and the budgetary comparison for the general fund and major special revenue fund for the year then ended in conformity with accounting principles generally accepted in the United States of America.
Emphasis-of-Matter - Change in Accounting Principle
As discussed in Note A-15 to the financial statements, in the fiscal year ended September 30, 2018, the City adopted the provisions of Government Accounting Standards Board Statement (“GASBS”) Number 75, Accounting and Financial Reporting for Postemployment Benefits Other Than Pensions. As a result of the implementation of GASBS 75, the City reported a restatement for the change in accounting principle as of October 1, 2017. Our opinions are not modified with respect to this matter.
3

Honorable Mayor and Members of the City Commission Cocoa Beach, Florida
INDEPENDENT AUDITOR’S REPORT (Concluded)
Other Matters
Required Supplementary Information
Accounting principles generally accepted in the United States of America require that the Management’s Discussion and Analysis and the required supplementary information, as listed in the table of contents, be presented to supplement the basic financial statements. Such information, although not a part of the basic financial statements, is required by the Governmental Accounting Standards Board, who considers it to be an essential part of financial reporting for placing the basic financial statements in an appropriate operational, economic, or historical context. We have applied certain limited procedures to the required supplementary information in accordance with auditing standards generally accepted in the United States of America, which consisted of inquiries of management about the methods of preparing the information and comparing the information for consistency with management’s responses to our inquiries, the basic financial statements, and other knowledge we obtained during our audit of the basic financial statements. We do not express an opinion or provide any assurance on the information because the limited procedures do not provide us with sufficient evidence to express an opinion or provide any assurance.
Other Information
Our audit was conducted for the purpose of forming opinions on the financial statements that collectively comprise the City’s basic financial statements as a whole. The introductory section, combining and individual fund financial statements and schedules, and statistical section, as listed in the table of contents, are presented for purposes of additional analysis and are not a required part of the financial statements. The combining and individual non-major fund financial statements and schedules are the responsibility of management and were derived from, and relate directly to, the underlying accounting and other records used to prepare the financial statements. Such information has been subjected to the auditing procedures applied in the audit of the financial statements and certain additional procedures, including comparing and reconciling such information directly to the underlying accounting and other records used to prepare the financial statements or to the financial statements themselves, and other additional procedures in accordance with auditing standards generally accepted in the United States of America. In our opinion, the combining and individual non-major fund financial statements and schedules are fairly stated, in all material respects, in relation to the financial statements as a whole. The introductory section and statistical section have not been subjected to the auditing procedures applied in the audit of the basic financial statements and, accordingly, we do not express an opinion or provide any assurance on them.
Other Reporting Required by Government Auditing Standards
In accordance with Government Auditing Standards, we have also issued our report dated March 14, 2019, on our consideration of the City’s internal control over financial reporting and on our tests of its compliance with certain provisions of laws, regulations, contracts, and grant agreements and other matters. The purpose of that report is to describe the scope of our testing of internal control over financial reporting and compliance and the results of that testing, and not to provide an opinion on internal control over financial reporting or on compliance. That report is an integral part of an audit performed in accordance with Government Auditing Standards in considering the City’s internal control over financial reporting and compliance. MOORE STEPHENS LOVELACE, P.A. Certified Public Accountants
Orlando, Florida March 14, 2019
4

Management’s Discussion and Analysis
Management’s discussion and analysis is designed to (a) assist the reader in focusing on significant financial issues, (b) provide an overview of the City’s financial activity, (c) identify changes in the City’s financial position, (d) identify any material deviations from the financial plan, and (e) identify individual fund issues or concerns. Readers are encouraged to consider the information presented here in conjunction with additional information that we have furnished in our letter of transmittal in the Introductory Section of the report.
FINANCIAL HIGHLIGHTS
• The assets of the City of Cocoa Beach exceeded its liabilities as of September 30, 2018, by $58,841,498 (net position). Of this amount, $4,416,234 (unrestricted net position) may be used to meet the City’s ongoing obligations to citizens and creditors. Governmental and business-type assets and deferred outflows of resources exceeded liabilities and deferred inflows of resources by $22,703,397 and $36,138,101, respectively.
• The City’s total net position was decreased by $1,634,061 due primarily to the City’s required implementation of Governmental Accounting Standards Board (GASB) Statement No. 75 (GASB 75), Accounting and Financial Reporting for Postemployment Benefits Other than Pension (OPEB). The decrease includes a $3,830,143 restatement to the $60,475,559 net position previously reported as of September 30, 2017. This restatement impacted both governmental and business-type activities. Detailed information on GASB 75 adjustments can be found in Note A-15, Note M and in the Required Supplementary Information (RSI).
• As stated previously, the City’s total net position was decreased by $1,634,061 or 2.7%, in comparison to the prior year. The City’s unrestricted net position, which may be used to meet the City’s ongoing obligations to its citizens and creditors, decreased by $714,425, a 13.9% decrease from the prior year.
• At September 30, 2018, the City of Cocoa Beach’s governmental fund balance sheet reported a combined ending fund balance of $11,895,051, an increase of $212,740 from the Fiscal Year 2017 ending fund balance of $11,682,311. Of this amount, $5,039,536 remains in the General Fund of the City as unassigned fund balance.
• The General Fund reported a total fund balance of $7,214,065 at year end, an increase from last fiscal year of $2,297,398. The ending fund balance in Fiscal Year 2017 was $4,916,667. The increase is primarily due to the integration of the Metered Parking Special Revenue Fund into the General Fund.
• Total external debt decreased by $381,751 in Fiscal Year 2018. This decrease is net of the $1,193,215 State Revolving Fund (SRF) Loan for Stormwater Improvements (SRF #4) which was finalized and payments began in Fiscal Year 2018 (see Note H to the financial statements).
5

MAJOR INITIATIVES
• Construction of the new Downtown Parking Garage in the Community Redevelopment Agency (CRA) began in September 2018 and is scheduled to be completed in summer of 2019. The 241-space parking garage will provide parking for visitors and businesses in the downtown area and include an informational area for visitors and public restrooms. Debt payments on Revenue Bond 2017B will be made with CRA tax increment financing (TIF)1. The Tourist Development Council (TDC) has provided $90,000 of the project funding.
•
• Indian River Lagoon dredging projects continue to be a priority. The City has an interlocal agreement with Brevard County/Florida Department of Environmental Protection (FDEP) for residential dredging services. Additionally, grants for the dredging project have been awarded by St. Johns River Water Management District (SJRWMD) and Save Our Indian River Lagoon Project (SOIRLP) (half cent sales tax revenues). Phase III of the residential dredging project began in FY 2018 with dredging underway and planned for thirteen canals south of Minutemen Cswy2.
With the addition of the Third Amendment3 to FDEP/Brevard County Agreement the project grants summary for Phase III is as follows:
Project Grants Awarded: 1) St. Johns River Water Management District (SJRWMD) $ 606,684 2) FDEP/Brevard County Amendment Two $ 500,000 3) Save Our Indian River Lagoon Project (SOIRLP) $ 981,305 4) FDEP/Brevard County Amendment Three $ 350,000 Total Grant Funding Awarded for Phase III Dredging $ 2,437,989
• The Water Reclamation Department initiated a comprehensive project to improve the sewer
treatment plant with major capital upgrades. The project includes engineering design and the State Revolving Fund application to upgrade sand filters, replace influent screens, rotary drum thickeners, and modify piping and bio solids processes. These improvements address items directly related to National Pollutant Discharge Elimination System (NPDES) permitting requirements outlined in the Wastewater Facility Plan.
• The Fischer Park paving and landscaping project to include design, engineering, site work, Stormwater improvements and landscaping began in spring of 2018, with completion scheduled for December 2018. The improvements will assist in increasing the park’s utilization and parking permits will be accepted in lieu of paid parking. 1 Tax Increment Financing (often referred to as "TIF") is a method to pay for redevelopment of a slum or blighted area through the increased ad valorem tax revenue resulting from that redevelopment. 2 Phase I, completed in March 2017, consisted of dredging six City canals north of State Road 520. Phase II consisted of dredging five canals in the center portion of the City and was completed in July of 2017. 3The Third Amendment to FDEP/Brevard County Agreement in the amount of $350,000 was subsequently approved by the City of Cocoa Beach Commission on October 18, 2018 (FY 2019).
6

FINANCIAL STATEMENTS
Overview of the financial statements. This discussion and analysis is intended to serve as an introduction to the City of Cocoa Beach’s basic financial statements. The basic financial statements are comprised of three (3) components: 1) government-wide financial statements, 2) fund financial statements, and 3) notes to the financial statements. This report also contains other supplementary information in addition to the basic financial statements themselves. This supplementary information should be considered an integral part of the financial statements.
Government-wide financial statements. The government-wide financial statements are designed to provide readers with a broad overview of the City’s finances in a manner similar to a private-sector business. The statement of net position presents information on all of the City’s assets, deferred outflows of resources, liabilities, deferred inflows of resources with the difference between them reported as net position. Over time, increases or decreases in net position may serve as a useful indicator of whether the financial position of the City is improving or deteriorating. The statement of activities presents information showing how the government’s net position changed during the most recent fiscal year. All changes in net position are reported as soon as the underlying event giving rise to the change occurs, regardless of the timing of related cash flows. Thus, revenues and expenses are reported in this statement for some items that will result in cash flows in future fiscal periods (e.g. uncollected taxes and earned but unused vacation leave).
Both of the government-wide financial statements distinguish functions of the City that are principally supported by taxes and intergovernmental revenues (governmental activities) from other functions that are intended to recover all or a significant portion of their costs through user fees and charges to external users (business-type activities). The governmental activities of the City include general government, planning and zoning, public safety, transportation, sanitation, street and park maintenance, public improvements and recreation. The business-type activities of the City include wastewater treatment/reuse and stormwater management.
The government-wide financial statements include only the City of Cocoa Beach itself (the primary government). The Cocoa Beach Public Library is funded through the Brevard County Free Public Library District, a separate taxing authority and is not included under the reporting entity definition in the City’s financial statements.
Fund Financial Statements A fund is a grouping of related accounts that is used to maintain control over resources that have been segregated for specific activities or objectives. The City of Cocoa Beach, like other state and local governments, uses fund accounting to ensure and demonstrate compliance with finance-related legal requirements. All of the funds of the City of Cocoa Beach can be divided into three categories: governmental funds, proprietary funds, and fiduciary funds.
Governmental Funds Governmental funds are used to account for essentially the same functions reported as governmental activities in the government-wide financial statements. However, unlike the government-wide financial statements, governmental fund financial statements focus on near-term inflows and outflows of spendable resources, as well as on balances of spendable resources available at the end of the fiscal year. Such information may be useful in evaluating a government’s near-term financing requirements.
7

Because the focus of governmental funds is narrower than that of the government-wide financial statements, it is useful to compare the information presented for governmental funds with similar information presented for governmental activities in the government-wide financial statements. By doing so, readers may better understand the long-term impact of the government’s near-term financing decisions. Both the governmental fund balance sheet and the governmental fund statement of revenues, expenditures, and changes in fund balances provide a reconciliation to facilitate this comparison between governmental funds and governmental activities.
During Fiscal Year 2018, the City of Cocoa Beach budget was amended to incorporate the Special Revenue Metered Parking Fund into the General Fund with the adoption of Resolution 2018-13. With this change, three individual governmental funds are maintained; the General Fund, Community Redevelopment Agency (CRA), and the Confiscated Property Fund. Information is presented separately in the governmental fund balance sheet and in the governmental fund statement of revenues, expenditures, and changes in fund balances for the General Fund and CRA which are considered to be major funds. Since the Confiscated Property Fund is not considered to be a major fund, data from the fund is combined into a single, aggregated presentation. The City of Cocoa Beach adopts an annual appropriated budget for its governmental funds. A budgetary comparison statement has been provided for the General Fund and CRA Fund to demonstrate compliance with this budget.
Proprietary Funds This category of funds includes both enterprise and internal service funds. However, the City does not use internal service funds. The City does maintain two funds which are considered enterprise funds. The City uses enterprise funds to account for the waste collection/disposal/reuse water system, and stormwater management system. Proprietary funds provide the same type of information as the government-wide financial statements. The proprietary fund financial statements provide separate information for the Utilities System Fund, and Stormwater Management Fund, each of which are considered to be major funds of the City.
Fiduciary Funds Fiduciary funds are used to account for resources held for the benefit of parties outside the government. Fiduciary funds are not reflected in the government-wide financial statement because the resources of those funds are not available to support the City’s programs. The City has three pension trust funds (General Employees’, Police, & Firefighters), and an OPEB trust fund. Financial information for these funds is provided in the notes to the financial statements.
Notes to the Financial Statements The notes provide additional information that is essential to a full understanding of the data provided in the government-wide and fund financial statements.
8

GOVERNMENT-WIDE FINANCIAL ANALYSIS
The government-wide financial report represents the approach mandated by the Governmental Accounting Standards Board (GASB). GASB sets the uniform standards for presenting government financial reports.
As noted earlier, net position may serve over time as a useful indicator of a government’s financial position. For the City of Cocoa Beach, the net position was $58,841,498 at the close of the most recent fiscal year. This is a $1,634,061 decrease in net position over the $60,475,559 reported in Fiscal Year 2017.
The decrease is attributed, as discussed on page 5, to the City adopting the provisions of GASB 75 which required a restatement of beginning net position. Detailed information on GASB 75 can be found in Note A-15, Note M and in the Required Supplementary Information (RSI).
$-
$10
$20
$30
$40
$50
$60
$70
Total Business-type Governmental
MIL
LIO
NS
OF
DO
LLAR
S
Net Position
FY 2018 FY 2017
The City’s net position totaled $58,841,498 at the end of Fiscal Year 2018. The largest portion of the City’s net position reflects the investment in capital assets (e.g. land, buildings, machinery, and equipment). Although the City’s investment in its capital assets ($54,244,743) (92.2% of total net position) is reported net of related debt, it should be noted that the resources needed to repay this debt must be provided from other sources, since the capital assets themselves cannot be used to liquidate these liabilities. The City uses these capital assets to provide services to citizens; consequently, these assets are not available for future spending.
9

2018 2017 2018 2017 2018 2017
Current and other assets 13,611,768$ 12,997,334$ 10,769,746$ 9,682,608$ 24,381,514$ 22,679,942$
Capital assets 32,006,999 30,359,987 50,355,474 51,883,410 82,362,473 82,243,397
Total assets 45,618,767 43,357,321 61,125,220 61,566,018 106,743,987 104,923,339
Deferred outflows of pension expenses 1,674,365 1,747,332 146,247 206,542 1,820,612 1,953,874 Deferred outflows of OPEB expenses 70,194 - 9,300 - 79,494 -
Total deferred outflows of resources 1,744,559 1,747,332 155,547 206,542 1,900,106 1,953,874
Long-term liabilities outstanding 18,503,462 18,073,325 22,940,934 23,025,139 41,444,396 41,098,464
Other liabilities 3,154,884 2,496,076 1,937,203 1,760,643 5,092,087 4,256,719
Total liabilities 21,658,346 20,569,401 24,878,137 24,785,782 46,536,483 45,355,183
Deferred inflows of pension earnings 1,825,979 983,988 108,758 62,483 1,934,737 1,046,471
Deferred inflows of OPEB earnings 1,175,604 - 155,771 - 1,331,375 -
Total deferred inflows of resources 3,001,583 983,988 264,529 62,483 3,266,112 1,046,471
Net investment in capital assets 27,578,331 26,290,568 26,666,412 27,971,940 54,244,743 54,262,508
Restricted 180,521 445,157 - 637,235 180,521 1,082,392
Unrestricted (5,055,455) (3,184,461) 9,471,689 8,315,120 4,416,234 5,130,659
Total net position $ 22,703,397 $ 23,551,264 $ 36,138,101 $ 36,924,295 58,841,498$ 60,475,559$
Total
Schedule of Net Position
GovernmentalActivities
Business-typeActivities
A portion of the City of Cocoa Beach’s net position, $180,521 (less than ½ % of total net position) represents resources that are subject to external restrictions on how they may be used. The balance of unrestricted net position, $4,416,234 (7.5% of total net position) may be used to meet the government’s ongoing obligations to citizens and creditors within the respective governmental and business-type activities. At the end of the current fiscal year, the City of Cocoa Beach is able to report positive balances in all three categories of net position as a whole. The principal reason for the changes in net position balances is due to the restatement of beginning net position as required by GASB 75. Detailed information on GASB 75 adjustments can be found in Note A-15, Note M and in the Required Supplementary Information (RSI).
10

The following display of Changes in Net Position shows the governmental and business-type activities during the fiscal year.
2018 2017 2018 2017 2018 2017
Revenues:
Programs revenues:
Charges for services 8,316,247$ 8,855,745$ 7,847,223$ 7,443,946$ 16,163,470$ 16,299,691$
Operating grants and contributions 499,643 746,727 - - 499,643 746,727
Capital grants and contributions 1,021,221 1,015,000 400,350 3,221,488 1,421,571 4,236,488
General revenues:
Property taxes 10,375,705 9,126,174 - - 10,375,705 9,126,174
Other taxes 3,607,987 3,482,403 - - 3,607,987 3,482,403
Intergovernmental 822,000 779,801 - - 822,000 779,801
Investment earnings 76,363 10,575 92,510 64,942 168,873 75,517
Other 469,223 264,298 - - 469,223 264,298
Total revenues 25,188,389 24,280,723 8,340,083 10,730,376 33,528,472 35,011,099
Expenses:
General government 4,968,022 4,935,118 - - 4,968,022 4,935,118
Public safety 8,730,028 8,782,659 - - 8,730,028 8,782,659
Physical environment 1,670,732 1,510,816 - - 1,670,732 1,510,816
Transportation/public works 4,300,002 3,526,815 - - 4,300,002 3,526,815
Recreation 3,486,931 3,432,942 - - 3,486,931 3,432,942
Interest on long-term debt 328,326 307,420 - - 328,326 307,420
Utilities System - - 7,122,007 6,828,930 7,122,007 6,828,930
Stormwater Management - - 726,342 500,555 726,342 500,555
Total expenses 23,484,041 22,495,770 7,848,349 7,329,485 31,332,390 29,825,255
Increase (decrease) in netposition before transfers 1,704,348 1,784,953 491,734 3,400,891 2,196,082 5,185,844
Transfers 859,000 559,000 (859,000) (559,000) - -
Change in net position 2,563,348 2,343,953 (367,266) 2,841,891 2,196,082 5,185,844
Net position, beginning (as restated) 20,140,049 21,207,311 36,505,367 34,082,404 56,645,416 55,289,715
Net position, ending $ 22,703,397 $ 23,551,264 $ 36,138,101 $ 36,924,295 $ 58,841,498 $ 60,475,559
GovernmentalActivities
Business-typeActivities Total
Schedule of Changes in Net Position
11

FINANCIAL ANALYSIS OF COCOA BEACH’S FUNDS As noted earlier, the City of Cocoa Beach uses fund accounting to ensure and demonstrate compliance with finance-related legal requirements. Governmental Funds. The City uses two governmental fund types (General & Special Revenue). The purpose of governmental funds is to provide information on near-term inflows, outflows, and balances of spendable resources. Such information is useful in assessing the City’s financing requirements. In particular, unassigned fund balance may serve as a useful measure of a government’s net resources available for spending at the end of the fiscal year.
0.00%
20.00%
40.00%
60.00%
80.00%
100.00%
2018 2017
General FundFund Balance as Percent of Expenditures
Total Fund Balance Unassigned Fund Balance
2018 201728% 21%20% 13%
Total Fund BalanceUnassigned Fund Balance
General Fund Budgetary Highlights. A budget to actual statement is provided for the General Fund. A budget column for both the original budget adopted for Fiscal Year 2018 as well as the final budget is presented. A comparison of the final budget to the actual amounts for current expenditures shows a final difference of $8,823,627. Funding in the amount of $7.5M for construction of the police station that is still in the design stage of planning accounts for the majority of the difference. Additionally, a portion of the difference is attributed to the carrying over of budgeted funds to the Fiscal Year 2019 budget in the amount of $629,521 for capital projects that were not completed by the end of the fiscal year. Furthermore, revenue actuals were less than original budgeted amounts by $357,487. This is primarily due to timing of hurricane related reimbursements and charges for services that were impacted by inclement weather. Lastly, operating expenditure actuals were overall below budgeted amounts.
As of September 30, 2018, the City of Cocoa Beach’s governmental funds reported a combined fund balance of $11,895,051. This is an increase of $212,740 from the prior year balance of $11,682,311. The General Fund is the chief operating fund of the City. As of September 30, 2018, total fund balance in the General Fund was $7,214,065 of which $5,039,536 was unassigned. As a measure of liquidity, a comparison of total and unassigned fund balances to total expenditures for Fiscal Year 2018 ($25,492,863) and Fiscal Year 2017 ($23,304,361) shows percentages of 20% and 13%, respectively for unassigned fund balance.
12

Special Revenue Funds. Special Revenue Funds account for specific revenues and expenditures. The City has two special revenue funds. Community Redevelopment Agency (CRA) Fund The CRA is a major governmental fund used to account for monies from the incremental increase in property tax revenue collected within the designated redevelopment area. Consistent with State law, revenues are utilized and expended in accordance with the Community Redevelopment Plan. Fund balance at the end of Fiscal Year 2018 was $4,500,465 ($4,494,922 is restricted for construction of the parking garage). The first tax incremental financing was received in Fiscal Year 2014 and has continued in subsequent years as taxable values have risen.
2018 2017Increase
(Decrease)
Taxable value 164,165,280$ 151,355,140$ 12,810,140$ Less: Base year value (119,086,930) (119,086,930) -
Net taxable value 45,078,350$ 32,268,210$ 12,810,140$
County tax rate per $1,000 of value 4.1600 4.3631 (0.2031)City tax rate per $1,000 of value 5.7298 5.4798 0.2500
Tax increment payments:County 177,936$ 133,564$ 44,372$ City 245,375 167,749 77,626
Total tax increment payments 423,310$ 301,313$ 121,997$
Community Redevelopment Agency Fund (CRA)
Tax Increment Values and Payments
Although the City’s electorate approved the formation of a CRA in 2008, the Community Redevelopment Plan was not delivered to the taxing authorities until April 2012 and tax incremental financing was not available prior to Fiscal Year 2014. Accordingly, loans from the General Fund totaling $261,230 were made to provide funds for the development of the CRA plan. A comprehensive repayment schedule was finalized in Fiscal Year 2015. The first payment was also made in Fiscal Year 2015 in the amount of $21,230. Annual payments of $20,000 are scheduled through Fiscal Year 2027 to repay the balance of the advance, which is $180,000 at September 30, 2018.
13
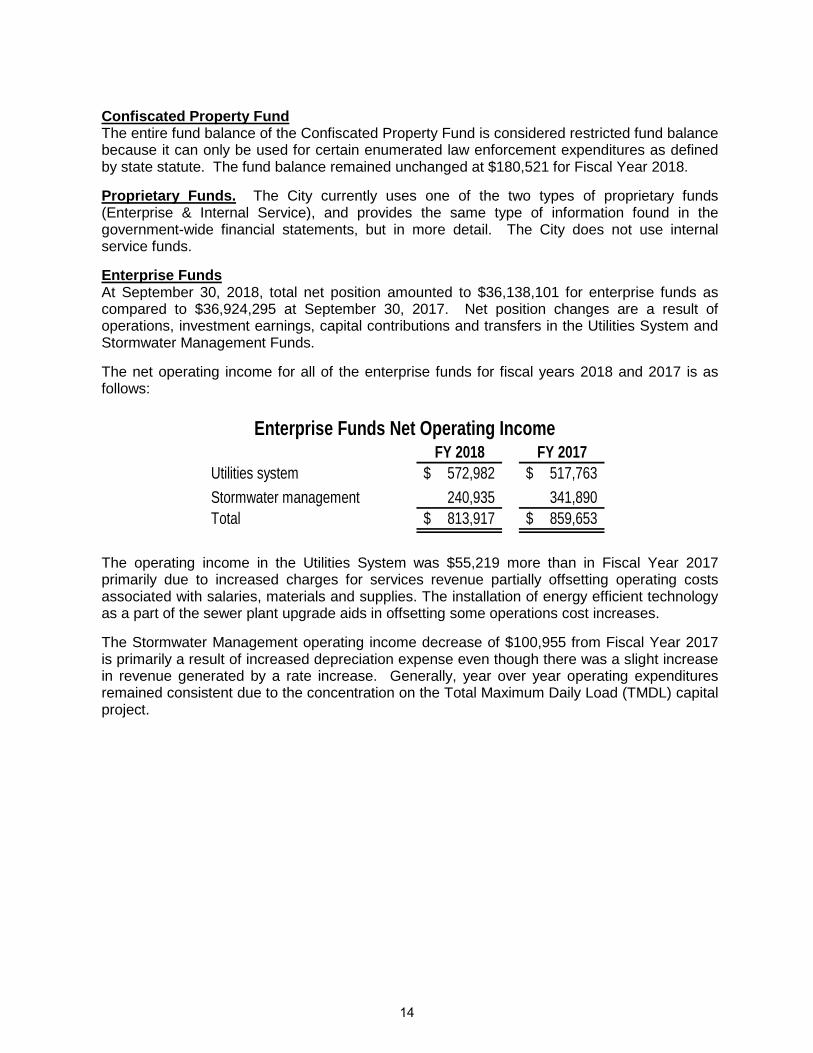
Confiscated Property Fund The entire fund balance of the Confiscated Property Fund is considered restricted fund balance because it can only be used for certain enumerated law enforcement expenditures as defined by state statute. The fund balance remained unchanged at $180,521 for Fiscal Year 2018. Proprietary Funds. The City currently uses one of the two types of proprietary funds (Enterprise & Internal Service), and provides the same type of information found in the government-wide financial statements, but in more detail. The City does not use internal service funds. Enterprise Funds At September 30, 2018, total net position amounted to $36,138,101 for enterprise funds as compared to $36,924,295 at September 30, 2017. Net position changes are a result of operations, investment earnings, capital contributions and transfers in the Utilities System and Stormwater Management Funds. The net operating income for all of the enterprise funds for fiscal years 2018 and 2017 is as follows:
FY 2018 FY 2017Utilities system 572,982$ 517,763$ Stormwater management 240,935 341,890 Total 813,917$ 859,653$
Enterprise Funds Net Operating Income
The operating income in the Utilities System was $55,219 more than in Fiscal Year 2017 primarily due to increased charges for services revenue partially offsetting operating costs associated with salaries, materials and supplies. The installation of energy efficient technology as a part of the sewer plant upgrade aids in offsetting some operations cost increases. The Stormwater Management operating income decrease of $100,955 from Fiscal Year 2017 is primarily a result of increased depreciation expense even though there was a slight increase in revenue generated by a rate increase. Generally, year over year operating expenditures remained consistent due to the concentration on the Total Maximum Daily Load (TMDL) capital project.
14

Capital Asset Administration Capital Assets. The City of Cocoa Beach’s investment in capital assets as of September 30, 2018 is $82,362,473 (net of accumulated depreciation). This investment in capital assets includes land, buildings, improvements, equipment, infrastructure and work in progress. Governmental activities net investment in capital assets increased by $1,647,012 and business-type activities decreased by $1,527,936. The primary reasons for the changes in the Governmental Activities Schedule are the completion of improvement and dredging projects. The primary reason for the change in the Business-type Activities Schedule is the disposal and depreciation of aging infrastructure and equipment. Major changes in capital assets during the current fiscal year included the following:
2018 2017 2018 2017 2018 2017
Land 7,950,653$ 7,950,653$ 1,691,599$ 1,691,599$ 9,642,252$ 9,642,252$
Buildings 7,599,504 7,746,185 2,046,086 2,134,421 9,645,590 9,880,606
Improvements 9,846,401 10,354,643 14,815,618 16,313,384 24,662,019 26,668,027
Equipment 3,322,324 3,090,051 858,983 414,316 4,181,307 3,504,367
Infrastructure 628,651 646,091 30,139,022 31,032,257 30,767,673 31,678,348
Work in progress 2,659,466 572,364 804,166 297,433 3,463,632 869,797
Total 32,006,999$ 30,359,987$ 50,355,474$ 51,883,410$ 82,362,473$ 82,243,397$
GovernmentalActivities
Business-typeActivities Total
Schedule of Capital Assets (Net)
Major changes in governmental activities included work in progress for construction of the parking garage, Fisher Park and country club improvements, residential dredging projects and the acquisition of vehicle and golf cart replacements. For the business-type activities, the major acquisitions of the Water Reclamation Facilities Upgrades and the North Banana River Blvd. Force Main Extension projects are in the work in progress category. These acquisitions were offset by disposals and depreciation of aging infrastructure and equipment. A detailed discussion of these projects is in Note H to the financial statements. The City annually updates a five year Capital Improvements Program (CIP) and forecasts the funding requirements for necessary equipment and facilities. These requirements, as well as projected costs of operations and maintenance, are compared and adjusted based on forecasted sources of funding over that timeframe. Additional information on the City’s capital assets can be found in Note G to the financial statements.
15

DEBT ADMINISTRATION Long-Term Debt At the end of the current fiscal year, the City of Cocoa Beach had total long-term debt in the amount of $31,844,139. The City is participating in the State of Florida Revolving (SRF) Loan Program with twenty (20) year loans for utilities facility upgrades and sewer systems rehabilitation and stormwater improvements. The outstanding balance of the SRF loans is $22,139,062. In Fiscal Year 2014, the 2004 SRF loan was refunded by a bank loan generating a savings of about $20,000 per year for ten (10) years. The outstanding balance is $1,550,000. A second bank loan was issued in Fiscal Year 2014 for the construction of the new fire station and has an outstanding balance of $3,265,000. The last payment of $19,446 for the FY 2013 capital lease agreement for golf carts was paid during the fiscal year. Another lease/purchase agreement for new carts was initiated in FY 2018. The outstanding balance is $260,319. In Fiscal Year 2016 the City entered into a Master Equipment Lease Agreement in the amount of $878,703 for various equipment units and has an outstanding balance of $384,758. In Fiscal Year 2017 debt was issued in the amount of $4,245,000 (net of bond premium and issuance costs) with Florida Municipal Loan Council (FMLC) Revenue Bond 2017B to fund the design and construction of the new parking garage in the Community Redevelopment Agency (CRA). The first payment on the principal of Revenue Bond 2017B was not made until FY 2019. See Note H to the financial statements for additional information.
2018 2017 2018 2017 2018 2017
State Revolving Loan (#2) -$ -$ 16,987,829$ 17,885,846$ 16,987,829$ 17,885,846$
State Revolving Loan (#4) - - 4,010,056 4,180,624 4,010,056 4,180,624
State Revolving Loan (#3) - - 1,141,177 - 1,141,177 -
Revenue Note (Series 2014A) 3,265,000 3,420,000 - - 3,265,000 3,420,000
Revenue Note (Series 2014B) - - 1,550,000 1,845,000 1,550,000 1,845,000 CRA Improvement Revenue Bonds, Series 2017B 4,245,000 4,245,000 - - 4,245,000 4,245,000
Capital Lease(s) 645,077 649,420 - - 645,077 649,420
Total 8,155,077$ 8,314,420$ 23,689,062$ 23,911,470$ 31,844,139$ 32,225,890$
Governmental Activities
Business-typeActivities Total
Schedule of Outstanding Debt
Total external debt decreased by $381,751 during Fiscal Year 2018. Additional information on the City’s long-term debt can be found in Note H to the financial statements.
16

ECONOMIC FACTORS AND NEXT YEAR’S BUDGETS AND RATES The City’s elected and appointed officials considered many factors when setting the fiscal year 2019 budget, tax rates, and fees to be charged for the business-type activities. In the past few years, the City has obligated significant dollars on new facilities, street resurfacing and infrastructure upgrades. The City has also managed to accumulate an acceptable level of unassigned reserves. Resolution 2016 - 25 amends formalized reserve policies to be in line with GASB 54 definitions and criteria for classifying fund balances. Bordering the ocean, the City wishes to hold reserve balances sufficient for those immediate expenditures associated with hurricanes, as well as expenditures required to maintain normal operations. Although a substantial portion of hurricane expenditures are typically reimbursed, this practice is considered necessary to avoid disruptions in operations. Since the City is effectively built-out, new construction is not expected to produce large annual increases in property tax receipts. It is important to the City’s future that property tax revenues be maintained or increased from year-to-year because it is the largest component of the General Fund’s annual revenues. In addition, other revenues are not likely to increase significantly and since some of those sources (e. g. state shared revenues, grants) are beyond the City’s control, property taxes were the most promising source of future funding. Developing new revenue sources and increasing existing ones are of increasing importance. Although the City is challenged by increased costs for employee benefits (primarily health insurance, workers compensation), it does not face demands to add personnel in order to extend current levels of service into new areas. With staffing levels now equal to those of a decade ago, a review to determine appropriate handling of our workloads continues. The five year CIP always presumes that operations and capital replacements are expected to be sufficiently funded without having to increase the ad valorem tax rate. We will have a real opportunity to test this presumption in the coming years. The City’s Golf Course continues to be challenged to sustain its operations and cover necessary equipment replacements. The high salt content in the area is extremely damaging to the equipment used for maintenance and funding the maintenance expense and replacement costs is an ongoing burden. The City has constructed a garage for equipment storage to aid in mitigating the salt issue and selectively purchases used equipment to lower capital costs. The course has been re-greened with a salt-resistant grass and play is gradually recovering as the economy improves. The twenty-seven hole golf course is actively used, particularly in the busy winter season, so strategies to increase play are marginally helpful, not a solution. The improvements and purchasing practices mentioned in the preceding paragraph are also helpful, but do not produce immediate, dramatic results.
17

ECONOMIC FACTORS AND NEXT YEAR’S BUDGETS AND RATES (continued) The Golf Course Fund was incorporated into the General Fund with the adoption of Resolution 2013 – 21, beginning in Fiscal Year 2014. Golf Course activity is presented in the category of Recreation in the General Fund. Play has still not returned to historical levels, but the number of rounds played continues to rise as the economic recovery continues. A comprehensive study by the National Golf Foundation proposed a series of rate increases and restructuring (i.e. sun setting) of annual memberships to encourage revenue generation. The study was adopted by Resolution 2015 – 33 in November 2015 new rates were subsequently adopted. The current rates are set by Resolution 2018 – 05. The Utilities System enterprise fund is in a similar situation. Environmental standards for discharges into the Indian River Lagoon have become stricter. We commissioned a comprehensive study in Fiscal Year 2008 to address specific capital replacements and upgrades required to meet the new discharge requirements schedule. We enacted a rate increase and subsequent rate increases were adjusted each year by the percentage change in the Gross Domestic Product Implicit Price Deflator to secure the necessary debt service for capital items, as well as cover increased costs of operations and the new regulatory requirements. The utility rate structure adopted by Resolution 2015 - 29 increased rates by 3% in FY 2018.
Forecasts for the Stormwater Management enterprise fund show that large capital improvements, such as the Minutemen Stormwater and Streetscape Project, will have to be funded using grants or loans. Revenues are not sufficient to fund both operations and capital projects of any size. In addition to the budgetary challenges facing the Stormwater Fund, federal Clean Water Act legislation concerning the TMDL and National Pollutant Discharge Elimination System programs are unfunded mandates upon local government and require extensive staff resource time and effort. To address rising operating costs, the most recent Stormwater rate structure adopted by Resolution 2015 – 31 increased rates by 3% in FY 2018.
The City’s current residential dredging program and schedule was developed through an interlocal agreement with Brevard County as a part of the state funding made available to clean the Indian River Lagoon. Dredging for the first of eleven residential canals scheduled under this agreement was completed in Fiscal Year 2017 and the program continues with the dredging of thirteen more canals added to the active schedule.
All of these factors were considered in preparing the City’s budget for Fiscal Year 2019. The Fiscal Year 2019 millage rate is 5.7298, the rollback rate is 5.3637. The rollback rate produces the same ad valorem tax revenue as the previous year and therefore is not a tax increase. See the economic outlook section of the letter of transmittal for additional details regarding economic conditions.
18

REQUESTS FOR INFORMATION
This financial report is designed to provide a general overview of the City of Cocoa Beach’s finances for all those with an interest in the City’s finances. Questions concerning any of the information provided in this report or requests for additional information should be addressed to Eileen A. Clark, CGFO, Chief Financial Officer, 2 South Orlando Avenue, Cocoa Beach, Florida, 32931 or [email protected]. The financial statements are included in the City’s Comprehensive Annual Financial Report (CAFR) posted on the City’s web site at www.cityofcocoabeach.com.
19

Page intentionally blank
20

Basic
Fin
anci
al S
tate
men
ts
21

Page intentionally blank
22

City of Cocoa Beach, FloridaStatement of Net Position
September 30, 2018
GovernmentalActivities
Business-typeActivities Total
ASSETSCash and cash equivalents 6,402,379$ 3,441,700$ 9,844,079$ Investments 1,241,524 4,938,926 6,180,450 Accounts receivable, net of allowance for uncollectible accounts 518,694 1,162,314 1,681,008 Due from other governments 277,769 - 277,769 Inventory 88,831 - 88,831 Prepaid expenses 197,084 29,979 227,063 Restricted assets:
Cash and cash equivalents 4,885,487 1,196,827 6,082,314 Capital assets not being depreciated:
Land 7,950,653 1,691,599 9,642,252 Work-in-progress 2,659,466 804,166 3,463,632
Capital assets net of accumulated depreciation:Buildings 7,599,504 2,046,086 9,645,590 Infrastructure 628,651 30,139,022 30,767,673 Improvements other than buildings 9,846,401 14,815,618 24,662,019 Machinery and equipment 3,322,324 858,983 4,181,307
Total assets 45,618,767 61,125,220 106,743,987
DEFERRED OUTFLOWS OF RESOURCESDeferred outflows related to pensions 1,674,365 146,247 1,820,612 Deferred outflows related to OPEB 70,194 9,300 79,494
Total deferred outflows of resources 1,744,559 155,547 1,900,106
LIABILITIESAccounts payable and accrued liabilities 1,571,535 311,642 1,883,177 Accrued interest payable 136,997 81,801 218,798 Unearned revenue 145,182 - 145,182 Noncurrent liabilities:
Due within one year 1,301,170 1,543,760 2,844,930 Due in more than one year 8,592,365 22,393,590 30,985,955 Net pension liability 5,799,550 2,552 5,802,102 Net OPEB liability 4,111,547 544,792 4,656,339
Total liabilities 21,658,346 24,878,137 46,536,483
DEFERRED INFLOWS OF RESOURCESDeferred inflows related to pensions 1,825,979 108,758 1,934,737 Deferred inflows related to OPEB 1,175,604 155,771 1,331,375
Total deferred inflows of resources 3,001,583 264,529 3,266,112
NET POSITIONNet investment in capital assets 27,578,331 26,666,412 54,244,743 Restricted for:
Law enforcement 180,521 - 180,521 Unrestricted (5,055,455) 9,471,689 4,416,234
Total net position 22,703,397$ 36,138,101$ 58,841,498$
The accompanying notes to the financial statements are an integral part of this statement.
23

City of Cocoa Beach, FloridaStatement of Activities
For the Fiscal Year Ended September 30, 2018
Function/Program Expenses
Charges for
Services
OperatingGrants and
Contributions
CapitalGrants and
Contributions
Governmental activities:General government 4,968,022$ 2,946,376$ -$ -$ Public safety 8,730,028 1,188,367 269,829 - Physical environment 1,670,732 1,854,899 - - Transportation/public works 4,300,002 165,065 229,814 1,021,221 Recreation 3,486,931 2,161,540 - - Interest on long-term debt 328,326 - - -
Total governmental activities 23,484,041 8,316,247 499,643 1,021,221
Business-type activities:Utility system 7,122,007 7,005,833 - 226,599 Stormwater 726,342 841,390 - 173,751
Total business-type activities 7,848,349 7,847,223 - 400,350
Total government 31,332,390$ 16,163,470$ 499,643$ 1,421,571$
General Revenues:Property taxesLocal option gax taxFranchise taxesExcise taxesUnrestricted intergovernmentalUnrestricted investment earningsMiscellaneous revenuesGain on sale of capital assets
TransfersTotal general revenues and transfers
Change in net position
Net position - beginning (as restated)
Net position - ending
Program Revenues
24

GovernmentalActivities
Business-typeActivities Total
(2,021,646)$ -$ (2,021,646)$ (7,271,832) - (7,271,832)
184,167 - 184,167 (2,883,902) - (2,883,902) (1,325,391) - (1,325,391)
(328,326) - (328,326)
(13,646,930) - (13,646,930)
- 110,425 110,425 - 288,799 288,799
- 399,224 399,224
(13,646,930) 399,224 (13,247,706)
10,375,705 - 10,375,705 327,312 - 327,312
1,274,531 - 1,274,531 2,006,144 - 2,006,144
822,000 - 822,000 76,363 92,510 168,873
290,457 - 290,457 178,766 - 178,766 859,000 (859,000) -
16,210,278 (766,490) 15,443,788
2,563,348 (367,266) 2,196,082
20,140,049 36,505,367 56,645,416
22,703,397$ 36,138,101$ 58,841,498$
Net (Expense) Revenue andChanges in Net Position
The accompanying notes to the financial statements are an integral part of this statement.
25

City of Cocoa Beach, FloridaBalance Sheet
Governmental FundsSeptember 30, 2018
General Fund
Community Redevelopment
Agency Fund
Other Governmental
Funds
TotalGovernmental
FundsASSETS
Cash and cash equivalents 6,392,920$ 4,698,555$ 196,391$ 11,287,866$ Investments 1,241,524 - - 1,241,524 Accounts receivable 518,694 - - 518,694 Due from other funds 180,000 - - 180,000 Due from other governments 277,769 - - 277,769 Inventory 88,831 - - 88,831 Prepayments 191,541 5,543 - 197,084
Total assets 8,891,279$ 4,704,098$ 196,391$ 13,791,768$
LIABILITIES AND FUND BALANCESLiabilities:
Accounts and contracts payable 1,165,713$ 23,633$ -$ 1,189,346$ Accrued liabilities 382,189 - - 382,189 Due to other funds - 180,000 - 180,000 Unearned revenue 129,312 - 15,870 145,182
Total liabilities 1,677,214 203,633 15,870 1,896,717
Fund balances:Non-spendable 280,372 5,543 - 285,915 Restricted 264,636 4,494,922 180,521 4,940,079 Committed 1,629,521 - - 1,629,521 Unassigned 5,039,536 - - 5,039,536
Total fund balances 7,214,065 4,500,465 180,521 11,895,051 Total liabilities and fund balances 8,891,279$ 4,704,098$ 196,391$
32,006,999
(5,951,164)
(5,216,957)
Long-term liabilities, excluding pension and OPEB (Note B, Paragraph 1) (10,030,532)
Net position of governmental activities 22,703,397$
Amounts reported for governmental activities in the statement of net position are different because:
Capital assets used in governmental activities are not financial resources and, therefore, are not reported in the funds (Note G, Paragraph 1)Pension related liabilities, deferred inflows and deferred outflows are not financial resources nor near-term obligations and, therefore, are not reported in the funds
The accompanying notes to the financial statements are an integral part of this statement.
OPEB related liabilities, deferred inflows and deferred outflows are not financial resources nor near-term obligations and, therefore, are not reported in the funds
26

City of Cocoa Beach, FloridaStatement of Revenues, Expenditures, and Changes in Fund Balances
Governmental FundsFor the Fiscal Year Ended September 30, 2018
General Fund
Community Redevelopment
Agency Fund
Other Governmental
Funds
TotalGovernmental
FundsREVENUES
Taxes 13,805,756$ 177,936$ -$ 13,983,692$ Licenses and permits 736,536 - - 736,536 Intergovernmental revenues 2,342,864 - - 2,342,864 Charges for services 7,523,826 - - 7,523,826 Fines and forfeitures 55,885 - - 55,885 Investment earnings 19,140 57,223 - 76,363 Miscellaneous revenues 290,457 - - 290,457
Total revenues 24,774,464 235,159 - 25,009,623
EXPENDITURESCurrent:
General government 5,559,608 58,267 - 5,617,875 Public safety 9,017,098 - - 9,017,098 Physical environment 1,670,732 - - 1,670,732 Transportation/public works 4,866,390 - - 4,866,390 Recreation 3,798,436 - - 3,798,436
Capital outlay - 484,828 - 484,828 Debt service:
Principal 454,566 - - 454,566 Interest and other 126,033 93,915 - 219,948
Total expenditures 25,492,863 637,010 - 26,129,873 Excess (deficiency) of revenues over (under) expenditures before transfers (718,399) (401,851) - (1,120,250)
OTHER FINANCING SOURCES (USES)Transfers in 2,787,182 245,375 - 3,032,557 Transfers out (245,375) - (1,928,182) (2,173,557) Sale of capital assets 178,766 - - 178,766 Capital lease 295,224 - - 295,224
Total other financing sources (uses) 3,015,797 245,375 (1,928,182) 1,332,990
Net change in fund balances 2,297,398 (156,476) (1,928,182) 212,740 Fund balances, beginning of year 4,916,667 4,656,941 2,108,703 11,682,311 Fund balances, end of year 7,214,065$ 4,500,465$ 180,521$ 11,895,051$
The accompanying notes to the financial statements are an integral part of this statement.
27

Page intentionally blank
28

City of Cocoa Beach, FloridaReconciliation of the Statement of Revenues, Expenditures, and Changes in
Fund Balances of Governmental Funds to the Statement of ActivitiesFor the Fiscal Year Ended September 30, 2018
Amounts reported for governmental activities in the statement of activities aredifferent because:
Net change in fund balances - total governmental funds 212,740$
Governmental funds report capital outlays as expenditures. However, in thestatement of activities, the cost of those assets is allocated over their estimateduseful lives and reported as depreciation expense. This is the amount by whichcapital outlays exceeded depreciation in the current period (Note B, Paragraph 2). 1,647,012
Government funds report contributions to pension plans as expenditures and donot recognize the long-term net pension liability. However, in the statement ofactivities, the pension expense associated with service cost is recognized and thecontributions to the pension plans reduce the net pension liability. (Note B,Paragraph 2) 335,975
Government funds report contributions to OPEB plans as expenditures and do notrecognize the long-term net OPEB liability. However, in the statement of activities,the OPEB expense associated with service cost is recognized and thecontributions to the OPEB plan reduces the net OPEB liability. (Note B, Paragraph2) 160,358
The issuance of long-term debt (e.g., bonds, bank loans) provides currentfinancial resources to governmental funds, while the repayment of the principal oflong-term debt consumes the current financial resources of governmental funds.Neither transaction, however, has any effect on net position. Also governmentalfunds report the effect of premiums, discounts and similar items when debt is firstissued, whereas these amounts are deferred and amortized in the statement ofactivities. This amount is the net effect of these differences in the treatment oflong-term debt and related items (Note B, Paragraph 2). 187,961
Some expenses reported in the statement of activities did not require the use ofcurrent financial resources and, therefore, are not reported as expenditures ingovernmental funds. (Note B, Paragraph 2). 19,302
Change in net position of governmental activities 2,563,348$
The accompanying notes to the financial statements are an integral part of this statement.
29

City of Cocoa Beach, FloridaStatement of Revenues, Expenditures, and Changes in Fund Balances - Budget and Actual
General FundFor the Fiscal Year Ended September 30, 2018
Budget AmountsVariance withFinal Budget -
Original FinalActual
AmountsPositive
(Negative)
REVENUESTaxes 13,688,724$ 13,688,724$ 13,805,756$ 117,032$ Licenses and permits 490,100 490,100 736,536 246,436 Intergovernmental revenues 2,382,676 2,382,676 2,342,864 (39,812) Charges for services 6,271,605 8,359,605 7,523,826 (835,779) Fines and forfeitures 51,200 51,200 55,885 4,685 Investment earnings 57,000 60,000 19,140 (40,860) Miscellaneous revenues 77,221 99,646 290,457 190,811
Total revenues 23,018,526 25,131,951 24,774,464 (357,487)
EXPENDITURESCurrent:
General government:Mayor and City Commission 134,061 140,061 128,609 11,452 City Attorney - legal services 250,000 250,000 250,344 (344) City Manager 497,619 411,119 380,772 30,347 Personnel 296,405 305,055 295,704 9,351 City Clerk 203,823 203,823 182,054 21,769 Finance 780,495 767,895 726,279 41,616 Metered parking program - 1,136,555 833,601 302,954 Information technology 1,178,583 1,343,583 1,158,579 185,004 Other general government 1,083,141 1,139,861 1,603,666 (463,805)
4,424,127 5,697,952 5,559,608 138,344
Public safety:Police department 4,451,420 4,358,005 4,224,543 133,462 Communications 725,136 736,576 674,572 62,004 Fire department 3,551,054 3,582,212 3,470,389 111,823 Building department:
Planning, zoning and development 435,577 435,577 418,016 17,561 Inspections and permits 266,022 266,022 229,578 36,444
9,429,209 9,378,392 9,017,098 361,294
Transportation/public works:Field operations 1,271,188 1,353,348 1,154,587 198,761 Building maintenance 827,495 963,427 743,120 220,307 Grounds maintenance 634,619 634,619 518,230 116,389 Fleet management 1,018,828 1,133,189 1,081,181 52,008 Capital improvements 8,389,778 8,951,426 1,369,272 7,582,154 Physical environment 1,499,420 1,499,420 1,670,732 (171,312)
13,641,328 14,535,429 6,537,122 7,998,307
Continued on next page
30

City of Cocoa Beach, FloridaStatement of Revenues, Expenditures, and Changes in Fund Balances - Budget and Actual
General Fund (continued)For the Fiscal Year Ended September 30, 2018
Variance withFinal Budget -
Original FinalActual
AmountsPositive
(Negative)
EXPENDITURES (continued)Recreation:
Administration and community service center 492,963$ 485,963$ 410,565$ 75,398$ Golf 2,355,745 2,362,745 2,633,760 (271,015) Parks 227,865 227,865 202,235 25,630 Swimming pool 470,986 495,214 471,582 23,632 Beach rangers 84,672 84,672 74,217 10,455 Tennis courts 26,480 26,480 6,077 20,403
3,658,711 3,682,939 3,798,436 (115,497)
Debt service:Principal 901,292 901,292 454,566 446,726 Interest 120,486 120,486 126,033 (5,547)
1,021,778 1,021,778 580,599 441,179 Total expenditures 32,175,153 34,316,490 25,492,863 8,823,627
Excess (deficiency) of revenues over expenditures (9,156,627) (9,184,539) (718,399) 8,466,140
OTHER FINANCING SOURCES AND (USES)Transfer from:
Utilities system fund 859,000 859,000 859,000 - Metered parking fund 1,000,000 1,000,000 1,928,182 928,182
Transfer to:CRA (245,375) (245,375) (245,375) -
Sale of capital assets 154,000 154,000 178,766 24,766 Capital lease - - 295,224 295,224 Issuance of debt 7,500,000 7,500,000 - (7,500,000)
Total other financing sources 9,267,625 9,267,625 3,015,797 (6,251,828)
Net change in fund balances 110,998 83,086 2,297,398 2,214,312
Fund balances, beginning of year 4,916,667 4,916,667 4,916,667 -
Fund balances, end of year 5,027,665$ 4,999,753$ 7,214,065$ 2,214,312$
Budget Amounts
The accompanying notes to the financial statements are an integral part of this statement.
31

Page intentionally blank
32

City of Cocoa Beach, FloridaStatement of Revenues, Expenditures, and Changes in Fund Balances - Budget and Actual
Community Redevelopment Agency FundFor the Fiscal Year Ended September 30, 2018
Budget AmountsVariance withFinal Budget -
Original FinalActual
AmountsPositive
(Negative)
REVENUES
Taxes 178,150$ 178,150$ 177,936$ (214)$ Investment earnings - - 57,223 57,223
Total revenues 178,150 178,150 235,159 57,009
EXPENDITURESCurrent:
General government:Planning and development 41,706 65,329 58,267 7,062
Capital outlay 4,700,000 4,700,000 484,828 4,215,172 Debt service:
Principal 102,387 6,349 - 6,349 Interest and other - 93,915 93,915 -
Total expenditures 4,844,093 4,865,593 637,010 4,228,583
OTHER FINANCING SOURCES AND (USES)Transfer from:
General fund 245,375 245,375 245,375 - Issuance of debt 4,700,000 4,700,000 - (4,700,000)
Total other financing sources 4,945,375 4,945,375 245,375 (4,700,000)
Net change in fund balances 279,432 257,932 (156,476) (414,408) Fund balances, beginning of year 4,656,941 4,656,941 4,656,941 -
Fund balances, end of year 4,936,373$ 4,914,873$ 4,500,465$ (414,408)$
The accompanying notes to the financial statements are an integral part of this statement.
33

City of Cocoa Beach, FloridaStatement of Net Position
Proprietary FundsSeptember 30, 2018
Utility StormwaterSystem Management Total
ASSETSCurrent assets:
Cash and cash equivalents 2,943,623$ 498,077$ 3,441,700$ Investments 4,654,564 284,362 4,938,926 Accounts receivable, net of allowance for uncollectible accounts 1,011,631 150,683 1,162,314 Due from other funds 94,142 - 94,142 Prepaid expenses 27,441 2,538 29,979
Total current assets 8,731,401 935,660 9,667,061
Noncurrent assets:Restricted assets
Cash and cash equivalents 1,164,033 32,794 1,196,827 Advances to other funds 283,512 - 283,512 Capital assets:
Land 1,691,599 - 1,691,599 Buildings 3,491,671 490,920 3,982,591 Infrastructure 40,336,490 9,157,985 49,494,475 Improvements other than buildings 22,997,433 250,814 23,248,247 Machinery and equipment 3,803,410 74,676 3,878,086 Construction in progress 798,310 5,856 804,166 Less accumulated depreciation (31,746,811) (996,879) (32,743,690)
Total noncurrent assets 42,819,647 9,016,166 51,835,813
Total assets 51,551,048 9,951,826 61,502,874
DEFERRED OUTFLOWS OF RESOURCESDeferred outflows related to pensions 127,457 18,790 146,247 Deferred outflows related to OPEB 8,108 1,192 9,300
Total deferred outflows of resources 135,565$ 19,982$ 155,547$
Continued on next page
Enterprise Funds
34

City of Cocoa Beach, FloridaStatement of Net Position
Proprietary Funds (continued)September 30, 2018
Utility StormwaterSystem Management Total
LIABILITIESCurrent liabilities:
Accounts payable and accrued liabilities 275,204$ 36,438$ 311,642$ Due to other funds - 94,142 94,142 Accrued compensated absences 90,540 20,879 111,419 Notes payable 1,398,258 34,083 1,432,341 Accrued interest payable 55,982 25,819 81,801
Total current liabilities 1,819,984 211,361 2,031,345
Noncurrent liabilities:Advances from other funds - 283,512 283,512 Accrued compensated absences 115,147 21,722 136,869 Net OPEB liability 474,947 69,845 544,792 Net pension liability 2,224 328 2,552 Notes payable 21,149,627 1,107,094 22,256,721
Total noncurrent liabilities 21,741,945 1,482,501 23,224,446
Total liabilities 23,561,929 1,693,862 25,255,791
DEFERRED INFLOWS OF RESOURCESDeferred inflows related to pensions 94,785 13,973 108,758 Deferred inflows related to OPEB 135,800 19,971 155,771
Total deferred inflows of resources 230,585 33,944 264,529
NET POSITIONNet investment in capital assets 18,824,217 7,842,195 26,666,412 Unrestricted 9,069,882 401,807 9,471,689
Total net position 27,894,099$ 8,244,002$ 36,138,101$
Enterprise Funds
The accompanying notes to the financial statements are an integral part of this statement.
35

Page intentionally blank
36

City of Cocoa Beach, FloridaStatement of Revenues, Expenses, and Changes in Fund Net Position
Proprietary FundsFor the Fiscal Year Ended
September 30, 2018
Utility StormwaterSystem Management Totals
OPERATING REVENUESCharges for services 6,932,200$ 841,390$ 7,773,590$ Other operating revenue 73,633 - 73,633 Total operating revenues 7,005,833 841,390 7,847,223
OPERATING EXPENSESSalaries, wages and employee benefits 1,659,190 235,353 1,894,543 Contractual services, materials and supplies 1,906,954 151,264 2,058,218 Insurance 65,399 8,086 73,485 Depreciation 2,801,308 205,752 3,007,060 Total operating expenses 6,432,851 600,455 7,033,306 Operating income (loss) 572,982 240,935 813,917
NON-OPERATING REVENUES (EXPENSES)Investment earnings 57,685 10,205 67,890 Interest on advance to other fund 24,620 (24,620) - Interest expense (689,156) (101,267) (790,423)
Total non-operating revenues (expenses) (606,851) (115,682) (722,533)
Income (loss) before contributions and transfers (33,869) 125,253 91,384
Capital contributions - connection fees 226,599 - 226,599 Capital grants - 173,751 173,751 Transfers out (859,000) - (859,000) Change in net position (666,270) 299,004 (367,266)
Total net position, beginning of year (as restated) 28,560,369 7,944,998 36,505,367
Total net position, end of year 27,894,099$ 8,244,002$ 36,138,101$
Enterprise Funds
The accompanying notes to the financial statements are an integral part of this statement.
37

City of Cocoa Beach, FloridaStatement of Cash Flows
Proprietary FundsFor the Fiscal Year Ended September 30, 2018
UtilitiesSystem
Stormwater Management Totals
CASH FLOWS FROM OPERATING ACTIVITIES
Receipts from customers and users 6,769,775$ 833,963$ 7,603,738$ Payments to suppliers (1,317,990) (55,572) (1,373,562) Employee payments and benefits (1,627,215) (231,603) (1,858,818) Payments for interfund services used (596,187) (78,192) (674,379) Other operating receipts 73,633 - 73,633
Net cash (used in) provided by operating activities 3,302,016 468,596 3,770,612
CASH FLOWS FROM NON-CAPITAL FINANCING ACTIVITIES
Proceeds from repayments of advances 3,966,801 - 3,966,801 Interest received from advances to other funds 24,620 - 24,620 Payments on advances from other funds - (3,966,801) (3,966,801) Interest paid on advances from other funds - (24,620) (24,620) Transfer to other funds (859,000) - (859,000)
Net cash (used in) provided by non-capital financing activities 3,132,421 (3,991,421) (859,000)
CASH FLOWS FROM CAPITAL AND RELATED FINANCING ACTIVITIES
Proceeds from capital debt - 1,193,215 1,193,215 Proceeds from capital grants - 2,766,213 2,766,213 Capital contributions - connection fees 226,599 - 226,599 Purchase and construction of capital assets (1,409,802) (69,322) (1,479,124) Principal payments on capital debt (1,363,585) (52,038) (1,415,623) Interest payments on capital debt (691,741) (75,448) (767,189)
Net cash (used in) provided by capital and related financing activities (3,238,529) 3,762,620 524,091
CASH FLOWS FROM INVESTING ACTIVITIES
Purchase of investments (332,108) 280,032 (52,076) Investment earnings 57,685 10,205 67,890
Net cash (used in) provided by investing activities (274,423) 290,237 15,814
Net increase (decrease) in cash and cash equivalents 2,921,485 530,032 3,451,517
Cash and cash equivalents, beginning 1,186,171 839 1,187,010
Cash and cash equivalents, ending 4,107,656$ 530,871$ 4,638,527$
Continued on next page
Enterprise Funds
38

City of Cocoa Beach, FloridaStatement of Cash Flows
Proprietary Funds (continued)For the Fiscal Year Ended September 30, 2018
Utilities SystemStormwater
Management TotalsReconciliation of operating income to net cash provided by operating activities:
Operating income (loss) 572,982$ 240,935$ 813,917$ Adjustments to reconcile operating income to net cash provided by operating activities:
Depreciation and amortization 2,801,308 205,752 3,007,060 (Increase) decrease in assets:
Accounts receivable (162,425) (7,427) (169,852) Prepaid expenses (5,511) (644) (6,155) Deferred outflows from OPEB (8,108) (1,192) (9,300) Deferred outflows from pensions 52,548 7,747 60,295
Increase (decrease) in liabilities:Accounts payable and accrued liabilities 63,687 26,230 89,917 Accrued compensated absences 9,385 412 9,797 Net pension liability (51,765) (7,631) (59,396) Net OPEB liability (146,215) (21,502) (167,717) Deferred inflows from OPEB 135,800 19,971 155,771 Deferred inflows from pensions 40,330 5,945 46,275
Total adjustments 2,729,034 227,661 2,956,695 Net cash (used in) provided by operating activities 3,302,016$ 468,596$ 3,770,612$
Cash and cash equivalents reconciliation:
Cash and cash equivalents 2,943,623$ 498,077$ 3,441,700$ Restricted assets:
Cash and cash equivalents (included in restricted cash, cash equivalents, and investments) 1,164,033 32,794 1,196,827
Cash and cash equivalents, ending 4,107,656$ 530,871$ 4,638,527$
Enterprise Funds
The accompanying notes to the financial statements are an integral part of this statement.
39

City of Cocoa Beach, FloridaStatement of Fiduciary Net Position
Fiduciary FundsSeptember 30, 2018
Employee Retirement
FundsASSETS
Receivables:Employer contributions 39,433$ Interest and dividends 13,050
Total receivables 52,483 Investments, at fair value:
Cash and money market 1,239,847 Real Estate 2,194,672 Mutual funds 53,766,103 Common collective equity funds 912,940
Total investments 58,113,562
Total assets 58,166,045
LIABILITIES -
NET POSITIONRestricted for pensions 56,545,914 Restricted for OPEB benefits 1,620,131
Total net position 58,166,045$
The accompanying notes to the financial statements are an integral part of this statement.
40

City of Cocoa Beach, FloridaStatement of Changes in Fiduciary Net Position
Fiduciary FundsFor the Fiscal Year Ended September 30, 2018
Employee Retirement
FundsADDITIONS
Contributions:Employer 2,447,754$ Plan members 446,747
Total contributions 2,894,501
Investment earnings:Net increase (decrease) in fair value of investments 1,499,863 Interest and dividends 3,897,320
Total investment earnings 5,397,183 Less investment expenses 129,883
Net investment earnings 5,267,300
Total additions 8,161,801
DEDUCTIONSBenefits 3,127,485 Refunds of contributions 52,816 Administrative expenses 105,246
Total deductions 3,285,547
Change in net position 4,876,254
Net position, beginning of year 53,289,791
Net position, end of year 58,166,045$
The accompanying notes to the financial statements are an integral part of this statement.
41

Page intentionally blank
42
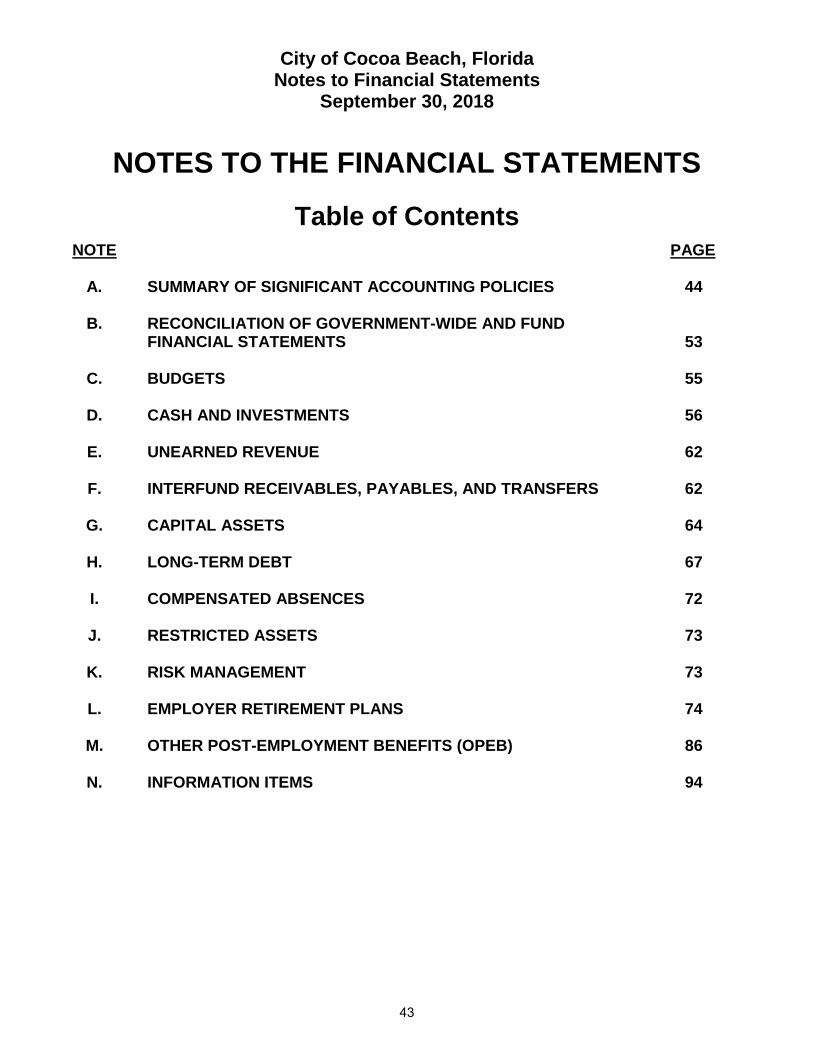
City of Cocoa Beach, Florida Notes to Financial Statements
September 30, 2018
NOTES TO THE FINANCIAL STATEMENTS
Table of Contents
NOTE PAGE
A. SUMMARY OF SIGNIFICANT ACCOUNTING POLICIES 44
B. RECONCILIATION OF GOVERNMENT-WIDE AND FUND FINANCIAL STATEMENTS
53
C. BUDGETS 55
D. CASH AND INVESTMENTS 56
E. UNEARNED REVENUE 62
F. INTERFUND RECEIVABLES, PAYABLES, AND TRANSFERS 62
G. CAPITAL ASSETS 64
H. LONG-TERM DEBT 67
I. COMPENSATED ABSENCES 72
J. RESTRICTED ASSETS 73
K. RISK MANAGEMENT 73
L. EMPLOYER RETIREMENT PLANS 74
M. OTHER POST-EMPLOYMENT BENEFITS (OPEB) 86
N. INFORMATION ITEMS 94
43

City of Cocoa Beach, Florida Notes to Financial Statements
September 30, 2018 A - SUMMARY OF SIGNIFICANT ACCOUNTING POLICIES
1. Reporting entity The City of Cocoa Beach, Florida (the City) is a political subdivision of the State of Florida and is located in Brevard County. The City was incorporated in 1925 and has a Commission/City Manager form of government. The City Commission consists of a Mayor and four (4) Commissioners responsible for establishing policies and enacting ordinances and resolutions. They are elected at large. The City Commission appoints the City Manager who is responsible for the daily administration of the City’s operations. The accompanying financial statements present the City and its component unit, an entity for which the City is considered to be financially accountable. A blended component unit, although legally separate, is, in substance, part of the City’s operations. The City has one blended component unit, the Community Redevelopment Agency (CRA). For financial reporting purposes, the CRA is reported as if it were a part of the City’s operations. The CRA is an incremental tax district established with City Resolution number 2009-28 on November 19, 2009, pursuant to Florida Statutes Chapter 163. The City Commission serves as the governing board, approves the budget, provides funding and performs all accounting functions for the CRA. The CRA’s services are provided exclusively to the City. The CRA is presented as a blended component unit classified as a special revenue fund. The Cocoa Beach Public Library is funded through the Brevard County Free Public Library District, a separate taxing authority. The City Commissioners appoint an advisory Library Board that has authority to propose budget recommendations to the County and provide input in the selection of a library director. The Library’s actual budget is approved and funded by Brevard County and all its personnel are governed by the policies and procedures of Brevard County. The Cocoa Beach Public Library is therefore not a component unit of the City. The accounting policies of the City conform to accounting principles generally accepted in the United States of America (GAAP) as applicable to governments. The following is a summary of the more significant policies of the City. 2. Government-wide and fund financial statements The government-wide financial statements consist of a Statement of Net Position and a Statement of Activities. These statements report information on all of the nonfiduciary activities of the primary government as a whole. As part of the consolidation process, all interfund activities are eliminated from these statements, except for the residual amounts between governmental and business-type activities reported as “internal balances.” Net position, the difference between assets, deferred outflows, and liabilities, deferred inflows, as presented in the Statement of Net Position, are categorized as follows:
a. Net investment in capital assets - the portion of net position which is associated with capital assets, less outstanding debt related to those capital assets.
44

City of Cocoa Beach, Florida Notes to Financial Statements
September 30, 2018 A - SUMMARY OF SIGNIFICANT ACCOUNTING POLICIES (continued)
2. Government-wide and fund financial statements (continued)
b. Restricted net position - have third party (statutory, bond covenant or granting agency) limitations on their use, or enabling legislation.
c. Unrestricted net position - have no third party limitations on their use. The Statement of Activities presents a comparison between the direct and indirect expenses of a given function or segment and its program revenues, and displays the extent to which each function or segment contributes to the change in net position for the fiscal year. Direct expenses are those that are clearly identifiable to a specific function or segment. Indirect expenses are costs the City has allocated to functions through various allocation methods. Program revenues consist of charges for services, operating grants and contributions, and capital grants and contributions. Charges for services refer to amounts received from those who purchase, use, or directly benefit from goods, services, or privileges provided by a given function or segment. Grants and contributions consist of revenues that are restricted to meeting the operational or capital requirements of a particular function or segment. Revenues not classified as program revenues are reported as general revenues. Separate fund financial statements report detailed information about the City's governmental, proprietary and fiduciary funds. The focus of governmental and proprietary fund financial statements is on major funds. Therefore, major funds are reported as separate columns in the fund financial statements and non-major funds are aggregated and presented as a single column on each statement. The results of governmental fund accounting are converted to the government-wide presentation by reconciliation. Generally, the effect of interfund activity has been eliminated from the government-wide financial statements. Exceptions to this are payments-in-lieu of taxes and other charges between the City’s utilities and stormwater management systems and various other functions of the government. Elimination of these charges would distort the direct costs and program revenues reported for the various functions concerned. 3. Measurement focus, basis of accounting, and financial statement presentation The government-wide financial statements, as well as the proprietary and fiduciary fund financial statements, are reported using the economic resources measurement focus and the accrual basis of accounting. Revenues are recognized in the period earned and expenses are recognized when a liability is incurred. Property tax revenues are recognized in the year for which they are levied. Grants and similar items are recognized as revenue as soon as all eligibility requirements imposed by the provider have been met.
45

City of Cocoa Beach, Florida Notes to Financial Statements
September 30, 2018 A - SUMMARY OF SIGNIFICANT ACCOUNTING POLICIES (continued)
3. Measurement focus, basis of accounting, and financial statement presentation (continued) All governmental fund financial statements are reported using a current financial resources measurement focus on a modified accrual basis of accounting. Under this basis, revenues are recognized in the accounting period in which they become both measurable and available to finance expenditures of the current period. Available is defined as collectible within the current period, or soon enough thereafter to be used to pay liabilities of the current period, usually considered sixty days. The primary revenue sources for governmental funds are property taxes, public utility taxes, franchise fees, and sales and fuel taxes. Primary revenue sources associated with the current fiscal period are considered to be susceptible to accrual and have been recognized as revenues of the current fiscal period. All other revenues, such as licenses and permits, charges for services, and miscellaneous revenues, are considered to be measurable and available only when payment is received. Expenditures of governmental funds are generally recorded when a liability is incurred, as under accrual accounting. However, accumulated sick and vacation pay, prepaid insurance and similar items, and principal and interest on long-term debt are recorded only when payment is due. Proprietary funds distinguish between operating and non-operating revenues and expenses. Operating revenues generally result from producing and delivering goods or providing services, such as water, sewer and stormwater services, to the public. Operating expenses for these operations include the costs of sales and services, administrative expenses, and depreciation. All revenues and expenses not meeting the definition of operating are reported as non-operating revenues and expenses. Major funds are those whose assets, revenues, expenditures and liabilities are at least 10% percent of corresponding totals for all governmental or enterprise funds and at least 5% percent of the aggregate amount for all governmental and enterprise funds for the same item. The following are major governmental funds:
General Fund - The General Fund is the City’s primary operating fund. It accounts for all financial resources of the general government, except those required to be accounted for in other funds. In Fiscal Year 2018, the Special Revenue Metered Parking Fund was incorporated into the General Fund with the adoption of Resolution 2018-13. The FY 2018 budget was amended to reflect the change. Community Redevelopment Agency (CRA) Fund - The CRA Fund is a special revenue fund that accounts for the provisions of carrying out redevelopment activities that include reducing or eliminating blight, improving the tax base and encouraging public and private investments in the redevelopment area.
46

City of Cocoa Beach, Florida Notes to Financial Statements
September 30, 2018 A - SUMMARY OF SIGNIFICANT ACCOUNTING POLICIES (continued)
3. Measurement focus, basis of accounting, and financial statement presentation (continued) The following are major enterprise funds:
Utilities System Fund - The Utilities System Fund accounts for the provision of sewer and water reuse services to City residents and some county areas. Stormwater Management Fund - The Stormwater Management Fund accounts for the provision of stormwater drainage services to the residents of the City.
Fiduciary Funds report assets held in a trustee or agency capacity for others and therefore cannot be used to support the government’s own programs. The following are trust or agency funds:
Trust Funds - The three pension trust funds account for the accumulation of resources to be used for pension payments to retiring general employees, police officers, and firefighters of the City. The Other Post-Employment Benefits (OPEB) Trust Fund accounts for the accumulation of resources that are used for payments of retirement benefits other than pensions. Agency Fund - The City has no agency funds.
4. Cash and cash equivalents
The City’s cash and cash equivalents are considered to be cash on hand, demand deposits, and highly liquid short-term investments with original maturities of three months or less from the date of acquisition. The City maintains centralized checking accounts for all funds (except fiduciary funds). 5. Investments
The City’s investment activities are governed by Chapter 218.415, Florida Statutes. In accordance with this statute, the City may invest any surplus funds in (a) The Local Government Surplus Funds Trust Fund; (b) Securities and Exchange Commission registered money market funds with the highest credit quality rating from a nationally recognized rating agency; (c) interest-bearing time deposits or savings accounts in qualified public depositories; (d) direct obligations of the U.S. Treasury and (e) federal agencies and instrumentalities. Securities listed in (c) and (d) must be invested to provide sufficient liquidity to pay obligations as they come due. The City has adopted a formal investment policy in compliance with Florida Statutes. Investments are stated at fair value. Changes in the fair value during the year are included in investment income or loss. GASB 72, Fair Value Measurements, establishes a framework for measuring fair value. That framework provides a fair value hierarchy that prioritizes the inputs to valuation techniques used to measure fair value. The hierarchy gives the highest priority to unadjusted quoted prices in active markets for identical assets or liabilities (Level 1 measurements) and the lowest priority to unobservable inputs (Level 3 measurements). The hierarchy is based on the valuation inputs used to measure the fair value of the asset, as determined by the City’s investment advisors.
47

City of Cocoa Beach, Florida Notes to Financial Statements
September 30, 2018 A - SUMMARY OF SIGNIFICANT ACCOUNTING POLICIES (continued)
6. Receivables and payables Activity between funds that are representative of lending/borrowing arrangements outstanding at the end of the fiscal year are referred to as either “due to/from other funds” (the current portion of interfund loans) or “advances to/from other funds” (the non-current portion of interfund loans). All other outstanding balances between funds are reported as “due to/from other funds.” Any residual balances outstanding between the governmental activities and business-type activities are reported in the government-wide financial statements as “internal balances.”
Advances between funds, as reported in the fund financial statements, are offset by a nonspendable fund balance account in the applicable governmental funds to indicate that they are not available for appropriation and are not expendable available resources.
Trade receivables consist of account balances less than thirty days overdue. Account balances exceeding thirty days overdue are written off and sent to a collection agency. Therefore, all trade receivables reported are deemed collectible.
7. Inventory
Inventory is stated at cost, which approximates fair value, using the first-in, first-out (FIFO) inventory costing method. Inventory in governmental funds is recorded as an expenditure when purchased.
8. Prepayments and deposits
Certain payments to vendors reflect costs applicable to future accounting periods and are recorded as prepaid items in both government-wide and fund financial statements. These amounts are offset by a nonspendable fund balance account, which indicates that they do not constitute available resources.
9. Restricted assets
Certain assets of the City’s funds are classified as restricted assets on the statement of net position because their use is limited by applicable legal restrictions. The restrictions are for the following:
• Capital Improvement Revenue Note, Series 2014A
• Capital Improvement Refunding Revenue Note, Series 2014B
• CRA Improvement Revenue Bonds, Series 2017B
• Confiscated Property Fund
• SRF Loan Repayment Reserve (Clean Water State Revolving Loans 050610, 050620, &
050621)
See Note J for additional information.
48

City of Cocoa Beach, Florida Notes to Financial Statements
September 30, 2018 A - SUMMARY OF SIGNIFICANT ACCOUNTING POLICIES (continued)
10. Property and equipment
Capital assets, which include land, buildings, infrastructure, improvements, and equipment, are reported in the applicable governmental or business-type activities columns in the government-wide financial statements. Capital assets are defined by the City as assets with an initial, individual cost of more than $1,000 and an estimated useful life exceeding one year. The cost of improvements and replacements, which extend the useful lives of assets or increase their capacity, are capitalized. Repairs and maintenance costs, which do not improve or extend the useful life of the respective assets, are charged to expense. Property and equipment purchased by the City is recorded at cost or, if contributed, acquisition value at the date of donation. Capital assets use straight-line depreciation over the following estimated service lives:
Classification Service Life
Ranges Infrastructure 30 - 50 years Buildings and building improvements 40 years Improvements other than buildings 10 - 15 years Machinery, furniture and equipment 3 - 5 years
Major outlays for capital assets and improvements are capitalized, as projects are commissioned. For individual proprietary funds, interest incurred during the construction phase of capital assets is included as part of the capitalized value of the assets constructed. The amount of interest to be capitalized is calculated using the weighted average of construction expenditures multiplied by the interest rate on the debt.
11. Compensated absences
The City permits employees to accumulate earned but unused “paid-time-off” (PTO). PTO is accrued when incurred in the government-wide and proprietary fund financial statements. In governmental funds, a liability for these amounts is reported only if the PTO has matured, for example, as a result of employee resignations and retirements. Upon termination, PTO is paid in full, but limited to 480 hours. Bargaining unit members are paid in accordance with their respective contracts. This amount is charged to the fund in which the employee was budgeted. See Note I for a comprehensive recap by fund of the liability associated with compensated absences.
49

City of Cocoa Beach, Florida Notes to Financial Statements
September 30, 2018 A - SUMMARY OF SIGNIFICANT ACCOUNTING POLICIES (continued)
12. Long-term liabilities
Long-term debt and other long-term obligations are reported as liabilities in the government-wide financial statements for both governmental and business type activities and in the individual proprietary fund statements. Bond premiums and discounts, as well as issuance costs, are deferred and systematically amortized over the term of the bonds. Bonds payable are reported net of the applicable bond premium or discount. Bond issuance costs are expensed in the fiscal year incurred.
In the fund financial statements, governmental funds recognize bond premiums and discounts, as well as bond issuance costs, during the current period. The face amount of debt issued is reported as an “other financing” source. Premiums received on debt issuances are reported as other financing sources while discounts on debt issuances are reported as other financing uses. Issuance costs are reported as debt service expenditures. Losses incurred on refunding debt in Proprietary Funds is deferred and amortized over the shorter of the life of the new issue or the remaining life of the refunded issue. Only material amounts of accrued interest are recorded in the financial statements.
13. Fund equity
Fund balances for governmental funds are reported in classifications that comprise a hierarchy based primarily on the extent to which the government is bound to honor constraints on the specific purposes for which amounts in those funds can be spent.
The City reported the following governmental fund balances:
GeneralConfiscated
Property
Community Redevelopment
(CRA) Totals
Non-spendable:Prepaid items 191,541$ -$ 5,543$ 197,084$ Inventory 88,831 - - 88,831
Restricted:Revenue Note, Series 2014A 264,636 - - 264,636 Parking garage construction - - 4,494,922 4,494,922 Public safety - 180,521 - 180,521
Committed:Capital projects 629,521 - - 629,521 Municipal Facilities 1,000,000 - - 1,000,000
Unassigned:General government 5,039,536 - - 5,039,536
7,214,065$ 180,521$ 4,500,465$ 11,895,051$ Total Fund Balance
Fund balances:
FUND BALANCE - GOVERNMENTAL FUNDS
50

City of Cocoa Beach, Florida Notes to Financial Statements
September 30, 2018
A - SUMMARY OF SIGNIFICANT ACCOUNTING POLICIES (continued)
13. Fund equity (continued) Non-spendable fund balance Represents components not in spendable form and legally or contractually required to be maintained intact. Examples are inventories, prepaid expenditures, long-term portion of notes receivable, property acquired for resale and unrealized gains. The City Commission is the highest authority for these items. Restricted fund balance These amounts represent spending constraints externally imposed by law through constitutional provisions or enabling legislation or by agreements with creditors, grantors, or other governments. Funds to construct the new fire station were secured with Capital Improvement Revenue Note, Series 2014A and the annual debt service payment is in this classification. Also in this classification are funds to construct the new downtown parking garage that were secured with CRA Improvement Revenue Bonds, Series 2017B. See Notes H and J for additional details. The Confiscated Property Fund is governed by Chapter 932, Florida Statutes, meaning that the $180,521 monies from the fund must be spent for the purposes and items enumerated in the statute. These expenditures are requested by the Police Chief and approved by the City Commission.
Committed fund balance These amounts can only be used for specific purposes pursuant to constraints imposed by the City Commission. The constraints cannot be removed unless the Commission removes it in the same manner it was implemented. Resolution 2018-18 (passed October 18, 2018) amended the Fiscal Year 2019 budget to appropriate funds for capital projects not completed in the prior fiscal year. The Commission may cancel or defer any of the projects funded by the Resolution.
Assigned fund balance These amounts are constrained by the government’s intent they be used for specific purposes. Decisions with regard to these purposes and amounts will be as determined by the City Commission by Resolution.
Unassigned fund balance Represents amounts that have not been assigned to other funds and that have not been restricted, committed, or assigned to a specific purpose within the general fund. This includes residual positive fund balance within the General Fund which has not been classified within the other above mentioned categories. Unassigned fund balance may also include negative balances for any governmental fund if expenditures exceed amounts restricted, committed, or assigned for those specific purposes. Currently, this condition does not exist. When both restricted and unrestricted amounts are available for use, it is the City’s practice to use restricted resources first. Additionally, the City would first use committed, then assigned, and lastly unassigned amounts of unrestricted fund balance.
51
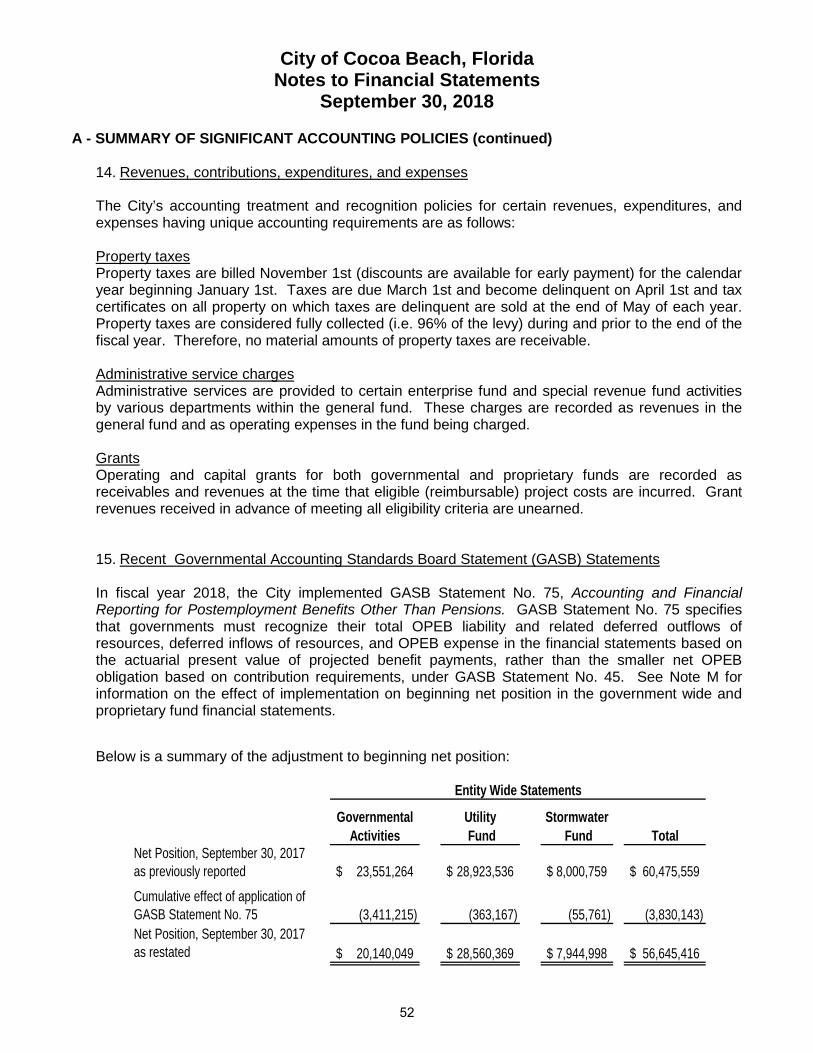
City of Cocoa Beach, Florida Notes to Financial Statements
September 30, 2018 A - SUMMARY OF SIGNIFICANT ACCOUNTING POLICIES (continued)
14. Revenues, contributions, expenditures, and expenses The City’s accounting treatment and recognition policies for certain revenues, expenditures, and expenses having unique accounting requirements are as follows:
Property taxes Property taxes are billed November 1st (discounts are available for early payment) for the calendar year beginning January 1st. Taxes are due March 1st and become delinquent on April 1st and tax certificates on all property on which taxes are delinquent are sold at the end of May of each year. Property taxes are considered fully collected (i.e. 96% of the levy) during and prior to the end of the fiscal year. Therefore, no material amounts of property taxes are receivable.
Administrative service charges Administrative services are provided to certain enterprise fund and special revenue fund activities by various departments within the general fund. These charges are recorded as revenues in the general fund and as operating expenses in the fund being charged. Grants Operating and capital grants for both governmental and proprietary funds are recorded as receivables and revenues at the time that eligible (reimbursable) project costs are incurred. Grant revenues received in advance of meeting all eligibility criteria are unearned. 15. Recent Governmental Accounting Standards Board Statement (GASB) Statements
In fiscal year 2018, the City implemented GASB Statement No. 75, Accounting and Financial Reporting for Postemployment Benefits Other Than Pensions. GASB Statement No. 75 specifies that governments must recognize their total OPEB liability and related deferred outflows of resources, deferred inflows of resources, and OPEB expense in the financial statements based on the actuarial present value of projected benefit payments, rather than the smaller net OPEB obligation based on contribution requirements, under GASB Statement No. 45. See Note M for information on the effect of implementation on beginning net position in the government wide and proprietary fund financial statements.
Below is a summary of the adjustment to beginning net position:
GovernmentalActivities
Utility Fund
Stormwater Fund Total
Net Position, September 30, 2017as previously reported 23,551,264$ 28,923,536$ 8,000,759$ 60,475,559$
Cumulative effect of application of GASB Statement No. 75 (3,411,215) (363,167) (55,761) (3,830,143) Net Position, September 30, 2017as restated 20,140,049$ 28,560,369$ 7,944,998$ 56,645,416$
Entity Wide Statements
52

City of Cocoa Beach, Florida Notes to Financial Statements
September 30, 2018
B - RECONCILIATION OF GOVERNMENT-WIDE AND FUND FINANCIAL STATEMENTS
1. Explanation of certain differences between the governmental funds balance sheet and the government-wide statement of net position
The governmental funds balance sheet includes reconciliation between fund balance-total governmental funds and net position-governmental activities as reported in the government-wide statement of net position. An element of that reconciliation explains that “long-term liabilities are not due and payable in the current period and, therefore, are not reported in the funds.” The details of this difference are as follows:
Capital Improvement Revenue Note, Series 2014A 3,309,622$ CRA Improvement Revenue Bonds, Series 2017 4,337,375 CRA Improvement Bond Premium 400,672 Master equipment lease payable 645,077 Accrued compensated absences 1,337,786
Net adjustment to reduce fund balance - total governmental funds to arrive at netposition - governmental activities 10,030,532$
2. Explanation of certain differences between the governmental funds statement of revenues,
expenditures, and changes in fund balances and government-wide statement of activities
The governmental fund statement of revenues, expenditures, and changes in fund balances includes reconciliation between net changes in fund balances - total governmental funds and changes in net position of governmental activities as reported in the government-wide statement of activities. One element of that reconciliation explains that “governmental funds report capital outlays as expenditures. However, in the statement of activities, the cost of those assets is allocated over their estimated useful lives and reported as depreciation expense.” The details of this difference are as follows:
Capital outlays and transfers (net) (Note G, Paragraph 3) 4,134,687$ Depreciation expense (2,487,675)
Net adjustment to increase net changes in fund balances - totalgovernmental funds to arrive at changes in net position - governmental activities 1,647,012$
Another element of the reconciliation explains that “the issuance of long-term debt (e.g., bonds) provides current financial resources to governmental funds, while the repayment of the principal of long-term debt consumes the current financial resources of governmental funds. Neither transaction, however, has any effect on net position. Also, governmental funds report the effect of issuance costs, premiums, discounts, and similar items when debt is first issued, whereas these amounts are deferred and amortized in the statement of activities.”
53

City of Cocoa Beach, Florida Notes to Financial Statements
September 30, 2018
B - RECONCILIATION OF GOVERNMENT-WIDE AND FUND FINANCIAL STATEMENTS (continued)
2. Explanation of certain differences between the governmental funds statement of revenues, expenditures, and changes in fund balances and government-wide statement of activities (continued)
The detail of this difference is as follows:
Principal payments on long-term debt:Capital improvement revenue note, Series 2014A 155,000$ Capital lease (golf carts) 54,352
Capital lease (equipment master lease) 245,215 New Capital lease (golf carts) (295,224) Amortization of bond premium 28,619
Net adjustment to increase net changes in fund balances - totalgovernmental funds to arrive at changes in net position - governmental activities 187,961$
A third element of the reconciliation states, “some expenses reported in the statement of activities did not require the use of current financial resources and, therefore, are not reported as expenditures in governmental funds.”
The details of this difference are as follows:
Change in accrued compensated absences 156,299$ Accrued interest expense (136,997)
Net adjustment to decrease net changes in fund balances - totalgovernmental funds to arrive at changes in net position - governmental activities 19,302$
A fourth element of the reconciliation states that “contributions to pension plans do not recognize the long-term net pension liability. However, in the statement of activities, the pension expense associated with service cost is recognized and the contributions to the pension plans reduce the net pension liability.”
The details of this difference are as follows:
General Employees'
Pension FundFirefighters'
Pension FundPolice Officers'Pension Fund Total
Pension contributions 510,000$ 609,433$ 860,000$ 1,979,433$ Pension expenses (650,474) (350,205) (642,779) (1,643,458)
(140,474)$ 259,228$ 217,221$ 335,975$
A final element of the reconciliation states that “contributions to the OPEB plan do not recognize the long-term net OPEB liability. However, in the statement of activities, the OPEB expense associated with service cost is recognized and the contributions to the OPEB plan reduce the net OPEB liability.”
The details of this difference are as follows:
OPEB contributions 299,461$ OPEB expenses (139,103)
160,358$
54

City of Cocoa Beach, Florida Notes to Financial Statements
September 30, 2018 C - BUDGETS
Budget policy Annual budgets are prepared for all funds except the following:
• The Confiscated Property Special Revenue Fund is not budgeted because its sole purpose is to account for property confiscated by law enforcement in accordance with State and Federal Law. The use of these funds is governed by Chapter 932, Florida statutes. Accordingly, these funds are held in a separate interest bearing account.
• The Pension and OPEB trust funds are not budgeted because the funds held in these
accounts are in trust for others; however, the City contributions to those funds are budgeted within the respective departments. See Notes L and M for additional information.
Annual operating budgets are prepared on a basis consistent with accounting principles generally accepted in the United States of America. Annual budget appropriations lapse at the end of each fiscal year. Open purchase orders and other commitments are recognized as expenditures in the period in which the actual goods or services are received and a liability is incurred. Encumbrances outstanding at year-end for unfulfilled obligations are canceled and appropriated in the succeeding year’s budget. Such amounts, if material, are disclosed in the notes to financial statements under “Commitments.” The City Commission, pursuant to Article V of the City Charter and state statutes, using the following procedures, adopts annual operating budgets:
• Each department, office or agency of the City submits a work program and budget request to the Chief Financial Officer during March of each year.
• The City Manager reviews the departmental requests, conducts workshop sessions and presents the proposed budget to the City Commission in July of each year.
• The City Commission holds a series of budget workshops and public hearings on the proposed budget and adopts the official annual budget of the City by resolution.
The budgets, as adopted, may be amended through formal approval by the City Commission. Budgetary integration is established in the accounting records for control purposes at the object of expenditure level; however, the City Charter establishes the level at which expenditures may not legally exceed budgeted amounts at the department level. The City’s general governmental appropriations are budgeted within the general fund as if it were a separate department. Items making up this legal level of budgetary control include current other general government expenditures, debt service expenditures and other financing uses. Resolution 2017-16 adopted September 21, 2017 contains budgets for the General Fund, Metered Parking Fund and CRA (governmental funds) as well as the Utilities System Fund, and the Stormwater Management Fund (enterprise funds). The budget was amended with Resolution 2018-13 to incorporate the Metered Parking Fund into the General Fund. The City Manager may transfer budgeted amounts within a department, office, or agency of the City without formal approval by the City Commission. The final budget amounts shown in the financial statements include all amendments as approved during the year by the City Commission.
55

City of Cocoa Beach, Florida Notes to Financial Statements
September 30, 2018
D - CASH AND INVESTMENTS The City’s cash and cash equivalents are considered to be cash on hand, demand deposits and certificates of deposit. The City maintains a centralized interest bearing checking account for all operating funds. At September 30, 2018, cash and cash equivalents consisted of the following:
Petty cash funds 8,818$ Florida Education Investment Trust (FEITF) 7,177,165 Florida Local Government Investment Trust 1,639,674 Bank balance (all accounts) 7,100,736 Total cash and cash equivalents 15,926,393 Less: cash and equivalents classified as restricted assets
Restricted Assets (see Note J for complete details) (6,082,314)
Available cash balance 9,844,079$
While the total carrying amount of our cash deposits is $15,926,393 the available cash balance is $9,844,079. The City has complied with the requirements of the Florida Security for Public Deposits Act (the Act) by maintaining its accounts at a qualified public depository as provided by Chapter 280 of the Florida Statutes. Under the Act, qualified public depositories must deposit with the State Treasurer eligible collateral in such amounts as required by the Act. Therefore, all cash deposits and certificates of deposit held by banks are classified as fully insured. The cash and cash equivalents listed above are exempt from fair market value hierarchy requirements of GASB 72, as discussed in Note D 3). 1. City investment policy and portfolio The City's investment policy is outlined in Resolution 2017-20. It allows the City to invest surplus money as provided by Florida Statute 218.415. The investment must be one of the following authorized types:
• The Local Government Surplus Funds Trust Fund or any intergovernmental investment pool
authorized pursuant to the Florida Interlocal Cooperation Act as provided in s. 163.01, Florida Statutes.
• Securities and Exchange Commission registered money market funds with the highest credit
quality ratings (AAA/AA) from a nationally recognized rating agency.
• Interest-bearing time deposits or savings accounts in qualified public depositories as defined in s. 280.02, Florida Statutes.
• Direct Obligations of the United States Treasury.
• Federal agencies and instrumentalities.
• Derivative products and margin purchases are expressly prohibited.
56

City of Cocoa Beach, Florida Notes to Financial Statements
September 30, 2018
D - CASH AND INVESTMENTS (continued) 2. City investment policy and portfolio (continued) The City’s investments at September 30, 2018, consisted of the following:
Less than One Year
1-5Years
OverFive Years Fair Value*
Direct Obligations of theU.S. Treasury (at fair value) -$ 845,788$ -$ 845,788$ Federal Agencies & Instrumentalities 125,281 5,209,381 - 5,334,662
Total investments 6,180,450$ *Includes temporarily restricted assets and accrued interest
Maturity Dates
The investment policy addresses and mitigates the risk types below as shown: (1) Interest Rate Risk – The policy requires the portfolio be structured with securities that maintain the greatest degree of liquidity and flexibility. The portfolio will maintain a structure with maturities staged to meet the City’s obligations as they come due. (2) Credit Risk – The City primarily invests in direct obligations of the U.S. Treasury, Federal agencies, and the State of Florida Local Government Surplus Trust Fund pool. (3) Custodial Risk – All cash and securities are held in accounts bearing the name of the City. Securities in such accounts, held in the “street name,” are considered held in the name of the City. (4) Concentration of Credit Risk – No more than 50% of the City’s funds will be invested with the same issuer, except direct obligations of the United States Treasury. No more than 50% of the City’s funds will be invested through the same investment institution or dealer. No more than 20% of the City’s funds will be invested beyond five years in any security with the same maturity date. 3. Fair value measurements
GASB 72, Fair Value Measurements, establishes a framework for measuring fair value. That framework provides a fair value hierarchy that prioritizes the inputs to valuation techniques used to measure fair value. The hierarchy gives the highest priority to unadjusted quoted prices in active markets for identical assets or liabilities (Level 1 measurements) and the lowest priority to unobservable inputs (Level 3 measurements).
57

City of Cocoa Beach, Florida Notes to Financial Statements
September 30, 2018
D - CASH AND INVESTMENTS (continued) 3. Fair value measurements (continued)
The three levels of the fair value hierarchy under GASB 72 are described as follows:
Level 1: Inputs to the valuation methodology are unadjusted quoted prices for identical assets or liabilities in active markets that the plan has the ability to access.
Level 2: Inputs to the valuation methodology include • quoted prices for similar assets or liabilities in active markets; • quoted prices for identical or similar assets or liabilities in inactive
markets; • inputs other than quoted prices that are observable for the asset or
liability; • inputs that are derived principally from or corroborated by observable
market data by correlation or other means. If the asset or liability has a specified (contractual) term, the level 2 input must be observable for substantially the full term of the asset or liability.
Level 3: Inputs to the valuation methodology are unobservable and significant to the fair value measurement.
The asset or liability’s fair value measurement level within the fair value hierarchy is based on the lowest level of any input that is significant to the fair value measurement. Valuation techniques used need to maximize the use of observable inputs and minimize the use of unobservable inputs. The following is a description of the valuation methodologies used for assets measured at fair value. There have been no changes in the methodologies used at September 30, 2018. Equities: Valued at quoted market prices. Mutual funds: Valued at quoted market prices. Alternative investments: Valued at net asset value, which approximates fair value. The methods described above may produce a fair value calculation that may not be indicative of net realizable value or reflective of future fair values. Furthermore, although the City believes its valuation methods are appropriate and consistent with other market participants, the use of different methodologies or assumptions to determine the fair value of certain financial instruments could result in a different fair value measurement at the reporting date. The following table sets forth by level, within the fair value hierarchy, the City’s assets at fair value as of September 30, 2018:
Investments by fair value level Level 1 Level 2 Level 3United States Treasuries 845,788$ - - United States Agencies 5,334,662 - - Total Investment by fair value level 6,180,450$ - -
58

City of Cocoa Beach, Florida Notes to Financial Statements
September 30, 2018 D - CASH AND INVESTMENTS (continued)
4. Pension fund investment policies A specific City ordinance created each pension fund. The Board of Trustees for each respective fund determines investment policies for each of the three pension trust funds. For each fund, no more than 5% of fund assets may be invested in the securities of any one issuing company (this excludes the U. S. Government and its agencies). No investment may exceed 5% of the outstanding capital stock of any one company. The aggregate investments in common and capital stock and convertible securities (at cost) may not exceed 65% of the assets of the Police and Fire funds, or 60% of the assets of the General Employees fund. Each fund maintains a list of prohibited investment security types. The following investment types are prohibited:
• Futures • General obligations issued by a foreign government • Hedge funds • Bonds issued by a state or municipality • Limited partnerships • Private equities • Options • Private mortgages • Margin accounts • Insurance annuities • Securities lending • Internally managed assets
The investment policies address and mitigate the risk types below as shown: (1) Interest Rate Risk – The funds’ investment policy requires that the portfolio be structured with sufficient liquidity to meet the funds’ obligations as they come due. (2) Credit Risk – The three pension trust funds each hold cash in their respective fund accounts. To mitigate credit risk, the time, savings and money market deposits of each fund in an institution may not exceed the Federal Deposit Insurance Corporation (FDIC) insurance coverage held by that institution for those amounts. (3) Custodial Risk – All cash and securities are held in accounts bearing the name of the respective fund. Securities in such accounts, even though held in the “street name” are considered held in the name of the fund. Fund managers are required to carry errors and omissions insurance coverage. (4) Concentration of Credit Risk – Each of the investment policies require that investments be diversified by security type. Each fund allocates the fund assets to a diversified portfolio of equities, fixed income and cash equivalent securities directed by a professional investment manager. Each fund has an independent investment consultant to evaluate and report on the performance of the investment managers.
59
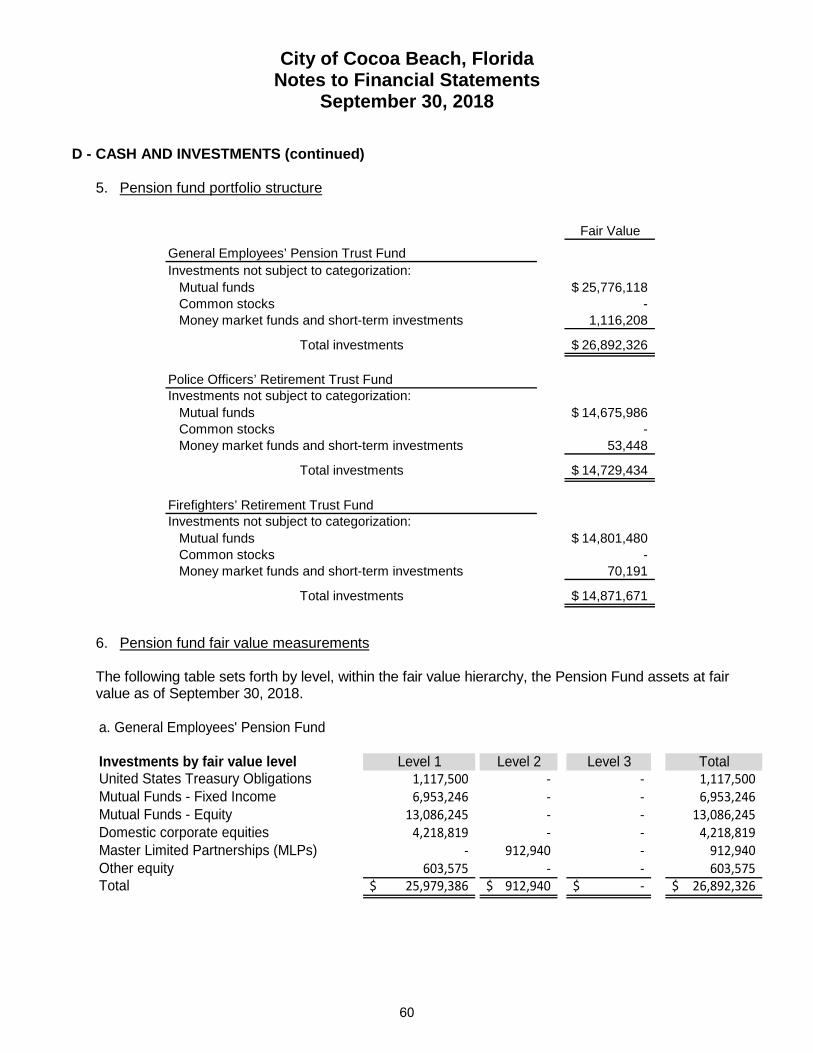
City of Cocoa Beach, Florida Notes to Financial Statements
September 30, 2018
D - CASH AND INVESTMENTS (continued)
5. Pension fund portfolio structure
Fair Value
General Employees’ Pension Trust FundInvestments not subject to categorization:
Mutual funds 25,776,118$ Common stocks - Money market funds and short-term investments 1,116,208
Total investments 26,892,326$
Police Officers’ Retirement Trust FundInvestments not subject to categorization:
Mutual funds 14,675,986$ Common stocks - Money market funds and short-term investments 53,448
Total investments 14,729,434$
Firefighters’ Retirement Trust FundInvestments not subject to categorization:
Mutual funds 14,801,480$ Common stocks - Money market funds and short-term investments 70,191
Total investments 14,871,671$
6. Pension fund fair value measurements The following table sets forth by level, within the fair value hierarchy, the Pension Fund assets at fair value as of September 30, 2018. a. General Employees' Pension Fund
Investments by fair value level Level 1 Level 2 Level 3 TotalUnited States Treasury Obligations 1,117,500 - - 1,117,500 Mutual Funds - Fixed Income 6,953,246 - - 6,953,246 Mutual Funds - Equity 13,086,245 - - 13,086,245 Domestic corporate equities 4,218,819 - - 4,218,819 Master Limited Partnerships (MLPs) - 912,940 - 912,940 Other equity 603,575 - - 603,575 Total 25,979,386$ 912,940$ -$ 26,892,326$
60

City of Cocoa Beach, Florida Notes to Financial Statements
September 30, 2018
D - CASH AND INVESTMENTS (continued)
6. Pension fund fair value measurements (continued) b. Police Officers' Retirement Trust Fund
Investments by fair value level Level 1 Level 2 Level 3 TotalUnited States Treasuries 53,448$ - - 53,448$ Mutual Funds - Fixed Income 3,127,555 - - 3,127,555 Mutual Funds - Equity 10,451,095 - - 10,451,095
Total by fair value level 13,632,098$ -$ -$ 13,632,098 Investments measured at
Net Asset Value (NAV)Real Estate Pooled Fund 1,097,336
Total Investments 14,729,434$
c. Firefighters' Retirement Trust Fund
Investments by fair value level Level 1 Level 2 Level 3 TotalUnited States Treasuries 70,191$ - - 70,191$ Mutual Funds - Fixed Income 3,108,002 - - 3,108,002 Mutual Funds - Equity 10,596,142 - - 10,596,142
Total by fair value level 13,774,335$ -$ -$ 13,774,335 Investments measured at
Net Asset Value (NAV)Real Estate Pooled Fund 1,097,336
Total Investments 14,871,671$
The real estate pooled fund has no unfunded commitments at September 30, 2018. The redemption frequency is quarterly and requires 30 days’ notice. This fund is valued at NAV of units held at the end of the period based upon the fair value of the underlying investments. Additional information about the City’s pension funds and fair value measurements within the fair value hierarchy established by generally accepted accounting principles are shown in Note L and in the RSI section. Maturities are considered less than one year for the above scheduled investments.
61

City of Cocoa Beach, Florida Notes to Financial Statements
September 30, 2018
E - UNEARNED REVENUE
Governmental funds report unearned revenue in connection with receivables for revenues that are not considered available to liquidate liabilities of the current period. Governmental funds also defer revenue recognition in connection with resources that have been received, but not yet earned. At September 30, 2018, the various components of unavailable revenue and unearned revenue reported in the governmental funds were as follows:
Unavailable Unearned
Business tax receipts received in Fiscal Year 2018 for Fiscal Year 2019 -$ 102,687$ Forfeited assets - 42,495 Total -$ 145,182$
F - INTERFUND RECEIVABLES, PAYABLES, AND TRANSFERS
1. Long-term advances to/from other funds
There are two long-term advances outstanding as of September 30, 2018.
a. In 2007, the Utilities System Enterprise Fund made a long-term advance to the Stormwater Enterprise Fund in the amount of $1,280,000 to fund the Ocean Beach Blvd. project construction phase. This advance is being repaid over a fifteen year period in annual installments including interest at 15.00% and will mature in Fiscal Year 2022.
b. Loans were made from the General Fund to the CRA Fund from Fiscal Year 2010 to Fiscal
Year 2013 in the amount of $261,230. Tax increment funding was not available prior to Fiscal Year 2014, so loans from the General Fund were made to provide funds for the development of the CRA plan. A repayment schedule was established in Fiscal Year 2015 and the principal payment of $21,230 was made with subsequent payments in the amount of $20,000 beginning in FY 2016. The advance is being repaid over a twelve year period in annual installments and will mature in Fiscal Year 2027.
Advance
Outstanding Balance at
9/30/18
Principal Due
in FY 2019(a) 377,654$ 94,142$ (b) 180,000 20,000
557,654$ 114,142$
1 Beginning in FY 2019, the amortization schedule will be recalculated using an interest rate of 2.5% to better reflect historical interest rates over the life of the loan.
62

City of Cocoa Beach, Florida Notes to Financial Statements
September 30, 2018 F - INTERFUND RECEIVABLES, PAYABLES, AND TRANSFERS (continued)
2. Interfund transfers Amounts are transferred from one fund to support expenditures of another fund in accordance with legally established budgets. Transfers between funds during the year ended September 30, 2018 were as follows: The Utility System Enterprise Fund transfer of $859,000 to the General Fund has three components. A payment in lieu of property taxes to compensate the General Fund for general government services in the amount of $700,000 is the first component. An offset for the cost of General Fund maintenance workers used on projects which benefit the utility department in the amount of $150,000 is the second component. The third component, in the amount of $9,000, is payment for use of retention ponds at the golf course.
The General Fund transfer to the CRA Fund in the amount of $245,375 represents the tax incremental financing (TIF) payment required. The Metered Parking Special Revenue Fund was incorporated into the General Fund with the adoption of Resolution 2018-13. As a result, the beginning fund balance in the Metered Parking Fund in the amount of $1,928,182 was transferred to the General Fund effective October 1, 2017. The amounts shown above specifically exclude the amounts the General Fund charges the enterprise funds each year for administrative support and services (e.g. payroll, accounts payable disbursements, etc.). These amounts are identified in the proprietary fund financial statements.
General CRATransfers out: Fund FundUtilities System Enterprise Fund 859,000$ -$ General Fund - 245,375 Metered Parking Special Revenue Fund 1,928,182 -
Total transfers 2,787,182$ 245,375$
Transfers in:
3. Due to/due from other funds (internal balances)
As of September 30, 2018, interfund balances are shown in the following table.
Utility General Due from: System FundStormwater Enterprise 94,142$ -$ Community Redevelopment Agency - 20,000
Total due to/from 94,142$ 20,000$
Due to:
Interfund balances represent the payments of expenditures paid by one fund on behalf of another fund and will be repaid within twelve months of year end.
63

City of Cocoa Beach, Florida Notes to Financial Statements
September 30, 2018
G - CAPITAL ASSETS 1. Governmental capital asset activity for the year ended September 30, 2018, was as follows:
Governmental activities:BeginningBalance Increases Decreases
EndingBalance
Capital assets, not being depreciated:
Land 7,950,653$ -$ -$ 7,950,653$ Construction in progress 572,364 2,280,277 (193,175) 2,659,466
Total capital assets, not being depreciated 8,523,017 2,280,277 (193,175) 10,610,119
Capital assets, being depreciated:
Buildings 10,300,253 121,792 (35,564) 10,386,481 Infrastructure 879,707 - - 879,707 Improvements other than buildings 22,725,365 558,822 (11,130) 23,273,057 Machinery and equipment 14,848,361 1,366,971 (1,790,354) 14,424,978
Total capital assets, being depreciated 48,753,686 2,047,585 (1,837,048) 48,964,223
Buildings (2,554,068) (268,473) 35,564 (2,786,977) Infrastructure (233,616) (17,440) - (251,056) Improvements other than buildings (12,370,722) (1,067,064) 11,130 (13,426,656)
Machinery and equipment (11,758,310) (1,134,698) 1,790,354 (11,102,654)
Total accumulated depreciation (26,916,716) (2,487,675) 1,837,048 (27,567,343)
Total capital assets, being depreciated, net 21,836,970 (440,090) - 21,396,880
Governmental activities capital assets, net 30,359,987$ 1,840,187$ (193,175)$ 32,006,999$
Less accumulated depreciation for:
64

City of Cocoa Beach, Florida Notes to Financial Statements
September 30, 2018
G - CAPITAL ASSETS (continued) 2. Business type capital asset activity for the year ended September 30, 2018, was as follows:
Business-type activities:BeginningBalance Increases
Decreases / Adjustments
EndingBalance
Capital assets, not being depreciated:
Land 1,691,599$ -$ -$ 1,691,599$ Construction in progress 297,433 747,004 (240,270) 804,166
Total capital assets, not being depreciated 1,989,032 747,004 (240,270) 2,495,765
Capital assets, being depreciated:
Buildings 3,982,591 - - 3,982,591 Infrastructure 49,194,875 299,600 - 49,494,475 Improvements other than buildings 23,232,127 20,500 (4,380) 23,248,247 Machinery and equipment 3,021,141 891,745 (34,800) 3,878,086
Total capital assets, being depreciated 79,430,734 1,211,845 (39,180) 80,603,399
Buildings (1,848,170) (88,335) - (1,936,505) Infrastructure (18,162,618) (1,192,835) - (19,355,453) Improvements other than buildings (6,918,743) (1,518,266) 4,380 (8,432,629) Machinery and equipment (2,606,825) (447,078) 34,800 (3,019,103)
Total accumulated depreciation (29,536,356) (3,246,514) 39,180 (32,743,690)
Total capital assets, being depreciated, net 49,894,378 (2,034,669) - 47,859,709
Business-type activities capital assets, net 51,883,410$ (1,287,665)$ (240,270)$ 50,355,474$
Less accumulated depreciation for:
65

City of Cocoa Beach, Florida Notes to Financial Statements
September 30, 2018
G - CAPITAL ASSETS (continued)
3. Depreciation expense charged to functions/programs of the City is as follows:
Governmental activities: Golf 214,517$
General government 392,094 Public safety 312,040 Transportation/public works 1,435,603 Recreation 133,421
Total depreciation expense -governmental activities 2,487,675$
Business-type activities:Utility 3,040,761$ Stormwater 205,753
Total depreciation expense - business-type activities 3,246,514$
Governmental current year activities:Assets being depreciated 2,047,585$ Construction in progress - increase 2,280,277 Construction in progress - decrease (193,175) Capital outlays and transfers (net) 4,134,687$
4. Construction (estimated) commitments are as follows: Minutemen Stormwater Streetscape, Residential Dredging projects, the new Police Station and Downtown Parking Garage account for major construction commitments. A complete list of projects by fund is included in adopted Resolution 2017-18. The scope of work for most projects shown below is preliminary. The commitments shown are order of magnitude, i.e. plus/minus thirty (+30%) percent, estimates for most projects. Replacements of existing equipment units are omitted.
Project Description Spent-to-date FY 2019BeyondFY 2019
Muck Dredging 1,311,405$ 1,105,102$ -$ PKCOMP - New Parking Garage 68,067 4,797,720 - PDCOMP - New Police Station 35,091 7,500,000 - Other projects (12) 5,600,073 5,129,074 4,938,576
Total 7,014,636$ 18,531,896$ 4,938,576$
Remaining Commitment
66

City of Cocoa Beach, Florida Notes to Financial Statements
September 30, 2018
G - CAPITAL ASSETS (continued)
5. Net investment in capital assets
Governmental Funds
Utility Fund
Stormwater Fund
Capital assets 59,574,342$ 73,118,912$ 9,980,251$ Less: Accumulated depreciation (27,567,343) (31,746,812) (996,879) Less: Outstanding principal of capital-related debt (8,555,749) (22,547,885) (1,141,177) Add: Unspent bond proceeds 4,127,081 - -
Net investment in capital assets 27,578,331$ 18,824,215$ 7,842,195$
Enterprise Funds
H - LONG-TERM DEBT
1. Revenue bonds and other debt instruments
OutstandingPrincipal
Capital Improvement Revenue Note, Series 2014A, payable in semi-annual installments beginningNovember 1, 2014 through November 1, 2033; interest rate is 3.28% secured by and payable from therevenue received for Utility Franchise Fees. Loan proceeds are used to pay costs of the new Fire StationConstruction Project. Loan has prepayment restrictions prior to May 1, 2024. Debt Service account withcurrent payment balance must be maintained. Covenant to budget and appropriate non-ad valoremrevenues. Original loan amount: $3,790,000. $ 3,265,000
Capital Improvement Revenue Refunding Note, Series 2014B, payable in semi-annual installmentsbeginning July 15, 2014 through July 15, 2023; interest rate 1.88%; secured by revenue received for UtilityFranchise Fees and payable from the net revenues derived from the operation of the City's sewer system.Loan has no prepayment restrictions. Debt Service account with current payment balance must bemaintained. Covenant to budget and appropriate non-ad valorem revenues. This loan advance refunded theremaining balance of Clean Water State Revolving Loan # 68506P. Original loan amount: $2,840,000. 1,550,000
Clean Water State Revolving Loan, # 050610 , payable in semi-annual installments beginning March 2014through September 2033; interest from 2.65% plus service charges. Issued to finance sewer treatment andrehabilitation projects; secured by and payable from the net revenues derived from the operation of the City'ssewer system. Original loan amount: $20,871,742. 16,987,829
Clean Water State Revolving Loan, # 050620, payable in proposed semi-annual installments beginningMay 2017 through November 2036; interest from 2.39% plus service charges. Issued to finance majorsewer rehabilitation and stormwater improvements; secured by and payable from the net revenues derivedfrom the operation of the City's sewer and stormwater system. Original loan amount: $4,180,624. 4,010,056
Clean Water State Revolving Loan, # 050621, payable in proposed semi-annual installments beginningDecember 2017 through June 2037; interest from .56 to 1.48% plus service charges. Issued to financemajor sewer rehabilitation and stormwater improvements; secured by and payable from the net revenuesderived from the operation of the City's sewer and stormwater system. Original loan amount: $1,193,215.
1,141,177
CRA Improvement Revenue Bonds, Series 2017B, payable in semi-annual installments beginning April 2018through October 2031; interest from 2.86% plus service charges. Issued to finance construction of a publicparking garage in the Downtown Community Redevelopment Area consisting of approximately 270 parkingspaces and will include an “artist’s wall” for displaying visual art by area artists.
4,245,000
In Fiscal Year 2018 the City entered into a Lease-Purchase Agreement in the amount of $295,224 for 110electric golf carts and a beverage cart, which act as collateral for the lease. The agreement includes anannual interest rate of 3.15%. A final payment of $19,610 is due in Fiscal Year 2022. Upon payment in fullof all lease payments, the rights of ownership of the golf carts, which have been reported as capital assets,will be conveyed to the City. 260,319
In Fiscal Year 2016 the City entered into a Master Equipment Lease Agreement in the amount of $878,703for purchase of a Vactor (vacon), Front End Loader, and 75 Parking Kiosks, which act as collateral for thelease. The agreement's original annual interest rate of 2.01716% was updated to 2.45% effective January2018. The equipment payment schedule ranges from 3 to 5 years. And final payment totaling $74,306 isdue in Fiscal Year 2021. Upon payment in full of all lease payments, the rights of ownership of the Vactor,Front-end loader, and 75 parking kiosks, which have been reported as capital assets, will be conveyed to theCity.
384,758
Total 31,844,139$
67

City of Cocoa Beach, Florida Notes to Financial Statements
September 30, 2018 H - LONG-TERM DEBT (continued)
2. Changes in long-term liabilities Long-term liability activity for the year ended September 30, 2018 (excluding long-term advances between funds) was as follows:
BeginningBalance Additions Reductions
EndingBalance
Due WithinOne Year
Governmental activities:
Note payable: Capital Improvement Revenue Note, Series 2014A 3,420,000$ -$ (155,000)$ 3,265,000$ 160,000$ CRA Improvement Revenue Bonds, Series 2017B 4,245,000 - - 4,245,000 220,000 Capital Leases 649,419 295,224 (299,566) 645,077 283,948
8,314,419 295,224 (454,566) 8,155,077 663,948 Plus bond premiums 429,291 - (28,619) 400,672 - Total bonds, notes, and leases payable 8,743,710 295,224 (483,185) 8,555,749 663,948
OPEB Liability 5,377,315 (1,265,768) - 4,111,547 - Net pension liability 6,831,349 - (1,031,799) 5,799,550 - Compensated absences 1,494,085 555,372 (711,671) 1,337,786 637,222 Governmental activity long-term liabilities 22,446,459$ (415,172)$ (2,226,655)$ 19,804,632$ 1,301,170$
Business-type activities:
Notes payable: Capital Improvement Refunding Revenue Note, Series 2014B 1,845,000 - (295,000) 1,550,000 300,000 State Revolving Loan # 050610 17,885,846 - (898,017) 16,987,829 923,589 State Revolving Loan # 050620 4,180,624 - (170,568) 4,010,056 174,669 State Revolving Loan # 050621 - 1,193,215 (52,038) 1,141,177 34,083 Total notes payable 23,911,470 1,193,215 (1,415,623) 23,689,062 1,432,341
OPEB Liability 712,509 (167,717) - 544,792 - Net pension liability 61,948 - (59,396) 2,552 - Compensated absences 238,491 116,883 (107,086) 248,288 111,419 Business-type activity long-term liabilities 24,924,418$ 1,142,381$ (1,582,105)$ 24,484,694$ 1,543,760$
For governmental activities, capital leases and compensated absences are generally liquidated by the General Fund. A detailed discussion of the OPEB liability including the allocation by fund is discussed in Note A, paragraph 15, Note M, and in the RSI section.
A detailed discussion of the compensated absence policy and its liability including the allocation by fund is discussed in Note A, paragraph 11 and Note I.
A detailed discussion of components of changes in the net pension liability by individual pension plan is disclosed in Note L, paragraph 8, and in the RSI section.
68

City of Cocoa Beach, Florida Notes to Financial Statements
September 30, 2018
H - LONG-TERM DEBT (continued)
3. Bond and note debt service requirements to maturity for governmental activities a.
Year EndingSeptember 30, Principal Interest
2019 160,000$ 104,468$ 2020 165,000 99,138 2021 170,000 93,644 2022 175,000 87,986 2023 180,000 82,164 2024 185,000 76,178 2025 190,000 70,028 2026 200,000 63,632 2027 205,000 56,990 2028 210,000 50,184 2029 220,000 43,132 2030 225,000 35,834 2031 235,000 28,290 2032 240,000 20,500 2033 250,000 12,464 2034 255,000 4,182 Total 3,265,000$ 928,814$
Governmental Activities Capital Improvement Revenue Note Series
2014A
b.
Year EndingSeptember 30, Principal Interest
2019 220,000$ 180,350$ 2020 230,000 171,350 2021 240,000 160,750 2022 250,000 148,500 2023 265,000 135,625 2024 280,000 122,000 2025 290,000 107,750 2026 305,000 92,875 2027 320,000 77,250 2028 340,000 60,750 2029 355,000 43,375 2030 370,000 28,950 2031 385,000 17,625 2032 395,000 5,925 Total 4,245,000$ 1,353,075$
Governmental Activities
Florida Municipal Loan CouncilCRA Revenue Bonds, Series 2017B
69

City of Cocoa Beach, Florida Notes to Financial Statements
September 30, 2018
H - LONG-TERM DEBT (continued)
4. Bond and note debt service requirements to maturity for business-type activities a.
Year EndingSeptember 30, Principal Interest
2019 300,000$ 29,140$ 2020 305,000 23,500 2021 310,000 17,766 2022 315,000 11,938 2023 320,000 6,016 Total 1,550,000$ 88,360$
Business-type Activities Capital Improvement Refunding Revenue
Note, Series 2014B
b.
Year EndingSeptember 30, Principal Interest
2019 923,589$ 474,013$ 2020 949,889 447,712 2021 976,940 420,662 2022 1,004,762 392,839 2023 1,033,378 364,224 2024 1,062,810 334,792 2025 1,093,081 304,521 2026 1,124,216 273,386 2027 1,156,238 241,363 2028 1,189,174 208,427 2029 1,223,050 174,552 2030 1,257,892 139,710 2031 1,293,728 103,874 2032 1,330,586 67,016 2033 1,368,495 29,106 Total 16,987,829$ 3,976,197$
Clean Water State Revolving Fund Loan
# 050610
Business-type Activities
70

City of Cocoa Beach, Florida Notes to Financial Statements
September 30, 2018
H - LONG-TERM DEBT (continued)
c.
Year EndingSeptember 30, Principal Interest
2019 174,669$ 94,803$ 2020 178,868 90,603 2021 183,169 86,303 2022 187,573 81,899 2023 192,082 77,389 2024 196,701 72,771 2025 201,430 68,042 2026 206,273 63,199 2027 211,232 58,239 2028 216,311 53,161 2029 221,512 47,960 2030 226,837 42,634 2031 232,291 37,181 2032 237,876 31,596 2033 243,595 25,876 2034 249,452 20,020 2035 255,449 14,022 2036 261,591 7,880 2037 133,145 1,591 Total 4,010,056$ 975,170$
Major Sewer Rehab & Stormwater Improvements
State Revolving Fund Loan*# 050620
Business-type Activities
d.
Year EndingSeptember 30, Principal Interest
2019 34,083$ 31,505$ 2020 57,936 7,652 2021 58,337 7,251 2022 58,742 6,846 2023 59,150 6,438 2024 59,561 6,027 2025 59,976 5,612 2026 60,394 5,194 2027 60,816 4,772 2028 61,242 4,346 2029 61,671 3,917 2030 62,104 3,484 2031 62,541 3,048 2032 62,981 2,607 2033 63,425 2,163 2034 63,873 1,715 2035 64,325 1,263 2036 64,781 807 2037 65,241 347
Total 1,141,177$ 104,995$
Major Sewer Rehab & Stormwater Improvements
State Revolving Fund Loan*# 050621
Business-type Activities
71

City of Cocoa Beach, Florida Notes to Financial Statements
September 30, 2018
H - LONG-TERM DEBT (continued)
5. Comprehensive summary of debt service requirements to maturity
Year EndingSeptember 30, Principal Interest
2019 2,096,288$ 928,365$ 2020 2,057,988 849,684 2021 2,089,316 793,124 2022 2,030,041 735,267 2023 2,049,610 671,857 2024 1,784,072 611,768 2025 1,774,511 555,953 2026 1,895,465 498,286 2027 2,013,681 438,614 2028 2,016,727 376,868 2029 2,081,233 312,936 2030 2,141,833 250,612 2031 2,208,560 190,017 2032 2,266,443 127,644 2033 1,925,515 69,609 2034 568,325 25,917 2035 319,775 15,285 2036 326,372 8,688 2037 198,385 1,938 Total 31,844,139$ 7,462,433$
Summary
I - COMPENSATED ABSENCES
An explanation of the compensated absences policy is given in Note A, paragraph 11. A comprehensive recap of the liability by fund is as follows:
BeginningBalance Additions Reductions
Ending Balance
Due WithinOne Year
General Fund 1,494,085$ 555,372$ (711,671)$ 1,337,786$ 637,222$
Enterprise Funds: Utilities System 196,302$ 95,794$ (86,409)$ 205,687$ 90,540$ Stormwater Management 42,189 21,089 (20,677) 42,601 20,879
Total Enterprise Funds 238,491$ 116,883$ (107,086)$ 248,288$ 111,419$
72
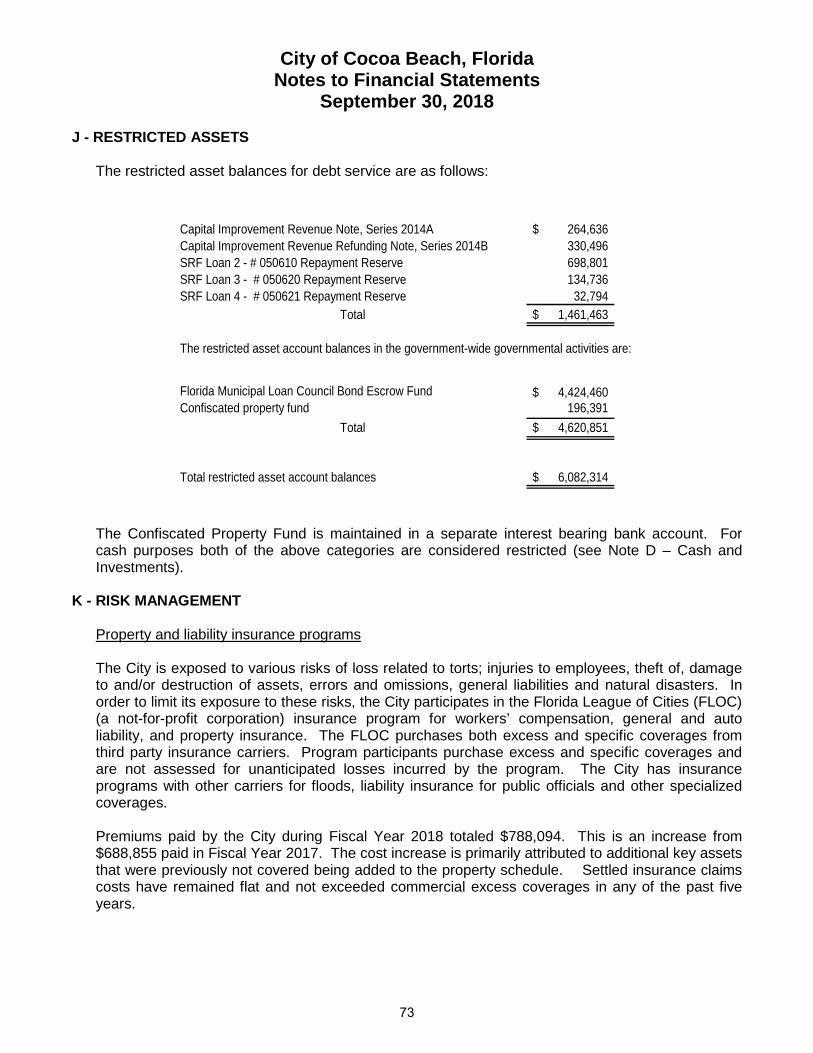
City of Cocoa Beach, Florida Notes to Financial Statements
September 30, 2018
J - RESTRICTED ASSETS
The restricted asset balances for debt service are as follows:
Capital Improvement Revenue Note, Series 2014A 264,636$ Capital Improvement Revenue Refunding Note, Series 2014B 330,496 SRF Loan 2 - # 050610 Repayment Reserve 698,801 SRF Loan 3 - # 050620 Repayment Reserve 134,736 SRF Loan 4 - # 050621 Repayment Reserve 32,794
Total 1,461,463$
Florida Municipal Loan Council Bond Escrow Fund 4,424,460$ Confiscated property fund 196,391
Total 4,620,851$
Total restricted asset account balances 6,082,314$
The restricted asset account balances in the government-wide governmental activities are:
The Confiscated Property Fund is maintained in a separate interest bearing bank account. For cash purposes both of the above categories are considered restricted (see Note D – Cash and Investments).
K - RISK MANAGEMENT Property and liability insurance programs
The City is exposed to various risks of loss related to torts; injuries to employees, theft of, damage to and/or destruction of assets, errors and omissions, general liabilities and natural disasters. In order to limit its exposure to these risks, the City participates in the Florida League of Cities (FLOC) (a not-for-profit corporation) insurance program for workers’ compensation, general and auto liability, and property insurance. The FLOC purchases both excess and specific coverages from third party insurance carriers. Program participants purchase excess and specific coverages and are not assessed for unanticipated losses incurred by the program. The City has insurance programs with other carriers for floods, liability insurance for public officials and other specialized coverages. Premiums paid by the City during Fiscal Year 2018 totaled $788,094. This is an increase from $688,855 paid in Fiscal Year 2017. The cost increase is primarily attributed to additional key assets that were previously not covered being added to the property schedule. Settled insurance claims costs have remained flat and not exceeded commercial excess coverages in any of the past five years.
73

City of Cocoa Beach, Florida Notes to Financial Statements
September 30, 2018
L - EMPLOYER RETIREMENT PLANS The City maintains three contributory single-employer defined benefit pension plans (Plans) that provide for retirement, disability and death benefits as described below. These Plans are:
City of Cocoa Beach General Employees’ Pension Trust Fund (General Employees) City of Cocoa Beach Police Officers’ Retirement Trust Fund (Police Employees) City of Cocoa Beach Firefighters’ Retirement Trust Fund (Fire Employees)
1. Summary of significant accounting policies (all Plans) Basis of accounting The Plans’ financial statements are prepared using the accrual basis of accounting. Plan member contributions are recognized in the period in which the contributions are due. Employer contributions to each plan are recognized when due and the employer has made a formal commitment to provide the contributions. Benefits, refunds and administrative costs are recognized when due and payable in accordance with the terms of each plan. On-behalf payments, made by the state totaling $107,105 and $111,216 for the Police Officers’ and Firefighters’ plans respectively, were recognized as revenues and expenditures in the General Fund during the year ended September 30, 2018. Method used to value investments The asset or liability’s fair value measurement level within the fair value hierarchy is based on the lowest level of any input that is significant to the fair value measurement. Valuation techniques used need to maximize the use of observable inputs and minimize the use of unobservable inputs. Investments are reported at fair value. Short-term investments are reported at cost, which approximates fair value. Securities traded on a national or international exchange are valued at the last reported sales price at current exchange rates. Investments that do not have an established market are reported at estimated fair value. Presentation of financial statements The Plans do not issue stand-alone financial reports and are not included in the reports of any other entity. Funding requirements At the request of the Division of Retirement, the City is required to fund the actuarially determined percentage of payroll for fiscal years beginning October 1, 2009 instead of a disclosed dollar requirement. Contributions Active members of each Plan are required to contribute 5% of base wages to the Plan. For all plans, the City pays the amount required in order to pay current costs and amortize unfunded past service cost, if any, as provided in Chapter 112, Florida Statutes.
74

City of Cocoa Beach, Florida Notes to Financial Statements
September 30, 2018
L - EMPLOYER RETIREMENT PLANS (continued)
2. General Employees’ Pension Trust Fund
Plan administration The Plan is administered by a Board of Trustees comprised of:
a. Two Trustees who are Plan participants, either a current employee or a retiree receiving benefits, elected by the employees in secret ballot elections;
b. One resident of the City to be appointed by the City Commission; c. One member of the City Commission chosen by the City Commission; d. The City Chief Financial Officer who serves as Chairman of the Board of Trustees. Plan membership as of October 1, 2017:Inactive plan members or beneficiaries currently receiving benefits 83Inactive plan members entitled to but not yet receiving benefits 31Active plan members 128
242
Normal retirement Age 62 and 5 years of Credited Service. Benefit Amount: If employed on or after 11/18/1999, 2.50% of Average Final Compensation times Credited Service. If employed before 11/18/1999, 3.00% of Average Final Compensation times Credited Service. If the Member had 25 or more years of Credited Service on 12/31/1998, the maximum benefit payable is 90% of Average Final Compensation. Otherwise, the maximum benefit payable is 80% of Average Final Compensation. Early retirement Age 52 and 5 years of Credited Service. Disability benefit Benefit accrued to date of disability, reduced as for Early Retirement from date of disability to Normal Retirement Date. Death benefit pre-retirement Vested: Accrued benefit paid to beneficiary for life at the Member's Normal Retirement Date (unreduced) or on a reduced basis at the otherwise Early Retirement Date. The monthly accrued benefit is payable to designated beneficiary for 10 years. Non-Vested: Refund of accumulated Member Contributions. Death benefit post-retirement According to optional form of benefit selected. Vesting schedule Employee vested after completion of 5 years of Credited Service.
75

City of Cocoa Beach, Florida Notes to Financial Statements
September 30, 2018 L - EMPLOYER RETIREMENT PLANS (continued)
3. Police Officers’ Retirement Trust Fund Plan administration The Plan is administered by a Board of Trustees comprised of:
a. Two City Commission appointees who are City residents; b. Two elected Members of the Plan; c. Fifth Member elected by other four and appointed by Commission.
Plan Membership as of October 1, 2017:Inactive plan members or beneficiaries currently receiving benefits 34Inactive plan members entitled to but not yet receiving benefits 7Active plan members 34
75
Normal retirement Earlier of: 1) Age 55 and the completion of 10 years of Credited Service, 2) Age 52 and the completion of 25 years of Credited Service, or 3) the completion of 30 years of Credited Service, regardless of age completion of 25 years of Credited Service, or 3) the completion of 30 years of Credited Service, regardless of age. Benefit amount: Retirement benefits are calculated as 4.00% of Average Final Compensation (AFC) times Credited Service before 11/19/1998, plus 3.00% of AFC times Credited Service on or after 11/19/1998. Early retirement Age 50 and 10 Years of Credited Service. Disability Service Incurred: Covered from Date of Employment Non-Service Incurred: Ten years of Credited Service Benefit accrued to date of disability but not less than 42% of Average Monthly Earnings (Service Incurred) Death benefits pre-retirement Vested: Monthly accrued benefit payable to designated beneficiary for 10 years. Non-Vested: Refund of accumulated contributions without interest.
Death benefits post-retirement Benefits payable to beneficiary in accordance with option selected at retirement. Vesting (termination) Less than 10 years of Contributing Service: Refund of Member Contributions with 3% interest per annum. Ten years or more: Accrued benefit payable at otherwise Normal Retirement Date if Member contributions left in Fund or Refund of Member Contributions.
76

City of Cocoa Beach, Florida Notes to Financial Statements
September 30, 2018 L - EMPLOYER RETIREMENT PLANS (continued)
3. Police Officers’ Retirement Trust Fund (continued) Deferred Retirement Option Program (DROP) Eligibility: Satisfaction of Normal Retirement requirements. Participation: Not to exceed 60 months. Rate of Return: Actual net rate of investment return (total return net of brokerage commissions, transaction costs, and management fees). The DROP balance as of September 30, 2018 is $ 306,297.
4. Firefighters’ Retirement Trust Fund Plan administration The Plan is administered by a Board of Trustees comprised of:
a. Two City Commission appointees who are City residents; b. Two elected Members of the Plan; c. Fifth Member elected by other four and appointed by Commission.
Plan Membership as of October 1, 2017:Inactive plan members or beneficiaries currently receiving benefits 22Inactive plan members entitled to but not yet receiving benefits 4Active plan members 25
51
Normal retirement: Eligibility: Earlier of: 1) Age 55 and the completion of 10 years of Credited Service, or 2) the completion of 25 years of Credited Service, regardless of age. Benefit amount: 4.00% of Average Final Compensation (AFC) times Credited Service before 11/19/1998, plus 3.00% of AFC times Credited Service on or after 11/19/1998. Early retirement Age 45 and 10 years of Credited Service. Benefit Amount: Deferred benefit payable at Normal Retirement or immediate benefit reduced 3% per year. Disability Service Incurred: Covered from Date of Employment Non-Service Incurred: Ten years of Credited Service. Benefit accrued to date of disability but not less than 42% of Average Monthly Earnings (Service Incurred). Death benefits pre-retirement Vested: Monthly accrued benefit payable to designated beneficiary for 10 years. Non-Vested: Refund of accumulated contributions without interest.
77

City of Cocoa Beach, Florida Notes to Financial Statements
September 30, 2018
L - EMPLOYER RETIREMENT PLANS (continued) 4. Firefighters’ Retirement Trust Fund (continued)
Death benefits post-retirement Benefits payable to beneficiary in accordance with option selected at retirement. Vesting (termination) Less than 10 years of Contributing Service: Refund of Member Contributions 10 year of more: Accrued benefit payable at otherwise Normal Retirement Date if Member contributions left in Fund or Refund of Member Contributions. Deferred Retirement Option Program (DROP) Eligibility: Satisfaction of Normal Retirement requirements. Participation: Not to exceed 60 months. Rate of Return: Actual net rate of investment return (total return net of brokerage commissions, transaction costs, and management fees). The DROP balance as of September 30, 2018 is $ 384,482. 5. Net pension liability of City
The City’s net pension liability was measured as of September 30, 2018. The total pension liability used to calculate the net pension liability was determined as of that date.
The components of the net pension liability of the City as of September 30, 2018 were as follows:
GeneralEmployees'
PoliceEmployees'
FireEmployees'
Total pension liability 26,902,476$ 18,943,710$ 16,501,830$ Plan fiduciary net position (26,892,326)$ (14,735,955)$ (14,917,633)$ City's net pension liability 10,150$ 4,207,755$ 1,584,197$ Plan fiduciary net position as a percentage of total pension liability 99.96% 77.79% 90.40% Actuarial assumptions: The total pension liability for all plans was determined by an actuarial valuation as of October 1, 2017 updated to September 30, 2018 using the following actuarial assumptions applied to all measurement periods.
GeneralEmployees'
PoliceEmployees'
FireEmployees'
Inflation 2.50% 2.50% 2.50%Salary increases 3.00% - 18.00% 4.5% - 13.00% 4.50% - 6.50%Discount rate 7.75% 7.75% 7.75%Investment rate of return 7.75% 7.75% 7.75% Mortality rates for the General Employees’ Fund were based on the RP-2000 Generational Mortality Tables, projected to valuation date using scale BB. Mortality rates for the Police and Fire Employees' Funds were based on the RP-2000 Table with no projection date. Based on a study of over 650 public safety funds, the table reflects a 10% margin for future mortality improvements.
78

City of Cocoa Beach, Florida Notes to Financial Statements
September 30, 2018
L - EMPLOYER RETIREMENT PLANS (continued)
5. Net pension liability of City (continued) For the General Employees' Fund measurement date 9/30/2018, as required by Chapter 2015-157, Laws of Florida, the assumed rates of mortality are consistent with those in the July 1, 2016 Florida Retirement System (FRS) valuation report. Long-term expected rate of return – all Plans The long-term expected rate of return on all pension plan investments was determined using a building-block method in which best-estimate ranges of expected future real rates of return (expected returns, net of pension plan investment expenses and inflation) are developed for each major asset class. These ranges are combined to produce the long-term expected rate of return by weighting the expected future real rates of return by the target asset allocation percentage and by adding expected inflation. Best estimates of arithmetic real rates of return for each major asset class included in the pension plan’s target asset allocation as of September 30, 2018 are summarized in the following table:
Asset ClassTarget
Allocation
Long-term Expected
Real Rate of Return
Target Allocation
Long-term Expected Real Rate of Return
Target Allocation
Long-term Expected
Real Rate of Return
Domestic equity 35% 8.10% 50% 7.50% 50% 7.50%International equity 15% 3.40% 15% 8.50% 15% 8.50%Broad market fixed income - - 20% 2.50% 20% 2.50%Bonds 30% 3.60% - - - - Convertibles 10% 6.70% - - - - Global fixed income - - 5% 3.50% 5% 3.50%Real estate - - 10% 4.50% 10% 4.50%REITS 5% 6.80% - - - - MLPs 5% 9.40% - - - -
GeneralEmployees'
PoliceEmployees'
FireEmployees'
Investment concentrations The Plans did not hold investments in any one organization that represent 5% or more of the Pension Plan's fiduciary net position.
79

City of Cocoa Beach, Florida Notes to Financial Statements
September 30, 2018
L - EMPLOYER RETIREMENT PLANS (continued)
5. Net pension liability of City (continued) Rate of return For the year ended September 30, 2018 the annual money-weighted rate of return on Pension Plan investments, net of pension plan investment expense, was 7.82% for the General Employees’ Plan, 11.71% for the Police Employees’ Plan and 11.89% for the Fire Employees’ Plan as shown in the table below. The money-weighted rate of return expresses investment performance, net of investment expense, adjusted for the changing amounts actually invested.
General Police FireFiscal Year 2018 Employees Employees Employees
Annual Money-Weighted Rate of ReturnNet of Investment Expense 7.82% 11.71% 11.89%
Discount rate The discount rate used to measure the total all three Plan’s pension liability was 7.75%. The projection of cash flows used to determine the discount rate assumed that plan member contributions will be made at the current contribution rate and the city contributions will be made at rates equal to the difference between actuarially determined contribution rates and the member rate. Based on those assumptions, the pension plan’s fiduciary net position was projected to be available to make all projected future benefit payments of current plan members. Therefore, the long-term expected rate of return on pension plan investments was applied to all periods of projected benefit payment to determine the total pension liability as shown in the table below.
City's Net Pension Liability1% Decrease
6.75%
Current Discount
Rate7.75%
1% Increase8.75%
General Employees' Fund 2,790,005$ 10,150$ (2,361,290)$
Police Employees' Fund 6,386,290$ 4,207,755$ 2,401,052$
Fire Employees' Fund 3,406,211$ 1,584,197$ 57,263$
80

City of Cocoa Beach, Florida Notes to Financial Statements
September 30, 2018 L - EMPLOYER RETIREMENT PLANS (continued)
6. Pension plan financial statements
a. Statement of plan net position – fair value General
Employees' Pension Trust
Fund
Police Officers'
Retirement Trust Fund
Firefighters' Retirement Trust
Fund TotalASSETSCash and cash equivalents: Short-term Investments 630$ 53,448$ 70,191$ 124,269$ Money market 1,115,578 - - 1,115,578 Total cash and equivalents 1,116,208 53,448 70,191 1,239,847
Receivable: Additional City contributions - - 39,433 39,433 Investment income - 6,521 6,529 13,050 Total receivable - 6,521 45,962 52,483
Investments: Mutual funds: Fixed income 8,083,996 3,127,555 3,108,002 14,319,553 Equity 16,779,182 10,451,095 10,596,143 37,826,420 Pooled/common/commingled funds: Equity 912,940 - - 912,940 Real estate - 1,097,336 1,097,336 2,194,672 Total investments 25,776,118 14,675,986 14,801,480 55,253,584
Total assets 26,892,326 14,735,955 14,917,633 56,545,914
Total liabilities - - - -
Net position restricted for pensions 26,892,326 14,735,955 14,917,633 56,545,914
Total liabilities and net position 26,892,326$ 14,735,955$ 14,917,633$ 56,545,914$
81
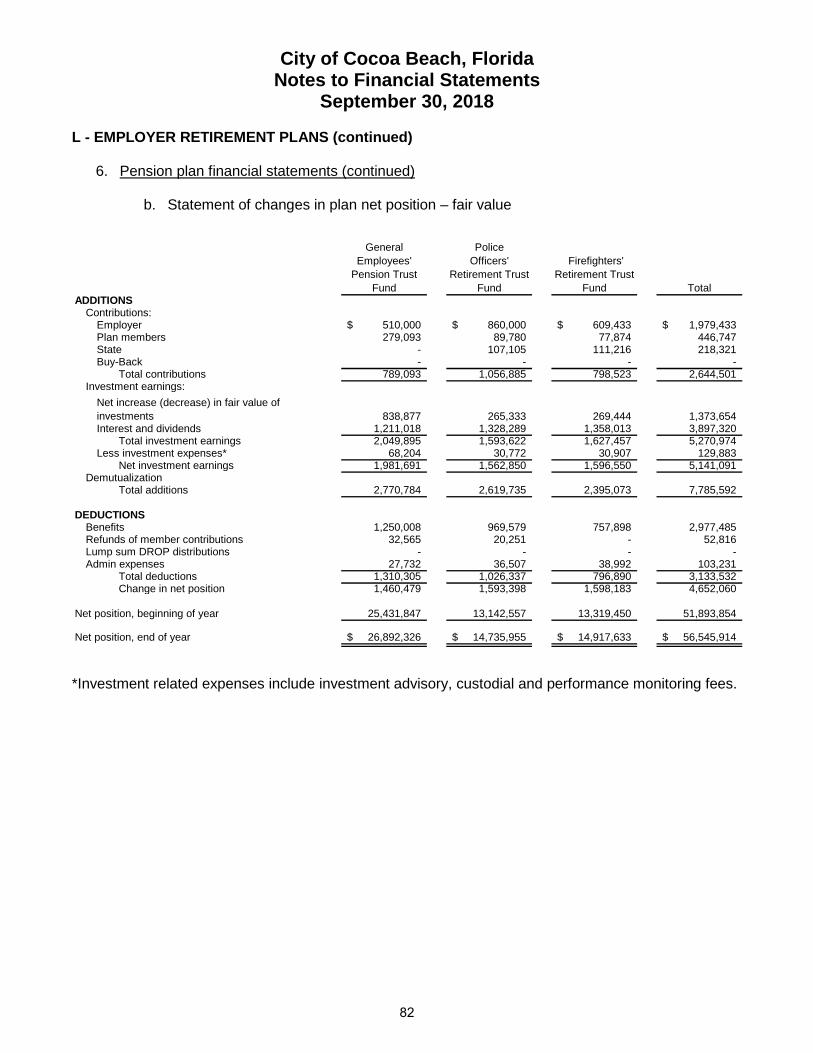
City of Cocoa Beach, Florida Notes to Financial Statements
September 30, 2018
L - EMPLOYER RETIREMENT PLANS (continued) 6. Pension plan financial statements (continued)
b. Statement of changes in plan net position – fair value
General Employees'
Pension Trust Fund
Police Officers'
Retirement Trust Fund
Firefighters' Retirement Trust
Fund TotalADDITIONS
Contributions:Employer 510,000$ 860,000$ 609,433$ 1,979,433$ Plan members 279,093 89,780 77,874 446,747 State - 107,105 111,216 218,321 Buy-Back - - - -
Total contributions 789,093 1,056,885 798,523 2,644,501 Investment earnings:
Net increase (decrease) in fair value of investments 838,877 265,333 269,444 1,373,654 Interest and dividends 1,211,018 1,328,289 1,358,013 3,897,320
Total investment earnings 2,049,895 1,593,622 1,627,457 5,270,974 Less investment expenses* 68,204 30,772 30,907 129,883
Net investment earnings 1,981,691 1,562,850 1,596,550 5,141,091 Demutualization
Total additions 2,770,784 2,619,735 2,395,073 7,785,592
DEDUCTIONSBenefits 1,250,008 969,579 757,898 2,977,485 Refunds of member contributions 32,565 20,251 - 52,816 Lump sum DROP distributions - - - - Admin expenses 27,732 36,507 38,992 103,231
Total deductions 1,310,305 1,026,337 796,890 3,133,532 Change in net position 1,460,479 1,593,398 1,598,183 4,652,060
Net position, beginning of year 25,431,847 13,142,557 13,319,450 51,893,854
Net position, end of year 26,892,326$ 14,735,955$ 14,917,633$ 56,545,914$
*Investment related expenses include investment advisory, custodial and performance monitoring fees.
82

City of Cocoa Beach, Florida Notes to Financial Statements
September 30, 2018
L - EMPLOYER RETIREMENT PLANS (continued) 7. Pension expense and deferred inflows/outflows of resources related to pensions
For the year ended September 30, 2018 the City recognized a pension expense of $697,648 for the General Employees’ Plan; $749,884 for the Police Officers’ Plan; and $461,421 for the Firefighters’ Plan. On September 30, 2018 the City reported deferred outflows of resources and deferred inflows of resources related to pensions from the following sources:
Deferred Outflow of Resources
Deferred Inflow of
Resources
Deferred Outflow of Resources
Deferred Inflow of
Resources
Deferred Outflow of Resources
Deferred Inflow of
Resources
Difference between expected and actual experience 281,595$ 235,308$ 538,370$ 51,339$ 452,420$ 22,205$
Changes of assumptions 300,134 - 177,611 - 70,482 -
Net difference between projected and actual earnings of pension plan investments - 197,302 - 705,543 - 723,040 Total 581,729$ 432,610$ 715,981$ 756,882$ 522,902$ 745,245$
GeneralEmployees'
PoliceEmployees'
FireEmployees'
The amounts reported as deferred outflows of resources and deferred inflows of resources related to pensions will be recognized in pension expense as follows:
Year ended September 30:General
Employees'Police
Employees'Fire
Employees'2019 364,145$ 248,679$ 148,728$ 2020 (91,246) (61,565) (90,515) 2021 (96,151) (119,391) (167,710) 2023 - - -
Thereafter - - -
83

City of Cocoa Beach, Florida Notes to Financial Statements
September 30, 2018
L - EMPLOYER RETIREMENT PLANS (continued) 8. Changes in net pension liability and sensitivity to changes in discount rate
a. General Employees’ Retirement Fund
Total PensionLiability
Plan Fiduciary Net Position
Net PensionLiability
Balances at September 30, 2017 25,678,257$ 25,431,847$ 246,410$ Changes for a year:
Service cost 625,201 - 625,201 Interest 1,988,818 - 1,988,818
(107,227) - (107,227) Contributions - employer - 510,000 (510,000) Contributions - employee - 279,093 (279,093) Net investment income - 1,981,691 (1,981,691)
(1,282,573) (1,282,573) - Administrative expense - (27,732) 27,732
Net changes 1,224,219 1,460,479 (236,260) Balances at September 30, 2018 26,902,476$ 26,892,326$ 10,150$
Increase (Decrease)
Differences between expected and actual experience
Benefit payments, including refunds of employee contributions
84

City of Cocoa Beach, Florida Notes to Financial Statements
September 30, 2018 L - EMPLOYER RETIREMENT PLANS (continued)
8. Changes in net pension liability and sensitivity to changes in discount rate (continued)
b. Police Officers’ Retirement Fund:
Total PensionLiability
Plan Fiduciary Net Position
Net PensionLiability
Balances at September 30, 2017 17,795,741$ 13,142,557$ 4,653,184$ Changes for a year:
Service cost 312,449 - 312,449 Interest 1,365,029 - 1,365,029
460,321 - 460,321 Contributions - employer - 860,000 (860,000) Contributions - state - 107,105 (107,105) Contributions - employee - 89,780 (89,780) Net investment income - 1,562,850 (1,562,850)
(989,830) (989,830) - Administrative expense - (36,507) 36,507
Net changes 1,147,969 1,593,398 (445,429) Balances at September 30, 2018 18,943,710$ 14,735,955$ 4,207,755$
Increase (Decrease)
Differences between expected and actual experience
Benefit payments, including refunds of employee contributions
85

City of Cocoa Beach, Florida Notes to Financial Statements
September 30, 2018 L - EMPLOYER RETIREMENT PLANS (continued)
8. Changes in net pension liability and sensitivity to changes in discount rate (continued)
c. Firefighters’ Retirement Fund:
Total PensionLiability
Plan Fiduciary Net Position
Net PensionLiability
Balances at September 30, 2017 15,532,287$ 13,319,450$ 2,212,837$ Changes for a year:
Service cost 252,306 - 252,306 Interest 1,193,937 - 1,193,937
281,198 - 281,198 Contributions - employer - 609,433 (609,433) Contributions - state - 111,216 (111,216) Contributions - employee - 77,874 (77,874) Net investment income - 1,596,550 (1,596,550)
(757,898) (757,898) - Administrative expense - (38,992) 38,992
Net changes 969,543 1,598,183 (628,640)
Balances at September 30, 2018 16,501,830$ 14,917,633$ 1,584,197$
Increase (Decrease)
Differences between expected and actual experience
Benefit payments, including refunds of employee contributions
M - OTHER POST-EMPLOYMENT BENEFITS (OPEB)
Generally accepted accounting principles require that state and local governmental employers account for and report the annual cost of OPEB and the outstanding obligations and commitments related to OPEB. In fiscal year 2018, the City implemented GASB Statement No. 75, Accounting and Financial Reporting for Postemployment Benefits Other Than Pensions. GASB Statement No. 75 specifies that governments must recognize their total OPEB liability and related deferred outflows of resources, deferred inflows of resources, and OPEB expense in the financial statements based on the actuarial present value of projected benefit payments, rather than the smaller net OPEB obligation based on contribution requirements, under GASB Statement No. 45. For purposes of measuring the net OPEB Liability, deferred outflows of resources and deferred inflows of resources related to OPEB, and OPEB expense, information about the fiduciary net position of the City's Retiree Health Care Plan (Plan) and additions to/ deductions from the Plan's fiduciary net position have been determined on the same basis as they are reported by The Plan. For this purpose, the Plan recognizes benefit payments when due and payable in accordance with the benefit terms. Investments are reported at fair value, except for money market investments, which are reported at cost.
86

City of Cocoa Beach, Florida Notes to Financial Statements
September 30, 2018 M - OTHER POST-EMPLOYMENT BENEFITS (OPEB) (continued)
General Information about the OPEB Plan 1. Plan Description
The City of Cocoa Beach’s Retiree Health Care Plan (Plan) is a single-employer defined benefit postemployment health care plan that covers eligible retired employees. The Plan, which is administered by the City, allows employees who retire and meet retirement eligibility requirements under one of the City’s retirement plans to continue medical and life insurance coverage as a participant in the City’s plan. 2. Employees covered by benefit terms
As of October 1, 2017, the following employees were covered by benefit terms:
Inactive Plan Members or beneficiaries currently receiving benefits 68 Inactive Plan Members entitled to but not yet receiving benefits - Active Plan Members 191
259
3. Benefits Provided
The benefits provided are the same as those provided for active employees. Spouses and dependents of eligible retirees are also eligible for medical coverage. All full-time employees of the City of Cocoa Beach are eligible to receive postemployment health care benefits. Coverage for retirees and their spouses and dependents is provided for life. The Trust was established with the intent to advance fund benefits provided under the Plan. 4. Contributions
Pre-Medicare retirees who retired prior to January 1, 2009 and retired from active service before January 1, 2014 (with a minimum of 10 years of service) and participate in the group insurance plan offered by the City of Cocoa Beach are required to contribute 50% of the active premium. Once these retirees are Medicare eligible, the City converts the health insurance to a Medicare supplement policy and pays 50% of the premium.
Retirees who retire after January 1, 2014, but were hired prior to January 1, 2009, must meet certain age and service requirements to be eligible for any City-paid premiums.
For retirees hired after January 1, 2009, at least 25 years of service is required before the City will contribute 33% of Pre-Medicare premiums. In addition, General employees must be at least age 62 and Police Officers and Firefighters must be at least age 55. Retirees are eligible for coverage in the Medicare supplement policy, but pay 100% of the premium.
In future years, contributions are assumed to increase at the same rate as premiums
Life Insurance in the amount of $5,000 may be provided to current retirees up to age 70, and then coverage drops to $2,500. The retiree contributes 100% of the premium for this benefit. However, Life Insurance is not offered to employees retiring after October 1, 2006.
87

City of Cocoa Beach, Florida Notes to Financial Statements
September 30, 2018 M - OTHER POST EMPLOYMENT BENEFITS (OPEB) (continued)
5. Summary of Significant Accounting Policies Basis of accounting The financial statements are prepared using the accrual basis of accounting. Contributions are recognized in the period in which the contributions are due. Benefits, refunds and administrative costs are recognized when due and payable in accordance with the terms of the plan. Method used to value investments Investments are reported at fair value. The Florida Municipal Pension Trust Fund (FMPTF) provides monthly statements for this purpose and is classified as a Level 1 investment. Presentation of financial statements The OPEB trust does not issue stand-alone financial reports and is not included in the reports of any other entity.
6. OPEB Investment Policy The following was the Board’s adopted asset allocation:
Asset Class Target AllocationCore Bonds 10%Core Plus 10%S. Large Cap Equity 39%S. Small Cap Equity 13%Non- U.S. Equity 18%Core Real Estate 10%Total 100%
7. Concentrations
The Plan did not hold investments in any one organization that represents 5 percent or more of the Fund’s Fiduciary Net Position. 8. Rate of Return
For the year ended September 30, 2018 the annual money-weighted rate of return on investments, net of investment expense, was 7.83%. The money-weighted rate of return expresses investment performance, net of investment expense, adjusted for the changing amounts invested.
9. Funding Policy
The Plan was established by Resolution 2008 – 31 in 2008. The Plan may be amended or terminated as circumstances require by Resolution. The numbers shown below reflect a decision to partially fund the program. Therefore, the contributions made to the program are the benefits paid to retirees (both on an explicit and implicit basis) and administrative expenses.
88

City of Cocoa Beach, Florida Notes to Financial Statements
September 30, 2018 M - OTHER POST EMPLOYMENT BENEFITS (OPEB) (continued)
9. Funding Policy (continued)
An initial $100,000 was contributed to the OPEB fund run by the FMPTF administered by the Florida League of Cities in October 2008. As of September 30, 2018, ten annual payments of $100,000 each had been made to the FMPTF. A payment of $100,000 for Fiscal Year 2019 was made in December 2018. Benefits may be changed from time to time by management as noted above. Under the current policy, if a retiree does not make his or her payments for the benefits as described above the benefit is forfeited and cannot be reinstated.
10. OPEB Plan Financial Statements a. Statement of plan net position – fair value
Assets Market Value
Investments:Mutual funds 1,620,131$
Total Investments 1,620,131
Total Assets 1,620,131
Total Liabilities - Net Position Restricted for Postemployment Benefits Other Than Pensions 1,620,131$
Statement of OPBEB Fund Net PositionSeptember 30, 2018
89

City of Cocoa Beach, Florida Notes to Financial Statements
September 30, 2018 M - OTHER POST EMPLOYMENT BENEFITS (OPEB) (continued)
10. OPEB Plan Financial Statements (continued)
b. Statement of changes in plan net position – fair value
ADDITIONSContributions:
Employer 250,000$ Plan members -
Total contributions 250,000 Investment Income:
Net increase (decrease) in fair value of investments 126,209 Interest and dividends -
Total investment earnings 126,209 Less investment expenses* -
Net investment earnings 126,209 Total additions 376,209
DEDUCTIONSHealth Insurance Benefits 150,000 Admin expenses 2,015
Total deductions 152,015 Net increase in net position 224,194
Net Position Restricted for Postemployment Benefits Other Than PensionsBeginning of year 1,395,937 End of year 1,620,131$
Statement of Changes in OPEB Net Position for the Year Ended September 30, 2018
11. Net OPEB Liability
The City’s net OPEB liability was measured as of September 30, 2018. The total OPEB liability used to calculate the net OPEB liability was also determined as of that date. The components of the Net OPEB Liability of the City on September 30, 2018 were as follows:
Total OPEB Liability 6,276,470$ Plan Fiduciary Net Position (1,620,131)$ Net OPEB Liability 4,656,339$
Plan Fiduciary Net Position as a percentage of Total OPEB Liability 25.81%
90

City of Cocoa Beach, Florida Notes to Financial Statements
September 30, 2018
M - OTHER POST EMPLOYMENT BENEFITS (OPEB) (continued)
11. Net OPEB Liability (continued) The City’s allocation of the net OPEB liability as of September 30, 2018 was as follows:
Activity Personnel Percent AmountGovernmental Activities 226 88.30% 4,111,547$ Utility System 29 10.20% 474,947 Stormwater 4 1.50% 69,845
259 100.00% 4,656,339$
Allocation of the Net OPEB Liability
12. Actuarial Assumptions The Total OPEB Liability was determined by an actuarial valuation as of October 1, 2017 using the following actuarial assumptions:
Inflation 2.50%Salary Increase Rate(s) 5.16%Discount Rate 4.40%Initial Trend Rate 8.50%Ultimate Trend Rate 4.00%Years to Ultimate 55Investment Rate of Return 6.50%
For general employees, mortality rates were based on the RP-2000 mortality tables. For female lives, 100% of the white collar table was used. For male lives, a 50% white collar table, 50% blue collar table blend was used. All tables include fully generational adjustments for mortality improvements using improvement scale BB. For disabled lives, mortality rates were based on the RP-2000 sex-distinct disabled mortality tables with female lives set forward two (2) years, male lives set back four (4) years. Disabled mortality has not been adjusted for mortality improvements. For police and fire employees, mortality rates were also based on various RP-2000 mortality tables. For female lives, 100% of the white-collar table was used. For male lives, a 10% white collar table, 90% blue collar table blend was used. All tables include fully generational adjustments for mortality improvements using improvement scale BB. For disabled female lives, a blend of 60% of the RP-2000 disabled female mortality table set forward two (2) years and 40% of the white-collar table with no setback was used. For disabled male lives, a blend of 60% of the RP-2000 disabled male mortality table set back four (4) year and 40% of the white-collar table with no setback was used. Disabled mortality has not been adjusted for mortality improvements.
91

City of Cocoa Beach, Florida Notes to Financial Statements
September 30, 2018 M - OTHER POST EMPLOYMENT BENEFITS (OPEB) (continued)
12. Actuarial Assumptions (continued) The Long-Term Expected Rate of Return on OPEB Plan investments was determined using a building-block method in which best-estimate ranges of expected future real rates of return (expected returns, net of investment expenses and inflation) are developed for each major asset class. These ranges are combined to produce the Long-Term Expected Rate of Return by weighting the expected future real rates of return by the target asset allocation percentage and by adding expected inflation. The target allocation and best estimates of arithmetic real rates of return for each major asset class are summarized in the following table:
Asset ClassLong Term
Expected Real Rate of ReturnCore Bonds 1.4%Core Plus 1.7%S. Large Cap Equity 5.1%S. Small Cap Equity 5.6%Non- U.S. Equity 5.6%Core Real Estate 4.5%
Discount Rate: The discount rate used to measure the Total OPEB Liability was 4.40% The City contributes $100,000 to the fund annually, but otherwise funds benefits on a pay-as-you-go basis. The expected rate of return on trust investments is 6.50%. The remaining projected benefit payments were discounted at a municipal bond rate. The high quality municipal bond rate, 4.18%, was based on the week closest but not later than the measurement date of the Bond Buyer 20-Bond Index as published by the Federal Reserve. The 20-Bond Index consists of 20 general obligation bonds that mature in 20 years 13. OPEB Expense and Deferred Outflows of Resources and Deferred Inflows of Resources
Related to OPEB For the year ended September 30, 2018 the City recognized an OPEB Expense of $157,535. On September 30, 2018, the City reported Deferred Outflows of Resources and Deferred Inflows of Resources related to OPEB from the following sources:
Deferred Outflowof Resources
Deferred Inflowof Resources
Differences between Expected and Actual Experience 79,494$ -$ Changes of assumptions - 1,305,544 Net difference between Projected and Actual Earnings on OPEB Plan investments - 25,831 Total 79,494$ 1,331,375$
92

City of Cocoa Beach, Florida Notes to Financial Statements
September 30, 2018 M - OTHER POST EMPLOYMENT BENEFITS (OPEB) (continued)
13. OPEB Expense and Deferred Outflows of Resources and Deferred Inflows of Resources Related to OPEB (continued)
Amount reported as reported Deferred Outflows of Resources and Deferred Inflows of Resources related to OPEB will be recognized in OPEB Expense as follows:
Fiscal Year Ending InflowsSeptember 30, 2019 (251,668)$ September 30, 2020 (251,668) September 30, 2021 (251,668) September 30, 2022 (251,667) September 30, 2023 (245,210)
14. Changes in Net OPEB Liability
Total OPEBLiability
Plan Fiduciary Net Position
Net OPEBLiability
Balances at September 30, 2017 7,485,762$ 1,395,937$ 6,089,825$ Changes for a year:
Service cost 212,520 - 212,520 Interest 288,588 - 288,588
95,393 - 95,393 Changes of assumptions (1,566,653) - (1,566,653) Explicit contributions - employer - 250,000 (250,000) Implicit contributions - employer - 89,140 (89,140) Net investment income - 126,209 (126,209)
(150,000) (150,000) - Implicit benefit payments (89,140) (89,140) - Administrative expense - (2,015) 2,015
Net changes (1,209,292) 224,194 (1,433,486) Balances at September 30, 2018 6,276,470$ 1,620,131$ 4,656,339$
Increase (Decrease)
Differences between expected and actual experience
Explicit benefit payments
Experience reflects changes to the census data during the twelve month period since the prior valuation. Changes of assumptions reflect a change in the discount rate from 3.76% for the reporting period ended September 30, 2017 to 4.40% for the reporting period ended September 30, 2018, updates to the underlying health claims and premium, and an update to mortality tables to be consistent with Chapter 2015-157, Florida Statutes for pension plans.
93

City of Cocoa Beach, Florida Notes to Financial Statements
September 30, 2018 M - OTHER POST EMPLOYMENT BENEFITS (OPEB) (continued)
15. Sensitivity of OPEB Liability to Changes in Rates
The first table below shows the Net OPEB Liability, as well as what the Net OPEB Liability would be if it were calculated using a discount rate that is one percentage-point lower or one percentage-point higher than the current discount rate:
1% Decrease 3.40%
Current Discount Rate
4.40%1% Increase
5.40%Net OPEB Liability 5,684,404$ 4,656,339$ 3,840,202$
The following table presents the Net OPEB Liability, as well as what the Net OPEB Liability would be if it were calculated using healthcare cost trend rates that are one percentage-point lower or one percentage-point higher than the current healthcare cost trend rates:
1% Decrease 3.00% - 7.50%
Healthcare Cost Trend
Rates4.00% - 8.50%
1% Increase 5.00 - 9.50%
Net OPEB Liability 3,771,906$ 4,656,339$ 5,773,348$
The Required Supplementary Information (RSI) immediately following the notes to the financial statements presents additional multi-year trend information about the employer contributions and changes in the City’s Net OPEB Liability and related ratios.
N - INFORMATION ITEMS
1. Hurricane Damage Reimbursements
Hurricane Irma made landfall as a Category 4 storm in the Florida Keys on the morning of September 10, 2017 before carving a path of destruction up the Florida Peninsula. The East Coast of Florida, including Cocoa Beach was impacted by the storm as it churned past. As with Hurricane Matthew the prior year, much of the costs incurred were related to protective services and debris pick-up and removal. The police station and portions of City Hall also sustained substantial damage. Although insurance claim proceeds were received in FY 2018, the City will not be made whole to recover all costs incurred as a result of the storm. As of this date $249,376 of the $726,363 in FEMA reimbursement requests have been obligated. Payment in the amount of $11,077 has been distributed to the City through the State. The City continues to work with FEMA and State representatives for timely payment of obligations.
2. Subsequent Event In November 2018, voters elected to amend the City Charter to revise the building height limit accommodations, adding a 10-foot allowance on the top of buildings for unoccupied building elements and attachments, and where applicable, specifying that the 45-foot height limit shall be measured from a parcel’s FEMA Base Flood Elevation (BFE) rather than the crown of the abutting road.
94

REQUIRED
SUPPLEMENTARY
INFORMATION
(RSI)
The schedules presented in the following required supplementary information are intended to provide information that is essential to understanding trends and puts the current period information into historical perspective. The Government Accounting Standards Board (GASB) concludes that a period of ten years will provide information to identify cyclical factors and other trends in connection with defined benefit pension plans and other postemployment benefit plans (OPEB). GASB Statements 67 and 74 (GASB 67 & 74) sets the requirements for the ten year schedules to be implemented prospectively. Until a full ten years of data is compiled, the schedules will present data that is available. GASB Statement 68 (GASB 68) requires that governments providing defined benefit pensions recognize long-term obligations for pension benefits as a liability and to more comprehensively and comparably measure the annual costs of pension benefits. GASB Statement 75 (GASB 75) requires that a 10 year schedule of changes in net OPEB liability be presented.
95
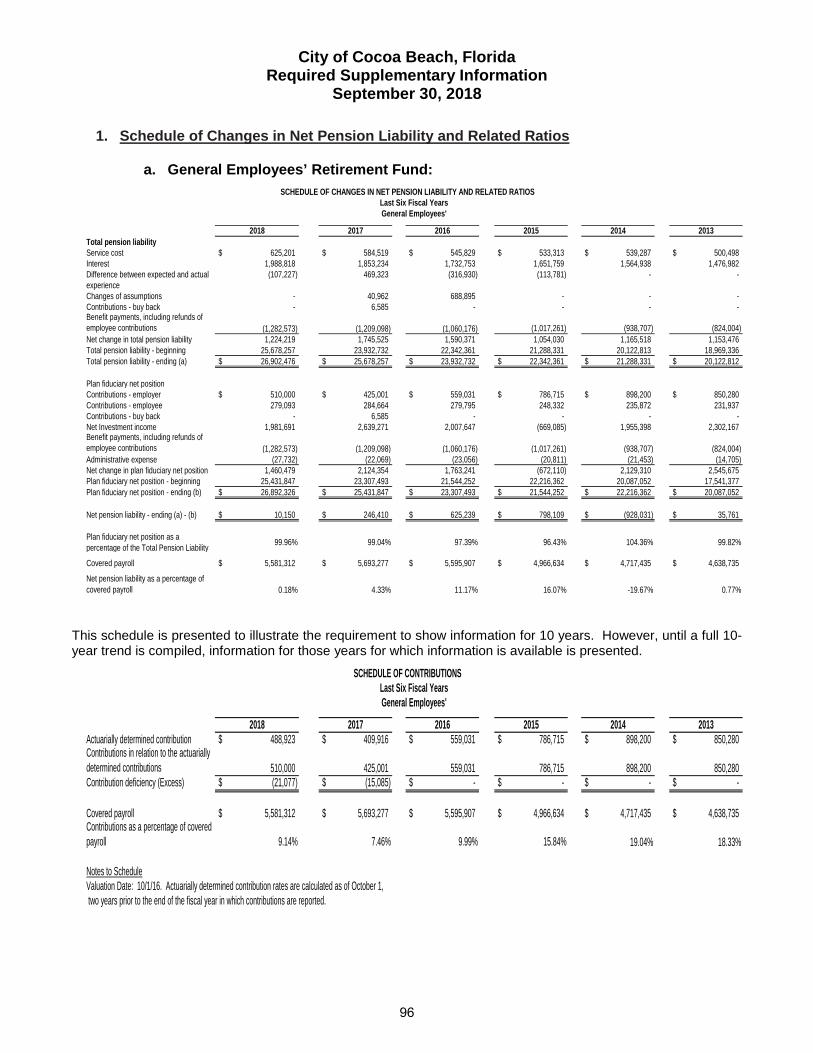
City of Cocoa Beach, Florida Required Supplementary Information
September 30, 2018
1. Schedule of Changes in Net Pension Liability and Related Ratios
a. General Employees’ Retirement Fund:
2018 2017 2016 2015 2014 2013Total pension liabilityService cost 625,201$ 584,519$ 545,829$ 533,313$ 539,287$ 500,498$ Interest 1,988,818 1,853,234 1,732,753 1,651,759 1,564,938 1,476,982 Difference between expected and actual (107,227) 469,323 (316,930) (113,781) - - experienceChanges of assumptions - 40,962 688,895 - - - Contributions - buy back - 6,585 - - - - Benefit payments, including refunds ofemployee contributions (1,282,573) (1,209,098) (1,060,176) (1,017,261) (938,707) (824,004) Net change in total pension liability 1,224,219 1,745,525 1,590,371 1,054,030 1,165,518 1,153,476 Total pension liability - beginning 25,678,257 23,932,732 22,342,361 21,288,331 20,122,813 18,969,336 Total pension liability - ending (a) 26,902,476$ 25,678,257$ 23,932,732$ 22,342,361$ 21,288,331$ 20,122,812$
Plan fiduciary net positionContributions - employer 510,000$ 425,001$ 559,031$ 786,715$ 898,200$ 850,280$ Contributions - employee 279,093 284,664 279,795 248,332 235,872 231,937 Contributions - buy back - 6,585 - - - - Net Investment income 1,981,691 2,639,271 2,007,647 (669,085) 1,955,398 2,302,167 Benefit payments, including refunds ofemployee contributions (1,282,573) (1,209,098) (1,060,176) (1,017,261) (938,707) (824,004) Administrative expense (27,732) (22,069) (23,056) (20,811) (21,453) (14,705) Net change in plan fiduciary net position 1,460,479 2,124,354 1,763,241 (672,110) 2,129,310 2,545,675 Plan fiduciary net position - beginning 25,431,847 23,307,493 21,544,252 22,216,362 20,087,052 17,541,377 Plan fiduciary net position - ending (b) 26,892,326$ 25,431,847$ 23,307,493$ 21,544,252$ 22,216,362$ 20,087,052$
Net pension liability - ending (a) - (b) 10,150$ 246,410$ 625,239$ 798,109$ (928,031)$ 35,761$
Plan fiduciary net position as a percentage of the Total Pension Liability 99.96% 99.04% 97.39% 96.43% 104.36% 99.82%
Covered payroll 5,581,312$ 5,693,277$ 5,595,907$ 4,966,634$ 4,717,435$ 4,638,735$
0.18% 4.33% 11.17% 16.07% -19.67% 0.77%
SCHEDULE OF CHANGES IN NET PENSION LIABILITY AND RELATED RATIOSLast Six Fiscal YearsGeneral Employees'
Net pension liability as a percentage of covered payroll
This schedule is presented to illustrate the requirement to show information for 10 years. However, until a full 10-year trend is compiled, information for those years for which information is available is presented.
2018 2017 2016 2015 2014 2013Actuarially determined contribution 488,923$ 409,916$ 559,031$ 786,715$ 898,200$ 850,280$ Contributions in relation to the actuarially determined contributions 510,000 425,001 559,031 786,715 898,200 850,280 Contribution deficiency (Excess) (21,077)$ (15,085)$ -$ -$ -$ -$
Covered payroll 5,581,312$ 5,693,277$ 5,595,907$ 4,966,634$ 4,717,435$ 4,638,735$ Contributions as a percentage of covered payroll 9.14% 7.46% 9.99% 15.84% 19.04% 18.33%
Notes to ScheduleValuation Date: 10/1/16. Actuarially determined contribution rates are calculated as of October 1, two years prior to the end of the fiscal year in which contributions are reported.
SCHEDULE OF CONTRIBUTIONS
General Employees'Last Six Fiscal Years
96

City of Cocoa Beach, Florida Required Supplementary Information
September 30, 2018
1. Schedule of Changes in Net Pension Liability and Related Ratios (continued)
b. Police Employees’ Pension Plan:
2018 2017 2016 2015 2014 2013Total pension liabilityService cost 312,449$ 266,442$ 264,410$ 268,905$ 278,445$ 257,819$ Interest 1,365,029 1,282,422 1,248,592 1,215,095 1,166,413 1,118,532 Change in excess state money - - (25,826) - - - Difference between expected and actual 460,321 386,258 (205,356) (159,029) - - ExperienceChanges of assumptions - 36,994 636,451 - - - Contributions - buy back - 22,500 - 52,320 - - Benefit payments, including refunds ofemployee contributions (989,830) (959,625) (1,052,685) (855,473) (798,118) (798,796) Net change in total pension liability 1,147,969 1,034,991 865,586 521,818 646,740 577,555 Total pension liability - beginning 17,795,741 16,760,750 15,895,164 15,373,346 14,726,606 14,149,051 Total pension liability - ending (a) 18,943,710$ 17,795,741$ 16,760,750$ 15,895,164$ 15,373,346$ 14,726,606$
Plan fiduciary net positionContributions - employer 860,000$ 782,512$ 822,359$ 625,885$ 751,980$ 719,321$ Contributions - state 107,105 101,389 104,215 97,977 99,477 97,465 Contributions - employee 89,780 95,018 91,834 80,429 91,260 87,375 Contributions - buy back - 22,500 - 52,320 - - Net Investment income 1,562,850 1,529,239 1,085,149 (150,618) 1,089,153 1,174,778 Benefit payments, including refunds ofEmployee contributions (989,830) (959,625) (1,052,685) (855,473) (798,118) (798,796) Administrative expense (36,507) (41,061) (41,054) (37,661) (32,708) (37,849) Other - - - - - - Net change in plan fiduciary net position 1,593,398 1,529,972 1,009,818 (187,141) 1,201,044 1,242,294 Plan fiduciary net position - beginning 13,142,557 11,612,585 10,602,767 10,789,908 9,588,864 8,346,569 Plan fiduciary net position - ending (b) 14,735,955$ 13,142,557$ 11,612,585$ 10,602,767$ 10,789,908$ 9,588,864$
Net pension liability - ending (a) - (b) 4,207,755$ 4,653,184$ 5,148,165$ 5,292,397$ 4,583,438$ 5,137,742$
Plan fiduciary net position as a percentage of the Total Pension Liability 77.79% 73.85% 69.28% 66.70% 70.19% 65.11%
Covered payroll 1,795,611$ 1,900,351$ 1,836,685$ 1,697,629$ 1,825,203$ 1,747,510$
234.34% 244.86% 280.30% 311.75% 251.12% 294.00%Net pension liability as a percentage of covered payroll
SCHEDULE OF CHANGES IN NET PENSION LIABILITY AND RELATED RATIOSLast Six Fiscal Years
Police Employees'
This schedule is presented to illustrate the requirement to show information for 10 years. However, until a full 10-year trend is compiled, information for those years for which information is available is presented.
2018 2017 2016 2015 2014 2013Actuarially determined contribution 932,461$ 933,642$ 876,833$ 723,862$ 851,457$ 716,786$ Contributions in relation to the actuarially determined contributions (34,644) 883,901 926,574 723,862 851,457 716,786 Contribution deficiency (Excess) 967,105$ 49,741$ (49,741)$ -$ -$ -$
Covered payroll 1,795,611$ 1,900,351$ 1,836,685$ 1,697,629$ 1,825,203$ 1,747,510$ Contributions as a percentage of covered payroll 53.86% 46.51% 50.45% 42.64% 46.65% 41.02%
Notes to Schedule
Valuation Date: 10/1/16. Actuarially determined contribution rates are calculated as of October 1, two years prior to the end of the fiscal year in which contributions are reported.
SCHEDULE OF CONTRIBUTIONSLast Six Fiscal Years
Police Employees'
97

City of Cocoa Beach, Florida Required Supplementary Information
September 30, 2018
1. Schedule of Changes in Net Pension Liability and Related Ratios (continued)
c. Fire Employees’ Pension Plan:
2018 2017 2016 2015 2014 2013Total pension liabilityService cost 252,306$ 223,453$ 238,463$ 226,817$ 231,534$ 214,383$ Interest 1,193,937 1,106,270 1,084,188 1,054,408 1,020,957 971,801 Change in excess state money - - (654,119) 77,735 85,864 - Difference between expected and actual 281,198 483,038 (88,821) (17,490) - - ExperienceChanges of assumptions - 26,411 229,105 - - - Benefit payments, including refunds ofemployee contributions (757,898) (715,766) (735,874) (1,070,390) (588,887) (588,887) Net change in total pension liability 969,543 1,123,406 72,942 271,080 749,468 597,297 Total pension liability - beginning 15,532,287 14,408,881 14,335,939 14,064,859 13,315,391 12,718,094 Total pension liability - ending (a) 16,501,830$ 15,532,287$ 14,408,881$ 14,335,939$ 14,064,859$ 13,315,391$
Plan fiduciary net positionContributions - employer 609,433$ 475,026$ 655,200$ 561,835$ 581,513$ 564,182$ Contributions - state 111,216 132,166 144,452 162,542 170,671 153,173 Contributions - employee 77,874 80,832 80,412 68,646 76,167 66,823 Net Investment income 1,596,550 1,540,888 1,104,852 (147,286) 1,080,437 1,190,873 Benefit payments, including refunds ofEmployee contributions (757,898) (715,766) (735,874) (1,070,390) (588,887) (588,887) Administrative expense (38,992) (29,789) (32,055) (29,141) (18,863) (24,007) Net change in plan fiduciary net position 1,598,183 1,483,357 1,216,987 (453,794) 1,301,038 1,362,157 Plan fiduciary net position - beginning 13,319,450 11,836,093 10,619,106 11,072,900 9,771,862 8,409,705 Plan fiduciary net position - ending (b) 14,917,633$ 13,319,450$ 11,836,093$ 10,619,106$ 11,072,900$ 9,771,862$
Net pension liability - ending (a) - (b) 1,584,197$ 2,212,837$ 2,572,788$ 3,716,833$ 2,991,959$ 3,543,529$
Plan fiduciary net position as a percentage of the Total Pension Liability 90.40% 85.75% 82.14% 74.07% 78.73% 73.39%
Covered payroll 1,557,486$ 1,616,637$ 1,608,236$ 1,441,819$ 1,386,146$ 1,336,468$
101.72% 136.88% 159.98% 257.79% 215.85% 265.14%Net pension liability as a percentage of covered payroll
SCHEDULE OF CHANGES IN NET PENSION LIABILITY AND RELATED RATIOSLast Six Fiscal Years
Fire Employees
This schedule is presented to illustrate the requirement to show information for 10 years. However, until a full 10-year trend is compiled, information for those years for which information is available is presented.
2018 2017 2016 2015 2014 2013Actuarially determined contribution 720,649$ 673,167$ 733,677$ 646,642$ 666,321$ 648,989$ Contributions in relation to the actuarially determined contributions 720,649 607,192 799,652 646,642 666,321 648,989 Contribution deficiency (Excess) -$ 65,975$ (65,975)$ -$ -$ -$
Covered payroll 1,557,486$ 1,616,637$ 1,608,236$ 1,441,819$ 1,386,146$ 1,336,468$ Contributions as a percentage of covered payroll 46.27% 37.56% 49.72% 44.85% 48.07% 48.56%
Notes to Schedule
Valuation Date: 10/1/16. Actuarially determined contribution rates are calculated as of October 1, two years prior to the end of the fiscal year in which contributions are reported.
SCHEDULE OF CONTRIBUTIONSLast Six Fiscal Years
Fire Employees'
98

City of Cocoa Beach, Florida Required Supplementary Information
September 30, 2018 2. Changes of Benefit Terms There have been no changes in benefits since the prior valuation of the General Employees’ Plan. Ordinance 1596, adopted and effective May 19, 2016, amended the Police and Fire Employees’ Plans primarily for compliance with requirements under the Internal Revenue Code, in addition to implementation of a Share Plan. A letter of no actuarial impact was submitted for this amendment2.
3. Changes of Assumptions
There have been no changes in actuarial assumptions or methods for the General Employees’ Plan since the prior valuation. In compliance with Chapter 112, Florida Statutes, the payroll growth assumption for amortization of the Plan’s Unfunded Actuarial Accrued Liability for the Fire Employees’ Plan was lowered from 1.04% to 0.91%. For the Police Employees’ Plan the assumption was lowered from 1.30% to 0.72%.
4. Methods and Assumptions Used to Determine Contribution Rates
GeneralEmployees'
PoliceEmployees'
FireEmployees'
Actuarial cost method : Frozen Entry Age Entry Age Normal Entry Age Normal
Amortization method: Level dollar amount Level % of pay, Closed Level % of pay, Closed
Remaining amortization period: 20 Years (as of 10/1/2016) 20 Years (as of 10/1/2016) 20 Years (as of 10/1/2016)
Inflation: 2.50% 2.50% 2.50%
Payroll increase: None 1.30% per year 1.04% per year
Salary increases : 3 - 18% per year 5 -13% per year 4.5 - 6.5% per year
*Interest rate: 7.75% 7.75% 7.75%
Retirement age: Age 62 and 5 years of service
Age 55 and 10 years of service, or age 52 and 25 years of service
Age 55 and 10 years of service, or 25 yearsof service, regardless of age
Early retirement: Age 52 -subsidized benefit at 5% per year
Age 50 -subsidized benefit at 5% per year
Beginning at age 50 -subsidized benefit at 10% per year
Mortality: RP-2000 Table RP-2000 Table RP-2000 Table *Interest rate is compounded annually, net of investment related expenses.
2 Ordinance 1628, adopted and effective December 6, 2018, amended the General Employees’ Plan primarily for compliance with requirements under the Internal Revenue Code. A letter of no actuarial impact was submitted for this amendment.
99

City of Cocoa Beach, Florida Required Supplementary Information
September 30, 2018 5. Money-Weighted Rate of Return
This schedule is intended to provide information about the actual performance of the pension plan’s investment portfolio because it takes into account the effects of transactions that increase the amount of pension plan investments(such as contributions from employers, non-employer contributing entities, and plan members) and those that decrease the amount of pension plan investments (such as benefit payments).
Annual money-weighted rate of return net of investment expense:
Fiscal YearGeneral
Employees'Police
Employees'Fire
Employees'2018 7.82% 11.71% 11.89%2017 11.38% 13.01% 12.97%2016 9.31% 10.02% 10.18%2015 -2.98% -1.37% -1.34%2014 9.55% 11.11% 10.77%2013 13.01% 13.90% 13.83%
100

City of Cocoa Beach, Florida Required Supplementary Information
September 30, 2018 6. Narrative Summary (OPEB Liability)
The OPEB liability is currently partially funded, with a combination of annual contributions to a professionally managed fund and City premium payments on a pay-as-you-go basis. See Note M for additional details.
7. Schedule of Changes in Net OPEB Liability and Related Ratios*
9/30/2018 9/30/2017Total OPEB Liability Service Cost 212,520$ 227,237$ Interest 288,588 254,072 Differences between Expected and Actual Experience 95,393 - Changes of assumptions (1,566,653) (678,077) Explicit Benefit Payments (150,000) (130,101) Implicit Benefit Payment (89,140) (78,541) Net Change in Total OPEB Liability (1,209,292) (405,410) Total OPEB Liability - Beginning 7,485,762 7,891,172 Total OPEB Liability -Ending (a) 6,276,470$ 7,485,762$
Plan Fiduciary Net PositionExplicit Contributions - Employer 250,000 230,101 Implicit Contributions - Employer 89,140 78,541 Net Investment Income 126,209 178,425 Explicit Benefit Payments (150,000) (130,101) Implicit Benefit Payment (89,140) (78,541) Administrative Expense (2,015) (1,753) Net Change in Plan Fiduciary Net Position 224,194 276,672 Plan Fiduciary Net Position - Beginning 1,395,937 1,119,264 Plan Fiduciary Net Position - Ending (b) 1,620,131$ 1,395,937$
Net OPEB Liability (a - b) 4,656,339$ 6,089,825$
Plan Fiduciary Net Position as a Percentageof Total OPEB Liability 25.81% 18.65%
Covered Employee Payroll 9,889,192$ 8,816,274$
Net OPEB Liability as a Percentageof Covered Employee Payroll 47.09% 69.07%
Schedule of Changes in Net OPEB Liability and Related Ratios
*This schedule is presented to illustrate the requirement to show information for 10 years. However, until a full 10-year trend is compiled, information for those years for which information is available is presented.
101

City of Cocoa Beach, Florida Required Supplementary Information
September 30, 2018
8. Schedule of City OPEB Contribution
9/30/2018 9/30/2017Actuarial Determined Contribution 453,999 576,881 Contribution in relation to the ActuariallyDetermined Contributions 250,000 230,101 Contribution Deficiency (Excess) 203,999$ 346,780$
Covered Employee Payroll 9,889,192$ 8,816,274$ Contributions as a percentage of Covered Employee Payroll 2.53% 2.61%
Schedule of City OPEB Contributions
*This schedule is presented to illustrate the requirement to show information for 10 years. However, until a full 10-year trend is compiled, information for those years for which information is available is presented. Note to Schedule: Actuarially determined contribution rates shown above are calculated as of October 1, 2017 for the plan/fiscal year in which contributions are reported. Methods and assumptions used to determine contribution rates are the same as those found in Note M, Paragraph 12 of this report.
9. Changes in actuarial assumptions
Changes in assumptions and other inputs reflect the effect of changes in the discount rate each period. The following are the discount rates used in each period:
FY 2018 4.40%FY 2017 3.76%FY 2016 3.17%
10. Money-Weighted Rate of Return
This schedule is intended to provide information about the actual performance of the pension plan’s investment portfolio because it takes into account the effects of transactions that increase the amount of pension plan investments(such as contributions from employers, non-employer contributing entities, and plan members) and those that decrease the amount of pension plan investments (such as benefit payments).
2018 2017
Annual money-weighted rate of return net of investment expense 7.83% 8.72%
SCHEDULE OF INVESTMENT RETURNSLast Two Fiscal Years
OPEB Plan
This schedule is presented to illustrate the requirement to show information for 10 years. However, until a full 10-year trend is compiled, information for those years for which information is available is presented.
102

Oth
er S
uppl
emen
tal I
nfor
mat
ion
103

City of Cocoa Beach, FloridaCombining Balance Sheet
Non-major Governmental FundsSeptember 30, 2018
Special Revenue
Metered Parking
Fund
Confiscated Property
Fund
Total Non-major
GovernmentalFunds
ASSETS
Cash and cash equivalents -$ 196,391$ 196,391$
Total assets -$ 196,391$ 196,391$
LIABILITIES AND FUND BALANCES
Liabilities:
Unearned revenues -$ 15,870$ 15,870$
Total liabilities - 15,870 15,870
Fund balances:
Restricted for law enforcement - 180,521 180,521
Total liabilities and fund balances -$ 180,521$ 180,521$
104

City of Cocoa Beach, FloridaCombining Statement of Revenues, Expenditures, and Changes in Fund Balances
Non-major Governmental FundsFor the Fiscal Year Ended September 30, 2018
Metered Parking Fund
Confiscated Property
Fund
Total Non-major
GovernmentalFunds
REVENUES
Parking meter fees -$ -$ -$
Fines and forfeitures - - -
Total revenues - - -
EXPENDITURES
Current:
General government - - -
Total expenditures - - -
Excess of revenues over (under) expenditures - - -
OTHER FINANCING SOURCES (USES)
Transfers out (1,928,182) - (1,928,182)
Total other financing sources (1,928,182) - (1,928,182)
Net change in fund balances (1,928,182) - (1,928,182)
Fund balances, beginning of year 1,928,182 180,521 2,108,703
Fund balances, end of year -$ 180,521$ 180,521$
Special Revenue
105
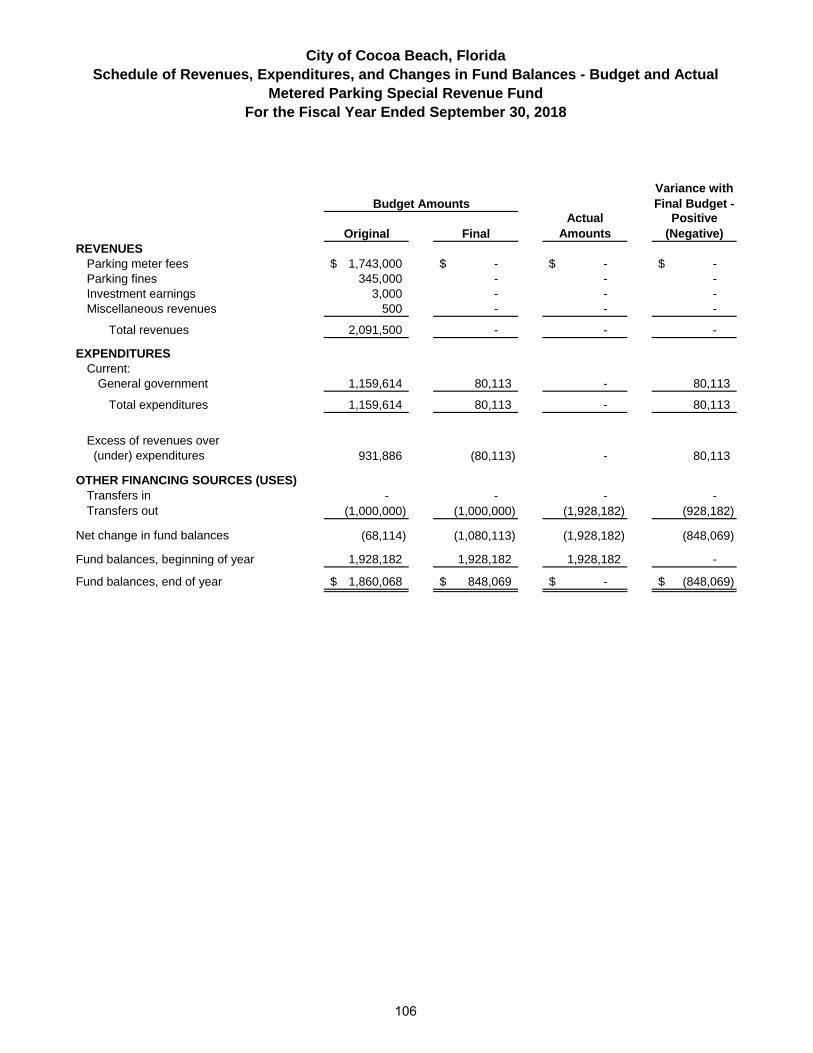
City of Cocoa Beach, FloridaSchedule of Revenues, Expenditures, and Changes in Fund Balances - Budget and Actual
Metered Parking Special Revenue FundFor the Fiscal Year Ended September 30, 2018
Budget AmountsVariance withFinal Budget -
Original FinalActual
AmountsPositive
(Negative)REVENUES
Parking meter fees 1,743,000$ -$ -$ -$ Parking fines 345,000 - - - Investment earnings 3,000 - - - Miscellaneous revenues 500 - - -
Total revenues 2,091,500 - - -
EXPENDITURESCurrent:
General government 1,159,614 80,113 - 80,113
Total expenditures 1,159,614 80,113 - 80,113
Excess of revenues over (under) expenditures 931,886 (80,113) - 80,113
OTHER FINANCING SOURCES (USES)Transfers in - - - - Transfers out (1,000,000) (1,000,000) (1,928,182) (928,182)
Net change in fund balances (68,114) (1,080,113) (1,928,182) (848,069)
Fund balances, beginning of year 1,928,182 1,928,182 1,928,182 -
Fund balances, end of year 1,860,068$ 848,069$ -$ (848,069)$
106

City of Cocoa Beach, FloridaSchedule of Revenues, Expenditures, and Changes in Fund Balances - Budget and Actual
Confiscated Property Special Revenue FundFor the Year Ended September 30, 2018
Budget AmountsVariance withFinal Budget -
Original FinalActual
AmountsPositive
(Negative)REVENUES
Fines and forfeitures -$ -$ -$ -$ Investment earnings - - - -
Total revenues - - - -
EXPENDITURESCurrent:
General government - - - -
Total expenditures - - - -
Excess of revenues over expenditures - - - -
Fund balances, beginning of year 180,521 180,521 180,521 -
Fund balances, end of year 180,521$ 180,521$ 180,521$ -$
107

City of Cocoa Beach, FloridaCombining Statement of Fiduciary Net Position
Pension (and Other Employee Benefit) Trust FundsSeptember 30, 2018
OPEB Trust Fund
GeneralEmployees
Police Officers Firefighters
Total Employee Retirement
FundsASSETS
Receivables:Employer contributions -$ -$ -$ 39,433$ 39,433$ Interest and dividends - - 6,521 6,529 13,050
Total receivables - - 6,521 45,962 52,483 Investments, at fair value:
Cash and money market - 1,116,208 53,448 70,191 1,239,847 Real Estate - - 1,097,336 1,097,336 2,194,672 Mutual funds 1,620,131 24,863,178 13,578,650 13,704,144 53,766,103 Common collective equity funds - 912,940 - - 912,940
Total investments 1,620,131 26,892,326 14,729,434 14,871,671 58,113,562
Total assets 1,620,131 26,892,326 14,735,955 14,917,633 58,166,045
LIABILITIES - - - - -
NET POSITIONRestricted for pensions - 26,892,326 14,735,955 14,917,633 56,545,914 Restricted for OPEB benefits 1,620,131 - - - 1,620,131
Total net position 1,620,131$ 26,892,326$ 14,735,955$ 14,917,633$ 58,166,045$
Pension Trust
108

City of Cocoa Beach, FloridaCombining Statement of Changes in Fiduciary Net Position
Pension (and Other Employee Benefit) Trust FundsFor the Fiscal Year Ended September 30, 2018
OPEB Trust Fund
GeneralEmployees
Police Officers Firefighters
Total Employee Retirement
FundsADDITIONS
Contributions:Employer 250,000$ 510,000$ 967,105$ 720,649$ 2,447,754$ Plan members - 279,093 89,780 77,874 446,747
Total contributions 250,000 789,093 1,056,885 798,523 2,894,501
Investment earnings:Net increase (decrease) in fair value of investments 126,209 838,877 265,333 269,444 1,499,863 Interest and dividends - 1,211,018 1,328,289 1,358,013 3,897,320
Total investment earnings 126,209 2,049,895 1,593,622 1,627,457 5,397,183 Less investment expenses - 68,204 30,772 30,907 129,883
Net investment earnings 126,209 1,981,691 1,562,850 1,596,550 5,267,300
Total additions 376,209 2,770,784 2,619,735 2,395,073 8,161,801
DEDUCTIONSBenefits 150,000 1,250,008 969,579 757,898 3,127,485 Refunds of contributions - 32,565 20,251 - 52,816 Administrative expenses 2,015 27,732 36,507 38,992 105,246
Total deductions 152,015 1,310,305 1,026,337 796,890 3,285,547
Change in net position 224,194 1,460,479 1,593,398 1,598,183 4,876,254
Net position, beginning of year 1,395,937 25,431,847 13,142,557 13,319,450 53,289,791
Net position, end of year 1,620,131$ 26,892,326$ 14,735,955$ 14,917,633$ 58,166,045$
Pension Trust
109

Page intentionally blank
110

STATISTICAL SECTION (Unaudited)
This part of the City of Cocoa Beach’s Comprehensive Annual Financial Report presents detailed information as a context for understanding what the information in the financial statements, note disclosures, and required supplementary information says about the City’s overall financial health.
Table of Contents & Additional Notes
A. Financial Trends These schedules contain trend information to help the reader understand how the city’s financial performance and well-being have changed over time. Page Table A-1 Net Position by Component 113 Table A-2 Changes in Net Position 114 Table A-3 Fund Balances - Governmental Funds 116 Table A-4 Changes in Fund Balances - Governmental Funds 117 B. Revenue Capacity These schedules contain information to help the reader assess the city’s most significant local revenue source, the property tax. Page Table B-1 Value of Taxable Property 118 Table B-2 Direct and Overlapping Property Tax Rates 119 Table B-3 Principal Property Taxpayers 120 Table B-4 Property Tax Levies and Collections 121 C. Debt Capacity These schedules present information to help the reader assess the affordability of the city’s current levels of outstanding debt and the city’s ability to issue additional debt in the future. Page Table C-1 Ratios of Outstanding Debt by Type 122 Table C-2 Ratios of General Bonded Debt Outstanding (See Notes) - Table C-3 Direct and Overlapping Governmental Activities Debt 123 Table C-4 Legal Debt Margin Information (See Notes) - Table C-5 Pledged Revenue Coverage 124 D. Demographic and Economic Information Financial Trends These schedules offer demographic and economic indicators to help the reader understand the environment within which the city’s financial activities take place. Page Table D-1 Demographic and Economic Statistics 125 Table D-2 Principal Employers 126
111

(Continued)
STATISTICAL SECTION (Unaudited) E. Operating Information These schedules contain service and infrastructure data to help the reader understand how the information in the city’s financial report relates to the services the city provides and the activities it performs. Page Table E-1 Full-time Equivalent City Government Employees by
Function/Program
127 Table E-2 Operating Indicators by Function/Program 128 Table E-3 Capital Asset Statistics by Function/Program 129
Additional Notes Unless otherwise noted, the information in these schedules is derived from the City’s Comprehensive Annual Financial Report (CAFR) for the relevant year. Actual titles of some schedules will vary from the general titles shown above. Neither the City of Cocoa Beach Charter or Code, nor the Florida Statutes limit the amount of debt the City of Cocoa Beach can issue; therefore tables showing the City’s legal debt limit and debt margins are not applicable. The City has not issued any General Bonded Debt in the last ten years. The following statistical tables which are normally included in a government’s Comprehensive Annual Financial Report are not applicable and, accordingly, are not included in this report.
Table C-2 Ratios of General Bonded Debt Outstanding Table C-4 Legal Debt Margin Information
112

City of Cocoa Beach, FloridaTable A-1
Net Position by ComponentLast Ten Fiscal Years
2009 2010 2011 2012 2013 2014 2015 2016 2017 2018Governmental activities
Net investment in capital assets 17,427,319$ 17,780,910$ 18,708,421$ 18,261,764$ 18,080,949$ 23,650,099$ 22,249,281$ 24,182,508$ 26,290,568$ 27,578,331$ Restricted 225,227 201,550 205,435 204,697 206,541 594,503 864,117 456,923 445,157 180,521 Unrestricted 8,814,972 8,930,157 8,743,640 8,984,450 5,609,847 2,278,071 (3,923,940) (3,432,120) (3,184,461) (5,055,455)
Total governmental activities net position 26,467,518$ 26,912,617$ 27,657,496$ 27,450,911$ 23,897,337$ 26,522,673$ 19,189,458$ 21,207,311$ 23,551,264$ 22,703,397$
Business-type activitiesNet investment in capital assets 27,284,398$ 31,284,569$ 31,165,812$ 32,096,348$ 29,003,772$ 25,003,758$ 24,343,465$ 25,427,503$ 27,971,940$ 26,666,412$ Restricted 2,025,593 112,840 105,626 98,193 824,865 824,865 1,029,297 1,029,297 637,235 - Unrestricted 3,987,231 1,893,282 2,447,560 2,091,980 8,318,197 8,376,696 8,857,119 7,625,604 8,315,120 9,471,689
Total business-type activities net position 33,297,222$ 33,290,691$ 33,718,998$ 34,286,521$ 38,146,834$ 34,205,319$ 34,229,881$ 34,082,404$ 36,924,295$ 36,138,101$
Primary governmentNet investment in capital assets 44,711,717$ 49,065,479$ 49,874,233$ 50,358,112$ 47,084,721$ 48,653,857$ 46,592,746$ 49,610,011$ 54,262,508$ 54,244,743$ Restricted 2,250,820 314,390 311,061 302,890 1,031,406 1,419,368 1,893,414 1,486,220 1,082,392 180,521 Unrestricted 12,802,203 10,823,439 11,191,200 11,076,430 13,928,044 10,654,767 4,933,179 4,193,484 5,130,659 4,416,234
Total primary government net position 59,764,740$ 60,203,308$ 61,376,494$ 61,737,432$ 62,044,171$ 60,727,992$ 53,419,339$ 55,289,715$ 60,475,559$ 58,841,498$
Notes:
1. Accrual Basis of Accounting.
2. Accounting standards require that net position be reportedin three (3) components in the financial statements: netinvestment in capital assets, restricted, and unrestricted.
3. Net position is considered restricted only when an externalparty, such as the state or federal government, places arestriction on how the resources may be used, or throughenabling legislation enacted by the City.
4. Net assets restated as net position beginning Fiscal Year 2013 CAFR.
113

City of Cocoa Beach, FloridaTable A-2, Part 1
Changes in Net PositionLast Ten Fiscal Years
2009 2010 2011 2012 2013 2014 2015 2016 2017 2018Program expensesGovernmental activities:
General government 3,802,676$ 3,249,190$ 3,357,724$ 2,788,002$ 2,919,124$ 1,285,245$ 3,487,514$ 4,819,444$ 4,935,118$ 4,968,022$ Public Safety 7,382,335 8,146,626 8,895,179 8,906,595 8,648,071 9,289,985 8,632,350 7,726,733 8,782,659 8,730,028 Physical Environment 1,529,693 1,474,627 1,463,330 1,448,782 1,480,466 1,491,654 1,441,963 1,468,270 1,510,816 1,670,732 Transportation/Public Works 3,037,158 3,291,140 3,135,193 3,450,828 2,970,897 5,199,935 3,744,760 3,368,439 3,526,815 4,300,002 Recreation 899,025 967,958 1,008,353 1,202,669 1,085,135 3,874,112 3,346,596 3,539,718 3,432,942 3,486,931 Interest on long-term debt 27,292 21,608 15,697 9,587 2,736 - 125,844 124,169 307,420 328,326
16,678,179$ 17,151,149$ 17,875,476$ 17,806,463$ 17,106,429$ 21,140,931$ 20,779,027$ 21,046,773$ 22,495,770$ 23,484,041$ Business-type activities:
Utilities system 5,242,467$ 4,894,135$ 4,682,920$ 4,846,321$ 4,802,654$ 6,428,259$ 6,180,828$ 6,491,931$ 6,828,930$ 7,122,007$ Golf 2,693,504 2,691,019 2,821,748 2,704,671 2,636,838 - - - - - Stormwater 606,009 586,175 510,821 482,407 507,130 512,869 472,371 471,907 500,555 726,342$
8,541,980$ 8,171,329$ 8,015,489$ 8,033,399$ 7,946,622$ 6,941,128$ 6,653,199$ 6,963,838$ 7,329,485$ 7,848,349$
25,220,159$ 25,322,478$ 25,890,965$ 25,839,862$ 25,053,051$ 28,082,059$ 27,432,226$ 28,010,611$ 29,825,255$ 31,332,390$
Program revenues
Governmental activities: General government 2,139,597$ 2,112,700$ 2,747,622$ 2,047,310$ 2,073,020$ 2,395,990$ 2,044,829$ 1,161,342$ 1,134,935$ 2,946,376$ Public Safety 402,905 434,621 420,858 642,032 725,412 665,589 626,835 981,899 1,105,118 1,188,367 Physical Environment 1,575,950 1,544,614 1,588,430 1,605,658 1,593,151 1,662,458 1,663,153 1,763,280 1,801,744 1,854,899 Transportation/Public Works 1,068,118 1,026,787 1,159,062 1,109,997 1,021,125 1,140,466 1,267,992 1,874,144 2,652,362 165,065 Recreation 245,272 223,766 250,063 244,540 274,497 2,496,625 2,436,776 2,340,083 2,161,586 2,161,540 Operating grants and contributions 627,413 - - - - - - 283,861 746,727 499,643 Capital grants and contributions - 639,697 1,026,314 547,108 328,225 478,810 660,802 1,844,670 1,015,000 1,021,221
6,059,255$ 5,982,185$ 7,192,349$ 6,196,645$ 6,015,430$ 8,839,938$ 8,700,387$ 10,249,279$ 10,617,472$ 9,837,111$ Business-type activities:
Charges for services: Utilities system 5,009,239$ 5,169,109$ 5,544,368$ 6,058,715$ 5,633,604$ 5,830,201$ 5,799,532$ 6,268,290$ 6,628,578$ 7,005,833$ Golf 1,749,352 1,977,061 2,103,128 2,225,397 2,311,096 - - - - - Stormwater 665,794 628,693 573,019 667,912 585,947 592,638 595,644 800,882 815,368 841,390 Operating grants and contributions - - - - - - - - - - Capital grants and contributions 177,425 720,442 635,021 73,391 54,314 159,540 558,212 208,794 3,221,488 400,350
7,601,810$ 8,495,305$ 8,855,536$ 9,025,415$ 8,584,961$ 6,582,379$ 6,953,388$ 7,277,966$ 10,665,434$ 8,247,573$
13,661,065$ 14,477,490$ 16,047,885$ 15,222,060$ 14,600,391$ 15,422,317$ 15,653,775$ 17,527,245$ 21,282,906$ 18,084,684$
Total governmental activities program expenses
Total business-type activities program expenses
Total governmental activities program revenues
Total business-type activities program revenues
Total primary government program expenses
114

City of Cocoa Beach, FloridaTable A-2, Part 2
General Revenues and Other Changes in Net PositionLast Ten Fiscal Years
2009 2010 2011 2012 2013 2014 2015 2016 2017 2018Net (expense) revenueGovernmental activities (10,618,924)$ (11,168,964)$ (10,683,127)$ (11,609,818)$ (11,090,999)$ (12,300,993)$ (12,078,640)$ (10,797,494)$ (11,878,298)$ (13,646,930)$ Business-type activities (940,170) 323,976 840,047 992,016 638,339 (358,749) 300,189 314,128 3,335,949 399,224
Total primary government net expense (11,559,094)$ (10,844,988)$ (9,843,080)$ (10,617,802)$ (10,452,660)$ (12,659,743)$ (11,778,451)$ (10,483,366)$ (8,542,349)$ (13,247,706)$
General revenues and other changesin net positionGovernmental activities:
General revenues:Property taxes 6,982,452$ 6,536,885$ 6,327,375$ 6,348,123$ 6,352,123$ 6,680,713$ 7,102,087$ 7,657,945$ 9,126,174$ 10,375,705$ Local option gas tax 396,620 360,065 366,540 458,735 408,959 393,454 417,978 461,652 333,671 327,312 Franchise taxes 1,550,539 1,424,131 1,357,980 1,358,787 1,231,315 1,290,918 1,294,985 1,272,155 1,247,130 1,274,531 Excise taxes 1,915,443 1,977,281 1,926,808 1,891,349 1,964,827 1,991,139 1,976,393 1,989,682 1,901,602 2,006,144 Intergovernmental 690,753 676,372 683,612 645,626 668,540 699,504 722,933 737,261 779,801 822,000 Unrestricted investment earnings 135,186 118,510 123,315 96,921 (1,692) 58,705 79,118 42,569 10,575 76,363 Miscellaneous revenues 33,943 79,765 151,322 112,638 97,773 165,712 156,703 145,083 264,298 469,223
Transfers 221,054 441,054 491,054 491,054 (3,184,420) 3,646,185 509,000 509,000 559,000 859,000
Total governmental activities 11,925,990$ 11,614,063$ 11,428,006$ 11,403,233$ 7,537,425$ 14,926,330$ 12,259,197$ 12,815,347$ 14,222,251$ 16,210,278$
Business-type activities:Unrestricted investment earnings 137,191$ 110,547$ 79,314$ 66,561$ 37,554$ 63,419$ 73,088$ 47,395$ 64,942$ 92,510$ Transfers (221,054) (441,054) (491,054) (491,054) 3,184,420 (3,646,185) (509,000) (509,000) (559,000) (859,000)
Total business-type activities (83,863)$ (330,507)$ (411,740)$ (424,493)$ 3,221,974$ (3,582,766)$ (435,912)$ (461,605)$ (494,058)$ (766,490)$
Total primary government 11,842,127$ 11,283,556$ 11,016,266$ 10,978,740$ 10,759,399$ 11,343,564$ 11,823,285$ 12,353,742$ 13,728,193$ 15,443,788$
Changes in net positionGovernmental activities 1,307,066$ 445,099$ 744,879$ (206,585)$ (3,553,574)$ 2,625,337$ 180,557$ 2,017,853$ 2,343,953$ 2,563,348$ Business-type activities (1,024,033) (6,531) 428,307 567,523 3,860,313 (3,941,515) (135,723) (147,477) 2,841,891 (367,266)
Total primary government 283,033$ 438,568$ 1,173,186$ 360,938$ 306,739$ (1,316,178)$ 44,834$ 1,870,376$ 5,185,844$ 2,196,082$
115

City of Cocoa Beach, FloridaTable A-3
Fund Balances, Governmental FundsLast Ten Fiscal Years
2009 2010 2011 2012 2013 2014 2015 2016 2017 2018General Fund
Reserved 686,318$ 2,665,004$ -$ -$ -$ -$ -$ -$ -$ -$ Unreserved 8,667,363 7,247,210 - - - - - - - - Nonspendable - - 3,117,227 3,530,116 140,544 374,973 222,504 246,919 239,286 280,372 Restricted - - - 16,200 16,200 402,375 672,125 264,636 264,636 264,636 Committed - - 1,083,606 668,570 328,918 3,031,960 422,975 1,018,716 1,435,818 1,629,521 Assigned - - - - - - - - - - Unassigned - - 5,691,311 6,116,168 6,396,738 5,007,909 4,530,258 3,714,213 2,976,927 5,039,536
Total general fund 9,353,681$ 9,912,214$ 9,892,144$ 10,331,054$ 6,882,400$ 8,817,217$ 5,847,862$ 5,244,484$ 4,916,667$ 7,214,065$
All other governmental fundsReserved, reported in:
Confiscated Property Fund 225,227$ 201,550$ -$ -$ -$ -$ -$ -$ -$ -$ Unreserved, reported in:
Metered Parking Fund 988,057 922,379 - - - - - - - - Nonspendable - - - - - 4,649 4,983 5,082 5,346 5,543 Restricted - - 205,435 188,497 190,341 192,128 191,992 192,287 4,680,521 4,675,443 Committed - - 1,032,001 1,106,949 1,144,536 1,045,024 1,115,763 1,126,273 1,928,182 - Assigned - - - - - - - - - - Unassigned - - - - - (261,230) (191,818) (77,030) 151,595 -
Total all other governmental funds 1,213,284$ 1,123,929$ 1,237,436$ 1,295,446$ 1,334,877$ 980,571$ 1,120,920$ 1,246,612$ 6,765,644$ 4,680,986$
Notes: 1 Modified accrual basis of accounting
2 The City Implemented GASB #54 for the fiscal year ended September 30, 2011.See Note A to the financial statements for details.
3 All other governmental funds includes: Confiscated Property Fund, Metered Parking Fund, and the Community Redevelopment Agency (CRA).
4 The Metered Parking Fund was incorporated into the General Fundbeginning in Fiscal Year 2018.
116

City of Cocoa Beach, FloridaTable A-4
Changes in Fund Balances, Governmental Funds Last Ten Fiscal Years
2009 2010 2011 2012 2013 2014 2015 2016 2017 2018
Taxes 10,845,054$ 10,298,362$ 9,978,703$ 10,056,994$ 9,957,224$ 10,356,221$ 10,791,445$ 11,381,434$ 12,608,577$ 13,983,692$ Licenses and permits 359,821 353,869 386,320 416,435 433,729 449,991 441,606 482,642 586,788 736,536 Intergovernmental revenues 1,318,166 1,321,858 1,719,712 1,192,734 996,765 1,178,314 1,383,735 2,865,792 2,541,528 2,342,864 Charges for services 4,718,683 4,552,958 4,576,197 4,349,042 4,311,489 6,567,717 6,585,380 7,331,896 7,818,769 7,523,826 Fines & forfeitures 353,338 429,872 1,193,286 900,892 971,569 1,396,075 1,067,909 306,210 450,188 55,885 Investment earnings 135,186 118,510 123,315 96,921 (1,692) 54,907 79,118 42,569 10,575 76,363 Miscellaneous revenues 33,943 79,765 151,768 95,804 68,191 116,854 101,393 145,083 264,298 290,457
17,764,191$ 17,155,194$ 18,129,301$ 17,108,822$ 16,737,275$ 20,120,079$ 20,450,586$ 22,555,626$ 24,280,723$ 25,009,623$
General government 3,300,052$ 3,205,018$ 3,118,375$ 3,260,223$ 3,160,833$ 3,749,095$ 4,399,772$ 4,733,699$ 5,038,902$ 6,102,703$ Public Safety 7,382,335 7,869,464 8,678,916 8,379,998 8,402,158 9,174,689 9,252,083 8,593,542 8,845,792 9,017,098 Physical Environment 1,529,693 1,474,627 1,463,330 1,448,782 1,480,466 1,491,654 1,441,963 1,468,270 1,510,816 1,670,732 Transportation/Public Works 3,037,158 3,509,852 4,153,674 2,785,826 2,712,413 5,156,369 5,244,532 5,954,177 4,886,276 4,866,390 Recreation 899,025 886,501 926,926 1,043,540 1,018,472 3,605,523 3,249,398 3,320,906 3,265,936 3,798,436 Debt Service
Principal 155,000 160,000 170,000 175,000 185,000 69,401 75,000 226,252 467,657 454,566 Interest 27,292 21,608 15,697 9,587 2,736 - 125,844 124,169 307,420 219,948
16,330,555$ 17,127,070$ 18,526,918$ 17,102,956$ 16,962,078$ 23,246,731$ 23,788,592$ 24,421,015$ 24,322,799$ 26,129,873$
Excess of revenues over (under) expenditures1,433,636$ 28,124$ (397,617)$ 5,866$ (224,803)$ (3,126,652)$ (3,338,006)$ (1,865,389)$ (42,076)$ (1,120,250)$
Other financing sources (uses)Land purchases - - - - - - - - - - Transfers in 782,246 781,655 835,798 1,090,074 1,112,184 1,575,341 1,218,930 1,265,170 1,277,099 3,032,557 Transfers out (561,192) (340,601) (344,744) (599,020) (4,296,604) (658,178) (709,930) (756,170) (718,099) (2,173,557) Sale of Capital Assets - - - - - - - - - 178,766 Capital lease - - - - - - - 878,703 - 295,224 Issuance of debt - - - - - 3,790,000 - - 4,245,000 - Premium on debt - - - - - - - - 429,291 -
221,054$ 441,054$ 491,054$ 491,054$ (3,184,420)$ 4,707,163$ 509,000$ 1,387,703$ 5,233,291$ 1,332,990$
Net change in fund balances1,654,690$ 469,178$ 93,437$ 496,920$ (3,409,223)$ 1,580,511$ (2,829,006)$ (477,686)$ 5,191,215$ 212,740$
Debt service as a percentage of non-capital expenditures1.20% 1.17% 1.14% 1.15% 1.16% 0.43% 1.42% 1.75% 2.95% 3.07%
Notes: 1. Modified accrual basis of accounting2. Rise of debt service percentage in Fiscal Year 2017 is attributed to Equipment Master Lease payments
Total other financing sources
Revenues
Expenditures
Total revenues
Total expenditures
117

City of Cocoa Beach, FloridaTable B-1
Value of Taxable PropertyLast Ten Fiscal Years
Taxable Value Personal NewReal Property Property for Gross Construction Adjusted Final
Fiscal for Operating Operating Taxable Taxable Taxable Taxable MillageYear Purposes Purposes Value Value Value Value* Rate **
2009 $ 1,639,162,920 $ 53,665,754 $ 1,692,828,674 $ 5,605,130 $ 1,687,223,544 $ 1,938,070,723 3.7186 2010 1,417,116,320 43,261,675 1,460,377,995 2,756,180 1,457,621,815 1,457,361,276 4.0000 2011 1,273,147,270 34,617,909 1,307,765,179 2,615,190 1,305,149,989 1,457,119,766 4.5000 2012 1,282,995,490 36,505,989 1,319,501,479 1,955,124 1,317,546,355 1,317,771,181 5.0240 2013 1,336,061,370 39,768,882 1,375,830,252 1,068,490 1,374,761,762 1,317,345,221 4.9798 2014 1,420,415,260 42,997,287 1,463,412,547 2,768,970 1,460,643,577 1,375,437,743 4.9798 2015 1,528,428,150 44,389,202 1,572,817,352 3,875,580 1,568,941,772 1,462,050,879 4.9798 2016 1,651,383,595 44,356,979 1,695,740,574 7,726,440 1,688,014,134 1,570,025,655 4.9798 2017 1,790,137,425 45,689,227 1,835,826,652 3,666,242 1,832,160,410 1,689,173,910 5.4798 2018 1,926,013,887 47,699,982 1,973,713,869 2,355,548 1,971,358,321 1,834,321,456 5.7298
Source: Brevard County Property Appraiser (Form DR-420)
Notes: * Final taxable value determined after Valuation Board rulings.
** The rate used in the calculation for property taxes. One mil equals $1 per $1,000 of taxable value.A millage of 5.7298, which is the current (Fiscal Year 2018) rate in effect for the City of Cocoa Beach isequal to $5.73 for each $1,000 of taxable value on real property.
Property is assessed at actual value and therefore a separate table for assessed and actual data is not presented.
118

City of Cocoa Beach, FloridaTable B-2
Direct and Overlapping Property Tax RatesLast Ten Fiscal Years
Fiscal Basic Brevard TotalYear Rate * County Operating Capital Outlay Other ** Millage
2009 3.7186 4.5211 6.1870 1.5000 0.4503 16.37702010 4.0000 5.2249 6.1530 1.5000 0.4503 17.32822011 4.5000 5.9199 6.6120 1.5000 0.3658 18.89772012 4.9798 5.9199 6.5960 1.5000 0.3658 19.36152013 4.9798 5.7979 6.1060 1.5000 0.3628 18.74652014 4.9798 5.4589 5.8390 1.5000 0.5230 18.30072015 4.9798 5.3047 5.7750 1.5000 0.4988 18.05832016 4.9798 5.3590 5.7750 1.5000 0.4445 18.05832017 5.4798 5.1512 5.4160 1.5000 0.4241 17.97112018 5.7298 4.9117 5.0680 1.5000 0.3952 17.6047
Source: Brevard County Property Appraiser website.
Notes: * The rate used in the calculation for property taxes. One mil equals $1 per $1,000 of taxable value.The tax rate on real property is based on $1 per $1,000 of assessed property value.
** "Other" includes Florida Inland Navigation District and St. John's River Water Management District.
Overlapping rates are those of local and county governments that apply to property owners withinthe City of Cocoa Beach.
The total millage column applies to all property owners within the City limits.
CityOverlapping Rates
Brevard County Schools
Direct Rates
119

City of Cocoa Beach, FloridaTable B-3
Principal Property TaxpayersCurrent Year and Nine Years Ago
`Percentage Percentageof Total City of Total City
Taxable Taxable Taxable TaxableAssessed Assessed Assessed Assessed
Value Rank Value Value Rank Value
20,359,230$ 1 1.11% - - - 20,245,170 2 1.10% 20,632,860$ 1 1.42%14,572,560 3 0.79% 8,500,000 6 0.58%
Northport Inc Et Al (Ocean Landings) 12,063,980 4 0.66% 11,498,870 2 0.79%11,087,960 5 0.60% 10,791,890 4 0.74%11,074,560 6 0.60% - - -
Ocean Partners Hospitality LLC 5500 North Corp. (Days Inn/Best Western) 9,574,680 7 0.52% 11,350,040 3 0.78%Branch Cornerstone Assoc LP (Inland Western)* 7,806,990 8 0.43% 5,600,000 8 0.38%
7,730,220 9 0.42% 6,404,870 7 0.44%6,521,900 10 0.36% 4,400,000 9 0.30%
Las Olas Beach Club - - - 8,934,200 5 0.61%Cocoa Beach Surf Company - - - 4,000,000 10 0.27%
121,037,250$ 6.60% 92,112,730$ 6.32%
1,834,321,456$ 1,457,119,766$
Source: Brevard County Property AppraiserMultiple properties may be included in some taxable assessed value totals*This Taxpayer includes the Cornerstone Plaza Publix
2018 2009
1300 Atlantic (International Palms)Cocoa Beach Development, Inc.(Cocoa Beach Resort)
Taxpayer
Total City final taxable value
Westgate Resorts Ltd & Pier (Wakulla)
TOTALS
Discovery Resort, Inc.
1550 North Atlantic (Hilton)
Ron Jon Surf Shop of Florida, Inc.Pandey Hotel Cocoa Beach LLC (Doubletree, Cocoa Beach Hotel Fund)
120

City of Cocoa Beach, FloridaTable B-4
Property Tax Levies and Collections Last Ten Fiscal Years
Current YearGross Collections
Fiscal Tax Percentage for Prior PercentageYear Levy (1) Amount of Levy Years Amount of Levy
2009 7,210,039$ 6,949,361$ 96.38% 33,091$ 6,982,452$ 96.84%2010 6,558,125 6,502,384 99.15% 45,134 6,547,518 99.84%2011 6,563,416 6,302,345 96.02% 25,030 6,327,375 96.40%2012 6,562,237 6,327,427 96.42% 20,696 6,348,123 96.74%2013 6,560,116 6,302,734 96.08% 49,388 6,352,122 96.83%2014 6,849,405 6,599,358 96.35% 55,240 6,654,598 97.16%2015 7,281,531 6,974,913 95.79% 13,075 6,987,988 95.97%2016 7,832,316 7,445,190 95.06% 12,070 7,457,259 95.21%2017 9,256,330 8,773,566 94.78% 10,390 8,783,956 94.90%2018 10,510,295 9,743,132 92.70% 175,935 9,919,067 94.37%
Source: (1) Form 420 Final Taxable Value Line 7, multiplied by millage rate, less allowance for adjustments and discounts.
Notes: Reference the Financial Statements, Note A, Paragraph 14.
Current Year Collections includes prior year taxes and penalties collected.
Total CollectionsCollected Within the Fiscal Year of the Levy
121

City of Cocoa Beach, FloridaTable C-1
Ratios of Outstanding Debt by TypeLast Ten Fiscal Years
CRA Utility Clean Clean Clean Debt asCapital Improvement System Water Water Water Total
Improvement Revenue Improvement State State State Debt of of DebtFiscal Revenue Bond Capital Revenue Revolving Revolving Revolving Primary Personal PerYear Note Series 2017B Lease(s) Bonds/Note Loan 050610 Loan 050620 Loan 050621 Government Income Capita
2009 690,000$ -$ -$ 3,565,000$ 3,994,751$ -$ -$ 8,249,751$ 1.85% 645$ 2010 530,000 - - - 3,761,330 - - 4,291,330 0.87% 340 2011 360,000 - - - 3,520,852 - - 3,880,852 0.83% 346 2012 185,000 - - - 13,398,470 - - 13,583,470 2.99% 1,206 2013 - - 310,647 - 22,924,791 - - 23,235,438 5.19% 2,064 2014 3,790,000 - 241,246 2,695,000 20,433,179 - - 27,159,425 6.21% 2,442 2015 3,715,000 - 169,625 2,420,000 19,607,982 1,714,186 - 27,626,793 6.91% 2,482 2016 3,570,000 - 967,076 2,135,000 18,759,001 4,170,162 - 29,601,239 5.33% 2,647 2017 3,420,000 4,245,000 649,419 1,845,000 17,885,846 4,180,624 - 32,225,889 9.51% 2,858 2018 3,265,000 4,645,672 645,077 1,550,000 16,987,829 4,010,056 1,141,177 32,244,811 6.43% 2,856
Notes: Percentage of personal income and per capita amounts calculated from information in Table D-1.
Revenue Note 2014 A for fire station construction issued in Fiscal Year 2014 (Governmental Activities).
See Note H, Paragraph No. 1 for a detailed discussion of the Capital Equipment Lease (Governmental Activities).
The Utility System Bonds Series 2002 were legally defeased March 3, 2010 (Business-type Activities).
See Note H, Paragraphs Nos. 1 & 2 and 4b - 5 for a detailed discussion of the Clean Water State Revolving Loans (SRF).
The 2004 SRF loan was refunded by a bank loan in Fiscal Year 2014 - Capital Improvement Revenue Refunding Note, Series 2014B (Business-type Activities).
CRA Improvement Revenue Bonds, Series 2017B were issued in September of 2017. Note H - 3b details the payment schedule
Details regarding all of the City's outstanding debt can be found in Note H to the Financial Statements.
Percentage
Governmental Activities Business-type Activities
122

City of Cocoa Beach, FloridaTable C-3
Direct and Overlapping Governmental Activities DebtAs of September 30, 2017
EstimatedEstimated Share of
Debt Percentage OverlappingOutstanding Applicable Debt
City Direct Debt (governmental activities) (a) 8,555,749$ 100.00% 8,555,749$
Overlapping DebtBrevard County: Governmental activities debt (b) 223,609,163 5.3039% 11,860,068
Total Direct and Overlapping Debt 232,164,912$ 20,415,817$
Source: (a) City of Cocoa Beach CAFR Fiscal Year 2018 Statistical Table C-1 .(b) Brevard County Finance Department - CAFR Fiscal Year 2017, Table 7 and 11.
Notes: Percentage based on the 2017 final taxable assessed City and County valuation.
Governmental Unit
123

City of Cocoa Beach, FloridaTable C-5
Pledged Revenue CoverageLast Ten Fiscal Years
(1) Utility (2)Gross Less: Net
Fiscal Pledged Operating PledgedYear Revenue Expenses Revenue Principal Interest Coverage
2009 5,181,664$ 3,785,669$ 1,395,995$ 1,695,000$ 135,643$ 0.762010 - - - - - -2011 - - - - - -2012 - - - - - -2013 - - - - - -2014 - - - - - -2015 - - - - - -2016 - - - - - -2017 - - - - - -2018 - - - - - -
Notes: (1) Gross pledged revenues include sewer system connection fees accounted for as contributed capital in the financial statements, but available for debt service in accordance with the bond resolution.
(2) Direct operating expenses exclude depreciation and amortization.
(3) The Utility bonds were advance refunded in November 2002. The debt service requirement for Fiscal Year 2003 included the Novemberprincipal and interest requirements for the Series 1993 Bonds and the May interest requirement for the Series 2002 Bonds.
(4) Gross pledged revenues include golf course operating revenue, electric franchise fees and occupational licenses.
(5) The Public Improvement Revenue Refunding Bonds, Series 2002 payments were split between the General Fund and the GolfCourse Fund. The Golf Course Fund was incorporated into the General Fund in Fiscal Year 2014.
(6) The Public Improvement Bonds were advance refunded in August 2002. The debt service requirement for Fiscal Year 2003 was onthe Series 1993 Public Improvement Revenue Bonds, which had principal and interest payments of $135,000 and $233,760,respectively, prior to their retirement.
(7) The Public Improvement Bonds were legally defeased as of April 2007.
(8) The Utilities System Improvement Bonds were legally defeased as of March 3, 2010.
Utilities System ImprovementUtilities System Improvement Revenue Refunding Bonds, Series 2002
Debt Service(3)(8)
124

City of Cocoa Beach, FloridaTable D-1
Demographic and Economic Statistics Last Ten Fiscal Years
(1) (2) (3) (4) (5) (6)Per Capita
Personal Personal Median Unemployment SchoolPopulation Income Income Age Rate Enrollment
12,800 445,977,600$ 34,842$ 53.2 12.1% 2,22612,631 492,583,738 38,998 53.9 12.9% 2,17511,231 468,939,174 41,754 54.3 10.8% 2,22611,233 453,970,462 40,414 53.5 6.0% 2,06311,259 447,770,430 39,770 56.2 3.9% 1,97711,121 437,044,179 39,299 56.8 6.3% 1,914
2015 11,131 399,814,389 35,919 58.3 6.1% 1,8762016 11,182 555,633,580 49,690 47.1 5.2% 1,8112017 11,276 338,821,248 30,048 59.4 4.6% 1,7852018 11,292 501,184,128 44,384 59.4 3.7% 1,782
Sources: (1) Economic Development Commission (EDC) of Florida's Space Coast(2) Estimate (1) x (3)(3) Economic Development Commission of Florida's Space Coast(4) Economic Development Commission of Florida's Space Coast(5) Economic Development Commission of Florida's Space Coast(6) Brevard County Public Schools Include: Cocoa Beach Junior/Senior High School
Freedom 7 Elementary School Theodore Roosevelt Elementary School
20132014
Year
2010
2012
2009
2011
125

City of Cocoa Beach, FloridaTable D-2
Principal Employers Current Year and Ten Years Ago
Percentage of Percentage ofTotal County Total County
Employer Employees Rank Employment Employees Rank Employment
Brevard County Schools 9,000 - 9,999 1 3.46% - 3.85% 8,800 1 3.73%Health First, Inc. 8,000 - 8,999 2 3.08% - 3.46% 6,420 3 2.72%Harris Corporation 6,000 - 6,999 3 2.31% - 2.69% 6,550 2 2.77%Northrop Grumman Corporation 2,000 - 2,999 4 .77% - 1.15% 1,560 11 0.66%Brevard County Government 2,000 - 2,999 5 .77% - 1.15% 2,720 7 1.15%45th Space Wing DOD 2,000 - 2,999 6 .77% - 1.15% 1,870 10 0.79%NASA @ Kennedy Space Ctr. 1,000 - 1,999 7 .38% - .77% 2,170 9 0.92%New Rockwell Collins Inc. 1,000 - 1,999 8 .38% - .77% - - 0.00%Steward Medical Group (Wuesthoff Health Systems) 1,000 - 1,999 9 .38% - .77% 2,440 8 1.03%Eastern Florida State College 1,000 - 1,999 10 .38% - .77% 1,560 12 0.66%Brevard County Sheriff Office 1,000 - 1,999 11 .38% - .77% - - -Florida Institute of Technology 1,000 - 1,999 12 .38% - .77% - - -United Space Alliance - - - 6,000 4 2.54%Publix - - - 2,820 6 1.19%Walmart - - - 3,140 5 1.33%
TOTALS N/A NA 46,050 19.49%
Source: Economic Development Commission of Florida's Space Coast.
Notes: 1 Employers include retail operations.
2 Employment figures are for Brevard County.3 Exact employment numbers are no longer available as of 2016 for security reasons per the EDC.4 Total average employment for Brevard County in fiscal year 2009 was 238,8905 Total average employment for Brevard County in fiscal year 2018 was 259,800
2018 2009
126

City of Cocoa Beach, FloridaTable E-1
Full-time Equivalent City Government Employees by Function/Program
Last Ten Fiscal Years
Function/Program 2009 2010 2011 2012 2013 2014 2015 2016 2017 2018
General Government 31.50 31.65 31.50 31.70 32.20 31.20 31.90 37.20 36.20 36.20
Police 53.50 51.50 53.60 53.35 54.00 54.45 55.45 55.50 55.45 56.45
Fire 28.00 27.00 28.00 28.00 28.00 28.00 28.00 28.00 28.00 28.00
Public Works 28.75 28.50 28.50 29.10 30.48 30.63 31.00 32.80 34.80 34.80
Parks and Recreation 24.38 19.17 19.56 25.44 29.45 23.27 23.29 29.35 29.35 30.35
Utilities 25.00 25.00 24.00 24.00 24.00 24.00 25.00 25.00 25.00 25.00
Stormwater 7.00 5.00 4.00 4.00 4.00 4.00 4.00 4.00 4.00 4.00
Golf Course 43.00 40.43 39.14 45.15 40.95 45.05 40.70 40.70 39.70 39.70
Metered Parking 4.00 5.68 5.35 6.85 6.25 5.25 5.90 5.90 5.90 5.90
Totals 245.13 233.93 233.65 247.59 249.33 245.85 245.24 258.45 258.40 260.40
Source: City Finance and Personnel Departments.
Notes: Refers to the number of personnel authorized for an accounting period, including part-timepersonnel converted to the decimal equivalent of a full-time position based on 2,080 hours peryear. For example, a part-time recreation aide working 20 hours per week for 52 weeks a yearequals one-half of a full-time position. Elected officials are carried as General Government
employees for payroll purposes, but are excluded from the figures above.
Staffing Notes: Increase in General Government in 2016 due to addition of 6 positions (ACM, Associate Planner, 2 GIS, 2 IT).Increase in Parks and Recreation due to ACA reg changes and the need to add additional staff membersto ensure the same or higher level of service is delivered to the residents and visitors.
Full-time Equivalent Employees as of September 30
127

City of Cocoa Beach, FloridaTable E-2
Operating Indicators by Function/Program Last Ten Years
2009 2010 2011 2012 2013 2014 2015 2016 2017 2018Police
Physical arrests 1,215 822 801 729 616 681 685 581 785 675 Parking violations 7,059 5,405 5,529 7,268 8,527 6,084 5,841 7,770 10,831 13,983 Traffic violations 5,469 4,863 3,798 3,616 3,696 4,163 1,984 2,941 2,904 2,668
FireEmergency responses (incidents) 2,184 2,149 2,513 2,150 2,467 2,235 2,565 2,646 2,803 2,745 Fires extinguished 63 46 62 63 62 47 46 48 55 57 Inspections 504 323 206 281 582 410 178 196 214 228
Public Works***Street resurfacing (miles) - - 1.3 - - - - 0.1 0.32 - Pothole repair/patching (square yards) 1,150 126 243 248 - 269 2,311 184 226 458Asphalt rejuvenation (square yards) - 530,109 - - - - 283,558 263,112 - -
Parks and RecreationAttendees at gymnasium 2,621 2,158 2,542 1,717 2,149 2,385 2,192 2,026 3,265 3,836 Pool attendees 19,624 19,003 22,627 21,180 19,564 21,392 25,083 23,021 21,154 19,839
WaterTotal metered connections* 4,526 4,507 4,518 4,502 4,501 4,523 4,368 4,570 4,589 4,603 Average daily consumption 2,136 1,902 1,913 1,891 1,780 1,808 1,652 1,784 1,768 1,709 (thousands of gallons)
WastewaterAverage daily sewage treatment ** 3,208 3,368 3,600 3,705 3,933 4,148 4,260 3,857 3,852 4,094 (thousands of gallons)
Refuse collection - Contracted out.Library - County provided.Transit - County provided.
* Excludes Patrick AFB.** Includes Patrick AFB.*** No road work was recorded in the Public Works categories in Fiscal Year 2014 - City-wide asphalt rejuvenation budgeted in Fiscal Year 2015 and Fiscal Year 2016.
Data provided by City of Cocoa Water Sewer Distribution Report.Water data provided by City of Cocoa.Wastewater data provided by City of Cocoa Beach.
Function/Program
Notes:
Sources:
128

City of Cocoa Beach, FloridaTable E-3
Capital Asset Statistics by Function/Program Last Ten Fiscal Years
2009 2010 2011 2012 2013 2014 2015 2016 2017 2018Schools (1)
Elementary 2 2 2 2 2 2 2 2 2 2 Junior/Senior High 1 1 1 1 1 1 1 1 1 1
PoliceStations 1 1 1 1 1 1 1 1 1 1 Police Officers (2) 33 37 34 31 34 32 35 35 35 37
Fire Stations 2 2 2 2 2 2 2 2 2 2
Firefighters (2) 27 27 27 26 27 27 27 27 27 27
Other Public WorksStreets (linear miles) 35 35 35 35 35 35 35 35 35 35 Streetlights 1,265 1,265 1,265 1,265 1,265 1,265 1,265 1,265 1,265 1,265
Parks and RecreationParks and playgrounds (4) 12 12 12 12 12 12 12 12 12 12 Golf course (27 holes) 1 1 1 1 1 1 1 1 1 1 Tennis courts (2 clay) 12 12 12 12 12 12 12 12 12 12 Swimming pools (1 adult; 1 children) 2 2 2 2 2 2 2 2 2 2 Maritime Hammock Preserve (5) 1 1 1 1 1 1 1 1 1 1 Skateboard park 1 1 1 1 1 1 1 1 1 1
UtilitiesWastewater Sanitary sewers (miles) 64 64 64 64 64 64 64 64 64 64 Storm sewers (miles) 18 22 22 22 22 22 22 22 22 22
Electricity Meter connections 10,122 10,120 10,121 10,137 10,155 10,201 10,235 10,269 10,280 10,129
Notes:(1) Schools owned and operated by Brevard County School Board(2) Sworn officers(3) Firefighters and 2 chiefs(4) City and County parks in City limits
Function/Program
129

Page intentionally blank
130
Com
plia
nce
Sect
ion
Independent Auditor’s Report on Internal Control Over Financial Reporting and on Compliance and Other Matters Based on an Audit of Financial Statements Performed in Accordance With Government Auditing Standards
Independent Auditor’s Management Letter Independent Accountant’s Report
131

Page intentionally blank
132

INDEPENDENT AUDITOR’S REPORT ON INTERNAL CONTROL OVER FINANCIAL REPORTING AND ON COMPLIANCE AND OTHER MATTERS BASED ON AN
AUDIT OF FINANCIAL STATEMENTS PERFORMED IN ACCORDANCE WITH GOVERNMENT AUDITING STANDARDS
Honorable Mayor and Members of the City Commission Cocoa Beach, Florida We have audited, in accordance with the auditing standards generally accepted in the United States of America and the standards applicable to financial audits contained in Government Auditing Standards issued by the Comptroller General of the United States, the financial statements of the governmental activities, the business-type activities, each major fund, and the aggregate remaining fund information of the City of Cocoa Beach, Florida (the “City”) as of and for the year ended September 30, 2018, and the related notes to the financial statements, which collectively comprise the City’s basic financial statements and have issued our report thereon dated March 14, 2019. Internal Control over Financial Reporting In planning and performing our audit of the financial statements, we considered the City’s internal control over financial reporting (internal control) to determine the audit procedures that are appropriate in the circumstances for the purpose of expressing our opinions on the financial statements, but not for the purpose of expressing an opinion on the effectiveness of the City’s internal control. Accordingly, we do not express an opinion on the effectiveness of the City’s internal control. A deficiency in internal control exists when the design or operation of a control does not allow manage-ment or employees, in the normal course of performing their assigned functions, to prevent or detect and correct misstatements on a timely basis. A material weakness is a deficiency, or combination of deficiencies, in internal control, such that there is a reasonable possibility that a material misstatement of the entity’s financial statements will not be prevented, or detected and corrected on a timely basis. A significant deficiency is a deficiency, or a combination of deficiencies, in internal control that is less severe than a material weakness, yet important enough to merit attention by those charged with governance. Our consideration of internal control over financial reporting was for the limited purpose described in the first paragraph of this section and was not designed to identify all deficiencies in internal control that might be material weaknesses or significant deficiencies. Given these limitations, during our audit we did not identify any deficiencies in internal control that we consider to be material weaknesses. However, material weaknesses may exist that have not been identified.
133

Honorable Mayor and Members of the City Commission Cocoa Beach, Florida Compliance and Other Matters As part of obtaining reasonable assurance about whether the City’s financial statements are free of material misstatement, we performed tests of its compliance with certain provisions of laws, regulations, contracts, and grant agreements, noncompliance with which could have a direct and material effect on the determination of financial statement amounts. However, providing an opinion on compliance with those provisions was not an objective of our audit and, accordingly, we do not express such an opinion. The results of our tests disclosed no instances of noncompliance or other matters that are required to be reported under Government Auditing Standards. Pursuant to provisions of Chapter 10.550, Rules of the Auditor General, we reported certain matters to management of the City in a separate Management Letter and Independent Accountant’s Report dated March 14, 2019. Purpose of this Report The purpose of this report is solely to describe the scope of our testing of internal control and compliance and the results of that testing, and not to provide an opinion on the effectiveness of the entity’s internal control or on compliance. This report is an integral part of an audit performed in accordance with Government Auditing Standards in considering the entity’s internal control and compliance. Accordingly, this communication is not suitable for any other purpose. MOORE STEPHENS LOVELACE, P.A. Certified Public Accountants Orlando, Florida March 14, 2019
134

INDEPENDENT AUDITOR’S MANAGEMENT LETTER Honorable Mayor and Members of the City Commission Cocoa Beach, Florida Report on the Financial Statements
We have audited the financial statements of the City of Cocoa Beach, Florida (the “City”) as of and for the year ended September 30, 2018, and have issued our report thereon dated March 14, 2019. Auditor’s Responsibility
We conducted our audit in accordance with auditing standards generally accepted in the United States of America and the standards applicable to financial audits contained in Government Auditing Standards issued by the Comptroller General of the United States and Chapter 10.550, Rules of the Auditor General. Other Reporting Requirements
We have issued our Independent Auditor’s Report on Internal Control over Financial Reporting and on Compliance and Other Matters Based on an Audit of Financial Statements Performed in Accordance with Government Auditing Standards; and Independent Accountant’s Report on an examination conducted in accordance with AICPA Professional Standards, AT-C Section 315, regarding compliance requirements in accordance with Chapter 10.550, Rules of the Auditor General. Disclosures in those reports, which are dated March 14, 2019, should be considered in conjunction with this management letter. Prior Audit Findings
Section 10.554(1)(i)1., Rules of the Auditor General, requires that we determine whether or not corrective actions have been taken to address findings and recommendations made in the preceding annual financial report. Corrective actions have been taken to address the finding and recommendation made in the preceding annual financial audit report. Official Title and Legal Authority
Section 10.554(1)(i)4., Rules of the Auditor General, requires that the name or official title and legal authority for the primary government and each component unit of the reporting entity be disclosed in this management letter, unless disclosed in the notes to the financial statements. The legal authority is disclosed in the notes to the financial statements.
135

Honorable Mayor and Members of the City Commission Cocoa Beach, Florida Financial Condition and Management
Sections 10.554(1)(i)5.a. and 10.556(7), Rules of the Auditor General, require us to apply appropriate procedures and communicate the results of our determination as to whether or not the City has met one or more of the conditions described in Section 218.503(1), Florida Statutes, and identification of specific condition(s) met. In conjunction with our audit, we determined that the City did not meet any of the conditions described in Section 218.503(1), Florida Statutes. Pursuant to Sections 10.554(1)(i)5.b. and 10.556(8), Rules of the Auditor General, we applied financial condition assessment procedures. It is management’s responsibility to monitor the City’s financial condition, and our financial condition assessment was based, in part, on representations made by manage-ment and the review of financial information provided by the same. The assessment was prepared as of September 30, 2018. Section 10.554(1)(i)2., Rules of the Auditor General, requires that we address in the management letter any recommendations to improve financial management. In connection with our audit, we did not have any such recommendations. Special District Component Units
Section 10.554(1)(i)5.c., Rules of the Auditor General, requires that we determine whether or not a special district that is a component unit of a county, municipality, or special district, provided the financial information necessary for proper reporting of the component unit, within the audited financial statements of the county, municipality, or special district in accordance with Section 218.39(3)(b), Florida Statutes. In connection with our audit, we determined that all special district component units provided the necessary information for proper reporting in accordance with Section 218.39(3)(b), Florida Statutes. Additional Matters
Section 10.554(1)(i)3., Rules of the Auditor General, requires us to communicate noncompliance with provisions of contracts or grant agreements, or abuse, that have occurred, or are likely to have occurred, that have an effect on the financial statements that is less than material but which warrants the attention of those charged with governance. In connection with our audit, we did not note any such findings. Purpose of this Letter
Our management letter is intended solely for the information and use of the Legislative Auditing Committee, members of the Florida Senate and the Florida House of Representatives, the Florida Auditor General, federal and other granting agencies, the City Commission members, and applicable management and is not intended to be, and should not be, used by anyone other than these specified parties. MOORE STEPHENS LOVELACE, P.A. Certified Public Accountants Orlando, Florida March 14, 2019
136

INDEPENDENT ACCOUNTANT’S REPORT Honorable Mayor and Members of the City Commission Cocoa Beach, Florida We have examined the compliance of the City of Cocoa Beach, Florida (the “City”) with the requirements of Section 218.415, Florida Statutes, during the fiscal year ended September 30, 2018. Management is responsible for the City’s compliance with those requirements. Our responsibility is to express an opinion on the City’s compliance based on our examination.
Our examination was conducted in accordance with attestation standards established by the American Institute of Certified Public Accountants. Those standards require that we plan and perform the exami-nation to obtain reasonable assurance about whether the City complied with those requirements. An examination involves performing procedures to obtain evidence about the City’s compliance with those requirements. The nature, timing, and extent of the procedures selected depend on our judgment, including an assessment of the risks of noncompliance, whether due to fraud or error. We believe that the evidence we obtained is sufficient and appropriate to provide a reasonable basis for our opinion. Our examination does not provide a legal determination on the City’s compliance with specified requirements.
In our opinion, the City complied, in all material respects, with the aforementioned requirements for the fiscal year ended September 30, 2018. MOORE STEPHENS LOVELACE, P.A. Certified Public Accountants Orlando, Florida March 14, 2019
137

Excellent Recreation and Quality Living
www.CityofCocoaBeach.com
https://www.facebook.com/CocoaBeachCityHall/
City of Cocoa Beach, Florida