city of laporte
TRANSCRIPT

City of LaPorteCity of LaPorteCSO Long Term Control Plan
June 2005

CSO LONG TERM CONTROL PLAN CITY OF LAPORTE, INDIANA Revised June 2005
Malcolm Pirnie, Inc. Environmental Engineers, Scientists & Planners
5975 Castle Creek Parkway North Drive Suite 355
Indianapolis IN 46250
and
NIES Engineering, Inc. 2421 173rd Street
Hammond, IN 46323-2132

TABLE OF CONTENTS
Page 1.0 INTRODUCTION
1.1 General.........................................................................................................1 1.2 Population ....................................................................................................1 1.3 Wastewater System......................................................................................2 1.4 Receiving Stream.........................................................................................3 1.5 Source Documents .......................................................................................4 1.6 Modified Planning Approval .......................................................................4
2.0 PUBLIC PARTICIPATION
2.1 Introduction..................................................................................................6 2.2 Citizens’ Advisory Committee ....................................................................7 2.3 Additional Public Participation Meetings....................................................7 2.4 Recommendations......................................................................................10
3.0 IDENTIFICATION OF AND IMPACTS TO SENSITIVE AREAS....................11 4.0 CHARACTERIZATION, MONITORING AND MODELLING OF THE
COMBINED SEWER SYSTEM 4.1 Use of SRCER Data to Model Events and Descriptions of Plant CSO
Control Methods ........................................................................................12 4.2 Flow Measurement.....................................................................................12 4.3 Storm Characterization ..............................................................................14 4.4 SRCER Sample Collection and Data.........................................................15
5.0 CSO OPERATIONAL PLAN 5.1 Documentation of Nine Minimum Controls ..............................................17
5.1.1 Surface Drainage and Ponding Issues............................................17 5.1.2 Sewer Backup Issues......................................................................18 5.1.3 Infiltration/Inflow Sources.............................................................18 5.1.4 Infiltration into the CSO Storage Lagoon by the Natural Spring ..18
5.2 Revisions to CSOOP..................................................................................18 5.3 Identification of Significant Industrial Dischargers...................................19 5.4 Maximization of Treatment at WWTP ......................................................20 5.5 Monitoring For CSO Control Decisions ....................................................21
ii

TABLE OF CONTENTS (Continued)
6.0 CSO CONTROL ALTERNATIVES 6.1 Introduction................................................................................................22 6.2 Alternative 1 – Sewer Separation ..............................................................22 6.3 Alternative 2 - Disinfection .......................................................................23 6.4 Alternative 3 – Store and Treat..................................................................24 6.5 Environmental Evaluation .........................................................................26 6.6 Project Financing and Cost Impact on Customers.....................................28 6.7 Recommended Project ...............................................................................28 7.0 IMPLEMENTATION SCHEDULE FOR THE RECOMMENDED PLAN.........30 8.0 POST-CONSTRUCTION MONITORING 8.1 Post-Construction Monitoring Program.....................................................31 8.2 Post-Construction Monitoring Report........................................................31 8.3 Discharge Authorization ............................................................................32
LIST OF APPENDICIES Appendix Description A CSO Operational Plan B Stream Reach Characterization and Evaluation Report C Public Participation Documentation D LaPorte CSO Overflow Data E Correspondence Regarding Potentially Sensitive Areas Excerpts from F Bulletin 71 “Rainfall Frequency Atlas of the Midwest” G Schedule of Estimated Revenue Versus Revenue Requirements H DVD Videos of May 5, 2004 and August 25, 2004 Public Meetings
iii

TABLE OF CONTENTS (Continued)
LIST OF TABLES
Table No. Description Page 1-1 Previous Reports ..........................................................................................4
5-1 Significant Industrial Users........................................................................19
5-2 CSO Volumes and Durations.....................................................................20
6-1 Alternative 1 – Sewer Separation – Preliminary Estimate of Probable Construction Costs .....................................................................................23
6-2 Alternative 2 – Disinfection – Preliminary Estimate of Probable Construction Costs .....................................................................................24
6-3 Alternative 3 – Store and Treat – Preliminary Estimate of Probable Construction Costs .....................................................................................26
7-1 Proposed CSO LTCP Implementation Schedule .......................................30
LIST OF PHOTOGRAPHS
No. Description Page 4-1 Aerial Photo of LaPorte Wastewater Treatment Facilities Flow Meters Showing Flow Meters....................................................................13
4-2 CSO Storage Lagoon Overflow.................................................................15
4-3 LaPorte Main WWTP Outfall 001 on left and CSO Lagoon Overflow 002 on right................................................................................15
iv

TABLE OF CONTENTS (Continued)
LIST OF FIGURES
Following No. Description Page 1-1 Combined and Sanitary Sewer Map ............................................................2
1-2 Census 2000 – LaPorte Census Blocks........................................................2
1-3 Aerial Photo of LaPorte WWTP..................................................................2
1-4 Wastewater Treatment Plant Process Flow Diagram...................................2
1-5 CSO and Receiving Stream Location Map..................................................5
5-1 CSO Events Discharge...............................................................................20
6-1 Alternative 2 – Disinfection Schematic Diagram ......................................23
6-2 Alternative 3 – Store and Treat Schematic Diagram .................................24
v

1.0 INTRODUCTION 1.1 GENERAL
The City of LaPorte, Indiana (City) has developed this Combined Sewer
Overflow (CSO) Long-Term Control Plan in accordance with the requirements of state
and federal law. The purpose of this Long-Term Control Plan (LTCP) is to identify
controls that when implemented will ensure compliance with the technology and water
quality based requirements of state and federal law.
The CSO LTCP was originally submitted to IDEM in July 2002. IDEM provided
review comments in a letter to LaPorte dated January 14, 2004. The CSO LTCP was
revised in response to IDEM’s comments and resubmitted in August 2004. IDEM and
LaPorte had several discussions regarding the August 2004 submittal, during which
IDEM provided comments regarding the submittal. The CSO LTCP was further revised
in response to IDEM’s comments and resubmitted in May 2005.
The control alternative recommended by the City of LaPorte is “Alternative 3,”
which calls for the storage and treatment of combined storm and sanitary wastewater,
with the goal of eliminating all CSO discharges. Specifically, LaPorte plans to increase
the storage capacity of the existing CSO storage lagoon from its current capacity of 12.8
million gallons to approximately 31.5 million gallons, and to increase the return pump-
back rate so that the CSO storage lagoon can be lowered more quickly after storm events.
1.2 POPULATION
The City of LaPorte is located in LaPorte County in northwest Indiana. LaPorte
had a population of approximately 21,600 according to the 2000 census. If the 2000
census is compared with the census of 1990 (population, 21,507), the census of 1980
(population, 21,755) and the census of 1970 (population, 22,140), it is apparent that the
City of LaPorte’s population has been stable for the past 30 years.
1

1.3 WASTEWATER SYSTEM
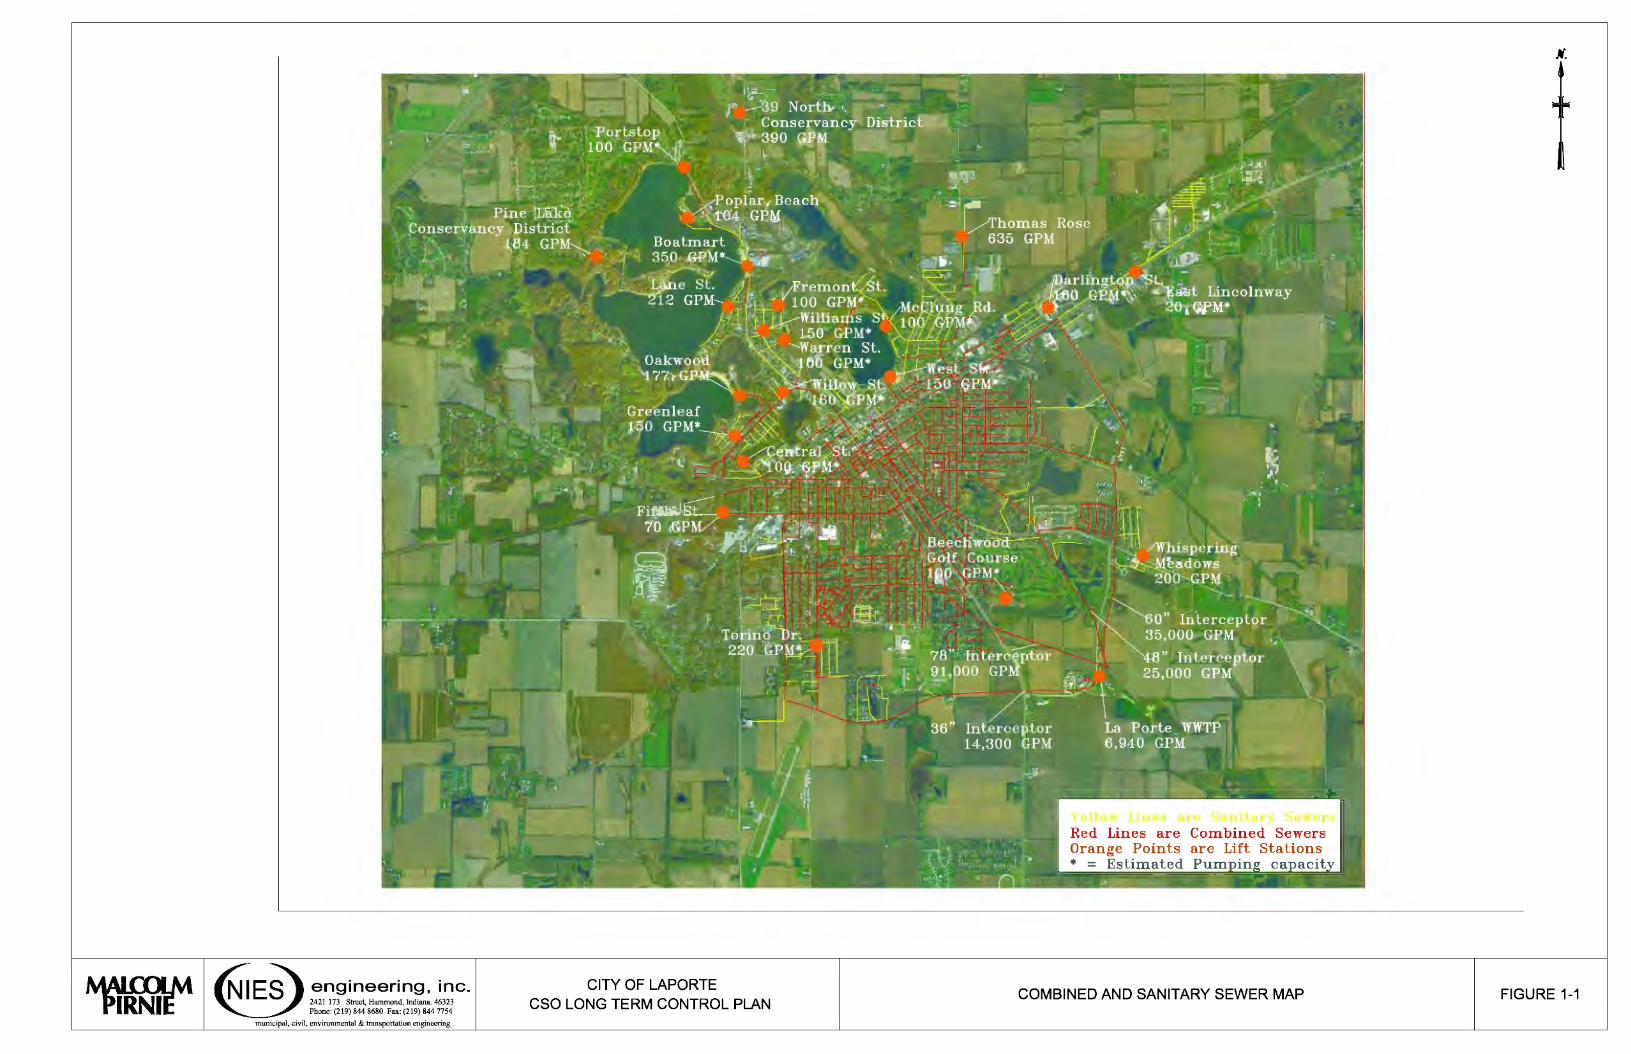
LaPorte’s wastewater collection system consists of approximately 69 miles of
combined sewers and 31 miles of sanitary sewers. Figure 1-1 is a map of the wastewater
collection system.
The combined sewers cover an area of approximately 2,240 acres. Figure 1-2 is a
map of LaPorte’s 2000 census blocks. Comparing the year 2000 population by census
block to the combined sewer area, LaPorte was able to determine that combined sewers
serve about 16,658 residents, or 77 percent of the population. LaPorte has a single CSO
discharge point, identified in NPDES Permit IN0025577 as Outfall 002, which is located
at the south eastern edge of a 17 acre CSO storage lagoon (Latitude 41 deg 35 min 07 sec
north, Longitude 86 deg 41 min 25 sec west).
LaPorte’s wastewater treatment facilities are comprised of a main wastewater
treatment plant (WWTP) and the aforementioned CSO storage lagoon. The main WWTP
receives approximately 3 million gallons per day (MGD) of dry weather flow, and has an
average design capacity of 7 MGD. Thus, there is plenty of available treatment capacity
at the main WWTP to accommodate any future population growth.
The wet weather capacity of the main WWTP was established by full-scale
testing. The maximum treatable peak and continuous treatable flow that the main WWTP
can successfully treat during wet weather is 10 MGD. Once the main WWTP reaches 10
MGD several processes start to reach their maximum capacity. Specifically the discharge
troughs on the primary clarifiers fill, raising the water level in the tanks, resulting in
carryover of solids out of the primary clarifiers’ scum line. However, LaPorte believes
that the secondary unit treatment process and disinfection process have capacities greater
than 10 MGD. This is more fully discussed in the context of “Control Alternative 3.”
See Chapter 6 and Figure 6-2 for additional information.
Figure 1-3 is an aerial photograph of LaPorte’s wastewater treatment facilities.
Figure 1-4 is a process flow diagram of LaPorte’s main WWTP. The flow into the main
WWTP is controlled through two computer-controlled gate valves. These valves act in
concert to limit the flow coming into the main WWTP to 10 MGD. If the flow drops
below 10 MGD they will automatically open to maintain that volume of wastewater
entering the facility. If the upstream flow exceeds 10 MGD they will automatically start
closing until the flow into the plant is reduced to 10 MGD. Flows in excess of the 10
2
engineering, inc. 2421 173 Street, Hammond, Indiana. 46323 Phone: (219) 844 8680 Fax: (219) 844 7754
municipal, civil, environmental & transportation engineering
COMBINED AND SANITARY SEWER MAP FIGURE 1-1 CITY OF LAPORTE
CSO LONG TERM CONTROL PLAN

43
175
50 42 130
43
11
296
@ engineering, inc. 2421 173 Street, Hammond, Indiana. 46323 Phone: (219) 844 8680 Fax: (219) 844 7754
municipal, civil, environmental & transportation engineering
42 36 31
24 29
54 53
29
10
524
CITY OF LAPORTE CSO LONG TERM CONTROL PLAN
87 N.
101
179
17
112
10
76
21
43
49 36
21
17
(
CENSUS 2000 - LAPORTE CENSUS BLOCKS FIGURE 1-2

engineering, inc. 2421 173 Street, Hammond, Indiana. 46323 Phone: (219) 844 8680 Fax: (219) 844 7754
municipal, civil, environmental & transportation engineering
CITY OF LAPORTE CSO LONG TERM CONTROL PLAN
AERIAL PHOTO OF LAPORTE WWTP FIGURE 1-3

r ---------------11 Measure 11---------------L
Flow 1 Combined Sewer Overflow Discharge to Travis Ditch Outfall 002
I LA~ON 1
1
1------<-11 LA~~N 11--------11 Measure 11---------~------AL_T_E_RN.=A::T.:.IVE:..::..:D::IS:.C:.HAR=::G::E:..:PO:.=INT::..::S:...._ ___________ ,_ _________ _,
l IPUMPSTATIONI L Flow 1
I Measure l Flow
RETURN FLOW (DRY WEATHER)
RECYCLE RECYCLE
WWTP Discharge to Travis Ditch, Outfall 001
DECHLORINATION~
I CHLORINATION I EXCESS WET WEATHER FLOW
60" Sewer 48" Sewer
78" Sewer 36" Sewer
SLUDGE DISPOSAL BY
LAND APPLICATION
I FIXED-BED I TRICKLING
1
1----. FILTER I
NITRIFICATION I TRICKLING ~1---..
FILTER
---~1 JUNCTION 11--...1.......o-11 SCREENING 1 1 MEASURE 1 1 GRIT 1 r PRIMARY 1 1 TRICKLING 1
----1 CHAMBER 1 1 11------11 FLOW 11----.--...-11 REMOVAL 11-----.----11 SETTLING 11-------L--IIP.!~~~~sEII------1 1---1-----~....j~ INTERMEDIATE lf-------L--11 BIOTOWER 11--------l
1 SETTLING
1 rUMPHOUSE
1
1-------'-...-.11 FINAL I I MEASURE I ·1 SETTLING ~1-----1~ FLOW
SCREENINGS TO LANDFILL GRIT TO
LANDFILL I
ROTARY I TRICKLING
1
1----..J FILTER I
NITRIFICATIONl
TRICKLING ~1--.-.1 FILTER
~--Jr~~------------------------_J SECONDARY SLUDGE
SUPERNATANT
I SLUDGE l !sECONDARY 1 I PRIMARY I I PRIMARY I ----1~ STTOANKRAGE lf->------1 f------1
1
DIGESTER ~1-.----1~ DIGESTER
1
._.,._ ___ __J
!DIGESTER I N0.2 N0.1
engineering, inc. CITY OF LAPORTE 2421173 Street, Hammond, Indiana. 46323 Phone: (219) 844 8680 Fax: (219) 844 7754
CSO LONG TERM CONTROL PLAN municipal, civil, environmental & transportation engineering
WASTEWATER TREATMENT PLANT PROCESS FLOW DIAGRAM FIGURE 1-4

MGD peak capacity of the main WWTP are diverted into the 17-acre CSO storage
lagoon. With a useable depth of 2.3 feet, the CSO storage lagoon can hold 12.8 million
gallons. When the CSO lagoon is full, and the main WWTP is operating at its 10 MGD
capacity, any additional influent flows result in an overflow of combined sewage to
Travis Ditch through permitted CSO Outfall 002.
When there is available capacity at the main WWTP, the wastewater captured in
the CSO lagoon is pumped to the headworks of the main WWTP at a maximum rate of
2.3 MGD via the CSO lagoon return pumping station, which has two submersible pumps
that were installed in 1998. This pumping facility is also tied into the computer control
system and is automatically turned on whenever the lagoon level rises above the
operational set point and there is available capacity at the headworks of the main WWTP.
The system operates as follows: After a storm passes, and the main WWTP influent plant
flow drops from its peak of 10 MGD to 9 MGD, it triggers the first pump to turn on. This
pump can pump at the rate of 1 MGD and that brings the influent flow to the main
WWTP back up to 10 MGD. When the influent flow (with the first pump running)
continues to drop and reaches 8.5 MGD the second, larger capacity pump starts and the
first pump then shuts down. This brings the main WWTP influent flow back up to 10
MGD. If additional rain/inflow causes the main WWTP influent flow to rise above 10
MGD, the pumps will automatically shut down, allowing the main WWTP to treat the
incoming flow at its maximum available capacity. When capacity at the headworks is
available, the pumps will automatically start again.
Both pumps are not run simultaneously due to the hydraulic capacity and size of
the CSO pump return lines. The larger pump runs at the capacity of the return lines, and
is able to pump at the rate of 2.6 MGD from the lagoon to the headworks. If the smaller
pump is operated simultaneously with the larger pump, return flow would increase to 2.9
MGD, a net increase of only 0.3 MGD.
1.4 RECEIVING STREAM
Figure 1-5 is a map showing Travis Ditch, the receiving stream for the main
WWTP effluent and for overflows from the CSO storage lagoon. The discharge from the
main WWTP and/or the CSO lagoon forms the headwaters of Travis Ditch, which flows
to the Kankakee River.
3

Travis Ditch receives flow from Shurz Ditch approximately 0.8 miles downstream
of La Porte’s wastewater treatment facilities. Approximately 6 miles downstream, Travis
Ditch receives discharges from two other NPDES permitted facilities, Roll Coater, Inc.
and the Kingsbury Utilities Wastewater Treatment Plant. In this same area, Travis Ditch
also merges with Kingsbury Creek, which flows into Travis Ditch from the northwest.
Travis Ditch also receives drainage from farm fields along its path to the Kankakee
River.
1.5 SOURCE DOCUMENTS
The City has developed numerous documents that are important to the
development of the LTCP. The LTCP has been prepared in coordination with the
documents listed in Table 1-1.
TABLE 1-1
PREVIOUS REPORTS Report Title Prepared By Date
Wastewater Treatment Plant Facilities Plan Murphy Consultants 1977
Combined Sewer System Operation Plan Boyd E. Phelps 1989
Combined Sewer System Operational Plan, Addendum #1 Haas & Associates 1992
Combined Sewer System Operational Plan, Minimum Controls 7, 8, and 9 Greeley and Hansen 1998
Stream Reach Characterization Analysis Report City of LaPorte 2001
1.6 MODIFIED PLANNING APPROVAL
The City of LaPorte requested and received IDEM approval to use the modified
planning approach in development of this LTCP. In accordance with Combined Sewer
Overflow (CSO) Long-Term Control Plan Use Attainability Analysis Guidance, April
2001 (Guidance), the required elements of the LTCP are as follows:
• Establish public participation process
• Consider impacts to sensitive areas near CSO discharge points, and
4

• Post-construction compliance monitoring program and sampling protocols.
In IDEM’s April 4, 2002 approval letter for LaPorte’s use of the modified
planning approach, the following four additional elements were requested:
• CSO Operational Plan
• Documentation of implementation of the Nine Minimum Controls
• Submit revisions to Combined Sewer System Operational Plan
• Maximization of treatment at WWTP
• Monitoring, as necessary, to support CSO control decisions
• Scope, schedule, and budget of proposed CSO controls
In addition, subsequent to the City’s submittal of its LTCP in July 2002, IDEM
advised the City that an evaluation of various control alternatives must be included in the
LTCP.
This LTCP includes the elements required by the Guidance and the requested
additional items.
5

engineering, inc. 2421 173 Street, Hammond, Indiana. 46323 Phone: (219) 844 8680 Fax: (219) 844 7754
municipal, civil, environmental & transportation engineering
CITY OF LAPORTE CSO LONG TERM CONTROL PLAN
CSO AND RECEIVING STREAM LOCATION MAP
FIGURE 1-5

2.0 PUBLIC PARTICIPATION
2.1 INTRODUCTION
As a component of the development of LaPorte’s CSO Long-Term Control Plan
(LTCP), the City initiated the public participation process at the April 10, 2002 meeting
of the Board of Public Works and Safety. At that meeting the Board authorized
formation of a Citizens’ Advisory Committee to serve as adviser to the Board and to the
CSO LTCP team regarding wet weather issues. The CAC included invited members
including representatives from the following:
• General Public/ratepayers
• Environmental group
• Adjacent land owner
• Business
• City Council
• Board of Public Works and Safety
• County Drainage Board/Surveyor
• City Development/Planning Department
• County Health Department
• Water Treatment Plant
• Wastewater Treatment Plant
• City Attorney
In addition to the invited members, the City provided an open invitation to the
general public to participate in the CSO LTCP CAC. This invitation was published in an
article entitled “People Can Talk Sewage” in the LaPorte Herald Argus on April 23,
2002.
Appendix C includes various documents related to the public participation
including public meeting attendance lists, meeting minutes, newspaper articles and the
like. Appendix H includes DVD video recordings of the May 5, 2004 and August 25,
2004 public meetings.
6

2.2 CITIZENS’ ADVISORY COMMITTEE
The CAC convened monthly from April 2002 through July 2002. At the April 24,
2002 meeting, the CAC discussed general background and requirements of the CSO
LTCP modified planning approach. Specific discussions during the April meeting
focused on understanding La Porte’s combined sewer system, CAC feedback on the
appropriateness of the proposed public participation process, consideration of sensitive
areas (both as defined by the Guidance and any additional local requirements), and the
post LTCP sampling and monitoring program. A sign-in sheet was available, and those
who attended indicated their names and affiliations.
The minutes were kept by William Hupp of NIES Engineering and are included in
Appendix C. At this meeting, the next meeting date was set for May 14, 2002.
The May 14, 2002 meeting included a site visit to the WWTP and to the CSO
facilities. During this meeting proposed alternatives were presented and discussed by the
CAC. CAC guidance was provided regarding the alternatives that the CAC members
considered to be appropriate for further evaluation. A sign-in sheet was available, and
those who attended indicated their names and affiliations. At this meeting, the next
meeting date was set for June 12, 2002.
At the June 12, 2002 meeting the CAC was presented with an evaluation of the
proposed alternatives and a recommended plan and schedule for implementation of the
LTCP. The CAC were supportive of the recommended plan. There appears to have been
no attendance sheet for this meeting. The next meeting was set for July 18, 2002.
The July 18, 2002 meeting was used to present and discuss the draft CSO LTCP
and to address additional recommendations and guidance from the CAC prior to
development of the final draft LTCP for submittal to IDEM. There appears to have been
no attendance sheet for this meeting.
2.3 ADDITIONAL PUBLIC PARTICIPATION MEETINGS
In response to comments from IDEM on the City’s July 2002 LTCP, three
additional CSO LTCP public participation meetings were conducted in 2004: on May 5,
May 17 and August 25. See Appendix C for documentation regarding these public
meetings.
7

The May 5, 2004 public meeting followed a LaPorte Board of Public Works
meeting. The time and place of the meeting was announced several times in the legal
notices of the local paper prior to the meeting. There was a newspaper article written
about the upcoming meeting the week before. Though well advertised, the meeting was
sparsely attended by the public.
The May 5, 2004 meeting (see DVD video of meeting in Appendix H) touched
upon several subjects that IDEM had noted needed clarification in their comment letter
regarding the City’s CSO LTCP. One of these topics concerned the issue of
Environmental Justice. The CSO discharge point overflows into the headwaters of Travis
Ditch. From this point, Travis Ditch flows south through various agricultural fields until
it reaches the Kankakee River in southern La Porte County. At the May 5 meeting it was
discussed that Travis Ditch does not flow through any urbanized or sub-urbanized zones,
and therefore seems unlikely to have any impact regarding Environmental Justice issues.
During the May 5 meeting, several alternatives were proposed that would allow
the City to meet the requirements of the Long Term Control Plan. It was discussed that
the City could completely convert the combined sewer system into a separate sanitary
and storm sewer system. It was noted that this would be a very expensive undertaking,
and would create potential future problems in dealing with storm water treatment.
A second option was proposed that would include increasing the capacity of the
main WWTP. It was noted that this too would be a very expensive option. Since the
main WWTP currently is at 50 percent of its dry weather capacity, this would lead to a
massive underutilization of a newly expanded main WWTP. Additionally, it was noted
that flows measured at the headworks of the main WWTP during storm events have been
measured at a rate 20 times higher than the main WWTP’s peak hydraulic capacity.
During intense storms, the peak rate of wet weather flow diverted to the storage lagoon
has exceeded 200 MGD (i.e. on July 22, 2002.)
A third option was presented that the City could increase the size of its existing
storage lagoon, and increases the rate at which captured wastewater is returned to the
main WWTP. This option is not as expensive as the first two options and allows for the
use of existing structures.
At this point, the meeting was opened to the public to provide additional input or
other control options that may not have been presented. The public appeared to disregard
8

the first option as not very feasible, and the second option was given consideration, but
due to the large discrepancy in the volume of the storm flows versus the existing main
WWTP's capacity it also appeared an unlikely option. The third given option generated
the most discussion, but the question was asked how this option would be performed
without completely interrupting the operation of the existing retention and pump-back
system. In response to this question it was explained that there would be no interruption
in operation because the existing CSO lagoon return pumping station would remain in
operation while the new pumping station was being constructed.
At the close of the May 5, 2004 public meeting, contact information was
presented for anyone wishing to further participate in additional public meetings
concerning LaPorte’s Long Term Control Plan. An address was given; a phone number
to call was listed, as well as an email address for those who would like to participate via
email. To date, there has been no response from any of these contact media. A sign-in
sheet was made available, and those who attended this meeting indicated their names and
their affiliations.
On May 17, 2004, Jerry Jackson, Superintendent of the LaPorte Wastewater
Department, made a presentation to the LaPorte City Council, which was aired over the
local cable company’s community Channel 43 at 7 pm. The purpose of this presentation
was to provide information to the City Council and the public concerning the work that
the Wastewater Department performs, as well as to raise community awareness
concerning wastewater issues. Jerry Jackson took this time to again raise the issue of
CSOs before the assembled audience and the viewing public. The steps that had been
taken to reduce CSOs to their current level were discussed, as well the proposed method
in the LTCP. Again, citizens who were interested in attending additional meetings were
encouraged to write, call or email; the contact information was presented during the
presentation. To date, there have been no responses from any of these contact media.
On August 25, 2004, another public participation meeting was held at the LaPorte
City Hall following a Board of Public Works Meeting. Again, this meeting was
publicized and a sign-in sheet was provided. At this meeting, engineers from Malcolm
Pirnie described three potential alternatives for controlling LaPorte’s CSOs:
• Sewer Separation
9

• Disinfection
• Store and Treat
The three alternatives are described in Chapter 6 of this report. Malcolm Pirnie
presented preliminary cost estimates for the three alternatives. A DVD video recording
of the August 25, 2004 meeting is included in Appendix H.
2.4 RECOMMENDATIONS
Recommendations from the CAC, public participation and notification, LTCP
alternative evaluation and selection, and the LTCP implementation schedule have been
incorporated into this CSO Long-Term Control Plan. The City intends to continue to
take advantage of the knowledge and insights of the CAC during implementation of the
CSO LTCP. The CAC will be used as a means to perform “reality checks” during the
implementation process to verify that the City’s LTCP continues to meet the local needs
as it progresses toward compliance with the water quality and technology based
requirements of state and federal law.
10

3.0 IDENTIFICATION OF AND IMPACTS TO SENSITIVE AREAS
The August 2004 Long Term Control Plan submitted by LaPorte contained a
summary of the sensitive areas evaluation conducted by LaPorte, as well as the
conclusion that LaPorte’s CSO discharges do not impact sensitive areas. IDEM indicated
that this conclusion was not adequately supported by the information contained in the
Long Term Control Plan.
The primary purpose of identifying sensitive areas is to establish a prioritization
for implementation of CSO controls. Additionally, with respect to discharges that impact
sensitive areas, the discharges must be eliminated unless it is not physically possible or
economically achievable to do so, in which case treatment must be provided.
There is no need to prioritize among various CSO outfalls since LaPorte has only
one CSO outfall. Additionally, the goal of LaPorte’s plan is the elimination of discharges
from the CSO outfall, which would be required if the discharges impacted a sensitive
area. Further, if after implementation of the plan, CSO discharges continue, LaPorte will
be required to take appropriate corrective actions. At that time, even if the discharges
impacted a sensitive area, LaPorte would be able to consider treatment options, rather
than options for elimination, as LaPorte would have a sufficient basis to establish that
elimination is not physically possible or economically achievable.
For these reasons, IDEM and LaPorte agreed that in this particular case, the
sensitive areas evaluation is unnecessary, and therefore, additional resources should not
be devoted to this issue.
11
4.0 CHARACTERIZATION, MONITORING AND MODELLING OF THE COMBINED SEWER SYSTEM
4.1 USE OF SRCER DATA TO MODEL EVENTS AND DESCRIPTIONS OF CSO CONTROL METHODS
The City of LaPorte used the data from its Stream Reach Characterization
Evaluation Report (SRCER) to help it model the effects of its CSO discharges. The City
has been actively working to reduce CSO discharge events since the mid-1990s. Initially
a temporary pumping solution was implemented as a means to control dry weather
overflows from the CSO storage lagoon. This solution worked for the dry weather
overflows, but did little to otherwise reduce CSO discharge volumes due to the small size
of the pump. In 1998 a significantly larger and permanent lagoon return pumping station
was installed. This station resulted in a tremendous reduction in the number of CSO
discharge events (See Chapter 5).
Additionally, LaPorte has been active in removing inflow and infiltration to the
combined sewer system. In 1999, while constructing the Lake Level Control Project
(“Siphon”), the City removed drainage from the Beechwood golf course area and
repaired a broken section of pipe in the Patton Cemetery wetlands, two major sources of
infiltration. With the assistance of INDOT, LaPorte has separated storm drains along
Pine Lake Avenue and is in the process of preparing for storm sewer separation along
Monroe Street (State Road 4).
LaPorte also has plans to reduce and control the amount of runoff entering the
collection system from several large factories on the east side of town with the
Darlington-Factory project. The Darlington-Factory project will greatly reduce the
volume of storm water passing through several historically flood-prone areas.
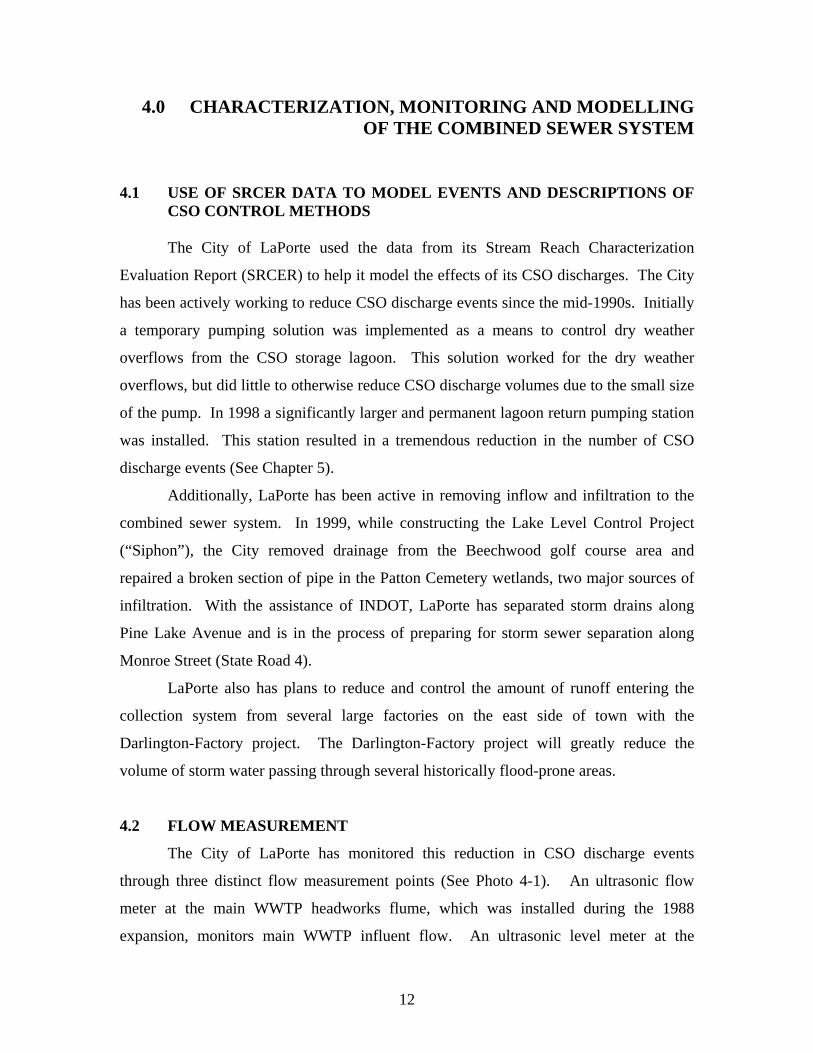
4.2 FLOW MEASUREMENT
The City of LaPorte has monitored this reduction in CSO discharge events
through three distinct flow measurement points (See Photo 4-1). An ultrasonic flow
meter at the main WWTP headworks flume, which was installed during the 1988
expansion, monitors main WWTP influent flow. An ultrasonic level meter at the
12

overflow weir of the CSO storage lagoon, which was installed in 1992, monitors CSO
discharges. A radar-based flow meter was installed in the CSO lagoon influent channel
in May, 2002 replacing a previous weir-level based system. The radar-based flow meter
brought the quality of the CSO influent measurements up to the same high quality
standard that the main WWTP headworks and CSO discharge flow measurements have
been. The data collected from these meters are processed and collected by a
programmable logic controller (PLC). This controller uses the data to calculate the peak
flow rate and the daily totals. Furthermore, the data are stored in a database which can be
accessed to plot charts and graphs of flow events for any given date and time.
Using the data generated by the flow meters and rainfall data procured from the
National Weather Service Rain Gauge located at the LaPorte Water Department, LaPorte
has been able to chart the effect of rainfall on the main WWTP influent and the CSO
storage lagoon.
Photo 4-1 Aerial Photo of LaPorte wastewater treatment facilities showing flow meters
By plotting previous rain events versus level changes in the CSO lagoon, LaPorte
is able to predict the lagoon volume required to store that rainfall event. (See charts in the
SRCER in Appendix B). CSO discharges in most communities occur as a result of
limited sewer capacity. LaPorte depends on storage to avoid CSO discharge events.
Consequently, it is not the rainfall intensity (10-year storm for example), but the volume
of water (inches of rainfall) received by the main WWTP during the event that
determines whether an overflow occurs. With the existing system, LaPorte can contain,
13

on average, a 1.5 inch storm (see rainfall versus volume received at the main WWTP
chart in SRCER Appendix B).
4.3 STORM CHARACTERIZATION
In 2000, IDEM required the City to perform a SRCER to assess the impacts of
CSO discharges on Travis Ditch. By that time, the City had already managed to reduce
CSO discharge events to a few times per year. In order to complete the requirements of
the SRCER, the City monitored all five CSO discharge events that occurred during the
allotted time frame given by the State. The infrequency of the events led to the data
being collected during all four seasons; one winter event (February), one spring event
(April), two summer events (June and July) and one fall event (September). It is
interesting to note that the winter event of February would not have occurred if it was
only due to the rainfall. However, a combination of the rainfall, the snow already on the
ground that melted, and the fact that the ground was frozen resulted in 100 percent runoff
without the ground absorption that would typically occur during the summer months.
The classification of these events was done using the Indiana DNR Division of Water’s
website for design storms (http://www.in.gov/dnr/water/surface_water/rainfallfrequency/).
Using the guidelines given by the website, the SRCER events are classified as follows:
• April 20, 2000 – 1 Year Storm
• June 24, 2000 – 5 Year Storm
• September 11, 2000 – 10 Year Storm
• February 24, 2001 – 1 Year Storm (but with special exceptions due to the winter nature of the event)
• July 7, 2001 – 10 Year Storm
Rainfall maps used to classify these storms were derived from Bulletin 71,
“Rainfall Frequency Atlas of the Midwest”, excerpts of which are included in Appendix
F.
14

4.4 SRCER SAMPLE COLLECTION AND DATA
The overflow samples collected during the SRCER were collected at the CSO
overflow point (see Photo 4-2). This point is the sole discharge, or end-of-pipe, for the
CSO lagoon. Since LaPorte is the headwaters for Travis Ditch, the only water entering
the ditch at this point is the mixture of water flowing over the CSO storage lagoon weir
and the effluent discharge from the main WWTP (see Photo 4-3).
Photo 4-2: CSO Storage Lagoon Overflow Photo 4-3: LaPorte main WWTP Outfall 001 on left and CSO Storage Lagoon Overflow Outfall 002 on right
By monitoring the effluent discharge from the CSO storage lagoon and using the
required monitoring data from the main WWTP effluent discharge, the impact from the
CSO discharge can be calculated based on the flow volumes measured from each source.
The samples that were collected during the SRCER were analyzed for the parameters in
LaPorte’s NPDES permit. These parameters included CBOD5, TSS, pH, D.O., ammonia,
E. coli, and the metals cadmium, copper, chromium, lead, nickel and zinc. The E. coli
samples were diluted down by 1 ml sample to 1 L, as it was taken into consideration that
the CSO discharge would contain sewage which has received only primary settling
treatment in the CSO storage lagoon. Even with such precautions, many of the E. coli
readings came back with a result of TNTC (too numerous to count). As is stated in the
SRCER Appendix D, this result of TNTC equates to a colony count of higher than
200,000 colonies/100 ml sample. With this in mind, any result of “TNTC” in the SRCER
data for E. coli means that the colony count was in excess of 200,000 colonies/100 ml,
almost 1,000 times the Indiana Water Quality Criterion. The noted exception was the
15

February 24, 2001 CSO event. Since that event happened during the winter, when the
State of Indiana has no bacteriological criterion, this sample was not evaluated for E. coli.
16

5.0 CSO OPERATIONAL PLAN
5.1 DOCUMENTATION OF NINE MINIMUM CONTROLS
In July 1994, IDEM approved the CSO Operational Plan (CSOOP) for the City of
LaPorte that included Minimum Controls 1 through 6. In April 1998, LaPorte submitted
revisions to its CSOOP that included Minimum Control requirements 7 through 9. The
revised CSOOP is under review by IDEM. The City has fully implemented its CSOOP
as approved and Controls 7 through 9 as submitted.
There are several items in the CSOOP that have been addressed since its approval
in 1994. Some of the corrective actions taken are described in the following subsections.
5.1.1 Surface Drainage and Ponding Issues
• Flow into the main WWTP has been maximized by a more efficient automated gate control system. This allows for the maximum available capacity of the main WWTP to be utilized effectively.
• The City has continued the maintenance and repair of catch basins around the City.
• In 1998, LaPorte repaired or replaced 46 catch basins or manholes
• In 2000, LaPorte repaired or replaced 41 catch basins or manholes
• In 2001, LaPorte repaired or replaced 41 catch basins or manholes
• In 2002, LaPorte repaired or replaced 47 catch basins or manholes
• In 2003, LaPorte repaired or replaced 34 catch basins or manholes
• For the areas listed in the CSOOP, the following problems have been fixed:
• F Street between 8th and 10th
• 1st St. by the railroad viaduct
• Rockwood & Truesdell
• Corvette Drive
• The following areas listed in the CSOOP are in the planning/financing stages:
• Brighton / Rush Street. as part of the Boston St improvement
• Darlington as part of the Darlington/Worden improvement
• 6th and J Street as part of the future INDOT widening of J Street
17

• Lincolnway East as part of the planned future INDOT improvement to Lincolnway
5.1.2 Sewer Backup Issues
• Staff and equipment move. LaPorte’s Wastewater Collection staff and equipment were formerly housed at the Street Department. They have since been moved out to the main WWTP site to better integrate with the Wastewater Department activities.
• More proactive cleaning of trunk lines. The collection crew jetted 6,439 feet of sewer mains in 2003. By mid 2004, they have already jetted 4,010 feet of sewer mains.
• Better records maintenance. All sewer calls, whether to report blockages, locates, or catch basins are now recorded into a single database. This enhances the ability of the Collection crew to spot trouble areas, which allows for a more efficient allocation of time and effort.
5.1.3 Infiltration/Inflow Sources
• Several major infiltration/inflow sources have been corrected since the inception of the CSOOP. With the installation of the LaPorte Lake Level Control Project in 1999, the Beechwood golf course pond infiltration has been eliminated. The Patton Cemetery wetlands infiltration has also been removed from the system. This year, the Pine Lake Avenue stormwater separation project in conjunction with INDOT will be finalized and starting in 2005, the Monroe Street sewer/storm separation will be implemented.
5.1.4 Infiltration into the CSO Storage Lagoon by the Natural Spring
• Infiltration into the CSO storage lagoon by the natural spring below has been accounted for by the use of a smaller automated level maintenance pump as part of the CSO lagoon return pumping system. This automated pumping system allows the current water level in the lagoon to be maintained with minimal effort.
5.2 REVISIONS TO CSOOP
The current CSOOP is reviewed on an annual basis, or in the event of a CSO
system operational or physical change.
The current CSOOP is included in Appendix A.
18

5.3 IDENTIFICATION OF SIGNIFICANT INDUSTRIAL DISCHARGERS
LaPorte currently has had several changes to the significant industrial dischargers
list that was included in the CSOOP. The revised list is included below showing which
industries have closed, as well as showing the primary parameters that would be of
environmental concern during a CSO event for those industries in operation.
TABLE 5-1
SIGNIFICANT INDUSTRIAL USERS Industry Name Current Status Parameters of Concern
Alpha Baking Co. In operation BOD, TSS, Oil & Grease, pH
AMPCOR II In operation Cadmium, Nickel, Zinc, Chromium, Silver, TSS, Copper, Lead, Cyanide, Oil & Grease, pH
AMPCOR II In operation Cadmium, Nickel, Zinc, Chromium, Silver, TSS, Copper, Lead, Cyanide, Oil & Grease, pH
Dreske Silver Plating In operation Cadmium, Lead, Silver, Cyanide, pH Enviro Solutions In operation BTEX
Harrison Engine Service In operation
Cadmium, Chromium, Copper, Lead, Nickel, Silver, Zinc, Cyanide, TSS, Oil & Grease, pH
HRR Soon to be in operation Ammonia, BOD, TSS, Oil & Grease, pH
Howmet In operation Chromium, Copper, Lead, Nickel, Silver, Zinc, Oil & Grease, pH
Jefferson Smurfit CLOSED Keystone Service, Inc. CLOSED La Porte Publishing Co. In operation Silver Lewis Baking Co. In operation BOD, TSS, Oil & Grease, pH Martin Oil Site CLOSED Mechanovent CLOSED Modine Mfg. Co. CLOSED
New York Blower Co. In operation Cadmium, Chromium, Copper, Lead, Nickel, Silver, Zinc, Phosphorous, Cyanide, TSS, Oil & Grease, pH
Powcote CLOSED
Silgan Containers (formerly American National Can)
In operation Chromium, Phosphorous, Copper, Manganese, Zinc, Oil & Grease, pH
Towndan Enterprises CLOSED Wal-Mart Store In operation Silver
19

5.4 MAXIMIZATION OF TREATMENT AT WWTP
Maximization of flow to (and through) the WWTP is CSOOP minimum control
number 4. As shown by the table below, the City of LaPorte has had significant success
in the reduction of CSO volume and duration since 1996. The result has been the
maximization of flow that receives full treatment prior to discharge to Travis Ditch.
As indicated in Table 5-2, there were a total of 15 CSO events for the five year
period from 1999 through 2003, an average of 3 events per year. The total volume of
overflow in million gallons, and the peak rate of overflow in MGD, for the 15 events are
plotted on Figure 5-1. Appendix D includes a tabulation of LaPorte’s daily CSO
operating data from December 1996 through July 2004.
TABLE 5-2
CSO VOLUMES AND DURATIONS
Year CSO
Discharge Events (#)
Calendar Days in Which CSO
Occurred (days)
Total Discharge Duration
(days)
CSO Volume (MG)
1996 46 165 No Data 211.7
1997 52 209 197.5 151.0
*1998 32 74 50.4 70.8
1999 3 6 4.9 12.0
2000 4 7 3.8 10.3
2001 5 13 6.9 31.4
2002 1 2 1. 8 6.1
2003 2 3 1.0 3.3
**2004 1 1 1.0 0.5
Avg prior to CSO Lagoon Return Pump Station (1996
and 1997)
49 187 197.5 181.4
Avg with CSO Lagoon Return Pump Station (1999 through
3 6 3.3 12.6
20

50
40
~ 30 !I....
0
0
~ 20
10
0 0') 0') 0') 0') 0') 0') ~ ~ - -N M N N - -~ "'=t 0 0
engineering, inc. 2421 173 Street, Hammond, Indiana. 46323 Phone: (219) 844 8680 Fax: (219) 844 7754
municipal, civil, environmental & transportation engineering
CSO Events Discharge City of LaPorte
0') 0 0 0 0 ~ ~ ~ ~ ~ N M M 0') 0 0 0 0 0 0 0 0 0 0 0 0 0') 0 0 0 0 0 0 0 0 0 0 0 0 ~ N N N N N N N N N N N N - - - - - - - - - - - - -~ 0 "'=t co N "'=t ...... II) M co N 0') ()() 0 N N N ~ N 0 N ~ ~ ~ 0 0 - - - - - - - - - - - - -...... "'=t co co 0') N ...... ()() 0 0 II) II) ...... 0 0 0 0 0 0 0 0 ~ ~ 0 0 0
Date
• CSO Overflow Volume(MG) D Peak Overflow Rate(MGD)
CITY OF LAPORTE CSO LONG TERM CONTROL PLAN
CSO EVENTS DISCHARGE FIGURE 5-1

TABLE 5-2
CSO VOLUMES AND DURATIONS
Year CSO
Discharge Events (#)
Calendar Days in Which CSO
Occurred (days)
Total Discharge Duration
(days)
CSO Volume (MG)
2003)
Reduction 94% 97% 98% 93%
* CSO Lagoon Return Pump Station operated a portion of 1998. ** Partial year to 8/29/2004. This year was not included in the averages.
5.5 MONITORING FOR CSO CONTROL DECISISONS
LaPorte’s CSO outfall has been monitored since 1996 for overflow volume and
duration. Additionally, flow into the CSO storage lagoon and flow returned from the
lagoon to the main WWTP also have been monitored since 2002 and 1998, respectively.
In July 2001, The City submitted its Stream Reach Characterization and
Evaluation report (SRCER). The SRCER is included in Appendix B.
This information has been used by the CSO Citizens’ Advisory Committee in
formation of its guidance on CSO control planning. This information also was used to
form the technical basis for the CSO control evaluation and recommendations.
21

6.0 CSO CONTROL ALTERNATIVES 6.1 INTRODUCTION
Three alternatives for the control of LaPorte’s combined sewer overflow
discharges are proposed for development and evaluation:
• Alternative 1 – Sewer Separation
• Alternative 2 – Disinfection
• Alternative 3 – Store and Treat
These alternatives are described in the subsections that follow. Preliminary
opinions of probable construction cost are presented for each of the alternatives.
At the end of the chapter, the alternatives are compared and evaluated.
6.2 ALTERNATIVE 1 – SEWER SEPARATION
Under Alternative 1, storm sewers would be constructed in the combined sewer
area. The proposed storm sewers would roughly parallel the existing combined sewers
and would discharge to Travis Ditch. Street inlets that now connect to the combined
sewers would be redirected to the new storm sewers. LaPorte’s existing combined
sewers would thus be converted to separate sanitary sewers. The lengths and diameters
of the proposed storm sewers under Alternative 1 would be roughly equal to the lengths
and diameters of LaPorte’s existing combined sewers.
Under Alternative 1, the existing CSO storage lagoon would be converted to a
“wet weather storage lagoon”. If peak wet weather flows due to inflow and/or infiltration
into LaPorte’s sanitary sewers (converted combined sewers) exceed the plant’s peak
capacity, the excess flows would be stored in the wet weather storage lagoon. Stored wet
weather flows would be returned to the plant using the existing CSO storage lagoon
return pump station. After implementation of Alternative 1, peak wet weather flows into
the lagoon would be much less than at present because the major sources of storm water,
primarily street inlets, would be connected to the new storm sewers.
Under Alternative 1, there would be no overflows from the wet weather storage
lagoon. LaPorte’s only discharges to Travis Ditch would be treated plant effluent and
untreated storm water from the separate storm sewers.
22

The preliminary estimate of construction cost for Alternative 1 is summarized in
Table 6-1.
6.3 ALTERNATIVE 2 – DISINFECTION
Alternative 2 is shown schematically on Figure 6-1.
Under this alternative, the existing CSO lagoon and lagoon return pump station
would be used to capture excess wet weather flows. Most storms would be fully captured
for subsequent treatment, as at present. However, under Alternative 2, CSO storage
lagoon overflows during extreme storms would be disinfected before discharge to Travis
Ditch.
Under this alternative, two new chlorine contact tanks, with a common divider
wall, would be constructed near the southeast corner of the CSO storage lagoon. The
North Contact Tank would provide disinfection contact time for lagoon overflows before
discharge to Travis Ditch. The South Contact Tank would provide disinfection contact
time for treated effluent from the main WWTP.
The main WWTP currently uses gaseous chlorine for disinfection and gaseous
sulfur dioxide for dechlorination. Under Alternative 2, the main WWTP would convert
to liquid chemicals, namely, sodium hypochlorite for disinfection and sodium bisulfite
for dechlorination. The proposed liquid chemicals present less risk than the gaseous
chemicals. This alternative includes a new Chemical Building which would be
constructed immediately west of the two new contact tanks and would house chemical
storage tanks and feed pumps. A paved road would be constructed to the Chemical
Building for bulk delivery of the chemicals. The existing Chlorine Building and the
existing chlorine contact tank would be removed from service.
Since the Chemical Building and the South Contact tank would operate
continuously during disinfection season, it would be relatively easy to reliably disinfect
using the North Contact Tank during the infrequent CSO storage lagoon discharges. It
would be less reliable for LaPorte to try to operate a stand-alone disinfection facility for
lagoon overflows. Since a stand-alone facility would not operate for long periods of
time, it may not be easily and successfully placed into operation during lagoon overflows.
Moreover, use of the single Chemical Building would permit relatively fresh chemicals to
be used for CSO disinfection. (Sodium hypochlorite loses strength in storage.)
23

Item No. Item Description No of Units Unit Unit Price Total
1 Mobilization & Traffic Control 1 LS $1,000,000 $1,000,000
2 Asphalt Roadway Reconstruction 210,000 S.Y. $30 $6,300,000
3 4 Feet Diameter Manholes 510 Ea. $5,250 $2,680,000
4 5 Feet Diameter Manholes 120 Ea. $6,300 $760,000
5 6 Feet Diameter Manholes 90 Ea. $7,350 $670,000
6 7 Feet Diameter Manholes 70 Ea. $9,000 $630,000
7 8 Feet Diameter Manholes 20 Ea. $10,500 $210,000
8 12-inch Storm Sewer 92,400 L.F. $35 $3,240,000
9 15-inch Storm Sewer 110,880 L.F. $40 $4,440,000
10 24-inch Storm Sewer 55,440 L.F. $55 $3,050,000
11 36-inch Storm Sewer 51,744 L.F. $110 $5,700,000
12 48-inch Storm Sewer 36,960 L.F. $160 $5,920,000
13 60-inch Storm Sewer 11,088 L.F. $265 $2,940,000
14 72-inch Storm Sewer 11,088 L.F. $350 $3,890,000
Construction Contingency (30%) $12,500,000
Construction Subtotal $54,000,000
Non-Construction (30%) $16,200,000
Total (rounded up) $71,000,000
PRELIMINARY ESTMATE OF CONSTRUCTION COST
TABLE 6-1
ALTERNATIVE 1 -- SEWER SEPARATION

TWO EXISTING 24" TERTIARY EFFLUENT PIPES ------'
CSO LAGOON
NEW LAGOON OVERFLOW PIPE
CHEMICAL BUILDING
NEW TERTIARY __/ EFFLUENT PIPE ...___ ______ ___,_.
engineering, inc. 2421 173 Street, Hammond, Indiana. 46323 Phone: (219} 844 8680 Fax: (219} 844 7754
municipal, civil, environmental &: transportation engineering
CITY OF LAPORTE CSO LONG TERM CONTROL PLAN
NORTH CHLORINE CONTACT TANK
SOUTH CHLORINE CONTACT TANK
NEW OUTFALL 001
EXISTING LAGOON OVERFLOW
NEW OUTFALL 002
ALTERNATIVE 2 DISINFECTION SCHEMATIC DIAGRAM
FIGURE 6-1

Treated effluent from the main WWTP would be directed through the two
existing 24-inch pipes to a new pipe which would connect to the head of the South
Contact Tank. Sodium hypochlorite would be fed to the head of the tank for disinfection.
Sodium bisulfite would be fed at the outlet of the tank for dechlorination.
The North Contact Tank would normally be empty. At times when the CSO
storage lagoon overflows, the lagoon discharges would be discharged to the head of the
North Contact Tank. Sodium hypochlorite and sodium bisulfite would be fed to the inlet
and outlet ends of the North Contact Tank, respectively. When the CSO storage lagoon
ceases overflowing, the North Contact Tank would be emptied.
Each contact tank would have its own outfall pipe to Travis Ditch. Flow rates in
each outfall would be monitored and recorded. Flow-proportioned automatic samplers
would be provided for each outfall.
The preliminary estimate of construction cost for Alternative 2 is summarized in
Table 6-2.
6.4 ALTERNATIVE 3 – STORE AND TREAT
Alternative 3 is shown schematically on Figure 6-2.
The goal of this alternative is the elimination of CSO discharges. This alternative
is an expanded, enhanced version of LaPorte’s present method of operation. Under this
alternative, the maximum operating depth of the lagoon would be increased by up to 3.4
feet, increasing the CSO storage volume from 12.8 million gallons to as much as 31.5
million gallons. Based upon engineering assessments, the proposed increase in operating
depth of 3.4 feet is the maximum allowable increase that can be made while continuing to
allow for gravity flow of combined wastewater into the lagoon. (The exact increase in
lagoon depth needs to be confirmed hydraulically, so that at maximum depth there is
enough available hydraulic head to get peak wet weather flows into the lagoon for
storage, without pumping). The increased lagoon operating depth would be
accomplished by placing more fill on the northeast section of lagoon embankment to
increase its height. (The west and south sections of embankment are already higher than
the northeast embankment and do not need to be raised.) The lagoon overflow weir
would be raised and an emergency motor-operated sluice gate would be provided for
protection of the embankment.
24

Item No. Item Description No of Units Unit Unit Price Total
1 Mobilization 1 LS $70,000 $70,000
2 Chlorine Contact Tanks with Outfall Sewers
Contact Tank Concrete Walls 230 CY $700 $170,000
Contact Tank Concrete Slab 270 CY $400 $110,000
Junction Chamber Concrete Walls 135 CY $700 $100,000
Junction Chamber Concrete Slab 90 CY $400 $40,000
Concrete Baffles 120 CY $700 $90,000
Equipment (Gates, Samplers etc) 1 LS $200,000 $200,000
Bored Piles 3,000 LF $30 $90,000
48-inch Outfall Sewer to Travis Ditch 200 L.F $175 $40,000
66-inch Outfall Sewer to Travis Ditch 200 L.F $325 $70,000
3 Chemical Feed Disinfection Building
Chemical Feed Building 1 LS $175,000 $175,000
Chemical Storage Tanks 2 LS $5,000 $10,000
Chemical Feed Systems 4 LS $20,000 $80,000
Electricals & Controls 1 LS $250,000 $250,000
4 Paved Road
Gravel 4,000 SY $3 $12,000
Paved Road 4,000 SY $8 $32,000
Construction Contingency (30%) $470,000
Construction Subtotal $2,010,000
Non-Construction (30%) $610,000
Total (rounded up) $2,700,000
PRELIMINARY ESTMATE OF CONSTRUCTION COST
TABLE 6-2
ALTERNATIVE 2 -- DISINFECTION

cso LAGOON
Measure Flow
I Measure I 1 Flow r
I Measure I
I I Flow I
FINE SCREENS CSO
IJIIJ-- LAGOON ~ PUMP STATION
~'----------<-11 Measure 11----------<-. 1 Flow r
~ 1.. RETURN FLOW(DRY WEATIIER) TO BOYD BLVD. SEWER
~---------Jr l'~---------------------~
EXCESS WET WEATIIER FWW Final
Sludge
1
Combined Sewer Overnow Discharge to Travis Ditch Outfall002
RETURN FLOW (DRY WEATIIER)
RECYCLE
1 :~.:.: 111----, FILTER
ALTERNATIVE DISCIIARGE POINTS
TO IIEADWORKS
RECYCLE
~NITRIFICATIONl--
TRICKLING FILTER
60" Sewer 48" Sewer
78" Sewer 36" Sewer
==:=ji:JUN;;;C~T:;IO~Nl---1~ SCREENING ~1----1 MEASURE 11---r---lr GRIT 11--+---lr PRIMARY 11----L--tl m;~~G ~1----i ----1 CIIAMBER I I FWW I I REMOVAL I I SETTLING I IPUMPHOUSEI
I INTERMEDIATE I I BIOTOWER I 1----L----~~ ~-~~ ~--~
1 SETTLING 1 rUMPHOUSE 1
SLUDGE DISPOSAL BY
LAND APPLICATION
Screenings to Landfill
Grit to Landfill
Supernatant
SLUDGE !sECONDARY I STORAGE f->-----1 1-------1
TANK I DIGESTER I
PRIMARY I I PRIMARY I DIGESTER lf->-----1 DIGESTER 1->-----....l
N0.2 I N0.1 I
engineering, inc. CITY OF LAPORTE
Secondary Sludge
LEGEND
EXISTING
PROPOSED ADDmONS FOR ALTERNATIVE 3
~NITRIFICATIONl--
TRICKLING FILTER
ALTERNATIVE 3
WWTP Discharge to Travis Ditch, Outfall 001
I DECHLORINATION I
t-----'-------11 FINAL 11-----11 MEASURE I I SETTLING I I FWW
1
Final Sludge to Head Works
2421173 Street, Hammond, Indiana. 46323 Phone: (219) 844 8680 Fax: (219) 844 7754
CSO LONG TERM CONTROL PLAN STORE AND TREAT SCHEMATIC DIAGRAM FIGURE 6-2
municipal, civil, environmental & transportation engineering

The existing CSO lagoon return pump station would be replaced with a new
larger pump station. The station would house four submersible pumps: three new 2.5
MGD pumps and the existing 2.3 MGD pump which would be relocated from the
existing CSO lagoon return pump station. The other existing lagoon pump, a 1.7 MGD
unit, is worn and would be retired. Additionally, two mechanical fine screens would be
installed on the inlet to the new CSO lagoon return pump station.
In this selected control alternative, the captured wastewater in the CSO lagoon
would receive screening (via the newly installed fine screens in the CSO lagoon return
pumping station) and primary treatment by the CSO lagoon.
The predominant means by which the CSO lagoon would be dewatered would be
to redirect the captured wastewater to the head of the main WWTP, by pumping this
wastewater back into the Boyd Avenue sewer. In this scenario all returned wastewater
would receive redundant screening and primary treatment (i.e. screening and primary
treatment from the CSO lagoon return pump station screens and the CSO lagoon,
respectively, and screening and primary treatment via the main WWTP screening devices
and primary treatment tanks).
The maximum flow rate that can be treated through the main WWTP primary
process is 10 MGD. Therefore the return rate to the Boyd Avenue sewer would be
controlled so that the total influent flow rate into the main WWTP does not exceed 10
MGD.
Additionally, when the main WWTP primary process is receiving at least 10
MGD, up to approximately 3 MGD of captured wastewater may be directed through an
auxiliary path from the CSO lagoon into the secondary process portion of the main
WWTP (as identified in Figure 6-2).1 In this scenario all wastewater would receive
screening, primary treatment, secondary treatment, and disinfection; additionally, some
wastewater would receive redundant screening and redundant primary treatment. This
control alternative would allow LaPorte to dewater the CSO lagoon as quickly as possible
when wet weather occurs, which would in turn allow LaPorte to capture more combined
1 The maximum auxiliary path return flow rate has not been definitively established, however, preliminary engineering evaluations indicate that a rate of approximately 2 to 4 MGD can be achieved. Plant scale stress testing will need to be conducted to determine the maximum flow rate that can be successfully treated through the auxiliary path.
25

sanitary sewage and storm water in the event that the wet weather conditions continue or
in the event that subsequent wet weather conditions quickly ensue.
The preliminary estimate of construction costs for Alternative 3 is summarized in
Table 6-3.
6.5 ENVIRONMENTAL EVALUATION
Advantages of Alternative 1 are that it will meet current regulatory requirements,
inasmuch as CSOs will be eliminated. An additional advantage is that the new storm
sewers under Alternative 1 will improve drainage in LaPorte, reducing street flooding.
Alternative 1, however, is considered less advantageous environmentally than the
other two alternatives. The reason is that, under Alternative 1, while sanitary flows
would be completely treated, storm water flows to Travis Ditch would be completely
untreated. Solids, bacteria and other pollutants that are carried into the storm sewers with
the runoff would be discharged to Travis Ditch. Water pollution and attainment of in-
stream water quality standards will still be an issue.
Another disadvantage of Alternative 1 is that peak wet weather discharges to
Travis Ditch will be greater than under Alternatives 2 and 3. The reason is that the
dampening effect of the lagoon will be eliminated under Alternative 1. The higher peak
flows to the ditch will increase erosion and the sediment load in the receiving stream. It
will also increase the potential for downstream flooding, which already occurs along the
Kankakee River. In contrast, Alternatives 2 and 3 will capture and discharge flows to the
ditch at a more gradual, steady rate (i.e. at the rate that the main WWTP can empty the
lagoon when the storms subside).
Alternative 1 is clearly much more expensive than the other two alternatives. For
these reasons, Alternative 1, complete sewer separation, is not recommended.
In the future, peak wet weather flows in the combined sewers would be lower
than at present. This is a result of partial sewer separation that would be accomplished in
connection with highway projects (See Section 4.1 for descriptions of planned, partial
sewer separations).
Alternatives 2 and 3 would both utilize the CSO lagoon. As indicated in Table 5-
2, the CSO frequencies, durations and volumes under the present method of operation are
26

Item No. Item Description No of Units Unit Unit Price Total
1 Mobilization 1 LS $50,000 $50,000
2 Outfall Modification Costs 1 LS $100,000 $100,000
3 East Embankment
Borrow/ Spreading 5,000 CY $10 $50,000
Compaction 5,000 CY $0.5 $3,000
Seeding 24,500 SF $0.6 $15,000
4 New CSO Lagoon Pumpstation
Wet Well (12' x 12' x 20' ) & Channel 1 EA $60,000 $60,000
Building 1,200 SF $80 $100,000
Fine Screens 2 EA $80,000 $160,000
New 2.5 MGD Pumps 3 EA $60,000 $180,000
Relocate 2.3 MGD Pump 1 LS $3,000 $3,000
Electrical Controls 1 LS $50,000 $50,000
Flow Meter 1 EA $10,000 $10,000
5 8' Diameter Concrete Pipe at Travis Ditch 700 LF $380 $270,000
6 Force Main and Valves 1 LS $60,000 $60,000
Construction Contingency (30%) $340,000
Construction Subtotal $1,460,000
Non-Construction (30%) $440,000
Total (rounded up) $1,900,000
PRELIMINARY ESTMATE OF CONSTRUCTION COST
TABLE 6-3
ALTERNATIVE 3 -- STORE AND TREAT

greatly reduced under the present method of operation compared to what they were prior
to 1998, when the CSO lagoon return pump station was placed into service.
Under Alternative 2, the lagoon’s available storage would be maintained at 12.8
million gallons and the existing CSO lagoon return pump station would be maintained.
The CSO storage lagoon would continue to overflow infrequently. The lagoon overflows
under Alternative 2 would be disinfected, but would not receive full treatment. Thus the
lagoon overflows may violate other, non-bacteria NPDES permit limits.
Another disadvantage of Alternative 2 is that the CSO disinfection facilities
would be very infrequently used; the North Contact Tank would only be used about three
times a year. Alternative 2 is an expensive project for such infrequent use.
Under Alternative 3, the effective storage volume in the lagoon would be
increased to approximately 31.5 million gallons. Looking at Figure 5-1 and the CSO
discharge data in Appendix D, the biggest discharge event, by volume, since construction
of the CSO lagoon return pump station in 1998 was the CSO discharge event that began
on October 13, 2001. A total of 11.6 million gallons overflowed during that event, which
spanned from October 13 to October 14, 2001. LaPorte’s operating records indicate that
all wastewater resulting from all storms from 1997 through April 2005 would have been
captured (i.e. there would have been no CSO storage lagoon overflows) had the storage
volume proposed in Alternative 3 been available.
Using the rainfall/volume chart from the SRCER (Appendix B), 31.5 million
gallons of storage could retain the following storms:
• 2 year frequency, 72 hour duration = 3.46 inches
• 5 year frequency, 48 hour duration = 3.87 inches
• 5 year frequency, 24 hour duration = 3.61 inches
• 10 year frequency, 12 hour duration = 3.67 inches
The storm frequencies listed above may be on the conservative (low) side because
they are based on the existing CSO lagoon return pump-back rates. The higher rates that
would be possible using the lagoon return pump station proposed under Alternative 3 are
believed to be capable of capturing even bigger storms than listed above. The proposed
new lagoon return pump station would lower the lagoon more quickly, making storage
available sooner after a storm. Moreover, it may be possible to effectively capture even
27

more than 31.5 million gallons during a storm because the lagoon return pump station can
begin returning flow even before the storm is over, especially if LaPorte is able to
effectively utilize the auxiliary path described in Section 6.4 above.
6.6 PROJECT FINANCING AND COST IMPACT ON CUSTOMERS
The accounting firm H.J. Umbaugh & Associates has reviewed LaPorte’s
wastewater finances. Their review included an evaluation of LaPorte’s current operations,
additional revenue needed to support current operation, as well as an estimate of the
additional review to support CSO LTCP Alternatives 1, 2 and 3. Umbaugh’s findings are
tabulated in the “Schedule of Estimated Revenue versus Revenue Requirements”
included in Appendix G.
Umbaugh’s evaluation determined that the rate impact on sewer customers would
be as follows:
• The current monthly sewer bill for 5,000 gallons is $20.08.
• A 13.5 percent rate increase is needed to support increased costs for current operations, resulting in a monthly sewer bill of $22.78, exclusive of any capital costs for CSO control.
• The following additional rate increases would be needed to implement the LTCP alternatives:
• Alternative 1 – a monthly increase of $47.85 for a total monthly bill of $70.64 for 5,000 gallons
• Alternative 2 – a monthly increase of $1.82 for a total monthly bill of $24.60 for 5,000 gallons
• Alternative 3 – a monthly increase of $1.28 for a total monthly bill of $24.06 for 5,000 gallons
• Solids that have accumulated in the CSO lagoon over the years need to be removed and properly disposed. The need to do that is common to all three alternatives. Assuming that that cost would be $2 million, an additional monthly increase of $1.35 would be needed and would be added to the monthly bills for each of the three alternatives.
6.7 RECOMMENDED PROJECT
Alternative 3 would provide full treatment for more flow than would either of the
other two alternatives. Additionally, Alternative 3 is the most economical (an average of
approximately only $1.28/month/household). Thus Alternative 3 is the best alternative
28

environmentally and economically, and therefore Alternative 3 is recommended for
implementation.
29

7.0 IMPLEMENTATION SCHEDULE FOR THE RECOMMENDED PLAN
The City of LaPorte proposes implementation of Control Alternative 3, “Store and
Treat,” as its CSO Long Term Control Plan. This alternative is fully described in Chapter
6.
LaPorte proposes to implement this control alternative, in accordance with the
schedule set forth in Table 7-1 below:
TABLE 7-1
PROPOSED CSO LTCP IMPLEMENTATION SCHEDULE
Milestone Date
Submit construction documents and application for construction permit.
Within one year after IDEM approval of LaPorte’s CSO LTCP
Begin construction of facilities provided for by Control Alternative 3.
Within 180 days after receiving IDEM construction permit
Complete construction and initiate operation of facilities provided for by Control Alternative 3.
Within three years after IDEM approval of LaPorte’s CSO LTCP
Initiate post-construction monitoring. At the time of initiation of
operation of facilities provided for by Control Alternative 3
Complete post-construction monitoring. 12 months after initiation of
operation of facilities provided for by Control Alternative 3
Submit Post-Construction Monitoring Report. Within 15 months after initiation of operation of facilities provided
for by Control Alternative 3.
30

8.0 POST-CONSTRUCTION MONITORING
8.1 POST-CONSTRUCTION MONITORING PROGRAM
Commencing upon the initiation of operation of the facilities provided for by
Control Alternative 3, LaPorte will initiate post construction monitoring activities to
gauge the effectiveness of Control Alternative 3 in eliminating discharges from the CSO
storage lagoon.
The length of the post-construction monitoring will be one year (12 months), and
will include the following activities: the continued monitoring of the CSO storage lagoon
water level; the continued monitoring of the totalized volume of combined sewage that is
pumped back to the main WWTP for treatment; the monitoring of discharges (if any) to
Travis Ditch from the CSO storage lagoon (as described below); and the continued
monthly submittal of the CSO DMR to IDEM.
Discharges from the CSO storage lagoon will be composite sampled, except
samples for pH, temperature, DO, E. coli, mercury, volatile organics, and whole effluent
toxicity for which grab samples will be obtained. Except as specified below, all
discharges from the CSO storage lagoon will be tested for temperature and all the
parameters listed in the City’s NPDES Permit for Outfall 001, except for total residual
chlorine. Discharges from the CSO storage lagoon will be tested for mercury, to the
extent practical using the appropriate mercury sample collection kit. One discharge from
the CSO storage lagoon will be tested for volatile and semi-volatile organic pollutants.
One discharge from the CSO storage will be tested for acute whole effluent toxicity. The
volume and duration of each CSO discharge event will also be monitored.
8.2 POST-CONSTRUCTION MONITORING REPORT
A “Post-Construction Monitoring Report” will be submitted to IDEM three
months after the conclusion of the post-construction monitoring period. This report will
include the data acquired during the post-construction monitoring and any other relevant
information as discussed below.
At the end of a one year period, if there have been no discharges from the CSO
storage lagoon to Travis Ditch, the CSO LTCP will be deemed to be effective. The
31

continued monitoring of the CSO storage lagoon water level and pump-back flow
volumes will be included as part of the CSO Operational Plan.
In the event that a discharge from the CSO storage lagoon occurs during the post-
construction monitoring period, the discharge will be sampled as described above. In
addition, the CSO LTCP will be re-assessed to evaluate why the CSO overflow occurred,
whether it was due to a failure in the design and implementation of the system, due to
mechanical/equipment failure, or weather-related events. A description of the overflow
circumstances; recommended actions for achieving compliance with the water quality
and technology based requirements of state and federal law; a proposed schedule for
implementation of such actions; and a proposed monitoring plan for the period of
implementation of such actions will be included in the Post-Construction Monitoring
Report. It is acknowledged that the recommended actions will be subject to IDEM
approval.
8.3 DISCHARGE AUTHORIZATION
It is proposed that the City’s authorization to discharge from the CSO lagoon
would remain in effect until:
1. The City successfully completes the post construction monitoring period (i.e. no overflows occur during the 12 month post-construction monitoring period). At such time, authorization to discharge from the CSO lagoon would expire; or
2. In the event that one or more overflows occur during the post-construction monitoring period, the City completes implementation of additional actions, as provided for by the Post-Construction Monitoring Report, and as approved by IDEM. At such time, authorization to discharge from the CSO lagoon would terminate (if the additional actions implemented by the City are intended to eliminate discharges from the CSO lagoon), or be modified to include additional limitations and requirements (if the additional actions implemented by the City are intended to treat discharges from the CSO lagoon, as necessary to ensure compliance with the water quality and technology based requirements of state and federal law).
Once authorization to discharge from the CSO lagoon expires, LaPorte
understands that such discharges from the lagoon will be prohibited. Should a lagoon
discharge occur after the authorization has expired, LaPorte proposes the following:
LaPorte will evaluate the causes of the discharges and recommend to IDEM appropriate
32

corrective actions. LaPorte may propose corrective actions that are intended to eliminate
the discharges or treat the discharges, as necessary to ensure compliance with the water
quality and technology based requirements of state and federal law. If LaPorte proposes
corrective actions intended to eliminate the discharges, the prohibition on discharges
from the CSO lagoon will remain in effect indefinitely. If LaPorte proposes corrective
actions intended to treat the discharges and IDEM approves the proposed corrective
actions, the prohibition on discharges from the CSO lagoon will remain in effect until the
corrective actions are completed and LaPorte’s NPDES Permit has been modified to
contain appropriate effluent limitations and monitoring requirements applicable to the
discharges.
33

LAPORTE, INDIANA
COMBINED SEWER SYSTEM OPERATIONAL PLAN
PHASE I & II
CITY OF LAPORTE, INDIANA BOARD OF PUBLIC WORKS AND SAFETY
Elmo A. Gonzalez, Mayor George M. Fettinger, Member
Robert H. Bernth, Member
Constance L. Ebert, Clerk-Treasurer Robert C. Szilagyi, Attorney
BOYD E. PHELPS, INC. Consulting Engineers
Michigan City, Indiana (219) 874-6238
OctobE~r, 1989

I. INTRODUCTION
1.1 1.2 1.3 1.4 1.5 1.6
PURPOSE ........................................ . REGULATION ....................................... . CONTRACT ....................................... . PHASE I ....................................... . PHASE I I ....................................... . IMPLEMENTATION DEADLINE ........................... .
I-1 I-1 I-1 I-1 I-1 I-1
II. EXISTING COMBINED SEWER SYSTEM
II.1 II.2 II.3 I I. 4 I I. 5 II.6 I I. 7
DESCRIPTION ....................................... . AREA DRAINAGE ..................................... . COMBINED SEWER FLOW TREATMENT ..................... . COMBINED SEWER SYSTEM PROBLEMS .................... . COMBINED SEWER SYSTEM MAINTENANCE ................. . C0MBINED SEWER SYSTEM CONTROL ..................... . COMBINED SEWER SYSTEM REGULATIONS ................. .
II-1 II-1 II-2 II-~
II-2 Il-3 ll-3
III. EXISTING COMBINED SEWER SYSTEM
I I I. 1 III.2 II I. 3 I II. 4 III.5 I I I. 6
GENERAL . . . . . . . . . . . . . . . . . . . . . . . . . . . . . . . . . . . . . . . . . . IIl-1 COMBINED SEWER OVERFLOW EVENTS . . . . . . . . . . . . . . . . . . . . III-1 INDUSTRIAL AREA SURFACE DRAINAGE .................. Ill-8 BUSINESS AND GOMMERCIAL PARKING LOT DRAINAGE . . . . . . III-8 ROOF DRAINAGE . . . . . . . . . . . . . . . . . . . . . . . . . . . . . . . . . . . . . III-8 OTHER DRAINAGE . . . . . . . . . . . . . . . . . . . . . . . . . . . . . . . . . . . . III-14
IV. IMPROVEMENT ALTERNATIVES FOR COMBINED SEWER SYSTEM
IV. 1 IV.2
IV.3 IV.4 IV.5 IV.6 IV. 7 IV.8 IV.9
IV. 10
GENERAL ........................................... . PREVENTIVE MAINTENANCE OF COMBINED SEWERS AND CATCH BASINS ...................................... . MORE FREQUENT STREET CLEANINGS .................... . SURFACE INFLOW CONTAMINATION CONTROL .............. . SURFACE INFLOW RATE CONTROL ....................... . SURFACE INFLOW ELIMINATION ........................ . COMBINED SEWER SYSTEM STORAGE OF WET WEATHER FLOWS . MAXIMIZE WET WEATHER FLOW RATE THRU TREATMENT PLANT. SEWER FLOW DETERMINATION AND BILLING FOR CUSTOMERS WITH LAFWE SURFACE INFLOW ......................... . SURFACE DRAINAGE PONDING AREA SOLUTIONS ........... .
V. SUMMARY, FINDINGS AND CONCLUSIONS AND RECOMMENDATIONS
v. 1 V.2 V.3
SUMMAFlY ........................................... . FINDINGS AND CONCLUSIONS .......................... . RECOMMENDATIONS ................................... .
IV-1
IV-1 IV-1 IV-2 IV-2 IV-3 lV-4 lV-5
IV-6 IV-7
V-1 V-2 V-3
VI. IMPLEMENTATION SCHEDULE FOR RECOMMENDATIONS . . . . . . . . . . . . . . . VI-1
i

INDEX OF TABLES
TITLE PAGE NO.
Combined Sewer Flow and Rainfall Data Comparison III-2
2 LaPorte Wastewater Treatment Plant Bypass Flow Quality Data ................................... III-3
3 LaPorte Wastewater Treatment Plant Influent Flow Strength . . . . . . . . . . . . . . . . . . . . . . . . . . . . . . . . . . . . . . . . III-7
4 Summary of Industrial Area Surface Drainage Survey .......................................... III-9, 10, 11
5 Large Business and Commericial Parking Lot Surface Drainage Summary .. .. .. .. .. .. .. .. .. .. .. .. .. .. .. .. III-12 & 13
6 Combined Sewer and Catch Basin Preventive Maintenance Equipment and Manpower and Estimated Costs . . . . . . IV-2
7 Possible Eliminatioh of Existing Surface Inflow Sources . . . . . . . . . . . . . . . . . . . . . . . . . . . . . . . . . . . . . . . . . IV-3
8 Plant Inlet Bypass Weir Raising Effects on Combined Sewer Flow Storage .. .. .. .. .. .. .. .. .. .. .. .. .. .. .. IV-4
9 Surface Drainage Pending Area Problems and Solutions . IV-7 & 8
INDEX OF FIGURES
TITLE PAGE NO.
Total Combined Sewer Storm Flow Rate ............... . III-4 Versus Rainfall Intensity
2 Total Combined Sewer Storm Flow Volume Versus Total Rainfall Amount ................. . III-5
i i

~
i I J
l I ~
J ~
I J
l J
~ NO.
I J
~
J , j
1
l
]
J I I ~
'
1
J ;
]
1 1
APPENDIX INDEX
DESCRIPTION
LAPORTE, INDIANA NPDES PERMIT
CONTRACT AND SCOPE OF SERVICES FOR THE COMBINED SEWER SYSTEM OPERATIONAL PLAN
LAPORTE CITY SEWER MAP
LAPORTE CITY SEWERED AREA MAP
SECTION 2.05 OF LAPORTE CITY ORDINANCE NO. 1760 AND LAPORTE CITY ORDINANCE NO. 1896
INDEX OF INDUSTRIES SURVEYED FOR SURFACE DRAINAGE
INVENTORY OF COMBINED AND SANITARY SEWER SYSTEM
1 , ;

I. INTRODUCTION
1.1 PURPOSE
The purpose of the combined sewer operation plan (PLAN) for the City of LaPorte, Indiana is to determine and implement the most efficient and effective operation and maintenance procedures for the City's existing combined sewer system. The PLAN also considers possible modifications to the existing system for improved efficiency and effectiveness. However, the basic intent of the PLAN is to make the best possible use of the City of LaPorte's combined sewer system as it presently exists.
1.2 REGULATION
The preparation and submittal of the PLAN is a requirement of the City of LaPorte's current NPDES permit. The specific requirements are contained in Items IliA, B and C on pages 19 and 20 of the permit, a copy of which is contained in the Appendix as Item A.
I.3 CONTRACT
The study and preparation of this report for the PLAN was authorized by the City of LaPorte, Board of Public Works and Satety, on March 15, 1989. This authorization was for both Phase I and Phase II of the PLAN. A copy of this authorization and a scope of services for each Phase is contained in the Appendix as Item B.
1.4 PHASE I
Phase I of the PLAN presented those portions of the combined sewer system study which could be completed prior to the PLAN submittal deadline of May 5, 1989. Phase I also previewed the remaining Phase II work.
I.5 PHASE II
Phase II of the PLAN completed the combined sewer system study, conclusions and recommendations. The completion of Phase II was weather related due to the wet weather flow monitoring and sampling required. Phase II of the PLAN is incorporated with Phase I into one document.
I.6 IMPLEMENTATION DEADLINE
The LaPorte NPDES permit requirements for the PLAN include one year for complete implementation, following PLAN approval by the Indiana Department of Environmental Management. This one year PLAN implementation period should follow approval of Phase II and not just Phase I.
I -

II. EXISTING COMBINED SEWER SYSTEM
I I . 1 DESCRIPTION
A combined sewer system receives and transports sanitary and industrial wastewaters and surface water from rainfall and snow melt. The City of LaPorte's combined sewer system presently services approximately 26% of the 8,000 (approximate) acres of area within the city limits. Approximately 7% of the city area is served by separate storm and sanitary sewer systems and 7% of the city area is served by sanitary sewers only. The remaining city area is not sewered due to lack of development. The combined and sanitary sewers are indicated on the LaPorte City Sewer Map in the Appendix, as Item C. The combined, sanitary and separate sewer areas are indicated on the LaPorte City Sewered Area Map in the Appendix, as Item D. An approximate inventory of the combined and sanitary sewer system is also contained in the Appendix, as Item G.
Approximately 33% of the sewered area on the north side of Lincolnway in LaPorte is served by combined sewers. The remainder of this north area is served by separate storm and sanitary sewers or sanitary sewers only. All of the City's 15 wastewater pumping stations are on the north side of Lincolnway and each station is on a sanitary sewer system. The sanitary sewer areas have ovElrland surface drainage into the various lakes in the area. The storm sewers on the north side of LaPorte discharge into the area lakes or into percolation basins or low areas.
Approximately 85% of the sewered area on the south side of Lincolnway in LaPorte is served by combined sewers. The only areas south of Lincolnway that have separate storm and sanitary sewers is in the downtown area and along 18th Street.
The sanitary sewer areas on the south side of Lincolnway have overland flow of surface water into low areas.
Overall, 33% of the 18 square block downtown area of LaPorte is served by combined sewers.
The sanitary sewers in LaPorte are basically on the edges of the City. The sewers in the middle of LaPorte, including the main sewers to the City's wastewater treatment plant at the southeast corner of the City, are all combined sewers. Therefore, the sanitary sewers in LaPorte all discharge into combined sewers.
II.2 AREA DRAINAGE
There is only one actual drainage outlet for the City of LaPorte. This is Travis Ditch which begins at the City's wastewater treatment plant and flows into the Kankakee River. None of the lakes and low areas in LaPorte have drainage outlets. All of the water that drains into these areas dissipates by evaporation and percolation.
II -

II. EXISTING COMBINED SEWER SYSTEM
1I.1 DESCRIPTION
A combined sewer system receives and transports sanitary and industrial wastewaters and surface water from rainfall and snow melt. The City of LaPorte's combined sewer system presently services approximately 26% of the 8,000 (approximate) acres of area within the city limits. Approximately 7% of the city area is served by separate storm and sanitary sewer systems and 7% of the city area is served by sanitary sewers only. The remaining city area is not sewered due to lack of development. The combined and sanitary sewers are indicated on the LaPorte City Sewer Map in the Appendix, as Item C. The combined, sanitary and separate sewer areas are indicated on the LaPorte City Sewered Area Map in the Appendix, as Item D. An approximate inventory of the combined and sanitary sewer system is also contained in the Appendix, as Item G.
Approximately 33% of the sewered area on the north side of Lincolnway in LaPorte is served by combined sewers. The remainder of this north area is served by separate storm and sanitary sewers or sanitary sewers only. All of the City's 15 wastewater pumping stations are on the north side of Lincolnway and each station is on a sanitary sewer system. The sanitary sewer areas have overland surface drainage into the various lakes in the area. The storm sewers on the north side of LaPorte discharge into the area lakes or into percolation basins or low areas.
Approximately 85% of the sewered area on the south side of Lincolnway in LaPorte is served by combined sewers. The only areas south of Lincolnway that have separate storm and sanitary sewers is in the downtown area and along 18th Street.
The sanitary sewer areas on the south side of Lincolr1way have overland flow of surface water into low areas.
Overall, 33% of the 18 square block downtown area of LaPorte is served by combined sewers.
The sanitary sewers in LaPorte are basically on the edges of the City. The sewers in the middle of LaPorte, including the main sewers to the City's wastewater treatment plant at the southeast corner of the City, are all combined sewers. Therefore, the sanitary sewers in LaPorte all discharge into combined sewers.
1I.2 AREA DRAINAGE
There is only one actual drainage outlet for the City of LaPorte. This is Travis Ditch which begins at the City's wastewater treatment plant and flows into the Kankakee River. None of the lakes and low areas in LaPorte have drainage outlets. All of the water that drains into these areas dissipates by evaporation and percolation.
II -

II. 3 COMBINED SEWER FLOW TREATMENT
All of the combined sewer system in LaPorte drains into the City's newly renovated and expanded wastewater treatment plant. All of the dry-weather flow, except for isolated peak flow periods, enters the plant for treatment. These dry-weather peak flows and wet weather flows from the combined sewer system enter a 16.75 acre retention pond which overflows directly into Travis Ditch. This is the QfiLt overflow on the LaPorte combined sewer system.
11 . 4 COMBINED SEWER SYSTEM PROBLEMS
Based on information provided by several city personnel, the combined sewer system problems in LaPorte are quite limited. No regular basement flooding problems exist anymore. Furthermore, temporary surface drainage pending occurs at the following locations or areas:
1. On "F" Street between 8th and 10th Street. 2. Under the railroad viaduct on 1st Street. 3. On Brighton Street at Rush Street. 4. On the west side of the 6th and "J" Street intersection. 5. Rockwood and Truesdell intersection. 6. Darlington Street. 7. Lincolnway east. 8. Corvette Drive, between "I" St. and Mustang Drive. 9. Monroe Manor west of Boyd Boulevard.
It should be mentioned that State and City regulations require reduced flow rates from any additional catch basins or other new connections to existing combined sewers. Therefore, if inadequate surface drainage inlet capacity is the cause of a surface ponding problem, additional capacity can only be provided by storm sewer inlets or drywells.
II.5 COMBINED SEWER SYSTEM MAINTENANCE
The LaPorte City Street Department cleans the existing City sewers and the catch basins on the City's combined sewers. Due to present budget limitations, these cleanings are on an "as-needed" basis. The Indiana State Highway Department also cleans the catch basins on the State Highways through LaPorte, which are the following streets:
1. Pine Lake Avenue 2. Indiana Avenue 3. L i nco 1 nway 4. "J" Street 5. Monroe Street
II - 2

These catch basin cleanings yield considerable material, however, this is to be expected. No known physical problems exist with the existing catch basins and combined se~1ers in LaPorte, except that the catch basin grates tend to plug with material. Local residents and the City Street Department clean these catch basin grates as required, to alleviate surface ponding problems.
Street cleaning affects combined sewers and catch basins. The LaPorte City Street Department cleans all street curb and gutter areas on an average of two or three times per year The State Highway Department also cleans the curb and gutters on the State Highways through LaPorte.
The City Street Department has the necessary equipment for cleaning the City's combined sewers, catch basins and streets, however, some of the equipment is in need of replacement.
II.6 COMBINED SEWER SYSTEM CONTROL
The existing combined sewer system in LaPorte is controlled in the following ways:
1. The surface runoff rate into the combined sewers is limited by the present number of catch basins and roof drains that are connected. State and local regulations require delayed flow rates from any new connections to the combined sewers.
2. The quality of surface runoff flow in the combined sewers is affected by the efficiency of street, catch basin and sewer cleaning.
3. The rate of combined sewer flow through the LaPorte wastewater treatment plant is controlled by adjustable flow gates and a fixed bypass weir level at the plant. Improvements would be required however, to expand the control capabilities of these facilities.
4. The wet weather flow rates in the combined sewer·s are reduced prior to discharge into Travis Ditch by the treatment plant flow rate and the retention pond overflow rate into Travis Ditch.
5. The quality of combined sewer wet weather flow is improved by the treatment plant and retention pond prior to their discharges into Travis Ditch.
II.7 COMBINED SEWER SYSTEM REGULATIONS
LaPorte City Ordinance No. 1760 covers the use, user charges and pretreatment requirements for the City's sewer system. Section 2.05 of this ordinance is included in the Appendix as Item E. Part L of Section 2.05 has been revised by City Ordinance No. 1896 to reflect the requirements of Item II on page 1g of LaPorte's current NPDES permit. A copy of Ordinance No. 1A96 is also included in Appendix Item E.
II - 3

III. EXISTING SURFACE DRAINAGE
III.1 GENERAL
Surface drainage from municipal areas has been scrutinized very closely in recent years. This PLAN is one example. All municipalities with combined sewer systems are requ1red tc have such a PLAN. Similar studies of large storm sewer systems and their discharges are also being considered by the regulatory agencies. Throughout this decade, data has been collected and reports have been published by the regulatory agencies and others concerning the pollutional effects of urban stormwater runoff. It is an accepted fact that all urban stormwater runoff has pollution potential, especially the initial runoff after an extended dry period.
The sources of pollution in urban stormwater runoff included:
1. Spilled chemicals in industrial or other loading areas. 2. Contaminated residues in industrial areas. 3. Petroleum products which are leaked, spilled or poured onto
the ground or paved surfaces throughout the city. 4. Fertilizer, insecticide and herbicide residues from the
lawn and garden areas throughout the city. 5. Animal droppings. 6. Decaying leaves, grass clippings and other vegetation.
These sources of pollution are compounded when they accumulate in extended dry periods and then are "flushed" into the sewers by a heavy rain. Oftentimes sewer accumulations occur in dry weather and are also "flushed" out during heavy rainfall. Hence the "first-flush" phenomenon that is the greatest pollutional threat.
II I. 2 COMBINED SEWER OVERFLOW EVENTS
Flow rate estimates and samples have been obtained at the LaPorte wastewater treatment plant inlet junction structure bypass, during several storm events. This is the onl}' combined sewer overflow (CSO) in LaPorte. These results determine the extent of the esc problem in LaPorte. It should be mentioned that the flow from this cso enters a retention pond, as described in Section !!.3, for treatment prior to overflow into Travis Ditch.
The existing LaPorte wastewater treatment plant inlet junction structure level recorder was used to determine periods of plant bypassing during significant rainfall events. The resulting plant bypass rate was calculated by bypass weir formula. The corresponding plant inlet flow rate recorder and local rainfall information were also obtained. All of this data is presented in Table 1 on the following page.
III -

TABLE 1 - COMBINED SEWER FLOW AND RAINFALL DATA COMPARISON
DATE TIME RAINFALL PLANT BYPASS Amount Intensity Max.Rate Volume
(IN) (IN/HR) (MGD) (MG)
4-28-89 6 AM .54 .36 11.7 -
6-27-89 2 AM . 64 .31 7.5 . 17
7-9-89 5 AM 1. 30 .73 87.6 4.83
8-5-89 3 AM .53 .27 63.2 1.10
8-15-89 2 PM .65 .65 76.4 2.37
8-20-89 3 AM .43 .29 8.9 .35
9-1-89 4 AM 1. 60 .27 93.3 4.52
* Storm flows only with typical wastewater flows excluded.
H H ...... I
N
PLANT FLOW * TOTAL FLOW Max.rate Volume Max.Rate Volume
(MGD) (MG) (MGD) (MG)
7.7 - 19.4 -
6.5 .68 14.0 .85
6.2 1. 09 93.8 5.72
6.2 . 71 69.4 1. 81
6.0 . 44 82.4 2.81
6.0 .98 14.9 1. 33
5.7 1. 09 99.0 5.61
COMMENTS
Plant Flow Chart Data Incomplete for Volume
Plant Bypass Maximum Rate was of very shor1 duration and doesn't correlate with the avE age rainfall intensit~
Storm Event was very long and the average rainfaill intensity i: not applicable to max. mum flow rates.

The flow rate and rainfall intensity data in Table 1 are flraphically displayed on Figure 1 on Page III-4. By graphically averaging the data on Figure 1, a total combined sewer storm flow rate versus rainfall intensity curve has been indicated. The approximate slopes of this curve yield 25 MGD of storm flow rate per inch per hour of rainfall intensity for intensities up to .25 inches per hour and 200 MGD/in./hr. for intensities above .30 inches per hour.
The flow volume and total rainfall data in Table 1 are graphically displayed on Figure 2 on page III-5. By graphically averaging the data on Figure 2, a total combined sewer storm flow volume versus total rainfall curve has been indicated. The approximate slope of th1s curve yields 3.4 million gallons of storm flow per inch of rain.
By comparing rainfall and plant flow data, the storm flow concentration time at the LaPorte wastewater treatment plant has been determined to be one hour. In other words, one hour after it starts to rain in LaPorte, the treatment plant flows start to increase as a result.
Additional wet weather flow monitoring data determined that the wet weather storm flow rates at the LaPorte wastewater treatment plant are contributed by the four plant inlet sewers as follows:
PEBQ~NL Qf_TQTALI~FLO~RAIE
36" S.W. Tip & Relief for N.W. Corner 8%
48" E. Area ~'3%
60" E. Edge & Relief for E. Area Above 6%
78" Remainder of Town _§3% 100%
The LaPorte wastewater tested the plant inlet course of this study. Table 2 below:
TOTAL
plant personnel periodically grab-sampled and junction structure bypass flow during the The results of this work are summarized in
TABLE 2 - LAPORTE W~STEWATER_TREATM£NT __ PLANT
DATE
4-4-89 4-17-89 4-18-89 4-28-89
98.2 188 89. 1 158
III - 3
IQ_~LLrng/_U
178 586 476 457

I
~- r-- ~~j ! --~---~ --- ~j-~<1 -- ----- ------·
I GU.
~\ 0 _) -::1
1\---Qll :I N
N N '.:l
i
i -----· --'·-*tt- -- ---------
Q 1 lll :s Q
1>- ! -' I \ J'l lL Ul U- r-1 - 0 '/) ~ I
·, <() .J :J 1 - i -~\. ~@-~ §
J\ ~-------- --- --- ..
7 I
~ I
\U:l ul trON l--
~ t- ! I \ :11Ul ~-------:L
\-------- -all r-- ----N --- --n-n -:r - ----
j 11 U\ J \ Nll\l r ; I tf 4 I
(l_Q-:1 lU ~ \ ___
[\.. 1)1 L--~~· ------- v-.~--1------
I~ --.
D I
\ I u> j !}) \ -d) :::J
1----::1 tJ\ \ ·---------
0 ~
\ \.) u1
I >
j \ lll -----
t 1-I \ 0 4
~ ~ \ I I'
-----------·----\ ·--~
\ UJ tl --~.\ _) c-------- ----------- -- --------- - --- -·------
I
~ () "¢ I -
LL N I \ .j
~-------
t-~--- -·~ -I • cr
-· -------
- -
* lll - I . -..o·
--
- ------ ------ --
r--~- _. ---
r---·-- ----
0 t'J
I
•a::l
~-- -
~------
r-~----·--
u1_: :l'
·- 1.11 ~I .J (1, .0 \1 4 .dr-
~·t no-Vltu :r l-y~
- n ~' . ~U' -41 "--o Wl.fl l'l..r
--- 11' 'ill --iSrl
* ----------- -~-
- --- ----
--------·
---~---- --
D ~ll--.....-<l---ION j:J ()0 \J::r
- li~------
0 . ()~T \1 l-J.:I-- '\f \)\-- . \.i\:12 ~-Ul ,, "- i -~ §-=-
Q.J_) jll..J
lflN~
~ ~ ~-1~N -X
,. 0 L 0 - ,
\ .....
'-
0 I! (f
\ ...
t 0 -,
"" ~ (
1'
0 I\ ' II
\ ~
' -< /
0 -.9 ' )
{' ( J-
0 v lf\
f\ ~ ....
0 __. '1' H u
{ 11
---- - ------- --0--- _G i. IS\ (l. IL 4
-- ---- -----
··- ---- -
----1 ~-------•
~
-
1{1 \{
"' -' ('
\_

\ (J
\ I
r-I
<r
\ \
j\
-1------~ ~------ ---------- -\-\- \ 1-:J
} 0
~ 0
tl j --<1
cl & ~ 1 VI 4
N N ~ nl
5. {--til 0 \{) ~
--- f----
D "' ul :J
:1 J)
rD N
6 ul >
\) tl} 2
j :l_ - ----- ----r J
~ 0 :>-
I
t;-J
ill t1 _J
~
lL
t.t-:r O.J
"! ~"" )3
.q.o "_j
{'()\1. ,, ~ ---·-- ------ -nl ---
\U lll
~3} _jll
\ \f)v'J D t 1llu1
~2 4
1\ }Ifl r1
~ -1 I
~B l-0-'
G
\ ~ \ I
4 I
\
< '
--- --- - -- --\ --
\ \
\
---- --- --~ f----~
------ -
. --~ ~ --- --- - ·--
--- 1------1
!
----- - -- -~- - - ----
lfl ,-. \\)
1\ \
\ -------- ·----- ------
\ ,j) I
~;()"
\ j\
\ \
--- --·------r-N
I • -.9
I
I
i I
I - ---- ---r---1---+----- q
~
0 /--- -----r----- . 'I
.n '~
2 "---
-r --- --- --~ --t----+------t-q )
0 ~ I •
'()
'f
[I
) f\J
~ ijl
(\j u·
0 --; - - - . :> ~, nl
If~
c 11 1 J )
G 0 - - . \J
--· -:.! I--I~
\.9 ~-
\ "--1 n n IN "'-1 --.1 "G -\ "'-I I ""./ ~ -..vlnl

J
J , I I •
] , J
J
]
]
J
1
J
l J
1 i
J
J
]
1
Th se plant bypass concentrations should be compared with the average pl nt inlet flow concentrations of 104 mg/1 CBODs and 112 mg/1 TSS fo the period from April 4, 1989 through April 28, 1989. This co parison indicates that the plant bypass flow (CSO) strength co centrations equal or exceed those of the average plant inlet flow, pa ticularly regarding TSS. This fact is further illustrated by Ta le 3 on the following page which presents the 1987 and 1988 La orte wasteater treatment plant influent flow concentrations for bo h bypass and non-bypass days.
All of the LaPorte wastewater treatment plant bypassing enters a re ention pond, which consequently overflows into Travis Ditch. The re ention pond acts like a waste stabilization lagoon and provides solids settling and natural decomposition of the plant bypass flow.
III - 6

MONTH 1987
JAN FEB MAR APR MAY JUNE JULY AUG SEPT OCT NOV DEC
YEARLY AVE.
1988
JAN FEB MAR APR MAY JUNE JULY AUG SEPT OCT NOV DEC
YEARLY AVE.
TABLE 3 - LAPORTE WASTEWATER TREATMENT PLANT INFLUENT FLOW STRENGTH
CBOD 5 (mg/l)
(Rain) BYPASS DAY MAX AVE MIN
104 130 140 149 164 168 162 124 350 200 146
167
77 208 128 138 157 118 118 195 167 135 171
85
141
104 116 111 112 112 108 105
86 133 148 117
114
77 123
99 83
129 110 105 131 129
86 100
85
105
104 98 82 62 55 81 54 65 82 96 92
79
77 92 70 31
105 105
96 79
102 60 62 85
80
NON-BYPASS DAY MAX
166 160 180 192 182 142 171 212 335 228 218 195
198
210 182 252 170 192 211 220 193 187 312 239 273
220
AVE
128 124 128 139 130 113 111 132 156 155 164 143
135
144 130 160 115 117 129 148 133 137 17 5 133 162
140
MIN
96 89 94
104 70 80 80 85 90
111 129
80
92
64 92
110 50 63 37 96 88 98
110 67 71
79
TSS (mg/l)
(Rain) BYPASS DAY MAX AVE MIN
204 138 232 322 262 129 140 168 270 222 150
203
108 186 164 167 276 150 168 232 133 165 188 142
173
204 109 14 7 150 124 110
89 105 125 134 118
129
108 128 109 134 158 121 14 0 14 5 103 103
91 142
123
204 73 96 65 53 94 49 60 63 84 55
81
108 84 54 88 80 64 78 68 70 68 46
142
79
NON-BYPASS DAY MAX
201 151 184 143 160 160 168 348 408 246 194 160
210
200 186 324 160 225 371 160 188 794 238 284 342
289
AVE
126 115 113 100
96 99 92
111 117 122 120 106
110
114 106 133
98 112 120 109
98 147 127 112 130
117
MIN
47 79 78 67 55 56 53 49 64 77 86 67
65
68 68 88 56 66 59 62 25 64 82 56 61
63

III.3 INDUSTRIAL AREA SURFACE DRAINAGE
Field surveys of each industrial area in LaPorte have been conducted to determine the amount of surface drainage into the LaPorte combined sewer system and any contamination potential thereto. The: locations of these industries are indicated on Item C in the Appendix and an index of these industries is included in the Appendix as Item F. The summary of these industrial drainage surveys is presented in Table 4 on the following pages.
III.4 BUSINESS AND COMMERCIAL PARKING LOT DRAINAGE
Field surveys of each large business and commercial parking lot were made to determine the amount of surface drainage into the LaPorte combined sewer system. The results of these surveys are presented in Table 5 on the following pages.
III.5 ROOF DRAINAGE
The Infiltration/Inflow Survey which the City of LaPorte completed in 1976 determined that 35% of the residences in LaPorte have their roof drains connected to the combined sewer system. This number has decreased since 1976, with enforcement of the City Sewer use ordinance as problems occurred. However, the present percentage of roof drain connections is not known. Furthermore, as mentioned in Section 11.7 of this report, the City has revised their· sewer use ordinance to allow the continued connection of roof drains to their combined sewer system. As there are no remaining regular sewer flooding areas in LaPorte and as a retention pond exists to receive CSO, the further elimination of roof drains from the combined sewer system is not necessary.
III - 8

INDUSTRY NAME
1. Allis Chalmers (Abandoned)
2. Alpha Baking
2a. American Home Foods Plant No. 2
ROOF AREA DRAINED TO
COMBINED
0
0
0
3. American Metal Products 0
4. Berkel, Inc.
5. Boise Cascade
6. Hedwin Corporation
7. Howmet Corporation
8. National Can Corp.
9. Teledyne Casting
10. Accurate Casting
11. American Rubber Co.
lla. Rectice: Foam
12. Bonnie Baking
13. Coca-Cola Bottling (Abandoned)
14. PPT (Formerly Conrad Corp. )
l.OA
3 .6A
0
3.4A
0
0
0
0
0
l.OA
.6A
.lA
NOTE: A c acres
TABLE 4 - SUMMARY OF INDUSTRIAL AREA SURFACE DRAINAGE SURVEY
PARKING LOT AREA DRAINED TO COMBINED
0
0
0
0
• 7A
2.1A
0
0
0
0
0
0
0
1.3A
0
NA
POTENTIAL DRAINAGE
SOURCES OF POTENTIAL
ON-SITE DRAINAGE DISPOSAL
CONTAMINANTS CONTAMINANTS PERCOLATION RET'N
NA
None
None
None
None
None
None
None
None
Grit
None
None
None
None
None
None
NA
NA
NA
NA
NA
NA
NA
NA
NA
Sand Cast~ngs
NA
NA
NJ,
NA
NA
NA
X
X
X
X
X
X
X
): X
X
X
PLANT WASTEWATER DISCHARGE SEWER
LOCATION S!ZE
NA
St.Rte.2
Fail Rd.
Koomler Dr.
Whirloool Drive
Lincolnway
Lincolnway
Lincolnway
Fail Rd.
Ridgeway St.
Koomler Dr.
Brighton St.
NA
24"
8"
10"
18"
24"
30"
24"
8"
36"
10"
10"
Da=lington St. 10~
Boyd Blvd. 48"
Rumely St. 21"
Factory St. 15"
COMMENTS
Retention Pond overflows to Clear Lake
Retention Pond for roof drainage. Parking Lot Drains to a Marshland to the West.
All Drainage toward a Marshland to the West.
Retention Ponds are Dry.
l/2 of Building Roof .and Parking Lot Drains to Street Inlets.
No Potential to Retain Site Drain1
Retention Pond Size is 200 X 80'
Old Bldg. Roof Drains are directlJ connected. Parking Lot Drains·.to a Ditch to the South.
Retention Pond Provided.
Surface Drainage is into Drywells on Philadelphia St.
Sur:ace Drainage to a Low Area East of Parking Lot.
Surface Drainage is into Drywells in Parking Lot.
Parking Lot Partially Drained by Drywell and partially into a d~tcl
which runs into a small pond that is shared with Arrow Metals:
Portion of Park~ng Lot drains to Rete~~ion Pond ~nd ~ portion to
48" Sewer. Same for roof·-·-·--
Parking Lot has 1 Dry Well.
50% of Roof is Connected to Combil Sewer. Parking Lots are Gravel.

INDUSTRY NAME
15. Teter Tool & Die
16. Mechanovent, Inc.
17. Whirlpool
18. CBC Drilling
19. LaPorte Foundary (Abandoned)
20. Industrial.Pattern Works
ROOF AREA DRAINED TO
COMBINED
0
0
0
0
0
0
21. LaPorte Herald Argus . 2A
6 ~2. Harrison Engine
23. Erincraft 0
24. Old Whirlpool Bldg. 4. lA
25. Midwest Industrial Bldg. 0
26. Modine Manufacturing Cc.
27. New York Blower Co.
28. Field Container
29. Kingsley Furr.lture
30. Arrow Metals
31. Powcote
3.5A
0
0
0
0
0
TABLE 4 - SUMMARY OF INDUSTRIAL AP~ SURFACE DRAINAGE SURVEY
PARKING LOT AREA DRAINED TO COMBINED
NA
0
0
0
0
0
NA
NA
0
NA
0
0
0
0
0
0
0
POTENTIAL DRAINAGE
SOURCES OF POTENTIAL
ON-SITE DRAINAGE DISPOSAL
CONTAMINANTS CONTAMINANTS PERCOLATION RET•N
None NA ·----~---·
None NA
None NA X
None NA
None NA X
None NA
None NA
None NA
None NA X
None NA
None NA X
None NA X
Solvents Storage Bins X
None NA X
None NA
None NA X
- - ---- -
None NA X
PLANT WASTLwATER DISCHARGE SEWER
LOCATION SITE
Washington St. 10"
COMMENTS
Near Downtown Location. ---~ ---------~------------ -- ---
Whirlpool Dr. 15"
Whirlpool Dr. 15"
Boyd Blvd. 48"
Truesdell Ave. 12"
Koomler Dr. 10"
Monroe St. 10"
Pulaski St. 12"
Truesdell Ave. 12"
Factory St. 36"
Lake St. 12"
Factory St. 36"
Factory St. 15"
Koomler Dr. 10"
Pari: St. 10"
Darlingt.on 10" Lift St";;.
Truesdell Ave. 10"
Surface Drainage is into Storm Sewer System. Surface Drainage is into Retentl-6i Pond.
----------------Surface Drainage is to Back and Also Road Ditches.
Surface Runoff to the East.
Downtown Location •.
Auto Storage Area is Unpaved.
Retention Pond Overflows to Clear Lake
--·-- ------ -- ---------Surface Drainage is into a Drywal: In the Parking Lot.
Parking Lot has Drywells.
Parking Lot has Drywells and SolvE are stored Nearby.
Retention Ponds are Dry.
Surface Drainage 1s directly into Clear Lake.
Parking Lot Drains into Small RP.tP-nTinn P0nn ~M~rAd with
Recticel Foam.
Parking Lot Drains into:.Reteotion Pond.

INDUSTRY NAME
ROOF AREA DRAINED TO
COMBINED
TABLE 4 - SUMMARY OF INDUSTRIAL AREA SURFACE DRAINAGE SURVEY
PARKING LOT AREA DRAINED TO COMBINED
POTENTIAL DRAINAGE
SOURCES OF POTENTIAL
ON-SITE DRAINAGE DISPOSAL
CONTAMINANTS CONTAMINANTS PERCOLATION RET'N
X
PLANT WASTEWATER DISCHARGE SEWER
LOCATION SITE
Clay St.
Washington St.
Washington
10"
10"
12"
Ridgeway St. 36"
COMMENTS
Downtown Location.
Downtown Location.
Downtown Location. Parking Lot has Drywell.
Entire Area Drains into Catch
Basin em __ Dayt_o~-~----
-- ~-=---= _-_·:._--::.:-__ -==-======:.:.::_:::.:..:==============

TAULI'; !) - LAKliiS UU!:ilNt;!i!:i ANU CU11MISIIC1AL l'AKKlNli 1.0'1'
SURFACE DRAINAGE SUMMARY
!'arking Lot llescriptioo
M:lple Lane M:lll
Locatioo
St.Rte. 2 West
Quick's Lanes & Colfax Ave.
LaPorte Cinerra & NIPSCo.
Krogers & St. Rte. 2 West Kabel ins & Andrew Ave.
Lincolnway West Rudd' s-Qxxlyear fran California St.
to Fildes St.
Roof & Paved Area Drained To
Carbined Sewer
12.8A Direct
2. 7A Indirect
0
0
LaPorte Hospital: Lincolnway & Chicago St. 0 Upper level lots Chicago & Washington Sts.
M:ldison St.
Washington St. Tyler & Washington St.
Lower level lot M:ldisoo & Washington St.
Dmners & Fanily Lincolnway East
Dollar and llos too St.
Al's East Lincolnway East
and York St.
LaPorte High Sclnol: West Lot
East Lot
Kes 1 ing Mid::Ue
Sctnol
lbok's
"I" St. & 6th St.
West of "F" St.
18th Street
18th Street &
"A" Street
oon;:, A acres
0
0
0
0
0
3.9A Direct
0
0
.5A Direct
.5A Indirect
0
0
On-Site Drainage
Disposal
Pco::olatioo Retentioo
Yes
Partial
Yes
No
Partial No
Pdrtial
Yes No
No
No
Partial
No
No
No No
No
No No
No
Carnents
"Ferx:h drain" sa.ers for all roof
and inlc:t drains and with direct gravity flCM c>OOneeticns to 30" s~ oo Andnw Ave. Vast majority of stonn water fla./11 thus enter 30" sewer.
N. W. corner of parking lot has drywell. S.W. corner of parking lot
iocluding a part of NIPSCo. drains into pond west of parking lot. East half of paddng lot :.ncluding a part of Nll'SCo. drains to Colfa¥ with calclo ll<l>iins providud at railroad.
South ha If of pa.rkinJ lot has
drywells. tlorU1 half of parking lot has dry.l'-'lls and over flo.-J 11 frencl)" drdin.
l'atking lot drains D State St.
where surface percoL1tion occurs as
drainage inlets are ineffective due to their locatio:iS.
One dryv1ell in packing lot. Inlds cvJU><-".:lo:l to stonn Se.A3r oo ~\.tdi~on St.
Ora; dryv"'ll aJ•l one inlet connected to stonu se.ver. 1'1-xl dryv.e 11 s . ~d.st lol has 1 chywell & west lot has 2 dryv.e 1 l!; .
Stotm "ater pul\)ing into ~lldison St . .::;tonus~.
No No Inlets are dit·ecLJy connected to
36" curl.,ined s""ver en Yock SL.
Yes No
Yes rlo
Partial
0 Yes
0 0
Parking Jot has dr'fl,ells.
"French" drdin for: c.ll parking Jol inlets.
N<Kllo pc~rt of fldJ:ki.ug lot drains to "F" St. Hid<lle Jldrt of packing lot dcains lo 2 clcY""lls wtlh "fr:ench" drain in bet~ S:x1U1 part of patking lot drains t.o entry way grate which dt·ains to catch basin on "F" St. Soul\J~o.eSt part of parking lot has 2 drywells with "french"drains.
Stann sc....er systan for all inlets
discharges into a p:>nd south of 18th St. and west of "A" St.
1'1-xl inlets on east side of parking lot ace connecloo to stonn s~ on liJth St.

I
!
l J.
Pd};"~ng Lot Lescriptioo
Be:rnacchi 's Farm l'tu:ket
City of LaPorte
City of LaPorte
5 Star-B.Jrger King
Location
1-bnroe St.
I.incolnway and 1-bnroe St.
Jackson St. and Jefferson Ave.
St. Rte. 2 fran Andrew Ave. to "J" Street
'IOI'ALS
lloof ' Paved Area Drained To
Camined sewer
On-Site Drainage
Dis[XJSal
Percolation Retention
.6A Direct
-r-·-1 1 Partial No
• SA Indirect
0
.3A Indirect
0
17 .BA Direct
4.0A Indirect
!
III-13
Yes No
No No
No Yes
Canrents
Northeast comer of parking lot has 2 dryw ells. Norttr..est comer of parking lot has drywall with CNerfl<M to parking lot ::atch basin at
1-bnroe SL. Ranlining of parking lot drains to inlets that are direct, ly connected to 10" carbined sewer on I-bn roe Street.
Parking lot has one ctrywell.
Parking lot surface drains to
Jefferson Ave. and Jackson St.
Stann SL"*'rs for all inlets dis-charge iuto a pond 3t the South-corner of this area.

III. 6 OTHER DRAINAGE
The field work for this project discovered the following additional confirmed or suspected drainage into the LaPorte combined sewer system.
1. Southeast corner of municipal golf course and the adjoining marshland were confirmed to drain into the 48'' combined sewer.
2. The private ponds east of the municipal golf course are suspected to drain into the 48" combined sewer.
III - 14
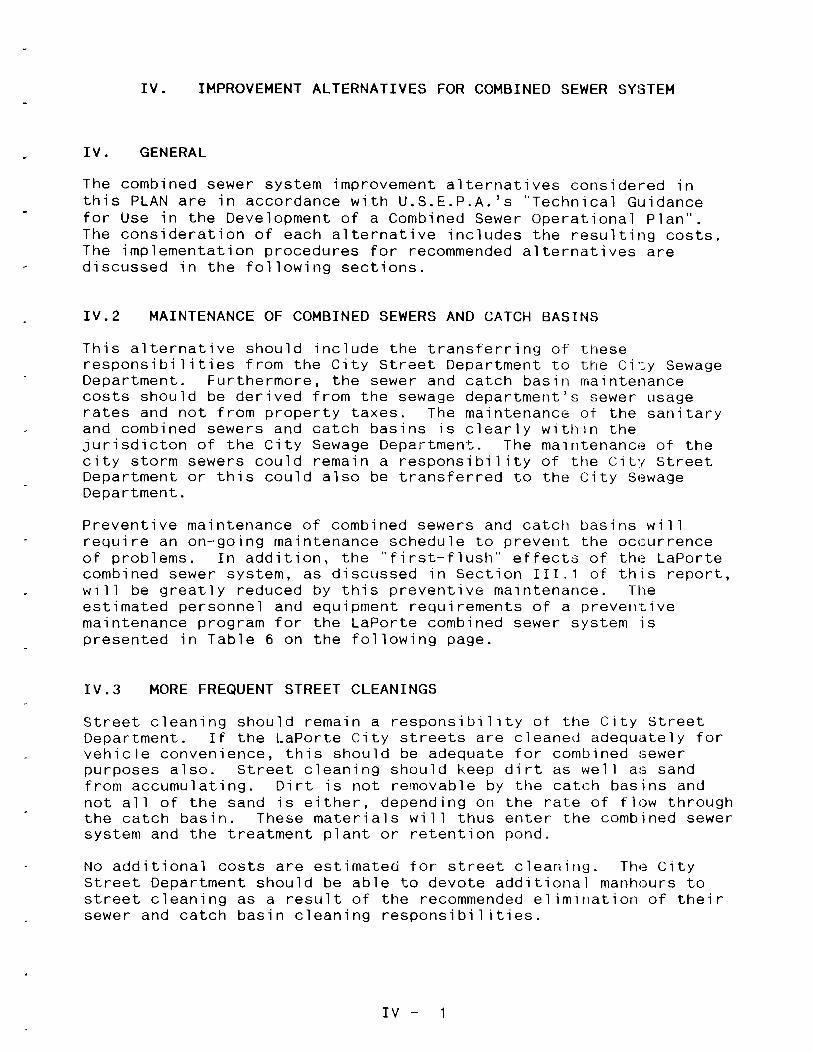
IV. IMPROVEMENT ALTERNATIVES FOR COMBINED SEWER SYSTEM
IV. GENERAL
The combined sewer system improvement alternatives conside1~ed in this PLAN are in accordance with U.S.E.P.A. 's "Technical Guidance for Use in the Development of a Combined Sewer Operational Plan''. The consideration of each alternative includes the resulting costs. The implementation procedures for recommended alternatives are discussed in the following sections.
IV.2 MAINTENANCE OF COMBINED SEWERS AND CATCH BASINS
This alternative should include the transferring of these responsibilities from the City Street Department to the Ci~y Sewage Department. Furthermore, the sewer and catch basir1 maintenance costs should be derived from the sewage department's sewer usage rates and not from property taxes. The maintenance of the sanitary and combined sewers and catch basins is clearly within the jurisdicton of the City Sewage Department. The maintenance of the city storm sewers could remain a responsibility of the City Street Department or this could also be transferred to the City Sewage Department.
Preventive maintenance of combined sewers and catch basins will require an on-going maintenance schedule to prevent the occurrence of problems. In addition, the "first-flush" effects of the LaPorte combined sewer system, as discussed in Section III.1 of this report, will be greatly reduced by this preventive maintenance. The estimated personnel and equipment requirements of a preven~ive maintenance program for the LaPorte combined sewer system is presented in Table 6 on the following page.
IV.3 MORE FREQUENT STREET CLEANINGS
Street cleaning should remain a responsibility ot the City Street Department. If the LaPorte City streets are cleaned adequately for vehicle convenience, this should be adequate for combined sewer purposes also. Street cleaning should keep dirt as well as sand from accumulating. Dirt is not removable by the catch basins and not all of the sand is either, depending on the rate of flow through the catch basin. These materials will thus enter the combined sewer system and the treatment plant or retention pond.
No additional costs are estimated for street cleaning. The City Street Department should be able to devote additional manhours to street cleaning as a result of the recommended elimination of their sewer and catch basin cleaning responsibilities.
IV -

illv' v
TABLE 6 - COMBINED SEWER AND CATCH BASIN PREVENTIVE MAINTENANC~UIPMENT AND MA~PQWER
AND ESTIMATED COSTS
REQUIRED ITEMS ESTIMATED COSTS
Purcnase/Repair ~M_!_R* Payroll**
Materials:
Equipment:
Hydraulic jet and vacuum truck (new)
Sewer roddi1g machine (existing)
Air compressor
Outside Services by Contract:
Personnel:
$125,000
0
10,000
$5,000/Yr.
$30,000/Yr.
2,500/Yr.
2,000/Yr.
$30,000/Yr.
1 - Collection System supervisor *** (promotion) $5,000/Yr. Operator *** 0 a.. -
2 - Laborers/Truck Drivers 44,000/Yr. 1 Secretary (part-time) -~- _:1 ~
---·--··-TOTAL COST $135,000 $69,500/Yr.
* Annual Operation, Maintenance and Replacement Costs ** Payroll CJsts Include Fringe Benefits *** Personnel Transferred from other City Positions
IV.4 SURFACE INFLOW CONTAMINATION CONTROL
10,000/Yr.
$59,000/Yr.
Of the varous sources of pollution in urban stormwater ru~off, as listed in Section III.1 of this report, only the spilled chemicals and contaminated residues in industrial areas appear to be controllable. The Section III.3 Industrial Area Surface Drainage portion of this report contains the field survey details in this regard. Based on these details only two potential surface drainage contamination problems exist in LaPorte and neither situation involves drainage into LaPorte's combined sewer system.
IV.5 SURFACE INFLOW RATE CONTROL
This alternative would involve the temporary retention of surface runoff flow on the ground and street surfaces by "throttling" the catch basins. Fortunately this alternative is not necessary in LaPorte as the City's combined sewers are of adequate capacity and any sewer flow rates in excess of the treatment plant capacity enter the retention pond and are thus delayed prior to overflowing into Travis Ditch.
IV - 2

.. I J
J
J
J
J l l J
j
J
J
J ...
I
J
J
J
' i ..
It ord sew the per LaP per sew in
IV.
Exi sys III (Ot pos in
l~f
1 • I
2. I
3.
hould be mentioned that the revisions to the LaPorte City sewer use nance include that ''new construction tributary to the combined r (system) be designed to minimize or delay inflow contribution to existing combined sewer (system)". Also, the typical drywell or olation trench methods of handling the parking lot drainage in rte provides inflow minimization and delay when the drywalls or olation trenches have overflow connections to the city combined r systems. Therefore, surface inflow rate control already exists aPorte and will continue to in the future.
SURFACE INFLOW ELIMINATION
ting sources of surface inflow into the LaPorte combined sewer em were discussed in the following report sections; 3(Industrial Areas), III.4 (Parking Lots), 111.5 (Roofs) and III.6 er). Based on the information presented in these sections, the ible elimination of existing surface inflow sources are considered able 7, which follows:
TABLE 7 - POSSIBLE ELIMINATION OF EXI§IING SUREACE _ _INFLOW_§QU~CES
ow__~ATEGQRY.
Roof Areas owmet onnie Baking
dustries: Parking Areas oise Cascade onnie Baking
nicipal & Commercial rking Lots: Parking Areas anners-Family Dollar aPorte H.S.-East Lot
ernacchi's Farm Market aple Lane Mall
Disconnect roof drains from the combined sewer system and discharge into available ground area
Disconnect the catch basins from the combined sewer system and replace with drywalls.
Disconnect the catch basins from the combined sewer system and replace with drywalls.
Revise the "french drain" sewer connections to the 30" Andrew Ave. sewer from direct gravity flow type to overflow type to allow the "french drain" sewers to function and percolate mall drainage flow into the ground.
4. o her Drainage: .E. Corner of Golf Course
rivate Ponds East of Golf Course
IV - 3
Pump this drainage directly to Travis Ditch. Locate and plug these possible pond drainage connections to 48" combined sewer.

IV.7 COMBINED SEWER SYSTEM STORAGE OF WET WEATHER FLOWS
The storage of wet weather flows in the existing LaPorte combined sewer system would require modifications to the plant inlet junction structure bypass weir and the plant inlet flow control gates.
The inlet junction structure bypass weir would have to be raised a considerable height to accomplish wet weather flow storage in the plant inlet sewers. Presently, the top of this weir is only 1.25 ft. above the invert elevations of the 36", 48", and 60" plant inlet sewers and also is 1.1 ft. below the invert elevation of the 78'' plant inlet sewer. Based on these elevation differences and the slopes of the inlet sewers, the resulting flow storage volumes are estimated and presented in Table 8 for different weir raising heights.
W£;l_FLRAI1HNG HE I GHI _ _l_f_I~
1 . 0 2.0 3.0 * 4.0 * 5.0 *
J}.BLE ~-=--PLANT_INLET __ f:!YPA~~-W!;!fLRAI ~IN~ EFFECTS ON COMBINED SE~EFLfLOW __ ~TQRAG£;
RESUL_ll~~ _ COMBINEQ_SE~I;R _ _ELOkL~TQRAG!;
J§'~- 4~__:~ §Q" 7~_ ..
19,900 25,900 86,800 0 48,300 74,000 248,400 6,700 83,400 137,000 468,600 37,700
116,500 193,400 734,300 108,000 149,500 256,100 968,000 200' 1 00
YQUJM!;_(~~L}
TQTAL
132,600 377,400 726,700
1,152,200 1,573,700
*These weir raisings would require the walls and top slab of the plant inlet structure to be raised.
These estimated total combined sewer flow storage volumes are quite small when the following items are considered:
1. The estimated plant bypass retention pond volume of 16,000,000 gallons.
2. The estimate of 3,400,000 gallons of combined sewer storm water flow volume per inch of rain, from Figure 2 on page III-5.
IV - 4

In addition to the relatively small amount of storage volume 1n the plant inlet combined sewers, this procedure has these other disadvantages:
1. Solids deposition from flow stoppage or even backward flow during wet weather periods could result in regular sewer maintenance problems on one or more of these plant inlet sewer lines.
2. The plant influent junction structure bypass we1r would have to be raised with a reinforced metal weir at an estimated cost range of $3,000 - $30,000. If the bypass weir is raised more than 2 feet, the walls and top slab of the structure would have to be raised at an estimated cost of $65,000.
3. The plant influent gate would have to be automated to "throttle" the plant flow rate during periods of plant influent junction structure and plant inlet sewer surcharging, at an estimated cost of $25,000.
Finally, the plant bypass retention basin would still be required as flow storage in the plant inlet combined sewers would only store a portion of the flow from most rainfall events.
IV.8 MAXIMIZE WET WEATHER FLOW RATE THRU TREATMENT PLANT
The maximization of wet weather flow rates through the LaPorte wastewater treatment plant can involve; (1) an increased flow rate from the combined sewer system and/or (2) a return flow rate from the retention pond. Option (1) is presently possible if the plant inlet gate is left oper1. Option (2) is presently hindered because no t low return facilities exist and the treatability of the retention pond contents by the treatment plant is unknown. The retention pond treatability question involves the suspended algae in the pond water. Option (2) would also stop the retention pond from overflowing in dry-weather.
Option (1) Discussion:
The rated or design capacity of the LaPorte wastewater treatment plant is 7.0 mgd. The maximum effective pumping rate through the plant is 9 mgd. To date, the plant has operated satisfactorily during the periods when the flow rate was 9 mgd, however, these time periods have all beer relatively short in duration. Extended periods of high plant flow rates should be investigated to determine if these high plant flow rates will cause the plant effluent to deteriorate below N.P.D.E.S. permit requirements.
IV - 5

Only operating experience can determine the wet weather flow rate capacity for the LaPorte wastewater treatment plant. Existing plant operating records are unusable for this purpose as they indicate only average daily data. Therefore, a special plant sampling and testing program is required during extended high flow (7-9 mgd) periods at the LaPorte treatment plant to determine maximum wet weather flow rate for the plant. This program should include a time-sequence of grab samples and analysis for temperature, CBODs, TSS and NH3-N concentrations for the plant influent and effluent flows. This time sequence should reflect the flow time between plant influent and effluent.
These concentrations can then be compared to the corresponding plant flow rates. This data should be obtained from a sufficient number of high plant flow periods, in both warm and cold periods of the year, to allow accurate graphical determination of the maximum seasonal wet weather plant flow rates. This special plant sampling and testing program should be performed during al 1 prolonged rainfal 1 events that cause high combined sewer flow rates, as these events are usually infrequent.
Option (2) Discussion:
The return of flow from the bypass retention basin would require a pumping and piping system. This system would also require automation if the return f lovl rates are controlled by the treatabi 1 ity 1 imits of the return t lcm. This type of return flow system would be very expensive and is not necessary or cost-effective. Rather, a manually control led returr1 flow system, for the purpose of preventing the bypass r-etention basin fr~om overflowing in dry weather, would be sufficient. ll1is system could be small in capacity and even portable to accomplish its intended purpose.
IV.9 SEWER FLOW DETERMINATION AND BILLING FOR CUSTOMERS WITH LARGE INfLOW AS AN ALTERNATIVE TO ELIMINATION
The work presented in Sections III.3 and III.4 determined if any l2rge sources of surface drainage inflow are connected directly or indirectly to the LaPorte combined sewer system. The possible elimination of these large inflow sources was considered in Section IV.6. An alternative to elimination would be determination of inflow volume and the bi 11 ing for the same. Inflow volume could be determined by either (1) a sewer flow rneter or (2) the measured hard-surface runoff area multiplied by the official tlational Weather Service precipitation data collected at the LaPorte water plant. The bi 1 ling for this inflow volume would require a legal determination concerning the ability to charge only the lar~ge sources for inflow. It would be extremely difficult to implement a procedure to charge all sources for inflow.
IV - 6

IV .1 0 SURFACE DRAINAGE PONDING AREA SOLUTIONS
The causes of the temporary surface drainage ponding problems listed in Section II.4 of this report were investigated during wet weather flow events. The findings and recommendations are presented in Table 9 which follov1s.
PONDING AREA --- .. ---
"F" St. between 8th and 10th St.
Under R.R. viaduct on 1st St.
Brighton St. and Rush St.
6th St. West of "J" St.
Rockwood and Truesdell St.
Darlington St.
T~_BI,._L9 ___ =-~-V13f_ACE PRt\I_NAGE_EQN_D_l:NG _ _ARfA PB_QBL_EM_§__At·HL SOLl)_T I_QN
PROB!-EM __ PE;SQJUJ~TlO_N
Inadequate combined sewer capacity
Inadequate number of drainage inlets
Inadequate combined sewer capacity
No drainage inlets in 1 ow ar-ea
Inadequate combined se1ver capacity
No drainage inlets due to santiary sewer and lift station for this street
IV - 7
PHOBL.,.HL~QLL)TION
Connect 10" sewer on "F" St. with 12" sewer on "E" St. with new 12" sewer on 8th St. This will increase the present sewer draining capacity by apprcximately 260%.
Install additional drainage inlets and connect to 24" storm sewer
Provide a 10" relief sewer from this intersection manhole on the 10" sewer on Brighton St. to a manhole appoximately 110 feet south on Rush St., which is on another 1 0" sewer. This wi 11 increase the present sewer draining capacity by approximately 180%
New drywell appec:,rs to have solved problem but additional drywells should be added.
Disconnect all drainage inlets from 1 0" comb i nee: sewer and reconnect to 18" storm sev-1er
Provide drywells in the ponding areas.

PONDING AREA . - -- -----
Lincolnway East
Corvette Drive between "I" St. and Mustang Dr.
Monroe Manor West of Boyd Blvd.
Inadequate combined sewer capacity
Inadequate combined sewer capacity
Inadequate combined sewer capacity
IV - 8
PROBLEM SQLUT_I_QN
Extend storm sewer system on both sides of Lincolnway and disconnect existing surface drainage inlets from combined sewers and reconrect the inlets to the new storm sewers
Reconnect existirg catch basins to larger sewer on "I" Street.
Relieve the subdivision sewer system to the 60" combined sewer on Boyd Blvd.

V. SUMMARY, FINDINGS AND CONCLUSIONS AND RECOMMENDATIONS
The results of the Phase I and Phase II work are summarized and the necessary conclusions and recommendations are presented in this Section.
V.I. SUMMARY
This Combined Sewer Operation Plan (PLAN) for LaPorte, Indiana considered the following aspects of the City's combined sewer system:
1. Extent and layout of the system. 2. Retention and treatment provided for system flows. 3. Specific system problems. 4. Maintenance and control of the system. 5. Regulations governing the system. 6. Sources of pollution to the system. 7. Wet weather flow monitoring and sampling of the sys~em. 8. Industrial drainage into the system. 9. Business and commercial parking lot drainage into the system.
10. Roof drainage into the system. 11. Other drainage into the system.
This PLAN also considered the following alternatives for improving the LaPorte combined sewer system operation and maintenance:
1. Transfer these responsibilities from the City Stree~ Department to the City Sewage Department.
2. Provide additional equipment and personnel for this purpose.
3. Contamination and rate control and elimination of drainage into the system.
4. Additional storage and treatment ut system wet weather flows.
5. Monitoring and billing for storm water drainage into the system.
Based on the preceding work, findings and conclusions and recommendations have been made and are presented in the following sections.
v -

V.2. FINDINGS AND CONCLUSIONS
The City of LaPorte is sewered primarily by combined sewers. This situation is expected to continue in the future due to the lack of natural drainage in the City. Future additions to the LaPorte sewer system wi 11 probably include percolation and retention of storm water drainage and possibly controlled rate discharge into the existing combined sewer system. Other findings and conclusions from the PLAN are:
1. The capacity of the combined sewer system in LaPorte is adequate for the present size of the City except in a few isolated areas.
2. The majority of the industrial and parking areas in LaPorte are not connected to the City's combined sewer system. The areas that are connected are not overloading the system.
3. If additional combined sewer capacity is ever needed in LaPorte, the removal of connected industrial and par~ing areas, as indicated in Table 7 on page IV-3 and roof drains could be considered as an alternative to constructin3 additional sewers.
4. Roof drainage into the LaPorte combined sewer system can rema1n as long as the sewer capacity is adequate.
5. No points of contamination of surface drainage into the LaPorte combined sewer system presently exist.
6. Rate control of drainage into the LaPorte combined sewer system presently exists where necessary.
7·. The existing LaPorte wastewater treatment p 1 ant bypass retention pond is the most effective means of retaining combined sewer system wet weather flows.
8. The increase of flow through the LaPorte wastewater treatment plant is the most cost-effective method of maxi~izing the treatment of combined sewer system wet weather flows. The return of flow from the bypass retention basin f:Jr treatment is also necessary, to prevent the basin fr:Jm overflowing in dry weather.
9. The other sources of drainage into the LaPorte combined sewer system which were discovered during this work are of long-term duration. One of these sources is city property, Beechwood Golf Course and no other means of draining this area is available. The other area is a private pond whose overflow is suspected to be connected to the 48" combined sewer at the east edge of the golf course.
v - 2

10. Additional equipment and personnel are required for maintenance of the LaPorte combined sewer system.
11. The City of LaPorte has adequate legal authority to regulate their combined sewer system.
12. Wet weather flow and rainfall monitoring has determined that the LaPorte combined sewer flows respond to rainfal 1 rates and amounts as follows:
Total Combined Sewer Storm Flow Rate = 25 MGD/IN/HR of rainfal 1 intensity for up to .25 IN/HR and 200 MGD/IN/HR for above . 3 IN/HR
Total Combined Sewer Storm Flow Volume= 3,400,000 gallons/inch of rain
Furthermore, these storm flows are distributed between the four combined sewers er1tering the LaPorte wastewater treatment plant as follows: 36" sev-Jer - 8%, 48" sewer - 23%, 60" sewer - 6%, and 78" sewer - 63%.
13. The concentr-ation time of storm water flow at the LaFJorte wastewater treatment plant is one hour, i.e., one hour after it starts to rain in LaPorte, the treatment plant flows start to increase as a result.
14. The strength of combined sewer wet weather flows in l_aPorte is significant, especially concerning suspended solids.
15. The monitor-ing and billing of only the large contributor-s of storm water to the LaPorte combined sewer system is not equitable, regardless of its legality.
V.3 RECOMMENDATIONS
Based on the findings and conclusions of the PLAN, the following recommendations are made in order of declining priority:
1. Transfer· Lhe operation and maintenance responsibi 1 ities of the combined sewer system and catch basins from the City Street Department to the City Sewage Department.
2. Provide the additional equipment and personnel for system operation and maintenance as presented in Table 6 on Page IV-2, as funds become available.
v - 3

3. Determine the maxi mum wet weather f 1 ow rate through tl1e wastewater treatment plant as outlined under Optiot1 l1) in Section IV.7 on pages IV-5 and 6.
4. Provide a manually controlled portable pumping and piping system to return flow from the bypass retention basin for treatment, as necessary, to prevent the basin from overflowing in dry weather.
5. Investigate the suspected private pond connection to the combined sewer at the east edge of Beechwood Gol-F Course. If verified, either eliminate this connection or establish a metering and billing procedure with the pond owner for the treatment of this water.
6. Implement the solutions to the existing surface drainage ponding areas contained in Table 9 on pages IV-7 and 8, based on cost-to-benefit determinations.
v - 4

VI. IMPLEMENTATION SCHEDULE FOR RECOMMENDATIONS
At1 implementation schedule for the PLAN recommendations shal 1 be completed within one year, if possible, following State approval of the PLAN. Sc1me of the PLAN recommendations can procePd priar to State approv~l and other should be subject to State approval. A suggested implementation schedule for the PLAN recommend at i :ms is pr-esented <1s fo I lows:
DATE
November, 1989
December 1 • 1 ~J.S(]
May 1, 1990
August 1, 1990
1. Review and revise the PLAN as necessary.
1. Approve the PLAN and submit it for State approva 1 .
2. Begin legal and administrative procedures to implement PLAN recommendation No. 1.
3. Begin financial budgeting for PLAN recommendation No. 2.
4. Begin the PLAN recommendation No. 3 investigation.
5. Begin the cost-to-benefit ratio detr:Jrminations of PLAN recommendation No. 6.
1. Estimated date for State approval of the PLAN.
2. Camp l ete PLAN recomrnendat ion t~o. 1 . 3. Begin purchasing the equipment and hiring
the personnel for PLAN recommendation No. 2, as funds become available.
4. Implement PLAN recommendation No. 4.
1. Conduct the PLAN recommendation No. 5 investigation and begin any necessa~y follow-up procedures.
1. Complete the cost-to-benefit determinations of PLAN recommendation No. 6 and begin implementation as funds become available.
2. Complete any necessary follow-up procedures regarding PLAN recommendation No. 5.
3. Complete the PLAN recommendation No. 3 investigation and begin treating combined sewer wet weather flows at the maximum rate determined by this investigation.
VI -

-J
J ·~
I ...
I ..
J
J
l ..
l .J
J
l .;
J
J
J
]
Ma 1, 1991
June 1, 1991
1. Continue implementing PLAN recommendation No. 2 as funds become available.
2. Continue implementing PLAN recommendation No. 5 as funds become available .
1. Submit implementation status report to IDEM.
VI - 2

ADDENDUM NO. 1 December, 1992
Prepared By: Haas & Associates Consulting Engineers Michigan City, Indiana For
LA PORTE, INDIANA COMBINED SEWER SYSTEM OPERATIONAL PLAN
October, 1989

ADDENDUM NO. 1 Dece;:nber, 1992
LaPORTE, INDIANA COMBINED SEWER SYSTEM OPERATIONAL PLAN
October, 1989
I. INTRODUCTION
This Addendum No. 1 is in response to a June 19, 1992 letter from the Indiana Department of Environmental Management (IDEM) as a result of their review of the LaPorte, Indiana Combined Sewer System Operational Plan (PLAN). A copy of IDEM'S letter is included at the end of this addendum as Attachment No. 1.
II. FORMAT
The information presented in this Addendum is arranged as a response to each item in IDEM'S letter.
III. RESPONSE TO IDEM COMMENTS
IliA. - Comment Item I.F The referenced catch basin information is presently being obtained. It is hereby proposed that this work be completed during the 15 month implementation and report period for the PLA~, follo\.,ring IDEM approval. This information can be submitted with Lhe required project status report, following the 15 month implementation and report period.
IIIB. - Comment Item I.C As-built details of the LaPorte wastewater treatment plant influent structure and CSO weir and flow channel are included at the end of this addendum on Attachment No. 2. As-built details of the LaPorte wastewater treatment plant CSO retention pond spillway are included at the end of this addendum on Attachment No. 3.
IIIC. - Comment I.E CSO retention basin water level is controlled by the spillway elevation which is approximately 4. 7 feet lower in elevation than the CSO weir in the plant influent structure. Therefore, backflow from the retention basin is not possible.
IIID. -Comments I.H.I and I.K The LaPorte wastewater treatment plant flows and performance have been analyzed for the entire year of 1991, for the purpose of determining the maximum wet weather flow rate through the plant. This determination is based on the prell'ises that the maximum plant flow rate shall not; (1) cause a violation of the plant's N.P.D.E.S. permit effluent limits, (2) cause physical damage to the plant, (3) have a prolonged negative effect on any plant processes and (4) require significant improvements to the plant. Each of these premise items is considered as follows: (l) NPDES permit violations for the LaPorte wastewater treat
ment plant are on an average monthly or weekly basis and not on a daily basis. Therefore, reductions in plant
-1-

effluent quality due to maximum wet weather flow rates will not result in permit violations unless the reduced plant effluent quality is extreme or prolonged enough to effect the plant effluent quality weekly average. Any resulting effect on the plant monthly average effluent quality is considered to be insignificant.
Weekly average limits in the LaPorte N.P.D.E.S. permit include CBOD, TSS and NH3-·N, both for winter and summer conditions. As a result, LaPorte wastewater treatment plant data for 1991 was analyzed for each day in which a plant CSO occurred. The graphical representation of this data is presented on the following attachments at the end of this addendum:
Attachment No. 4 - Daily Plant Flow vs. Plant Effluent CBOD Attachment No. 5 - Daily Plant Flow vs. Plant Effluent TSS Attachment No. 6 - Daily Plant Flow vs. Plant Effluent NH3-N
The data presented on each attachment indicate summer and winter ranges and trends which when visually extended verify the plant's maximum rated capacity of 9-9.5 mgd. The attachments indicate that the plant's N.P.D.E.S. permit summer effluent limits for TSS will begin to be exceeded at this maximum design flow rate. However, as previously discussed, these short-term periods of plant effluent degradation should not result in weekly or monthly N.P.D.E.S. permit effluent limit violations. ~herefore, other procedures must be used to determine the maximum wet weather flow capacity of the LaPorte wastewater treatment plant.
(2),(3)&(4) Due to the fixed growth type of bacteria in the LaPorte wastewater treatment plant, biological solids washout from high wet weather flows is not a problem. However, high flows can cause these other problems if the stated capacities are exceeded: (1) screenings being forced thru the inlet bar screen due to excessive flow velocities, maximum apparent capacity= 17 mgd, (2) flow meter range, maximum apparent capacity = 15 mgd, (3) grit carrythru the grit channels, due to excessive flow velocities, maximum apparent capacity = 12 mgd, (4) inadequate solids removal in the primary settling tanks due to excessive flow volumes, maximum apparent capacity
*with some = 12 mgdf (5) flooding of the trickling filters or inadequate improvements treatment due to excessive flow volumes; rotary trickling
filter rate= 5 mgd with one pump on and 7.5 mgd with two pumps on; fixed nozzle trickling filter rate = 4.5 mgd with two pumps on, (6) inadequate solids removal in the intermediate settling tanks due to excessive flow volumes, maximum apparent capacity = 9.5 mgd, (7) inadequate nitrification in biotowers due to excessive flow volumes; biotower rate =
14.1 mgd with 3 pumps on, (8) inadequate disinfection of pla~t effluent due to inadequate chlorine contact time, maximum apparent capacity = 9.5 mgd.
Based on the preceding consideration of the LaPorte wastewater treatment plant unit capacities, the maximum wet weather flow rate thru the plant should be 9.5 mgd as limited by the
intermediate clarifiers and chlorine contact tank and possibly the rotary trickling filter. The abilities of the rotary trickling filter distributor and media and the intermediate clarifiers to handle the additional flow with both influent pumps on are presently being determined.
-?-

liiE. - Comment I.N A list of all significant industrial dischargers to the LaPorte combined sewer system, a description of their wastewater parameter limits and any pretreatment facilities and a summation of the monitoring data on their discharges are provided on Attachment No. 7 at the end of this addendum. All industries and other sewer system dischargers in LaPorte are upstream of the CSO, which is located at the wastewater treatment plant.
IIIF. - Comment II A combined sewer maintenance schedule is provided on Attachment No. 8 at the end of this addendum.
IIIG. - Comment III.A A street and catch basin cleaning schedule is provided on Attachment No. 9 at the end of this addendum. The locations and details of the catch basins on the LaPorte combined sewer system are currently being determined by City forces as they clean and repair the catch basins. As proposed in Item IliA of this Addendum, the location of all catch ~asins will be determined during the 15 month implement/report period for the PLAN and will be submitted with the project status report, following the 15 month implement/report period.
IIIH. - Comment IV.H A study of the LaPorte wastewater treatment plant bypass (CSO) retention basin has been mandated by the enforcement section of IDEM and is presently in progres3. This study includes the investigation of return pumping from the ret.ention basin thru the treatment plant. Therefore, this comment will be answered as part of this other study.
III.I. -Comment V.B As mentioned in Section III.D, the units of the LaPorte wastewater treatment plant that limit the maximum wet weather flow rate thru the plant to 9.5 mgd are the intermediate clarifiers, the chlorine contact tank and possibly the trickling filters. If it is determined that the rotary trickling filter can handle and effectively treat the flow with both influent feed pumps on and the intermediate clarifiers remain effective at the resulting increased plant flow rate, a wet weather plant flow rate of 12 mgd would be possible, if the chlorine contact tank is still effective. The limiting treatment plant units at a wet ~eather flow capacity of 12 mgd would then be the grit channels and primary clarifiers.
The preceding analysis of the capacities of the various units at the LaPorte wastewater treatment plant concurs with the projected plant effluent quality at higher plant flow rates, from Attachments ~o. 4, 5 and 6.
These attachments were based on plant operating data for 1991. It must be realized that the average plant flow rate in 1991 was 5.8 mgd or 83% of the average plant flow design capacity of 7.0 mgd. Also, the average plant influent CBOD and TSS
-3-

loads in 1991 were approximately 35% of the plant design loads. Therefore, the maximum plant wet weather flow rate may have to be reduced in the future, as the average plant influent loadings increase. Nevertheless, at the present time, a wet weather maximum flow rate of 12 mgd appears possible at the LaPorte wastewater treatment plant, subject to verification and modification by actual plant experience during the 15 month PLAN implementation and status report period.
If it is determined that the wet weather flow capacity of the LaPorte wastewater treatment plant can be increased significantly, such as to 12 mgd, the following additional improvements will have to be made at the plant:
1. Raise the CSO weir in the plant influent structure approximately 1.5 feet in elevation.
2. Automate the sluice gate on the inlet to the plant bar screen structure with control by plant inlet flow rate.
3. Increase the speed of the plant inlet bar screen for faster cleaning.
4. Improve the grit channels to provide effective removal at the high flow rate.
5. Automate the second rotary trickling filter feed pump with control by plant inlet flow rate.
IIIJ. - Comment VI.B,C The LaPorte wastewater facilities, including the combined sewer system, do not serve any other community.
-4-
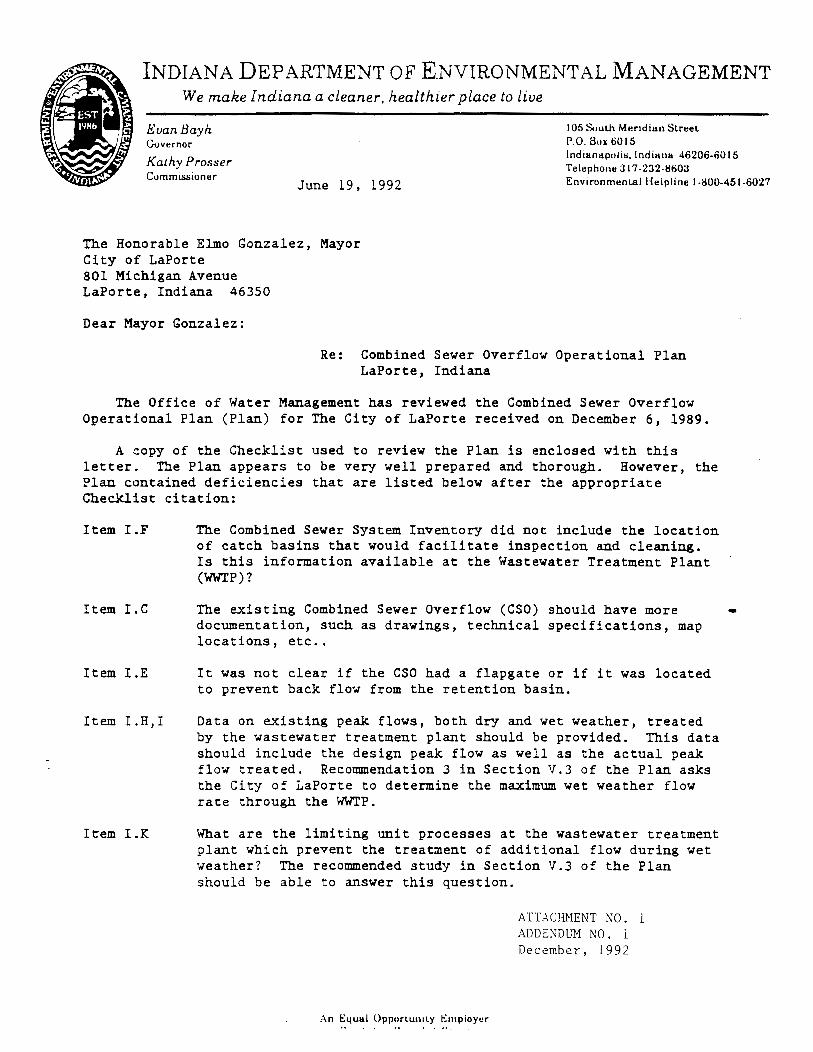
INDIANA DEPARTMENT OF E.NVIRONMENTAL MANAGEMENT We make Indiana a cleaner, healthier place to live
EuanBayh Gtlvernor
l 05 Suulh Meridian Slreel P.O. Bur. 6015
Kathy Prosser Commisswner
June 19, 1992
Indianapolis. Indiana 46206-6015 Telephone 317 -232-Mti03 Environment.allielpline 1-H00-451-6027
The Honorable Elmo Gonzalez, Mayor City of LaPorte 801 Michigan Avenue LaPorte, Indiana 46350
Dear Mayor Gonzalez:
Re: Combined Sewer Overflow Operational Plan LaPorte, Indiana
The Office of Water Management has reviewed the Combined Sewer Overflow Operational Plan (Plan) for The City of LaPorte received on December 6, 1989.
A copy of the Checklist used to review the Plan is enclosed with this letter. The Plan appears to be very well prepared and thorough. However, the Plan contained deficiencies that are listed below after the appropriate Checklist citation:
Item I .F
Item I. C
Item I.E
Item I .H, I
Item I .K
The Combined Sewer System Inventory did not include the location of catch basins that would facilitate inspection and cleaning. Is this information available at the Wastewater Treatment Plant (WWTP)?
The existing Combined Sewer Overflow (CSO) should have more documentation, such as drawings, technical specifications, map locations, etc ..
It was not clear if the CSO had a flapgate or if it was located to prevent back flow from the retention basin.
Data on existing peak flows, both dry and wet weather, treated by the wastewater treatment plant should be provided. This data should include the design peak flow as well as the actual peak flow treated. Recommendation 3 in Section V.3 of the Plan asks the City of LaPorte to determine the maximum wet weather flow rate through the WWTP.
What are the limiting unit processes at the wastewater treatment plant which prevent the treat~ent of additional flow during wet weather? The recommended study in Section V.3 of the Plan should be able to answer this question.
An ~qual OppurtumLy ~~mpioyer
ATTACHMENT NO. 1 ADDE:.:DUM NO. 1 December, 1992
•

The Honorable Elmo Gonzalez, Mayor Page 2
Item I.N
Item II
Item III .A
Direct up-pipe industrial dischargers should be identified in the Plan. It is important to know if industrial toxics will be directly discharged to the receiving stream from industrial processes. A list of all direct dischargers to the combined sewer system (CSS) and if pretreatment is provided (Item III.B) will satisfy this requirement. Tables 4 and 5 in the Plan only list industries that may have a surface water drainage to the css.
Item II of the Checklist refers to schedules for implementation of various sewer maintenance tasks. These schedules should be included in the Plan and should be sufficiently detailed such that new employees could properly maintain the system. Specific schedules for the inspection of combined sewers (Item II.A), overflows (Item II.B) and flapgates (Item II.C), along with schedules for sewer televising (if performed routinely) (Item II.D) and combined sewer cleaning and flushing (Item II.E) should be included in the Plan.
A schedule for street, catch basin and regulator cleaning should be included in the Plan. If done often enough, this can reduce the loading to the wastewater treatment plant. The schedule should identify areas that might contribute excessive loadings, such as industrial areas. These areas should be cleaned more often.
Item IV.H The use of a manually controlled portable pumping and piping system to return combined sewer overflow from the bypass retention basin to the WWTP(as recommended in Section V.3.4 of the Plan) appears to be a cost-effective mechanism to prevent dry weather discharges and to treat additional wet weather discharges. If implemented, would this eliminate all dry and wet weather discharges?
Item V.B Can operatfons of any of the wastewater treatment plant unit processes be modified to process more flow?
Item VI.B, C Does LaPorte provide combined sewer service for other communities? If so, the sewer use contracts should be in place and enforced. The regionalized communities served by LaPorte should have equivalent sewer use ordinances.
Please submit a revised Plan to the Office of Water Management within 120 days of the date of this letter. If you have any questions, you may contact Mr. Terry F. Gray, at 317/232-8739.
Enclosure: Checklist
Sincerely,
Lonnie Brumfield, Permits Section Office of Water Management
ATTACHMENT ;\0. 1 ADDENDUM NO. l December, 1992

LISTING AND DESCRIPTION
OF
15 SIGNIFIC&~T INDUSTRIAL DISCHARGERS
INTO
COMBINED SEWER SYSTE~
LaPorte, Indiana
l'~OTES: (1) Industries are listed in alphabetical order
ATTACHMENT NO. 7 ADDENDUM NO. 1 December, 1992
(2) Only the industries in LaPorte which discharge process wastewater into the citv sewer system are listed herein.

CITY OF LA PORTE INDUSTRIAL PRETREATMENT
Company Name: ALPHA BAKING CO. Address: 360 NORTH FAIL ROAD ST.: INDIANA ZIP: 46350 Company Representative: DICK BROWN Products Produced Or Service Preformed: BREAD AND BUNS
Pretreatment Process: GREASE REMOVAL
Time of Operation: VARIABLE Shifts: 3 :tl= Employees: 20
Classification: BAKERY Permit :tl=: 11
Typical Monthly
Daily Flow (gpd): 30,528 Average Flow (gallons): 915,833
Accountil: MOl 04140-01 Accounti2: Accounti3:
Discharge Parameters BOD5 TSS OIL&GREASE(T) PH
Daily Parameter Limits : MG/L BOD5 300 TSS 300 OIL&GREASE(T) 100 PH 6-9 S.U.
Average Parameter Discharge : MG/L
BOD5 390.4 TSS 118.1 OIL&GREASE(T) 29 PH 8.016
Information OIL & GREASE (T) - TOTAL OIL & GREASE
(1)

CITY OF LA PORTE INDUSTRIAL PRETREATMENT
Company Name: AMERICAN METAL PRODUCTS Address: 105 KOOMLER DRIVE ST. : INDIANA
(OWNER) ZIP: 46350
Company Representative: DAVID CHRISTIAN Products Produced Or Service Preformed: CASKET HARDWARE
Pretreatment Process: CYANIDE DISTRUCTION; METAL REMOVAL; PH ADJUSTMENT
Time of Operation: 6AM - llPM Shifts: 2 # Employees:
Classification: METAL FINISHER Permit =#:: 5 Account#l: MOl Account#2: MOl Account:#=3:
Typical Daily Flow (gpd): 70,111 Monthly Average Flow (gallons): 2,103,332
CADMIUM NICKEL ZINC 'ITO
CADMIUM .69 NICKEL 3.98 ZINC 2.61 'ITO 2.13
CADMIUM < .005 NICKEL .3797 ZINC .088 'ITO
Discharge Parameters CHROMIUM COPPER SILVER CYANIDE (T) TSS : OIL&GREASE(HC)
Daily Parameter CHROMIUM 2.77 SILVER .3 TSS 300
Limits : MG/L COPPER 3.0 CYANIDE (T) 1.1 OIL&GREASE(HC) 50
Average Parameter Discharge : MG/L
CHROMIUM .0162 SILVER .0049 TSS <.05
COPPER 2.4622 CYANIDE (T) 2.38 OIL&GREASE (HC)2
Information CYANIDE (T) - TOTAL CYANIDE CYANIDE (A) - CYANIDE AMENDABLE TO CHLORINE
(2)
04461-00 04460-00
LEAD CYANIDE (A) PH
LEAD .69 CYANIDE (A) .86 PH 6-9 S.U.
LEAD <.0014 CYANIDE (A) . 06 PH 7.596

CITY OF LA PORTE INDUSTRIAL PRETREATMENT
Company Name: AMERICAN NATIONAL CAN Address: 300 FAIL ROAD ST.: INDIANA ZIP: 46350 Company Representative: Products Produced Or Service Preformed: TIN CAN MANUFACTURING
Pretreatment Process: METALS REMOVAL; PH ADJUSTMENT; SOLIDS REMOVAL
Time of Operation: 24 HRS. Shifts: 3 #Employees:
Classification: COIL COATING:SUB-D CANMAKING Permit #: 3
Typical Daily Flow (gpd): 37,200 Account#1: MOl 04170-00 Account#2:
Monthly Average Flow (gallons): 1,116,000 Account#3:
CHROMIUM PHOSPHORUS
CHROMIUM 36.92 PHOSPHORUS 1401
CHROMIUM .0233 PHOSPHORUS 1.3084
Discharge Parameters COPPER ZINC MANGANESE OIL&GREASE(HC) ITO
Daily Parameter COPPER 159.41 MANGANESE 57.05 ITO 26.85
Limits : MG/M CANS ZINC 122.49 OIL&GREASE(HC) 50
Average Parameter Discharge : MG/L
COPPER .0071 MANGANESE .0134 ITO
ZINC .0222 OIL&GREASE(HC)3.2
Information OIL & GREASE (HC) • HYDROCARBON FRACTION
(3)
FLOUR IDE PH
FLOURIDE 4992 PH 6-9 S.U.
FLOURIDE .9398 PH 8.167

CITY OF LA PORTE INDUSTRIAL PRETREATMENT
Company Name: DRESKE SILVER PLATING Address: 702 RIDGEWAY ST.: INDIANA ZIP: 46350 Company Representative: DAVID CLAEYS Products Produced Or Service Preformed: REFINISHING METAL
Pretreatment Process: RINSE TANKS;
Time of Operation: SAM - 5PM Shifts: 1 # Employees: 2
Classification: ELECTROPLATING PRECIOUS METALS Permit #: 10
Typical Daily Flow (gpd): 127 Account#l: C26 01810-00 Account#2:
Monthly Average Flow (gallons): 3,800 Discharge Parameters
CYANIDE(A).6597 CADMIUM .0014 LEAD PH 7.89 TTO
Account#3:
.0198
Daily Parameter Limits : MG/L CYANIDE(A) 2.7 PH 6-9 S.U.
CYANIDE(A) .6597 PH 7.89
CADMIUM .7 LEAD .4 TTO 4.5
Average Parameter Discharge : MG/L
CADMIUM .0014 TTO
LEAD .0198
Information CYANIDE (A) - CYANIDE AMENDABLE TO CHLORINE
(4)
SILVER .0958
SILVER .3
SILVER .0958

CITY OF LA PORTE INDUSTRIAL PRETREATMENT
Company Name: HARRISON ENGINE SERVICE Address: 301 DETROIT STREET ST.: INDIANA ZIP: 46350 Company Representative: MR.MATHIS Products Produced Or Service Preformed: REPAIR AIRCRAFT ENGINES
Pretreatment Process: OIL REMOVAL; CLOSED PLATING SYSTEM
Time of Operation: 7AM - 11PM Shifts: 2 # Employees: 20
Classification: METAL FINISHER Permit #: 9
Typical Daily Flow (gpd): 127 Account#l: MOl 0288-00 Account#2:
Monthly Average Flow (gallons): 3,800 Account:i3:
CADMIUM NICKEL OIL&GREASE(HC)
CADMIUM .69 NICKEL 3.98 OIL&GREASE(HC)50
CADMIUM .0041 NICKEL .006 OIL&GREASE(HC) 2
Discharge Parameters CHROMIUM COPPER SILVER ZINC TSS : PH
Daily Parameter CHROMIUM 2.77 SILVER .43 TSS 300
Limits : MG/L COPPER 3.38 ZINC 2.61 PH 6-9 S.U
Average Parameter Discharge : MG/L
CHROMIUM .0845 SILVER .0009 TSS 2.0
COPPER .1229 ZINC .1470 PH 7.834
Information OIL & GREASE (HC) - HYDROCARBON FRACTION
(5)
LEAD CYANIDE TTO
LEAD .69 CYANIDE 1.1 TTO 2.13
LEAD .0355 CYANIDE .0021 TTO

CITY OF LA PORTE INDUSTRIAL PRETREATMENT
Company Name: HOWMET LAPORTE CASTING Address: 1110 EAST LINCOLNWAY ST.: INDIANA ZIP: 46350 Company Representative: MURRAL MILLER Products Produced Or Service Preformed: JET ENGINE TURBINES
Pretreatment Process: SOILDS REMOVAL; SILVER RECOVERY; PH ADJUSTMENT
Time of Operation: 7AM - 3PM Shifts: 1 =II= Employees: 625
Classification: METAL MOLDING CASTING POINT Permit =II=: 6
Typical Daily Flow (gpd): 70,400 Account=ll=l: MOl 04100-00 Account=ll=2:
Monthly Average Flow (gallons): 2,112,000 Account=ll=3:
CHROMIUM SILVER 'ITO
CHROMIUM 24 MG/L SILVER .3 MG/L TTO 13.2
CHROMIUM .0016 SILVER .0474 'ITO
Discharge Parameters COPPER LEAD ZINC OIL&GREASE(HC)
Daily Parameter Limits : KG/MKG COPPER 3.19 LEAD 5.84 ZINC 10.8 OIL&GREASE(HC)330
Average Parameter Discharge : KG/MKG
COPPER .2774 ZINC .5363
LEAD .0294 OIL&GREASE(HC)7.0
Information OIL & GREASE (HC) - HYDROCARBON FRACTION
(6)
NICKEL PH
NICKEL lO.MG/L PH 6-9 S.U.
NICKEL 1.238 PH 7.595
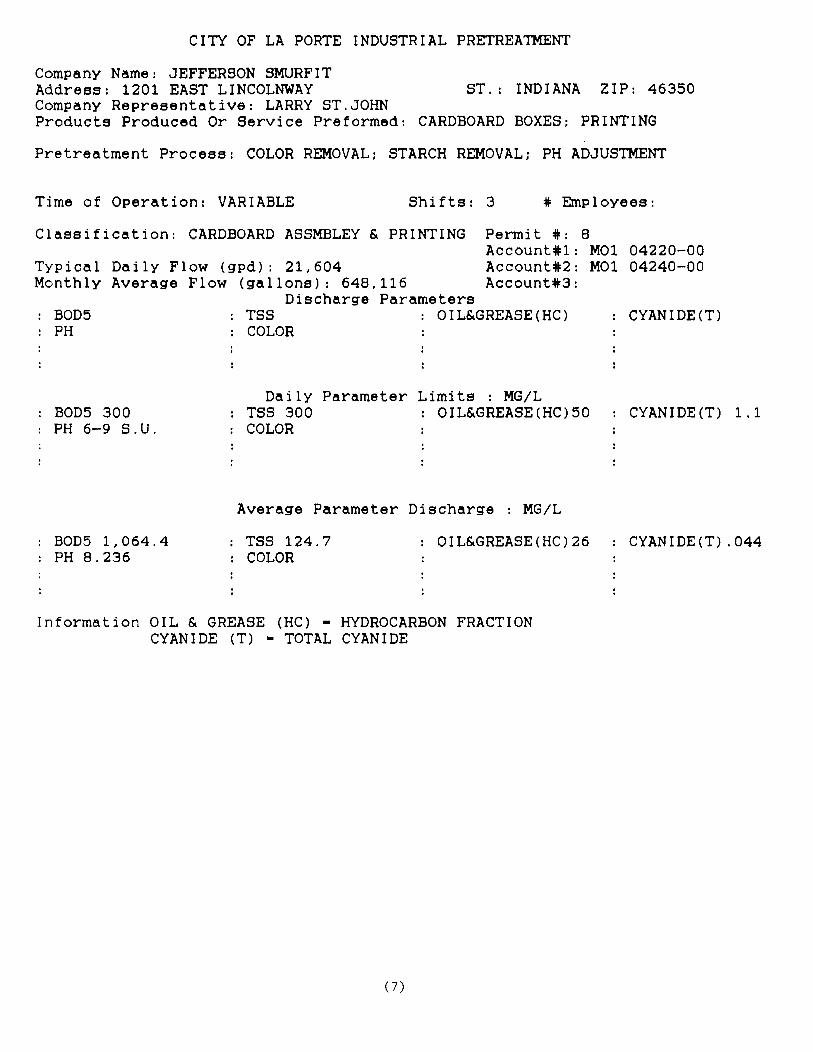
CITY OF LA PORTE INDUSTRIAL PRETREATMENT
Company Name: JEFFERSON SMURFIT Address: 1201 EAST LINCOLNWAY ST.: INDIANA ZIP: 463SO Company Representative: LARRY ST.JOHN Products Produced Or Service Preformed: CARDBOARD BOXES: PRINTING
Pretreatment Process: COLOR REMOVAL: STARCH REMOVAL: PH ADJUSTMENT
Time of Operation: VARIABLE Shifts: 3 i Employees:
Classification: CARDBOARD ASSMBLEY & PRINTING Permit i: 8 Accountil: MOl 04220-00
Typical Daily Flow (gpd): 21,604 Accounti2: MOl 04240-00 Monthly Average Flow (gallons): 648,116 Accounti3:
Discharge Parameters BODS TSS OIL&GREASE(HC) CYANIDE(T) PH COLOR
BODS 300 PH 6-9 S.U.
BODS 1,064.4 PH 8.236
Daily Parameter Limits : MG/L TSS 300 OIL&GREASE(HC)50 COLOR
Average Parameter Discharge : MG/L
TSS 124.7 COLOR
OIL&GREASE(HC)26
Information OIL & GREASE (HC) • HYDROCARBON FRACTION CYANIDE (T) • TOTAL CYANIDE
(7)
CYANIDE(T) 1.1
CYANIDE(T) .044

CITY OF LA PORTE INDUSTRIAL PRETREATMENT
Company Name: KEYSTONE SERVICE INC. Address: 1500 GENESIS DRIVE ST.: INDIANA ZIP: 46350 Company Representative: MARV MITCHELL Products Produced Or Service Preformed: CHROME PLATING SHAFTS
Pretreatment Process: NONE
Time of Operation: VARIABLE Shifts: 2 # Employees: 30
Classification: METAL FINISHER Permit #: 14
Typical Daily Flow (gpd): 3,857 Monthly Average Flow (gallons): 115,716
Account#l: MOl 04517-00 Account#2:
CADMIUM NICKEL MERCURY TTO
CADMIUM .11 NICKEL 3.98 MERCURY .15 TTO 2.13
CADMIUM .0013 NICKEL .0143 MERCURY TTO
Accountf:3: Discharge Parameters
CHROMIUM COPPER SILVER ZINC SELENIUM : CYANIDE(T)
Daily Parameter CHROMIUM 2.77 SILVER .43 SELENIUM .2
Limits : MG/L COPPER 3.0 ZINC 2.61 CYANIDE(T) 1.1
Average Parameter Discharge : MG/L
CHROMIUM .0393 SILVER .0016 SELENIUM
COPPER .3528 ZINC .1995 CYANIDE(T) .0074
Information CYANIDE (T) - TOTAL CYANIDE
(8)
LEAD ARSENIC PH
LEAD .69 ARSENIC 1.8 PH 6-9 S.U.
LEAD .0125 ARSENIC PH 8.346

CITY OF LA PORTE INDUSTRIAL PRETREATMENT
Company Name: LAPORTE PUBLISHING (HERALD ARGUS) Address: 701 STATE STREET ST.: INDIANA ZIP: 46350 Company Representative: Products Produced Or Service Preformed: LOCAL NEWS PAPER
Pretreatment Process: SILVER RECOVERY
Time of Operation: 6AM - 5PM Shifts: 1 i Employees:
Classification: NEWS PRINT
Typical Daily Flow (gpd): 1,039 Monthly Average Flow (gallons): 31,166
Discharge Parameters SILVER
Daily Parameter Limits SILVER .3
Permit i: 2 Accountil: MOl Accounti2: Accounti3:
MG/L
Average Parameter Discharge MG/L
SILVER
Information
(9)
02430-00

CITY OF LA PORTE INDUSTRIAL PRETREATMENT
Company Name: LEWIS BAKING CO. Address: 800 BOYD BLVD. ST.: INDIANA ZIP: 463SO Company Representative: GEORGE MITCHEM Products Produced Or Service Preformed: BREAD AND BUNS
Pretreatment Process: OIL & GREASE REMOVAL; STARCH REMOVAL; PH ADJUSTMENT
Time of Operation: VARIABLE Shifts: 3 :11: Employees:
Classification: BAKERY Permit :11:: 7
Typical Daily Flow (gpd): 9,639 Monthly Average Flow (gallons): 289,166
Accountil: MOl 04100-00 Accounti2: Accountt3:
Discharge Parameters BODS TSS OIL&GREASE(T) PH
Daily Parameter Limits : MG/L BODS 300 TSS 300 OIL&GREASE(T)lOO PH 6-9 S.U.
Average Parameter Discharge : MG/L
BODS 1,742.6 TSS 180.4 OIL&GREASE(T)31.3 PH 7.33
Information OIL & GREASE (T) • TOTAL OIL & GREASE
(10)

CITY OF LA PORTE INDUSTRIAL PRETREATMENT
Company Name: MARTIN OIL Address: 1332 STATE ROAD 2 WEST ST.: INDIANA ZIP: 46350 Company Representative: STEVE SCHROEDER Products Produced Or Service Preformed: GROUND REMEDIATION
Pretreatment Process: AIR STRIPPING TOWER, FOR VOLTILE ORGANICS
Time of Operation: 24 HRS. Shifts: :#:Employees:
Classification: GROUND REMEDIATION Permit i: 4
Typical Monthly
Daily Flow (gpd): 14,033 Account:#:l: MOl 0038-00 Account:fl:2:
Average Flow (gallons): 421,000 Discharge Parameters
Account:#:3:
BOD5 LEAD TTO
BOD5 300 LEAD 2.8 TTO < .01
BOD5 0.0 LEAD < .03 TTO
Information
CADMIUM CHROMIUM MERCURY NICKEL
Daily Parameter Limits : MG/L CADMIUM 1.8 CHROMIUM 24.7 MERCURY .15 NICKEL 10.0
Average Parameter Discharge : MG/L
CADMIUM< .0017 MERCURY 0
(11)
CHROMIUM 0 NICKEL .0033
COPPER ZINC
COPPER 3.0 ZINC 12.0
COPPER .0067 ZINC .03

CITY OF LA PORTE INDUSTRIAL PRETREATMENT
Company Name: MODINE MANUFACTURING Address: 239 FACTORY STREET ST.: INDIANA ZIP: 46350 Company Representative: BILL BURKHART Products Produced Or Service Preformed: RADIATOR MANUFACTURING
Pretreatment Process: METALS REMOVAL, PH ADJUSTMENT
Time of Operation: 8HRS.VARIABLE Shifts: 1 #Employees: 166
Classification: METAL FINISHER Permit #: 1
Typical Daily Flow (gpd): 3,977 Account#l: MOl 04330-00 Account#2:
Monthly Average Flow (gallons): 119,300 Account#3:
CADMIUM NICKEL TSS
CADMIUM .69 NICKEL 3.98 TSS 300.0
CADMIUM <0.0057 NICKEL 0.0375 TSS 12.1
Information
Discharge Parameters CHROMIUM COPPER SILVER ZINC OIL&GREASE(HC) : PH
Daily Parameter CHROMIUM 2.77 SILVER .3 OIL&GREASE(HC)50
Limits : MG/L COPPER 3.0 ZINC 2.61 PH 6-9 S.U.
Average Parameter Discharge : MG/L
CHROMIUM 0.0248 SILVER 0.0026 OIL&GREASE(HC) .7
(12)
COPPER .6252 ZINC 0.4481 PH 8.448
LEAD CYANIDE TTO
LEAD .69 CYANIDE 1.1 TTO 2.13
LEAD 0.0242 CYANIDE 0.0106 TTO

CITY OF LA PORTE INDUSTRIAL PRETREATMENT
Company Name: NEW YORK BLOWER Address: 17 FACTORY STREET ST.: INDIANA ZIP: 46350 Company Representative: GREG CRAIL Products Produced Or Service Preformed: BLOWER MANUFACTURING
Pretreatment Process: SOLIDS REMOVAL; OIL REMOVAL; PH ADJUSTMENT
Time of Operation: 7AM-11PM Shifts: 2 :If Employees: 280
Classification: METAL FINISHER (PHOSPHATING) Permit :if: 15 Account:lf1: MOl Accounti2: MOl Accounti3: MOl
Typical Daily Flow (gpd): 50 Monthly Average Flow (gallons): 1,500
CADMIUM NICKEL CYANIDE (T) OIL&GREASE(T)
CADMIUM .69 NICKEL 3.98 CYANIDE(T) 1.1 OIL&GREASE(T)150
CADMIUM .0152 NICKEL .2657 CYANIDE(T) .0035 OIL&GREASE(T)9.9
Discharge Parameters CHROMIUM COPPER SILVER ZINC TSS : PH OIL&GREASE(HC)
Daily Parameter CHROMIUM 2.77 SILVER .3 TSS 300 OIL&GREASE(HC)50
Limits : MG/L COPPER 3.0 ZINC 2.61 PH 6-9 S.U.
Average Parameter Discharge : MG/L
CHROMIUM .0787 SILVER .0198 TSS 41.7 OIL&GREASE(HC)1.8
COPPER .6807 ZINC .4927 PH 6.133
Information CYANIDE (T) - TOTAL CYANIDE OIL & GREASE (T} TOTAL OIL & GREASE OIL & GREASE (HC) HYDROCARBON FRACTION
(13)
04370-00 04380-00 04390-00
LEAD PHOSPHORUS TTO
LEAD .69 PHOSPHORUS TTO 2.13
LEAD .0159 PHOSPHORUS TTO

CITY OF LA PORTE INDUSTRIAL PRETREATMENT
Company Name: POWCOTE INC. Address: 408 TRUESDELL AVENUE ST.: INDIANA ZIP: 46350 Company Representative: DOUG FREDENBURG Products Produced Or Service Preformed: POWDER PAINTED METAL PARTS
Pretreatment Process: PH ADJUSTMENT
Time of Operation: 7ruM-4AM VARIABLE Shifts: 1 #Employees: 8
Classification: POWDER PAINTER
Typical Daily Flow (gpd): 5,039 Monthly Average Flow (gallons): 151,166
Discharge Parameters BOD5 TSS PH
Permit #: 13 Account#l: MOl 04895-00 Account#2: Account#3:
Daily Parameter Limits MG/L BOD5 300 TSS 300 PH 6-9 S.U.
Average Parameter Discharge MG/L
BOD5 71.4 TSS 43.4 PH 7.208
Information
(14)

CITY OF LA PORTE INDUSTRIAL PRETREATMENT
Company Name: TOWNDAN ENTERPRISES INC. Address: 2700 MONROE AVENUE ST.: INDIANA ZIP: 46350 Company Representative: CHIP JONES Products Produced Or Service Preformed: WEEKLY NEWS PAPER; MISC. PRINTING
Pretreatment Process: SILVER RECOVERY
Time of Operation: 7AM - 5PM Shifts: 1 =II= Employees: 15
Classification: NEWS PRINT I PRINTER
Typical Daily Flow (gpd): 433 Monthly Average Flow (gallons): 13,000
Discharge Parameters SILVER CYANIDE PH
Permit =II=: 12 Account#l: MOl 04059-00 Account#2: Account#3:
Daily Parameter Limits MG/L SILVER .3 CYANIDE 1.1 PH 6-9 S.U.
Average Parameter Discharge MG/L
SILVER .0559 CYANIDE < .0003 PH 8.228
Information CYANIDE (T) - TOTAL CYANIDE
(15)

-·, ·--- -----------------1------[
'ntt--+------~--~-------------------'-----~-~--~----~------ ------------·· -----\
blJ0+--------1
/()0
;
2.
A-rrt'lcHMEJJT Ale. 4 /-J D DE tJ DU Mf ;.Jc !
Decel"'f~r7 li1'2 i '
LEGEIJD
-- -· ---_-.:. _- ,_-! - ---_- :SiiMM£12--
--x~- WINTER.
(tv1GD)

' '
u...----------~·------· ---·-~----
>< - ---------,--- -~-- --- --- ·-
i
ATTA Cf{MEIJT JJC.;:
1/DOEtJ f)l{ IJf 1-/0 .I
.DeceMh,er? 1992 i
I ; I
---,-----------~,- -- -
I I ·,
' v ---- - jl_
'J( I
I X
I I("
I -~- ~
I , I X
I X I( v )(
,j
I I
I
-1 I
/ ;---r
/
/0
/ /
I I ,
.I ,
LE!~END
b
PLANT 8
FLOW (JVJ6D)

~I '>--i 't j_ __________ -·
~1 :
~ I : ~
--- t-
I '
----1--~~---t- --
X
)(I
I I
I
I I
PLANT
)C •
;. >< I
I
AITAC/-1/vfGIVT tJo. b
A DDt AI DU "1 ;Jo. I
Dec~·w. ber, I q 1 2
l I I I
I I I I
i I I I
I // /j
I I
/
L£qEND
-----· ----
X -- -- WINTE/f

COMBINED SEWER SYSTEM INSPECTION AND MAINTENANCE DETAILS AND SCHEDULE
LaPORTE, INDIANA
COMBINED SEWER SYSTEM OPERATIONAL PLAN
I. COMBINED SEWER SYSTEM INVENTORY
I.A. Length of combined sewers which can effectively be cleaned by hydraulic jetting, 8"-24" diameter pipe size = 231,000 ft.
I.B. Length of combined sewers which can only be effectively cleaned by bucket machine, 30" - 78" diameter pipe size = 84,300 ft.
I.C. Length of combined sewers which might be effectively cleaned by flushing, 8" - 15" diameter pipe size 193,000 ft.
I.D. Number of combined sewer manholes = 870
I.E. Length of sanitary sewers included in the combined sewer system = 116,000 ft., with 380 manholes. Note: Sanitary sewers are not included in this combined sewer system inspection and maintenance schedule as they do not receive high flows during wet weather and therefore, do not "flush" solids into the wastewater treatment plant and system CSO.
II. POTENTIAL PROBLEMS RESULTING FROM A COMBINED SEWER SYSTEM
II.A. Surface "cave-ins" due to: (1) undermining from water and soil entering combined sewers and manholes thru joint openings, cracks and breaks, (2) structural failure of the sewers or manholes.
II.B. Surf2ce and basement floodings due to the combined sewers inability to carry the flow because of: (1) undersizing, (2) structural failure or (3) partial or complete blockages.
II.C. Excessive solids and pollutant loadings at the wastewater treatment plant or in the system CSO due to the flush-out of accumulated solids from combined sewers and manholes during high wet weather flows.
III. INSPECTION PROCEDURES TO FIND COMBINED SEWER SYSTEM PROBLEMS
III.A. Observe surface settlement areas.
III.B. Visually inspect manholes and all adjacent plplng for structural condition, solids accumulation and infiltration leakage.
III.C. Measure and compare high water elevations in the combined sewer system manholes after wet weather flow periods to determine if the flow thru any sewer segments is restricted.
III.D. Internally inspect suspect sewers by sewer televising procedures or by direct entry, if the sewer is large enough and mechanically ventilated to safe air quality levels. Note: Sewer problems are suspect if: (1) surface settlement is occurring above, (2) solids accumulation is continually occurring within the sewer or in the adjacent manholes or (3) surface or basement flooding is occurring on or upstream of the sewer.
ATTACHMENT NO. 8 ADDENDUM NO. 1 December, 199 2

III.E. Inspect the combined sewer overflow (CSO) weir in the wastewater treatment plant influent flow junction structure for structural integrity and solids accumulation. Also, inspect the flow channel from the weir into the CSO retention pond for structural integrity and debris accumulation.
IV. lv!AINTENANCE PROCEDURES FOR COMBINED SEWER SYSTEM
IV.A. Sewer cleaning, by hydraulic jetting or bucket machine.
IV.B. Sewer flushing, with water from a tank truck.
IV.C. Removal of accumulated solids from manholes by vacuum truck, as required, and as part of sewer cleaning procedures.
IV.D. Catch basin maintenance to minimize the solids entry into the combined sewers with surface water. Refer to Attachment No. 9 for catch basin maintenance details.
IV.E. Removal of any solids accumulation on the system CSO weir and any accumulated debris in the flow channel from the weir to the CSO retention pond.
V. ENFORCEMENT OF SEWER USE ORDINANCE AND INDUSTRIAL PRETREATMENT REQUIREMENTS
V.A. To prevent the discharge of substances into the combined sewer system which could: (l) chemically attack the system materials, (2) accumulate as solids within the system, (3) physically or biologically damage the wastewater treatment plant or (4) degrade the quality of the systeiT CSO during wet weather.
V.B. To require all new surface water connections to the combined sewer system to have a regulated reduced rate of discharge.
V.C. To prevent the construction of any new combined sewers.
VI. SCHEDULE OF COMBINED SEWER SYSTEM INSPECTION METHODS
VI.A. Manhole Inspections - Every manhole and adjacent piping should be inspected every five years and an inspection report prepared for each inspection. These inspections can be made throughout the years at an average rate of approximately 3 per week, or preferably during a two month time period, at a rate of approximately 20 per day.
VI.B. Surface Settlement Observations - All combined sewer system maintenance personnel should be continuously aware of this situation and should look for surface settlement areas during the manhole inspections and at all other times that their jobs permit.
VI.C. Measure Manhole High Water Elevations - Should be included in the Section VI.A. Manhole Inspections work, if the high water elevation marks are still noticeable. Otherwise, this should be done as part of a surface or bas~ment flooding problem investigation.
ATTACHMENT NO. 8 ADDENDUM NO. l December, 1992
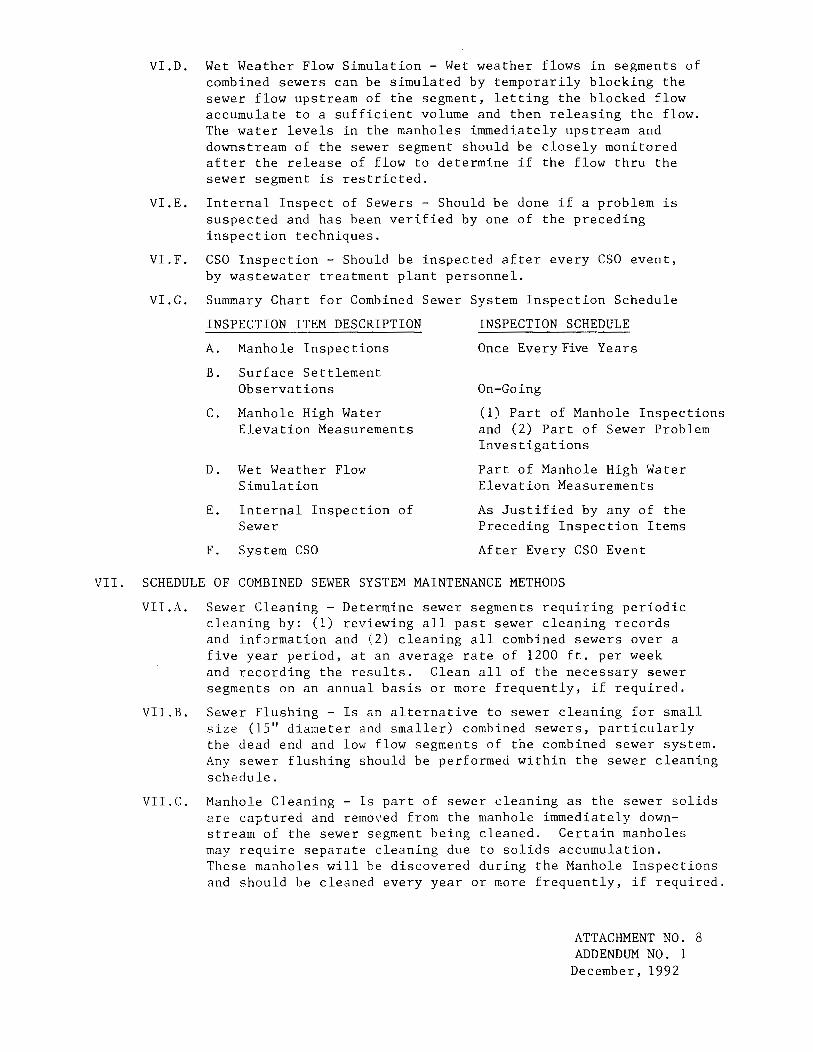
VI.D. Wet Weather Flow Simulation - Wet weather flows in segments of combined sewers can be simulated by temporarily blocking the sewer flow upstream of the segment, letting the blocked flow accumulate to a sufficient volume and then releasing the flow. The water levels in the manholes immediately upstream and downstream of the sewer segment should be closely monitored after the release of flow to determine if the flow thru the sewer segment is restricted.
VI.E. Internal Inspect of Sewers - Should be done if a problem is suspected and has been verified by one of the preceding inspection techniques.
VI.F. CSO Inspection - Should be inspected after every CSO event, by wastewater treatment plant personnel.
VI.G. Summary Chart for Combined Sewer System Inspection Schedule
INSPECTION ITEM DESCRIPTION
A. Manhole Inspections
B. Surface Settlement Observations
C. Manhole High Water Elevation Measurements
D. Wet Weather Flow Simulation
E. Internal Inspection of Sewer
F. System CSO
INSPECTION SCHEDULE
Once Every Five Years
On-Going
(1) Part of Manhole Inspections and (2) Part of Sewer Problem Investigations
Part of Manhole High Water Elevation Measurements
As Justified by any of the Preceding Inspection Items
After Every CSO Event
VII. SCHEDULE OF COMBINED SEWER SYSTEM MAINTENANCE METHODS
VII.A. Sewer Cleaning - Determine sewer segments requiring periodic cleaning by: (l) reviewing all past sewer cleaning records and inf8rmation and (2) cleaning all combined sewers over a five year period, at an average rate of 1200 ft. per week and recording the results. Clean all of the necessary sewer segments on an annual basis or more frequently, if required.
VII.B. Sewer Flushing - Is an alternative to sewer cleaning for small size (15" diameter and smaller) combined sewers, particularly the dead end and low flow segments of the combined sewer system. Any sewer flushing should be performed within the sewer cleaning schedule.
VII.C. Manhole Cleaning - Is part of sewer cleaning as the sewer solids are captured and removed from the manhole immediately downstream of the sewer segment being cleaned. Certain manholes may require separate cleaning due to solids accumulation. These manholes will be discovered during the Manhole Inspections and should be cleaned every year or more frequently, if required.
ATTACHMENT NO. 8 ADDENDUM NO. l
December, 1992

VII.D. Catch Basin Maintenance - Refer to Attachment No. 9 for this schedule.
VII.E. CSO Maintenance - After every CSO event, remove accumulated solids from the system CSO weir and any accumulated debris from the flow channel between the weir and the CSO retention pond.
VII.F. Summary Chart for Combined Sewer System Maintenance Schedule
MAINTENANCE ITEM DESCRIPTION
A. Sewer Cleaning
B. Sewer Flushing
C. Manhole Cleaning
D. System CSO
MAINTENANCE SCHEDULE
(1) Determine necessary sewer segments over a five year period of cleaning all sewers (2) Clean all necessary sewer segments at least once per year
Part of Sewer Cleaning
(1) Determine necessary manholes over five year manhole inspection schedule (2) Clean all necessary manholes at least once per year
After every CSO event
ATTACHMENT NO. 8 ADDENDUM NO. 1 December, 1992

STREET AND CATCH BASIN CLE&~ING DETAILS AND SCHEDULE
LaPORTE, INDIANA
COMBINED SEWER SYSTEM OPERATIONAL PLAN
I. STREET AND CATCH BASIN INVENTORY
I.A. Length of street curb and/or gutter which drains into the combined sewer system = *
I.B. Number of catch basins connected to the combined sewer system *
II. IMPORTANT EFFECTS OF STREET AND CATCH BASIN CLEANING ON COMBINED SEWER SYSTEM
II.A. Street Cleaning - m1n1m1zes the entry of sand and dirt into the catch basins and thus reduces; (1) the need for catch basin cleaning, (2) the amount of sand and particularly dirt which enters the combined sewer system, (3) the need for combined sewer cleaning, (4) the amounts of wastewater treatment plant solids load and sludge disposal and (5) the systen CSO solids load.
II.B. Catch Basin Cleaning - m1n1mizes the entry of sand into the combined sewers and thus reduces; (1) the need for combined sewer cleaning, (2) the amounts of wastewater treatment plant solids load and sludge disposal and (3) the system CSO solids load.
III. STREET CLEANING RESPONSIBILITIES
III.A. LaPorte city street cleaning is the responsibility of the City Street Department.
III.B. State and Federally designated highways thru LaPorte are cleaned by both the Indiana Department of Transportation and the City Street Department.
III.C. The LaPorte City Wastewater Department, thru an interdepartmental agreement, shall direct the City Street Department's street cleaning work in the combined sewer areas of LaPorte.
IV. STREET CLEANING SCHEDULE
~ote: This schedule pertains to all streets with curb and/or gutter which are drained by combined sewers.
IV.A. All streets should be cleaned when needed and as weather permits. The determination of need shall be made by the City Wastewater Department. Weather limitations shall be freezing temperatures or wet conditions. For planning purposes, the following schedule is assumed:
IV .A. 1. Summer Season (May thru October) - clean streets on an as needed basis.
IV. A. 2. \.Jinter Season (November thru April) - clean highway streets and city streets as least twice during the winter season.
*To be determined during 15 month PLAN Implementation and Status Report Period
ATTACHMENT NO. 9 ADDENDUM NO. 1
December, 1992

V. CATCH BASIN CLEANING AND INSPECTION SCHEDULE
V.A. Highway Street Catch Basins - clean and inspect at the end of each winter season (around May 1).
V.B. City Street Catch Basins - clean and inspect everyfive years, during the summer season.
ATTACHMENT NO. 9 ADDENDUM NO. 1
December, 1992

a: I.Ll 3 w Vl
Q w 6 ct1
·~
INFLUENT STRUCTURE AND CS
AND FLOW CHANNEL DETAILS
WASTEWATER TREATMENT PL
LaPORTE, INDIANA
* lNOlC~TE.S OVERFLOW WEIR WALLf TOC ELE\1. '=?lil"t.O't
r;,o"'; RCP COMBINED SEWE.R
E~POSEO ui' TOP wf T.O.c; aEV. =T78.?..~
** INtl\C
a. u a:.
~~ tFLOOR ELEv.-~7.11 FlOOR ELEv ... ·~·w+ =~=U===~~==~~==~~==~1 ). +--1 I
0~ CAANNEL SUP?ORT' P\ER$J ' : ------::~ UNDERNf.ATH CHANNELWAU) >
7 1 SEWER FlOW CHANNEL ·
+FLOOR ELf
);OC. ELEV.:.TI0.03 1..FLOOR ELEV. UNDE~f.A.TH-~7.11).
---
PLAN VIEW NO SCf..LE

INFLUENT STRUCTURE AND CSO WEIR
AND FLOW CHANNEL DETAILS
WASTEWATER TREATMENT PLANT
LaPORTE, INDIANA
TOC ELEV. ~ 1<D'l.O~ ** INOIO.TES C SO WE\R WALL} TOC ELEV ..... 7tD8.80
I.=T16.2fj
l)
[4B>J.t RGP COMBINED SEWER-(A6AI'(00NED· ANC REPLI\CED BY GO''f ~CP
. AT LEFT IN A ;)UNCTION STRUCTURE . APPROXIMATELY 70FT TO TI-lE NORTH)
l
-t FLOOR ELEV ..... 7,7.SO
A.LVM. CSO WE.\R PL)..TE; TOP ELEV.-=~&.,5
PLAN YIEW NO SCA.LE
~ J(
I
U~RE
80TT01\

~ J(
I
UMa:R EX\SrtNG BRIDGE. WITH
BOTTOM OF -QECK ELEV.-= 77~.15
OLE ELEVS· =7T4.~ ' :=lGJ'J.I'f'(tN) == lWCO. 5 t (001')
ATTACHMENT NO. 2
ADDENDUM N0.1
December, 1992

30.0"NTS
WEIR'

12.2'
TOP OF WAL ELEV 789.31
J BAFFLE BEAM (CONCA. ETE)
TOP OF WEIR W.All, 784.34 ELEV ~ 'V t WEIR PLATE (GALV STEEL)
---"' ~+---5-.3-.-~~ 22.0' ___t_
f.-~-------·-----
' \~1~\\ WEIR WALL
COMPACTED SAND
LONGITUDINAL SECTION
CSO RETENTI< WASTEWA1
Lt

23.0'
NOTE: SPILLWAY STRUCTURE IS REINFOF CONCRETE EXCEPT WHERE
i I I I
INDICATED OTHERWISE
-------------------------~
.&'NT8 8.7'
ION POND SPILLWAY DETAILS TER TREATMENT PLANT aPORTE, INDIANA
BEGINNING OF TRAVIS DITCH >

ATTACHMENT NO~ 3 -. -- - --·
ADDENDUM NO. 1 December, 1992
~ORCED
20.04'
r- ;--
~ TOP OF BAFFLE, ELEV 788.58
TOP OF WEll PLATE 784.82 ELEV ~8· j• r-
80TTOM OF WEIR NOTCH, ELEV. 784.51 ___If
~-------------------
~TOP OF TOE WALL 758.28 ELEV
v:- TOP OF APRON, 7H.58 EL:EV
_LJ\._ -J\-~
CROSS-SECTION

2101 Boyd Blvd. LaPorte, IN 46350 (219)362-2354 (219)362-1 018 FAX 4/6/98
Update to LaPorte's CSO Operational Plan To 1\~eet Indiana Department of Environmental Managem1ent's
Minimum Controls 7, 8, and 9
Greeley and Hansen 3750 Guion Rd., Suite200
Indianapolis, Indiana 46222

L VII Minimum Control No.7- Pollution Prevention Programs
VII.l GENERAL
Pollution prevention programs reduce the amount of contaminant and floatables that enter the combined sewer system and the receiving stream. This section presents implemented and proposed pollution prevention programs.
VII.2 EXISTING POLLUTION PREVENTION PROGRAMS
Street Sw-eeping
The City currently has a street sweeping program. Streets in combined sevver areas are cleaned twice during the spring. Streets with more solids accumulation, such as the dovvntown area, are cleaned more often.
Solid Waste Collection and Recvclim!
In addition to the once a week curbside solid waste collection program, the City has strategically placed trash collection receptacles approximately every block in the dovvntown area to control litter. Receptacles are emptied once a week.
The City has a City-wide curbside recycling program that collects recyclable materials every other week. Approximately 63 tons of materials are collected every two weeks through the recycling program.
Hazardous Waste Collection
The Lake Michigan Districts (LMD) has a program that collects household hazardous waste 2 or 3 times per the year from communities around Lake :Y1ichigan, including the City of LaPorte. The date and location of the hazardous waste collection is advertised in the LaPorte Herald Argus. A sample of the advertisement is shown on Figure VII -1.
Yard Waste Collection
The City has an extensive yard waste collection program. Yard wastes including grass cuttings, leaves and Christmas trees are collected weekly or can be picked up by calling the City Street Department. This prevents yard wastes from entering and blocking catch basins.
Control oflllegal Dumping
The City has placed signs at strategic locations to prevent illegal dumping of solid wastes. A $500 penalty is enforced for anyone caught violating the ordinance.
1

',.._ Catch Basin Sand Trap and Trash Baffle
I
'-
In 1992. the City passed an ordinance requiring that new catch basins be installed with a sand trap and trash baffle. This prevents solids and floatables from entering storm and combined sewer systems.
Wetlands Ordinance
Wetlands Ordinance 5-91 was adopted by the City in 1991 with the goal of preservin~; existing w·etlands \vithin the city limit. Under the ordinance, the City's Board of Public Works and Safety reviews projects that fill or alter existing wetlands. By preserving existing \vetlands, the City ensures that no additional impervious acres and trash from the area developed are added to the \vatershed.
Overflow Lagoon Baffle
The overflo\v lagoon has a concrete baffle at its outfall. The baffle prevents most floatables from being discharged into Travis Ditch.
VII.3 PROPOSED POLLUTION PREVENTION PROGRAMS
Additional Hazardous Waste Drop-Off Site
The City will investigate providing household battery drop-off sites at local government establishments such as the public library. The City will also pursue arrangements with local businesses including oil changing stations to be the designated drop-off sites for used motor oils and anti-freeze.
Public Education New·sletter
The City will develop a semi-annual public education ne\vsletter to raise public awareness of the impacts of CSOs on the receiving stream water quality, what the City is doing to control CSOs, the cost of CSO control, and how individuals and organizations can prevent or reduce pol!Ulion. The newsletter will also include information on hazardous waste drop-off sites.
Catch Basin Dumping Warning Signs
The City proposes stenciling \Yarning signs on curbs at catch basins where there is evidence of illegal dumping. Figure VII-2 shows the proposed warning sign. The warning sign will be stenciled using bright orange weatherproof paint.
2

Product Use Restriction
The City proposes to adopt an ordinance that requires its citizens to use biodegradable products and em:ironmentally safe chemicals. Among the products targeted are as follows:
• Styrofoam packing materials, cups and other products. These products are nonbiodegradable.
• Certain herbicides applied at public parks and golf courses that impact aquatic life and water quality.
CSO Structure Floatable Control
The City has one CSO structure located at the waste>vater treatment plant. The City proposes to install a screen or baffles as part of a long-term CSO control plan to prevent floatables from discharging to the overflo>v lagoon and Travis Ditch.
,., .)

. 0 .... v, "' -;
s -~
" (J)
Z' <£)-
0
' co 0
--u.J _j
<>: () (f)
<D 0 IY I <£)
;;; / w >-IY 0 CL <>:
"- / f./) .:n 0 -, / -o
u.J _j
u...
FIGURE VII -1
Lake Michigan Districts' Household Hazardous
Waste Program Collection times ·are from 10 a.m. to 3 p.m.
_We Accept: Batteries, Cleaners, Oils, Paints, Pesticides, Insecticides, Poisons, Solvents, Anti-Freeze, Stains, Varnishes,
Gasolines and Reusable Latex Paint.
May 17 June 21 July 25 Aug. 23 Sept. 20 Oct. 18
1997 LaPorte County Schedule Wanatah LaPorte Mich. City LaPorte LaPorte Mich. City
Town Hall, Main St. & R.R. Ave Kabelins True Value, 512 Andrew Ave·. Kabel ins True Value, 432 St. John Rc. To Be Announced Kabelins True Value, 512 Andrew Ave:. Kabelins True Value _I
We Cannot Accept: Tires, Appliances, Medical or Biological Waste, Explosives, Ammunition, Radioactive Waste or Asbestos.
REDUCE-REUSE-RECYCLE ,· •,
Questions? Call 1~219-326-1425 or 1-800-946-4449
This Program Funded in Part By The Department of Environmental Management.
HAZARDOUS WASTE COLLECTION SAMPLE ADVERTISEMENT
GREELEY AND HANSEN
CITY OF LAPORTE CSO OPERATIONAL PLAN UPDATE TO MEET MINIMUM CONTROL NO. 7, 8 AND 9

I
"-
'
\......
. 0
'<T u
i
""' ';
:!
-~
" (J)
~
<D 0 '-co 0
--w _J
<( u (f)
""' 0 a:: I <.;)
<0 / w ..... a:: 0 a._ <(
\...... _J / (f) CD 0 ...., / -':i
w _J
u_
FIGURE VII -2
n n ~ ( )
I ) I I I I c )
c:..r,;)
( ) ~
~
CATCH BASIN DUMPING WARNING SIGN
GREELEY AND HANSEN
CITY OF LAPORTE CSO OPERATIONAL PLAN UPDATE TO MEET MINIMUM CONTROL NO. 7, 8 AND 9

VIII MINIMUM CONTROL N0.8- PUBLIC NOTIFICATION
VIII.l GENERAL
The intent of public notification is to inform the public, in a timely manner, of the locatwn of the CSO outfall, the occurrences of CSO and the possible health and environmental effects of CSO.
The City is planning to implement the follov.ing public notification programs:
VIII.2 PLA0rNED PROGRAMS
CSO Outfall Warning Sign
The City of LaPorte has one CSO outfall which is located at the wastewater treatment plant's overflow lagoon. The lagoon is located in an area that is not readily accessible by the public. In the future, the open area west of the overflow lagoon will be converted to a wetlands/City park. \v'hen the wetlands/City park is created, as a precaution, the City will install the warning sign :;hown on Figure VIII-1 around the perimeter of the lagoon and the sign shown on Figure VIII-2 at the lagoon's outfall.
4

. 0
v u
I ...., -; ~ ,. 0
c;
" 0>
~ ....,· N
'-U)
0
--w ...J <(
u {f)
N 0 ct:: I U)
~ w ,... ct:: 0 0.. <( ...J
\.._. / ffl co 0 -, / .:.;
w ...J
u..
1=-IGURE VIII-1
NOTICE This lagoon receives
combined sewer overflows.~ The water in the lagoon cou1ld
be polluted. A void contact with the water in the lagoo1n. For more detailed information,
please call LaPorte's Wastewater Treatment Plant
at 362-2354.
OVERFLOW LAGOON WARNING SIGN
GREELEY AND HANSEN
CITY OF LAPORTE CSO OPERATIONAL PLAN UPDATE TO MEET MINIMUM CONTROL NO. 7, 8 AND 9

. 0 ... u
i r<) . a> ..-0
c;
" a> ~ r<)-
N '-... <!) 0
--w _J
<( () (f)
0 a:: ;:0 <!) ./ w >-a:: 0 0.. <( .
\_ ;;:!-(f) Q)
0 ..., ./ ....,
w -' u._
FIGURE VIII -2
NOTICE Travis Ditch receives
combined sewer overflows and can become polluted
during or after rain events or snow melt. For more detailed
information, please call LaPorte's Wastewater
Treatment Plant at 362-2354.
OVERFLOW LAGOON OUTFALL AND TRAVIS DITCH WARNING SIGN
GREELEY AND HANSEN
CITY OF LAPORTE CSO OPERATIONAL PLAN UPDATE TO MEET MINIMUM CONTROL NO. 7, 8 AND 9
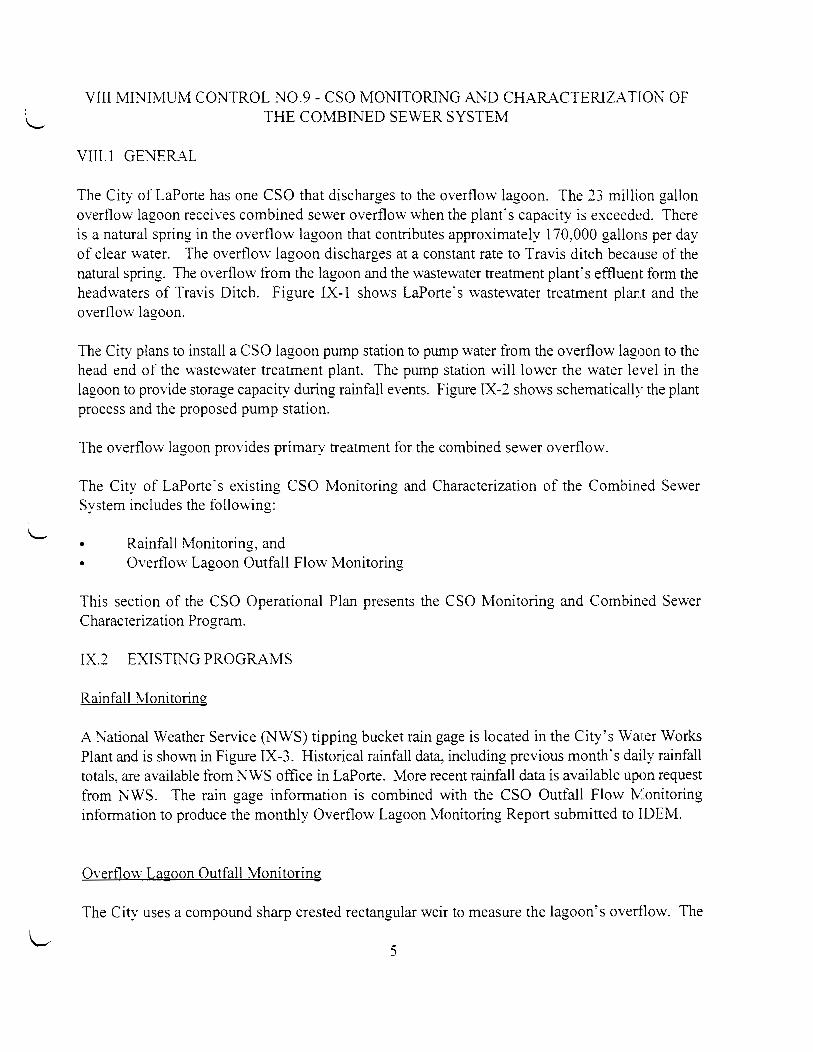
VIII MINIMUM CONTROL N0.9- CSO MONITORING AND CHARACTERIZAT[ON OF L THE COMBINED SEWER SYSTEM
VIII.l GE)JER.A.L
The City of LaPorte has one CSO that discharges to the overflow· lagoon. The 23 million gallon overflow lagoon receives combined sewer overflow when the plant's capacity is exceeded. There is a natural spring in the overflow lagoon that contributes approximately 170,000 gallons per day of clear water. The overflovv lagoon discharges at a constant rate to Travis ditch because of the natural spring. The overflow from the lagoon and the wastewater treatment plant's effluent form the headwaters of Travis Ditch. Figure IX-1 shows LaPorte's vvastewater treatment plart and the overflovv lagoon.
The City plans to install a CSO lagoon pump station to pump water from the overflow lagoon to the head end of the wastevvater treatment plant. The pump station will lower the water level in the lagoon to provide storage capacity during rainfall events. Figure IX-2 shows schematically the plant process and the proposed pump station.
The overflov,: lagoon provides primary treatment for the combined sewer overflow.
The City of LaPorte· s existing CSO Monitoring and Characterization of the Combined Sewer System includes the following:
• Rainfall Monitoring, and • Overflow Lagoon Outfall Flow Monitoring
This section of the CSO Operational Plan presents the CSO Monitoring and Combined Sewer Characterization Program.
IX.2 EXISTING PROGRAMS
Rainfall Monitoring
A ~ational Weather Service (NWS) tipping bucket rain gage is located in the City's Wmer Works Plant and is shown in Figure IX-3. Historical rainfall data, including previous month's daily rainfall totals, are available from NWS office in LaPorte. More recent rainfall data is available upon request from NWS. The rain gage information is combined with the CSO Outfall Flow :rv::onitoring information to produce the monthly Overflow Lagoon Monitoring Report submitted to IDEM.
Overflow Lagoon Outfall Monitoring
The City uses a compound sharp crested rectangular weir to measure the lagoon's overflow. The
5

of ov rflow from the lagoon to Travis Ditch.
Figur IX-4 shows a sample of the monthly lagoon overflow monitoring report. Rainfall information from he NWS rain gage is added to the report.
From May 1992 to April 1993, under Agreed Order B-1442, the City of LaPorte conducted a study of the I goon's overflow water quality. The overflow lagoon's weekly discharges were tested for CBOD5, Total Suspended Solids (TSS), Ammonia, pH, Dissolved Oxygen (DO), Fecal Coliform, Cadmium, Hexa hrome, Copper, Lead, Nickel, Zinc and Cyanide for a total of 55 samples. A total of 205 storms occu ed during the study period.
Duri wet weather, significant turbulence exists in the junction chamber that diverts combined sewer to the overflow lagoon. The junction chamber will be modified under LaPorte's long-term CSO control plan or installation of a flow monitor to measure combined sewer flow to the overflow lagoon.
P:IWP\OA AILAPORTEIMIN7&8.DOC
6

. 0 ..,. " I ,..., .
..... 0> 0>
w -' < (.)
en 0> 0 0:: :I: <0
~ w 1-0:: 0 a._
< 7 en CD 0 )-';
j GREELEY AND HANSEN
COMBINED
PRIMARY CLARIFIERS
SEWER OVERFLOW CHAMBER
~~OFFICE BUILDING
LAPORTE 1S WASTEWATER TREI SCALE: 1" = 200'
tL-______________________________________________ , ____________ _

LAGOON OUTFALL
OVERFI OW LAGOON
II
~= ~~ ======::..., ~J
- SLUDGE LAGOON
D:r..E1
TRAVIS DITCH HEADWATERS
24" WWTP OUTFALL
FIGURE IX-1
CITY OF LAPORTE
ENT PLANT AND OVERFLOW LAGOON CSO OPERATIONAL PLAN UPDATE TO MEET MINIMUM CONTROL NO. 7, 8 AND 9

. 0 ..,. u
I
"' .
0 r-Gl
"'
w -' <(
u (/)
0
0:
<0 §. w 1-0: 0 a_ <(
? (/) CD 0 --, / .:..;
TRAVIS DITCH OUTFALL 002
EXCESS WET WEATHER FLOW
cso LAGOON
60" SEWER _..-.r---~--.....,
48" SEWER 78" SEWER
JUNCTION CHAMBER
36" SEWER -..._.,_ ______ --l 9 MGD
PROPOSED CSO LAGOON
PUMP STATION
SCREENING
(PEAK) 1----"""T"'""---.J
I J
SCREENINGS TO LANDFILL
RETURN FLOW (DF~Y WEATHER) 600 GPM
MEASURE FLOW
I I I I I I I
r---------r ___ SUPERNATAN~--~
SLUDGE DISPOSAL BY __ _
LAND APPLICATION
OUTFALL 001 TRAVIS DITCH -
I I I I
SLUDGE STORAGE
TANK
DECHLORINATION
f---
!--
SECONDARY DIGESTER
CHLORINATION
-·-
I--
PRIMARY DIGESTER
NO. 2
MEASURE FLOW
t-
LAPORTE WASTEVVATER Tf
~ GREELEY AND HANSEN
~~-------------------------------------------------------------------------

GRIT REMOVAL
I
I J
GRIT TO LANDFILL
PRIMARY - DIGESTER
NO. 1
FINAL
PRIMARY SETTLING
l
I I I I I
FIGURE IX-2
RECYCLE
FIXED-BED TRICKLING ~-
FILTER
TRICKLING FILTER
PUMPHOUSE
ROTARY TRICKLING 1--
FILTER
1 I I I I I I I L----+----2ECONDARY 2LUDG~---- "1
I I
~----J RECYCLE
NITRIFICATION r-- TRICKLING
FILTER
I
BIOTOWER INTERMEDIATE I----
SETTLING PUMPHOUSE SETTLING t I I : NITRIFICATION
1
1
L..- TRICKLING I FILTER I I I L----------------------------------~
FINAL SLUDGE
\TMENT PLANT SCHEMATIC CITY OF LAPORTE CSO OPERATIONAL PLAN UPDATE TO MEET MINIMUM CONTROL NO. 7, 8 AND 9

. a .... 0 I ,.., ..
w ...J < (.) (()
CXl 0
s <D
!§ w ... 0:: 0 a... < ~ (()
CD 0 :;;. "-;
~ GREELEY AND HANSEN
'\
:t;l;;" !
==--====-----~:~:.=~-=: ~~....;--...=:' p-=--
COLLECTION SCALE: 1'' = 3000'
.·~
;. ; •.. ~ ,.--,
'
SYSTE
~'-------------------------------------------------------------------------------------------------------------------

_.;~!
~ --- :---~--'---·-- ,-~~' .=·=·-~--· . .o-:-~-:c-~.c;:..~r_._~'-""'-"~~~- ·- -----·-··----- .,...; ·:~ -· --- ------·-·~--~-~~~~----'' iiJ---/
\\ ; 36" ''
I:
!,::..= :"':
--==-"""";--=--=-==--= ;)
; \ ,. · •. •. '\
TRUNK'· SEWER (TYP)
LAPORTE WWTP
~NO RAIN GAGE LOCATION
II
· .. \
FIGURE IX-3
CITY OF LAPORTE CSO OPERATIONAL PLAN UPDATE TO MEET MINIMUM CONTROL NO. 7, 8 AND 9

0 .,. v I
")
w -'
Monitomg Penod.
Name:
Addless:
c~
Phone:
~Date
____9.~102/97
06/06/97
06/16/97
06121/97
06125197
06/30/97
Jun-97
LaPorte Vv'NTP
2101 Boyd Blvd.
LaP-orte, IN-46350 -.
(219)362-2354
Prec:picacion
Event
NATIONAL POLLUTANT DISCHARGE ELIMINATION SYSTEM (NPDES)
CSO DISCHARGE MONITORING REPORT
No CSO D:scharge Occurred:
FIGURE IX-4
·-------- ---- .- ----iPeani! lt. IN0025577
. ----- - - -- ··- ----- -. -· - . ------ - ------------------- --- .. --- ---- ..
fax· f-1~)362-10!8
I cso Discharge Begin r------1- - --
, Discharge End ! ! Durac:on Coscharge Outfal ' ' Time Inches ~ II Dale Time ' Dale ! Time
i Eve11t I Ev•nC
: (hours) (MG)
01:30AM 0.29 See Note CS/02/971 02:52 AMi 06102/97j 07:10AM i---~~: --__Q_?6
04:00AM 1.18 See Note 06/061971 04:54AM: 06106/971 04:22£.ML 11.5i 7 08
04:00AM 1.08 See Note 06/16!97! 05:51AM· 06/16/97[ 02:20PM i 8 51 5 90
06:30AM 0.18 See Note 06121/971 10:00 AM: 06/21/97\ 12:26 PM; _2.'!i 0 23
03:00 PMI 0.46 See Note 06/25197' 03:33PM: 06125/97; 06:16PM; vi 0 43
04:30PM: 2.o7lsee Note 06/30197 06:18PM' 07/01197! 02:46 AIJ, 8 5' 10 39 l --~------
i :
I I
-~ .------------
: ; ; ~------ ~-----
I ! i ! ; ----I CSIT:FY UNOEA PE ...... TY OF l>\W THAT I HAVE PfRSCNAU Y EXAMINEOANOmFAMI.IAA WITl1
tw.EITITI E PRN::P~L T~ !ltf0Rt..¥.TION SUENTTEOHERf!W .lNO 8ASEOCN MY INQlltRY OF THOSE lt}OM[)UAlS fWAE.ITinE PRINC.PAl :
'"-ECtATft'f RESPPONSialE FOR OSTA~ THE t,W:c;t:UM.TJCN IBEUE.'-11: THe S\JSMHEO EJ<£C\ITN£ OFFICER f.IFORMA. riON lS TRUE. ACCtJAA lf NolO CONPt..e Te IIW A.WAAE THAT TtERE .ARE SIG14FJC:).NT __ !_XfCUTIV!~~-IC.§~ ----!-- OA.TE - --
PENAl TI:S FCR SUliKTTitlG FAlSE INFORWonot•.I«::.OJCm ThE Poss;eury OF FIN!: ""'0 Je_rryP Jackson IMPR:I~. SEE lllU S C. 6 1001 N«:J ll U.S.C & 1319. {pi!NRioiiiMef llwitw ~~-mil'( l1dude ;
, ... 5upk)$1Q,CXXI~lllrN~ •!ftt.'lis.ona.cnlcJ~OI'I'ICI\hl and Sycws) ---TY'PfO OR PfUI'fTEO S:tGtiATUAE YEAR~ CAY ------------- ---
Notes
I LaPorte diverts exceS$1118 wet weather ftowa to the CSO Lagoon, located at the WNTP. The CSO Lagoon overftows vra Outlail 002 l<> LaPerle s receNong stream{Tr .....
Dach~ As ap<ing ftows in the CSO Lagoon cause a constant ove:ltow at Oucta<l 002, LaPorto reports duta~on or the <lHers:ons to the Lagocn inatead ol the over1tow at
iau~~a~ 002.
SAMPLE
GREELEY AND HANSEN
MONTHLY OVERFLOW LAGOON MONITORING REPORT
CITY OF LAPORTE CSO OPERATIONAL PLAN UPDATE TO MEET MINIMUM CONTROL NO. 7, 8 AND 9
~L-------------------------------------------------------------------------------------~

2101 Boyd Blvd. LaPorte, IN 46350 (219)362-2354 (219)362-1018 FAX 07/28/01
I:\WP\DATA\CSO\Srcer\srcer.doc
Stream Reach Characterization and Evaluation Report
I. ABSTRACT The City of LaPorte studied discharges from its only combined sewer overflow, which discharges at the headwaters of Travis Ditch, a tributary of the Kankakee River. Overflows occurred 5 times during the 15 month study period, with a total discharge duration of 6.4 days. CSO pollutant concentrations were compared to LaPorte’s wastewater treatment plant NPDES discharge limitations. CSO pollutant concentrations exceeded NPDES limitations for lead, cyanide, total suspended solids, ammonia, E. coliform, dissolved oxygen, and pH. Wet weather flows were tabulated and charted.

I:\WP\DATA\CSO\Srcer\srcer.doc 2
II. METHODOLOGIES AND SYSTEM DESCRIPTION a. Sampling and Analysis All five CSO events between 4/20/2000 and 7/07/2001 were sampled. During the first two events(4/20/2000 and 6/24/2000), 10 grab samples were taken every 15 minutes from Outfall 002. A composite was created from the grab samples. The composite sample was analyzed for cadmium, lead, nickel, zinc, copper, chromium, CBOD, TSS, pH, and Ammonia. Grab samples were analyzed for E. coliform. and dissolved oxygen. As a result of discussions with IDEM, the following three events were sampled and analyzed in a different manner. Grab samples were taken every 15 minutes from Outfall 002 for 120 minutes(8 samples). Each grab sample was analyzed for cadmium, lead, nickel, zinc, copper, chromium, CBOD, TSS, pH, ammonia, E. coliform, and dissolved oxygen. Test protocols were identical to those required by LaPorte’s NPDES permit.
Parameter Methodology Notes Cadmium EPA 213.2 Total Recov. Metal Lead EPA 239.2 Total Recov. Metal Nickel EPA 200.7 Total Recov. Metal Zinc EPA 200.7 Total Recov. Metal Copper EPA 200.7 Total Recov. Metal Chromium EPA 200.7 Total Recov. Metal CBOD Standard Methods(18th ed) 5210 B TSS Standard Methods(18th ed) 2450 D pH Standard Methods(18th ed) 4500-H+ B Ammonia Standard Methods(18th ed) 4500-NH3 D E. coliform EPA 1103.1 Dissolved Oxygen Standard Methods(18th ed) 4500-O G b. CSO Flow Measurement CSO flows were calculated from level measurements of CSO flow over a 20 foot wide rectangular compound weir. The compound weir contains a 4 foot wide by 1/3 foot deep notch used for measuring small flows. Level measurement was made using a Miltronics Hydroranger ultrasonic level meter. Level signal is transmitted to the Wastewater Treatment Plants(WWTP)’s SCADA system, where flow is calculated according to the following formula: For the 4 foot wide notch portion
Flow = 6.46*H1.5 -0.43*H2

I:\WP\DATA\CSO\Srcer\srcer.doc 3
For the 17 foot section Flow = 36.59*(H-1/3)1.5
Where Flow [=] MGD H [=] Height over weir, feet Weir formulas were generated from the ISCO Open Channel Flow Measurement Handbook. CSO level is charted mechanically and electronically. A PLC calculates the CSO flow and stores the data electronically. c. Rainfall Measurement Rainfall measurements are provided by the City of LaPorte Waterworks, an official National Weather Service Observation Station(Index # 12-4837-1). The weather station is well located to monitor LaPorte’s combined sewer area. d. CSO Lagoon Operation During wet weather, flows in excess of the WWTP’s 9.0 MGD wet weather capacity are diverted to the 17 acre CSO Lagoon. The 17 acre CSO Lagoon can store 2 feet(11 MG) prior to overflowing outfall 002 to Travis Ditch. Location maps and flow schematics for the WWTP, CSO Lagoon, and Outfalls are contained in Appendix #A. Following rain events, combined flows stored in the lagoon are pumped to the WWTP headworks. Both pumps are utilized to return stored flows to the WWTP, resulting in a return rate of 2.4 MGD. e. Outfall Locations LaPorte’s Wastewater Treatment Plant(WWTP) discharge(Outfall 001) and CSO form the headwaters of Travis Ditch. See Appendix A for location maps. Flow at the headwaters of Travis Ditch consists solely of wastewater treatment plant effluent and, during CSO events, combined sewer overflow from Outfall 002(CSO Lagoon). f. Sewer System Description LaPorte's sewer system contains 69.4 miles of combined sewers(69%) and 31.44 miles of sanitary sewer(31%). Portions of LaPorte's sewer system were constructed prior to 1900. Portions of the brick "big sewer" that served the community prior to 1911 are still operation. In 1901, LaPorte began construction of the 78 inch concrete "main" sewer began. LaPorte is centered around pothole lake system. Natural drainage was generally to the lake system and isolated wetlands scattered throughout the city. The only streams that carry water out of the LaPorte are remote from the city center. The Shurz ditch begins 2.0 miles from the city center. Travis Ditch begins 2.8 miles the city center. Because outlets(streams, ditches, etc.) for sewage were far removed and it was undesireable to discharge sewage into the lakes, LaPorte constructed large diameter mains(78", 48", 36",

I:\WP\DATA\CSO\Srcer\srcer.doc 4
and 60") to convey combined flows out of the city for disposal. The WWTP was constructed in 1939. LaPorte modeled its sewer system to develop a replacement sewer design for the Fox Street Combined Sewer. The Fox Street project replaced a failing 100 year old sewer in more efficiently conveys combined flows to the CSO Lagoon for storage. The model was also used to develop the Clark Park Offline Storage Facility design and the Darlington/Factory St Sewer Separation. Clark Park and Darlington/Factory projects are both designed to reduce basement backup and street flooding. All three projects have been funded by the State Revolving Loan Fund(SRF)

I:\WP\DATA\CSO\Srcer\srcer.doc 5
III. Discussion a. CSO Volume and Frequency The following table describes the volume, frequency, and duration of CSO events for the years 1996-2001(partial year to July 31).
Year
CSO Events (#)
Calendar Days in which CSO
occurred
Total Discharge Duration
(days)
Volume (MG)
1996 46 165 No Data 211.74 1997 52 209 197.50 151.00 1998 32 74 50.36 70.80 1999 3 6 4.90 12.02 2000 3 7 3.70 10.30
20011 2 5 2.56 7.66 1 Partial Year - January to July 31 Construction of the CSO Lagoon Return pump station took place in 1998 and operated for the first full year in 1989. The pump station allows the lagoon to be drawn down and store up to 10 million gallons when the treatment plant capacity is exceeded during storm events. Construction of the pump station eliminated 93% of CSO discharges by volume. Flows from significant rain events are tabulated and graphed in Appendix B for the period 1996 to July 2001. Linear regression was used to draw a best fit line through the data. With 11 million gallons of storage and approximately 1 additional million gallons of flow through the WWTP, the system can usually hold and treat 12 million gallons of flow prior to a combines sewer overflow occurring. The correlation line suggests that a rain of about 1.6 inches can be held prior to overflow. This result agrees with previous experience. Note that the volume of combined flow delivered to the WWTP varies considerable for a given size storm. b. CSO Flows For Event Studied Appendix C contains charts showing CSO flow and WWTP flow for each of the 5 events studied. The WWTP influent flow is controlled by two gates, which are modulated by the WWTP SCADA system to maintain a chosen influent flow. The system allows the WWTP to automatically operate at maximum flow without operator intervention. Currently, the influent flow controller setpoint is 9.7 MGD. CSO flow can be a significant percentage of the total flow in Travis Ditch at its Travis Ditch's beginning. The following table displays the maximum proportion of CSO flow in Travis Ditch as a percentage.

I:\WP\DATA\CSO\Srcer\srcer.doc 6
Maximum Proportion of CSO in Travis Ditch Flow
Date
Time
WWTP Flow
(MGD)
WWTP Portion of
Travis Ditch Total
Flow
CSO Flow
(MGD)
CSO Portion of
Travis Ditch Total
Flow
Travis
Ditch Total Flow
(MGD) 4/20/00 20:35 8.62 74% 3.05 26% 11.67 6/24/00 01:08 9.06 35% 16.70 65% 25.76 9/12/00 05:46 8.96 27% 24.56 73% 33.52 2/25/01 00:12 8.85 40% 13.46 60% 22.31 7/7/01 09:39 8.94 31% 19.53 89% 28.47
WWTP effluent flow varies periodically with discharges from the batch process fixed-bed trickling filter. Consequently, effluent flow is periodically higher and then lower than the influent flow. When wet weather flow from the sewer system subsides, the CSO Lagoon pumps start automatically. The WWTP influent flow usually falls well below maximum capacity(9.0 MGD) while the lagoon is being emptied as the CSO Lagoon pumping station pumping capacity is not large enough to keep the WWTP at maximum. Increasing the CSO Lagoon pumping station capacity would decrease the time needed to empty the lagoon. With current pump capacity, it takes about 5 days to empty the lagoon. b. CSO Quality Water quality data is contained in Appendix D. Discussion of the water quality data follows on a parameter by parameter basis. Strength of CSO discharge did not exhibit the "first flush" behavior common in CSO's located in the collection system. The CSO Lagoon accumulates 11 MG of combined sewage prior to discharge, so that the first flush is diluted with later flows. Floatables The outlet of the CSO Lagoon is baffled to prevent floatables from being discharged to Travis Ditch. Floatables become trapped between the discharge weir and the baffle when the lagoon is lowered and then filled. This small amount of trapped floatables is then discharged when a CSO event occurs. Cadmium, Nickel, Zinc, Copper, Chromium, CBOD All samples were below WWTP discharge limitations. Lead Lead was a significant pollutant in the two 2001 events, exceeding the WWTP NPDES daily maximum in both of the events. For one sample from the event of 2/24/01, the lead

I:\WP\DATA\CSO\Srcer\srcer.doc 7
concentration was slightly more than double the daily maximum limitation. Dilution by the WWTP flow is insufficient to consistently gain compliance for lead. Samples of sludge from the CSO lagoon have show lead concentration exceeding the 503 land application ceiling concentration. As the WWTP's sludges have historically had low lead concentrations, the CSO Lagoon lead may result from run-off, possible due to leaded gasoline. Cyanide Two samples for the event of 2/24/01 had cyanide concentrations very slightly above the daily maximum value. AMPCOR II, a metal plater in LaPorte that uses cyanide in its process, reported concentrations well below its limit for the month of February. Monitoring done by the WWTP also showed AMPCOR II's cyanide concentrations well below their permit limit. LaPorte has demonstrated that ferro cyanide compounds in road salt can cause the WWTP to exceed its discharge limitation. It is likely the source of cyanide in this winter CSO event was road salt. TSS Four of five CSO events exceeded the WWTP NPDES weekly maximum concentration for total suspended solids. TSS concentration during the event of 2/24/01 were much higher than other events. TSS concentrations exceeded the limitation by more than 4 times. This event was the only winter event - the flow of cold water into the shallow lagoon likely was not conducive to good settling. Dilution by WWTP flow was insufficient to gain compliance. Ammonia Ammonia concentrations consistently exceeded the WWTP NPDES weekly maximum limitation. Dilution by the WWTP flow would result in compliance for the majority of samples. E. Coliform E. coliform concentrations were consistently greater than 200,000 colonies per 100 ml. Dilution by WWTP flow was insufficient to gain compliance. Dissolved Oxygen Dissolved oxygen concentrations were less than the WWTP NPDES daily minimum limitation for all events except the winter event of 2/2/4/01. Dilution by WWTP flow generally insufficient to gain compliance.

I:\WP\DATA\CSO\Srcer\srcer.doc 8
pH The WWTP NPDES weekly minimum limitation was exceeded during the first three samples of the winter event(2/24/01). Dilution by WWTP flow was sufficient to gain compliance.

I:\WP\DATA\CSO\Srcer\srcer.doc 9
IV. Summary The Stream Reach Characterization and Evaluation demonstrated that discharges from CSO outfall 002 do not meet water quality standards lead, cyanide, TSS, ammonia, E. coliform, dissolved oxygen, and pH. Travis ditch stream quality is impaired by these discharges an average of 3.7 days per year.

I:\WP\DATA\CSO\Srcer\srcer.doc 10
Appendix A - Location Maps and Flow Diagrams

Lo.Porte \v'\v'TP
CSD Lo.goon 17 Acres
(
{
CSD Lo.goon Dutfo.ll 002 V./V./T Dutfo.ll 001 Sto.rt of Tro. vis Ditch
LAPORTE \v'\v'TP DRA\v'N BY DM\v'/JPJ
• • 0 • N
SCALE: 1" - 2400' DATE:07 /30/2001 PAGE 1/1

0
Ma.jor Conduits LAPORTE 'v/'v/TP DRA 'v/N BY DM'v/ I JP J
Item 1 Junction Chamber 2 Screening(2) 3 Grit Removal(2)
0
4 Primary Clarification( 4)
N
5 Primary Effluent Pump Station 6 Rotary Trickling Filter(1) 7 Fixed-Bed Trickling Filter(1) 8 Secondary Clarification(2) 9 Biotower Pump Station 10 Biotower(nitrification trickling filter)(2) 11 Tertiary Clarification(2) 12 Chlorine Contact Tank(1) 13 Primary Digester #1 14 Primary Digester #2 15 Secondary Digester 16 Sludge Storage Tank 17 CSO Lagoon Pumping Station
SCALE: 1" = 1200' DATE: 8/09/99 PAGE 1/1

Page 1Copyright © 1988-2000 Microsoft Corp. and/or its suppliers. All rights reserved. http://www.microsoft.com/Streets© Copyright 1999 by Geographic Data Technology, Inc. All rights reserved. © 1999 Navigation Technologies. All rights reserved. This data includes information taken with permission from Canadian authorities © Her Majesty the Queen in Right of Canada. © Copyright 1999 by Compusearch Micromarketing Data and Systems Ltd.
LP_WWTP_Outfall
0 mi 0.5 1 1.5 2

CSD Lo.goon
Lo.Porte \v'\v'TP NP DES IN0025577 1 inch = 20 feet 6/18/01
Dutf o.ll 002 CSD L o.goon Outlet
~- Dutfo.ll 001 ( 2 ) 2 4 // P i p e s

I:\WP\DATA\CSO\Srcer\srcer.doc 11
Appendix B - Wet Weather Flow Historical Data

0 0.5 1 1.5 2 2.5 3
Rainfall(inch)
0
5
10
15
20
25
30
35
Incr
ease
d S
ewag
e V
olum
e(M
G)
Increased Flow 8.2 x Rain -1.0
Combined Sewer Increaseto 3" rain
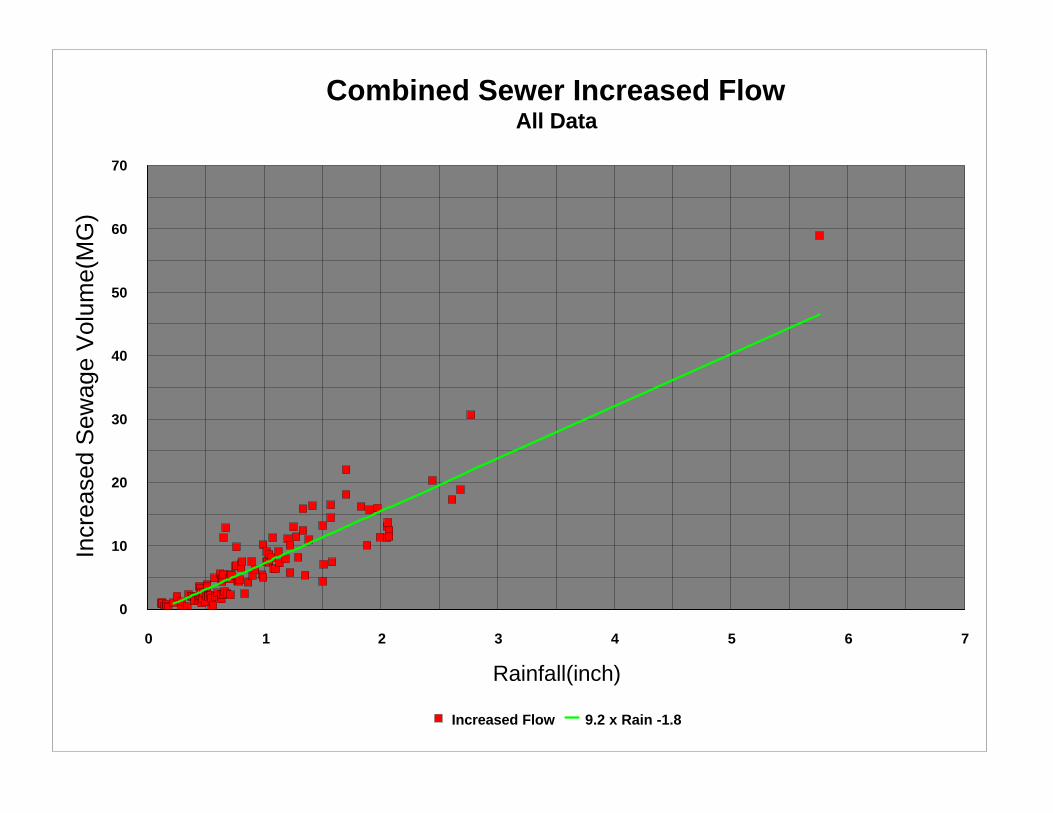
0 1 2 3 4 5 6 7
Rainfall(inch)
0
10
20
30
40
50
60
70
Incr
ease
d S
ewag
e V
olum
e(M
G)
Increased Flow 9.2 x Rain -1.8
Combined Sewer Increased FlowAll Data

Increased Increased Initial Final Volume Event Recursion Recursion 2) stored volume = final level - initial levelPlant CSO Lagoon Lagoon Stored Total Line Line 3) if overflow occurs, stored = weir height - initial level
Rainfall Flow Level Level Flow #1 #1 4) Event total = increased plant flow + stored volume + cso volumeDate (inch) (mg) (mg) (ft) (ft) (mg) (mg) Notes
06/01/1997 0.12 0.10 0.80 0.9003/24/1997 0.12 0.85 0.29 1.1308/14/1999 0.13 0.36 0.54 0.9004/11/1997 0.14 0.22 0.27 0.4905/15/1997 0.16 0.77 0.08 0.8507/27/1997 0.16 0.01 0.49 0.5006/21/1997 0.18 0.00 0.23 0.2311/17/1996 0.22 0.62 0.46 1.07 0.82 0.2106/14/2000 0.25 0.30 0.00 1.40 1.72 1.77 2.07 1.07 0.4910/22/1996 0.29 0.38 0.26 0.64 1.39 0.86 Two rains, 10/22/96(0.29"), 10/23/96(0.11")05/07/1997 0.29 0.33 0.85 1.18 1.39 0.8601/15/1997 0.34 0.20 0.26 0.46 1.81 1.3203/09/1997 0.35 0.94 1.44 2.37 1.89 1.4105/18/1997 0.37 0.67 1.40 2.07 2.05 1.5912/22/1997 0.38 1.17 0.25 0.89 1.00 0.61 2.03 2.14 1.6810/13/1997 0.40 1.57 0.28 1.85 2.30 1.8706/26/2000 0.40 0.00 0.44 2.84 3.39 0.89 1.33 2.30 1.8712/24/1997 0.43 0.56 0.95 1.00 1.00 0.00 1.51 2.55 2.1402/04/1997 0.44 1.59 2.06 3.64 2.63 2.2310/08/1996 0.44 1.54 0.31 1.85 2.63 2.2306/09/1998 0.45 0.55 0.00 0.88 1.17 1.61 2.16 2.71 2.3209/20/1998 0.45 0.65 0.00 0.16 0.63 2.60 3.25 2.71 2.3211/29/1996 0.46 2.01 0.68 2.69 2.80 2.42 Two rains, 11/29/96(0.36"), 11/30/96(0.10")06/25/1997 0.46 0.00 0.44 0.89 1.00 0.61 1.05 2.80 2.4207/21/1997 0.47 0.21 1.46 1.67 2.88 2.5104/09/1998 0.48 0.00 0.31 1.53 2.21 2.60 2.60 2.96 2.6004/24/1997 0.49 0.47 0.71 1.18 3.04 2.6908/21/1997 0.50 0.60 1.58 2.18 3.13 2.7803/13/1997 0.51 1.30 2.66 3.96 3.21 2.8712/11/1996 0.51 1.75 1.79 3.54 3.21 2.8702/16/1998 0.52 1.33 0.00 0.10 0.26 0.89 2.21 3.29 2.97 Two rain events, 02/16/98(0.18"), 02/17/98(0.34")05/24/1998 0.52 0.00 0.00 0.95 1.31 1.99 1.99 3.29 2.9707/18/1997 0.54 0.00 1.74 0.92 1.00 0.44 2.18 3.46 3.1506/18/1998 0.55 0.00 0.00 0.00 0.00 3.54 3.2410/29/1996 0.55 0.68 0.97 1.65 3.54 3.2403/05/1999 0.56 0.00 0.00 0.13 0.25 0.66 0.66 3.62 3.3307/05/2000 0.57 1.47 0.00 1.66 2.29 3.49 4.96 3.70 3.4205/05/1997 0.58 0.38 1.67 2.05 3.79 3.5207/22/1998 0.60 0.00 0.00 1.12 1.59 2.60 2.60 3.95 3.7007/06/1997 0.62 0.38 5.24 5.62 4.12 3.8807/10/2000 0.63 2.32 0.00 1.27 1.71 2.44 4.76 4.20 3.9705/24/1997 0.63 0.36 1.28 1.64 4.20 3.97 Two rain events, 5/24/97(0.25"), 2/25/97(0.38")02/26/2000 0.63 0.96 0.00 0.25 0.51 1.44 2.40 4.20 3.9708/22/1996 0.64 0.30 4.12 4.42 4.28 4.0704/20/1998 0.64 1.55 0.24 1.44 2.14 3.10 4.89 4.28 4.0711/09/1998 0.65 2.88 0.00 0.13 1.65 8.42 11.30 4.36 4.1609/17/1997 0.65 -0.79 3.17 2.38 4.36 4.16

Increased Increased Initial Final Volume Event Recursion Recursion 2) stored volume = final level - initial levelPlant CSO Lagoon Lagoon Stored Total Line Line 3) if overflow occurs, stored = weir height - initial level
Rainfall Flow Level Level Flow #1 #1 4) Event total = increased plant flow + stored volume + cso volumeDate (inch) (mg) (mg) (ft) (ft) (mg) (mg) Notes
10/06/1998 0.65 1.61 0.00 0.14 0.85 3.93 5.54 4.36 4.1608/23/1998 0.66 2.86 0.00 0.00 2.86 4.45 4.25 two days01/21/1997 0.67 5.18 7.68 12.86 4.53 4.34 Two rains, 1/21/97(0.56"), 1/22/97(0.11")04/05/1997 0.68 -0.11 2.65 2.55 4.61 4.4305/23/1999 0.70 0.67 0.00 0.23 0.98 4.15 4.82 4.78 4.6208/24/1997 0.71 -0.05 2.33 2.28 4.86 4.7103/31/1998 0.71 1.20 4.34 2.00 2.00 0.00 5.54 4.86 4.71 Two rain events, 03/08/98(1.08"), 03/09/98(0.80")07/14/2000 0.72 1.35 0.00 1.21 1.93 3.99 5.34 4.94 4.8005/14/2001 0.75 1.95 1.23 2.11 4.87 6.82 5.19 5.0801/17/1999 0.76 2.60 0.00 0.36 1.67 7.26 9.86 5.27 5.1708/17/2000 0.76 1.33 0.00 1.42 2.43 5.59 6.92 5.27 5.1703/28/1997 0.77 0.67 3.85 4.51 5.35 5.2611/01/1999 0.78 1.29 0.00 1.17 1.74 3.16 4.45 5.43 5.3512/01/1996 0.79 1.80 2.86 4.66 5.52 5.4410/03/1999 0.80 1.56 0.00 0.15 1.16 5.59 7.15 5.60 5.5308/19/1999 0.80 1.64 0.00 0.20 1.10 4.99 6.63 5.60 5.5303/28/1998 0.81 0.51 3.95 1.44 2.00 3.10 7.55 5.68 5.6306/12/2000 0.83 1.23 0.00 0.28 0.51 1.27 2.50 5.85 5.8110/26/1997 0.86 1.88 1.87 0.90 1.00 0.55 4.30 6.09 6.0806/21/2001 0.89 1.55 1.09 2.18 6.04 7.59 6.34 6.3605/28/1997 0.90 1.33 4.03 5.37 6.42 6.45 Two rain events, 5/28/97(0.57"), 2/29/97(0.33")07/31/1999 0.92 0.27 0.00 0.26 1.34 5.98 6.25 6.59 6.6305/09/2000 0.98 1.63 0.00 0.12 0.81 3.82 5.45 7.08 7.1802/10/1998 0.99 0.36 0.03 0.15 1.00 4.71 5.08 7.17 7.28 Two rain events, 02/10/98(0.14"), 02/11/98(0.85")04/13/1998 0.99 0.00 6.74 1.38 2.69 3.43 10.18 7.17 7.2806/05/2001 1.02 2.59 1.12 2.00 4.87 7.46 7.41 7.5507/03/2000 1.02 2.60 0.00 1.29 2.47 6.54 9.14 7.41 7.5508/06/2000 1.03 0.67 0.00 1.34 2.57 6.81 7.48 7.50 7.6405/07/1998 1.04 0.89 1.42 1.08 2.40 5.10 7.41 7.58 7.7408/24/1999 1.04 1.54 0.04 0.19 1.47 7.09 8.67 7.58 7.7406/20/2000 1.06 0.55 0.00 1.49 2.87 7.64 8.19 7.74 7.92 CSO Lagoon meter zero lowered 1 foot to allow measurement of lower pumpdown of lagoon12/23/1996 1.07 3.28 8.01 11.29 7.83 8.0106/16/1997 1.08 0.42 6.02 6.44 7.91 8.1008/13/1999 1.10 2.51 0.00 0.20 0.91 3.93 6.44 8.07 8.2906/13/2000 1.12 1.43 0.00 0.52 1.91 7.70 9.13 8.24 8.4706/15/2001 1.13 1.50 1.48 2.53 5.82 7.32 8.32 8.5606/06/1997 1.18 0.67 7.32 7.99 8.73 9.0207/07/1998 1.20 1.00 7.61 1.54 3.01 2.55 11.15 8.90 9.2006/05/2000 1.22 3.07 0.00 0.20 1.48 7.09 10.16 9.06 9.3909/26/1996 1.22 3.50 2.32 5.82 9.06 9.39 Two rains, 9/26/96(0.73"), 9/27/96(0.49")08/12/1997 1.25 1.33 11.70 13.03 9.31 9.6601/21/1999 1.27 3.75 2.85 1.12 2.50 4.87 11.47 9.47 9.8406/26/1999 1.29 1.25 0.00 0.60 1.86 6.98 8.23 9.64 10.0306/11/2001 1.33 6.70 1.17 2.21 5.76 12.46 9.97 10.39 Two rain events, 6/11/01(0..85"), 6/12/01(0.48")02/26/1997 1.33 4.03 11.84 15.87 9.97 10.39 Two rain events, 2/26/97(1.21"), 2/27/97(0.12")04/30/1997 1.35 0.58 4.82 5.40 10.13 10.5808/07/1996 1.38 1.60 9.40 11.00 10.38 10.85 Two rains, 8/7/96(0.85"), 8/8/96(0.53")

Increased Increased Initial Final Volume Event Recursion Recursion 2) stored volume = final level - initial levelPlant CSO Lagoon Lagoon Stored Total Line Line 3) if overflow occurs, stored = weir height - initial level
Rainfall Flow Level Level Flow #1 #1 4) Event total = increased plant flow + stored volume + cso volumeDate (inch) (mg) (mg) (ft) (ft) (mg) (mg) Notes
08/09/1998 1.41 3.68 7.94 1.15 3.01 4.71 16.32 10.63 11.1304/05/2001 1.50 3.98 1.04 2.71 9.25 13.23 11.37 11.95 Two rain events, 4/05/01(0.56"), 4/06/01(0.94")11/27/1997 1.50 2.34 1.44 0.88 1.00 0.66 4.44 11.37 11.9509/12/1996 1.51 2.71 4.41 7.12 11.45 12.05 Four rains, 9/12/96(0.39"), 8/13/96(0.81"), 8/14/99(0.23"), 8/15/99(0.08")06/11/1998 1.57 1.24 8.63 1.17 2.80 4.60 14.47 11.95 12.60 6/11+6/1202/08/2001 1.57 6.51 1.01 2.81 9.97 16.48 11.95 12.60 Two rain events, 2/08/01(0.41"), 2/09/01(1.16")07/23/1997 1.58 0.04 7.44 7.48 12.03 12.6902/24/2001 1.70 7.35 3.71 1.02 3.74 10.97 22.03 13.02 13.7902/24/2001 1.70 3.50 3.71 1.02 3.00 10.97 18.18 13.02 13.7908/04/1998 1.83 6.26 0.47 0.08 1.80 9.53 16.26 14.09 14.9803/08/1998 1.88 3.27 5.21 0.70 1.00 1.66 10.14 14.50 15.44 Two rain events, 03/08/98(1.08"), 03/09/98(0.80")04/19/2000 1.90 4.91 0.56 0.15 2.44 10.25 15.72 14.67 15.6211/06/1996 1.97 10.28 5.70 15.98 15.25 16.26 Four rains, 11/07/96(0.39"), 11/08/96(0.96"), 11/9/96(0.25"), 11/10/96(0.40")07/01/1999 1.99 0.91 2.78 0.61 2.83 7.70 11.39 15.41 16.4508/16/1997 2.05 0.85 12.22 13.07 15.91 17.00 Two rain events, 8/16/97(1.40"), 8/17/97(0.65")07/03/1998 2.05 0.00 6.67 1.16 2.97 4.65 11.32 15.91 17.0010/17/1996 2.06 2.37 11.39 13.76 15.99 17.0906/24/2000 2.07 1.77 3.19 1.64 3.74 7.53 12.49 16.07 17.1806/30/1997 2.07 1.14 10.36 11.50 16.07 17.1802/20/1997 2.44 5.11 15.26 20.37 19.12 20.58 Four rain events, 2/20/97(0.82"), 2/21/97(1.46"), 2/22/97(0.14"). 2/23/97(0.02")07/07/2001 2.61 3.77 3.95 1.26 3.87 9.64 17.36 20.52 22.1304/22/1999 2.68 2.60 6.36 0.20 3.06 9.97 18.93 21.10 22.7801/03/1998 2.77 15.46 14.62 0.89 1.00 0.61 30.68 21.84 23.60 Six rain events, 01/03/98(0.34"), 01/04/98(0.61"), 01/05/98(0.73"), 01/06/98(0.11"), 01/07/98(0.41"), 01/07/98(0.57")07/18/1996 5.76 6.00 52.99 58.99 46.49 51.02

I:\WP\DATA\CSO\Srcer\srcer.doc 12
Appendix C - CSO and WWTP Event Flow Charts

03:30 07:30 11:30 15:30 19:30 23:30 03:30 07:30 11:30
Time of Day
0
2
4
6
8
10
12
Flo
w(M
GD
)
WWTP
CSO
CSO EventApril 20, 2000

17:0
0:00
21:0
0:00
01:0
0:00
05:0
0:00
09:0
0:00
13:0
0:00
17:0
0:00
21:0
0:00
01:0
0:00
05:0
0:00
09:0
0:00
13:0
0:00
17:0
0:00
21:0
0:00
01:0
0:00
05:0
0:00
09:0
0:00
13:0
0:00
Time of Day
0
5
10
15
20
Flo
w(M
GD
)
WWTP
CSO
CSO EventJune 24, 2000

16:00:0020:00:00
00:00:0004:00:00
08:00:0012:00:00
16:00:0020:00:00
00:00:0004:00:00
Time of Day
0
5
10
15
20
25
30
Flo
w(M
GD
)
WWTP
CSO
CSO EventSeptember 11, 2000

08:00:0012:00:00
16:00:0020:00:00
00:00:0004:00:00
08:00:0012:00:00
16:00:0020:00:00
00:00:00
Time of Day
0
5
10
15
Flo
w(M
GD
)
WWTP
CSO
CSO EventFebruary 24, 2001

05:00:0009:00:00
13:00:0017:00:00
21:00:0001:00:00
05:00:0009:00:00
13:00:00
Time of Day
0
5
10
15
20
25
Flo
w(M
GD
)
WWTP
CSO
CSO EventJuly 7, 2001

I:\WP\DATA\CSO\Srcer\srcer.doc 13
Appendix D - CSO and WWTP Water Quality

Stream Reach and Characterization Evaluation Report - SummaryLaPorte WWTP
Exceedance of Daily or Weekly NPDES(Outfall 001) Limits*
CSO Dissolved
Rainfall Flow Duration Pb CN TSS NH3 E. Coliform Oxygen pH
Event Date (inch) (mg) (days) (mg/l) (mg/l) (mg/l) (mg/l) (mg/l) (mg/l) (mg/l)
1 04/20/2000 0.66+1.24 = 1.90 1.90 1.00 1(comp) 10 of 10 3 of 3
2 06/24/2000 2.07+0.40 = 2.47 3.98 2.20 1(comp) 10 of 10 6 of 6
3 09/12/2000 2.35+1.00 = 3.35 5.73 0.60 5 of 8 8 of 8 8 of 8 8 of 8
4 02/24/2001 1.70 3.71 1.22 4 of 4 2 of 4 8 of 8 3 of 8 3 of 8
5 07/07/2001 2.61 3.95 1.34 3 of 4 8 of 8 3 of 8 8 of 8 8 of 8
* Exceedances are given in the form (# of exceedances) of (#of samples)Note that dilution by the WWTP flow was not considered in the above analysis.

CSO Overflow sampling Results City of LaPorte WWTP
CompositeParameters Results Start Time + minutes End Time
Date Start Time (mg/l) (mg/l) 15m 30m 45m 60m 75m 90m 105m 120m 150m 180m Limit Notes:04/20/2000 01:30 PM Cd <0.0005 daily max 0.005 mg/l
3 Hr Composite Pb <0.005 daily max 0.02 mg/lNi <0.010 daily max 0.16 mg/lZn 0.031 daily max 0.50 mg/lCu <0.010 daily max 0.055 mg/lCr <0.010 daily max 0.94 mg/lCN NA daily max 0.009 mg/l
CBOD 3HR Comp 7.300 wkl avg 30/40 mg/l*TSS 3HR Comp 27.500 wkl avg 36/45 mg/l*NH3 3HR Comp 2.880 wkl avg 2.4/2.7 mg/l*
Coliform TNTC TNTC TNTC TNTC TNTC TNTC TNTC TNTC TNTC TNTC dly max 235 col/100ml TNTC = >200,000D.O. 3.3 3.6 3.7 dly min 6.0 mg/lpH 6.985 6.0 / 9.0 SU min/max
* Summer / winter limits

CSO Overflow sampling Results City of LaPorte WWTP
CompositeParameters Results Start Time + minutes End Time
Date Start Time (mg/l) (mg/l) 15m 30m 45m 60m 75m 90m 105m 120m 150m 180m Limit Notes:06/24/2000 10:30 PM Cd <0.0005 daily max 0.005 mg/l
3 Hr Composite Pb 0.01 daily max 0.02 mg/lNi <0.010 daily max 0.16 mg/lZn 0.028 daily max 0.50 mg/lCu 0.017 daily max 0.055 mg/lCr <0.010 daily max 0.94 mg/lCN <0.005 daily max 0.009 mg/l
CBOD 3HR Comp 11 wkl avg 30/40 mg/l*TSS 3HR Comp 38.5 wkl avg 36/45 mg/l*NH3 3HR Comp 2.37 wkl avg 2.4/2.7 mg/l*
Coliform 30850 TNTC TNTC TNTC TNTC TNTC TNTC TNTC TNTC TNTC dly max 235 col/100ml TNTC = >200,000D.O. 2.6 2 2 1.9 1.8 1.8 1.8 dly min 6.0 mg/lpH 7.2 7.14 7.3 7.25 7.22 6.92 6.72 6.0 / 9.0 SU min/max

CSO Overflow sampling Results City of LaPorte WWTP
Parameters Start Time + minutes End TimeDate Start Time (mg/l) 15m 30m 45m 60m 75m 90m 105m 120m 150m 180m Limit Notes:
09/12/2000 12:30 AM Cd <0.0005 <0.0005 <0.0005 <0.0005 daily max 0.005 mg/lPb 0.009 0.010 0.015 0.018 daily max 0.02 mg/lNi <0.010 0.011 0.014 <0.010 daily max 0.16 mg/lZn 0.051 0.063 0.084 0.104 daily max 0.50 mg/lCu 0.030 0.042 0.044 0.044 daily max 0.055 mg/lCr 0.011 0.015 0.018 0.024 daily max 0.94 mg/lCN <0.005 <0.005 <0.005 <0.005 daily max 0.009 mg/lCBOD 16.5 18 16 17 15 14 14.5 14 wkl avg 30/40 mg/l*TSS 31 29 36 59 47 58 54 52 wkl avg 36/45 mg/l*NH3 6.15 5.51 5.48 4.35 4.23 4.14 4.23 4.21 wkl avg 2.4/2.7 mg/l*Coliform TNTC TNTC TNTC TNTC TNTC TNTC TNTC TNTC dly max 235 col/100ml TNTC = >200,000D.O. 1.9 1.7 1.8 1.8 1.9 1.8 1.8 1.8 dly min 6.0 mg/lpH 7.17 7.16 7.29 7.22 7.26 7.18 7.27 7.16 6.0 / 9.0 SU min/max

CSO Overflow sampling Results City of LaPorte WWTP
Parameters Start Time + minutes End TimeDate Start Time (mg/l) 15m 30m 45m 60m 75m 90m 105m 120m 150m 180m Limit Notes:
02/24/2001 07:05 PM Cd <0.0005 0.0006 <0.0005 0.0005 daily max 0.005 mg/lPb 0.026 0.042 0.033 0.040 daily max 0.02 mg/lNi <0.010 <0.010 0.014 0.012 daily max 0.16 mg/lZn 0.153 0.168 0.150 0.162 daily max 0.50 mg/lCu 0.017 0.028 0.023 0.026 daily max 0.055 mg/lCr <0.010 <0.010 <0.010 0.018 daily max 0.94 mg/lCN <0.005 0.010 0.008 0.010 daily max 0.009 mg/lCBOD 21.5 22.0 20.7 20.0 19.0 18.7 19.0 16.0 wkl avg 30/40 mg/l*TSS 150 200 198 188 170 166 184 142 wkl avg 36/45 mg/l*NH3 4.22 2.06 2.15 2.06 2.76 2.45 2.13 3.15 wkl avg 2.4/2.7 mg/l*Coliform dly max 235 col/100mlD.O. 8.5 10.3 10.5 10.1 9.5 9.8 10.3 8.4 dly min 6.0 mg/lpH 5.92 5.22 5.28 6.1 6.78 6.79 6.89 6.84 6.0 / 9.0 SU min/max Avg temp = 3.6°C
* Summer / winter limits

CSO Overflow sampling Results City of LaPorte WWTP
Parameters Start Time + minutes End TimeDate Start Time (mg/l) 15m 30m 45m 60m 75m 90m 105m 120m 150m 180m Limit Notes:
07/07/2001 07:50 AM Cd <0.0005 <0.0005 <0.0005 <0.0005 daily max 0.005 mg/lPb 0.018 0.023 0.028 0.026 daily max 0.02 mg/lNi <0.010 0.013 <0.010 <0.010 daily max 0.16 mg/lZn 0.074 0.062 0.088 0.077 daily max 0.50 mg/lCu 0.021 0.027 0.041 0.042 daily max 0.055 mg/lCr <0.010 <0.010 <0.010 <0.010 daily max 0.94 mg/lCN <0.005 <0.005 <0.005 <0.005 daily max 0.009 mg/lCBOD 9 11.5 8.5 14.0 12 11.5 12.5 10.5 wkl avg 30/40 mg/l*TSS 98 47 73 69 73 70 79 67 wkl avg 36/45 mg/l*NH3 6.32 10.51 4.08 3.24 3.46 3.76 3.73 3.17 wkl avg 2.4/2.7 mg/l*Coliform 3600 TNTC TNTC TNTC TNTC TNTC TNTC TNTC dly max 235 col/100ml TNTC = >200,000D.O. 5.4 3.6 4.6 5.0 4.6 4.4 4.6 5.0 dly min 6.0 mg/lpH 6.7 6.11 6.5 6.52 6.58 6.94 6.85 6.89 6.0 / 9.0 SU min/max
* Summer / winter limits

MONTHLY REPORT OF OPERATIONTrickling Filter Wastewater Treatment Plant
Date: Apr-00 LaPorte Wastewater Treatment Plant Page 2 of 6
2101 Boyd Boulevard
LaPorte IN, 46350 Permit # IN0025577
Certified Operator : Jerry P Jackson
Final Effluent Certification Number : 11496
Chlorine Effluent
CBOD CBOD CBOD CBOD TSS TSS TSS TSS NH3-N NH3-N NH3-N NH3-N Dissolved Aerators Tank Escherichia Chlorine
Day of Day of pH in weekly av in weekly av in weekly av in weekly av in weekly av in weekly av Oxygen run Residual Coliform Residual
the the mg/L in lbs/Day in mg/L in lbs/Day in mg/L in lbs/Day in in in in (Colonies in
Month Week mg/L lbs/Day mg/L lbs/Day mg/L lbs/Day mg/L hours mg/L /100mL) mg/L
1 Sat 7.44 < 2 3 25 84 5 5 127 134 0.36 0.29 9 8 10.3 1.72 4 < 0.0062 Sun 7.31 3 78 11 277 0.39 10 8.9 1.67 0 < 0.0063 Mon 7.27 3 83 4 101 0.46 12 9.3 1.56 3 < 0.0064 Tue 7.47 2 58 4 102 0.42 10 9.8 1.73 1 < 0.0065 Wed 7.70 4 87 9 200 0.29 6 10.1 1.55 2 < 0.0066 Thu 7.21 6 149 15 385 0.43 11 10.1 1.51 0 < 0.0067 Fri 7.36 11 531 19 902 2.44 114 10.6 1.62 0 < 0.0068 Sat 7.40 6 5 343 190 12 11 674 377 0.74 0.74 42 29 10.3 1.53 2 < 0.0069 Sun 7.51 6 248 10 386 0.43 18 10.2 1.57 0 < 0.006
10 Mon 7.50 5 134 6 168 0.65 18 11.2 1.46 0 < 0.00611 Tue 7.31 4 90 10 224 0.42 10 10.4 1.52 0 < 0.00612 Wed 7.61 5 106 8 177 0.38 8 10.3 1.91 0 < 0.00613 Thu 7.28 5 150 22 667 0.44 13 9.9 1.70 0 < 0.00614 Fri 7.33 4 110 10 276 0.30 8 10.3 1.56 0 < 0.00615 Sat 7.29 3 4 67 129 15 11 370 324 <0.20 0.39 2 11 9.6 1.52 0 < 0.00616 Sun 7.45 4 89 13 310 0.35 8 9.3 1.66 0 < 0.00617 Mon 7.39 4 162 18 690 0.48 19 9.6 1.57 0 < 0.00618 Tue 7.34 3 101 23 669 0.22 7 10.1 1.57 4 < 0.00619 Wed 7.46 6 227 26 1056 0.81 33 9.5 1.70 3 < 0.00620 Thu 6.98 6 392 23 1605 0.32 23 10.0 1.56 4 < 0.00621 Fri 7.14 3 148 9 464 0.21 11 10.7 1.47 158 < 0.00622 Sat 7.46 4 4 170 184 11 17 487 755 <0.20 0.36 4 15 10.0 1.53 2 < 0.00623 Sun 7.65 4 206 10 469 0.67 31 9.9 1.68 2 < 0.00624 Mon 7.22 4 192 12 513 0.32 14 10.0 1.44 55 < 0.00625 Tue 7.45 4 153 11 435 0.39 16 10.0 2.01 2 < 0.00626 Wed 7.44 4 107 8 237 <0.20 3 10.0 1.40 5 < 0.00627 Thu 7.76 3 90 11 292 0.22 6 10.4 1.49 0 < 0.00628 Fri 7.43 3 77 7 175 0.22 6 10.0 1.41 0 < 0.00629 Sat 7.36 3 4 64 127 10 10 230 336 0.40 0.33 9 12 10.3 1.43 1 < 0.00630 Sun 7.48 4 90 13 305 <0.20 2 10.4 1.52 0 < 0.006
AVERAGE 7.40 4 151 12 432 0.44 16 10.1 1.59 2 < 0.006MAXIMUM 7.76 11 5 531 190 26 17 1605 755 2.44 0.74 114 29 11.2 2.01 158 < 0.006MINIMUM 6.98 <2 25 4 101 <0.20 2 8.9 1.40 0 < 0.006
# OF DATA 30 30 30 30 30 30 30 30 30 30 30TOTAL 222 126 4527 362 12972 13 485 301.5 47.57 248 < 0.006

MONTHLY REPORT OF OPERATIONTrickling Filter Wastewater Treatment Plant
Date: Apr-00 Page 6 of 6
Permit # IN0025577
Certified Operator : Jerry P Jackson
Total lbs Volatile Certification Number : 11496
Solids to Digester 4,169 TREATMENT Total Number
Monthly Removal Summary EQUIPMENT available in service
PRIMARYOverall Percent Removal Percent Removal : CBOD TSS AMMONIA CLARIFIER TANKS 4 4
of Volatile Solids 56.5% Primary Treatment : 21% 41% -4%Secondary Treatment : 82% 73% 56% SECONDARYTertiary Treatment : 70% 32% 95% CLARIFIER TANKS 2 2Overall Treatment : 96% 89% 98%
Equivalent Population FINALTreated in CLARIFIER TANKS 2 2
(lbs Raw CBOD per Day / 0.17) 19,676
ROTARY FILTER 1 1
Rotary
Filter Hydraulic Loading Rate FIXED BED FILTER 1 1(Gallon / Day / Sq Ft) 470 Detention Time (Hours) Maximum Minimum Average
Primary Settling Tank 4.6 1.4 3.0Secondary Settling Tank 3.4 1.0 2.2 BIOTOWERS 2 2
Fixed Bed Final Settling Tank 10.6 3.3 7.0Filter Hydraulic Loading Rate Total Plant Retention Time 18.5 5.8 12.2
(Gallon / Day / Sq Ft) 78
Biotower
Filter Hydraulic Loading Rate Monthly Comments Concerning Plant Operation:(Gallons / Day / Sq Ft) 1,465
Surface Flow Rate
Gallons per sq ft per Day Maximum Minimum Average
Rotary Primary Settling Tank 1069 332 505 April 3rd - Fixed Bed / Southern half back in serviceFilter Organic Loading Rate Secondary Settling Tank 1412 439 666
(lbs CBOD / 1000 Cu Ft / Day) 26 Final Settling Tank 720 224 339 April 6th - Opened Biotower vents (All vents opened 100%) for summer
April 8th - On emergency power for 1 hourFixed Bed
Filter Organic Loading Rate
(lbs CBOD / 1000 Cu Ft / Day) 4 Tested emergency backup generator on 6th, 11th, and 25th.
Biotower
Filter Organic Loading Rate Weir OverFlow Rate
(lbs CBOD / 1000 Cu Ft / Day) 3 1000 Gal per ft per Day Maximum Minimum Average
Primary Settling Tank 21 6 10Secondary Settling Tank 17 5 8Final Settling Tank 16 5 8

MONTHLY REPORT OF OPERATIONTrickling Filter Wastewater Treatment Plant
Date: Jun-00 LaPorte Wastewater Treatment Plant Page 2 of 6
2101 Boyd Boulevard
LaPorte IN, 46350 Permit # IN0025577
Certified Operator : Jerry P Jackson
Final Effluent Certification Number : 11496
Chlorine Effluent
CBOD CBOD CBOD CBOD TSS TSS TSS TSS NH3-N NH3-N NH3-N NH3-N Dissolved Aerators Tank Escherichia Chlorine
Day of Day of pH in weekly av in weekly av in weekly av in weekly av in weekly av in weekly av Oxygen run Residual Coliform Residual
the the mg/L in lbs/Day in mg/L in lbs/Day in mg/L in lbs/Day in in in in (Colonies in
Month Week mg/L lbs/Day mg/L lbs/Day mg/L lbs/Day mg/L hours mg/L /100mL) mg/L
1 Thu 7.74 4 149 7 308 <0.20 4 8.3 1.52 2 < 0.0062 Fri 7.34 9 265 10 285 1.81 52 9.2 1.67 3 < 0.0063 Sat 7.68 3 5 59 182 7 8 166 296 <0.20 0.37 2 12 9.2 1.61 3 < 0.0064 Sun 7.96 4 86 3 68 <0.20 2 9.3 1.58 1 < 0.0065 Mon 7.23 5 313 10 580 <0.20 6 10.1 1.33 22 < 0.0066 Tue 7.44 3 139 7 306 <0.20 4 9.7 1.78 17 < 0.0067 Wed 7.40 3 112 4 177 0.33 14 9.3 1.73 20 < 0.0068 Thu 7.69 3 117 10 419 0.21 9 8.9 1.69 8 < 0.0069 Fri 7.39 3 86 5 134 0.36 11 8.6 1.47 0 < 0.006
10 Sat 7.39 3 3 77 133 9 7 204 270 <0.20 0.19 2 7 8.7 1.37 0 < 0.00611 Sun 7.38 5 157 5 141 <0.20 3 8.9 1.32 0 < 0.00612 Mon 7.34 5 283 11 549 <0.20 5 9.2 1.47 16 < 0.00613 Tue 7.09 5 280 14 771 <0.20 6 9.3 1.50 38 < 0.00614 Wed 7.13 5 241 12 616 0.26 13 8.6 1.37 12 < 0.00615 Thu 7.38 3 119 8 330 <0.20 4 9.1 1.66 8 < 0.00616 Fri 7.22 4 143 14 535 <0.20 4 8.9 1.73 9 < 0.00617 Sat 7.29 4 4 175 200 16 11 638 512 <0.20 0.12 4 6 9.3 1.32 20 < 0.00618 Sun 7.63 5 183 16 580 <0.20 4 9.1 1.54 0 < 0.00619 Mon 7.48 5 142 21 582 0.22 6 9.1 1.73 5 < 0.00620 Tue 7.62 7 260 13 458 2.16 79 8.6 1.64 10 < 0.00621 Wed 6.63 9 487 19 996 1.32 69 8.9 1.62 47 < 0.00622 Thu 7.74 6 256 18 799 <0.20 4 9.6 1.54 68 < 0.00623 Fri 7.37 6 232 20 822 <0.20 4 8.6 1.56 22 < 0.00624 Sat 7.41 5 6 276 262 19 18 989 747 <0.20 0.59 5 25 8.2 1.82 35 < 0.00625 Sun 6.96 5 254 9 432 <0.20 5 8.5 1.37 5 < 0.00626 Mon 7.07 5 264 10 464 <0.20 5 9.5 1.02 69 < 0.00627 Tue 7.53 4 139 16 626 <0.20 4 9.1 1.45 74 < 0.00628 Wed 7.48 6 261 15 663 0.62 27 8.1 1.51 58 < 0.00629 Thu 7.52 6 282 17 750 0.84 37 9.0 1.56 89 < 0.00630 Fri 7.46 7 300 16 675 0.29 12 9.3 1.37 10 < 0.006
AVERAGE 7.40 5 205 12 502 0.34 14 9.0 1.53 10 < 0.006MAXIMUM 7.96 9 6 487 262 21 18 996 747 2.16 0.59 79 25 10.1 1.82 89 < 0.006MINIMUM 6.63 3 59 3 68 <0.20 2 8.1 1.02 0 < 0.006
# OF DATA 30 30 30 30 30 30 30 30 30 30 30TOTAL 222 146 6140 355 15064 10 409 270.2 45.85 671 < 0.006

MONTHLY REPORT OF OPERATION
Trickling Filter Wastewater Treatment Plant
Date: 36678 Page 6 of 6
Permit # IN0025577
Certified Operator : Jerry P Jackson
Total lbs Volatile Certification Number : 11496
Solids to Digester 3,467 TREATMENT Total Number
Monthly Removal Summary EQUIPMENT available in service
PRIMARY
Overall Percent Removal Percent Removal : CBOD TSS AMMONIA CLARIFIER TANKS 4 4
of Volatile Solids 47.1% Primary Treatment : 21% 36% -11%
Secondary Treatment : 83% 64% 62% SECONDARY
Tertiary Treatment : 54% 42% 94% CLARIFIER TANKS 2 2
Overall Treatment : 94% 87% 97%
Equivalent Population FINAL
Treated in CLARIFIER TANKS 2 2
(lbs Raw CBOD per Day / 0.17) 19,051
ROTARY FILTER 1 1
Rotary
Filter Hydraulic Loading Rate FIXED BED FILTER 1 1
(Gallon / Day / Sq Ft) 515 Detention Time (Hours) Maximum Minimum Average
Primary Settling Tank 4.3 1.8 2.5
Secondary Settling Tank 3.2 1.3 1.8 BIOTOWERS 2 2
Fixed Bed Final Settling Tank 9.9 4.0 5.7
Filter Hydraulic Loading Rate Total Plant Retention Time 17.3 7.1 10.0
(Gallon / Day / Sq Ft) 91
Biotower
Filter Hydraulic Loading Rate Monthly Comments Concerning Plant Operation:
(Gallons / Day / Sq Ft) 1,497
Surface Flow Rate
Gallons per sq ft per Day Maximum Minimum Average
Rotary Primary Settling Tank 870 356 616 June 20th - Lightening damage to Digester Controls system. System no longer reporting digester temperatures
Filter Organic Loading Rate Secondary Settling Tank 1148 470 813 and flows to the SCADA computer
(lbs CBOD / 1000 Cu Ft / Day) 24 Final Settling Tank 585 239 415
June 20th - Primary Clarifier #2 out of service for 8 hours for repairs
Fixed Bed June 21st - Final Clarifier #2 out of service for 8 hours for repairs
Filter Organic Loading Rate
(lbs CBOD / 1000 Cu Ft / Day) 4 June 2nd, 6th, 8th, and 13th - Test Generator Successfully
Biotower
Filter Organic Loading Rate Weir OverFlow Rate
(lbs CBOD / 1000 Cu Ft / Day) 3 1000 Gal per ft per Day Maximum Minimum Average
Primary Settling Tank 17 7 12
Secondary Settling Tank 14 6 10
Final Settling Tank 13 5 9

MONTHLY REPORT OF OPERATIONTrickling Filter Wastewater Treatment Plant
Date: Sep-00 LaPorte Wastewater Treatment Plant Page 2 of 6
2101 Boyd Boulevard
LaPorte IN, 46350 Permit # IN0025577
Certified Operator : Jerry P Jackson
Final Effluent Certification Number : 11496
Chlorine Effluent
CBOD CBOD CBOD CBOD TSS TSS TSS TSS NH3-N NH3-N NH3-N NH3-N Dissolved Aerators Tank Escherichia Chlorine
Day of Day of pH in weekly av in weekly av in weekly av in weekly av in weekly av in weekly av Oxygen run Residual Coliform Residual
the the mg/L in lbs/Day in mg/L in lbs/Day in mg/L in lbs/Day in in in in (Colonies in
Month Week mg/L lbs/Day mg/L lbs/Day mg/L lbs/Day mg/L hours mg/L /100mL) mg/L
1 Fri 7.42 3 66 1 26 <0.20 3 8.5 1.57 5 < 0.0062 Sat 7.56 2 3 53 84 5 6 120 152 <0.20 0.16 2 4 8.1 1.28 8 < 0.0063 Sun 7.67 5 113 3 65 <0.20 2 8.1 1.58 5 < 0.0064 Mon 7.57 3 64 2 47 <0.20 2 8.7 1.00 19 < 0.0065 Tue 7.68 3 65 2 52 <0.20 2 8.9 1.36 10 < 0.0066 Wed 7.88 3 88 5 129 <0.20 3 8.4 1.54 18 < 0.0067 Thu 7.51 4 97 7 176 0.21 5 9.0 2.21 5 < 0.0068 Fri 7.45 3 100 9 266 <0.20 3 8.4 1.87 34 < 0.0069 Sat 7.44 3 3 71 85 8 5 196 133 <0.20 0.12 2 3 8.1 1.00 11 < 0.006
10 Sun 7.51 < 2 24 3 67 <0.20 2 8.2 2.01 24 < 0.00611 Mon 7.61 5 198 8 324 0.49 20 8.2 2.01 19 < 0.00612 Tue 6.95 4 242 12 729 0.24 15 8.7 1.44 29 < 0.00613 Wed 7.17 12 532 12 546 1.21 55 8.6 1.56 21 < 0.00614 Thu 7.39 4 209 8 411 0.24 12 9.8 1.49 68 < 0.00615 Fri 7.27 4 211 5 231 0.46 24 9.4 1.29 60 < 0.00616 Sat 7.59 3 5 124 220 6 8 257 366 0.26 0.43 11 20 10.0 1.51 6 < 0.00617 Sun 7.41 3 128 4 141 0.28 10 9.7 1.27 14 < 0.00618 Mon 7.66 4 87 6 136 0.70 17 9.2 2.20 7 < 0.00619 Tue 7.77 2 45 6 130 0.34 8 8.5 2.10 19 < 0.00620 Wed 7.46 6 204 9 294 0.85 29 8.3 1.62 13 < 0.00621 Thu 7.24 7 185 7 174 0.92 25 9.2 1.35 4 < 0.00622 Fri 7.45 3 78 4 100 0.37 9 9.8 2.21 19 < 0.00623 Sat 7.41 6 4 235 137 8 6 342 188 2.40 0.84 103 29 9.2 1.67 21 < 0.00624 Sun 7.33 4 108 5 135 0.43 12 9.7 1.29 0 < 0.00625 Mon 7.61 4 91 2 38 0.41 10 9.5 2.20 7 < 0.00626 Tue 7.58 3 71 1 32 1.39 36 9.3 1.38 16 < 0.00627 Wed 7.61 4 100 1 24 0.23 6 9.2 1.37 12 < 0.00628 Thu 7.78 4 87 3 81 0.31 8 10.3 1.30 6 < 0.00629 Fri 7.49 3 68 5 122 0.26 6 9.3 1.38 13 < 0.00630 Sat 7.54 2 3 58 83 6 3 151 83 <0.20 0.45 3 11 9.0 1.43 9 < 0.006
AVERAGE 7.50 4 127 5 185 0.43 15 9.0 1.58 12 < 0.006MAXIMUM 7.88 12 5 532 220 12 8 729 366 2.40 0.84 103 29 10.3 2.21 68 < 0.006MINIMUM 6.95 <2 24 1 24 <0.20 2 8.1 1.00 0 < 0.006
# OF DATA 30 30 30 30 30 30 30 30 30 30 30TOTAL 225 115 3803 160 5542 13 445 269.3 47.49 502 < 0.006

MONTHLY REPORT OF OPERATIONTrickling Filter Wastewater Treatment Plant
Date: Sep-00 Page 6 of 6
Permit # IN0025577
Certified Operator : Jerry P Jackson
Total lbs Volatile Certification Number : 11496
Solids to Digester 3,551 TREATMENT Total Number
Monthly Removal Summary EQUIPMENT available in service
PRIMARY
Overall Percent Removal Percent Removal : CBOD TSS AMMONIA CLARIFIER TANKS 4 4
of Volatile Solids 35.5% Primary Treatment : 35% 46% -8%
Secondary Treatment : 82% 74% 64% SECONDARY
Tertiary Treatment : 72% 67% 94% CLARIFIER TANKS 2 2
Overall Treatment : 97% 95% 98%
Equivalent Population FINAL
Treated in CLARIFIER TANKS 2 2
(lbs Raw CBOD per Day / 0.17) 20,992
ROTARY FILTER 1 1
Rotary
Filter Hydraulic Loading Rate FIXED BED FILTER 1 1
(Gallon / Day / Sq Ft) 482 Detention Time (Hours) Maximum Minimum Average
Primary Settling Tank 4.5 1.6 3.3
Secondary Settling Tank 3.3 1.2 2.4 BIOTOWERS 2 2
Fixed Bed Final Settling Tank 10.4 3.8 7.5
Filter Hydraulic Loading Rate Total Plant Retention Time 18.2 6.6 13.2
(Gallon / Day / Sq Ft) 93
Biotower
Filter Hydraulic Loading Rate Monthly Comments Concerning Plant Operation:(Gallons / Day / Sq Ft) 1,445
Surface Flow Rate
Gallons per sq ft per Day Maximum Minimum Average
Rotary Primary Settling Tank 930 338 466 5th, 12th, 21th, 26th - Test Run Generator
Filter Organic Loading Rate Secondary Settling Tank 1228 446 615
(lbs CBOD / 1000 Cu Ft / Day) 21 Final Settling Tank 626 227 314
Fixed Bed
Filter Organic Loading Rate
(lbs CBOD / 1000 Cu Ft / Day) 4
Biotower
Filter Organic Loading Rate Weir OverFlow Rate
(lbs CBOD / 1000 Cu Ft / Day) 3 1000 Gal per ft per Day Maximum Minimum Average
Primary Settling Tank 18 7 9
Secondary Settling Tank 15 5 7
Final Settling Tank 14 5 7
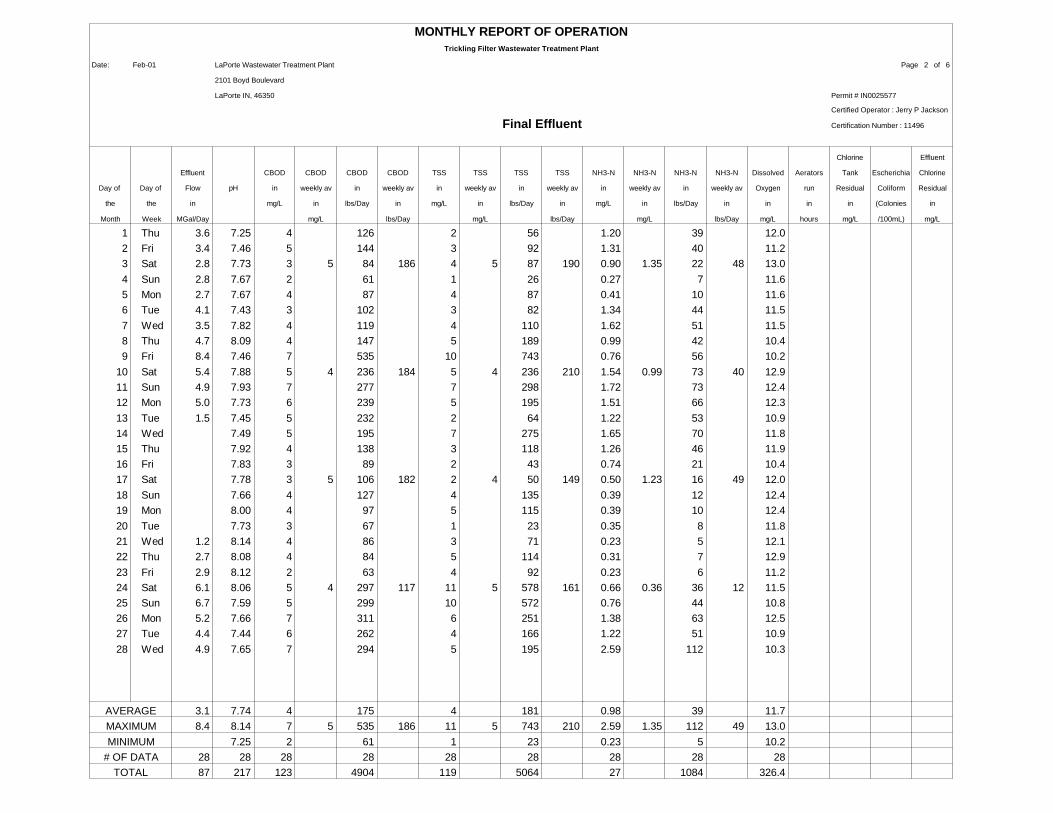
MONTHLY REPORT OF OPERATIONTrickling Filter Wastewater Treatment Plant
Date: Feb-01 LaPorte Wastewater Treatment Plant Page 2 of 6
2101 Boyd Boulevard
LaPorte IN, 46350 Permit # IN0025577
Certified Operator : Jerry P Jackson
Final Effluent Certification Number : 11496
Chlorine Effluent
Effluent CBOD CBOD CBOD CBOD TSS TSS TSS TSS NH3-N NH3-N NH3-N NH3-N Dissolved Aerators Tank Escherichia Chlorine
Day of Day of Flow pH in weekly av in weekly av in weekly av in weekly av in weekly av in weekly av Oxygen run Residual Coliform Residual
the the in mg/L in lbs/Day in mg/L in lbs/Day in mg/L in lbs/Day in in in in (Colonies in
Month Week MGal/Day mg/L lbs/Day mg/L lbs/Day mg/L lbs/Day mg/L hours mg/L /100mL) mg/L
1 Thu 3.6 7.25 4 126 2 56 1.20 39 12.0 2 Fri 3.4 7.46 5 144 3 92 1.31 40 11.2 3 Sat 2.8 7.73 3 5 84 186 4 5 87 190 0.90 1.35 22 48 13.0 4 Sun 2.8 7.67 2 61 1 26 0.27 7 11.6 5 Mon 2.7 7.67 4 87 4 87 0.41 10 11.6 6 Tue 4.1 7.43 3 102 3 82 1.34 44 11.5 7 Wed 3.5 7.82 4 119 4 110 1.62 51 11.5 8 Thu 4.7 8.09 4 147 5 189 0.99 42 10.4 9 Fri 8.4 7.46 7 535 10 743 0.76 56 10.2
10 Sat 5.4 7.88 5 4 236 184 5 4 236 210 1.54 0.99 73 40 12.9 11 Sun 4.9 7.93 7 277 7 298 1.72 73 12.4 12 Mon 5.0 7.73 6 239 5 195 1.51 66 12.3 13 Tue 1.5 7.45 5 232 2 64 1.22 53 10.9 14 Wed 7.49 5 195 7 275 1.65 70 11.8 15 Thu 7.92 4 138 3 118 1.26 46 11.9 16 Fri 7.83 3 89 2 43 0.74 21 10.4 17 Sat 7.78 3 5 106 182 2 4 50 149 0.50 1.23 16 49 12.0 18 Sun 7.66 4 127 4 135 0.39 12 12.4 19 Mon 8.00 4 97 5 115 0.39 10 12.4 20 Tue 7.73 3 67 1 23 0.35 8 11.8 21 Wed 1.2 8.14 4 86 3 71 0.23 5 12.1 22 Thu 2.7 8.08 4 84 5 114 0.31 7 12.9 23 Fri 2.9 8.12 2 63 4 92 0.23 6 11.2 24 Sat 6.1 8.06 5 4 297 117 11 5 578 161 0.66 0.36 36 12 11.5 25 Sun 6.7 7.59 5 299 10 572 0.76 44 10.8 26 Mon 5.2 7.66 7 311 6 251 1.38 63 12.5 27 Tue 4.4 7.44 6 262 4 166 1.22 51 10.9 28 Wed 4.9 7.65 7 294 5 195 2.59 112 10.3
AVERAGE 3.1 7.74 4 175 4 181 0.98 39 11.7 MAXIMUM 8.4 8.14 7 5 535 186 11 5 743 210 2.59 1.35 112 49 13.0 MINIMUM 7.25 2 61 1 23 0.23 5 10.2
# OF DATA 28 28 28 28 28 28 28 28 28 TOTAL 87 217 123 4904 119 5064 27 1084 326.4

MONTHLY REPORT OF OPERATIONTrickling Filter Wastewater Treatment Plant
Date: Feb-01 Page 6 of 6
Permit # IN0025577
Certified Operator : Jerry P Jackson
Total lbs Volatile Certification Number : 11496
Solids to Digester 2,896 TREATMENT Total Number
Monthly Removal Summary EQUIPMENT available in service
PRIMARYOverall Percent Removal Percent Removal : CBOD TSS AMMONIA CLARIFIER TANKS 4 4
of Volatile Solids 32.8% Primary Treatment : 22% 39% -7%Secondary Treatment : 69% 59% 28% SECONDARYTertiary Treatment : 83% 86% 92% CLARIFIER TANKS 2 2Overall Treatment : 96% 97% 94%
Equivalent Population FINALTreated in CLARIFIER TANKS 2 2
(lbs Raw CBOD per Day / 0.17) 24,091
ROTARY FILTER 1 1
Rotary
Filter Hydraulic Loading Rate FIXED BED FILTER 1 1(Gallon / Day / Sq Ft) 461 Detention Time (Hours) Maximum Minimum Average
Primary Settling Tank 4.4 1.4 2.8Secondary Settling Tank 3.3 1.0 2.0 BIOTOWERS 2 2
Fixed Bed Final Settling Tank 10.2 3.2 6.3Filter Hydraulic Loading Rate Total Plant Retention Time 17.9 5.5 11.1
(Gallon / Day / Sq Ft) 55
Biotower
Filter Hydraulic Loading Rate Monthly Comments Concerning Plant Operation:(Gallons / Day / Sq Ft) 1,483
Surface Flow Rate
Gallons per sq ft per Day Maximum Minimum Average
Rotary Primary Settling Tank 1113 344 553 Tested emergency power generator on 23rd and 28th.Filter Organic Loading Rate Secondary Settling Tank 1469 454 731
(lbs CBOD / 1000 Cu Ft / Day) 35 Final Settling Tank 749 231 372Feb 2nd - Instrument Panel #3 with new Allen Bradley Controls placed on-line.
Fixed Bed
Filter Organic Loading Rate Feb 14th thru 20th - No final effluent flows. Replaced final effluent weir plate. Existing plate was extremely corroded.(lbs CBOD / 1000 Cu Ft / Day) 4
Biotower
Filter Organic Loading Rate Weir OverFlow Rate
(lbs CBOD / 1000 Cu Ft / Day) 6 1000 Gal per ft per Day Maximum Minimum Average
Primary Settling Tank 22 7 11Secondary Settling Tank 18 5 9Final Settling Tank 17 5 8

MONTHLY REPORT OF OPERATIONTrickling Filter Wastewater Treatment Plant
Date: Jul-01 LaPorte Wastewater Treatment Plant Page 2 of 6
2101 Boyd Boulevard
LaPorte IN, 46350 Permit # IN0025577
Certified Operator : Jerry P Jackson
Final Effluent Certification Number : 11496
Chlorine Effluent
Effluent CBOD CBOD CBOD CBOD TSS TSS TSS TSS NH3-N NH3-N NH3-N NH3-N Dissolved Aerators Tank Escherichia Chlorine
Day of Day of Flow pH in weekly av in weekly av in weekly av in weekly av in weekly av in weekly av Oxygen run Residual Coliform Residual
the the in mg/L in lbs/Day in mg/L in lbs/Day in mg/L in lbs/Day in in in in (Colonies in
Month Week MGal/Day mg/L lbs/Day mg/L lbs/Day mg/L lbs/Day mg/L hours mg/L /100mL) mg/L
1 Sun 2.5 7.47 4 97 9 196 0.39 9 8.4 2.00 2 < 0.0062 Mon 3.1 7.71 5 148 6 174 0.46 13 9.2 2.01 4 < 0.0063 Tue 3.6 7.54 6 204 14 446 0.54 17 8.9 2.21 10 < 0.0064 Wed 2.8 7.56 3 81 6 139 0.53 14 8.3 2.47 15 < 0.0065 Thu 3.1 7.74 4 108 9 250 <0.20 3 8.8 2.40 16 < 0.0066 Fri 2.4 7.41 3 61 9 204 0.37 8 9.2 2.57 27 < 0.0067 Sat 6.1 7.41 7 5 368 152 21 10 1151 366 1.09 0.50 59 18 8.3 2.88 140 < 0.0068 Sun 4.5 7.42 4 152 10 379 0.60 24 7.8 2.47 80 < 0.0069 Mon 4.8 7.43 5 207 7 302 0.55 24 8.6 1.90 12 < 0.006
10 Tue 4.7 7.49 5 197 13 545 0.50 21 8.9 2.20 77 < 0.00611 Wed 4.9 7.15 5 202 13 570 0.38 17 9.0 2.79 26 < 0.00612 Thu 4.8 7.27 6 234 17 701 0.30 13 8.8 3.47 81 < 0.00613 Fri 4.6 7.24 3 103 12 475 0.40 16 9.1 3.27 33 < 0.00614 Sat 2.8 7.25 3 4 75 167 4 11 103 439 0.35 0.44 9 18 8.5 3.22 18 < 0.00615 Sun 2.7 7.39 7 173 5 123 0.23 6 10.4 2.80 4 < 0.00616 Mon 3.3 7.34 5 143 16 498 <0.20 3 10.7 2.47 33 < 0.00617 Tue 4.0 7.30 6 203 14 499 0.65 24 8.5 2.57 26 < 0.00618 Wed 3.7 7.13 4 143 2 66 <0.20 3 7.7 3.27 0 < 0.00619 Thu 2.9 7.27 3 74 8 210 0.41 11 8.3 3.35 36 < 0.00620 Fri 2.9 7.39 4 99 5 123 0.44 12 8.1 3.27 22 < 0.00621 Sat 4.4 7.48 4 5 171 144 10 8 399 274 0.59 0.36 24 12 8.0 3.02 31 < 0.00622 Sun 4.5 7.36 4 154 10 384 <0.20 4 7.8 3.11 41 < 0.00623 Mon 4.9 7.41 5 198 6 242 0.40 17 7.7 3.38 144 < 0.00624 Tue 4.9 7.31 2 88 10 452 0.40 18 7.7 3.27 56 < 0.00625 Wed 5.1 7.37 4 180 12 518 0.52 23 8.1 3.22 146 < 0.00626 Thu 4.6 7.20 5 201 19 770 0.80 33 8.3 2.37 88 < 0.00627 Fri 3.5 7.42 4 115 4 131 0.47 15 8.8 3.01 6 < 0.00628 Sat 2.7 7.32 6 4 159 156 1 9 25 361 0.20 0.41 5 17 8.5 3.27 8 < 0.00629 Sun 2.8 7.26 3 85 3 86 0.20 5 8.3 4.50 17 < 0.00630 Mon 2.9 7.24 3 75 5 139 <0.20 3 8.3 4.75 12 < 0.00631 Tue 3.2 7.31 3 93 5 135 <0.20 3 8.2 4.66 0 < 0.006
AVERAGE 3.8 7.37 4 148 9 337 0.40 15 8.6 2.97 20 < 0.006MAXIMUM 6.1 7.74 7 5 368 167 21 11 1151 439 1.09 0.50 59 18 10.7 4.75 146 < 0.006MINIMUM 2.4 7.13 2 61 1 25 <0.20 3 7.7 1.90 0 < 0.006
# OF DATA 31 31 31 31 31 31 31 31 31 31 31 31TOTAL 118 229 131 4590 280 10437 12 455 265.2 92.15 1211 < 0.006

MONTHLY REPORT OF OPERATIONTrickling Filter Wastewater Treatment Plant
Date: Jul-01 Page 6 of 6
Permit # IN0025577
Certified Operator : Jerry P Jackson
Total lbs Volatile Certification Number : 11496
Solids to Digester 4,099 TREATMENT Total Number
Monthly Removal Summary EQUIPMENT available in service
PRIMARYOverall Percent Removal Percent Removal : CBOD TSS AMMONIA CLARIFIER TANKS 4 4
of Volatile Solids 43.4% Primary Treatment : 37% 36% -5%Secondary Treatment : 87% 69% 53% SECONDARYTertiary Treatment : 60% 50% 95% CLARIFIER TANKS 2 2Overall Treatment : 97% 90% 97%
Equivalent Population FINALTreated in CLARIFIER TANKS 2 2
(lbs Raw CBOD per Day / 0.17) 26,022
ROTARY FILTER 1 1
Rotary
Filter Hydraulic Loading Rate FIXED BED FILTER 1 1(Gallon / Day / Sq Ft) 465 Detention Time (Hours) Maximum Minimum Average
Primary Settling Tank 4.5 1.9 2.9Secondary Settling Tank 3.3 1.4 2.2 BIOTOWERS 2 1
Fixed Bed Final Settling Tank 10.4 4.3 6.8Filter Hydraulic Loading Rate Total Plant Retention Time 18.2 7.6 11.9
(Gallon / Day / Sq Ft) 80
Biotower
Filter Hydraulic Loading Rate Monthly Comments Concerning Plant Operation:(Gallons / Day / Sq Ft) 2,089
Surface Flow Rate July 3rd - Final sludge flow now being discharged into plant headworks after the influent flowmeter, instead Gallons per sq ft per Day Maximum Minimum Average of into secondary clarifiers.
Rotary Primary Settling Tank 810 339 517Filter Organic Loading Rate Secondary Settling Tank 1069 448 683 July 7th - On emergency power from 6 am to 7am during the storm.
(lbs CBOD / 1000 Cu Ft / Day) 27 Final Settling Tank 545 228 348July 26th - North Biotower back in service
Fixed Bed Tested emergency power generator on 3rd and 13th.Filter Organic Loading Rate
(lbs CBOD / 1000 Cu Ft / Day) 4
Biotower
Filter Organic Loading Rate Weir OverFlow Rate
(lbs CBOD / 1000 Cu Ft / Day) 5 1000 Gal per ft per Day Maximum Minimum Average
Primary Settling Tank 16 7 10Secondary Settling Tank 13 5 8Final Settling Tank 12 5 8
Certified Operator Signature:________________________ Certification # : 11496

La Porte Wastewater 'Treatment Pfant Laboratory
Misce{{aneous Samy{e 1Jata Sfieet
Sample I.D. . C5D . Sample Date : t.l· w~oo Sample Notes: ;5"7J\.!t. Tt t'J ~ }:30~W\ £1Jr>lit1 e 4 ~ 1.10 e~ -
51kfi(S Jl.- 1- !0 it/::. tJCJe_ll'\. s4""e.lt. •
pH I (,_ <J~s- I D.o. I ttl 3.3 I NH3-N It. ~~ I CN-L I 11./0 #J"" 3.(o
E. Coliform it~ 3-7 ml of Sample /0 9:>
Colony Count Calculation: Colony Counts + + ml of Sample + +
Sum of Colony Counts X 100 I Sum ofml = Colonys/IOOml
Total Suspended Solids ml of sample ~tz ;wJ #_5 /()()~ Gross Z'-/_ t/7 /Cf Z'l. If ft:J z "8-Tare .It/ if(, 9 z.. .ti-a-~oo Difference 0627 , oo 2.~ / ;~
Solids in mg/1 27 2'5?' ( 27,!: trl1b \
~--~ CBODs Date Incubated: Date Removed:
Sample mlof ml of Percent Initial 5Day D.O. Minus CBOD I. D. Seed Sample Cone. D.O. D.O. Depletion Seed in mg/1
Factor
'*( ~ 2 ~.S' ~.1 0 ·\ S:o 1 ~} U) Zo 8-D Lt,-; I ) l.Cl1 ~~·..,.
") /20 '-[0 l,S L\,~ 1 . c-. ) f- 1 ) ~
' __.......
·r- --........ ~)v..:\ D 1\..1 ...._ ---Source of Seed: Lab Tech: I1v

" ...... ,__....
.::;. /0~ sc,J I TAIF- TNT'-2 T/vl'- TAif<-3 -rrvr'- TN I'-'-1 TIJTC ThlT<... s- TNfC TNT(_
" TNTL TIJTL - 7 TNfL TAJIC )
) ~ T~T<-. T.vT<-9 TNT<:_ T~rc
) J() TNT'- TNT<-

Committed To Your Success
I L A B 0 R A T 0 R Y T E S T R E S U L T S I Job Number: 104716 Oate: 05/15/2000 I
CUSTOMER: La Porte Waste Water Treatment Plant PROJECT: CSO OVERFLOW ATTN: Matthew Amor
I I
Customer Sample ID: CSO OVERFLOW Laboratory Sample ID: 104716-1 Date Sampled ...... : 04/20/2000 Date Received ....... : 05/05/2000 Time Sampled ...... : 13:00 Time Received ....... : 10:40 Sample Matrix ..... : Aqueous
TEST METHOD PARAMETER/TEST DESCRIPTION SAMPLE RESULT REPORTING LIMIT UNITS DATE TECH
EPA 200.7 Chromium (Cr) <0.010 0.010 mg/L 05/09/00 bjl
EPA 200.7 Copper (Cu) <0.010 0.010 mg/L 05/09/00 bjl
EPA 200.7 Nickel (Ni) <0.010 0.010 mg/L 05/09/00 bjl
EPA 200.7 Zinc (Zn) 0.031 0.010 mg/L 05/11/00 bjl
EPA 213.2 Cadmium (Cd) <0.0005 0.0005 mg/L 05/13/00 chh
EPA 239.2 Lead (Pb) <0.005 0.005 mg/L 05/12/00 chh
Pa e 2
a part of ====

La Porte 'Wastewater Treatment Pfant La6oratory
Misce{{aneous Samy{e Data Sfieet
Sample J.D. : {'50 Jvc,-t_{/vt.V - Co"'t? , Sam pie Date : -~&~-2:....!.'1+-/.lbboL...-_--=o-=0 __ _ Sample Notes: _________________ _
pH ~L.....-----' D.o.IL-__ ___. NH3-N L-j ----'
E. Coliform I ~I of Sample I
Calculation: Colony Counts ___ + ____ + ___ _ ml of Sample + + ___ _
Sum of Colony Counts X 100 I Sum of ml ___ = ___ Colonys/lOOml
T t IS oa d d s rd uspen e 0 I s ml of sample #2 tuu.) --~ ldJ~ Gross ;-/_1/7~9 t{ ~(, s-7 '
Tare z.f '17 z 1 11. <?~I~ Difference .(;0 18 . ()0 39 Solids in mg/1 J<jJ J9
CBO Ds Date Incubated· Date Removed· Sample ml of ml of Percent Initial 5Day D.O. Minus CBOD
I. D. Seed Sample Cone. D.O. D.O. Depletion Seed in mg/1 Factor
11--f .lo,..f. ;ot, ~- 7.... 7.3 O.'f 9. (.) j ll ~r.J-1_ Lo·;,. 7~7 s-. (., 2./ 10,5' 113 ;zod_ '-/0'1, "·'~ 2 ) '-1· (., II· )
.J---- ·~
/ I t1t.~~ ( //.0 ~ "- -
Source of Seed: Lab Tech: ----- ----

': Cltj. ~fl~,.;<.,.
pv~Ntt{. f..t('pAj 5L( 0~ f.C(X .. (iJtJr(.
C.-ZY-W BYrlP5 e.- /U:<J];?'*'\ 5 fitlRT /0 ·; Q ,?""'\
j>Jt 7.ZO PO 2.(;;
IO:c.j_s-/111 /
/;. , VO ;--:>r~
('If 7.1( {JD 2. 0
po ~· .. o
/l'ISf~ ;;f/ 72s-
/L:wA~ /
Do /, ~
;z:.frAf'/ ofl t,.1l.D Du ~~~
-sT;~ :J-<(;f?.v - /-law ,}tA._x_ lctJf!..Je W;t:.<_ /?ut...J.
J~ - ;:/()t,V S?J'-t.. ;/1-t.<c-<J.J/NJ
>'Vb - L(.)TJ ..:.y::- &A.:.I< c.(4!' fl../ ~(.. t, --·~/(5) oVC< pI tXv'

·.
~I /) 2'-J :::::: 2~,3o0
. -sJ t17 - ~'-fuD -tJL fNT""c.
!NT(.,
d-...) lfvTC-iN><-
fi'i I~R
\~TC
ts-.> TtJI<.. 11"1'-
{:J' l~i\,
\tJI<-
~7 1/vl\... \}Jj~
P<i T~l'-
T~\C
~1 11-.trt. IIJTC...
P-/0 1~1L
\NT'-

Commined To }lmr Success
L A B 0 R A T 0 R Y T E S T R E S U L T S Job Number: 106999
CUSTOMER: La Porte Waste Water Treatment Plant PROJECT: CSO OVERFLOW
Customer Sample ID: CSO OVERFLOW Date Sampled ..•... : 06/24/2000 Time Sampled ...... : 10:15 Sample Matrix ..... : Aqueous
TEST METHOD PARAMETER/TEST DESCRIPTION
SM 4500 CN Cyanide, Total
EPA 200.7 Chromium (Cr)
EPA 200.7 Copper (Cu)
EPA 200.7 Nickel ( N i)
EPA 200.7 Zinc (Zn)
EPA 213.2 Cadmium (Cd)
EPA 239.2 Lead (Pb)
SAMPLE RESULT
<0.005
<0.010
0.017
<0.010
0.028
<0.0005
0.01
Page 2
Date: 07/10/20(10
ATTN: Matthew Amor
Laboratory Sample ID: 106999-1 Date Received ....... : 06/28/2000 Time Received ....... : 12:45
REPORT 1 NG Ll MIT UNITS DATE TECH
0.005 mg/L 06!30!00 jdb
0.010 mg/L 06/29/00 bjl
0.010 mg/L 06/29/00 bjl
0.010 mg/L 06/29/00 bjl
0.010 mg/L 06/29/00 bjl
0.0005 mg/L 07!07!00 chh
0.005 mg/L 06!30!00 chh
a part of

La Porte Wastewater Treatment Pfant LafJoratory
:Jvlisce{{aneous Samy{e Data Sfieet
/~,-0 Ovt"~'tJw 11-j Sample J.D. : _..;;;..'-"_J_'_"f_<-1' __ __._ ___ _
Sam pie Date : _ ____;C):...._-.:....::Il'---.:::...oo=----e=· ---<..:It:.._· -t..=:S:"-'-~111\__,.._
Sample Notes: -------------------
pHI -,, 17 D.o. I I.Cf NH3-N I (tJ.ts= CN"L
E. Coliform
I ml of Sample I I /U
"'!IJTC 1A1l'-Colonl: Count . Calculation: Colony Counts + + ml of Sample + +
Sum of Colony Counts X 100 I Sum ofml = IJ.LTC. Colonys/IOOml
T t IS oa us pen d d s I'd e 01 s ml of sample •9 IW.J Gross tl. lll8' Tare t8. 2097 Difference . 003/ Solids in m1?;/l 3}. 0
CBODs Date Incubated: -I -W Date Removed: -J]-vv Sample ml of ml of Percent Initial 5Day D.O. Minus CBOD
I. D. Seed Sample Cone. D.O. D.O. Depletion Seed in mg/1 Factor
I~J &% 7-7 ~-7 /.0 ~ &vJ. )0{., 7-~ '-1.1 :?.3 1~-s-,
L.~ r:-l~.S ....____...,
Source of Seed: -----Bi.~WIL::. r. 3
Lab Tech: 1"7

I
La 'Porte Wastewater Treatment 'Pfant Laboratory
:Misce[[aneous Samy[e Data Sfieet
Sample J.D. : --=C=Su~w_c!2._:_~.;_1u.::...::w __ ~-~~-Sa m pIe Date : ----=-q-~ 1-=:;2_-o_.:J_' _€.--=--_1_: ~_.; A_rV\_,___
Sample Notes: -------------------
pHI 7.//t) D.o. I /. 7 NH3-N I S.S"/ CN"C
E. Coliform ml ofSam~le I L iN~(_ Colon,r Count . rurc.
Calculation: Colony Counts + + ml of Sample + +
Sum of Colony Counts X 100 I Sum ofml =JUT'- Colonys/lOOml
T t IS o a d d s rd uspen e 0 I S
ml of sample 112 /()()~ Gross 2'-/. '11 J '8 Tare 2{ L/7o9 . Difference · {)Dl'9 Solids in mgll zc;.o
CBO Ds Date Incubated· 1-IZ ,v.;; Date Removed· 1 -11- 0 J
Sample ml of ml of Percent Initial 5Day D.O. Minus CBOD I. D. Seed Sample Cone. D.O. D.O. Depletion Seed in mgll
Factor
/~,JJ &1. ¥.' 7.3 0.% ·~ vvJ. Jwot 7.3 3.7 ],(p /~.0
--~ /~.0
....... ......
Source of Seed: ----- Lab Tech: yttrJ
)

I
La 'Porte Wastewater Treatment 'Pfant Laboratory
:Misce{{aneous Samy{e 'Data Slieet
Sample J.D. : --=C=-=-5-=-u--=-o()(.oZ=~t:....:..;/.;=-'.:;_· _lf.=3:....__ __ Sam pie Date : _ ___,_1_-.:....::12'--~~o..:;_o_e. __ r...::..::· JS')'-'-'A'--141\+----
Sample Notes: -------------------
pHI 721 D.o. I /.,. NH3-N I 5. '18 CN-L
E. Coliform ml of Sample I L 10
Tuf<.. TAil<-Colonr Count . Calculation: Colony Counts + + ml of Sample + +
Sum of Colony Counts X 100 I Sum ofml = T~IC Colonys/1 OOm I
T t IS oa us pen d d s rd e 0 I S
ml of sample dJ Jov,.f Gross 2'-1. ~ U;o..j '> Tare 1'-1. <j & 09 Difference . DOJ~ Solids in mg/1 3~-0
CBODs Date Incubated· q_,z ~u:.; Date Removed· '1-17 ~().:J
Sample ml of ml of Percent Initial 5Day D.O. Minus CBOD
J.D. Seed Sample Cone. D.O. D.O. Depletion Seed iin mg/1 Factor
114 {.,~ ~2. 7.'-/ o.~ :~ {JO~ l01. 7.(/) c./. t.( 3.2.. LID n
-lfo.tJ) .... ____....
Source of Seed: ____ _ LabTech: ¢
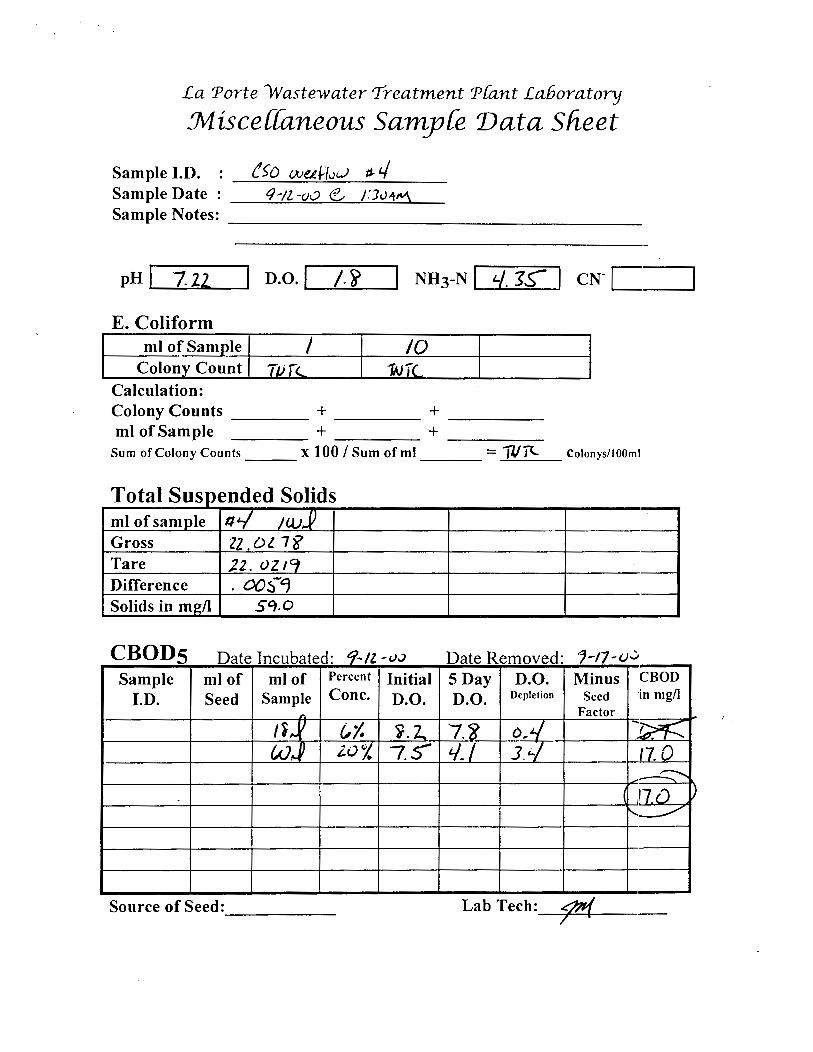
La Porte 'Wastewater Treatment Pfant Laboratory
:Jvtisce[[aneous Samy[e 'Data Sheet
Sample I. D. : {:;o we.ttfvw tJ.. 4 Sample Date : tf-!l-ov e J:Jv4:M..
Sample Notes: -------------------
pHI 7.22 D.o. I /.~ NH3-N I l./. 1s- CN-c
E. Coliform
I ml of Sample I I /0
111.. rc 1NfC_ Colonl: Count . Calculation: Colony Counts + + ml of Sample + +
Sum of Colony Counts X 100 I Sum ofml =WR Colonys/IOOml
T t IS d d S rd o a uspen e 0 I S
ml of sample tJ'-/ IW) Gross ZZ.Dl7~ Tare )2. OZJ<t Difference . 00!>-~ Solids in mg/1 5').0
CBOD 5 Date Incubated: q'-Jl-cXJ Date Removed: 1-1]-()..J
Sample ml of ml of Percent Initial 5Day D.O. Minus CBOD
J.D. Seed Sample Cone. D.O. D.O. Depletion Seed in mg/1 Factor
/i, . ./ ~1- ~- 2. 7.<g 0,~ ~~ W) lOX 7.s-' if./ J.'-1 17.0
_c:-....
( n.a ) ,___,
Source of Seed: ----- Lab Tech: f"'{

La Porte 'Wastewater 'Treatment Pfant La6oratory
:Misce[[aneous Samy[e 1Jata Sfieet
~ample I.D. . CSO ~f/ot,J -fJ:-s-. ~ample Date : q-12-oO e. /:'{SAM
• ~ample Notes:
-
pHI 7. l(, I D.o. I /.9 I NH3-N I '-/. 23 I CN-c I 1~. Coliform
ml of Sample I 10 Colony Count TliTt W'J<....
C~alculation: C~olony Counts + + ntl of Sample + + ~urn of Colony Counts X 100 I Sum ofml = 1JJTC..... Colonys/IOOml
rpotal Suspended Solids 1~11 of sample tts- /OV~ 4Sross zs. z1ll8 ·rare 25". 272/ ]~ifference I 00'-11 ~ olids in m~/1 "11.0
~~BODs Date Incubated: Cf-IL -uu Date Removed: 1 -17- ov Sample ml of mlof Percent Initial 5Day D.O. Minus CBOD
I. D. Seed Sample Cone. D.O. D.O. Depletion Seed in mg/1 Factor
11,/' t,Y. ~- 2.. 7.7 0.5' ~~ w~ 1.01.. 7.S c./S 3.0 lS" .. D
__.c:-o,
. ,.....fS: c1 ) _/ -
~Source of Seed: Lab Tech: {*!

I
La 'Porte Wastewater Treatment 'Pfant Laboratory
.Jtrtisce[[aneous Samy[e 1Jata Slieet
Sam pie I.D. : ---=-C=-5 0=--o_u--=-(Jl.-=-=f..:...:.f o_t.J_tJ-_0..::..__ __ Sample Date : -~q--'-1-=-2_--=-oo.::...__:e=·J ----=::..2...:;; w-=-4...:.:..111\--4.--
Sample Notes: -------------------
pH I 7-1~ D.o. I /. ~ NH3-N I '-/.1{ I CN-c
E. Coliform ml of Sample I :mrt ;0
UJTC Colonr Count . Calculation: Colony Counts + + ml of Sample + +
Sum of Colony Counts X 100 I Sum ofml =1Nic Colonys/1 OOml
T t IS oa us pen d d s I'd e 0 I S
ml of sample rt(p /W..f Gross zs-. J.s ls Tare 2S". 1ZS7 Difference . ODS'S Solids in mgn ~8-D
CBODs Date Incubated: -n· ()v Date Removed: c ·17- oo Sample ml of ml of Percent Initial 5Day D.O. Minus CBOD
I.D. Seed Sample Cone. D.O. D.O. Depletion Seed in mg/1 Factor
/iJ_ G,%_ ~- t 7. 'iS 0.3 :~ ~o.J 2o'b 7.3 t-/.S 1.~ 1'/.0
~
vtt./.ol "-.....__/
Source of Seed: ----- Lab Tech:_--+ftJi~-
I .

La 'Porte 'Wastewater 'Treatment 'Pfant Lavoratory
.1v1isce{{aneous Samy{e 'Data Slieet
Sam pie I.D. : ---=.:CS:o.....;O~o~v..:..:..;e~~fl~·.;i.J...::....__t.t-__.7.___ __ Sample Date : __ 9..£_-...!.;/ l!!:..--_,W'-=--_,_~,£_-=z:.....:...:::;s;~A!V\~, _
Sample Notes: -------------------
pH I l27 D.o.l J.~
E. Coliform I -;,, of Sample I I /0 TN I c..
Calculation: Colony Counts ___ + ____ + ___ _ ml of Sample + + ___ _
Sum of Colony Counts X 100 I Sum ofml = 1i\f[L. Colonys/lOOml
T t IS oa d d s I'd uspen e 0 I s ml of sample tt7 twJ Gross l'-/. 8 > f z Tare 2'-1. '8-L/ s-~ Difference 60S'-! Solids in mg/1 _<;t./. D
CBOD 5 Date Incubated: 9-12 · tJi) Date Removed: tl-17- 00
Sample ml of ml of Percent Initial 5Day D.O. Minus CBOD I. D. Seed Sample Cone. D.O. D.O. Depletion Seed i.n mg/1
A Factor
II',/_ &to 'i. 7... _7. CJ. 0.3 --~ W.J 20% 7,5"' ~.to 2.9 r'-/.S
~
1(1'-/.5" '· ..,?
Source of Seed: ----- Lab Tech:_~?rJ~-
....
)

La 'Porte Wastewater Treatment 'Pfant La6oratory
.Jvlisce[[aneous Samy[e TJata Sfieet
Sample J.D. : C5() OUCtZflow ~ '8 ~~~-=~----=----
Sam pie Date : ___ q'--..:....:12:.._~-=o:.....::o'--e~..=:....z._· Jo...;_;,A...:.;..HI\-1,..---
Sample Notes: --------------------
pHI 7~/&J D.o. I /.~ NH3-N I '-/.21 I CN"C
E. Coliform
I ml of Sam~le I L 10
Colonl: Count : 1}[1'- TNTL Calculation: Colony Counts + + ml of Sample + +
Sum of Colony Counts X 100 I Sum ofml = 1lJiL Colonys/IOOml
T t IS oa d d s l"d uspen e 0 I S
ml of sample 11-<jf /UrJ) Gross Z/. >.& S & Tare 21. S"0 0 Lj Difference OD)l Solids in mg/1 N Sl.C
CBODs Date Incubated: '12- ();} Date Removed: 9-17' oo Sample ml of ml of Percent Initial 5Day D.O. Minus CBOD
J.D. Seed Sample Cone. D.O. D.O. Depletion Seed in mg/1 Factor
nJJ &% ~~I 7_.'8 0.3 ~~ ..,/ . "j-
I .
&u_f ao 1. 7.LJ '--1.0 2.~ {'-/. 0
~/"'"'" " ) ~H.O ,......____.....
Source of Seed: --------- Lab Tech: 1"7 ~(£.H~qL =- ~. 3

9-!z -ov ])_o_
SrA-R.r e 11.-'JO
t:lvu o~,e. S~-1.;./( 'VI!·.~ - /,. rr • 1- ,,.;,,,c. r-1~57 Y4t~tfL£. e-~~.1 /.t-YS4 7.1] /. c; 21.'(
1:1"..; :>T.An(T ;MJ o.tW_ /tlJt'' ...,.~ . ..(. ,',.,. f'""<J 4;,4..:. (k-<-<'•·1.) vf'
ttl f:c/0 A 7./~ /7 ,2/. f "'J .. I I . 1-IIJO.J t"vl GW(,(, ~~')C. (..If,~
~t 3 1 :;~ 7. 1<-] /. "8' 2/.s-
flt'~vy flow 1 5AM,k .. h ... > Jq.el(lsl 7~tv-r- t'\i..:.w v!> jl..~f,) ~~~/ie.e._
tJ~ i:JtJA. 7.21... (!r 21. I J./~4 "Y fl..w, s;;//lt!.lt ;w,Jj , S 4 ... {1(~ ....:...R-'f Tv~~;~
as /;LisA. 7. l(p I. 9 21 . .3 ffiJt.... S7•l/ JrlU.t~J,.Aj 1 SA l"'f'f<.. lw«5 /,'Jt.e r·rs c/~<..(!(./._
a~ 2:uc> t1 7.1 <t' I. '8" 21 . .3 flow s1iJ/ '~'"'(ll.H~,'j , STJ.t( tA•~·~j. YAttt/lit. +.;.d,.~~. t-y sr-4-bk ..
a7 2:tS4 7.Z7 l.'i" 21.{
tt~ 2:JJA J./.J......

•·
L A B 0 R A T 0 R Y T E S T R E S U L T S Job Number: 110993 Date: 10/13/2000
CUSTOMER: La Porte Waste Water Treatment Plant PROJECT: WASTEWATER ATTN: Matthew Amor
Customer Sample ID: CSO OVERFLOW #1 Laboratory Sample ID: 110993-3 Date Sampled ...... : 09/12/2000 Date Received ....... : 09!27!2000 Time Sampled ....•• : 12:45 Time Received ••...•. : 12:30 Sample Matrix .•••• : Water
TEST METHOD PARAMETER/TEST DESCRIPTION SAMPLE RESULT REPORTING LIMIT UNITS DATE TECH
EPA 200.7 Chromium (Cr) 0.011 0.010 mg/L 09!29!00 bjl
EPA 200.7 Copper (Cu) 0.030 0.010 mg/L 09!29!00 bjl
EPA 200.7 Nickel (Ni) <0.010 0.010 mg/L 09!29!00 bjl
EPA 200.7 Zinc (Zn) 0.051 0.010 mg/L 10!03!00 chh
EPA 213.2 Cadmium (Cd) <0.0005 0.0005 mg/L 09!29!00 chh
EPA 239.2 Lead (Pb) 0.009 0.005 mg/L 10/04/00 chh
Page 4

SEVERN
•••••••• SERVICES
L A B 0 R A T 0 R Y T E S T R E S U L T S Job Number: 110993 Date: 10/13/2000
CUSTOMER: La Porte Waste Water Treatment Plant PROJECT: WASTEWATER ATTN: Matthew Amor
Customer Sample ID: CSO OVERFLOW #3 Laboratory Sample ID: 110993-4 Date Sampled ...... : 09/12/2000 Date Received •.••... : 09!27!2000 Time Sampled ...... : 13:15 Time Received ..••.•. : 12:30 Sample Matrix ..... : Water
TEST METHOD • PARAMETER/TEST DESCRIPTION SAMPLE RESULT REPORTING LIMIT UNITS DATE TECH
EPA 200.7 Chromium (Cr) 0.015 0.010 mg/L 09!29!00 bjl
EPA 200.7 Copper (Cu) 0.042 0.010 mg/L 09!29!00 bjl
EPA 200.7 Nickel ( N i) 0.011 0.010 mg/L 09!29!00 bjl
EPA 200.7 Zinc (Zn) 0.063 0.010 mg/L 10!03!00 chh
EPA 213.2 Cadmium (Cd) <0.0005 0.0005 mg/L 09!29!00 chh
EPA 239.2 Lead (Pb) 0.010 0.005 mg/L 10/04/00 chh
Page 5

L A B 0 R A T 0 R Y T E S T R E S U L T S Job Number: 110993
CUSTOMER: La Porte Waste Water Treatment Plant PROJECT: WASTEWATER
Customer Sample ID: CSO OVERFLOW #5 Date Sampled ...... : 09/12/2000 Time Sampled ...... : 13:45 Sample Matrix ..... : Water
TEST METHOD PARAMETER/TEST DESCRIPTION SAMPLE RESULT
EPA 200.7 Chromium (Cr) 0.018
EPA 200.7 Copper (Cu) 0.044
EPA 200.7 Nickel ( N i) 0.014
EPA 200.7 Zinc (Zn) 0.084
EPA 213.2 Cadmium (Cd) <0.0005
EPA 239.2 Lead (Pb) 0.015
Page 6
•••••o• llii:Ji§IM ·-Date: 10/13/2000
ATTN: Matthew Amor
Laboratory Sample 10: 110993-5 Date Received ...... ... 09/27/2000 Time Received .... ., ... 12:30
REPORTING LIMIT UNITS DATE
0.010 mg/L 09!29!00
0.010 mg/L 09/29/00
0.010 mg/L 09!29!00
0.010 mg/L 10!03!00
0.0005 mg/L 09!29!00
0.005 mg/L 10/04/00
TECH
bjl
bj l
bj l
chh
chh
chh

S VERN
•••••••• SER\'ICES
L A B 0 R A T 0 R Y T E S T R E S U L T S Job Number: 110993 Date: 10/13/2000
CUSTOMER: La Porte Waste Water Treatment Plant PROJECT: WASTEWATER ATTN: Matthew Amor
Customer Sample ID: CSO OVERFLOW #7 Laboratory Sample ID: 110993-6 Date Sampled ...... : 09/12/2000 Date Received ....... : 09!27!2000 Time Sampled •..••• : 14:15 Time Received •••..•• : 12:30 Sample Matrix ..... : Water
TEST METHOD PARAMETER/TEST DESCRIPTION SAMPLE RESULT REPORTING LIMIT UNITS DATE TECH
EPA 200.7 Chromium (Cr) 0.024 0.010 mg/L 09!29!00 bjl
EPA 200.7 Copper (Cu) 0.044 0.010 mg/L 09!29!00 bjl
EPA 200.7 Nickel (Ni) <0.010 0.010 mg/L 09!29!00 bj l
EPA 200.7 Zinc (Zn) 0.104 0.010 mg/L 09!29!00 bjl
EPA 213.2 Cadmium (Cd) <0.0005 0.0005 mg/L 09!29!00 chh
EPA 239.2 Lead (Pb) 0.018 0.005 mg/L 10/04/00 chh
Page 7

La Porte Wastewater Treatment Pfant La6oratory
.1v1isce{{aneous Samy{e 'Data Slieet
Sample J.D. : (~0 OUUftvtJ S- 8-Sample Date : -----=2:.......-.::;__J.'I:........ -_ol,____ __ _ Sample Notes: ------------------
pH L-1 ----.J D.O. L-1 __ ___.
E. Coliform I ml of Sample I
Calculation: Colony Counts ___ + + ___ _ ml of Sample + + ___ _
Sum of Colony Counts X 100/ Sum ofml ___ = ___ Colonys/lOOml
Total Sus ended Solids ml of sam Gross Tare Difference 1 00$3 Solids in m II /~
CBODs Date Incubated· Date Removed· Sample ml of ml of Percent Initial 5Day D.O. Minus CBOD
J.D. Seed Sample Cone. D.O. D.O. Depletion Seed in mg/1 Factor
f£-.:5- Ju ;of. i.l. L;.l J,S :~ /.
~s- 90 'JOf, ~ . .3 z.Ct- S.l {4_.0 #.(R JO lUi ~-Z Lc.'l i ~ -~ fl,ftJ 9u 5()/{ ~. L (.. (p ..s.-. ~ II.. l ~7 JO lu%· ~-~ '(:>. 5 /.I .~ #-7 '10 JU;( ~- '-/ t.l s;.l 1'1.D ttf ]() 10 t 8 -I 0.8 I. ) ~~ tt'Ff 10 ~ot 7.8 .3.0 '4. 3 [L.D
Source of Seed: ----- Lab Tech: ___ _

I
La Porte 'Wastewater Treatment Pfant Lavoratory
:Misce[[aneous Samy[e Data Sheet
Sample J.D. . c"5-D Ot/i£fLuU 1-'i . Sample Date : J -2'1 -oL Sample Notes:
pHI D.o. I NH3-N I CN-c
E. Coliform ml of Sample I
Colon;y Count . Calculation: Colony Counts + + ml of Sample + +
Sum of Colony Counts X 100 I Sum ofml = Colonys/1 OOm I
ml of sam Gross Tare Difference Solids in m II
d{1tJI!,
CBODs Date Incubated· Sample ml of ml of Percent
I.D. Seed Sample Cone.
,4f Ju.--{ ;ot If/ C)o._f 3o%
11-l_ >o /U% tt2_ Cj() soX t13 '30 ;OX t13 90 Jut ~+'-I 3c) lu 1. t:t£j 90 Jot
Source of Seed: ____ _
Date Removed· Initial 5Day D.O. Minus CBOD
D.O. D.O. Depletion Seed in mg/1 Factor
zrg S'.'l z...D 20 C:> ~.2. {, ~ L.9 Z3 0
'i.2. G..l I.S j~
~.t/ /. c L. .l.v ;~z.o
~.3 t_.:,.G-' 1-~1 ·~~
~.i-/ 2. I L. lR·l zo.l 8,~ G.-; I. I ~~ 6.3 2. 3 L·O '10 0 l .
Lab Tech: -----
"? }.1.5' M£?

I
2
7
Indiana Water Pollution Control Associatiion, Inc.
... s-o ovc.effJ/J 2- <1-0/
+.JO
+- I Uu {,.JO
t,.JCf
tt 1,. 8/
~-~
P-<..'. s. I
/0.3
/0.~
fO. I
9.8
/D.J
l-~
!~
J.lp
L/_1._ b-6
., (/ t/fl6l. Ic£ -~/.0 ..). J Bt-r:cKJ~ 4L6e.
~ltC
3.1 (I
!.~

SEVERN
TRENT
SERVICES
L A B 0 R A T 0 R Y T E S T R E S U L T S Job Number: 602497 Date: 03/14/200'1
CUSTOMER: La Porte Waste Water Treatment Plant PROJECT: INFLUENT/EFFLUENT ATTN: Matthew 1\mor
Customer Sample ID: CSO Overflow #1 Laboratory Sample ::D: 602497-1 Date Sampled .....• : 02/24/2001 Date Received ..... ... 03/08/2001 Time Sampled ...... : 07:20 Time Received ..... ... 11:55
I
Sample Matrix ..... : Water
TEST METHOD PARAMETER/TEST DESCRIPTION SAMPLE RESULT REPORTING LIMlT UNITS DATE TECH
EPA 200.7 Chromium (Cr) <0.010 0.010 mg/L 03/09/01 chh
EPA 200.7 Copper (Cu) 0.017 0.010 mg/L 03/10/01 chh
EPA 200.7 Nickel (Ni) <0.010 0.010 mg/L 03!09!01 chh
EPA 200.7 Zinc (Zn) 0.153 0.010 mg/L 03!09!01 chh
EPA 213.2 Cadmium (Cd) <0.0005 0.0005 mg/L 03/10/01 chh
EPA 239.2 Lead (Pb) 0.026 0.005 mg/L 03/10/01 pal
I I
Page 2

ERVICES
L A B 0 R A T 0 R Y T E S T R E S U L T S Job Number: 602497 Date: 03/14/200'1
CUSTOMER: La Porte Waste Water Treatment Plant PROJECT: INFLUENT/EFFLUENT ATTN: Matthew 1\mor
Customer Sample ID: CSO Overflow #3 Laboratory Sample ::D: 602497-2 Date Sampled ...... : 02/24/2001 Date Received ....... : 03/08/2001 Time Sampled ...... : 07:50 Time Received ....... : 11 :55 Sample Matrix ..... : Water
TEST METHOD PARAMETER/TEST DESCRIPTION SAMPLE RESULT REPORTING LIMIT UNITS DATE TECH
EPA 200.7 Chromium (Cr) <0.010 0.010 mg/L 03!09!01 chh
EPA 200.7 Copper (Cu) 0.028 0.010 mg/L 03!10!01 chh
EPA 200.7 Nickel ( N i) <0.010 0.010 mg/L 03/09/01 chh
EPA 200.7 Zinc (Zn) 0.168 0.010 mg/L 03!09!01 chh
EPA 213.2 Cadmium (Cd) 0.0006 0.0005 mg/L 03!10!01 chh
EPA 239.2 Lead (Pb) 0.042 0.005 mg/L 03!10!01 pal
I
Page 3

·--L A B 0 R A T 0 R Y T E S T R E S U L T S
Job Number: 602497 Date: 03/14/200'1
CUSTOMER: La Porte Waste Water Treatment Plant PROJECT: INFLUENT/EFFLUENT ATTN: Matthew llmor
Customer Sample ID: CSO Overflow #5 Laboratory Sample ID: 602497-3 Date Sampled ...... : 02/24/2001 Date Received ....... : 03/08/2001 Time Sampled ...... : 08:20 Time Received ....... : 11:55 Sample Matrix ...•. : Water
TEST METHOD PARAMETER/TEST DESCRIPTION SAMPLE RESULT REPORTING LIMIT UNITS DATE TECH
EPA 200.7 Chromium (Cr) <0.010 0.010 mg/L 03/09/01 chh
EPA 200.7 Copper (Cu) 0.023 0.010 mg/L 03/10/01 chh
EPA 200.7 Nickel (Ni) 0.014 0.010 mg/L 03!09!01 chh
EPA 200.7 Zinc (Zn) 0.150 0.010 mg/L 03/09/01 chh
EPA 213.2 Cadmium (Cd) <0.0005 0.0005 mg/L 03/10/01 chh
EPA 239.2 Lead (Pb) 0.033 0.005 mg/L 03/10/01 pal
Page 4

·-I L A B 0 R A T 0 R Y T E S T R E S U L T S
Job Number: 602497 Oate: 03/14/2001
CUSTOMER: La Porte Waste Water Treatment Plant PROJECT: INFLUENT/EFFLUENT ATTN: Matthew Amor
Customer Sample ID: CSO Overflow #7 Laboratory Sample ID: 602497-4 Date Sampled ...... : 02/24/2001 Date Received ....... : 03/08/2001 Time Sampled ...... : 08:50 Time Received ....... : 11 :55 Sample Matrix ..... : Water
TEST METHOD PARAMETER/TEST DESCRIPTION SAMPLE RESULT REPORTING LIMIT UNITS DATE TECH
EPA 200.7 Chromium (Cr) 0.018 0.010 mg/L 03!09!01 chh
EPA 200.7 Copper (Cu) 0.026 0.010 mg/L 03/10/01 chh
EPA 200.7 Nickel ( N i) 0.012 0.010 mg/L 03/09/01 chh
EPA 200.7 Zinc (Zn) 0.162 0.010 mg/L 03/09/01 chh
EPA 213.2 Cadmium (Cd) 0.0005 0.0005 mg/L 03/10/01 chh
EPA 239.2 Lead (Pb) 0.040 0.005 mg/L 03/10/01 pal
Page 5

La Porte 'Wastewater 'Treatment P[ant Lavoratory
:M.isce[[aneous Samy[e 'Data Sfieet
Sam pie J.D. : _..::__(S_'()------=o'--J_(J2~p{'--r:; v-J_· __ _
Sample Date : __ -..J.I_-..~-1......::-0!_j-( ____ _
Sample Notes: ------------------
pHI D.o. I NH3-N I I CN-c
E. Coliform
I ml of Sample I
Colon,Y Count . Calculation: Colony Counts + + ml of Sample + +
Sum of Colony Counts X 100 I Sum ofml = Colonys/1 OOm I
Total Sus ended Solids ml of sam Gross Tare 21. 5LP z I Difference .oo73 .voC.,1 Solids in m n 73
CBODs Date Incubated: 7-7-v Date Removed: 7-/l-0/ Sample ml of ml of Percent Initial 5Day D.O. Minus CBOD
I. D. Seed Sample Cone. D.O. D.O. Depletion Seed in mg/l Factor
11-f !F.,( {,1. ?.2 g .I (J ,J !. I ~I t.tu.J 2o:t 8'.0 ~.2 f,'g' 1(1.0) ltl.. 15.} &% 'i.t 7.0, t),L )-3 IJ2_ w .. / lcJ'l J.Lj 5.1 2 ..., IC //.~ ~J tr~ iZ ~-A. 8.~ ---d3 wJ bJZ 7~ u./ l,l r~s:s)
tt<f (~J (;f. 'if./ 1.~ o.l -11 . .:1.
ttt.j &u.J 2vX 7.~ sf) 2...'1> (J--i~u -Source of Seed: ----- Lab Tech: ___ _
X X< )(
D

La Porte Wastewater 'Treatment Pfant La6oratory
:Jvlisce{{aneous Samy{e 'Data Slieet
Sam pie I.D. : ---=(-'-) J_· _ov_c.;;_a. '-'-Pi-=-~ vJ __ _ Sam pie Date : ___ _,_7_-7..__-_0~/-----__ _
Sample Notes: ------------------
pHI D.o. I NH3-N I I CN-c
E. Coliform
I ml of Sample I
Colonl: Count . Calculation: Colony Counts + + ml of Sample + +
Sum of Colony Counts X 100 I Sum ofml = Colonys/1 OOm I
ml of sam Gross Tare Difference Solids in m II
CBODs Date Incubated· Date Removed· Sample ml of ml of Percent Initial 5Day D.O. Minus CBOD
I. D. Seed Sample Cone. D.O. D.O. Depletion Seed i:n mgll Factor
45' ;f) ~i ~, ( 1.o D.'> 5""..,0. as- {pv.-f zoX. 7.?' 5'-i 2.~ (/LI) \ tt(r; nJ c:.:,r.: ~.1. 7.7 ()I 5' rr rt tt& &J) Zo ;L 7't 5.-S" 2."1:> IC11. s"· 47 ;~) &1. ~- 2- 7.7 (), S' l~ tj.7 &o) Zu% 7.?_ 5.~ 2.is ICJt.s"') jj_'? ;~Jl 0 %' J.~ ~.L -D - ~ rt8' &u.) 2v% 9,0 S:'1_ l./ v·IO;s-".
Source of Seed: Lab Tech: _ ....
----- ----

. ' Indiana Water Pollution Control Associatlion, Inc.
Sl ~-07 ~7
c) v ct.,:-, 1M) €_7·sb~
Sl'rt) fif/ J)() ft!,41j) r:i( (.,_ 70 S,c( 2(). s-
+fS #2. L.ll J.(,; I?.'"!
t].) P] ".s-a '-/' (., /1,'i
;'-/S tt'f ~-s z_ ~~ u '1 :;-( -
+f;..J rts-
t 7.) lt.(_;
1- 'jll JJ7
-i /0~ r+Jf
i£. {' tJ L 1 ,C(),f~
/~ -It( 3V> #2 7).JTC. tJJ /AfT(_ ~tf TIJTC-f/. S" 1JJ TC-Ii(, T)JTC-
117 T)JTC-tJg 1JJTC
I --'B ''-~
(;.if
~--r,. 0
~-~/
'-1-v rJ },
'/. '-1 )0. <.)
'f.v lo.J
.s.o i1. (t
1074L-3t-OO
i..z¥=~ > zw, <)A)
~ > zu;;l ().J-0
>~ '71.-<.AJ, c.vv )~ '?LJI.J, <NO
)'~ .7l·uil1
V'fJQ ?~o /Qo~.~ 7~ 72-v.J, (.()0
-it'-.
/JY{(j
L.1;19c. wtt{r.. I) .N<-ff ~<.A..~ .·A.):;
(,. ) .;t L,tc.... ·i ~
~-- 7 t Lvtt:::::._
~,
-J. etr.~
r., . ~ <::: i,{]; __

L A B 0 R A T 0 R Y T E S T R E S U L T S Job Number: 607201
CUSTOMER: La Porte Waste Water Treatment Plant PROJECT: INFLUENT/EFFLUENT
Customer Sample ID: CSO OVERFLOW #1 Date Sampled ...... : 07/07/2001 Time Sampled ...... : 00:00 Sample Matrix ..... : Water
TEST METHOD PARAMETER/TEST DESCRIPTION SAMPLE RESULT
EPA 200.7 Chromium (Cr) <0.010
EPA 200.7 Copper (Cu) 0.021
EPA 200.7 Nickel ( N i) <0.010
EPA 200.7 Zinc (Zn) 0.074
EPA 213.2 Cadmium (Cd) <0.0005
EPA 239.2 Lead (Pb) 0.018
Page 4
S VERN
lllhli§IM SIER\ICES
Date: 07/18/2001
ATTN: Matthew Amor
Laboratory Sample ID: 607201·3 Date Received •.•.... : 07/09/2001 Time Received ....... : 08:00
REPORTING LIMIT IJNITS DATE
0.010 mg/L 07/10/01
0.010 mg/L 07/10/01
0.010 mg/L 07/10/01
0.010 mg/L 07/17/01
0.0005 mg/L 07/15/01
0.005 mg/L 07/11/01
TECH
chh
chh
chh
chh
chh
chh

S VERN
IIJI;j@§IM SIER\ICES
L A 8 0 R A T 0 R Y T E S T R E S U L T S Job Number: 607201 Date: 07/18/2001
CUSTOMER: La Porte Waste Water Treatment Plant PROJECT: INFLUENT/EFFLUENT ATTN: Matthew Amor
Customer Sample ID: CSO OVERFLOW #3 Laboratory Sample ID: 607201-4 Date Sampled ...... : 07/07/2001 Date Received ....... : 07/09/2001 Time Sampled ...... : 00:00 Time Received ....... : 08:00 Sample Matrix .•... : Water
TEST METHOD PARAMETER/TEST DESCRIPTION SAMPLE RESULT REPORTING LIMIT UNITS DATE TECH
EPA 200.7 Chromium (Cr) <0.010 0.010 mg/L 07/10/01 chh
EPA 200.7 Copper (Cu) 0.027 0.010 mg/L 07/10/01 chh
EPA 200.7 Nickel ( N i) 0.013 0.010 mg/L 07/10/01 chh
EPA 200.7 Zinc (Zn) 0.062 0.010 mg/L 07/17/01 chh
EPA 213.2 Cadmium (Cd) <0.0005 0.0005 mg/L 07/15/01 chh
EPA 239.2 Lead (Pb) 0.023 0.005 mg/L 07/11/01 chh
Page 5

S VERN
E!SJI§IM ~ER\ ICES
L A B 0 R A T 0 R Y T E S T R E S U L T S Job Number: 607201 Date: 07/18/2001
CUSTOMER: La Porte Waste Water Treatment Plant PROJECT: INFLUENT/EFFLUENT ATTN: Matthew Amor
Customer Sample ID: CSO OVERFLOW #5 Laboratory Sample ID: 607201-5 Date Sampled ...... : 07 !07 /2001 Date Received ....... : 07/09/2001 Time Sampled ...... : 00:00 Time Received ....... : 08:00 Sample Matrix ..... : Water
TEST METHOD PARAMETER/TEST DESCRIPTION SAMPLE RESULT REPORTING LIM IT UNITS DATE TECH
EPA 200.7 Chromium (Cr) <0.010 0.010 mg/L 07/10/01 chh
EPA 200.7 Copper (Cu) 0.041 0.010 mg/L 07/10/01 chh
EPA 200.7 Nickel ( N i) <0.010 0.010 mg/L 07/10/01 chh
EPA 200.7 Zinc (Zn) 0.088 0.010 mg/L 07/17/01 chh
EPA 213.2 Cadmium (Cd) <0.0005 0.0005 mg/L 07/15/01 chh
EPA 239.2 Lead (Pb) 0.028 0.005 mg/L 07/11/01 chh
Page 6

Sll 1~\ I ( I S
!
I Job Number: L A B 0 R A T 0 R Y T E S T R E S U L T S
607201 Date: 07/18/2001 !
..
CUSTOMER: La orte Waste Water Treatment Plant PROJECT: INflUENT/EFFLUENT ATTN: Matthelol Amor .... , .. ·.
'"'tome~ Samplo ID' CSD DVERFLDU #7 Laboratory Sample ID: 607201-6 Date Sa pled ...... : 07/07/2001 Date Received .....•. : 07/09/2001 Time Sa pled ...... : 00:00 Time Received •...... : 08:00 Sample atrix ..... : Water
TEST METHOD PARAMETER/TEST DESCRlPTI ON SAMPLE RESULT REPORTING LIMIT UNITS DATE TECH .
EPA 200.7 Chromium (Cr) <0.010 0.010 mg/L 07/10/01 chh
EPA 200.7 Copper (Cu) 0.042 0.010 mg/L 07/10/01 chh
EPA 200.7 Nickel (Ni) <0.010 0.010 mg/L 07/10/01 chh
EPA 200.7 Zinc (Zn) 0.077 0.010 mg/L 07/17/01 chh
EPA 213.2 Cadmium (Cd) <0.0005 0.0005 mg/L 07/15/01 chh
EPA 239.2 Lead (Pb) 0.026 0.005 mg/L 07/11/01 chh
Page 7

JHeral o -Argtl5 fHE LAPORTE H(Pt..LQ.ARGUS u
~--.-... ..... - ·.' ..... -Second· Eront \ __ _...--'
J ail~-work moves along Fine weather has helped expansion stay on track CHRIS JACOBS fllr. LAPOJI f( IIH1AUJ 1\HOIJS
l.af'orl!• County Comml..-lon· r:r Marlow !Iarmon 5•ys th~ La·
\ f'ortf! County Jail r.~pan11lon ix going ·p~tr .. mrly W!'ll."
lkd ~par<' IIJl to a capacity of 350 is f;eing added to tbe jail. It curr~ntly has 135 beds and on av<'ra~e, :25 inmates.
"So far WP, U!' ahead 0<1 OUr
tim~ 8Chf'dulo:o end w~JI unrh•r hurll(et," !Iarmon uld.
The .-.ttmaled cost for the project i1 $22 million.
Harmon said an I'Brly change of S370,000 lr.ss in construction ·materials has allowed .'lOme ad· dit!onal things to~ put bad into the construction.
"It has also kept us under budget, which is really good," Hannon ,said.
He said DLZ, th<' architectural nrm (or the projl'cl, has ~n k~ping a close eye on costs. He also said favorabl~ wt>ather ha.o; kept things going smcx>lhly.
IY CHRlS JAC08SjSTM•
LAPORTE COUNTY Sheriff Jirn Arnold explains the layout of the ne·..., sally POrt ar<:a on th"! e'lSt 51de of the county J<lil building to rnembers of the LaPorte County Council and Commission Monday ilfternor;n.
Builder Larson-Danielson has · ~n working hard to. keep thing~ wiU1ln or ~low th!' spo:~ified budget.
LaPorte County Sheriff Jim Arnold invite<! mt-mt)('rs of the LaPorte County Council and Commission to lour the construction site Monday afternoon. ·Jie explained tha l things are goIng well, but oot without prob-
!ems. "Most of our major issues aH
with th~ kitchen fadliliel Wr tls.-d to bring all food d!'cliveri--,; th:·ough the sally port an·a Ia vr~ htcle t"ntrance on the east !•nd of lht· <'ounty C'Omplex off Wa~hlnglon Stn·f't), but that i• ciOO"<l ~n 1l
can ~ made into offices. So "''' ha'le to bring food in from a sir!<• door and down through the main COIJnty com pier elevator." Arnold said. "There are just
Residents of McClung lash out at mayor Claim they weren't told of impending drainage work DANIEL PRZYBYLA Til£ LAf'OVH( >J[RALD I\HGU5
J,al'ortP Mayor Kathy
of lhr ~llt•rnat•• rnut ... to !'in~
Lake Av<>nu• whil~ thP av.-ntH' 11
bt'irt~ V•'idNI~cJ HrJ~'I r.•s11rla~1n~ will COil
S 125,000 Th• quotf's lr•r tht' s<>w. I'T W(Jrt Will !;.. Ol><'flf'f] Wf!<:fO<'.,· d•v. flr•arJwork won't he1;1n until lh~ ~tf)rrn ~ww,.r prO)P('"t 1~ drJn.-.~
probl~ms continually cropping up
· Arnold aill'l ta!k<'rl ab<JUt ~IPi::· trical problems In tlH' kltrhPn ar!·a. ,..,o f'!Pctrical work ha3 bf'f•n doM in that arra of thf> coiTIPI"x s,inrP it wa., built In J9n
"fl•·causP nothing n!'w ha$ evr·r l)('f'n drJn<' to thn~ rl!'ctrical win-s. th<'¥ h<Jve su~tain<'<J a Jot of watt>r ·darnagP ovrr th~ yrars. And nnw, from th~ ron-
Officer's wife
accidentally shot rorn~;H IAI'i- A wnm~n
rh11ngJng th!' sh<'t•t5 on a t><'d wns ~hot wh<'n a gun krpt und!'r th•· mattr<'ss appar~ntly dl~hargcd accidf'ntally, pollr~ s~ld
El<'tll' Sc<>ll, Jl. who~•· hu~band Chrl~ S<"nlt I~ a ~<>rg.-ant with lhf' F'ort<"r pnl1rr• rh'portm .. nt, was Jlst~d 1n ~··rlnu• ronrlillon Mnnd~y ot f'ort~r MPrnnrlallln~pll~lln V•lp>r•ivJ
Chrl• Sr·ntt found hi~ wi(r
. sh<>rtly aftpr np linl~twd working at 9 p.m. Satu.rday H~>tty S<;r;tt """·' a!on~ at thf' tlrn•.o trw gun w~nt rJff anrJ wu unabl" trJ citll for a!•-li)tancr aft!'r t~<>in~; ~hot 111 thf' rh<>•t. p<?ll<:~ ~aid lnv•·~ll;;a. lor:§ w~r~ POt JUr~ ~l_iH:·[I)' Wh~IJ
~lrurtion, •1r just frr>rn we~r and trar, lhPy short~>d out," ,\ rnnlrJ SolirL -n;., pr>wer bas ~0 nurtuating anrJ it flnaiJy Wt>Ot off ~ we have to r!:'wire everything ill'ld !Mn wh"n we remod~l lh!:' l:itd~en Jatt>r. we'll have to t.akt> all lhh wiring out anrl rr·-dn t>~rcrylhin~ again."
The shrriff Pstlmated th,11 eon.1truction would b<! complt>t· f'd 1n ~cem~r 200J. f!e 5aid hP ~nd Lan.on-Danielson h<tv!'
BRIEFS
~hr w a.• sh·JI. ThP gun. • Jll-ca!l~,r Smith
and WP"-\nn r .. v<:JlYPr. I• nwn.-d hv Chrl3 Sron but i' not ownPd b)· pnllrP <J.-partm•·nt in th~ town of ~tY•ut J,JI)<') ~pi•• rwar Lab· ,\ll\hlr,an.
People can
talk sewage Th" L.-.f'ortr• w~,t,watf'r li<··
p.rtrrwnl w111 hnld ,, puhlw m~<'tln~ ill JQ • rn \l."drl\'-'<lay ''' ('1\v l!allto 'llnw r•>~d,.nt• to a'k '{ll">lltmi i>l:v111t lhP rity·~ 1Jp•
r:-orn1ng rrJrnl•lnf>-d Y:·..,.,·a~~ 'JvPr~
flow rontrol plan Wd.lt••w•t"r Sup•rlnt~'nrl,.nt
J•rry Ja~bnn ~.aid h" II updato thP publ1r aiYHJt wh6r• thr• r-tty ~land~ w1th Jt~ plan ar1rl lh" rh-
.,.,.,.~.ly updal~ ffi!'<'ling~
•Jt may not look llkt> WP.vr>
~olll'n a lot arrompllsht>d. but
w~ r<'ally hav~ d'l~ a lot ln f'lur month.~: Arnold ~aJd
ArnolrJ ~aid lh<'n~ hav~ ~n
fl'w ChMti(P. orrl<>rs requiring additi'»1aJ funrb. -w~ havr nnly h.ad a f-.w
chan~;e ordPT! and they h.avp b<>f.n fairly ~mall. s.~ving rnorwy has t>f?!'rt tlr~t ~nd fon•most on thi~ pro)"<.·t," ,\mold XllrJ.
rr.ctlon th .. pl4n will t.ak., In tho futur~.
Th.<> pl•n JJ d<"~l gn'"d to crl'• tP W<~YJ to prf!vrnt unlr~at.-d ).ewag,. from (l()w!n~; Into watPr· way~. AI tlm<'~. untn•ated ~wall" b•~ bypa,.vrl thP tr~atm~>nl pl,;nl and p<HJr~d into Tr••·1~ DIIC'h. Pour tim<>~ Ul W<J!. untr~'aled .wwag• flnw•d tntn • tli!rh h<'hlnd th<> trr•t rn<'ot pl•nt. fillo>d • 17-•ne boldln~ pnnd thPTP and "lbS<"<jll<'Olly flnw,.rf lnln Tra•t.< Oitrh
A!YIIIt IM ,...,wal(f> ovrorflnw, rx-rurr"rJ prior to tlwl l Akr·IPv~l rnntrol ~y~tnn b--Ini( cnn.ltrurt~rJ in 199~. Th.P •·t•t.e- ,..~nt., munteip~lltl~~ ln r,.d11c~ th" ~o~·ir'Jnrn.,nt.ol harm cauud wh"n •••Waf/~ ri(P With Oa<:!PrJ,l flow, Into llr>'fl,., n/ w~t•r.
Casinos here take in record $90.4M in March
CAHY rAP, Th,· r1vp rA.,H).r''"' In nr,rthwt•"ft lndl41f\d ·tr)('Jk In d
rF•f"nrd J'J() i rnlll111n 1n ~L,rf"h and S259 J tnilllt')fl In tbv (Jr~t ltlff"f'
month' th" veur Jron1rally·. a sluR<ISh <·ronorny
In thP area may ll'· ,,~ '""'t partly fPSp<>nSI~I•• for lh• rr•('QfrJ lakP, OTIP ca.'tno ~p<JkPsrnan said
"Certain! I' in this rnarkPt. b<>Jng a day-trip ~arkPl so to 'P"ak vPr·
'ilL._ \IJmP IT1.Jrkt•l.;. t1J,Jt h44VP t.H'~f"rl
hurt. w••'ve lw<•ll ahl1• to t><•n<>ftt frnm Ill" fact llldt j><'<>~l~ arr• not !~<'In~ ai>IP to lr•vrl tn !.11,~ \'pf,U.Jef HauN of th<' M•w~tir Star ca~ino lnld thf' Gary Post Tribun"
Th<' Fllu<' Ch1p ra.IIM in .\lirhi~a o ('ity, w h1ch is J 11<l m inutP~ from th<' .\!JrhlgJn t"'rdf'r, rnad<' Sl~ 6 mill inn In .\Ia ret: and SH 9 nul lion for the quarter
Th" ,\laj<'stic Star's rr:•·enu.-s of Sl U rni!Jirm 111 Marrh and SJLI million for th<' quarter wf'rP tn., lowP:U amnn>; th" fiv• Thf' flo,...... 3h0f' casino of Hammond. tb., rlos••st lor ChH·a~.;o r~~irlf'flcs. wa~ top~ w1 th a re~ord $26 million in ~ar~h
Figiel1~: new H-1\. staffer
S a r a F'IKI•I ha., j o i n PrJ Thf' Lap o r t ~
HHaldAritU3 ·~ a ~ta((
pllotn~rr•· plwr
P r. ~ ; FliO&I P or nt. IlL, r~llrl.ent I~ a rerenl jourOMIJ.Im KHdUat~ of East.,rn fi!Jnoil lJnll'f·nlty. whf'r~ ~h., wu p/'><)tn orlllor ~nrl a :<t.aff wnl••r for Th~· Dolly F:.o•tPro .•1,..,, 'tucJ<>nt n~wlp~j)"r :\h" al~o play,.d on th" wnrr,..-n'J v.:..n.ity .VK'f"fl'r tPdtn
F'lv,i•J. !1, al.•n ho>lrl •L•ff photngrapho>r pr1$lllon.< for t)J"' Jo11rn•l G.antte. ~!•t· (f'>Oo, Ill. anrl Tim<'i-f'o crl-
·. er, Charlr!tnn. 111. w'ill• attPOrJiMI( 3rhrr1J rll"l•l !"'"" flniJ WPIIIn,kJ on •,t,., IJ-,<, piV•In!lr•phy 'La/( Chrobark I~ c•lrhlng th ... bac·k·
I a•h from Mc-Clung Hoar! rr.slrf.,nls nv"r plan~ to inst•ll • •lorm rlralnf.if'<' unr!"r th .. "'"" In romlng ,..,.,.b,
~ .. v.•rol ,,.~Jd,.nls •tlrnrJ,.<i Mnndn1·'~ L.F'ort .. City Cr1uorll mM"lln.,.; to voirf' their (lppn!itlon l'l the c-Ity'~ plan to ttlvl'rt stnrrn wat~r that roti<'ds orr thr 100 """~' hlock or McClung Into a pip<' that rould pv,.ntuolly trlrk· J,. down Into ~·i~h Trop Loki".
r>nnn• MrCt .. ...,·y, I~& W. M<:Clunr Rd .. uld thf' rlty has fw-1-n anythlnr hut up front about a dr•ln•ll:" prnjPCt lh•t '""ld .. nh have t-n Inquiring al>oul for thr
"Agoin, I'm nr>t ~··ndln~ ttw Wa·
trr lntr• tlw lak"." ChrobaC'k ~aid lollowin~ ltu• rnN·tln~ "It'~ g<>ln~ under ttw rood. It'~ g'Jirl£ to bP ~n· gin~<-r•~l tn trick!~ tbrrwgb ro<:"b. If It •tart~ ~hnotin~ lhr<JIIS.:h th<:rr. ,..~·11 cap it, w~'ll cln~" it"
Schmitt's concerns &hrnitt ~old h" ~h•r...,. hi• rnn
~lilu~:"nts• tflncerns ov,·r storm water p9t.,.ntially drainln~ Into th.- lalu•
Standing up to be heard not easy, but needed
, la~t tlf'Vf'rOI yu~. That'' on ICt:'U'-.ttlrm Chrobad
firmly rP.nl"'•
"I trl,.rJ tn kind of rn<>PI th~>rn
hallwoy ond that would leo put a valvl' ~n t~ drain that wnuld •hut il orr il ~~ JakP IPV<"I! s.:nt l()t>) hiuh nr- t&"n r ....... ,. ·-- ·---
A darn Kin~. vic~ pr<"'l'l"nt fl(
the I ..a Porte lli~h SdvxJI }uninr cia.'-'· ~ol up t,._f(>T<' til<> L..aPr)rt" . xhrx>l fl.rJ.>rd last Tu~Y'iay anrl said Y>tn" of his pc<>n w~r~n·t ~ .......... -
I W.u JusT I_...,·---·- THIHXIHG .....
Y?>J wni.P a r:ulumo and •v<>n-'1<1" ha.• an opiMnn Qf -~tn.:-r y~tJ wor- rtrllt Qr
wrllfl<; . ff y-,-,.J :.r.o-t 11"1 :J~.d ............. ~ ,.,_,
t.n ~ tl>o> r""t .,( th<o "lrl AHI~O,..Im,.n ~1\(j '"1'1"n'mdi"'l oit.>• t.n b-> ll<OP<'ll•lr
AJ,.:,&It '1<1 P""'J'I" 1M•<><1 "D

Received Event (Event Succeeded)
Date:
Pages: 7/10/02
3
07/10/2002 14:49
Time: 2:49PM Sender: 219 844 7754
219-844-7754 NIES ENGINEERING PAGE 02
SECTION 2.0: .PUBLIC PARTICIPATION
"Public Participation" is an essential part of the Long Term Control Plan (LTCP). The City of La Porte has formed a Citizen Action Committee (CAC) and has had several meetings. The steps taken by La Porte are as follows:
• William Hupp, P.E., from NIBS Engineering, Inc., Brett Barber, from Malcom Pieroie, Inc., Jerry Jackson, Superintendent for the La Porte Treatment Plant met with the La Porte Board of Public Works and Safety on April 10, 2002. Present from the Board was Mayor Kathy Chroback, Jack Rosenberg, Member and Al Hinton, Member. The tneeting was to inform the Board of the need to form a CAC. It was explained that CAC's should be formed to act as liaisons among municipal officials, NPDES permitting agencies, and the general public. There were recommendations made and the Mayor said she would call the different individuals and get the committee formed.
• The La Porte Herald Argus Newspaper had an article titled "People can talk sewage~' in the April23, 2002 paper. This was an open invitation for anyone who maybe interested to come to the first CAC meeting.
• The first meeting of the CAC was held April 24, 2002, at 10:00 a.m. at La Porte City Hall. It was explained that a L TCP must contain the following elements: 1. Establish public participation process. 2. Consider impacts to sensitive areas near CSO discharge points. 3. Post-construction compliance monitoring program and sampling protocol. The purpose of the committee was discussed as well as La Porte's sewer system and CSO location.
• The second meeting of the CAC was held May 14, 2002 at the La Porte Wastewater Treatment Plant. The installation of the CSO return pump station was discussed and how the system works. The phasing of the CSO LTCP were discussed. Phase I included increasing the volume of CSO that can be stored in the lagoon, increase pumping capacity of the CSO return pump station, installing a fine screen at the inlet to the CSO basin and look at plant hydraulics to increase the maxitnum flow through the plant. Phase II was to look at areas of street ponding and to determine a method to reduce this pending. After the meeting all person present were taken for a tour of the plant and CSO basin the CSO outlet structure.
• The third meeting was held June 12, 2002, at the Wastewater Treatment Plant. Phase I was discussed in detail with the associated cost for each improvement. The items discussed are as follows: 1. Modification to the Outlet Structure to raise the weir elevation. 2. Construct a earth dike on the east side of the basin and install a 60" RC pipe in an existing ditch along side of the basin edge and cover with earth. 3. Modify the CSO return pump station to 3500 gpm. Phase II projects discussed were as follows: l. Install a screening facility at the inlet to the CSO basin. 2. Removal of accumulated sludge in the CSO basin.
• The fourth meeting was July 18, 2002 at the Wastewater Treatment Plant. The Draft LTCP was discussed and the tinal plan will be sent to IDEM on July 31, 2002. Malcom Pirenie has sent a written request to DNR regarding endangered species.
2

:;?c~ved Event (Event Succeeded)
:. 4/24/02 Time: 3:58PM Pages: 2 Sender: 219 844 7754
04/24/2002 02:58 219-844-7754 NIES ENGINEERING PAGE 02
SUMMARY OF CAC MEETING, APRIL 24, 2002
The following people were in attendance;
1. Brett Barber, Malcolm Pirnie 2. William Hupp, P.E., NIES Engineering 3. Jerry Jackson, La Porte WWTP Superintendent 4. Mayor Kathy Chroback 5. Al Hinton, Board of Public Works 6. Jack Rosenberg, Board of Public Works 7. Jim Keil, La Porte County Surveyor/Member· of La Porte
County Drainage Board 8. ~.John Hodawal, Interested Observer/Resident of the City 9. Mathew Vigneault, La Porte Economic Development Corporation 10. Andrea Renner, La Porte City Council 11. -Larry Yazel, Farmer downstream of La Porte's CSO 12. •Robert Boklund, La Porte Co. Cons. Trust 13. Todd Taylor, Resident of La Porte/La Porte Water Dept.
Superintendent
Everyone introduced themselves to the group.
Mr. Brett Barber discussed the items that are part of the LTCP and they are as follows:
1. Consideration of sensitive areas 2. Public participation 3. Characterization, monitoring, and modeling 4. Evaluation of alternatives 5. Maximize flow through the POTW 6. Development of cost/performance curve 7. Financial capability and implementation schedule 8. Post-Construction compliance monitoring·program
There was a general discussion of the CSO and the people were told that before 1998 the CSO quantity was 150± million gallons and after installation of the return pump station the CSO quantity is 10± million gallons.
There will be a meeting of Malcolm Pirnie, NIES Engineering and the s.taff of the WWTP to discuss the sewer problems and come up with alternatives to solve these problems. This will be the subject of the next CAC meeting.
The Next meeting is May 15, at 4:00 PM at the La Porte WWTP.
2

Received Event (Event Succeeded)
Date: Pages:
6/11/02 2
05/11/2002 15:22 219-844-7754
·;!
---------- -----·· ·-;·· .. !·-T .. ----------------... --··-····-- •.••.• -- -- ·-- --- • ..:..l .. ~---· . -- . ·-· ---. -- - ••.
: i . ·-·----------· --~-·- r·····-· ....... - .... - . ------- -------· ... ------ ·-- ............. _ ..
-----·- __ , _____________ -.·- ----~-: !;
.... ---.. ~ - --~- j . . . -·- - ~ .... -
j
Time: 3:22PM
Sender: 219 844 7754
NIES ENGINEERING PAGE 02
.. . ?.66"' ~---.. ... -- ---- . . ... ·-···· .
_g;. t!": ~ .. -· .. . . . -· ~/7. -· \(.'._ ~--~~!~
.. :3~ ?.:-: ~ ~!.i) __ ~7-· ~·s'-l-7
. . . ~-- .... - . . --.-. - - .
·······~--- '• -·· ----~· ·- ···------·- ..... - -' ··-····-·· .. -·-···· ·····- ...... ·- ........... , -·-··- ..
···-··· - ·- -···--···- . -- ...... ··--······ ~ '• --· ---- . - ~~ ·- -- .. - ....... - ..... ,_ ........... .
-.... - •.. L. -- ···-· .. ·--- . . ·-···· ··-· ·-· ... -· ........•. •···---. . .... . . -. ·-·· ........ - . -·-···-···.
; ~ . -·--- ....... i ..
: i:
_i
2

Received Event (Event Succeeded)
Date:
Pages:
Company:
6/11/02
2
06/11/2002 15:22 219-844-7754
DATE: M~ \~
Time: 3:22PM
Sender: 219 844 7754
Fax Number:
NIES ENGINEERING PAGE 01
CAC MEETING ATTENDANCE
1 2002
NAME REPRESENTING PHONE/FAX
1 I -
@-.E~ ~~!!~!~a~!~~~ia~~6~2~ Ph: (219) 844 8680 I Fax~ (219) 844 7754
__ e-mail~ [email protected]
municipal, civil, environmental, & transportation engineering
1

3

Name
(Printed)
City of La Porte CSO-LTCP
Combined Sewer Overflow -Long Term Control Plan May 5th, 2004 Public Meeting
Si n in sheet: Signature Business or Organization Phone Number
(If you wish to be contacted about future

Plant Bypass to CSO Lagoon CSO Lagoon Date Influent Flow Rain CSO Lagoon Overflow Return Pump
MGD inches hours MGD MGD12/01/1996 7.11 0.79 7.86 2.5412/02/1996 6.19 0.00 0.2812/03/1996 5.78 0.06 0.00 0.0412/04/1996 5.61 0.00 0.0012/05/1996 5.82 0.13 0.00 0.0012/06/1996 5.94 0.25 0.0012/07/1996 5.67 0.00 0.0012/08/1996 5.35 0.02 0.00 0.0012/09/1996 5.59 0.00 0.0012/10/1996 5.42 0.00 0.0012/11/1996 7.17 0.51 6.50 1.4812/12/1996 6.58 0.04 0.00 0.2812/13/1996 5.91 0.00 0.0312/14/1996 5.72 0.10 0.0012/15/1996 5.73 0.10 0.00 0.0012/16/1996 5.93 0.01 0.00 0.0012/17/1996 5.65 0.20 0.00 0.0012/18/1996 5.39 0.00 0.0012/19/1996 5.90 0.03 0.0012/20/1996 5.17 4.00 0.0012/21/1996 5.18 0.00 0.0012/22/1996 4.92 0.01 0.00 0.0012/23/1996 8.21 1.07 14.64 7.2212/24/1996 6.40 0.10 0.00 0.6512/25/1996 5.47 0.00 0.1212/26/1996 5.86 0.07 0.00 0.0212/27/1996 5.83 0.00 0.0012/28/1996 5.85 0.00 0.0012/29/1996 5.43 0.01 0.00 0.0012/30/1996 5.45 0.00 0.0112/31/1996 4.87 0.00 0.0001/01/1997 5.65 0.09 0.16 0.0001/02/1997 5.84 0.00 0.0101/03/1997 5.76 0.01 0.86 0.0001/04/1997 6.13 0.22 2.55 0.0601/05/1997 5.18 0.00 0.0501/06/1997 5.11 0.02 0.00 0.0001/07/1997 5.01 0.01 0.00 0.0001/08/1997 5.03 0.00 0.0001/09/1997 5.21 0.34 0.00 0.0001/10/1997 4.48 0.13 0.00 0.0201/11/1997 4.48 0.00 0.0101/12/1997 4.32 0.00 0.0601/13/1997 4.82 0.00 0.0501/14/1997 4.87 0.00 0.0201/15/1997 5.07 0.34 0.00 0.1701/16/1997 4.93 0.19 0.00 0.0701/17/1997 4.84 0.03 0.00 0.0301/18/1997 4.67 0.12 0.00 0.1901/19/1997 4.96 0.00 0.0001/20/1997 5.33 0.00 0.0101/21/1997 7.47 0.56 13.10 4.3201/22/1997 8.37 0.11 12.51 2.8001/23/1997 6.65 0.03 0.00 0.4101/24/1997 6.24 0.04 0.00 0.1301/25/1997 5.60 0.03 0.00 0.02
LaPorte CSO Overflow Data
Page 1

Plant Bypass to CSO Lagoon CSO Lagoon Date Influent Flow Rain CSO Lagoon Overflow Return Pump
MGD inches hours MGD MGD
LaPorte CSO Overflow Data
01/26/1997 5.16 0.12 0.00 0.2701/27/1997 5.80 0.13 0.00 0.0701/28/1997 5.82 0.02 0.00 0.0101/29/1997 5.79 0.00 0.0001/30/1997 5.70 0.00 0.0001/31/1997 6.17 0.00 0.0002/01/1997 5.60 0.00 0.0002/02/1997 5.56 0.00 0.0002/03/1997 6.18 3.01 0.0902/04/1997 7.77 0.44 9.46 1.5502/05/1997 6.38 0.01 0.00 0.3502/06/1997 6.13 0.00 0.1502/07/1997 5.58 0.00 0.0102/08/1997 5.36 0.00 0.0002/09/1997 5.51 0.00 0.0002/10/1997 5.15 0.01 0.00 0.0002/11/1997 5.43 0.07 0.00 0.0002/12/1997 5.52 0.12 0.00 0.0002/13/1997 5.80 0.00 0.0002/14/1997 5.63 0.00 0.0002/15/1997 4.88 0.01 0.00 0.0002/16/1997 5.12 0.18 0.00 0.0002/17/1997 5.73 0.00 0.0002/18/1997 7.32 6.33 0.0802/19/1997 6.94 0.00 0.0302/20/1997 8.66 0.82 17.08 4.7102/21/1997 9.02 1.46 18.98 8.7402/22/1997 8.11 0.14 6.30 0.8902/23/1997 7.05 0.02 2.65 0.4602/24/1997 6.92 0.00 0.3302/25/1997 6.97 0.11 0.1402/26/1997 8.95 1.21 17.71 8.0802/27/1997 9.01 0.12 17.51 2.5402/28/1997 8.72 0.00 0.7203/01/1997 8.48 0.03 0.00 0.3303/02/1997 8.14 0.00 0.1703/03/1997 8.54 0.00 0.0903/04/1997 8.30 0.00 0.0703/05/1997 7.51 0.00 0.0903/06/1997 7.44 0.00 0.0803/07/1997 7.32 0.00 0.0303/08/1997 7.02 0.00 0.0403/09/1997 7.95 0.35 6.61 0.7903/10/1997 7.69 0.00 0.4403/11/1997 7.18 0.00 0.2103/12/1997 7.06 0.00 0.0903/13/1997 8.36 0.51 9.63 1.4203/14/1997 7.85 0.27 0.01 0.8903/15/1997 7.07 0.01 0.00 0.3503/16/1997 6.92 0.00 0.1603/17/1997 7.38 0.02 0.00 0.0503/18/1997 7.09 0.00 0.0503/19/1997 7.18 0.00 0.0403/20/1997 7.19 0.00 0.0303/21/1997 8.03 0.00 0.0203/22/1997 7.52 0.00 0.01
Page 2

Plant Bypass to CSO Lagoon CSO Lagoon Date Influent Flow Rain CSO Lagoon Overflow Return Pump
MGD inches hours MGD MGD
LaPorte CSO Overflow Data
03/23/1997 7.30 0.00 0.0003/24/1997 8.15 0.12 4.53 0.0903/25/1997 7.75 0.11 0.00 0.1503/26/1997 8.02 0.00 0.0503/27/1997 8.26 0.00 0.0403/28/1997 8.93 0.77 16.04 2.4703/29/1997 8.41 0.30 0.00 1.0303/30/1997 7.80 0.04 0.00 0.3403/31/1997 7.79 0.26 0.1504/01/1997 7.81 0.00 0.0604/02/1997 7.93 0.00 0.0404/03/1997 8.24 0.01 0.00 0.0304/04/1997 8.46 0.10 4.50 0.1104/05/1997 8.36 0.68 8.51 1.9204/06/1997 7.78 0.00 0.5504/07/1997 8.01 0.00 0.1804/08/1997 7.76 0.00 0.0604/09/1997 7.92 0.01 0.00 0.0104/10/1997 8.16 0.00 0.0004/11/1997 8.38 0.14 2.95 0.0304/12/1997 7.81 0.14 0.00 0.1504/13/1997 8.03 0.05 1.51 0.0904/14/1997 7.77 0.00 0.0104/15/1997 7.27 0.00 0.0104/16/1997 7.46 0.08 0.00 0.0004/17/1997 6.33 0.03 0.00 0.0604/18/1997 7.76 0.00 0.1004/19/1997 7.74 0.00 0.0304/20/1997 7.62 0.00 0.0004/21/1997 7.75 0.00 0.0004/22/1997 7.65 0.00 0.0004/23/1997 7.99 0.00 0.0004/24/1997 8.46 0.49 7.26 0.4504/25/1997 7.77 0.15 0.2104/26/1997 7.83 0.00 0.0604/27/1997 7.29 0.04 0.00 0.0104/28/1997 8.03 0.00 0.0004/29/1997 7.85 0.00 0.0004/30/1997 8.13 0.60 6.06 1.6105/01/1997 8.09 0.47 3.86 1.4005/02/1997 7.91 0.28 5.43 1.1105/03/1997 7.83 0.07 0.00 0.5405/04/1997 7.83 0.00 0.1605/05/1997 8.21 0.58 4.80 1.2005/06/1997 8.05 0.01 0.00 0.4705/07/1997 8.38 0.29 5.03 0.3405/08/1997 7.78 0.07 0.00 0.3805/09/1997 7.95 0.04 0.00 0.1405/10/1997 7.83 0.00 0.0305/11/1997 7.24 0.04 0.00 0.0005/12/1997 7.71 0.00 0.0005/13/1997 7.52 0.03 0.00 0.0005/14/1997 6.79 0.11 0.00 0.0005/15/1997 7.55 0.16 2.58 0.0605/16/1997 7.05 0.00 0.0205/17/1997 6.66 0.00 0.00
Page 3

Plant Bypass to CSO Lagoon CSO Lagoon Date Influent Flow Rain CSO Lagoon Overflow Return Pump
MGD inches hours MGD MGD
LaPorte CSO Overflow Data
05/18/1997 7.33 0.37 5.63 0.5305/19/1997 7.31 0.10 0.46 0.6805/20/1997 6.84 0.00 0.1905/21/1997 7.57 0.00 0.0305/22/1997 8.08 0.00 0.0005/23/1997 7.86 0.00 0.0005/24/1997 8.22 0.25 7.76 0.1905/25/1997 7.03 0.38 0.68 0.8905/26/1997 7.04 0.00 0.2105/27/1997 7.52 0.00 0.0205/28/1997 8.42 0.57 10.81 1.8405/29/1997 7.97 0.33 2.55 1.7805/30/1997 7.55 0.00 0.3205/31/1997 7.48 0.00 0.1006/01/1997 7.59 0.12 4.11 0.1406/02/1997 7.64 0.29 0.10 0.6606/03/1997 7.28 0.00 0.1806/04/1997 7.53 0.00 0.0306/05/1997 7.77 0.00 0.5206/06/1997 8.44 1.18 11.20 6.5106/07/1997 7.13 0.03 0.00 0.5806/08/1997 7.76 0.00 0.2406/09/1997 7.70 0.00 0.0606/10/1997 7.15 0.00 0.0006/11/1997 6.92 0.00 0.0006/12/1997 7.32 0.23 0.00 0.0406/13/1997 7.96 0.05 0.0206/14/1997 7.54 0.00 0.0006/15/1997 7.99 0.00 0.0106/16/1997 8.41 1.08 6.50 5.4806/17/1997 7.88 0.00 0.4206/18/1997 7.67 0.00 0.1206/19/1997 7.71 0.00 0.0106/20/1997 7.56 0.00 0.0006/21/1997 7.30 0.18 2.43 0.1906/22/1997 7.66 0.00 0.0406/23/1997 7.65 0.00 0.0006/24/1997 7.48 0.00 0.0006/25/1997 7.25 0.46 2.48 0.2806/26/1997 7.48 0.00 0.1506/27/1997 7.52 0.00 0.0106/28/1997 7.20 0.00 0.0006/29/1997 7.31 0.00 0.0006/30/1997 8.44 2.07 6.93 9.3207/01/1997 7.94 0.00 0.8307/02/1997 7.86 0.00 0.2107/03/1997 7.74 0.00 0.0207/04/1997 7.44 0.00 0.0007/05/1997 7.40 0.00 0.0007/06/1997 7.77 0.62 4.81 4.4007/07/1997 7.21 0.00 0.6207/08/1997 6.35 0.08 1.06 0.2307/09/1997 5.75 0.00 0.0607/10/1997 7.29 0.16 0.0107/11/1997 7.91 0.01 0.0007/12/1997 7.80 0.00 0.00
Page 4

Plant Bypass to CSO Lagoon CSO Lagoon Date Influent Flow Rain CSO Lagoon Overflow Return Pump
MGD inches hours MGD MGD
LaPorte CSO Overflow Data
07/13/1997 7.66 0.00 0.0007/14/1997 6.49 0.02 0.00 0.0007/15/1997 7.34 0.00 0.0007/16/1997 7.43 0.00 0.0007/17/1997 7.73 0.00 0.0007/18/1997 7.46 0.54 3.16 1.1607/19/1997 7.72 0.00 0.4807/20/1997 7.74 1.21 0.1007/21/1997 7.95 0.47 6.03 1.0007/22/1997 7.74 0.05 0.01 0.4607/23/1997 7.78 1.58 7.00 6.8207/24/1997 7.96 0.00 0.5107/25/1997 7.22 0.00 0.1107/26/1997 7.44 0.07 0.00 0.0307/27/1997 7.45 0.16 2.30 0.3507/28/1997 7.39 0.00 0.1407/29/1997 6.48 0.03 0.0107/30/1997 7.21 0.25 0.0007/31/1997 7.75 0.00 0.0008/01/1997 7.48 0.00 0.0008/02/1997 7.05 0.00 0.0008/03/1997 7.12 0.00 0.0008/04/1997 7.51 0.00 0.0008/05/1997 6.94 0.00 0.0008/06/1997 6.86 0.00 0.0008/07/1997 7.12 0.00 0.0008/08/1997 6.79 0.00 0.0008/09/1997 7.73 0.00 0.0008/10/1997 7.34 0.00 0.0008/11/1997 7.39 7.00 1.1008/12/1997 8.72 19.00 10.2408/13/1997 7.58 0.00 0.6808/14/1997 7.61 0.00 0.4308/15/1997 7.54 0.00 0.3408/16/1997 8.34 7.00 9.2708/17/1997 7.59 10.00 2.6308/18/1997 7.33 0.00 0.2808/19/1997 7.56 0.00 0.0508/20/1997 7.49 1.00 0.0508/21/1997 8.09 3.00 0.5508/22/1997 7.52 0.00 0.6108/23/1997 8.01 0.00 0.4208/24/1997 7.95 5.00 2.0608/25/1997 7.46 0.00 0.2408/26/1997 7.50 0.00 0.0308/27/1997 7.73 0.00 0.0008/28/1997 7.93 0.00 0.0008/29/1997 6.40 0.00 0.0008/30/1997 4.99 0.00 0.0008/31/1997 4.38 0.00 0.0009/01/1997 4.60 0.00 0.0009/02/1997 6.47 0.00 0.0009/03/1997 7.54 0.00 0.0009/04/1997 7.28 0.00 0.0009/05/1997 6.98 0.00 0.0009/06/1997 7.10 0.00 0.00
Page 5

Plant Bypass to CSO Lagoon CSO Lagoon Date Influent Flow Rain CSO Lagoon Overflow Return Pump
MGD inches hours MGD MGD
LaPorte CSO Overflow Data
09/07/1997 6.87 0.00 0.0009/08/1997 6.58 0.14 0.00 0.0009/09/1997 7.01 0.00 0.0009/10/1997 7.26 0.18 0.96 0.0009/11/1997 7.97 0.00 0.0309/12/1997 8.24 0.00 0.1309/13/1997 6.86 0.00 0.1909/14/1997 7.37 0.00 0.2009/15/1997 7.52 0.00 0.2409/16/1997 7.80 3.90 0.4609/17/1997 7.01 0.65 1.98 1.2109/18/1997 7.40 0.00 0.5409/19/1997 6.49 0.63 4.66 1.4209/20/1997 6.47 0.00 0.2809/21/1997 6.96 0.00 0.0109/22/1997 7.15 0.05 0.31 0.0409/23/1997 5.78 0.21 0.00 0.2009/24/1997 4.90 0.00 0.2509/25/1997 4.87 0.00 0.2709/26/1997 4.65 0.00 0.2509/27/1997 4.52 0.00 0.2509/28/1997 4.52 0.08 0.00 0.3109/29/1997 4.71 0.00 0.3009/30/1997 5.04 0.19 1.51 0.2910/01/1997 4.53 0.02 0.00 0.2910/02/1997 4.72 0.00 0.2410/03/1997 4.58 0.00 0.2210/04/1997 4.13 0.11 0.00 0.2910/05/1997 4.34 0.00 0.3710/06/1997 4.52 0.00 0.2810/07/1997 4.41 0.00 0.2510/08/1997 4.49 0.00 0.2310/09/1997 4.82 0.27 2.06 0.3510/10/1997 4.36 0.00 0.2210/11/1997 4.19 0.00 0.1510/12/1997 4.18 0.00 0.1410/13/1997 5.75 0.40 2.95 0.2310/14/1997 4.33 0.00 0.0510/15/1997 4.32 0.00 0.0010/16/1997 5.73 0.00 0.0010/17/1997 5.93 0.00 0.0010/18/1997 6.05 0.00 0.0010/19/1997 5.75 0.00 0.0010/20/1997 6.52 0.00 0.0010/21/1997 7.25 0.00 0.0010/22/1997 6.16 0.05 0.00 0.0010/23/1997 6.59 0.05 1.31 0.0010/24/1997 5.49 0.25 0.00 0.0010/25/1997 5.91 0.02 0.00 0.0010/26/1997 7.84 0.75 12.05 0.9810/27/1997 6.21 0.11 1.66 0.6410/28/1997 6.64 0.00 0.2410/29/1997 4.84 0.00 0.0110/30/1997 4.84 0.00 0.0010/31/1997 5.78 0.00 0.0011/01/1997 5.99 0.25 2.30 0.00
Page 6

Plant Bypass to CSO Lagoon CSO Lagoon Date Influent Flow Rain CSO Lagoon Overflow Return Pump
MGD inches hours MGD MGD
LaPorte CSO Overflow Data
11/02/1997 5.95 0.06 0.00 0.0011/03/1997 5.77 0.05 0.00 0.0011/04/1997 5.25 0.00 0.0011/05/1997 5.64 0.03 0.00 0.0011/06/1997 5.69 0.03 0.00 0.0011/07/1997 5.29 0.00 0.0011/08/1997 4.79 0.00 0.0011/09/1997 4.90 0.01 0.00 0.0011/10/1997 5.56 0.19 0.00 0.0011/11/1997 5.29 0.04 0.00 0.0011/12/1997 4.94 0.00 0.0011/13/1997 4.90 0.05 0.00 0.0011/14/1997 5.06 0.15 0.00 0.0011/15/1997 5.53 0.71 0.00 0.0011/16/1997 5.61 0.04 0.00 0.0011/17/1997 5.02 0.00 0.0011/18/1997 5.60 0.00 0.0011/19/1997 4.87 0.00 0.0011/20/1997 5.51 0.00 0.0011/21/1997 6.29 0.00 0.0011/22/1997 5.25 0.00 0.0011/23/1997 5.16 0.00 0.0011/24/1997 3.74 0.00 0.0011/25/1997 4.88 0.00 0.0011/26/1997 5.01 0.06 0.0011/27/1997 5.61 1.00 3.25 0.6111/28/1997 5.72 0.26 0.93 0.5011/29/1997 6.03 0.24 3.70 0.2911/30/1997 5.81 0.00 0.0412/01/1997 4.45 0.00 0.0012/02/1997 4.93 1.35 0.0012/03/1997 4.79 0.03 0.00 0.0012/04/1997 5.27 0.01 0.00 0.0012/05/1997 5.25 0.19 0.00 0.0012/06/1997 5.13 0.01 0.00 0.0012/07/1997 4.63 0.00 0.0012/08/1997 4.07 0.04 0.00 0.0012/09/1997 5.09 0.17 0.00 0.0012/10/1997 6.16 0.86 0.00 0.0012/11/1997 5.75 0.00 0.0012/12/1997 5.64 0.04 0.00 0.0012/13/1997 4.92 0.00 0.0012/14/1997 4.74 0.00 0.0012/15/1997 3.92 0.00 0.0012/16/1997 4.74 0.00 0.0012/17/1997 4.55 0.00 0.0012/18/1997 5.01 0.00 0.0012/19/1997 6.39 0.00 0.0012/20/1997 5.92 0.10 0.10 0.0012/21/1997 5.78 0.00 0.0012/22/1997 6.96 0.38 6.71 0.1912/23/1997 6.71 0.03 0.00 0.0612/24/1997 7.27 0.43 6.19 0.6412/25/1997 7.08 0.05 0.00 0.3112/26/1997 6.64 0.00 0.0312/27/1997 6.43 0.01 0.00 0.00
Page 7

Plant Bypass to CSO Lagoon CSO Lagoon Date Influent Flow Rain CSO Lagoon Overflow Return Pump
MGD inches hours MGD MGD
LaPorte CSO Overflow Data
12/28/1997 6.22 0.00 0.0012/29/1997 5.83 0.08 0.00 0.0012/30/1997 5.50 0.77 0.00 0.0012/31/1997 4.96 0.36 0.00 0.0001/01/1998 5.07 0.00 0.0001/02/1998 8.16 13.31 0.0401/03/1998 8.49 0.34 10.00 1.4601/04/1998 8.44 0.61 12.25 1.7101/05/1998 8.35 0.73 10.41 4.0701/06/1998 8.15 0.11 1.93 0.5001/07/1998 8.43 0.41 11.83 1.0301/08/1998 9.07 0.57 18.11 5.3701/09/1998 7.75 0.09 0.00 0.4501/10/1998 6.11 0.00 0.0201/11/1998 5.67 0.00 0.0001/12/1998 5.50 0.03 0.00 0.0001/13/1998 5.02 0.03 0.00 0.0001/14/1998 4.91 0.16 0.00 0.0001/15/1998 5.25 0.00 0.0001/16/1998 4.92 0.00 0.0001/17/1998 4.60 0.00 0.0001/18/1998 4.57 0.00 0.0001/19/1998 4.80 0.00 0.0001/20/1998 5.96 0.00 0.0001/21/1998 6.01 0.01 0.00 0.0001/22/1998 6.23 0.11 0.00 0.0001/23/1998 6.16 0.07 0.00 0.0001/24/1998 5.93 0.00 0.0001/25/1998 5.83 0.00 0.0001/26/1998 6.17 0.00 0.0001/27/1998 6.66 0.23 0.0001/28/1998 7.05 0.00 0.0001/29/1998 7.08 0.11 2.01 0.0001/30/1998 5.84 0.00 0.0001/31/1998 4.85 0.00 0.0002/01/1998 4.86 0.00 0.0002/02/1998 5.97 0.00 0.0002/03/1998 6.40 0.00 0.0002/04/1998 6.58 0.00 0.0002/05/1998 6.63 0.00 0.0002/06/1998 6.36 0.00 0.0002/07/1998 6.23 0.00 0.0002/08/1998 6.00 0.00 0.0002/09/1998 6.96 0.00 0.0002/10/1998 7.32 0.14 0.31 0.0002/11/1998 8.51 0.85 14.03 0.0302/12/1998 8.06 0.03 0.00 0.0002/13/1998 7.61 0.00 0.0002/14/1998 6.96 0.00 0.0002/15/1998 6.72 0.00 0.0002/16/1998 6.65 0.18 2.83 0.0002/17/1998 8.12 0.34 7.21 0.0002/18/1998 7.24 0.20 0.00 0.0002/19/1998 7.04 0.09 0.00 0.0002/20/1998 6.74 0.04 0.00 0.0002/21/1998 7.32 0.00 0.00
Page 8

Plant Bypass to CSO Lagoon CSO Lagoon Date Influent Flow Rain CSO Lagoon Overflow Return Pump
MGD inches hours MGD MGD
LaPorte CSO Overflow Data
02/22/1998 7.48 0.00 0.0002/23/1998 7.34 1.48 0.0002/24/1998 7.49 0.12 0.00 0.0002/25/1998 7.06 0.00 0.0002/26/1998 7.51 0.01 2.83 0.0002/27/1998 7.37 0.19 0.95 0.0002/28/1998 6.99 0.09 0.83 0.0003/01/1998 7.73 0.00 0.0003/02/1998 7.54 0.00 0.0003/03/1998 7.40 0.11 0.00 0.0003/04/1998 7.62 0.03 0.00 0.0003/05/1998 7.68 0.01 0.00 0.0003/06/1998 7.31 0.01 0.00 0.0003/07/1998 6.68 0.00 0.0003/08/1998 8.57 1.08 16.66 1.3803/09/1998 8.06 0.80 3.68 3.4903/10/1998 7.87 0.06 0.00 0.3403/11/1998 7.58 0.22 0.00 0.0003/12/1998 7.62 0.00 0.0003/13/1998 7.69 0.00 0.0003/14/1998 7.47 0.00 0.0003/15/1998 7.28 0.01 0.00 0.0003/16/1998 7.56 0.00 0.0003/17/1998 8.95 0.33 15.85 0.0003/18/1998 9.20 0.17 11.69 0.2303/19/1998 8.45 0.04 0.00 0.1003/20/1998 8.37 0.35 4.94 0.1903/21/1998 8.72 9.56 0.9103/22/1998 8.31 1.60 0.5603/23/1998 8.27 0.00 0.0703/24/1998 7.74 0.00 0.0003/25/1998 8.09 0.00 0.0003/26/1998 8.11 0.00 0.0003/27/1998 8.26 3.03 0.0003/28/1998 8.76 0.80 7.96 3.5403/29/1998 8.27 0.01 0.00 0.3803/30/1998 7.94 0.00 0.0303/31/1998 8.44 0.49 9.56 2.4504/01/1998 8.65 0.22 6.21 1.4304/02/1998 8.45 0.00 0.4504/03/1998 8.20 0.01 0.0204/04/1998 7.95 0.00 0.0004/05/1998 8.41 0.00 0.0004/06/1998 7.88 0.00 0.0004/07/1998 8.07 0.08 4.15 0.0004/08/1998 8.23 0.12 0.00 0.0004/09/1998 8.81 0.48 10.60 0.3104/10/1998 8.61 0.00 0.0904/11/1998 8.09 0.00 0.0004/12/1998 8.32 0.00 0.0004/13/1998 8.88 0.85 12.08 2.9004/14/1998 9.00 0.14 0.00 2.6604/15/1998 8.96 0.00 0.7804/16/1998 8.58 0.05 0.00 0.3904/17/1998 8.36 0.00 0.0104/18/1998 8.27 0.00 0.00
Page 9

Plant Bypass to CSO Lagoon CSO Lagoon Date Influent Flow Rain CSO Lagoon Overflow Return Pump
MGD inches hours MGD MGD
LaPorte CSO Overflow Data
04/19/1998 7.99 0.00 0.0004/20/1998 8.79 0.29 5.08 0.0004/21/1998 8.77 0.35 7.03 0.2404/22/1998 8.67 0.00 0.0604/23/1998 8.73 0.00 0.0004/24/1998 8.44 0.00 0.0004/25/1998 8.43 0.09 0.83 0.0004/26/1998 8.72 0.05 0.00 0.0004/27/1998 8.08 0.00 0.0004/28/1998 8.78 3.34 0.0004/29/1998 8.10 0.38 0.13 0.0004/30/1998 8.61 0.08 0.00 0.0005/01/1998 6.10 0.02 0.00 0.0005/02/1998 8.07 0.00 0.0005/03/1998 7.90 0.05 0.00 0.0005/04/1998 7.94 0.06 0.00 0.0005/05/1998 8.18 0.08 0.00 0.0005/06/1998 8.51 0.07 0.00 0.0005/07/1998 9.16 1.02 12.81 0.1605/08/1998 8.82 0.02 2.06 1.1105/09/1998 8.45 0.00 0.1505/10/1998 8.39 0.00 0.0005/11/1998 8.49 0.00 0.0005/12/1998 8.17 0.03 0.00 0.0005/13/1998 7.91 0.05 0.00 0.0005/14/1998 7.71 0.00 0.0005/15/1998 8.25 0.00 0.0005/16/1998 7.80 0.00 0.0005/17/1998 8.00 0.00 0.0005/18/1998 8.04 0.00 0.0005/19/1998 7.90 0.11 0.98 0.0005/20/1998 8.36 0.00 0.0005/21/1998 7.97 0.00 0.0005/22/1998 8.03 0.00 0.0005/23/1998 8.07 0.00 0.0005/24/1998 7.72 0.52 4.01 0.0005/25/1998 7.81 0.00 0.0005/26/1998 8.01 0.00 0.0005/27/1998 7.71 0.00 0.0005/28/1998 8.64 0.00 0.0005/29/1998 7.67 0.07 0.00 0.0005/30/1998 7.33 0.00 0.0005/31/1998 7.21 0.00 0.0006/01/1998 7.69 0.00 0.0006/02/1998 7.92 0.00 0.0006/03/1998 7.77 0.12 0.00 0.0006/04/1998 8.23 0.00 0.0006/05/1998 7.63 0.11 0.00 0.0006/06/1998 7.69 0.00 0.0006/07/1998 7.70 0.00 0.0006/08/1998 8.02 0.06 0.00 0.0006/09/1998 8.25 0.45 6.86 0.0006/10/1998 7.91 0.01 0.0006/11/1998 8.97 1.54 17.48 6.0206/12/1998 8.47 0.03 1.96 2.1706/13/1998 7.53 0.00 0.44
Page 10

Plant Bypass to CSO Lagoon CSO Lagoon Date Influent Flow Rain CSO Lagoon Overflow Return Pump
MGD inches hours MGD MGD
LaPorte CSO Overflow Data
06/14/1998 7.57 0.00 0.0106/15/1998 8.23 0.00 0.0006/16/1998 7.66 0.00 0.0006/17/1998 7.83 0.00 0.0006/18/1998 7.88 0.50 0.98 0.0006/19/1998 7.53 0.05 2.63 0.0006/20/1998 7.58 0.00 0.0006/21/1998 7.59 0.00 0.0306/22/1998 8.33 0.00 0.0006/23/1998 7.32 0.00 0.0006/24/1998 7.90 0.00 0.0006/25/1998 7.86 0.00 0.0806/26/1998 7.77 0.30 1.90 0.0006/27/1998 7.37 0.00 0.0006/28/1998 7.76 0.02 0.00 0.0006/29/1998 8.14 0.37 3.05 0.0006/30/1998 7.79 0.03 0.0007/01/1998 7.85 0.00 0.0007/02/1998 8.30 0.00 0.0007/03/1998 7.68 2.05 2.76 1.2007/04/1998 7.89 4.91 5.3407/05/1998 7.90 0.00 0.1307/06/1998 8.11 0.00 0.0007/07/1998 8.67 1.20 8.89 6.9507/08/1998 8.56 0.00 0.6607/09/1998 8.32 0.00 0.0007/10/1998 7.83 0.00 0.0007/11/1998 7.81 0.00 0.0007/12/1998 8.53 0.00 0.0007/13/1998 8.49 0.00 0.0007/14/1998 7.19 0.00 0.0007/15/1998 8.01 0.00 0.0007/16/1998 8.22 0.00 0.0007/17/1998 7.46 0.00 0.0007/18/1998 7.52 0.00 0.0007/19/1998 6.67 0.16 1.01 0.0007/20/1998 7.70 0.00 0.0007/21/1998 7.54 0.00 0.0007/22/1998 7.25 0.60 2.41 0.0007/23/1998 8.25 0.00 0.0007/24/1998 8.03 0.00 0.0007/25/1998 7.66 0.00 0.0007/26/1998 7.79 0.00 0.0007/27/1998 7.83 0.00 0.0007/28/1998 5.81 0.00 0.0007/29/1998 6.08 0.00 0.0007/30/1998 6.50 0.00 0.0007/31/1998 7.08 0.00 0.0008/01/1998 8.05 0.00 0.0008/02/1998 5.88 0.00 0.0008/03/1998 6.01 0.14 1.63 0.0008/04/1998 8.39 1.23 9.76 0.0008/05/1998 8.04 0.60 3.01 0.0708/06/1998 7.86 1.93 0.4008/07/1998 7.18 0.13 0.01 0.0008/08/1998 7.27 0.08 1.05 0.00
Page 11

Plant Bypass to CSO Lagoon CSO Lagoon Date Influent Flow Rain CSO Lagoon Overflow Return Pump
MGD inches hours MGD MGD
LaPorte CSO Overflow Data
08/09/1998 8.66 1.41 10.18 6.3808/10/1998 8.47 0.60 1.5508/11/1998 8.34 0.00 0.0108/12/1998 8.42 0.00 0.0008/13/1998 8.38 0.00 0.0008/14/1998 8.07 0.00 0.0008/15/1998 7.87 0.00 0.0008/16/1998 7.59 0.00 0.0008/17/1998 8.25 0.00 0.0008/18/1998 8.15 0.00 0.0008/19/1998 8.18 0.00 0.0008/20/1998 7.21 0.00 0.0008/21/1998 7.13 0.00 0.0008/22/1998 7.04 0.43 2.65 0.0008/23/1998 6.90 4.11 0.0008/24/1998 7.56 0.25 2.01 0.0008/25/1998 7.93 0.41 2.43 0.0008/26/1998 8.07 0.05 0.00 2.0008/27/1998 8.35 0.00 0.00 1.0008/28/1998 7.88 0.14 0.00 0.00 2.0008/29/1998 8.01 0.00 0.00 2.0008/30/1998 7.29 0.00 0.00 1.5708/31/1998 7.14 0.00 0.00 0.4009/01/1998 7.68 0.00 0.00 0.4309/02/1998 8.46 0.00 0.00 1.1709/03/1998 7.96 0.05 0.00 0.00 0.9609/04/1998 7.86 0.00 0.00 0.6909/05/1998 6.61 0.00 0.00 0.0009/06/1998 6.57 0.02 0.00 0.00 0.0009/07/1998 6.35 0.11 1.25 0.00 0.1409/08/1998 5.15 0.05 0.00 0.00 0.0009/09/1998 5.10 0.00 0.00 0.0009/10/1998 6.40 0.00 0.00 1.2509/11/1998 6.30 0.00 0.00 1.9109/12/1998 4.80 0.00 0.00 0.9209/13/1998 3.90 0.00 0.00 0.0009/14/1998 4.32 0.00 0.00 0.4409/15/1998 4.17 0.12 0.00 0.00 0.0109/16/1998 4.80 0.00 0.00 0.0009/17/1998 4.15 0.00 0.00 0.0009/18/1998 3.88 0.00 0.00 0.0009/19/1998 5.36 0.00 0.00 1.7309/20/1998 5.85 0.45 3.50 0.00 1.3309/21/1998 6.08 0.01 0.00 0.00 1.8109/22/1998 5.94 0.00 0.00 1.7509/23/1998 4.68 0.00 0.00 0.4709/24/1998 4.20 0.03 0.00 0.00 0.0009/25/1998 4.17 0.00 0.00 0.4109/26/1998 4.53 0.00 0.00 0.8209/27/1998 3.71 0.00 0.00 0.2709/28/1998 3.70 0.00 0.00 0.0009/29/1998 4.53 0.00 0.00 0.5109/30/1998 6.39 0.36 2.56 0.00 1.1610/01/1998 6.36 0.00 0.00 1.7910/02/1998 6.69 0.46 4.98 0.00 1.3410/03/1998 5.05 0.05 0.00 0.00 1.16
Page 12

Plant Bypass to CSO Lagoon CSO Lagoon Date Influent Flow Rain CSO Lagoon Overflow Return Pump
MGD inches hours MGD MGD
LaPorte CSO Overflow Data
10/04/1998 5.11 0.00 0.00 1.6010/05/1998 5.07 0.17 0.00 0.00 0.6010/06/1998 6.74 0.65 8.61 0.00 0.0110/07/1998 6.94 0.04 0.00 0.00 2.0810/08/1998 6.67 0.07 0.00 0.00 1.8710/09/1998 5.89 0.00 0.00 1.5410/10/1998 4.21 0.00 0.00 0.0010/11/1998 4.05 0.00 0.00 0.0010/12/1998 4.42 0.00 0.00 0.0910/13/1998 5.09 0.00 0.00 0.8110/14/1998 5.68 0.00 0.00 1.4710/15/1998 5.75 0.00 0.00 1.2510/16/1998 5.06 0.00 0.00 0.7110/17/1998 4.34 0.07 0.00 0.00 0.0010/18/1998 5.17 0.27 2.48 0.00 0.0010/19/1998 4.92 0.00 0.00 0.4910/20/1998 4.87 0.00 0.00 0.4410/21/1998 4.18 0.01 0.00 0.00 0.0010/22/1998 5.50 0.04 0.00 0.00 1.3110/23/1998 4.02 0.00 0.00 0.1110/24/1998 3.52 0.00 0.00 0.1010/25/1998 5.14 0.00 0.00 1.8410/26/1998 3.58 0.00 0.00 0.0010/27/1998 3.87 0.04 0.00 0.00 0.0510/28/1998 5.27 0.01 0.00 0.00 0.8810/29/1998 5.55 0.27 2.50 0.00 0.2510/30/1998 6.58 0.10 0.13 0.00 1.8610/31/1998 5.28 0.02 0.00 0.00 1.2011/01/1998 5.18 0.01 0.00 0.00 1.1911/02/1998 4.21 0.00 0.00 0.0211/03/1998 4.22 0.00 0.00 0.1411/04/1998 4.59 0.00 0.00 0.3911/05/1998 5.60 0.05 0.00 0.00 1.1511/06/1998 5.14 0.07 0.00 0.00 0.0011/07/1998 5.52 0.00 0.00 0.0811/08/1998 6.63 0.11 0.00 0.00 1.1111/09/1998 6.22 0.65 1.95 0.00 0.2711/10/1998 8.79 0.47 11.10 0.00 0.8111/11/1998 8.21 0.00 0.00 2.4511/12/1998 8.28 0.05 0.00 0.00 2.4411/13/1998 8.08 0.00 0.00 2.5211/14/1998 5.60 0.00 0.00 0.2311/15/1998 5.16 0.00 0.00 0.0011/16/1998 6.34 0.00 0.00 0.8811/17/1998 5.29 0.01 0.00 0.00 0.0011/18/1998 5.86 0.00 0.00 0.0011/19/1998 5.78 0.00 0.00 0.0011/20/1998 5.44 0.00 0.00 0.0011/21/1998 6.52 0.00 0.00 1.1411/22/1998 5.27 0.00 0.00 0.0011/23/1998 5.62 0.00 0.00 0.0011/24/1998 5.61 0.00 0.00 0.0011/25/1998 6.15 0.02 0.00 0.00 0.7011/26/1998 5.12 0.00 0.00 0.0011/27/1998 5.47 0.00 0.00 0.5111/28/1998 5.31 0.00 0.00 0.24
Page 13
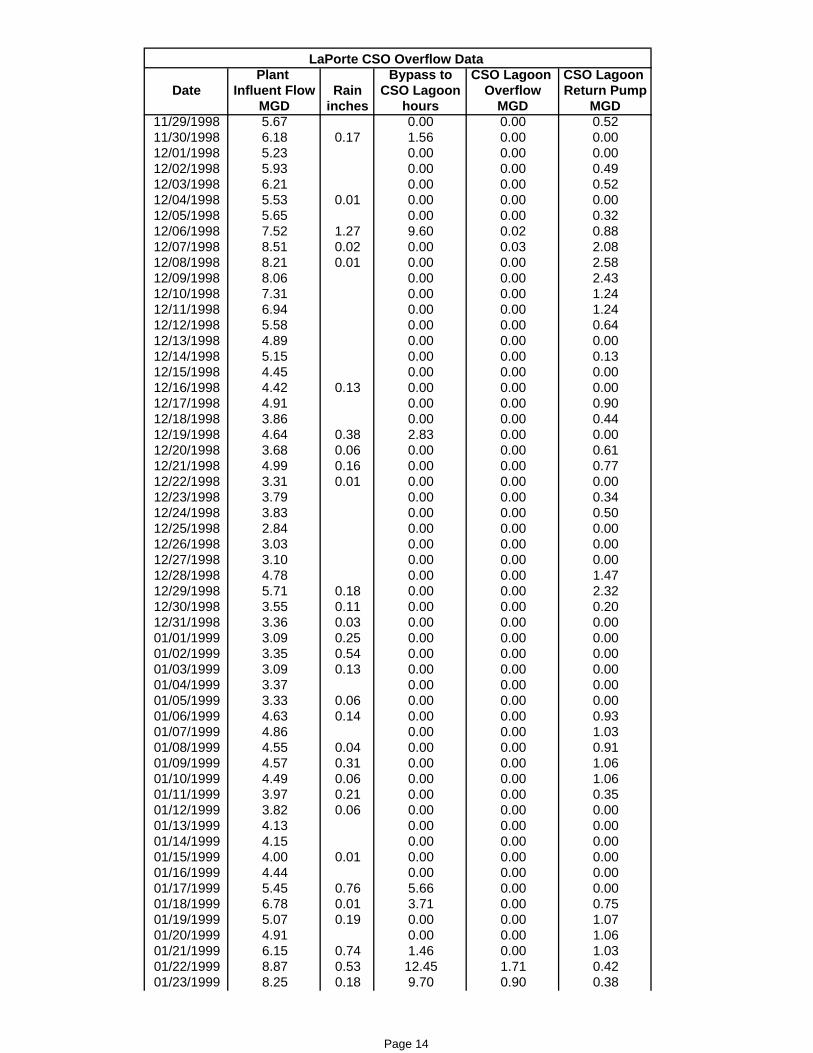
Plant Bypass to CSO Lagoon CSO Lagoon Date Influent Flow Rain CSO Lagoon Overflow Return Pump
MGD inches hours MGD MGD
LaPorte CSO Overflow Data
11/29/1998 5.67 0.00 0.00 0.5211/30/1998 6.18 0.17 1.56 0.00 0.0012/01/1998 5.23 0.00 0.00 0.0012/02/1998 5.93 0.00 0.00 0.4912/03/1998 6.21 0.00 0.00 0.5212/04/1998 5.53 0.01 0.00 0.00 0.0012/05/1998 5.65 0.00 0.00 0.3212/06/1998 7.52 1.27 9.60 0.02 0.8812/07/1998 8.51 0.02 0.00 0.03 2.0812/08/1998 8.21 0.01 0.00 0.00 2.5812/09/1998 8.06 0.00 0.00 2.4312/10/1998 7.31 0.00 0.00 1.2412/11/1998 6.94 0.00 0.00 1.2412/12/1998 5.58 0.00 0.00 0.6412/13/1998 4.89 0.00 0.00 0.0012/14/1998 5.15 0.00 0.00 0.1312/15/1998 4.45 0.00 0.00 0.0012/16/1998 4.42 0.13 0.00 0.00 0.0012/17/1998 4.91 0.00 0.00 0.9012/18/1998 3.86 0.00 0.00 0.4412/19/1998 4.64 0.38 2.83 0.00 0.0012/20/1998 3.68 0.06 0.00 0.00 0.6112/21/1998 4.99 0.16 0.00 0.00 0.7712/22/1998 3.31 0.01 0.00 0.00 0.0012/23/1998 3.79 0.00 0.00 0.3412/24/1998 3.83 0.00 0.00 0.5012/25/1998 2.84 0.00 0.00 0.0012/26/1998 3.03 0.00 0.00 0.0012/27/1998 3.10 0.00 0.00 0.0012/28/1998 4.78 0.00 0.00 1.4712/29/1998 5.71 0.18 0.00 0.00 2.3212/30/1998 3.55 0.11 0.00 0.00 0.2012/31/1998 3.36 0.03 0.00 0.00 0.0001/01/1999 3.09 0.25 0.00 0.00 0.0001/02/1999 3.35 0.54 0.00 0.00 0.0001/03/1999 3.09 0.13 0.00 0.00 0.0001/04/1999 3.37 0.00 0.00 0.0001/05/1999 3.33 0.06 0.00 0.00 0.0001/06/1999 4.63 0.14 0.00 0.00 0.9301/07/1999 4.86 0.00 0.00 1.0301/08/1999 4.55 0.04 0.00 0.00 0.9101/09/1999 4.57 0.31 0.00 0.00 1.0601/10/1999 4.49 0.06 0.00 0.00 1.0601/11/1999 3.97 0.21 0.00 0.00 0.3501/12/1999 3.82 0.06 0.00 0.00 0.0001/13/1999 4.13 0.00 0.00 0.0001/14/1999 4.15 0.00 0.00 0.0001/15/1999 4.00 0.01 0.00 0.00 0.0001/16/1999 4.44 0.00 0.00 0.0001/17/1999 5.45 0.76 5.66 0.00 0.0001/18/1999 6.78 0.01 3.71 0.00 0.7501/19/1999 5.07 0.19 0.00 0.00 1.0701/20/1999 4.91 0.00 0.00 1.0601/21/1999 6.15 0.74 1.46 0.00 1.0301/22/1999 8.87 0.53 12.45 1.71 0.4201/23/1999 8.25 0.18 9.70 0.90 0.38
Page 14

Plant Bypass to CSO Lagoon CSO Lagoon Date Influent Flow Rain CSO Lagoon Overflow Return Pump
MGD inches hours MGD MGD
LaPorte CSO Overflow Data
01/24/1999 5.42 0.00 0.24 1.1201/25/1999 5.41 0.05 0.00 0.00 1.1201/26/1999 5.25 0.00 0.00 1.1201/27/1999 5.87 0.00 0.00 1.1201/28/1999 5.18 0.00 0.00 1.1201/29/1999 5.09 0.00 0.00 1.1601/30/1999 4.82 0.00 0.00 1.2701/31/1999 4.47 0.00 0.00 1.2602/01/1999 4.60 0.06 0.00 0.00 1.2502/02/1999 5.97 0.24 2.01 0.00 1.1302/03/1999 4.58 0.00 0.00 1.1902/04/1999 4.21 0.00 0.00 0.7302/05/1999 4.47 0.00 0.00 0.8902/06/1999 3.39 0.00 0.00 0.1602/07/1999 5.45 0.22 4.25 0.00 0.6202/08/1999 5.61 0.13 0.00 1.1002/09/1999 3.91 0.00 0.00 0.4402/10/1999 3.86 0.00 0.00 0.5502/11/1999 5.09 0.32 3.88 0.00 0.5302/12/1999 4.68 0.10 0.00 0.00 1.2202/13/1999 4.45 0.05 0.00 0.00 1.2402/14/1999 4.12 0.00 0.00 1.1502/15/1999 4.02 0.00 0.00 0.7902/16/1999 4.97 0.36 1.21 0.00 0.6802/17/1999 3.76 0.00 0.00 0.5302/18/1999 3.75 0.00 0.00 0.5002/19/1999 4.02 0.00 0.00 0.7902/20/1999 3.22 0.04 0.00 0.00 0.1902/21/1999 4.05 0.00 0.00 1.0902/22/1999 3.16 0.00 0.00 0.0002/23/1999 3.91 0.13 0.00 0.00 0.7302/24/1999 3.80 0.00 0.00 0.5102/25/1999 4.14 0.28 0.00 0.00 0.3702/26/1999 3.47 0.05 0.46 0.00 0.0102/27/1999 4.61 0.12 0.83 0.00 0.8902/28/1999 3.76 0.00 0.00 0.3303/01/1999 3.81 0.00 0.00 0.5903/02/1999 5.28 0.32 2.65 0.00 0.6503/03/1999 4.39 0.06 0.00 0.00 0.8603/04/1999 3.97 0.00 0.00 0.5603/05/1999 4.64 0.56 1.05 0.00 0.8503/06/1999 4.83 0.11 0.00 0.00 0.5203/07/1999 4.37 0.00 0.00 0.8403/08/1999 4.77 0.31 0.00 0.00 1.0503/09/1999 4.07 0.19 0.00 0.00 0.0703/10/1999 5.10 0.00 0.00 0.7503/11/1999 4.65 0.00 0.00 0.3903/12/1999 4.88 0.00 0.00 0.5503/13/1999 4.65 0.00 0.00 1.0203/14/1999 3.68 0.00 0.00 0.2903/15/1999 4.10 0.00 0.09 0.2303/16/1999 4.83 0.00 0.00 0.0003/17/1999 4.75 0.00 0.00 0.1103/18/1999 5.09 0.00 0.00 1.2303/19/1999 3.53 0.00 0.00 0.1003/20/1999 3.29 0.00 0.00 0.00
Page 15

Plant Bypass to CSO Lagoon CSO Lagoon Date Influent Flow Rain CSO Lagoon Overflow Return Pump
MGD inches hours MGD MGD
LaPorte CSO Overflow Data
03/21/1999 4.02 0.00 0.00 0.8303/22/1999 3.44 0.36 0.00 0.1303/23/1999 4.70 0.00 0.00 1.1503/24/1999 3.74 0.00 0.00 0.1203/25/1999 3.91 0.00 0.00 0.4503/26/1999 4.21 0.00 0.00 0.9203/27/1999 3.23 0.00 0.00 0.0403/28/1999 3.30 0.00 0.00 0.1703/29/1999 4.54 0.00 0.00 1.2203/30/1999 3.70 0.00 0.00 0.3803/31/1999 3.78 0.00 0.00 0.4704/01/1999 3.84 0.04 0.00 0.00 0.5204/02/1999 4.07 0.00 0.00 0.7204/03/1999 3.64 0.11 0.00 0.00 0.0904/04/1999 5.41 0.32 3.76 0.00 1.3604/05/1999 5.04 0.01 0.00 0.00 1.9704/06/1999 4.27 0.11 0.85 0.00 0.6404/07/1999 3.35 0.26 0.00 0.00 0.2804/08/1999 3.83 0.33 1.01 0.00 0.1404/09/1999 7.32 0.21 6.20 0.00 1.6204/10/1999 5.72 0.02 1.75 0.00 1.9104/11/1999 5.75 0.76 0.00 1.7504/12/1999 5.42 0.00 0.00 2.2104/13/1999 5.35 0.00 0.00 2.1604/14/1999 3.95 0.00 0.00 0.7404/15/1999 5.51 0.85 7.35 0.00 0.3304/16/1999 7.48 0.16 2.51 0.00 1.7304/17/1999 5.56 0.06 0.00 0.00 2.2704/18/1999 5.04 0.12 1.01 0.00 1.2204/19/1999 4.78 0.00 0.00 1.0804/20/1999 4.45 0.13 0.56 0.00 0.1904/21/1999 5.20 0.09 0.66 0.00 0.9904/22/1999 5.94 2.11 5.81 0.03 0.6704/23/1999 8.75 0.57 7.35 6.36 1.0204/24/1999 6.37 0.00 0.00 2.0404/25/1999 4.96 0.00 0.00 1.2604/26/1999 5.80 0.00 0.00 1.7304/27/1999 6.67 0.33 4.18 0.00 1.6804/28/1999 7.40 0.14 4.51 0.00 1.6604/29/1999 6.15 0.00 0.00 2.0104/30/1999 5.88 0.00 0.00 1.9405/01/1999 5.67 0.00 0.00 1.8805/02/1999 5.47 0.00 0.00 1.8305/03/1999 5.79 0.00 0.00 1.9105/04/1999 5.76 0.00 0.00 1.8405/05/1999 4.99 0.01 0.00 0.00 1.0805/06/1999 5.68 0.28 2.25 0.00 0.8505/07/1999 5.89 0.00 0.00 2.0005/08/1999 4.88 0.02 0.00 0.00 1.2305/09/1999 3.42 0.00 0.00 0.0005/10/1999 4.27 0.00 0.00 0.4705/11/1999 4.34 0.01 0.00 0.00 0.5505/12/1999 5.33 0.00 0.00 1.5205/13/1999 5.46 0.02 0.00 0.00 1.5805/14/1999 4.08 0.00 0.00 0.3605/15/1999 4.38 0.00 0.00 0.79
Page 16

Plant Bypass to CSO Lagoon CSO Lagoon Date Influent Flow Rain CSO Lagoon Overflow Return Pump
MGD inches hours MGD MGD
LaPorte CSO Overflow Data
05/16/1999 3.61 0.00 0.00 0.1305/17/1999 5.73 0.26 2.45 0.00 1.1605/18/1999 5.51 0.06 0.00 0.00 1.7905/19/1999 5.45 0.00 0.00 1.7205/20/1999 5.23 0.00 0.00 1.4405/21/1999 4.64 0.00 0.00 0.9405/22/1999 4.59 0.11 0.00 0.00 0.9305/23/1999 5.73 0.70 6.76 0.00 0.4705/24/1999 5.33 0.06 0.00 0.00 1.4805/25/1999 5.87 0.00 0.00 2.2705/26/1999 5.74 0.00 0.00 2.0605/27/1999 3.72 0.00 0.00 0.0005/28/1999 4.78 0.00 0.00 1.2105/29/1999 4.03 0.00 0.00 0.7405/30/1999 4.09 0.10 0.00 0.00 0.6505/31/1999 4.51 0.11 0.00 0.00 0.9206/01/1999 4.80 0.32 0.00 0.00 0.9306/02/1999 6.45 0.21 3.16 0.00 1.6306/03/1999 5.71 0.00 0.00 2.0906/04/1999 4.62 0.00 0.00 1.1206/05/1999 3.92 0.00 0.00 0.6206/06/1999 4.23 0.00 0.00 1.0306/07/1999 4.04 0.00 0.00 0.5206/08/1999 3.80 0.00 0.00 0.2806/09/1999 4.83 0.00 0.00 1.2506/10/1999 3.96 0.00 0.00 0.2706/11/1999 4.47 0.04 0.00 0.00 0.9006/12/1999 5.64 0.95 3.96 0.00 0.7306/13/1999 4.77 0.34 1.75 0.00 0.8706/14/1999 5.39 0.00 0.00 1.8406/15/1999 5.62 0.00 0.00 2.2306/16/1999 5.67 0.00 0.00 2.1706/17/1999 4.78 0.00 0.00 1.2406/18/1999 3.85 0.00 0.00 0.4806/19/1999 3.90 0.00 0.00 0.7706/20/1999 3.50 0.00 0.00 0.6306/21/1999 4.47 0.00 0.00 1.3106/22/1999 4.14 0.00 0.00 0.8806/23/1999 3.36 0.00 0.00 0.0306/24/1999 5.41 0.23 2.86 0.00 0.9906/25/1999 5.55 0.00 0.00 2.0706/26/1999 5.24 0.44 2.41 0.00 1.4106/27/1999 6.95 0.85 5.33 0.00 1.5606/28/1999 5.79 0.14 0.61 0.00 1.9806/29/1999 5.60 0.00 0.00 2.1806/30/1999 5.70 0.00 0.00 2.2807/01/1999 7.92 1.99 7.58 2.78 1.3107/02/1999 6.04 0.12 0.00 2.2807/03/1999 5.67 0.00 0.00 2.1907/04/1999 5.18 0.00 0.00 1.8807/05/1999 5.24 0.00 0.00 1.8607/06/1999 5.59 0.00 0.00 2.0807/07/1999 5.48 0.00 0.00 2.0607/08/1999 4.33 0.00 0.00 0.9307/09/1999 4.39 0.00 0.00 0.8607/10/1999 3.37 0.00 0.00 0.29
Page 17

Plant Bypass to CSO Lagoon CSO Lagoon Date Influent Flow Rain CSO Lagoon Overflow Return Pump
MGD inches hours MGD MGD
LaPorte CSO Overflow Data
07/11/1999 2.96 0.00 0.00 0.0007/12/1999 3.60 0.00 0.00 0.2707/13/1999 4.22 0.00 0.00 0.9207/14/1999 5.06 0.00 0.00 1.6907/15/1999 3.67 0.00 0.00 0.1807/16/1999 3.57 0.00 0.00 0.2307/17/1999 4.53 0.15 1.06 0.00 0.9007/18/1999 3.54 0.00 0.00 0.5507/19/1999 3.71 0.00 0.00 0.4707/20/1999 4.42 0.20 1.55 0.00 0.6507/21/1999 4.65 0.03 0.00 0.00 1.2407/22/1999 4.19 0.00 0.00 0.8207/23/1999 6.25 0.57 3.66 0.00 1.3807/24/1999 4.88 0.00 0.00 1.6707/25/1999 4.08 0.00 0.00 1.0907/26/1999 4.38 0.00 0.00 1.1507/27/1999 4.41 0.05 0.00 0.00 1.0307/28/1999 5.45 0.31 2.18 0.00 0.8707/29/1999 4.78 0.00 0.00 1.2107/30/1999 3.81 0.00 0.00 0.5007/31/1999 4.34 0.92 3.33 0.00 0.2608/01/1999 5.22 0.00 0.00 1.9608/02/1999 5.26 0.10 0.00 2.0908/03/1999 3.88 0.00 0.00 0.7608/04/1999 4.24 0.00 0.00 0.9908/05/1999 4.65 0.00 0.00 1.5208/06/1999 4.36 0.00 0.00 1.3008/07/1999 4.19 0.30 1.53 0.00 0.5508/08/1999 3.73 0.00 0.00 0.4408/09/1999 3.78 0.05 0.00 0.00 0.5608/10/1999 3.59 0.11 0.00 0.00 0.0308/11/1999 4.49 0.00 0.00 1.3408/12/1999 4.61 0.27 1.65 0.00 0.3808/13/1999 6.57 1.10 5.50 0.00 1.1108/14/1999 4.83 0.00 0.00 1.7208/15/1999 4.47 0.00 0.00 1.5908/16/1999 4.58 0.00 0.00 1.4308/17/1999 3.81 0.00 0.00 0.5908/18/1999 3.63 0.03 0.00 0.00 0.3608/19/1999 6.35 0.80 5.03 0.00 1.0908/20/1999 4.79 0.00 0.00 1.6408/21/1999 4.57 0.00 0.00 1.6008/22/1999 4.30 0.00 0.00 1.4108/23/1999 4.41 0.06 0.00 0.00 0.9308/24/1999 6.41 1.04 8.68 0.00 0.4508/25/1999 6.02 0.06 1.85 0.00 1.7808/26/1999 5.56 0.09 0.00 0.00 2.1008/27/1999 5.23 0.00 0.00 2.0308/28/1999 4.86 0.00 0.00 1.8208/29/1999 2.89 0.00 0.00 0.0008/30/1999 3.78 0.00 0.00 0.7308/31/1999 3.42 0.00 0.00 0.3509/01/1999 3.61 0.00 0.00 0.5109/02/1999 3.65 0.00 0.00 0.4509/03/1999 3.39 0.00 0.00 0.2809/04/1999 3.32 0.00 0.00 0.46
Page 18

Plant Bypass to CSO Lagoon CSO Lagoon Date Influent Flow Rain CSO Lagoon Overflow Return Pump
MGD inches hours MGD MGD
LaPorte CSO Overflow Data
09/05/1999 3.05 0.00 0.00 0.3609/06/1999 3.40 0.00 0.00 0.5809/07/1999 3.40 0.00 0.00 0.4209/08/1999 3.13 0.00 0.00 0.1309/09/1999 3.36 0.00 0.00 0.2309/10/1999 3.45 0.00 0.00 0.4909/11/1999 3.26 0.00 0.00 0.5809/12/1999 3.60 0.14 0.00 0.00 0.5509/13/1999 3.34 0.00 0.00 0.2809/14/1999 3.40 0.00 0.00 0.4309/15/1999 3.97 0.00 0.00 1.0909/16/1999 3.59 0.00 0.00 0.5409/17/1999 2.98 0.00 0.00 0.0709/18/1999 3.14 0.00 0.00 0.3509/19/1999 3.19 0.00 0.00 0.4009/20/1999 3.24 0.02 0.00 0.00 0.2609/21/1999 3.14 0.00 0.00 0.2509/22/1999 3.26 0.00 0.00 0.4409/23/1999 3.08 0.00 0.00 0.1209/24/1999 3.76 0.00 0.00 0.8909/25/1999 2.83 0.00 0.00 0.0909/26/1999 3.14 0.00 0.00 0.4609/27/1999 3.09 0.02 0.00 0.00 0.1809/28/1999 4.54 0.59 2.70 0.00 0.8409/29/1999 6.15 0.22 2.11 0.00 1.7109/30/1999 4.86 0.00 0.00 1.9610/01/1999 3.10 0.00 0.00 0.2910/02/1999 3.15 0.04 0.00 0.00 0.4310/03/1999 5.06 0.80 7.00 0.00 0.3510/04/1999 5.39 0.01 0.00 0.00 2.2510/05/1999 4.93 0.01 0.00 0.00 2.2610/06/1999 4.03 0.00 0.00 1.4310/07/1999 3.25 0.00 0.00 0.3010/08/1999 3.40 0.06 0.00 0.00 0.4510/09/1999 3.71 0.01 0.00 0.00 1.0610/10/1999 3.02 0.00 0.00 0.3710/11/1999 3.11 0.00 0.00 0.4610/12/1999 2.98 0.00 0.00 0.2110/13/1999 3.38 0.06 0.00 0.00 0.0710/14/1999 2.84 0.00 0.00 0.0010/15/1999 2.72 0.00 0.00 0.0010/16/1999 2.68 0.01 0.00 0.00 0.0010/17/1999 2.55 0.01 0.00 0.00 0.0010/18/1999 2.70 0.01 0.00 0.00 0.0010/19/1999 2.72 0.03 0.00 0.00 0.0010/20/1999 2.76 0.00 0.00 0.0010/21/1999 2.86 0.00 0.00 0.0010/22/1999 2.74 0.01 0.00 0.00 0.0010/23/1999 3.23 0.12 0.00 0.00 0.0010/24/1999 2.96 0.05 0.00 0.00 0.0010/25/1999 2.78 0.00 0.00 0.0010/26/1999 2.72 0.00 0.00 0.0010/27/1999 2.73 0.00 0.00 0.0010/28/1999 2.73 0.00 0.00 0.0010/29/1999 2.72 0.00 0.00 0.0010/30/1999 2.55 0.00 0.00 0.00
Page 19

Plant Bypass to CSO Lagoon CSO Lagoon Date Influent Flow Rain CSO Lagoon Overflow Return Pump
MGD inches hours MGD MGD
LaPorte CSO Overflow Data
10/31/1999 2.50 0.00 0.00 0.0011/01/1999 3.80 0.78 3.88 0.00 0.0011/02/1999 4.46 0.16 0.00 0.00 0.9811/03/1999 2.87 0.01 0.00 0.00 0.2011/04/1999 2.72 0.00 0.00 0.0011/05/1999 2.58 0.00 0.00 0.0011/06/1999 2.47 0.00 0.00 0.0011/07/1999 2.44 0.00 0.00 0.0011/08/1999 2.66 0.00 0.00 0.0011/09/1999 2.68 0.00 0.00 0.0011/10/1999 2.67 0.00 0.00 0.0011/11/1999 2.73 0.00 0.00 0.0011/12/1999 2.64 0.00 0.00 0.0011/13/1999 2.52 0.00 0.00 0.0011/14/1999 2.46 0.00 0.00 0.0011/15/1999 2.63 0.00 0.00 0.0111/16/1999 3.69 0.00 0.00 1.1611/17/1999 4.49 0.00 0.00 1.9111/18/1999 4.56 0.00 0.00 1.8411/19/1999 5.92 0.28 3.11 0.00 2.1311/20/1999 4.01 0.00 0.00 1.5411/21/1999 2.74 0.00 0.00 0.3411/22/1999 3.84 0.05 0.00 0.00 1.2111/23/1999 4.18 0.47 2.45 0.00 0.1411/24/1999 4.21 0.00 0.00 1.4611/25/1999 3.34 0.00 0.00 0.8711/26/1999 3.63 0.00 0.00 1.2511/27/1999 2.85 0.02 0.00 0.00 0.3811/28/1999 2.82 0.00 0.00 0.3311/29/1999 2.93 0.01 0.00 0.00 0.3111/30/1999 3.11 0.00 0.00 0.5012/01/1999 2.61 0.00 0.00 0.0012/02/1999 2.75 0.00 0.00 0.0012/03/1999 5.36 0.37 2.86 0.00 0.8812/04/1999 3.62 0.08 0.00 0.00 0.5212/05/1999 7.00 1.05 8.53 0.00 0.8512/06/1999 5.07 0.00 0.00 2.3912/07/1999 5.04 0.00 0.00 2.4712/08/1999 4.37 0.00 0.00 1.7112/09/1999 3.45 0.13 0.00 0.00 0.3512/10/1999 3.08 0.00 0.00 0.3012/11/1999 3.57 0.00 0.00 1.1112/12/1999 2.94 0.09 0.00 0.00 0.3412/13/1999 3.04 0.00 0.00 0.3012/14/1999 7.25 1.08 6.81 0.00 1.0512/15/1999 7.18 0.35 2.73 0.00 1.7812/16/1999 5.50 0.03 0.00 0.00 2.3512/17/1999 3.15 0.04 0.00 0.00 0.9412/18/1999 3.52 0.00 0.00 0.8512/19/1999 3.06 0.02 0.00 0.00 0.3912/20/1999 3.18 0.04 0.00 0.00 0.3212/21/1999 3.59 0.00 0.00 0.9012/22/1999 3.11 0.03 0.00 0.00 0.3812/23/1999 2.80 0.08 0.00 0.00 0.0012/24/1999 2.79 0.07 0.00 0.00 0.3012/25/1999 2.96 0.00 0.00 0.69
Page 20

Plant Bypass to CSO Lagoon CSO Lagoon Date Influent Flow Rain CSO Lagoon Overflow Return Pump
MGD inches hours MGD MGD
LaPorte CSO Overflow Data
12/26/1999 4.14 0.00 0.00 1.7312/27/1999 3.14 0.22 0.00 0.00 0.5212/28/1999 2.61 0.11 0.00 0.00 0.0012/29/1999 3.11 0.00 0.00 0.0012/30/1999 3.17 0.00 0.00 0.0012/31/1999 2.61 0.00 0.00 0.0001/01/2000 2.42 0.00 0.00 0.0001/02/2000 2.80 0.23 0.00 0.00 0.0001/03/2000 3.99 0.07 1.13 0.00 0.7501/04/2000 3.54 0.22 0.00 0.00 0.5501/05/2000 2.70 0.01 0.00 0.00 0.0001/06/2000 3.23 0.00 0.00 0.2501/07/2000 3.25 0.00 0.00 0.4301/08/2000 3.76 0.03 0.00 0.00 0.9801/09/2000 5.56 0.38 2.23 0.00 1.3601/10/2000 4.12 0.10 0.00 0.00 0.7101/11/2000 2.90 0.00 0.00 0.1701/12/2000 2.76 0.00 0.00 0.0901/13/2000 3.87 0.05 0.00 0.00 1.0401/14/2000 2.77 0.06 0.00 0.00 0.0801/15/2000 3.65 0.00 0.00 1.0001/16/2000 2.63 0.00 0.00 0.1301/17/2000 3.16 0.15 0.00 0.00 0.4401/18/2000 2.98 0.00 0.00 0.2501/19/2000 2.65 0.18 0.00 0.00 0.0001/20/2000 3.32 0.25 0.00 0.00 0.4001/21/2000 3.00 0.07 0.00 0.00 0.2501/22/2000 3.63 0.13 0.00 0.00 1.0601/23/2000 3.42 0.00 0.00 0.7801/24/2000 2.91 0.02 0.00 0.00 0.2401/25/2000 2.67 0.31 0.00 0.00 0.0001/26/2000 2.80 0.16 0.00 0.00 0.0001/27/2000 3.23 0.00 0.00 0.3801/28/2000 2.87 0.00 0.00 0.1801/29/2000 3.64 0.11 0.00 0.00 1.0301/30/2000 3.32 0.18 0.00 0.00 0.7201/31/2000 2.92 0.00 0.00 0.1502/01/2000 2.71 0.01 0.00 0.00 0.0002/02/2000 2.68 0.00 0.00 0.0002/03/2000 3.03 0.15 0.00 0.00 0.0002/04/2000 3.18 0.14 0.00 0.00 0.2602/05/2000 3.11 0.00 0.00 0.5102/06/2000 3.09 0.00 0.00 0.5402/07/2000 3.49 0.00 0.00 0.6002/08/2000 2.76 0.00 0.00 0.0002/09/2000 3.27 0.00 0.00 0.0002/10/2000 3.39 0.04 0.00 0.00 0.1002/11/2000 3.46 0.00 0.00 0.6502/12/2000 3.07 0.00 0.00 0.4702/13/2000 2.91 0.05 0.00 0.00 0.4002/14/2000 3.13 0.05 0.00 0.00 0.4402/15/2000 2.91 0.00 0.00 0.2102/16/2000 2.96 0.00 0.00 0.2302/17/2000 3.21 0.00 0.00 0.4502/18/2000 3.04 0.37 0.00 0.00 0.3402/19/2000 3.28 0.00 0.00 0.58
Page 21

Plant Bypass to CSO Lagoon CSO Lagoon Date Influent Flow Rain CSO Lagoon Overflow Return Pump
MGD inches hours MGD MGD
LaPorte CSO Overflow Data
02/20/2000 3.22 0.00 0.00 0.3002/21/2000 4.59 0.00 0.00 0.8302/22/2000 4.82 0.00 0.00 0.3102/23/2000 3.30 0.00 0.00 0.0002/24/2000 6.22 0.42 5.78 0.00 0.9102/25/2000 4.11 0.00 0.00 1.0302/26/2000 5.78 0.63 5.85 0.00 0.7202/27/2000 5.38 0.05 0.00 2.0502/28/2000 3.24 0.00 0.00 0.3702/29/2000 2.74 0.00 0.00 0.0003/01/2000 2.89 0.06 0.00 0.00 0.0103/02/2000 3.43 0.00 0.00 0.6603/03/2000 2.88 0.00 0.00 0.2503/04/2000 2.72 0.00 0.00 0.1803/05/2000 3.21 0.00 0.00 0.7103/06/2000 2.92 0.00 0.00 0.2303/07/2000 3.07 0.00 0.00 0.3803/08/2000 3.55 0.00 0.00 0.8603/09/2000 2.79 0.00 0.00 0.0203/10/2000 2.81 0.01 0.00 0.00 0.2103/11/2000 2.83 0.00 0.00 0.3003/12/2000 2.86 0.00 0.00 0.3703/13/2000 3.13 0.10 0.00 0.00 0.2903/14/2000 3.33 0.11 0.00 0.00 0.5503/15/2000 5.37 0.56 5.75 0.00 0.3503/16/2000 5.73 0.09 0.00 0.00 2.1503/17/2000 4.43 0.00 0.00 1.7103/18/2000 2.71 0.00 0.00 0.2203/19/2000 5.01 0.30 2.53 0.00 1.3603/20/2000 5.21 0.31 1.41 0.00 0.1803/21/2000 2.88 0.00 0.00 0.0903/22/2000 3.69 0.00 0.00 0.9803/23/2000 3.13 0.00 0.00 0.2703/24/2000 3.28 0.04 0.00 0.00 0.4003/25/2000 2.95 0.00 0.00 0.3403/26/2000 2.71 0.00 0.00 0.1703/27/2000 3.05 0.02 0.00 0.00 0.2403/28/2000 3.58 0.17 0.91 0.00 0.0003/29/2000 2.66 0.00 0.00 0.0003/30/2000 3.03 0.00 0.00 0.2803/31/2000 3.69 0.00 0.00 1.0604/01/2000 3.03 0.02 0.00 0.00 0.5104/02/2000 3.01 0.14 0.00 0.00 0.1604/03/2000 3.02 0.00 0.00 0.4204/04/2000 2.91 0.00 0.00 0.2604/05/2000 2.66 0.00 0.00 0.0004/06/2000 3.18 0.00 0.00 0.4204/07/2000 5.63 0.85 5.08 0.00 1.0504/08/2000 6.73 0.15 0.00 0.00 2.1704/09/2000 4.87 0.00 0.00 2.3304/10/2000 3.35 0.03 0.00 0.00 0.6504/11/2000 2.83 0.02 0.00 0.00 0.0004/12/2000 2.65 0.00 0.00 0.0004/13/2000 3.59 0.00 0.00 0.8504/14/2000 3.30 0.00 0.00 0.6304/15/2000 2.95 0.00 0.00 0.36
Page 22

Plant Bypass to CSO Lagoon CSO Lagoon Date Influent Flow Rain CSO Lagoon Overflow Return Pump
MGD inches hours MGD MGD
LaPorte CSO Overflow Data
04/16/2000 2.80 0.10 0.00 0.00 0.2504/17/2000 4.73 0.13 1.80 0.00 0.9104/18/2000 3.56 0.00 0.00 0.8304/19/2000 4.86 0.66 4.18 0.00 0.5004/20/2000 8.55 1.24 12.08 0.43 0.8804/21/2000 6.31 0.17 1.56 0.13 2.2104/22/2000 5.21 0.00 0.00 2.5404/23/2000 5.61 0.15 0.55 0.00 2.4004/24/2000 5.35 0.00 0.00 2.4104/25/2000 4.96 0.00 0.00 2.3004/26/2000 3.55 0.00 0.00 0.9404/27/2000 3.25 0.00 0.00 0.4504/28/2000 2.99 0.00 0.00 0.3904/29/2000 2.75 0.00 0.00 0.2904/30/2000 2.76 0.00 0.00 0.3505/01/2000 5.19 0.42 4.26 1.0805/02/2000 3.90 0.00 0.00 1.2605/03/2000 2.62 0.00 0.00 0.0005/04/2000 2.82 0.00 0.00 0.0005/05/2000 2.71 0.00 0.00 0.0005/06/2000 3.75 0.00 0.00 1.1905/07/2000 3.22 0.02 0.00 0.00 0.6705/08/2000 3.24 0.00 0.00 0.4105/09/2000 6.05 0.98 4.66 0.00 1.1805/10/2000 5.00 0.01 0.00 0.00 2.1505/11/2000 5.71 0.27 3.15 0.00 1.6505/12/2000 4.40 0.06 0.00 0.00 1.5405/13/2000 2.97 0.00 0.00 0.2605/14/2000 2.72 0.00 0.00 0.2105/15/2000 2.79 0.00 0.00 0.1205/16/2000 4.29 0.18 0.70 0.00 0.8105/17/2000 3.02 0.00 0.00 0.2905/18/2000 5.23 0.81 5.00 0.00 0.3705/19/2000 5.21 0.06 0.00 0.00 2.3605/20/2000 4.53 0.03 0.00 0.00 2.0905/21/2000 4.09 0.00 0.00 1.5605/22/2000 4.10 0.04 0.00 0.00 1.3505/23/2000 3.27 0.00 0.00 0.5505/24/2000 2.74 0.00 0.00 0.0005/25/2000 2.87 0.00 0.00 0.0405/26/2000 3.18 0.09 0.00 0.00 0.4005/27/2000 2.81 0.30 0.00 0.00 0.2905/28/2000 6.36 0.83 5.15 0.00 1.5705/29/2000 4.80 0.00 0.00 2.3505/30/2000 4.83 0.02 0.00 0.00 2.1305/31/2000 5.62 0.30 1.65 0.00 1.9606/01/2000 5.10 0.00 0.00 2.2306/02/2000 3.42 0.00 0.00 0.2506/03/2000 2.84 0.00 0.00 0.3606/04/2000 2.95 0.05 0.00 0.00 0.5306/05/2000 6.95 1.22 8.73 0.00 0.9306/06/2000 5.06 0.00 0.00 2.3706/07/2000 4.98 0.01 0.00 0.00 2.2806/08/2000 5.02 0.00 0.00 2.2006/09/2000 3.56 0.00 0.00 0.8506/10/2000 2.87 0.00 0.00 0.22
Page 23

Plant Bypass to CSO Lagoon CSO Lagoon Date Influent Flow Rain CSO Lagoon Overflow Return Pump
MGD inches hours MGD MGD
LaPorte CSO Overflow Data
06/11/2000 3.56 0.31 1.70 0.00 0.2706/12/2000 6.27 0.83 4.01 0.00 1.4806/13/2000 6.84 1.12 6.01 0.00 1.8506/14/2000 6.15 0.25 2.11 0.00 2.3006/15/2000 5.11 0.00 0.00 2.1206/16/2000 4.74 0.00 0.00 1.9406/17/2000 4.78 0.00 0.00 2.2306/18/2000 4.48 0.00 0.00 2.0106/19/2000 3.40 0.00 0.00 0.6306/20/2000 4.39 1.06 2.50 0.00 0.4406/21/2000 6.28 0.16 3.16 0.00 2.0706/22/2000 5.39 0.00 0.00 2.4506/23/2000 5.05 0.00 0.00 2.3206/24/2000 6.24 2.07 5.43 0.19 1.7406/25/2000 6.10 0.06 2.46 3.19 1.9006/26/2000 5.85 0.40 2.51 0.44 1.8906/27/2000 4.76 0.00 0.16 1.8606/28/2000 5.29 0.10 0.00 0.00 2.3006/29/2000 5.28 0.00 0.00 2.1906/30/2000 5.05 0.00 0.00 2.2207/01/2000 4.89 0.00 0.00 2.2707/02/2000 4.85 0.00 0.00 2.2607/03/2000 6.93 1.02 5.41 0.00 1.7307/04/2000 5.03 0.00 0.00 2.4607/05/2000 5.98 0.57 2.48 0.00 1.9707/06/2000 6.25 0.24 1.33 0.00 2.3807/07/2000 5.21 0.00 0.00 2.4607/08/2000 4.90 0.00 0.00 2.2107/09/2000 4.83 0.16 1.05 0.00 1.6907/10/2000 6.73 0.63 6.81 0.00 1.2707/11/2000 4.94 0.00 0.00 1.9707/12/2000 5.07 0.00 0.00 2.1807/13/2000 4.60 0.00 0.00 1.6307/14/2000 5.87 0.72 3.08 0.00 1.5407/15/2000 5.05 0.00 0.00 2.3507/16/2000 4.79 0.00 0.00 2.1807/17/2000 4.73 0.00 0.00 1.7907/18/2000 3.66 0.00 0.00 0.7807/19/2000 2.92 0.00 0.00 0.1807/20/2000 2.88 0.00 0.00 0.0007/21/2000 2.63 0.00 0.00 0.0007/22/2000 2.46 0.00 0.00 0.0007/23/2000 2.45 0.00 0.00 0.0007/24/2000 2.73 0.00 0.00 0.0507/25/2000 3.22 0.00 0.00 0.5007/26/2000 3.84 0.00 0.00 0.5007/27/2000 4.56 0.00 0.00 2.2807/28/2000 4.19 0.26 1.78 0.00 0.7307/29/2000 3.58 0.10 0.00 0.00 0.9107/30/2000 3.48 0.11 0.00 0.00 0.5507/31/2000 2.93 0.10 0.00 0.00 0.5508/01/2000 5.46 0.26 1.85 0.00 1.3108/02/2000 4.08 0.22 1.06 0.00 0.6608/03/2000 2.64 0.00 0.00 0.0008/04/2000 3.47 0.00 0.00 0.7108/05/2000 3.12 0.10 0.00 0.00 0.30
Page 24

Plant Bypass to CSO Lagoon CSO Lagoon Date Influent Flow Rain CSO Lagoon Overflow Return Pump
MGD inches hours MGD MGD
LaPorte CSO Overflow Data
08/06/2000 4.43 1.03 3.28 0.00 0.6408/07/2000 4.81 0.00 0.00 1.8008/08/2000 4.47 0.00 0.00 1.5808/09/2000 5.10 0.00 0.00 2.1508/10/2000 5.17 0.00 0.00 2.1908/11/2000 3.49 0.00 0.00 0.6108/12/2000 2.83 0.00 0.00 0.2008/13/2000 2.98 0.00 0.00 0.3608/14/2000 3.18 0.00 0.00 0.3508/15/2000 2.88 0.00 0.00 0.1008/16/2000 3.08 0.00 0.00 0.1908/17/2000 6.05 0.76 3.75 0.00 1.6408/18/2000 5.34 0.01 0.00 0.00 2.6808/19/2000 3.95 0.00 0.00 1.4808/20/2000 3.13 0.00 0.00 0.7108/21/2000 3.01 0.00 0.00 0.3808/22/2000 3.10 0.01 0.00 0.00 0.3808/23/2000 3.97 0.03 0.00 0.00 1.1008/24/2000 3.28 0.00 0.00 0.4508/25/2000 2.96 0.00 0.00 0.3908/26/2000 2.83 0.00 0.00 0.3508/27/2000 2.85 0.00 0.00 0.3908/28/2000 3.10 0.00 0.00 0.3808/29/2000 3.15 0.00 0.00 0.3908/30/2000 3.03 0.00 0.00 0.2508/31/2000 3.09 0.00 0.00 0.2009/01/2000 3.05 0.00 0.00 0.3709/02/2000 2.88 0.00 0.00 0.4209/03/2000 2.82 0.00 0.00 0.4409/04/2000 2.83 0.00 0.00 0.4009/05/2000 2.79 0.00 0.00 0.2309/06/2000 3.09 0.00 0.00 0.5109/07/2000 2.91 0.00 0.00 0.1609/08/2000 3.54 0.00 0.00 0.9109/09/2000 2.93 0.00 0.00 0.3409/10/2000 2.91 0.01 0.00 0.00 0.3709/11/2000 4.85 2.35 4.21 0.00 0.6009/12/2000 7.44 1.00 5.26 5.73 2.0009/13/2000 5.45 0.00 0.00 2.7009/14/2000 5.96 0.13 0.00 0.00 2.7009/15/2000 6.16 0.24 1.35 0.00 2.5209/16/2000 5.13 0.00 0.00 2.6309/17/2000 4.51 0.00 0.00 1.9909/18/2000 2.96 0.00 0.00 0.3009/19/2000 2.70 0.00 0.00 0.0009/20/2000 4.15 0.39 4.01 0.00 0.0109/21/2000 3.21 0.00 0.00 0.3909/22/2000 3.00 0.20 0.00 0.00 0.3609/23/2000 5.12 0.20 0.71 0.00 1.6209/24/2000 3.41 0.20 0.00 0.00 0.1709/25/2000 3.04 0.00 0.00 0.3709/26/2000 3.05 0.00 0.00 0.3809/27/2000 2.91 0.00 0.00 0.2509/28/2000 2.97 0.00 0.00 0.2309/29/2000 2.92 0.00 0.00 0.3509/30/2000 3.02 0.00 0.00 0.54
Page 25

Plant Bypass to CSO Lagoon CSO Lagoon Date Influent Flow Rain CSO Lagoon Overflow Return Pump
MGD inches hours MGD MGD
LaPorte CSO Overflow Data
10/01/2000 2.90 0.00 0.00 0.4510/02/2000 2.95 0.00 0.00 0.3210/03/2000 3.16 0.24 0.71 0.00 0.2910/04/2000 6.76 0.84 4.73 0.00 1.7010/05/2000 5.61 0.20 0.00 0.00 2.4010/06/2000 5.18 0.09 0.00 0.00 2.4510/07/2000 3.20 0.09 0.00 0.00 0.7310/08/2000 6.31 0.57 6.91 0.00 0.7010/09/2000 5.25 0.00 0.00 2.3610/10/2000 3.97 0.00 0.00 1.4310/11/2000 3.06 0.00 0.00 0.4410/12/2000 3.46 0.00 0.00 0.5710/13/2000 2.72 0.00 0.00 0.0910/14/2000 2.88 0.05 0.00 0.00 0.2810/15/2000 2.87 0.04 0.00 0.00 0.4110/16/2000 3.19 0.02 0.00 0.00 0.5010/17/2000 3.48 0.00 0.00 0.9010/18/2000 2.88 0.00 0.00 0.2910/19/2000 2.74 0.00 0.00 0.0010/20/2000 2.89 0.00 0.00 0.2710/21/2000 2.90 0.00 0.00 0.4310/22/2000 2.91 0.00 0.00 0.4610/23/2000 3.03 0.03 0.00 0.00 0.3610/24/2000 5.63 0.51 2.56 0.00 1.5910/25/2000 4.85 0.01 0.00 0.00 2.2710/26/2000 3.74 0.01 0.00 0.00 1.0310/27/2000 2.92 0.08 0.00 0.00 0.0110/28/2000 2.72 0.00 0.00 0.3210/29/2000 2.74 0.00 0.00 0.4110/30/2000 2.91 0.00 0.00 0.2910/31/2000 2.69 0.00 0.00 0.0011/01/2000 2.66 0.00 0.00 0.0011/02/2000 2.71 0.00 0.00 0.0011/03/2000 2.97 0.00 0.00 0.3711/04/2000 2.82 0.00 0.00 0.3411/05/2000 2.84 0.00 0.00 0.2911/06/2000 4.08 0.32 0.23 0.00 0.7811/07/2000 3.52 1.06 0.00 0.1611/08/2000 2.85 0.05 0.00 0.00 0.3211/09/2000 6.12 1.36 6.48 0.00 0.3911/10/2000 5.29 0.02 0.00 0.00 2.3711/11/2000 4.80 0.00 0.00 2.3611/12/2000 3.49 0.07 0.00 0.00 1.0711/13/2000 4.97 0.34 1.85 0.00 0.0011/14/2000 3.92 0.00 0.00 1.3411/15/2000 3.30 0.00 0.00 0.6911/16/2000 2.58 0.00 0.00 0.0011/17/2000 2.98 0.04 0.00 0.00 0.2711/18/2000 3.10 0.00 0.00 0.5511/19/2000 2.97 0.06 0.00 0.00 0.3911/20/2000 3.43 0.19 0.00 0.00 0.8911/21/2000 2.94 0.01 0.00 0.00 0.2511/22/2000 2.62 0.00 0.00 0.0011/23/2000 2.33 0.00 0.00 0.0011/24/2000 2.69 0.00 0.00 0.3111/25/2000 3.36 0.16 0.00 0.00 0.37
Page 26

Plant Bypass to CSO Lagoon CSO Lagoon Date Influent Flow Rain CSO Lagoon Overflow Return Pump
MGD inches hours MGD MGD
LaPorte CSO Overflow Data
11/26/2000 4.10 0.29 0.00 0.00 0.0011/27/2000 2.85 0.01 0.00 0.00 0.0811/28/2000 2.95 0.00 0.00 0.3011/29/2000 5.02 0.27 2.35 0.00 0.2611/30/2000 4.86 0.31 1.06 0.00 0.5312/01/2000 2.89 0.03 0.00 0.00 0.2312/02/2000 2.93 0.00 0.00 0.4412/03/2000 3.01 0.00 0.00 0.6112/04/2000 3.23 0.50 0.00 0.5612/05/2000 2.82 0.01 0.00 0.00 0.3212/06/2000 2.74 0.05 0.00 0.00 0.3312/07/2000 2.96 0.30 0.00 0.00 0.3912/08/2000 2.97 0.00 0.00 0.3512/09/2000 2.73 0.00 0.00 0.3012/10/2000 2.82 0.00 0.00 0.4112/11/2000 2.81 0.66 0.00 0.00 0.3612/12/2000 2.54 0.13 0.00 0.00 0.0412/13/2000 3.34 0.26 0.00 0.00 0.8512/14/2000 3.36 0.01 0.00 0.00 0.6912/15/2000 2.95 0.03 0.00 0.00 0.3212/16/2000 3.65 0.03 0.00 0.00 0.3712/17/2000 3.05 0.02 0.00 0.00 0.4012/18/2000 3.35 0.16 0.00 0.00 0.8112/19/2000 2.91 0.51 0.00 0.00 0.2912/20/2000 2.89 0.01 0.00 0.00 0.3212/21/2000 2.94 0.09 0.00 0.00 0.3012/22/2000 3.16 0.00 0.00 0.7912/23/2000 2.99 0.01 0.00 0.00 0.4012/24/2000 2.57 0.09 0.00 0.00 0.3412/25/2000 2.16 0.01 0.00 0.00 0.3412/26/2000 2.95 0.03 0.00 0.00 0.4012/27/2000 2.97 0.03 0.00 0.00 0.4412/28/2000 2.67 0.00 0.00 0.3012/29/2000 2.67 0.13 0.00 0.00 0.3012/30/2000 3.74 0.06 0.00 0.00 0.3012/31/2000 2.97 0.19 0.00 0.00 0.7301/01/2001 2.78 0.01 0.00 0.00 0.3801/02/2001 2.83 0.01 0.00 0.00 0.4501/03/2001 3.05 0.06 0.00 0.00 0.4501/04/2001 3.08 0.00 0.00 0.4601/05/2001 3.14 0.00 0.00 0.2701/06/2001 3.11 0.00 0.00 0.4201/07/2001 2.85 0.02 0.00 0.00 0.3301/08/2001 2.95 0.14 0.00 0.00 0.3501/09/2001 2.99 0.00 0.00 0.3601/10/2001 3.01 0.00 0.00 0.3401/11/2001 2.84 0.00 0.00 0.3001/12/2001 3.01 0.00 0.00 0.4001/13/2001 2.92 0.00 0.00 0.2701/14/2001 3.72 0.10 0.00 0.00 0.2601/15/2001 3.25 0.03 0.00 0.00 0.0401/16/2001 2.84 0.00 0.00 0.3001/17/2001 2.88 0.00 0.00 0.2801/18/2001 2.85 0.00 0.00 0.2801/19/2001 2.78 0.01 0.00 0.00 0.3101/20/2001 2.66 0.00 0.00 0.37
Page 27

Plant Bypass to CSO Lagoon CSO Lagoon Date Influent Flow Rain CSO Lagoon Overflow Return Pump
MGD inches hours MGD MGD
LaPorte CSO Overflow Data
01/21/2001 2.86 0.00 0.00 0.4501/22/2001 2.97 0.00 0.00 0.3601/23/2001 2.90 0.00 0.00 0.2901/24/2001 2.75 0.17 0.00 0.00 0.3001/25/2001 2.99 0.02 0.00 0.00 0.2701/26/2001 3.30 0.20 0.00 0.00 0.7001/27/2001 2.94 0.00 0.00 0.4001/28/2001 2.79 0.05 0.00 0.00 0.4601/29/2001 5.08 0.45 5.26 0.00 0.2901/30/2001 5.03 0.12 1.15 0.00 0.2801/31/2001 4.01 0.02 0.00 0.00 0.8802/01/2001 3.86 0.01 0.00 0.00 0.6002/02/2001 3.68 0.07 0.00 0.00 1.2202/03/2001 2.97 0.01 0.00 0.00 0.4402/04/2001 3.05 0.08 0.00 0.00 0.4002/05/2001 2.99 0.06 0.00 0.00 0.4402/06/2001 3.92 0.15 0.00 0.00 1.1902/07/2001 3.75 0.02 0.00 0.00 1.1602/08/2001 5.03 0.41 3.46 0.00 0.2402/09/2001 8.90 1.16 14.83 0.00 0.4202/10/2001 5.67 0.03 0.00 0.00 2.4002/11/2001 5.10 0.00 0.00 2.3802/12/2001 5.20 0.00 0.00 2.3702/13/2001 5.15 0.00 0.00 2.4302/14/2001 5.07 0.20 0.00 0.00 1.0502/15/2001 4.36 0.00 0.00 1.4602/16/2001 3.45 0.00 0.00 0.5902/17/2001 3.96 0.05 0.00 0.00 1.4602/18/2001 3.79 0.00 0.00 1.3202/19/2001 3.05 0.00 0.00 0.2602/20/2001 2.75 0.00 0.00 0.0002/21/2001 2.85 0.00 0.00 0.2402/22/2001 2.88 0.04 0.00 0.00 0.2402/23/2001 3.14 0.00 0.00 0.4002/24/2001 6.60 1.70 13.15 1.11 0.2702/25/2001 7.03 2.80 2.60 2.1002/26/2001 5.48 0.00 0.00 2.4802/27/2001 4.98 0.00 0.00 2.1002/28/2001 5.18 0.00 0.00 2.4403/01/2001 5.28 0.00 0.00 2.4003/02/2001 5.05 0.02 0.00 0.00 2.1303/03/2001 3.39 0.00 0.00 0.7303/04/2001 3.11 0.00 0.00 0.5003/05/2001 3.83 0.14 0.00 0.00 1.1103/06/2001 3.35 0.00 0.00 0.6603/07/2001 4.02 0.00 0.00 1.1703/08/2001 3.45 0.02 0.00 0.00 0.6203/09/2001 3.35 0.26 0.00 0.00 0.2303/10/2001 3.40 0.00 0.00 0.3703/11/2001 4.02 0.11 0.00 0.00 0.8203/12/2001 3.99 0.09 0.00 0.00 0.8903/13/2001 3.65 0.00 0.00 0.7403/14/2001 4.57 0.07 0.00 0.00 1.7903/15/2001 4.17 0.16 0.38 0.00 0.5503/16/2001 3.67 0.19 0.00 0.00 0.8503/17/2001 4.09 0.13 0.00 0.00 0.57
Page 28

Plant Bypass to CSO Lagoon CSO Lagoon Date Influent Flow Rain CSO Lagoon Overflow Return Pump
MGD inches hours MGD MGD
LaPorte CSO Overflow Data
03/18/2001 3.08 0.00 0.00 0.4503/19/2001 4.15 0.00 0.00 1.2903/20/2001 3.24 0.00 0.00 0.5003/21/2001 3.63 0.00 0.00 0.8103/22/2001 3.21 0.00 0.00 0.3303/23/2001 3.56 0.00 0.00 0.8903/24/2001 2.91 0.00 0.00 0.3703/25/2001 3.91 0.14 0.00 0.00 1.2503/26/2001 3.66 0.04 0.00 0.00 0.9303/27/2001 3.76 0.00 0.00 0.9603/28/2001 3.55 0.00 0.00 0.8703/29/2001 4.10 0.02 0.00 0.00 1.2903/30/2001 2.98 0.00 0.00 0.2603/31/2001 3.98 0.14 0.00 0.00 1.0404/01/2001 2.79 0.00 0.00 0.2504/02/2001 2.99 0.00 0.00 0.3504/03/2001 3.75 0.00 0.00 1.1804/04/2001 3.67 0.00 0.00 1.0304/05/2001 4.12 0.56 3.21 0.00 0.5204/06/2001 7.19 0.94 5.10 0.00 1.5304/07/2001 4.97 0.00 0.00 2.2904/08/2001 5.01 0.00 0.00 2.2704/09/2001 5.41 0.17 1.98 0.00 2.0004/10/2001 4.97 0.00 0.00 2.2104/11/2001 4.99 0.07 0.00 0.00 2.1304/12/2001 4.64 0.00 0.00 1.6904/13/2001 3.34 0.00 0.00 0.8104/14/2001 3.21 0.01 0.00 0.00 0.5504/15/2001 4.94 0.91 6.95 0.00 0.9804/16/2001 5.18 0.18 0.71 0.00 1.8304/17/2001 5.44 0.08 0.00 0.00 2.0404/18/2001 4.91 0.00 0.00 2.0904/19/2001 4.90 0.00 0.00 2.0904/20/2001 4.79 0.19 0.00 0.00 1.1504/21/2001 5.41 0.52 3.05 0.00 1.5104/22/2001 5.17 0.12 1.10 0.00 1.9304/23/2001 5.23 0.11 1.18 0.00 1.8604/24/2001 4.71 0.00 0.00 1.9104/25/2001 3.85 0.00 0.00 1.0704/26/2001 4.01 0.00 0.00 1.0204/27/2001 2.94 0.00 0.00 0.2004/28/2001 2.49 0.00 0.00 0.0004/29/2001 2.48 0.00 0.00 0.0004/30/2001 2.78 0.00 0.00 0.0005/01/2001 3.34 0.00 0.00 0.5605/02/2001 4.16 0.00 0.00 1.2005/03/2001 4.06 0.00 0.00 1.1905/04/2001 4.00 0.00 0.00 1.1805/05/2001 3.68 0.00 0.00 1.1705/06/2001 3.11 0.08 0.00 0.00 0.5005/07/2001 3.66 0.00 0.00 0.6705/08/2001 2.66 0.35 0.00 0.0005/09/2001 3.00 0.00 0.00 0.3905/10/2001 4.26 0.04 0.00 0.00 1.3605/11/2001 3.93 0.19 0.00 0.00 0.9005/12/2001 3.15 0.01 0.00 0.00 0.46
Page 29

Plant Bypass to CSO Lagoon CSO Lagoon Date Influent Flow Rain CSO Lagoon Overflow Return Pump
MGD inches hours MGD MGD
LaPorte CSO Overflow Data
05/13/2001 2.86 0.00 0.00 0.4505/14/2001 4.80 0.75 4.06 0.00 0.7205/15/2001 4.97 0.00 0.00 2.3205/16/2001 5.54 0.21 1.35 0.00 2.0705/17/2001 4.99 0.00 0.00 2.2405/18/2001 4.25 0.12 1.00 0.00 1.0205/19/2001 3.27 0.00 0.00 0.8405/20/2001 3.28 0.00 0.00 0.8505/21/2001 5.28 0.46 2.80 0.00 1.4105/22/2001 3.96 0.00 0.00 1.2205/23/2001 4.75 0.24 1.71 0.00 1.1705/24/2001 3.89 0.07 0.00 0.00 0.9405/25/2001 4.77 0.37 4.40 0.00 0.6005/26/2001 5.40 0.58 5.03 0.00 1.2205/27/2001 6.45 0.28 3.46 0.00 1.8005/28/2001 4.51 0.00 0.00 1.9605/29/2001 4.43 0.00 0.00 1.7905/30/2001 4.46 0.00 0.00 1.7405/31/2001 4.95 0.45 1.36 0.00 1.4306/01/2001 5.98 0.10 2.20 0.00 1.8706/02/2001 6.23 0.36 3.78 0.00 1.8006/03/2001 5.22 0.11 0.00 0.00 2.1606/04/2001 4.16 0.00 0.00 1.4406/05/2001 6.75 1.02 7.86 0.00 0.8706/06/2001 5.38 0.04 0.00 0.00 2.3106/07/2001 5.18 0.00 0.00 2.2906/08/2001 4.02 0.00 0.00 1.2906/09/2001 3.17 0.00 0.00 0.5006/10/2001 2.99 0.00 0.00 0.4306/11/2001 6.02 0.85 2.80 0.00 1.7606/12/2001 6.66 0.48 2.56 0.00 1.9106/13/2001 5.20 0.00 0.00 2.2406/14/2001 5.27 0.05 0.00 0.00 2.1806/15/2001 6.77 1.13 4.78 0.00 1.6906/16/2001 5.05 0.00 0.00 2.3006/17/2001 4.96 0.00 0.00 2.2706/18/2001 5.03 0.00 0.00 2.2406/19/2001 4.50 0.00 0.00 1.7406/20/2001 3.87 0.00 0.00 1.1506/21/2001 5.42 0.89 4.90 0.00 0.8706/22/2001 5.11 0.00 0.00 2.3006/23/2001 4.90 0.00 0.00 2.3406/24/2001 4.33 0.00 0.00 1.8406/25/2001 3.26 0.00 0.00 0.4906/26/2001 3.17 0.00 0.00 0.4406/27/2001 3.40 0.00 0.00 0.6206/28/2001 3.77 0.00 0.00 0.8406/29/2001 3.77 0.00 0.00 0.9606/30/2001 3.18 0.00 0.00 0.6907/01/2001 2.76 0.00 0.00 0.3207/02/2001 3.48 0.00 0.00 0.9607/03/2001 3.82 0.19 1.01 0.00 0.6207/04/2001 3.03 0.00 0.00 0.7107/05/2001 3.42 0.00 0.00 0.7407/06/2001 2.71 0.00 0.00 0.2807/07/2001 6.48 2.61 6.38 3.79 1.10
Page 30

Plant Bypass to CSO Lagoon CSO Lagoon Date Influent Flow Rain CSO Lagoon Overflow Return Pump
MGD inches hours MGD MGD
LaPorte CSO Overflow Data
07/08/2001 4.78 0.00 0.16 1.9007/09/2001 5.16 0.00 0.00 2.1607/10/2001 5.03 0.00 0.00 2.1207/11/2001 5.25 0.00 0.00 2.3707/12/2001 5.09 0.00 0.00 2.2907/13/2001 4.94 0.00 0.00 2.2407/14/2001 3.08 0.00 0.00 0.5307/15/2001 3.09 0.00 0.00 0.4707/16/2001 3.73 0.00 0.00 1.0107/17/2001 4.34 0.07 0.96 0.00 1.1107/18/2001 3.98 0.00 0.00 1.0707/19/2001 3.15 0.00 0.00 0.2707/20/2001 3.28 0.01 0.00 0.00 0.5007/21/2001 4.77 0.33 2.61 0.00 0.9007/22/2001 4.85 0.07 0.00 0.00 2.1807/23/2001 5.27 0.82 3.38 0.00 1.2007/24/2001 5.28 0.00 0.00 2.2607/25/2001 5.40 0.17 1.06 0.00 1.9807/26/2001 4.92 0.00 0.00 2.0807/27/2001 3.93 0.00 0.00 1.0407/28/2001 3.02 0.00 0.00 0.5007/29/2001 3.18 0.00 0.00 0.5107/30/2001 3.34 0.00 0.00 0.5907/31/2001 3.60 0.00 0.00 0.8508/01/2001 3.47 0.00 0.00 0.7508/02/2001 4.81 0.32 2.50 0.00 0.9808/03/2001 3.78 0.00 0.00 1.0908/04/2001 2.94 0.00 0.00 0.3408/05/2001 2.74 0.00 0.00 0.3408/06/2001 3.02 0.00 0.00 0.3808/07/2001 2.88 0.00 0.00 0.0008/08/2001 3.05 0.00 0.00 0.2808/09/2001 4.60 0.40 1.51 0.00 1.3908/10/2001 4.87 0.02 1.20 0.00 1.3508/11/2001 2.79 0.00 0.00 0.4508/12/2001 2.87 0.00 0.00 0.5408/13/2001 3.32 0.00 0.00 0.8208/14/2001 2.66 0.00 0.00 0.1308/15/2001 3.24 0.00 0.00 0.7908/16/2001 6.03 0.52 2.41 0.00 1.6808/17/2001 3.29 0.00 0.00 0.8108/18/2001 4.55 0.24 1.55 0.00 1.0008/19/2001 5.20 0.19 1.73 0.00 1.8708/20/2001 3.36 0.00 0.00 0.5508/21/2001 2.96 0.04 0.00 0.00 0.4308/22/2001 3.57 0.02 0.00 0.00 0.8508/23/2001 3.05 0.01 0.00 0.00 0.3508/24/2001 3.38 0.00 0.00 0.7408/25/2001 5.66 3.49 7.13 2.17 0.8608/26/2001 7.27 0.28 5.65 8.54 1.6608/27/2001 5.38 0.00 0.01 2.3808/28/2001 5.24 0.00 0.00 2.3108/29/2001 4.95 0.00 0.00 2.2308/30/2001 5.08 0.00 0.00 2.1408/31/2001 4.88 0.04 0.00 0.00 2.2109/01/2001 3.47 0.00 0.00 1.03
Page 31

Plant Bypass to CSO Lagoon CSO Lagoon Date Influent Flow Rain CSO Lagoon Overflow Return Pump
MGD inches hours MGD MGD
LaPorte CSO Overflow Data
09/02/2001 2.69 0.00 0.00 0.5009/03/2001 3.49 0.03 0.00 0.00 0.8309/04/2001 2.83 0.00 0.00 0.2509/05/2001 3.51 0.00 0.00 0.9309/06/2001 3.57 0.25 0.70 0.00 0.6809/07/2001 5.17 0.02 1.43 0.00 1.5309/08/2001 3.10 0.04 0.20 0.00 0.5409/09/2001 6.47 0.74 5.36 0.00 1.3509/10/2001 4.82 0.00 0.00 2.2509/11/2001 4.73 0.00 0.00 2.2809/12/2001 3.11 0.00 0.00 0.6209/13/2001 3.13 0.01 0.00 0.00 0.4409/14/2001 2.99 0.00 0.00 0.5909/15/2001 2.91 0.00 0.00 0.4909/16/2001 2.82 0.00 0.00 0.5409/17/2001 4.03 1.42 3.18 0.00 0.5709/18/2001 5.68 0.09 1.78 0.00 2.1009/19/2001 7.45 0.71 3.86 0.00 1.6709/20/2001 5.18 0.00 0.00 2.4109/21/2001 5.05 0.08 0.00 0.00 2.3109/22/2001 4.65 0.00 0.00 2.2709/23/2001 3.52 0.07 0.00 0.00 1.1209/24/2001 3.37 0.01 0.00 0.00 0.7609/25/2001 3.44 0.21 0.98 0.00 0.2209/26/2001 2.63 0.00 0.00 0.1809/27/2001 3.89 0.00 0.00 1.1809/28/2001 3.55 0.00 0.00 1.0409/29/2001 2.70 0.00 0.00 0.3609/30/2001 2.78 0.00 0.00 0.4310/01/2001 2.69 0.00 0.00 0.1010/02/2001 2.96 0.00 0.00 0.4410/03/2001 3.64 0.00 0.00 0.9410/04/2001 4.91 0.80 6.31 0.00 0.3010/05/2001 9.13 1.19 15.85 0.00 0.3610/06/2001 5.56 0.00 0.00 2.3610/07/2001 5.32 0.00 0.00 2.3410/08/2001 5.18 0.00 0.00 2.2810/09/2001 5.32 0.00 0.00 2.1710/10/2001 4.32 0.09 0.00 0.00 1.1710/11/2001 6.63 0.47 3.11 0.00 1.6610/12/2001 7.69 1.09 7.76 0.00 1.4510/13/2001 7.43 2.09 11.96 3.66 1.0010/14/2001 7.75 0.49 6.50 7.97 1.5510/15/2001 5.64 0.03 0.00 0.02 2.3110/16/2001 8.52 1.09 12.86 1.21 0.8610/17/2001 5.80 0.00 0.15 2.3110/18/2001 5.74 0.00 0.00 2.3010/19/2001 5.55 0.01 0.00 0.00 2.2410/20/2001 5.26 0.00 0.00 2.2810/21/2001 5.23 0.00 0.00 2.2610/22/2001 5.36 0.05 0.00 0.00 2.2410/23/2001 6.52 0.49 3.56 0.00 1.8110/24/2001 6.49 1.10 4.38 0.00 1.7310/25/2001 5.96 0.00 0.00 2.3410/26/2001 5.58 0.08 0.00 0.00 2.3310/27/2001 5.41 0.06 0.00 0.00 2.32
Page 32

Plant Bypass to CSO Lagoon CSO Lagoon Date Influent Flow Rain CSO Lagoon Overflow Return Pump
MGD inches hours MGD MGD
LaPorte CSO Overflow Data
10/28/2001 5.36 0.00 0.00 2.4010/29/2001 5.37 0.00 0.00 2.2810/30/2001 3.63 0.00 0.00 0.5610/31/2001 4.37 0.00 0.00 1.1411/01/2001 4.15 0.09 0.00 0.00 0.9511/02/2001 7.28 0.86 6.26 0.00 1.5411/03/2001 5.31 0.00 0.00 2.3111/04/2001 5.34 0.00 0.00 2.2911/05/2001 4.28 0.00 0.00 1.2211/06/2001 4.06 0.00 0.00 0.9011/07/2001 4.16 0.00 0.00 1.1211/08/2001 4.53 0.09 0.00 0.00 1.0611/09/2001 4.39 0.00 0.00 1.4311/10/2001 3.62 0.00 0.00 0.7311/11/2001 3.14 0.00 0.00 0.4111/12/2001 4.49 0.00 0.00 1.4311/13/2001 3.78 0.00 0.00 0.8611/14/2001 4.44 0.21 0.28 0.00 0.7111/15/2001 4.12 0.00 0.00 1.2311/16/2001 3.45 0.00 0.00 0.4711/17/2001 3.31 0.00 0.00 0.5111/18/2001 3.34 0.01 0.00 0.00 0.4211/19/2001 5.41 0.18 0.08 0.00 1.8111/20/2001 4.12 0.00 0.00 1.0811/21/2001 4.10 0.00 0.00 1.1811/22/2001 3.37 0.00 0.00 0.6911/23/2001 3.59 0.02 0.00 0.00 0.9811/24/2001 4.79 0.15 0.98 0.00 1.2911/25/2001 3.61 0.02 0.00 0.00 0.8811/26/2001 4.36 0.05 0.00 0.00 1.4211/27/2001 3.37 0.04 0.00 0.00 0.3211/28/2001 4.24 0.13 0.00 0.00 1.3911/29/2001 5.01 0.63 1.61 0.00 0.0011/30/2001 6.73 0.12 3.08 0.00 1.7912/01/2001 5.02 0.04 0.00 0.00 2.1812/02/2001 4.73 0.00 0.00 2.0312/03/2001 3.72 0.00 0.00 0.7712/04/2001 3.96 0.00 0.00 1.1812/05/2001 3.89 0.06 0.00 0.00 0.9412/06/2001 3.26 0.00 0.00 0.0712/07/2001 4.09 0.00 0.00 1.3312/08/2001 3.84 0.00 0.00 1.1212/09/2001 3.33 0.00 0.00 0.6712/10/2001 3.61 0.00 0.00 0.8012/11/2001 3.69 0.00 0.00 0.9212/12/2001 4.49 0.25 0.00 0.00 1.0512/13/2001 4.44 0.08 0.00 0.00 1.0512/14/2001 5.55 0.32 3.58 0.00 1.3312/15/2001 4.19 0.00 0.00 1.5412/16/2001 3.67 0.13 0.00 0.00 0.7512/17/2001 6.15 0.23 1.01 0.00 1.3012/18/2001 3.45 0.00 0.00 0.4012/19/2001 4.35 0.07 0.00 0.00 1.3812/20/2001 3.51 0.00 0.00 0.4812/21/2001 3.48 0.00 0.00 0.7512/22/2001 4.61 0.18 2.03 0.00 1.06
Page 33

Plant Bypass to CSO Lagoon CSO Lagoon Date Influent Flow Rain CSO Lagoon Overflow Return Pump
MGD inches hours MGD MGD
LaPorte CSO Overflow Data
12/23/2001 3.64 0.09 0.00 0.00 0.9112/24/2001 3.92 0.18 0.00 0.00 1.3612/25/2001 3.05 0.03 0.00 0.00 0.7112/26/2001 3.51 0.02 0.00 0.00 0.7412/27/2001 3.66 0.03 0.00 0.00 0.7312/28/2001 3.59 0.01 0.00 0.00 0.8812/29/2001 3.26 0.02 0.00 0.00 0.7412/30/2001 2.92 0.02 0.00 0.00 0.3712/31/2001 2.74 0.00 0.00 0.0001/01/2002 2.52 0.00 0.00 0.0001/02/2002 2.75 0.02 0.00 0.00 0.0001/03/2002 2.92 0.00 0.00 0.0001/04/2002 2.79 0.00 0.00 0.0001/05/2002 2.64 0.18 0.00 0.00 0.0001/06/2002 2.95 0.16 0.00 0.00 0.0001/07/2002 4.20 0.21 0.00 0.00 1.5401/08/2002 4.96 0.00 0.00 2.1001/09/2002 5.66 0.00 0.00 2.1201/10/2002 4.72 0.00 0.00 1.8801/11/2002 3.06 0.00 0.00 0.4701/12/2002 3.97 0.01 0.00 0.00 1.3601/13/2002 2.90 0.00 0.00 0.3901/14/2002 3.48 0.04 0.31 0.00 0.7301/15/2002 3.25 0.02 0.00 0.00 0.6801/16/2002 3.37 0.14 0.00 0.00 0.7101/17/2002 4.37 0.00 0.00 1.5601/18/2002 3.46 0.00 0.00 0.9301/19/2002 2.40 0.00 0.00 0.0001/20/2002 2.47 0.00 0.00 0.0001/21/2002 3.23 0.03 0.00 0.00 0.5101/22/2002 4.10 0.00 0.00 1.3901/23/2002 4.08 0.06 0.00 0.00 1.3701/24/2002 2.93 0.00 0.00 0.2301/25/2002 3.84 0.00 0.00 1.1601/26/2002 3.10 0.00 0.00 0.5901/27/2002 3.41 0.00 0.00 0.9501/28/2002 3.12 0.00 0.00 0.4501/29/2002 4.16 0.23 0.16 0.00 1.1101/30/2002 7.18 1.25 3.71 0.00 0.8701/31/2002 8.60 0.63 6.16 0.00 0.5002/01/2002 6.18 0.00 0.00 1.9402/02/2002 4.93 0.00 0.00 2.0702/03/2002 4.93 0.00 0.00 2.0502/04/2002 4.22 0.19 0.00 0.00 1.3902/05/2002 3.51 0.00 0.00 0.7102/06/2002 3.45 0.00 0.00 0.6002/07/2002 3.67 0.00 0.00 0.7002/08/2002 3.13 0.00 0.00 0.2902/09/2002 4.05 0.00 0.00 1.2502/10/2002 3.87 0.00 0.00 1.2002/11/2002 3.04 0.00 0.00 0.3102/12/2002 3.90 0.00 0.00 1.1202/13/2002 2.97 0.00 0.00 0.1502/14/2002 3.95 0.00 0.00 1.1402/15/2002 3.48 0.00 0.00 0.6802/16/2002 3.61 0.04 0.00 0.00 0.82
Page 34

Plant Bypass to CSO Lagoon CSO Lagoon Date Influent Flow Rain CSO Lagoon Overflow Return Pump
MGD inches hours MGD MGD
LaPorte CSO Overflow Data
02/17/2002 3.88 0.03 0.00 0.00 1.1302/18/2002 3.58 0.00 0.00 0.7002/19/2002 6.60 0.53 2.60 0.00 1.0602/20/2002 7.22 0.52 7.03 0.00 1.1702/21/2002 5.34 0.19 0.00 0.00 1.9102/22/2002 3.96 0.00 0.00 0.8402/23/2002 3.13 0.00 0.00 0.3702/24/2002 3.98 0.00 0.00 1.2402/25/2002 3.58 0.28 0.00 0.00 0.5702/26/2002 4.72 0.45 0.00 0.00 0.6002/27/2002 5.14 0.25 0.00 0.00 1.8602/28/2002 3.66 0.00 0.00 0.5703/01/2002 3.91 0.00 0.00 0.9303/02/2002 6.31 1.29 6.76 0.00 0.7703/03/2002 5.59 0.39 0.00 0.00 1.9103/04/2002 4.96 0.03 0.00 0.00 1.9203/05/2002 4.90 0.01 0.11 0.00 1.6803/06/2002 5.22 3.85 0.00 0.3603/07/2002 5.19 0.00 0.00 0.6903/08/2002 6.87 0.29 3.90 0.00 1.1503/09/2002 7.25 0.56 7.93 0.00 1.2003/10/2002 5.26 0.00 0.00 1.9703/11/2002 5.74 0.00 0.00 1.8503/12/2002 5.41 0.00 0.00 1.9203/13/2002 5.04 0.00 0.00 1.6503/14/2002 4.90 0.00 0.00 1.2903/15/2002 4.88 0.05 0.00 0.00 1.2903/16/2002 4.45 0.00 0.00 1.2603/17/2002 4.52 0.08 0.00 0.00 1.2503/18/2002 4.47 0.00 0.00 0.6903/19/2002 4.73 0.06 0.00 0.00 0.5303/20/2002 5.76 0.04 0.00 0.00 1.3603/21/2002 5.59 0.09 0.00 0.00 1.1903/22/2002 5.33 0.00 0.00 1.2803/23/2002 5.33 0.00 0.00 1.2703/24/2002 4.64 0.13 0.00 0.00 0.7403/25/2002 5.50 0.09 0.00 0.00 1.2703/26/2002 5.47 0.20 0.00 0.00 1.2803/27/2002 5.54 0.01 0.00 0.6903/28/2002 5.74 0.00 0.00 1.6803/29/2002 6.29 0.30 3.96 0.00 1.3503/30/2002 5.59 0.00 0.00 1.8903/31/2002 5.44 0.03 0.00 0.00 1.8804/01/2002 5.27 0.22 2.23 0.00 0.7704/02/2002 6.93 0.44 3.96 0.00 1.3904/03/2002 5.71 0.05 0.33 0.00 1.8604/04/2002 5.65 0.03 0.36 0.00 1.7404/05/2002 5.37 0.63 0.00 1.7804/06/2002 5.35 0.00 0.00 1.7704/07/2002 4.47 0.07 0.00 0.00 0.6804/08/2002 7.35 0.80 8.90 0.00 0.7604/09/2002 5.62 0.13 0.00 0.00 1.7604/10/2002 5.02 0.00 0.00 1.7304/11/2002 5.97 0.00 0.00 1.4004/12/2002 7.40 0.00 0.00 1.8204/13/2002 7.13 0.00 0.00 1.85
Page 35

Plant Bypass to CSO Lagoon CSO Lagoon Date Influent Flow Rain CSO Lagoon Overflow Return Pump
MGD inches hours MGD MGD
LaPorte CSO Overflow Data
04/14/2002 7.19 0.00 0.00 2.1504/15/2002 6.01 0.00 0.00 0.9204/16/2002 6.40 0.00 0.00 1.2204/17/2002 6.36 0.05 0.00 0.00 1.3104/18/2002 6.13 0.00 0.00 1.5204/19/2002 6.01 0.97 1.35 0.00 0.9504/20/2002 8.34 0.65 4.83 0.00 1.6204/21/2002 7.97 0.30 2.66 0.00 1.8704/22/2002 7.44 0.00 0.00 2.2004/23/2002 7.31 0.00 0.00 2.2804/24/2002 7.64 0.25 3.35 0.00 1.7304/25/2002 7.48 0.00 0.00 2.1904/26/2002 6.88 0.00 0.00 2.1804/27/2002 7.22 0.70 7.21 0.00 1.3604/28/2002 7.52 0.05 0.00 0.00 2.0604/29/2002 7.29 0.00 0.00 2.1604/30/2002 7.17 0.00 0.00 2.1605/01/2002 7.30 0.04 0.00 0.00 2.1005/02/2002 7.18 0.08 0.45 0.00 1.7105/03/2002 5.80 0.00 0.00 1.0405/04/2002 5.53 0.00 0.00 0.8805/05/2002 5.78 0.00 0.00 1.3005/06/2002 7.12 0.43 4.51 0.00 1.1205/07/2002 7.14 0.00 0.00 2.3505/08/2002 7.08 0.26 2.91 0.00 1.5105/09/2002 7.96 0.82 4.03 0.00 1.7805/10/2002 7.05 0.00 0.00 2.3405/11/2002 7.74 1.23 7.40 0.00 1.4105/12/2002 8.98 0.89 11.03 5.80 0.5505/13/2002 7.30 0.04 0.00 0.30 2.2105/14/2002 5.91 0.00 0.00 2.3505/15/2002 5.84 0.00 0.00 2.3005/16/2002 6.87 0.68 4.38 0.00 1.7505/17/2002 5.99 0.00 0.00 2.3105/18/2002 5.76 0.00 0.00 2.2905/19/2002 5.76 0.02 0.00 0.00 2.2505/20/2002 5.78 0.00 0.00 2.2205/21/2002 5.70 0.00 0.00 2.1905/22/2002 5.84 0.45 0.00 2.1805/23/2002 5.95 0.00 0.00 2.2205/24/2002 6.72 0.73 3.16 0.00 1.6405/25/2002 5.00 0.04 0.00 0.00 1.3605/26/2002 4.55 0.00 0.00 1.2605/27/2002 5.24 0.00 0.00 1.8305/28/2002 6.23 0.16 0.00 0.00 2.1105/29/2002 6.09 0.05 0.00 0.00 2.2105/30/2002 6.07 0.00 0.00 2.2505/31/2002 5.38 0.00 0.00 1.6406/01/2002 4.85 0.00 0.00 1.3206/02/2002 4.26 0.00 0.00 0.8706/03/2002 5.96 0.02 0.00 0.00 2.3206/04/2002 4.99 0.05 0.13 0.00 1.4606/05/2002 3.96 0.08 0.00 0.00 0.3206/06/2002 4.98 0.83 0.00 1.4506/07/2002 4.40 0.00 0.00 0.9506/08/2002 4.90 0.00 0.00 1.55
Page 36

Plant Bypass to CSO Lagoon CSO Lagoon Date Influent Flow Rain CSO Lagoon Overflow Return Pump
MGD inches hours MGD MGD
LaPorte CSO Overflow Data
06/09/2002 4.57 0.00 0.00 1.1706/10/2002 4.78 0.16 0.00 0.00 1.1806/11/2002 5.02 0.02 0.00 0.00 1.5306/12/2002 4.21 0.00 0.00 0.5006/13/2002 5.12 0.00 0.00 1.6406/14/2002 6.09 0.20 0.68 0.00 1.7606/15/2002 7.23 0.51 0.00 1.8206/16/2002 5.45 0.00 0.00 1.1106/17/2002 5.30 0.01 0.00 0.00 0.6606/18/2002 5.85 0.00 0.00 1.2806/19/2002 5.55 0.00 0.00 1.1206/20/2002 5.21 0.00 0.00 1.1506/21/2002 4.31 0.00 0.00 0.9806/22/2002 4.24 0.00 0.00 1.2206/23/2002 4.22 0.00 0.00 1.2106/24/2002 3.80 0.00 0.00 0.5206/25/2002 5.83 0.75 2.88 0.00 1.3706/26/2002 5.76 0.02 0.00 0.00 2.3706/27/2002 6.27 0.09 0.00 0.00 2.3806/28/2002 5.12 0.00 0.00 1.9506/29/2002 3.63 0.00 0.00 0.7206/30/2002 4.11 0.00 0.00 1.0807/01/2002 4.05 0.00 0.00 0.9207/02/2002 4.13 0.00 0.00 0.9907/03/2002 4.29 0.00 0.00 1.0507/04/2002 3.69 0.00 0.00 0.7707/05/2002 3.61 0.00 0.00 0.7307/06/2002 3.63 0.00 0.00 0.8507/07/2002 4.91 0.00 0.00 0.9207/08/2002 5.84 0.00 0.00 0.8307/09/2002 7.09 0.36 3.08 0.00 0.9207/10/2002 5.93 0.00 0.00 1.1007/11/2002 4.59 0.00 0.00 0.5407/12/2002 4.36 0.00 0.00 1.4307/13/2002 3.34 0.00 0.00 0.7407/14/2002 4.66 0.00 0.00 0.7507/15/2002 5.90 0.51 0.00 0.8307/16/2002 5.97 0.00 0.00 0.8407/17/2002 5.41 0.00 0.00 1.2607/18/2002 3.89 0.00 0.00 0.8307/19/2002 3.24 0.00 0.00 0.3007/20/2002 3.44 0.00 0.00 0.7907/21/2002 5.15 0.00 0.00 0.6907/22/2002 7.69 1.47 4.63 0.00 0.9607/23/2002 8.22 0.00 0.00 2.4507/24/2002 7.92 0.00 0.00 2.3407/25/2002 7.88 0.39 2.81 0.00 1.7707/26/2002 7.46 0.00 0.00 2.1407/27/2002 7.01 0.14 0.46 0.00 2.0207/28/2002 6.32 0.00 0.00 1.9207/29/2002 6.24 0.22 2.30 0.00 1.0207/30/2002 5.83 0.00 0.00 1.3107/31/2002 5.70 0.00 0.00 1.2408/01/2002 5.83 0.00 0.00 1.2608/02/2002 7.34 0.99 3.40 0.00 1.4408/03/2002 6.34 0.00 0.00 1.88
Page 37

Plant Bypass to CSO Lagoon CSO Lagoon Date Influent Flow Rain CSO Lagoon Overflow Return Pump
MGD inches hours MGD MGD
LaPorte CSO Overflow Data
08/04/2002 6.65 0.00 0.00 1.8408/05/2002 6.37 0.00 0.00 1.7808/06/2002 4.50 0.00 0.00 1.8008/07/2002 3.66 0.00 0.00 1.0508/08/2002 3.51 0.00 0.00 0.8208/09/2002 3.30 0.00 0.00 0.6308/10/2002 3.25 0.00 0.00 0.8008/11/2002 3.22 0.00 0.00 0.6708/12/2002 4.03 0.00 0.00 0.7208/13/2002 6.30 0.47 3.43 0.00 0.5508/14/2002 6.74 0.09 0.00 0.00 1.8908/15/2002 5.32 0.01 0.00 0.00 0.7608/16/2002 6.15 0.26 1.71 0.00 0.8808/17/2002 5.50 0.00 0.00 1.0708/18/2002 4.56 0.00 0.00 0.4408/19/2002 6.69 0.44 2.71 0.00 1.3008/20/2002 6.24 0.00 0.00 1.8508/21/2002 4.69 0.00 0.00 0.4908/22/2002 4.77 0.04 0.00 0.00 0.7108/23/2002 5.19 0.02 0.00 0.00 1.0008/24/2002 4.79 0.10 1.53 0.00 0.4508/25/2002 4.48 0.00 0.00 0.7008/26/2002 5.26 0.00 0.00 1.2408/27/2002 3.95 0.00 0.00 0.1808/28/2002 4.56 0.00 0.00 0.7908/29/2002 4.23 0.00 0.00 0.5308/30/2002 3.19 0.00 0.00 0.6308/31/2002 3.02 0.00 0.00 0.6709/01/2002 2.43 0.00 0.00 0.0009/02/2002 5.54 0.37 2.13 0.00 1.4209/03/2002 5.27 0.00 0.00 1.3409/04/2002 4.74 0.06 0.00 0.8209/05/2002 4.39 0.00 0.00 0.3909/06/2002 4.26 0.00 0.00 0.4909/07/2002 4.59 0.00 0.00 0.8609/08/2002 4.05 0.00 0.00 0.4709/09/2002 4.94 0.00 0.00 1.1809/10/2002 3.83 0.04 0.00 0.00 0.0009/11/2002 4.20 0.00 0.00 0.5509/12/2002 4.07 0.00 0.00 0.3709/13/2002 4.58 0.00 0.00 0.9409/14/2002 3.77 0.00 0.00 0.4409/15/2002 4.04 0.10 0.00 0.00 0.1409/16/2002 4.73 0.00 0.00 0.7709/17/2002 4.17 0.00 0.00 0.3809/18/2002 4.20 0.09 0.00 0.00 0.1009/19/2002 5.59 0.11 1.66 0.00 1.0209/20/2002 5.59 0.20 1.55 0.00 0.9709/21/2002 4.21 0.00 0.00 0.6609/22/2002 4.38 0.11 0.00 0.00 0.5509/23/2002 4.41 0.00 0.00 0.6309/24/2002 4.02 0.00 0.00 0.3909/25/2002 3.71 0.00 0.00 0.0009/26/2002 5.34 0.00 0.00 1.2209/27/2002 4.00 0.00 0.00 0.0009/28/2002 4.83 0.00 0.00 0.91
Page 38

Plant Bypass to CSO Lagoon CSO Lagoon Date Influent Flow Rain CSO Lagoon Overflow Return Pump
MGD inches hours MGD MGD
LaPorte CSO Overflow Data
09/29/2002 4.57 0.12 0.46 0.00 0.3209/30/2002 4.79 0.00 0.00 0.9210/01/2002 3.52 0.00 0.00 0.3310/02/2002 3.33 0.00 0.00 0.9510/03/2002 3.32 0.00 0.00 0.5210/04/2002 5.13 0.76 3.21 0.00 0.8010/05/2002 4.43 0.00 0.00 2.2310/06/2002 4.55 0.01 0.00 0.00 2.2010/07/2002 3.50 0.00 0.00 0.8910/08/2002 2.65 0.00 0.00 0.3010/09/2002 3.06 0.00 0.00 0.5010/10/2002 3.34 0.00 0.00 0.4910/11/2002 2.92 0.00 0.00 0.3410/12/2002 2.86 0.26 0.30 0.00 0.3110/13/2002 3.85 0.00 0.00 0.7810/14/2002 2.97 0.00 0.00 0.5610/15/2002 2.91 0.00 0.00 0.5610/16/2002 2.43 0.04 0.00 0.00 0.0010/17/2002 3.82 0.09 0.00 0.00 1.2210/18/2002 2.64 0.08 0.00 0.00 0.3010/19/2002 2.99 0.00 0.00 0.5610/20/2002 2.71 0.00 0.00 0.5210/21/2002 2.82 0.00 0.00 0.5210/22/2002 3.05 0.00 0.00 0.5510/23/2002 2.26 0.00 0.00 0.0010/24/2002 3.86 0.00 0.00 1.1510/25/2002 3.58 0.17 0.00 0.00 0.4810/26/2002 3.06 0.00 0.00 0.6810/27/2002 2.51 0.00 0.00 0.3110/28/2002 2.89 0.00 0.00 0.4910/29/2002 2.95 0.00 0.00 0.6610/30/2002 2.65 0.00 0.00 0.3610/31/2002 2.95 0.02 0.00 0.00 0.5111/01/2002 2.84 0.00 0.00 0.6211/02/2002 2.62 0.00 0.00 0.4511/03/2002 2.83 0.03 0.00 0.00 0.4311/04/2002 2.61 0.00 0.00 0.3311/05/2002 3.91 0.27 0.00 0.00 0.9411/06/2002 2.83 0.06 1.18 0.00 0.3011/07/2002 2.62 0.00 0.00 0.2811/08/2002 2.50 0.00 0.00 0.2711/09/2002 4.09 0.50 2.93 0.00 0.9011/10/2002 5.44 0.10 3.71 0.00 1.7511/11/2002 2.85 0.02 0.00 0.00 0.5711/12/2002 2.70 0.00 0.00 0.3811/13/2002 3.13 0.00 0.00 0.8811/14/2002 3.39 0.24 0.00 0.00 0.1811/15/2002 3.43 0.00 0.00 0.8311/16/2002 2.37 0.00 0.00 0.2711/17/2002 2.52 0.00 0.00 0.4211/18/2002 2.91 0.10 0.00 0.00 0.4911/19/2002 3.80 0.10 0.00 0.00 0.8011/20/2002 2.41 0.00 0.00 0.1811/21/2002 4.40 0.34 1.30 0.00 0.3511/22/2002 4.26 0.02 0.00 0.00 0.8511/23/2002 2.69 0.00 0.00 0.54
Page 39

Plant Bypass to CSO Lagoon CSO Lagoon Date Influent Flow Rain CSO Lagoon Overflow Return Pump
MGD inches hours MGD MGD
LaPorte CSO Overflow Data
11/24/2002 2.71 0.12 0.00 0.00 0.4411/25/2002 3.30 0.00 0.00 0.9011/26/2002 2.45 0.03 0.00 0.00 0.1911/27/2002 2.55 0.00 0.00 0.2011/28/2002 3.90 0.00 0.00 1.7411/29/2002 2.52 0.00 0.00 0.4611/30/2002 2.52 0.17 0.00 0.00 0.2312/01/2002 2.44 0.00 0.00 0.2612/02/2002 2.62 0.09 0.00 0.00 0.2612/03/2002 2.37 0.00 0.00 0.0012/04/2002 2.32 0.00 0.00 0.0012/05/2002 4.37 0.02 0.00 0.00 1.9712/06/2002 3.03 0.00 0.00 0.6612/07/2002 2.46 0.00 0.00 0.2512/08/2002 2.35 0.00 0.00 0.2312/09/2002 2.43 0.00 0.00 0.1312/10/2002 2.26 0.00 0.00 0.0012/11/2002 2.26 0.00 0.00 0.0012/12/2002 3.11 0.00 0.00 0.6312/13/2002 3.33 0.00 0.00 1.0712/14/2002 2.46 0.00 0.00 0.3112/15/2002 2.26 0.01 0.00 0.00 0.0012/16/2002 2.67 0.00 0.00 0.3912/17/2002 3.58 0.18 0.00 0.00 1.1312/18/2002 7.79 0.94 10.13 0.00 0.6412/19/2002 5.27 0.08 0.00 0.00 2.2212/20/2002 4.39 0.01 0.00 0.00 2.2012/21/2002 2.40 0.37 0.00 0.00 0.0912/22/2002 2.17 0.31 0.00 0.00 0.0012/23/2002 3.37 0.00 0.00 1.1512/24/2002 2.10 0.00 0.00 0.0012/25/2002 2.22 0.06 0.00 0.3412/26/2002 2.92 0.00 0.00 0.6612/27/2002 2.31 0.00 0.00 0.0012/28/2002 3.82 0.00 0.00 1.5112/29/2002 3.99 0.00 0.00 1.6812/30/2002 4.05 0.01 0.00 0.00 0.0112/31/2002 2.31 0.00 0.00 0.0001/01/2003 2.06 0.00 0.00 0.0001/02/2003 2.31 0.09 0.00 0.00 0.0001/03/2003 2.76 0.02 0.00 0.00 0.2601/04/2003 3.57 0.09 0.00 0.00 1.3301/05/2003 2.93 0.10 0.00 0.00 0.4001/06/2003 2.62 0.04 0.00 0.00 0.0001/07/2003 2.22 0.00 0.00 0.0001/08/2003 2.90 0.00 0.00 0.1401/09/2003 4.50 0.04 0.00 0.00 2.0301/10/2003 3.66 0.08 0.00 0.00 1.4501/11/2003 2.30 0.02 0.00 0.00 0.0901/12/2003 2.21 0.02 0.00 0.00 0.0001/13/2003 2.31 0.00 0.00 0.0501/14/2003 2.26 0.25 0.00 0.00 0.0001/15/2003 2.19 0.00 0.00 0.0001/16/2003 2.33 0.00 0.00 0.0001/17/2003 2.23 0.06 0.00 0.00 0.0001/18/2003 2.15 0.03 0.00 0.00 0.00
Page 40

Plant Bypass to CSO Lagoon CSO Lagoon Date Influent Flow Rain CSO Lagoon Overflow Return Pump
MGD inches hours MGD MGD
LaPorte CSO Overflow Data
01/19/2003 3.25 0.00 0.00 1.1601/20/2003 3.01 0.00 0.00 0.6401/21/2003 2.14 0.02 0.00 0.00 0.0001/22/2003 2.13 0.49 0.00 0.00 0.0001/23/2003 2.80 0.20 0.00 0.00 0.3001/24/2003 2.19 0.00 0.00 0.0001/25/2003 3.49 0.04 0.00 0.00 1.3301/26/2003 3.62 0.40 0.00 0.00 1.3801/27/2003 2.19 0.00 0.00 0.0001/28/2003 2.29 0.03 0.00 0.00 0.0001/29/2003 2.45 0.00 0.00 0.0001/30/2003 2.34 0.00 0.00 0.0001/31/2003 2.56 0.07 0.00 0.00 0.0002/01/2003 4.68 0.00 0.00 1.5102/02/2003 3.33 0.00 0.00 0.5702/03/2003 4.60 0.30 3.33 0.00 0.1602/04/2003 4.84 0.04 0.00 0.00 2.0502/05/2003 2.21 0.02 0.00 0.00 0.0102/06/2003 2.30 0.00 0.00 0.0002/07/2003 2.53 0.02 0.00 0.00 0.2602/08/2003 3.37 0.00 0.00 1.0702/09/2003 2.07 0.00 0.00 0.0302/10/2003 2.35 0.15 0.00 0.00 0.0002/11/2003 2.11 0.03 0.00 0.00 0.0002/12/2003 2.14 0.00 0.00 0.0002/13/2003 2.44 0.00 0.00 0.0002/14/2003 3.68 0.02 0.00 0.00 1.2902/15/2003 3.13 0.00 0.00 0.8302/16/2003 2.15 0.00 0.00 0.0002/17/2003 2.82 0.00 0.00 0.3902/18/2003 2.28 0.00 0.00 0.0002/19/2003 2.35 0.00 0.00 0.0002/20/2003 2.86 0.00 0.00 0.0102/21/2003 2.51 0.00 0.00 0.0002/22/2003 3.25 0.02 0.00 0.00 0.9402/23/2003 3.38 0.00 0.00 1.3302/24/2003 2.54 0.18 0.00 0.00 0.3902/25/2003 2.27 0.01 0.00 0.00 0.0002/26/2003 2.18 0.00 0.00 0.0002/27/2003 2.25 0.00 0.00 0.0002/28/2003 2.38 0.00 0.00 0.0003/01/2003 3.00 0.01 0.00 0.00 0.0003/02/2003 3.45 0.16 0.00 0.00 2.0503/03/2003 2.24 0.02 0.00 0.00 0.0003/04/2003 2.14 0.21 0.00 0.00 0.0003/05/2003 2.33 0.24 0.00 0.00 0.0003/06/2003 2.55 0.01 0.00 0.00 0.0003/07/2003 2.34 0.00 0.00 0.0003/08/2003 4.84 0.15 3.05 0.00 0.9903/09/2003 3.91 0.00 0.00 1.7003/10/2003 3.49 0.01 0.00 0.00 1.3103/11/2003 3.72 0.00 0.00 1.3103/12/2003 3.07 0.00 0.00 0.1503/13/2003 4.84 0.30 5.13 0.00 0.0103/14/2003 2.39 0.00 0.00 0.0403/15/2003 3.76 0.00 0.00 1.29
Page 41

Plant Bypass to CSO Lagoon CSO Lagoon Date Influent Flow Rain CSO Lagoon Overflow Return Pump
MGD inches hours MGD MGD
LaPorte CSO Overflow Data
03/16/2003 2.53 0.00 0.00 0.3603/17/2003 2.20 0.00 0.00 0.0003/18/2003 2.38 0.00 0.00 0.0003/19/2003 3.01 0.05 0.00 0.00 0.7603/20/2003 4.49 0.30 1.81 0.00 0.6603/21/2003 3.55 0.02 0.00 0.00 1.2303/22/2003 2.07 0.00 0.00 0.0003/23/2003 2.08 0.00 0.00 0.0003/24/2003 2.91 0.00 0.00 0.5703/25/2003 3.52 0.14 0.00 0.00 0.2903/26/2003 2.24 0.06 0.00 0.00 0.0003/27/2003 3.44 0.04 0.00 0.00 0.9303/28/2003 2.23 0.01 0.00 0.00 0.0003/29/2003 2.00 0.00 0.00 0.0003/30/2003 2.21 0.00 0.00 0.0903/31/2003 2.94 0.06 0.00 0.00 0.7504/01/2003 2.34 0.00 0.00 0.0504/02/2003 2.49 0.00 0.00 0.2004/03/2003 3.18 0.21 0.50 0.00 0.7304/04/2003 7.46 1.78 10.26 0.04 0.4104/05/2003 4.72 0.00 0.01 2.2204/06/2003 4.33 0.00 0.00 2.1404/07/2003 5.50 0.37 0.00 0.00 2.2404/08/2003 4.69 0.00 0.00 2.1604/09/2003 4.41 0.00 0.00 2.1904/10/2003 2.66 0.00 0.00 0.4304/11/2003 2.69 0.00 0.00 0.4204/12/2003 2.35 0.00 0.00 0.3504/13/2003 2.41 0.00 0.00 0.3904/14/2003 2.54 0.00 0.00 0.1904/15/2003 2.31 0.00 0.00 0.1204/16/2003 2.83 0.00 0.00 0.6804/17/2003 2.27 0.00 0.00 0.0004/18/2003 2.12 0.00 0.00 0.0004/19/2003 2.37 0.00 0.00 0.2704/20/2003 5.71 0.57 4.63 0.00 1.4704/21/2003 3.33 0.03 0.00 0.00 1.0904/22/2003 1.95 0.00 0.00 0.0004/23/2003 2.25 0.00 0.00 0.0004/24/2003 3.31 0.00 0.00 1.0004/25/2003 2.23 0.00 0.00 0.0004/26/2003 2.17 0.00 0.00 0.0004/27/2003 2.50 0.00 0.00 0.4904/28/2003 2.57 0.00 0.00 0.4104/29/2003 2.40 0.00 0.00 0.2104/30/2003 5.23 0.73 5.35 0.00 0.9205/01/2003 7.03 0.99 6.70 0.00 1.4605/02/2003 4.60 0.01 0.00 0.00 2.2305/03/2003 4.22 0.00 0.00 2.2005/04/2003 4.54 0.65 1.50 0.00 1.9805/05/2003 6.77 0.57 5.70 0.00 1.5605/06/2003 4.37 0.00 0.00 2.1305/07/2003 5.24 0.36 2.10 0.00 1.8305/08/2003 4.60 0.01 0.00 0.00 2.1805/09/2003 6.61 1.51 5.25 0.58 1.6105/10/2003 4.69 0.06 0.00 0.00 2.26
Page 42

Plant Bypass to CSO Lagoon CSO Lagoon Date Influent Flow Rain CSO Lagoon Overflow Return Pump
MGD inches hours MGD MGD
LaPorte CSO Overflow Data
05/11/2003 5.77 0.34 0.00 0.00 2.0305/12/2003 4.89 0.07 0.00 0.00 2.2605/13/2003 4.61 0.00 0.00 2.2505/14/2003 5.08 0.21 0.66 0.00 2.0205/15/2003 3.36 0.00 0.00 0.8905/16/2003 2.56 0.00 0.00 0.3705/17/2003 2.66 0.00 0.00 0.4905/18/2003 2.06 0.00 0.00 0.0005/19/2003 2.96 0.00 0.00 0.7505/20/2003 6.30 0.57 2.28 0.00 1.7205/21/2003 3.87 0.00 0.00 1.6005/22/2003 3.87 0.00 0.00 0.2005/23/2003 3.01 0.00 0.00 0.0005/24/2003 2.15 0.00 0.00 0.0605/25/2003 3.00 0.00 0.00 1.1005/26/2003 2.13 0.00 0.00 0.0505/27/2003 3.05 0.00 0.00 0.7605/28/2003 2.36 0.08 0.00 0.00 0.0005/29/2003 2.79 0.00 0.00 0.4105/30/2003 2.89 0.38 2.10 0.00 0.0905/31/2003 3.74 0.04 0.00 0.00 1.1906/01/2003 2.77 0.00 0.00 0.00 0.5606/02/2003 3.17 0.03 0.00 0.00 0.9006/03/2003 4.79 0.47 3.40 0.00 0.9306/04/2003 3.19 0.01 0.00 0.00 0.9406/05/2003 3.57 0.00 0.00 1.2906/06/2003 4.02 0.08 0.00 0.00 1.7406/07/2003 2.49 0.00 0.00 0.3406/08/2003 2.73 0.23 0.96 0.00 0.0006/09/2003 2.20 0.00 0.00 0.0406/10/2003 2.27 0.05 0.00 0.00 0.0106/11/2003 2.45 0.03 0.00 0.00 0.2706/12/2003 5.07 0.22 2.01 0.00 1.5506/13/2003 3.90 0.15 0.61 0.00 1.0606/14/2003 3.13 0.00 0.00 1.1106/15/2003 2.96 0.00 0.00 0.9906/16/2003 2.32 0.00 0.00 0.0606/17/2003 2.12 0.00 0.00 0.0006/18/2003 3.40 0.44 2.41 0.00 0.0806/19/2003 4.21 0.00 0.00 1.7906/20/2003 3.87 0.00 0.00 1.7806/21/2003 3.01 0.00 0.00 1.0006/22/2003 2.10 0.00 0.00 0.0006/23/2003 2.17 0.00 0.00 0.0006/24/2003 2.13 0.00 0.00 0.0006/25/2003 2.28 0.00 0.00 0.0006/26/2003 2.76 0.20 0.50 0.00 0.0006/27/2003 2.09 0.00 0.00 0.0006/28/2003 2.25 0.16 0.00 0.00 0.0006/29/2003 2.03 0.00 0.00 0.0006/30/2003 2.68 0.00 0.00 0.5807/01/2003 2.14 0.00 0.00 0.0007/02/2003 2.57 0.00 0.00 0.5307/03/2003 2.19 0.00 0.00 0.0007/04/2003 2.28 0.00 0.00 0.2307/05/2003 4.32 0.62 2.50 0.00 1.07
Page 43

Plant Bypass to CSO Lagoon CSO Lagoon Date Influent Flow Rain CSO Lagoon Overflow Return Pump
MGD inches hours MGD MGD
LaPorte CSO Overflow Data
07/06/2003 5.44 0.85 4.35 0.00 1.4107/07/2003 5.85 1.24 2.80 0.00 1.5807/08/2003 5.94 0.44 5.83 2.45 0.0007/09/2003 4.32 0.06 0.00 0.28 0.0007/10/2003 4.53 0.16 0.00 0.00 0.0007/11/2003 4.17 0.00 0.00 0.0007/12/2003 3.86 0.00 0.00 0.0007/13/2003 3.85 0.00 0.00 0.0007/14/2003 3.91 0.00 0.00 0.0007/15/2003 4.44 0.19 1.06 0.00 0.0007/16/2003 3.69 0.00 0.00 0.0007/17/2003 2.64 0.00 0.00 0.0007/18/2003 2.10 0.00 0.00 0.0007/19/2003 2.06 0.00 0.00 0.0007/20/2003 2.31 0.10 0.00 0.00 0.0007/21/2003 4.77 0.46 2.25 0.00 0.0007/22/2003 2.81 0.00 0.00 0.0007/23/2003 2.66 0.00 0.00 0.0007/24/2003 2.17 0.00 0.00 0.0007/25/2003 2.24 0.00 0.00 0.0007/26/2003 2.44 0.00 0.00 0.0007/27/2003 3.89 0.44 3.28 0.00 0.0007/28/2003 3.19 0.00 0.00 0.0007/29/2003 2.14 0.00 0.00 0.0007/30/2003 2.57 0.00 0.00 0.0007/31/2003 2.60 0.00 0.00 0.0008/01/2003 2.44 0.05 0.00 0.00 0.0008/02/2003 2.20 0.00 0.00 0.0008/03/2003 2.37 0.11 0.00 0.00 0.0008/04/2003 2.10 0.00 0.00 0.0008/05/2003 2.48 0.00 0.00 0.0008/06/2003 2.69 0.00 0.00 0.0008/07/2003 2.08 0.00 0.00 0.0008/08/2003 2.09 0.00 0.00 0.0008/09/2003 2.01 0.00 0.00 0.0008/10/2003 1.85 0.00 0.00 0.0008/11/2003 2.89 0.00 0.00 0.0008/12/2003 2.98 0.04 0.00 0.00 0.0008/13/2003 2.13 0.00 0.00 0.0008/14/2003 2.19 0.00 0.00 0.0008/15/2003 2.32 0.00 0.00 0.0008/16/2003 2.02 0.00 0.00 0.0008/17/2003 1.97 0.00 0.00 0.0008/18/2003 2.20 0.00 0.00 0.0008/19/2003 2.41 0.00 0.00 0.0008/20/2003 2.69 0.00 0.00 0.0008/21/2003 2.81 0.00 0.00 0.0008/22/2003 2.20 0.00 0.00 0.0008/23/2003 2.43 0.00 0.00 0.0008/24/2003 2.34 0.00 0.00 0.0008/25/2003 2.37 0.00 0.00 0.0008/26/2003 4.07 0.39 2.13 0.00 0.0008/27/2003 4.22 0.00 0.00 0.0008/28/2003 2.36 0.00 0.00 0.0008/29/2003 4.11 0.74 2.65 0.00 0.0008/30/2003 3.32 0.00 0.00 0.00
Page 44

Plant Bypass to CSO Lagoon CSO Lagoon Date Influent Flow Rain CSO Lagoon Overflow Return Pump
MGD inches hours MGD MGD
LaPorte CSO Overflow Data
08/31/2003 3.52 0.53 1.31 0.00 0.0009/01/2003 7.51 0.81 7.36 0.00 0.0009/02/2003 4.32 0.00 0.00 0.0009/03/2003 2.13 0.00 0.00 0.0009/04/2003 2.29 0.00 0.00 0.0009/05/2003 2.14 0.00 0.00 0.0009/06/2003 1.91 0.00 0.00 0.0009/07/2003 2.39 0.00 0.00 0.0009/08/2003 2.81 0.00 0.00 0.0009/09/2003 2.14 0.00 0.00 0.0009/10/2003 2.17 0.00 0.00 0.0009/11/2003 2.36 0.00 0.00 0.0009/12/2003 2.75 0.00 0.00 0.0009/13/2003 2.07 0.00 0.00 0.0009/14/2003 2.87 0.22 0.98 0.00 0.0009/15/2003 2.85 0.00 0.00 0.0009/16/2003 2.11 0.00 0.00 0.0009/17/2003 2.64 0.00 0.00 0.0009/18/2003 2.64 0.00 0.00 0.0009/19/2003 2.29 0.00 0.00 0.0009/20/2003 2.16 0.00 0.00 0.0009/21/2003 2.02 0.00 0.00 0.0009/22/2003 5.32 0.53 2.16 0.00 0.0009/23/2003 3.11 0.11 0.00 0.00 0.0009/24/2003 2.51 0.02 0.00 0.00 0.0009/25/2003 2.11 0.00 0.00 0.0009/26/2003 3.92 0.32 1.83 0.00 0.0009/27/2003 2.58 0.00 0.00 0.0009/28/2003 2.42 0.30 0.80 0.00 0.0009/29/2003 4.63 0.12 0.53 0.00 0.0009/30/2003 2.36 0.00 0.00 0.0010/01/2003 2.26 0.00 0.00 0.0010/02/2003 2.36 0.01 0.00 0.00 0.0010/03/2003 3.49 0.21 0.76 0.00 0.0010/04/2003 2.20 0.00 0.00 0.0010/05/2003 2.35 0.00 0.00 0.0010/06/2003 2.15 0.00 0.00 0.0010/07/2003 2.25 0.00 0.00 0.0010/08/2003 2.26 0.00 0.00 0.0010/09/2003 3.22 0.00 0.00 0.0010/10/2003 3.02 0.00 0.00 0.0010/11/2003 2.11 0.00 0.00 0.0010/12/2003 2.05 0.02 0.00 0.00 0.0010/13/2003 2.34 0.00 0.00 0.0010/14/2003 6.78 1.40 10.25 0.00 0.0010/15/2003 4.46 0.00 0.00 0.0010/16/2003 4.68 0.02 0.00 0.00 0.0010/17/2003 3.75 0.00 0.00 0.0010/18/2003 2.18 0.00 0.00 0.0010/19/2003 2.94 0.00 0.00 0.0010/20/2003 2.34 0.00 0.00 0.0010/21/2003 2.65 0.00 0.00 0.0010/22/2003 2.03 0.00 0.00 0.0010/23/2003 2.82 1.33 0.00 0.0010/24/2003 2.23 0.00 0.00 0.0010/25/2003 5.33 0.80 4.73 0.00 0.77
Page 45

Plant Bypass to CSO Lagoon CSO Lagoon Date Influent Flow Rain CSO Lagoon Overflow Return Pump
MGD inches hours MGD MGD
LaPorte CSO Overflow Data
10/26/2003 4.16 0.00 0.00 1.9310/27/2003 4.09 0.00 0.00 1.8210/28/2003 4.13 0.20 0.00 0.00 1.3810/29/2003 2.37 0.02 0.00 0.00 0.0410/30/2003 2.32 0.00 0.00 0.0010/31/2003 2.17 0.00 0.00 0.0011/01/2003 2.01 0.02 0.00 0.00 0.0011/02/2003 3.44 0.30 1.11 0.00 0.0011/03/2003 2.96 0.12 0.00 0.00 0.0011/04/2003 2.66 0.39 0.50 0.00 0.1211/05/2003 5.74 0.55 4.38 0.00 1.5011/06/2003 3.97 0.00 0.00 1.8911/07/2003 3.97 0.00 0.00 1.8611/08/2003 2.55 0.00 0.00 0.4611/09/2003 2.07 0.00 0.00 0.0011/10/2003 2.42 0.03 0.00 0.00 0.0011/11/2003 2.85 0.09 0.00 0.00 0.4711/12/2003 2.39 0.00 0.00 0.2411/13/2003 2.50 0.00 0.00 0.0011/14/2003 2.37 0.00 0.00 0.1211/15/2003 2.10 0.05 0.00 0.00 0.1411/16/2003 2.17 0.08 0.00 0.00 0.0511/17/2003 2.23 0.09 0.00 0.00 0.0011/18/2003 8.40 1.18 12.68 0.00 0.0011/19/2003 4.18 0.00 0.00 2.2411/20/2003 4.14 0.00 0.00 1.8411/21/2003 2.60 0.00 0.00 0.2711/22/2003 2.22 0.98 0.00 0.00 0.0011/23/2003 4.77 8.25 0.00 0.0011/24/2003 4.80 0.53 0.00 1.7611/25/2003 3.76 0.00 0.00 1.3711/26/2003 4.26 0.08 0.00 0.00 1.8311/27/2003 3.02 0.02 0.00 0.00 1.8311/28/2003 2.16 0.02 0.00 0.00 1.0311/29/2003 2.25 0.00 0.00 0.0111/30/2003 2.19 0.00 0.00 0.0012/01/2003 2.25 0.00 0.00 0.0012/02/2003 2.29 0.00 0.00 0.0012/03/2003 2.10 0.00 0.00 0.0012/04/2003 2.76 0.09 0.00 0.00 0.4012/05/2003 4.91 0.37 1.93 0.00 0.7012/06/2003 2.26 0.01 0.00 0.00 0.0012/07/2003 2.18 0.00 0.00 0.0012/08/2003 3.43 0.00 0.00 1.0912/09/2003 2.63 0.07 0.00 0.00 0.0012/10/2003 5.90 0.47 3.60 0.00 0.9812/11/2003 3.38 0.00 0.00 0.9312/12/2003 2.17 0.00 0.00 0.0012/13/2003 2.03 0.00 0.00 0.0012/14/2003 2.13 0.02 0.00 0.00 0.0012/15/2003 2.13 0.00 0.00 0.0012/16/2003 2.16 0.04 0.00 0.00 0.0012/17/2003 2.04 0.04 0.00 0.00 0.0012/18/2003 2.15 0.01 0.00 0.00 0.0112/19/2003 4.17 0.08 0.00 0.00 1.8012/20/2003 2.48 0.00 0.00 0.43
Page 46

Plant Bypass to CSO Lagoon CSO Lagoon Date Influent Flow Rain CSO Lagoon Overflow Return Pump
MGD inches hours MGD MGD
LaPorte CSO Overflow Data
12/21/2003 2.18 0.00 0.00 0.0012/22/2003 2.22 0.00 0.00 0.0112/23/2003 2.40 0.63 0.00 0.00 0.0012/24/2003 2.13 0.04 0.00 0.00 0.0012/25/2003 1.77 0.00 0.00 0.0012/26/2003 1.97 0.00 0.00 0.0012/27/2003 2.30 0.00 0.00 0.0012/28/2003 3.40 0.16 0.00 0.00 0.4512/29/2003 4.31 0.08 0.00 0.00 0.8612/30/2003 2.43 0.00 0.00 0.3312/31/2003 1.95 0.00 0.00 0.0001/01/2004 2.10 0.10 0.00 0.00 0.2101/02/2004 1.95 0.02 0.00 0.00 0.0001/03/2004 2.55 0.00 0.00 0.5501/04/2004 2.12 0.18 0.00 0.00 0.0001/05/2004 2.44 0.16 0.00 0.00 0.0001/06/2004 2.05 0.00 0.00 0.0001/07/2004 1.99 0.00 0.00 0.0001/08/2004 2.17 0.00 0.00 0.0001/09/2004 2.13 0.00 0.00 0.0001/10/2004 1.97 0.00 0.00 0.0001/11/2004 2.29 0.00 0.00 0.3101/12/2004 4.29 0.02 0.00 0.00 1.8701/13/2004 2.82 0.00 0.00 0.7901/14/2004 1.96 0.00 0.00 0.0001/15/2004 2.17 0.07 0.00 0.00 0.0001/16/2004 2.00 0.00 0.00 0.0001/17/2004 1.89 0.11 0.00 0.00 0.0001/18/2004 2.00 0.17 0.00 0.00 0.0601/19/2004 2.11 0.23 0.00 0.00 0.0001/20/2004 2.18 0.01 0.00 0.00 0.0001/21/2004 2.16 0.00 0.00 0.0001/22/2004 2.11 0.03 0.00 0.00 0.0001/23/2004 1.95 0.16 0.00 0.00 0.0001/24/2004 2.11 0.00 0.00 0.0001/25/2004 1.95 0.00 0.00 0.0001/26/2004 1.97 0.01 0.00 0.00 0.0001/27/2004 2.07 0.28 0.00 0.00 0.0001/28/2004 2.04 0.00 0.00 0.0001/29/2004 2.08 0.01 0.00 0.00 0.0001/30/2004 2.07 0.00 0.00 0.0001/31/2004 1.96 0.00 0.00 0.0002/01/2004 2.48 0.00 0.00 0.5702/02/2004 2.38 0.17 0.00 0.00 0.0602/03/2004 2.32 0.03 0.00 0.00 0.0002/04/2004 2.42 0.00 0.00 0.2802/05/2004 2.58 0.07 0.00 0.00 0.3602/06/2004 3.10 0.03 0.00 0.00 0.9102/07/2004 3.51 0.19 0.00 0.00 1.2902/08/2004 2.41 0.00 0.00 0.3702/09/2004 2.23 0.00 0.00 0.0002/10/2004 2.11 0.02 0.00 0.00 0.0002/11/2004 2.35 0.00 0.00 0.0002/12/2004 2.26 0.00 0.00 0.0002/13/2004 2.18 0.00 0.00 0.0002/14/2004 2.21 0.00 0.00 0.00
Page 47

Plant Bypass to CSO Lagoon CSO Lagoon Date Influent Flow Rain CSO Lagoon Overflow Return Pump
MGD inches hours MGD MGD
LaPorte CSO Overflow Data
02/15/2004 1.99 0.00 0.00 0.0002/16/2004 2.06 0.00 0.00 0.0002/17/2004 2.09 0.00 0.00 0.0002/18/2004 2.30 0.00 0.00 0.0002/19/2004 2.90 0.00 0.00 0.0002/20/2004 4.31 0.25 1.28 0.00 0.2702/21/2004 4.70 0.13 0.00 0.00 1.8402/22/2004 3.47 0.00 0.00 0.9502/23/2004 2.40 0.04 0.00 0.00 0.0002/24/2004 2.25 0.00 0.00 0.0002/25/2004 2.26 0.00 0.00 0.0002/26/2004 2.41 0.00 0.00 0.0002/27/2004 2.15 0.00 0.00 0.0002/28/2004 2.05 0.00 0.00 0.0002/29/2004 2.15 0.00 0.00 0.0003/01/2004 5.69 0.81 6.40 0.00 0.5503/02/2004 4.24 0.00 0.00 1.8303/03/2004 3.78 0.05 0.00 0.00 1.4603/04/2004 4.25 0.96 6.26 0.00 0.3103/05/2004 5.92 0.33 6.03 0.00 1.3103/06/2004 3.98 0.00 0.00 1.8403/07/2004 4.04 0.09 0.00 0.00 1.8103/08/2004 4.05 0.00 0.00 1.8003/09/2004 3.23 0.00 0.00 1.0403/10/2004 2.20 0.00 0.00 0.0003/11/2004 2.71 0.02 0.00 0.00 0.5903/12/2004 2.14 0.00 0.00 0.0003/13/2004 2.02 0.00 0.00 0.0003/14/2004 2.10 0.07 0.00 0.00 0.0003/15/2004 2.84 0.01 0.00 0.00 0.7503/16/2004 2.09 0.00 0.00 0.0003/17/2004 2.65 0.06 0.00 0.00 0.0003/18/2004 2.81 0.13 0.00 0.00 0.2003/19/2004 3.26 0.00 0.00 0.8503/20/2004 2.20 0.02 0.00 0.00 0.0003/21/2004 2.22 0.09 0.00 0.00 0.0003/22/2004 2.34 0.01 0.00 0.00 0.0003/23/2004 3.19 0.00 0.00 0.4303/24/2004 4.13 0.23 0.56 0.00 0.7503/25/2004 3.19 0.28 0.08 0.00 0.0003/26/2004 5.58 0.49 3.68 0.00 0.9603/27/2004 4.04 0.00 0.00 1.7703/28/2004 2.85 0.15 0.00 0.00 0.8503/29/2004 2.63 0.00 0.00 0.0003/30/2004 3.96 0.60 2.93 0.00 0.2903/31/2004 3.53 0.00 0.00 1.4404/01/2004 3.32 0.00 0.00 1.1604/02/2004 2.10 0.00 0.00 0.0004/03/2004 1.91 0.00 0.00 0.0004/04/2004 1.85 0.00 0.00 0.0004/05/2004 3.15 0.00 0.00 0.9304/06/2004 2.76 0.00 0.00 0.7004/07/2004 1.99 0.00 0.00 0.0004/08/2004 2.24 0.00 0.00 0.0004/09/2004 1.94 0.00 0.00 0.0004/10/2004 1.92 0.00 0.00 0.00
Page 48

Plant Bypass to CSO Lagoon CSO Lagoon Date Influent Flow Rain CSO Lagoon Overflow Return Pump
MGD inches hours MGD MGD
LaPorte CSO Overflow Data
04/11/2004 1.95 0.00 0.00 0.0004/12/2004 2.08 0.00 0.00 0.0104/13/2004 3.37 0.00 0.00 1.1704/14/2004 2.92 0.00 0.00 0.7304/15/2004 2.22 0.00 0.00 0.0004/16/2004 1.98 0.00 0.00 0.0004/17/2004 4.90 0.51 2.18 0.00 1.6304/18/2004 2.74 0.00 0.00 0.8104/19/2004 2.07 0.00 0.00 0.0004/20/2004 3.36 0.13 0.00 0.00 0.7304/21/2004 2.21 0.00 0.00 0.0504/22/2004 2.22 0.00 0.00 0.0004/23/2004 2.32 0.00 0.00 0.0004/24/2004 2.32 0.00 0.00 0.3304/25/2004 4.16 0.41 2.01 0.00 0.9904/26/2004 2.32 0.02 0.00 0.00 0.0004/27/2004 2.05 0.00 0.00 0.0004/28/2004 2.04 0.00 0.00 0.0004/29/2004 3.04 0.00 0.00 0.8004/30/2004 2.83 0.41 1.85 0.00 0.0005/01/2004 4.57 0.39 1.13 0.00 1.1305/02/2004 3.14 0.11 0.00 0.00 0.0205/03/2004 2.15 0.00 0.00 0.0005/04/2004 2.08 0.00 0.00 0.0005/05/2004 2.09 0.00 0.00 0.0005/06/2004 2.74 0.00 0.00 0.7405/07/2004 2.44 0.05 0.00 0.00 0.3105/08/2004 1.97 0.00 0.00 0.0005/09/2004 1.98 0.05 0.00 0.00 0.0805/10/2004 3.95 0.37 3.08 0.00 0.4605/11/2004 4.59 0.00 0.00 2.1505/12/2004 2.44 0.11 0.00 0.00 0.4205/13/2004 4.39 0.37 1.63 0.00 0.6205/14/2004 4.68 0.64 3.26 0.00 1.1005/15/2004 3.50 0.02 0.00 0.00 1.5405/16/2004 1.95 0.00 0.00 0.0005/17/2004 2.27 0.00 0.00 0.0005/18/2004 4.20 0.49 1.85 0.00 0.7205/19/2004 3.29 0.00 0.00 1.1605/20/2004 2.75 0.26 0.00 0.00 0.4405/21/2004 5.18 0.25 3.05 0.00 1.2405/22/2004 4.60 0.46 2.86 0.00 1.3305/23/2004 4.15 0.30 0.90 0.00 1.8705/24/2004 3.93 0.45 0.00 0.9405/25/2004 5.04 0.44 2.40 0.00 1.6305/26/2004 2.43 2.08 0.00 0.3105/27/2004 3.22 0.00 0.00 0.9705/28/2004 2.28 0.00 0.00 0.0605/29/2004 2.27 0.00 0.00 0.0005/30/2004 4.85 1.26 5.31 0.00 0.6005/31/2004 6.07 0.48 1.83 0.00 2.3006/01/2004 5.24 0.00 0.00 2.8706/02/2004 4.66 0.00 0.00 2.4406/03/2004 3.35 0.00 0.00 1.0606/04/2004 2.19 0.00 0.00 0.0006/05/2004 2.23 0.00 0.00 0.00
Page 49

Plant Bypass to CSO Lagoon CSO Lagoon Date Influent Flow Rain CSO Lagoon Overflow Return Pump
MGD inches hours MGD MGD
LaPorte CSO Overflow Data
06/06/2004 2.13 0.00 0.00 0.0306/07/2004 2.38 0.00 0.00 0.0406/08/2004 2.29 0.00 0.00 0.0406/09/2004 3.06 0.00 0.00 0.8706/10/2004 4.16 0.88 2.78 0.00 0.0806/11/2004 6.94 0.39 4.45 0.00 1.9406/12/2004 6.59 1.18 5.36 0.00 2.0306/13/2004 5.20 0.21 0.90 0.00 2.5006/14/2004 5.89 0.27 2.81 0.00 2.3406/15/2004 4.97 0.00 0.00 2.7106/16/2004 3.91 0.00 0.00 1.5906/17/2004 2.39 0.02 0.00 0.00 0.0006/18/2004 2.64 0.00 0.00 0.5006/19/2004 3.21 0.00 0.00 0.9706/20/2004 2.00 0.00 0.00 0.0006/21/2004 3.62 0.35 1.61 0.00 0.3406/22/2004 3.18 0.00 0.00 0.8506/23/2004 2.27 0.00 0.00 0.0006/24/2004 2.41 0.00 0.00 0.0006/25/2004 2.37 0.00 0.00 0.0006/26/2004 2.13 0.00 0.00 0.0006/27/2004 3.00 0.00 0.00 0.9206/28/2004 3.33 0.04 0.00 0.00 0.9906/29/2004 2.28 0.00 0.00 0.0006/30/2004 2.27 0.00 0.00 0.0007/01/2004 2.54 0.00 0.00 0.0007/02/2004 2.26 0.00 0.00 0.0007/03/2004 3.29 1.83 0.00 0.3207/04/2004 4.39 1.00 0.00 1.4107/05/2004 2.05 0.00 0.00 0.0007/06/2004 2.96 8.75 0.00 0.6707/07/2004 4.12 0.00 0.00 1.8207/08/2004 2.87 0.00 0.00 0.6007/09/2004 2.24 0.00 0.00 0.0007/10/2004 2.55 0.53 0.00 0.0707/11/2004 3.62 1.77 0.00 0.8007/12/2004 3.29 0.00 0.00 1.0807/13/2004 3.66 2.40 0.00 0.6907/14/2004 5.40 0.60 0.00 2.5707/15/2004 4.19 0.00 0.00 1.8707/16/2004 4.27 1.62 0.00 1.1207/17/2004 2.89 0.00 0.00 0.5307/18/2004 2.90 0.00 0.00 0.7807/19/2004 3.22 0.00 0.00 0.8907/20/2004 3.10 0.00 0.00 0.9007/21/2004 4.10 5.58 0.00 0.1907/22/2004 6.35 2.13 0.00 2.4407/23/2004 4.90 0.00 0.00 2.8007/24/2004 4.53 0.00 0.00 2.4607/25/2004 4.12 0.00 0.00 2.0007/26/2004 3.17 0.00 0.00 0.8107/27/2004 2.41 0.00 0.00 0.2107/28/2004 2.39 0.00 0.00 0.0107/29/2004 2.32 0.00 0.00 0.0007/30/2004 3.35 0.00 0.00 0.8907/31/2004 2.21 0.00 0.00 0.02
Page 50

United States Department of the Interior Fish and Wildlife Service
Mr. James McMahon City of LaPorte WWTP 2101 Boyd Boulevard LaPorte, Indiana 46350
Bloomington Field Office (ES) 620 South Walker Street
Bloomington, IN 47403-2121 Phone: (812) 334-4261 Fax: (812) 334-4273
April 20, 2004
Project: Waterway:
LaPorte CSO Long Term Control Plan Travis/Long Ditch
Location: LaPorte, LaPorte County
Dear Mr. McMahon:
This responds to your e-mail dated April 9, 2004, requesting our comments on the aforementioned project.
These comments have been prepared under the authority of the Fish and Wildlife Coordination Act (16 U.S.C. 661 et. seq.) and are consistent with the intent of the National Environmental Policy Act of 1969, the Endangered Species Act of 1973, and the U. S. Fish and Wildlife Service's Mitigation Policy.
The City of LaPorte is currently evaluating its combined sanitary/storm sewer system and the impacts of discharges from this system on the receiving stream, TraYis Ditch (called Long Ditch for about its last 3 miles before the confluence with the Kankakee River). Pollution abatement options are being considered. You have requested information on federally endangered species or other significant resources in the project area which may be affected by combined sewer discharges and abatement options.
The proposed project is within the range of the Federally endangered Indiana bat (Myotis sodalis) and Mitchell's satyr butterfly(Neonympha mitchelli) and the threatened bald eagle (Haliaeetus leucocephalus).
The Mitchell's satyr is found in a specific wetland within LaPorte County and is not located near the City of LaPorte or along Travis/Long Ditch.
Bald eagles do not currently nest in northern Indiana. However, they may be seen occasionally in LaPorte County as incidental visitors, particularly during the winter. There is no specific habitat available for this species along Travis Ditch, although bald eagles are often observed in appropriate habitats along the Kankakee River, including Kingsbury State Fish and Wildlife Area.
The Indiana bat utilizes wooded riparian areas and adjacent wooded uplands as its summer nursery habitat. Maternity colonies roost under loose bark of trees and feed along stream corridors. Adult female Indiana bats exhibit strong site fidelity to summer roosting and foraging areas; that is, they return to the same summer range annually to bear their young. The have been found throughout Indiana in suitable habitats and may be present along Travis Ditch in the project area.

2.
During summer 2000, mist net surveys for Indiana bats were conducted at the Kingsbury Local Training Area, in the southcentral portion of the former Kingsbury Ordinance Plant, at the former Army Reserve Center along Hupp Road, and at the former White Oak Park, also along Hupp Road. No Indiana bats were found. However, no surveys were conducted along Travis Ditch, which contains suitable habitat along several miles of its length, particularly in the section between CR 500 South and US 35, but also possibly between CR 300 South and CR 500 South.
Based upon mist netting surveys along the Kankakee River in 1982, it is known that Indiana bats are present at the Kingsbury State Fish and Wildlife Area. The survey site was at the mouth of Breckenridge Ditch where CR 600 East meets the Kankakee River, so it is 5 or more miles east of the suitable habitat along Travis Ditch. Adult female Indiana bats are known to fly as much as 2.5 miles from the roost tree while foraging for food at night. Therefore, it is unlikely that a maternity colony near Breckenridge Ditch would utilize Travis Ditch. However, it is not unlikely that there could be additional Indiana bat colonies elsewhere within Kingsbury State Fish and Wildlife Area and adjacent private lands, particularly along or near Travis Ditch.
Although CSO discharges would not directly impact Indiana bat habitat, water pollution could impact the bat's insect food source. Reducing pollution discharges could therefore benefit this species if it is present.
The proposed project is also within the range of the eastern massasauga rattlesnake (Sistrurus catenatus catenatus), which has been listed as a Candidate for possible future listing as either threatened or endangered. Candidate species are those for which sufficient information on their biological status exists to warrant listing but for which listing has not yet occurred. Although this species is present in LaPorte County, it is not known from the City of LaPorte or the area along Travis/Long Ditch.
These endangered species comments constitute informal consultation only. They do not fulfill the requirements of Section 7 of the Endangered Species Act of 1973, as amended.
There is a Wetland Reserve Program (WRP) wetland near the confluence of Travis/Long Ditch with the Kankakee River, and several others in Starke County just downstream along the Kankakee. Although waterfowl hunting and other similar uses occur at these areas, and fishing occurs at the Travis/Long Ditch site, we do not know if there is primarily contact water use as well. Please contact Theresa Wojkovich at the LaPorte County office of the USDA Natural Resources Conservation Service for information about these WRP sites.
We appreciate the opportunity to comment at this early stage of project planning. If you have any questions about our comments, please contact Elizabeth McCloskey at (219) 983-9753 or elizabeth [email protected].
Sincerely yours,
~__;-led:;;rr;/ff~ ~~- Pruitt ~(/ t/~Supervisor - 0/
cc: Dave Tennis, IDEM, Office of Water Management, Indianapolis, IN Christie Kiefer, Environmental Coordinator, Division of Water, Indianapolis, IN Peter Swenson, USEPA, NPDES Programs Branch, WN-16J, Chicago, IL Theresa Wojkovich, NRCS, LaPorte, IN

From: [email protected] <[email protected]>
Subject: Fw: City of La Porte, IN sensitive areas query
Date: Fri, 09 Apr 2004 14:36:10-0500
To: James McMahon <[email protected]> <Holst. [email protected]> <[email protected]>
CC:
BCC:
Mr. McMahon, (also Bill Spaulding, and Linda Holst)
Thank you for your inquiry on sensitive areas.
I don't believe generally, that USEPA will have much information relating to sensitive areas in Travis Ditch, but have a few suggestions:
It's possible that USEPA may have information on drinking water sources and I am copying Bill Spaulding of our Drinking Water Branch to see if that is the case, or if he can suggest other sources of information. IDEM may have additional information.
On threatened or endangered species I recommend that you contact the U.S. Fish and Wildlife Service.
IDEM may be the best source of information on OSRW and ONRW, but I am also copying Linda Holst of our Water Quality Branch to see if we have any information on this.
Information on recreational uses and access is usually developed locally, and IDEM has good guidance on how this should be done.
If I get more information I will forward this to you.
Thank you Peter Swenson USEPA, Region 5
----- Forwarded by Peter Swenson/R5/USEPNUS on 04/09/2004 01:45 PM
Mike Joyce To:
04/09/2004 01:40 Peter Swenson/R5/USEPNUS@EPA cc:
PM Subject: Fw: City of La Porte, IN sensitive areas query
Hi Peter. This is Mike Joyce in Public Affairs forwarding you this request for info.

From: [email protected] <[email protected]>
Subject: Re: Fw: City of La Porte, IN sensitive areas query
Date: Fri, 09 Apr 2004 15:12:21 -0500
To: <[email protected]>
CC: James McMahon <[email protected]> <[email protected]>
BCC:
Peter,
We don't have any information on file regarding delineated source water areas. Completing source water assessments is the responsibility of the Indiana Department of Environmental Management. For information on source water assessment areas intersecting Travis Ditch, I recommend that he contact Mr. Jim Sullivan of I OEM at (317) 308-3322. The City of LaPorte water department may also have local assessment information on hand for their system.
Bill Spaulding
Peter Swenson To:
04/09/04 02:36PM cc:
James McMahon <[email protected]>, Linda Holst/R5/USEPA/US@EPA, William Spaulding/R5/USEPA/US@EPA
Subject: Fw: City of La Porte, IN sensitive areas query
Mr. McMahon, (also Bill Spaulding, and Linda Holst)
Thank you for your inquiry on sensitive areas.
I don't believe generally, that USEPA will have much information relating to sensitive areas in Travis Ditch, but have a few suggestions:
It's possible that USEPA may have information on drinking water sources and I am copying Bill Spaulding of our Drinking Water Branch to see if that is the case, or if he can suggest other sources of information. IDEM may have additional information.
On threatened or endangered species I recommend that you contact the U.S. Fish and Wildlife Service.
IDEM may be the best source of information on OSRW and ONRW, but I am also copying Linda Holst of our Water Quality Branch to see if we have any information on this.

From: Mac Carlisle <[email protected]> Subject: RE: City of La Porte sensitive area determination
Date: Mon, 12 Apr 2004 11:16:33 -0500 To: James McMahon <[email protected]> CC:
BCC:
I do not believe a "sensitive" area exists along the portion of Travis Ditch that passes through Area 6 and 8 of the Kingsbury Fish & Wildlife Area however:
Franklin's Ground Squirrels (state endangered) have been documented within a three mile distance from the ditch.
Indiana bat (federal endangered) habitat exists in the entire state.
Massasauga Rattlesnake (state endangered) is listed for LaPorte County.
· A Great Blue Heron rookery exists along the ditch in area 8 but this is not an endangered or threatened bird.
Hope this information helps.
Mac Carlisle Property Manager- Kingsbury F&W Area
-----Original Message-----From: James McMahon [mailto:[email protected]] Sent: Friday, April 09,200412:17 PM To: [email protected] Subject: City of La Porte sensitive area determination
Hello,
My name is James McMahon and I work for, the City of La Porte Wastewater Treatment Plant. We are a CSO (combined sewer overflow) community and are in the process of refining our L TCP (long term control plan) which is aimed at eliminating all but the most extreme wet-weather CSO events. Our discharge flows into Travis Ditch, then proceeds south to the Kankakee River. In our consultations with IDEM

Government Complex 809 State Street- Suite 401 A LaPorte, Indiana 46350-3385
Jim McMahon Wastewater Treatment Operator 2101 Boyd Blvd LaPorte, IN 46350
Re: CSO sensitive areas
April15, 2004
Dear Mr. McMahon,
(219) 326-6808 (219) 879-9383 (219) 325-8628
Charles Janovsky, M.D., Health Officer, Paul E. Trost, Administrator
The LaPorte County Health Department received a request from your department for us to research any "sensitive areas" along Travis Ditch. The Health Department does not sample any bathing beaches in this area, as it is mostly agricultural farmland. We do not know of any other sensitive areas along this ditch.
Sincerely,
Ann Klute Environmental Planner

Bulletin 71 (MCC Resear~h Report 92-03)
RAINFALL FREQUENCY ATLAS OF THE MIDWEST
by Floyd A. Huff and James R. Angel
Midwestern Climate Center Climate Analysis Center
National Weather Service National Oceanic and Atmospheric Administration
and
Illinois State Water Survey A Division of the Illinois Department of Energy and Natural Resources
1992

Table 2. Sectional Mean Frequency Distributions for Storm Periods of 5 Minutes to 10 Days and Recurrence Intervals of 2 Months to 100 Years in Indiana
Sectional code (see figure 1 on page 4)
01- Northwes 06- East Central 02- North Central 07- Southwest 03- Northeast 08- South Central 04 - West Central 09- Southeast 05- Central
·Rainfall (inches) for given recurrence interval
Section Duration 2-month 3-month 4-month 6-month 9-month 1-year 2-year 5-year 10-year 25-year 50-year I 00-year
01 01
01
01 01 01 01
01 01
01 01
01 01 01
01
02 02
02
02 02
02
02 02
02 02
02 02 02 02
02
03
03
03 03 03
03
03 03
03
03
03 03
03
03 03
118
10-day 5-day
72-hr 48-hr
24-hr 18-hr 12-hr
6-hr 3-hr
2-hr 1-hr
30-min
15-min 10-min
5-min
10-day
5-day 72-hr
48-hr 24-hr
18-hr 12-hr 6-hr
3-hr
2-hr 1-hr
30-min 15-min 10-min
5-min
10-day
5-day
72-hr 48-hr
24-hr 18-hr
12-hr 6-hr
3-hr
2-hr 1-hr
30-min 15-min
10-min
5-min
2.07 2.50 1.68 2.01
1.53 1.80 1.40 1.64
1.33 1.55 1.25 1.45
1.16 1.35 1.00 1.16
0.85 0.99 0.77 0.90
0.63 0.73
0.50 0.58 0.36 0.42 0.28 0.33
0.16 0.19
2.04 2.45
1.68 2.01
1.48 1.74 1.37 1.60 1.30 1.51 1.22 1.42 1.13 1.31 0.97 . 1.13
0.83 0.97 0.75 0.88 0.61 0.71
0.48 0.56 0.35 0.41
. 0.28 0.32
0.15 0.18
1.81 2.18
1.52 1.82
1.35 1.59 1.27 1.48
1.19 1.38
1.12 1.30
1.03 1.20 0.89 1.04
0.76 0.88
0:69 0.80
0.56 0.65 0.44 0.51
0.32 0.37
0.25 0.29 0.14 0.17
2.88 2.27
2.04
1.83
1.69 1.59 1.48 1.27
1.08
0.98 0.80
0.63 0.45 0.36 0.20
2.83
2.28
1.97 1.78 1.65 1.55 1.43
1.24
1.06 0.96
0.78 0.61 0.45
0.35 0.20
2.52
2.06
1.79 1.65 1.51
1.42
1.32
1.13
0.97 0.88
0.71 0.56
0.41
0.31
0.18
3.38 2.63 2.36
2.12
1.96 1.84
1.71 1.47
1.26
1.13 0.92
0.73 0.53 0.41
0.23
3.33 2.64
2.28 2.06 1.91
1.80
1.66 1.43
1.22 1.11
0.90
0.70 0.52
0.41
0.23
2.96 2.38
2.08 1.91 1.75
1.64
1.52 1.31 .
1.12
1.01
0.83 0.65
0.47 0.36 0.21
3.89
3.03 2.71
2.44 2.23 2.09
1.94
1.67 1.43 1.29
1.05
0.83 0.60 0.47 0.27
3.83 3.04
2.62 2.37 2.17
2.04
1.89 1.63
1.39 1.26 1.02
0.80 0.59
0.46 0.26
3.40 2.74
2.39 2.20 1.99
1.87 1.73
1.49 1.27
1.15
0.94 0.74
0.53 0.41 0.24
4.23
3.29 2.95
2.65 2.42 2.27 2.11
1.82
1.55 1.40 1.14
0.90 0.65 0.51 0.29
4.16
3.30 2.85 2.58 2.36
2.22 2.05
1.77
1.51 1.37 1.11
0.87 0.64
0.50 0.28
3.70 2.98
2.60 2.39 2.16
2.03
1.68 1.62
1.38 1.25 1.02 0.80
0.58
0.45 0.26
4.84 3.84
3.46 3.12 2.89 2.72 2.51
2.17
1.85 1.68
1.36
1.07 0.78 0.61
0.35
4.75
3.80 3.33 3.02 2.78
2.61 2.42
2.09
1.78 1.61 1.31
1.03 0.75
0.58
0.33
4.25
3.46
3.01 2.77
2.52
2.37
2.19
1.89 1.61
1.46
1.18 0.93
0.68
0.53 0.30
5.79 4.70
4.24
3.87 3.61 3.39 3.14
2.71
2.31 2.09
1.70 1.34
0.97 0.76
0.43
5.64
4.62 4.10
3.73 3.43 3.22 2.98 2.57
2.20
1.99 1.61
1.27 0.93
0.72 0.41
5.12
4.18
3.68 3.38 3.04 2.86
2.64 2.28
1.95
1.76 1.43 1.12 0.82
0.64
0.36
6.67
5.50 4.97 4.56
4.22 3.97
3.67 3.16
2.70 2.45
1.98 1.56
1.14 0.89 0.51
6.45
5.38 4.79
4.36 4.00
3.76 3.48
3.00 2.56 2.32
1.88
1.48 1.08 0.84
0.48
5.84
4.81
4.27 3.92
3.52 3.31
3.06 2.64
2.25 2.04
1.65 1.30
0.95 0.74
0.42
8.03 6.81
6.10
5.58 5.22 4.91 4.54
3.91 3.34
3.03 2.45
1.93 1.41 1.10
0.63
7.69
6.57
5.88 5.36 4.90 4.61
4.26
3.68 3.14
2.84 2.30 1.81 1.32
1.03
0.59
6.96
5.83
5.21 4.78
4.29 4.03
3.73 3.22
2.75
2.49 2.02 1.59
1.16
0.90 0.51
9.23 7.99
7.17 6.52
6.10 5.73 5.31
4.57
3.90 3.54 2.87
2.26
1.65 1.28
0.73
8.80
7.63
6.86 6.25 5.67
5.33 4.93 4.25
3.63 3.29 2.66
2.10 1.53
1.19
0.68
. 8.01
6.76
6.06 5.57
5.02 4.72
4.37 3.76
3.21
2.91
2·.36 1.86
1.36
1.05 0.60
10.58 9.37
8.38
7.58 7.12 6.69 6.19 5.34
4.56
4.13 3.35 2.63
1.92 1.50
0.85
10.03
8.85
8.00 7.28 6.54
6.15
5.69 4.90
4.19
3.79 3.07 2.42 1.77
1.37
0.78
9.16
7.80
7.01 6.45
5.77 5.42
5.02
4.33
3.69
3.35 2.71 2.13 1.56
1.21
0.69

RAINFALL- 1 YEAR FREQUENCY- 12 HOUR DURATION
N
+
REFERENCE TECHNICAL PAPER NO. 40
NATIONAL WEATHER SERVICE
2.00" Lagrange Steuben
Adams
Randolph
Montgomery
Heney
-..----"'Hendricks Marion
Putnam
_ ..... ~ .... --.... Shelby
Johnson
30 Miles ~~~~ 0 10 20
STATE OF INDIANA DEPARTMENT OF NATURAL RESOURCES
DIVISION OF WATER INDIANA DEPAilTMENT OF NATURAL RESOURCES

RAINFALL- 5 YEAR FREQUENCY- 3 HOUR DURATION
N
+
REFERENCE TECHNICAL PAPER NO. 40
NATIONAL WEATHER SERVICE
2.50"
2.20" Lagrange
Adams
Jay
0 10 20 30 Miles ~~~~
STATE OF INDIANA DEPARTMENT OF NATURAL RESOURCES
DIVISION OF WATER INDIANA DEPAilTMENT OF NATURAL RESOURCES

RAINFALL- 10 YEAR FREQUENCY- 3 HOUR DURATION
N
+
REFERENCE TECHNICAL PAPER NO. 40
NATIONAL WEATHER SERVICE
2.50" Lagrange
Adams
Randolph
Hancock
_ ....... --.... Shelby
0 10 20 30 Miles ~~~~
STATE OF INDIANA DEPARTMENT OF NATURAL RESOURCES
DIVISION OF WATER INDIANA DEPAilTMENlOF NATURAL R5SOURC£S

RAINFALL- 10 YEAR FREQUENCY- 12 HOUR DURATION
N
+
REFERENCE TECHNICAL PAPER NO. 40
NATIONAL WEATHER SERVICE
3.40" 3.30" Elkhart Lagrange Steuben
3.30"
Randolph
0 10 20 30 Miles ~~~~
STATE OF INDIANA DEPARTMENT OF NATURAL RESOURCES
DIVISION OF WATER INDIANA DEPAilTMENT OF NATURAL RESOURCES

LAPORTE (INDIANA) MUNICIPAL SEWAGE WORKS
SCHEDULE OF ESTIMATED REVENUE VERSUS
REVENUE REQUIREMENTS
Current Sewer Separation
Project ($110M)
CSO Disinfection
Estimated Revenue Requirements· Proforma operating expense Normal capita! improvements (I) Average annual debt service ~ outstanding Bonds Pmposed 2006 Bonds ~ Capital Improvement Plan Proposed Bonds~ Long Term Control Plan (3) Funding of Debt Service Reserve Fund balance build~up (4)
Total estimated revenue requirements
Esllmated Annual Revenue Residential revenue Commercia! revenue Septic hauler revenue Industrial revenue Surcharge revenue Governmental revenues Institutional revenues Miscellaneous revenues Industria! fines & fees Penalties Interest income
Total estimated annual revenue
Esttmated additional revenue required
Percentage increase required
Monthly bii!ing- S/8" meter- 5,000 gallons Current Operations Increase LTCP Increase
Current Bill
ll) Per Budget Form 1 per the sewer superintendent.
(2) Assumes a $3,170,000 Bond 1ssue over 15 years at 5.0%
(3) Assumes 20 year bond 1ssues at 5.5%
(4) Assumes a $210,130 buildup over 3 years.
~i!m.§
$2,193,432 349,000
563,500 305,405
61,081 70,043
$3,542,461
$1,564,971 680,149
44,309 356,497
81,750
92,777 248,526
11,473 2,089
48,688
8,624 $3,139 853
$402,608
13.5%
Estimated Bill
$22.78 $2.70 $0.00
$2,193,432 349,000
563,500
305,405 5,941,232 ),249,327
70,043 $10,671,940
$1,564,971 680,149
44,309 356,497
81,750
92,777 248,526
11,473 2,089
48,688
8,624 $3,139,853
$7,532,087
~
Estimated Bill
$70.64 $2.70
$47.85
~ ($27M)
$2,193,432 349,000
563,500 305,405 225,934
106,268 70,043
$3,813,582
$1,564,971 680,149
44,309 356,497
81,750 92,777
248,526 11,473 2,089
48,688
8,624
$3,139,853
$673,729
~
Estimated Bill
$24.60 $2.70
!Ul
Capture & Treat Project
($L9MJ
$2,193,432 349,000
563,500 305,405
158,991
92,879 70,043
$3,733 250
$1,564.971 680,!49
44,309 356,497
8!,750 92,777
248,526 11,473 2,089
48,688
8,624 $3,139,853
$593,397
!9.8%
Estimated
Iill!
$2406 $2 70
1!1.!.
Clean CSO
l&W!n ($20M)
$2,193,432 349,000
563,500
305,405 167,359
94,553 70,043
$3,743,291
$U64.971 680,149
44,309 356,497
81,750 92,777
248,526 11,473 2,089
48,688 8,624
$3,139,853
$603,438
20_2%
Estimated
Bm
lliJl $2.70 $135

INDIANADEPARTMENTOFENVIRONMENTALMANAGEMENT We make Indiana a cleaner, healthier place to live
--Frank 0 'Bannon Governor
100 North Senate Avenue
Lori F. kaplan Commissioner
June 27, 2001
P_O Box 6015 lndia,-,apolis, Indiana 46206-6015 (317) 232-8603 (800) 451-6027 www.state .in. us/idem
VIA CERTIFIED MAll.. 7000 0600 0026 8341 1329 The Honorable Kathleen Chroback, Mayor City of LaPorte 801 Michigan A venue LaPorte, Indiana 46350
Dear Mayor Chroback: Re: Adoption of Agreed Order and
Issuance of Final Order Commissioner, Indiana Department of Environmental Management
v. City of LaPorte Case No. 2000-9996-W
This letter is to inform you that the Commissioner of the Indiana Department of Environmental Management (the Department) has approved the Agreed Order negotiated between you and members of my staff and has issued same as the Department's Final Order. A copy of the executed Final Agreed Order is enclosed.
As to civil penalties provided for in the document, please forward the check made payable to the Environmental Management Special Fund marked: Cashier, Indiana Department of Environmental Management, P.O. Box 7060, Indianapolis, Indiana 46207-7060, within thirty days of receipt of this correspondence. To insure proper processing, please reference the case number of this action with your payment.
You are no doubt familiar with the other terms of the Agreed Order to assure future compliance. Thank you for your cooperation. If there are any questions, please contact Mr. Paul Cluxton of my staff at 317/232-8432.
Enclosure cc: Mr. Donald Baugher, City Attorney
Mr. Jerry Jackson, Superintendent LaPorte County Health Department
Sincerely, ~_/4'-r-._; CJ6;--k <'/--'
~Mark W. Sta~ifer, Chief Water Enforcement Section Office of Enforcement
U.S. EPA, Region V, Water Division, Enforcement Unit II
.. An Equal Opportunity Employer Pl,.a.u RtcJclr '--'

Frank 0 'Bannon Governor
Lori F. kaplan Commissioner
INDIANADEPARTMENTOFENVIRONMENTALMANAGEMENT We make Indiana a cleaner, healthier place to live
--1 00 North Senate Avenue P.O. Box6015 Indianapolis, Indiana 46206-6015 (317) 232-8603 (800) 451-6027 www.state.in.us/idem
STATE OF INDIANA ) ) )
BEFORE THE INDIANA DEPARTMENT SS: OF ENVIRONMENTAL MANAGEMENT
COUNTY OF MARION
COMMISSIONER OF THE DEPARTMENT OF ENVIRONMENTAL MANAGEMENT,
) ) ) ) ) ) ) ) ) )
Complainant,
v. Case No. 2000-9996-W
CITY OF LAPORTE,
Respondent.
AGREED ORDER
The Complainant and the Respondent desire to settle and compromise this action without hearing or adjudication of any issue of fact or law, and consent to the entry of the following Findings of Fact and Order.
I. FINDINGS OF FACT
1. Complainant is the Commissioner ("Complainant") ofthe Indiana Department of Environmental Management, a department of the State of Indiana created by IC 13-13-1-1.
2. Respondent is the City of LaPorte ("Respondent"), having its main business office located at 801 Michigan A venue, LaPorte, Indiana. Respondent operates the publicly owned 7.0 MGD trickling filter wastewater treatment plant located at 2101 Boyd Boulevard, LaPorte, Indiana, in LaPorte County, Indiana ("Site") and discharges treated wastewater to Travis Ditch, as authorized by NPDES permit IN0025577 effective May 1, 1995.
3. The Indiana Department of Environmental Management ("IDEM") has jurisdiction over the parties and the subject matter of this action.
An Equal Opportunity Employer

Agreed Order 2000-9996-W Page 2
4. Pursuant to IC 13-30-3-3, IDEM issued a Notice ofViolation on January 11, 2001, via Certified Mail to:
The Honorable Kathleen Chroback, Mayor City of LaPorte 801 Michigan Ave. LaPorte, Indiana 46350
5. Pursuant to 327 lAC 5-2-8, Respondent's NPDES permit requires the following:
a. Comply with all terms and conditions of the permit. b. Take all reasonable steps to minimize or correct any
adverse impact on the environment resulting from noncompliance with the permit.
c. Allow the commissioner, or an authorized representative, to enter the premises and have access to records, inspect the premises or collect samples, at reasonable times and upon presentation of appropriate credentials.
d. At all times maintain in good working order and efficiently operate all facilities and systems (and related appurtenances) for collection and treatment which are necessary for achieving compliance with the terms and conditions of the permit.
e. Comply with the monitoring, recording, and reporting requirements established in 327 lAC 5-2-13, 327 lAC 5-2-14, and 327 lAC 5-2-15.
Failure to comply with any of these requirements, pursuant to 327 lAC 5-2-8, constitutes a violation ofthe Clean Water Act (CWA) and the Environmental Management Act (EMA) and the NPDES permit.
6. Part I.A.1 and Part 1.A.2 of Respondent's NDPES Permit sets forth effluent limitations applicable to the discharge from Outfall 001.
7. Indiana Code IC 13-18-4-5 provides, in part, that it is unlawful for any person to throw, run, drain, or otherwise dispose into any ofthe streams or waters of the state, or to cause, permit or suffer to be thrown, run, drained, allowed to seep, or otherwise disposed into any waters any organic or inorganic matter that causes or contributes to a polluted condition of any waters, as determined by a rule of the board adopted under sections 1 and 3 of this chapter.
8. Respondent failed to comply with its NPDES Permit Monthly Average Concentration effluent limitation for Copper in May through November 1999, February through September 2000, and November 2000. Additionally, the

Agreed Order 2000-9996-W Page 3
April 2001. Additionally, the Respondent failed to comply with its NPDES Permit Daily Maximum effluent limitation for Cyanide on 1 occasion during September 2000. The failure to comply with NPDES Permit effluent limitations is in violation ofiC 13-18-4-5, 327 lAC 5-2-8(1 ), and Part I.A.l. & Part I.A.2. of the NPDES Permit.
9. In recognition of the settlement reached, Respondent waives any right to administrative and judicial review of this Agreed Order.
II. ORDER
1. This Agreed Order shall be effective ("Effective Date") when it is approved by the Complainant or her delegate, and has been received by the Respondent. This Agreed Order shall have no force or effect until the Effective Date.
2. Within sixty (60) days of the Effective Date of this Agreed Order, Respondent shall develop and submit to IDEM for approval a "Copper Compliance Plan" which identifies the actions that Respondent will take to achieve compliance with its NPDES Permit effluent limitations for Copper. The Copper Compliance Plan shall include an implementation and completion schedule, including specific milestone dates.
3. The Respondent shall, within eighteen (18) months of completion of the Copper Compliance Plan (Performance Period), demonstrate twelve (12) consecutive months of compliance (Compliance Demonstration) with the effluent limitations for Copper contained in its NPDES Permit. In the event that Respondent fails to make the Compliance Demonstration, Respondent shall, within sixty (60) days of becoming aware that the Compliance Demonstration cannot be achieved, develop and submit to IDEM, for approval, a plan which identifies the actions that Respondent will take to achieve compliance with the effluent limitations for Copper contained in its NPDES Permit. The plan, if required, shall include an implementation and completion schedule, including specific milestone dates.
4. The compliance plan (CP) required by Paragraphs 2 and 3 are subject to IDEM approval. If a CP is deemed inadequate by IDEM, a revised plan shall be submitted within fifteen (15) days ofreceipt of notice from IDEM ofthe inadequacies thereof. If, after submission of the revised document, IDEM still finds the document to be inadequate, then IDEM will request further modification of the CP as necessary to meet IDEM's requirements. If the subsequently submitted modification of the CP does not meet IDEM's approval, IDEM will suggest specific modifications to be made to the CP and require re-submittal by a specific date. If the IDEM-suggested modifications are not incorporated into the

Agreed Order 2000-9996-W Page4
CP by the Respondent (or an alternative plan is not submitted by the Respondent) by the specified date or are not approved by IDEM, the Respondent will be subject to stipulated penalties as described below. The Respondent, upon receipt of written notification from IDEM, shall immediately implement the approved plan and adhere to the milestone dates therein. The approved plan shall be incorporated into the Agreed Order and shall be deemed an enforceable part thereof.
5. The Respondent shall conduct a study and develop and submit to IDEM by July 31, 2001, a Stream Reach Characterization and Evaluation Report (SRCER) which characterizes potential water quality impacts on Travis Ditch from the discharges from Outfall 002. In addition to any information specified by Part ill of Attachment A of Respondent's NPDES Permit, the report shall include the following information:
a. The protocol that was used to conduct the study. This protocol shall include, but not be necessarily limited to, the monitoring of any discharges from Outfall 002.
Each grab sample shall be tested for each parameter listed in Part I.A. I and Part I.A.2 ofthe Respondent's NPDES Permit.
b. A listing of precipitation events that occurred during the study period, including the amount and duration of each precipitation event.
c. A listing of all discharge events during the study period from Outfall 002, including the date, time, volume and duration of each discharge event.
d. An identification and summary of the water quality characteristics of the discharges from Outfall 002, including an indication of the treatment capabilities provided by the CSO capture/control lagoon and associated pumping facilities.
e. An identification and summary of the impacts of the discharges from Outfall 002 on the water quality characteristics ofthe receiving waters, during the study period.
f. A characterization ofthe system and an evaluation ofthe effectiveness of the implemented CSO controls with respect to the attainment of Water Quality Standards.
In the event that IDEM deems Respondent's SRCER to be deficient, Respondent shall, upon receiving written notice from IDEM of such deficiency, supplement its

Agreed Order 2000-9996-W Page 5
SRCER as necessary to correct the noted deficiencies within the timeframe requested.
6. The Respondent shall develop and submit to IDEM for approval, within twelve (12) months of its submittal of a sufficient SRCER, but no later than July 31, 2002, a Long Term CSO Control Plan (LTCP) that will enable the Respondent to achieve compliance with the technology-based and water quality-based requirements of the CW A. In addition to any information specified by Part VI of Attachment A ofRespondent's Permit, the LTCP shall consist of, but not necessarily be limited to the following elements:
a. Characterization, Monitoring and Modeling - The characterization, monitoring, and if necessary the modeling of the Combined Sewer System (CSS) to provide for effective and efficient operation of the CSS, and to aid in the selection of the Long Term CSO Controls.
b. Public Participation - The identification of a process by which the Public can participate in the decision-making which will ultimately select the Long Term CSO Controls.
c. Sensitive Areas - The consideration and assurance that Sensitive Areas be given the highest priority when evaluating the selection of the Long Term CSO Controls.
d. Evaluation of Alternatives - The Evaluation of Control Alternatives that will enable the Respondent to, in consultation with the permitting authority, and the public, select the Long Term CSO Controls that will achieve compliance with the technology-based and water quality-based requirements ofthe CWA.
e. Cost/Performance Considerations- The evaluation ofthe Cost/Performance considerations that establishes the relationship between a comprehensive set of Long Term CSO Control alternatives and their respective cost and anticipated performance.
f. Operational Plan - A schedule for revising the Combined Sewer Operational Plan (CSOOP) to include the selected Long Term CSO Controls. The revised CSOOP should be fully implemented as soon as possible, but no later than one year, after the construction, installation, and/or completion of the selected Long _Term CSO Controls.
g. Maximizing Treatment at the WWTP - The Respondent shall evaluate and select control alternatives which provide for the maximization of treatment at the WWTP.

Agreed Order 2000-9996-W Page 6
h. Implementation Schedule- The LTCP shall include an implementation schedule which includes specific milestone dates for the design, construction, and implementation of the selected Long Term CSO Controls. The implementation schedule shall take into consideration eliminating overflows that discharge to sensitive areas as the highest priority and use impairment. The implementation schedule should also consider the Respondent's financial capabilities by evaluating:
i. The median household income;
ii. Total annual wastewater and CSO control costs per household as a percent of the median household income;
iii. Overall net debt as a percent of full market property value;
iv. The property tax revenues as a percent of full market property value;
v. The property tax collection rate; vi. The unemployment rate;
vii. The Respondent's bond rating.
Additionally, the implementation schedule should consider:
i. Sources of funding, such as the availability of grants and loans;
ii. Previous and current residential, commercial, and industrial sewer user fees and rate structures.
i. Post-Construction Compliance Monitoring - The Long Term Control Plan shall provide for a process by which the Respondent will evaluate the effectiveness of the selected Long Term CSO Controls, and their adequacy in achieving compliance with the technology-based and water quality-based requirements of theCWA.
The Long Term Control Plan(LTCP) shall be subject to the approval of IDEM. If the LTCP is deemed inadequate by IDEM, a revised plan shall be submitted within fifteen (15) days of receipt of notice from IDEM ofthe inadequacies thereof. If, after submission of the revised document, IDEM still finds the document to be inadequate, then IDEM will request further modification of the LTCP as necessary to meet IDEM's requirements. Ifthe subsequently submitted modification of the LTCP does not meet IDEM's approval, IDEM will suggest

Agreed Order 2000-9996-W Page 7
specific modifications to be made to the LTCP and require re-submittal by a specific date. If modifications are not incorporated into the L TCP by the Respondent (or an alternative plan is not submitted by the Respondent) by the specified date or are not approved by IDEM, the Respondent will be subject to stipulated penalties as described below. The Respondent, upon receipt of written notification from IDEM, shall immediately implement the approved plan and adhere to the milestone dates therein. The approved plan shall be incorporated into the Agreed Order and shall be deemed an enforceable part thereof.
7. Submittals required by this Agreed Order paragraphs 2-4, shall be sent to:
Paul Cluxton, Case Manager, IDEM Office of Enforcement 100 N. Senate Avenue P. 0. Box 6015 Indianapolis, IN 46206-6015
Submittals required by paragraphs 5-6 shall be sent to Dave Tennis, Urban Wet Weather Section, Office of Water Quality.
8. Respondent is assessed a Civil Penalty of Two Thousand Dollars ($2,000). Said penalty amount shall be due and payable to the Environmental Management Special Fund within thirty (30) days of the Effective Date of this Agreed Order.
9. In the event the terms and conditions of the following paragraphs are violated, the Complainant may assess and the Respondent shall pay a stipulated penalty in the following amount:
VIOLATION PENALTY
Paragraph 2 Failure to submit Copper Compliance Plan $ 500 per week late
Paragraph 3 Failure to comply with NPDES Permit $1,000 per violation effluent limitations for Copper during the Performance Period
Paragraph 3 Failure to submit plan, if required $ 500 per week late
Paragraph 3 Failure to comply with any milestone date $1,000 per week late identified in the approved plan
Paragraph 4 Failure to submit revised plan, if required $ 500 per week late
Paragraph 4 Failure to comply with any milestone date $1,000 per week late identified in the approved plan

Agreed Order 2000-9996-W Page 8
Paragraph 5 Failure to timely submit SRCER or timely respond to deficiencies
Paragraph 6 Failure to timely submit complete Long Term Control Plan or timely respond to notice of deficiencies
$500 per week late
$500 per week late
10. Stipulated penalties shall be due and payable within thirty (30) days after Respondent receives written notice that the Complainant has determined a stipulated penalty is due. Assessment and payment of stipulated penalties shall not preclude the Complainant from seeking any additional relief against the Respondent for violation ofthe Agreed Order. In lieu of assessment of the stipulated penalty given above, the Complainant may seek any other remedies or sanctions available by virtue ofRespondent's violation of this Agreed Order, or Indiana law, including but not limited to civil penalties pursuant to IC 13-30-4.
11. Civil and stipulated penalties are payable by check to the Environmental Management Special Fund. Checks shall include the Case Number of this action and shall be mailed to:
Cashier IDEM 100 N. Senate Avenue P.O. Box 7060 Indianapolis, Indiana 46207-7060
12. In the event that the civil penalty required by Order paragraph 8 is not paid within thirty (30) days of the Effective Date of this Agreed Order, Respondent shall pay interest on the unpaid balance at the rate established by IC 24-4.6-1-101. The interest shall continue to accrue until the civil penalty is paid in full.
13. This Agreed Order shall apply to and be binding upon the Respondent, its successors and assigns. The Respondent's signatories to this Agreed Order certify that they are fully authorized to execute this document and legally bind the parties they represent. No change in ownership, corporate, or partnership status of the Respondent shall in any way alter its status or responsibilities under this Agreed Order.
14. The provisions of this Agreed Order do not affect the limitations and requirements set forth in Respondent's NPDES Permit. Efforts by Respondent to comply with provisions of this Agreed Order shall not serve as a justification for not complying with limitations and requirements set forth in its NPDES Permit.

Agreed Order 2000-9996-W Page 9
15. In the event that any terms of the Agreed Order are found to be invalid, the remaining terms shall remain in full force and effect and shall be construed and enforced as if the Agreed Order did not contain the invalid terms.
16. This Agreed Order shall remain in effect until Respondent has complied with the terms of this Agreed Order.
17. "Force Majeure", for purposes of this Agreed Order, is defined as any event arising from causes totally beyond the control and without fault of the Respondent that delays or prevents the performance of any obligation under this Agreed Order despite Respondent's best efforts to fulfill the obligation. The requirement that the Respondent exercise "best efforts to fulfill the obligation" includes using best efforts to anticipate any potential force majeure event and best efforts to address the effects of any potential force majeure event (1) as it is occurring and (2) following the potential force majeure event, such that the delay is minimized to the greatest extent possible. "Force Majeure" does not include changed business or economic financial inability to complete the work required by this Agreed Order or increases in costs to perform the work.
The Respondent shall notify IDEM by calling within three (3) calendar days and by writing no later than seven (7) calendar days after it has knowledge of any event which the Respondent contends is a force majeure. Such notification shall describe the anticipated length of the delay, the cause or causes of the delay, the measures taken or to be taken by the Respondent to minimize the delay, and the timetable by which these measures will be implemented. The Respondent shall include with any notice all available documentation supporting its claim that the delay was attributable to a force majeure. Failure to comply with the above requirements shall preclude Respondent from asserting any claim of force majeure for that event. The Respondent shall have the burden of demonstrating that the event is a force majeure. The decision of whether an event is a force majeure shall be made by IDEM.
If a delay is attributable to a force majeure, IDEM shall extend, in writing, the time period for performance under this Agreed Order, by the amount of time that is attributable to the event constituting the force majeure.

Agreed Order 2000-9996-W Page 10
TECHNICAL RECOMMENDATION ' Department of Environmental Management
By:~(.,.~ Mark W. Stanifer, Chief Water Enforcement Section Office of Enforcement
Date: -----
COUNSEL FOR COMPLAINANT
Sierra L. Cutts Office of Legal Counsel
RESPONDENT City of LaPorte
By:
Title: _ _.rq_-+"'tld=.....:;~,_../0<-.;.A~--
Date: u-13-0/
COUNSEL FOR RESPONDENT
B~ '""' '"b ~ Donald Baugh~ )
APPROVED AND ADOPTED BY THE INDIANA DEPARTMENT OF ENVIRONMENTAL MANAGEMENTTHIS 2 z DAYOF ~ ,2001.
For the Commissioner:
Assistant Commissioner Office of Enforcement
. .

J INDIANA DEPARTMENT OF ENVIRONMENTAL MANAGEMENT
We make Indiana a cleaner, healthier place to live.
Mitchell E. Daniels, Jr. Governor
Thomas W Easterly Commissioner
July 8, 2005
OE- Mail Code 60-02 100 North Senate A venue Indianapolis, Indiana 46204-2251 (317) 232-8603 (800) 451-6027 www.IN.gov/idem
VIA CERTIFIED MAIL 7 0 0 0 0 6 0 0 0 0 2 7 2 0 4 2 57 3 9
The Honorable Leigh E. Morris, Mayor City of LaPorte 801 Michigan Avenue LaPorte, IN 46350
Dear Mayor Morris: Re: Agreed Order, Case No. 2000-9996-W
Combined Sewer Overflow Long Term Control Plan Approval
This is to inform you that, pursuant to Paragraph 6 of Agreed Order Case No. 2000-9996-W (Agreed Order), the Indiana Department of Environmental Management (IDEM) hereby approves the City ofLaPorte's Combined Sewer Overflow Long Term Control Plan (LTCP), as revised and submitted in June 2005. The LTCP identifies controls that will be promptly implemented by the City of LaPorte, with a goal of eliminating all combined sewer overflows within the next three years. The LTCP is thus expected to timely provide for compliance with the water quality based and technology based requirements of the Clean Water Act and state law, and is therefore deemed approvable by IDEM.
In accordance with Paragraph 6 of the Agreed Order, the approved LTCP is hereby incorporated into the Agreed Order and deemed an enforceable part thereof. Additionally, in accordance with Paragraph 6 of the Agreed Order, upon receipt of this correspondence, LaPorte must implement the approved LTCP, in accordance with the schedule contained therein.
Please note that IDEM appreciates the proactive approach taken by LaPorte to address its combined sewer overflow issues. If you have any questions, please contact Mr. Paul Cluxton of my staff at (317) 232-8432.
cc: Patrick Kuefler, USEP A, Region V Peter Swenson, USEP A Region V Sally Swanson, USEP A Region V Jerry P. Jackson, City of LaPorte Richard Erhardt, Malcolm Pirnie Kari Evans, Barnes & Thornburg LaPorte County Health Department
Recycled Paper (!}
Sincerely, A+ .. :~-. f7WwW.~~,r Mark Stanifer, Chief Water Enforcement Section Office of Enforcement
An Equal Opportunity Employer Please Recycle 0