city of las vegas neighborhood risk index (“nri”)
TRANSCRIPT

July 15, 2016
Cheryl Ross
Office of Community Services
City of Las Vegas
495 S. Main St.
Las Vegas, NV 89101
RE: City of Las Vegas | Neighborhood Economic Risk Assessment
Dear Ms. Ross:
In accordance with your request, Applied Analysis (“AA”) is pleased to submit the enclosed City of Las Vegas Neighborhood Economic Risk Assessment for
the second quarter of 2016. AA was retained by the City of Las Vegas Office of Community Services (“the City”) to assist in the preparation of an index of
community economic risk (the “Neighborhood Risk Index” or the “NRI”). This summary presentation report outlines the strategy, methodology and findings
of our review and analysis.
This report and index was designed by AA in response to your request. However, we make no representations as to the adequacy of these procedures for all
your purposes. Generally speaking, though our findings and estimates are as of the latest data available, this report is intended to develop a methodology to be
followed on a continuing basis.
Our report contains economic and real estate data pertaining to the City and the Las Vegas valley as a whole. This information was collected from various
third parties and assembled by AA in such a manner as to provide insight based on its aggregated form. While we have no reason to doubt its accuracy, the
information collected was not subjected to any auditing or review procedures by AA and; therefore, we can offer no representations or assurances as to its
completeness.
This presentation report is a summary of the analyses undertaken and the conclusion of our analyses. It is intended to provide an overview of the analyses
conducted and a summary of our findings. AA will retain additional working papers relevant to this study. If you reproduce this report, it must be done so in
its entirety.
We welcome the opportunity to discuss this report with you at any time. Should you have any questions, please contact Jeremy Aguero or Brian Gordon at
(702) 967-3333.
Sincerely,
Applied Analysis

Neighborhood Risk Index (NRI)
Applied Analysis was retained by the City of Las Vegas Office of Community Services to develop an index of “neighborhood risk” that would identify focus areas for the deployment of resources under the control of the City.
This is an overview of the development of the Neighborhood Risk Index (NRI). This analysis is inherently limited to the quality of the input data as provided by the listed entities and provides a general overview of how specific geographic areas (defined as zip codes) are being impacted by a variety of social and economic factors. We anticipate that these factors, and the weights they are assigned in this analysis, will evolve over time.
This analysis contains information on eight key variables researched from:
• Nevada Division of Welfare & Supportive Services (three variables)
• Nevada Department of Employment, Training & Rehabilitation (one variable)
• Clark County Recorder (one variable)
• Clark County Assessor (one variable)
• Clark County Comprehensive Planning (one variable)
• Applied Analysis (one variable)

methodology: a body of methods, postulates or procedures of inquiry in a particular field

Objective: The City of Las Vegas is seeking to use economic and social data to identify sub-regions within the City at a heightened risk for long-term instability
Approach: Create a Neighborhood Risk Index (NRI) by: (1) identifying risk categories; (2) decomposing each category into factors, creating common sizing and weights for the factors; and (3) calculating a mathematical composition of the area’s risk and size (the NRI)
Concept: By identifying the regions that are at the greatest and most sizable risk, the City can direct resources to areas where they can do the greatest good for the greatest number of people
Methodology of the NRI

Methodology of the NRIIdentifying Instability - Categories and Factors
•Foreclosures•Residential Vacancies•Commercial Vacancies•Bank Owned Properties
•TANF Recipients•Medicaid Recipients•SNAP Recipients
Instability Categories
Factors•Unemployment
Insurance Claims
Employment Neighborhood Household

CategoryIndex Factor Timeframe
Household Instability
TANF: Temporary Assistance forNeedy Families 6 Month Rolling
AverageMedicaid
SNAP: Supplemental Nutrition Assistance Program
Employment Instability
Unemployment InsuranceClaims1
6 Month RollingAverage
Neighborhood Instability
Foreclosures 6 Month Rolling Total
Residential Vacancies
Varying Timeframes2
Commercial Vacancies
Bank Owned Properties3
Methodology of the NRIIdentifying Instability - Categories and Factors
1 Unemployment insurance claims are a fraction of total unemployment; this variable does not represent the “unemployment rate”.2 Residential vacancies are based on annual data, commercial vacancies on quarterly data and bank owned properties on a current snapshot.3 Bank owned properties are homes that are owned by financial institutions or acquired at foreclosure auction.

Common Sizing: All factors were expressed as per 1,000 housing units (HU) or per 1,000 population (POP) where appropriate1; these measures were then expressed as a 100-base ratio of their valley- or city-wide average
Methodology of the NRICommon Sizing of Critical Factors
Area FactorFactor
Index Value
A 650 130
B 600 120
C 550 110
D 500 100
E 450 90
F 400 80
G 350 70
Valley-wide Average = 500
Area FactorFactor
Index Value
A 650 130
The index score of 130 means this area has this factor at a rate 1.3 times the valley-wide average
1Commercial vacancy is expressed as the percentage of commercial space that is available.

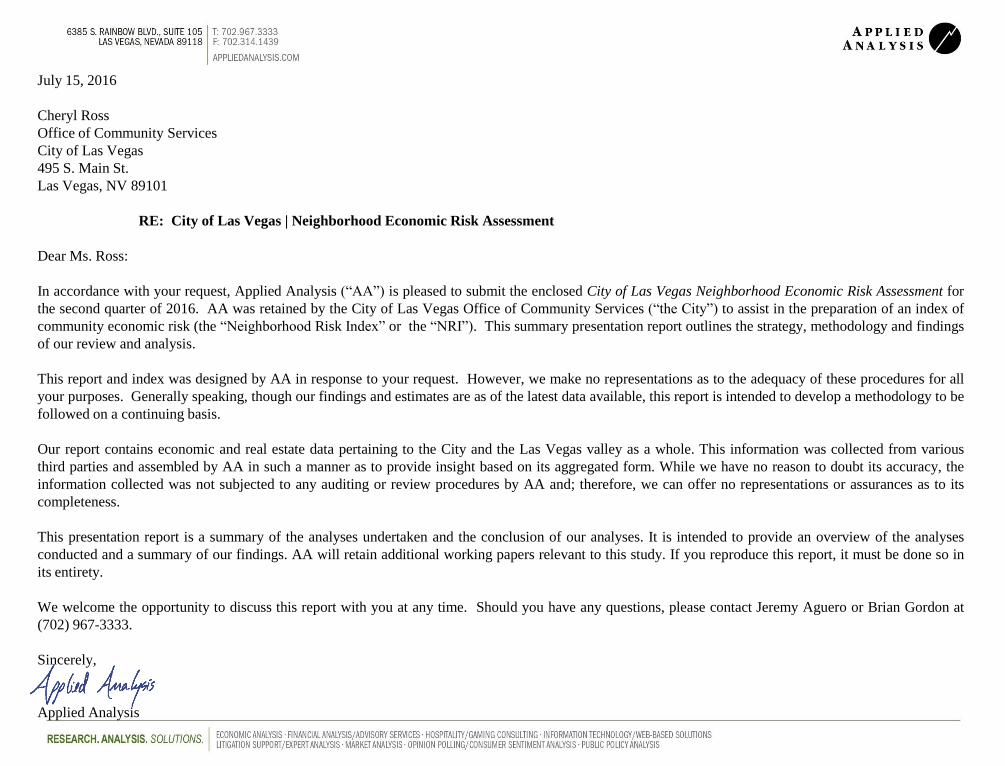
CategoryCategory Weight
Index Factor
Factor Weight
Household Instability
25%
TANF 8.3%
Medicaid 8.3%
SNAP 8.3%
Employment Instability
25%Unemployment
Insurance Claims25.0%
Neighborhood Instability
50%
Foreclosures 25.0%
Residential Vacancies
8.3%
Commercial Vacancies
8.3%
Bank Owned Properties
8.3%
Methodology of the NRIWeights and Composite Risk
Not all factors are assumed to be equally important; modeling allows the City to weight factors based on their relative impact or on policy objectives
Initial conditions for the factor weights assumed 50% household and employment indicators and 50% real estate indicators
Composite Risk
Once weighted, factors were combined into a single measure…
CategoryCategory Weight
Index Factor
Factor Weight
Household Instability
25%
TANF 8.3%
Medicaid 8.3%
SNAP 8.3%
Employment Instability
25%Unemployment
Insurance Claims25.0%
Neighborhood Instability
50%
Foreclosures 25.0%
Residential Vacancies
8.3%
Commercial Vacancies
8.3%
Bank Owned Properties
8.3%
Not all factors are assumed to be equally important; modeling allows the City to weight factors based on their relative impact or on policy objectives
Methodology of the NRIWeights and Composite Risk
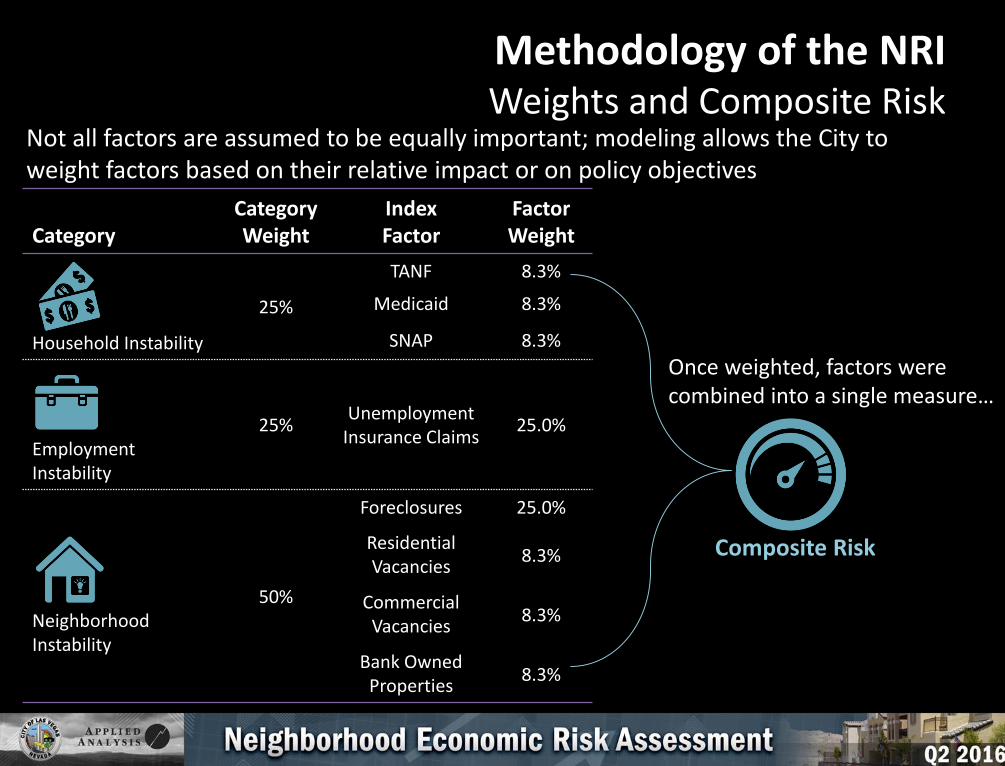
Composite risk was weighted by the number of occupied housing units in the zip code; this way, the City can equalize risk to do the greatest good for the greatest number of people
Methodology of the NRIRelativity and Composite Risk
Size
Low
High
Low High
High RiskMed Size
Med RiskHigh Size
Med
Med
Med RiskMed Size
High RiskHigh Size
RiskGOAL
Focus the City’s efforts, making the best use of limited resources

Methodology of the NRIRelativity and Composite Risk
Size
Low
High
Low High
High RiskMed Size
Med RiskHigh Size
Med
Med
Med RiskMed Size
High RiskHigh Size
RiskElevates
Levels
with
Identifies

summary: an abstract, abridgment or compendium especially of a preceding discourse

What Areas in the Las Vegas Valley have the Highest Economic Risk?

SummaryValley-wide NRI
LowMedium-LowMediumMedium-HighHigh
Charleston
Tropicana
Rancho
N. LVB

89011
89014
89074
89081
89103
89107
89117
89120
89123
89128
89129
89015 89130 89002
89032 89139 89012
89101 89141 89052
89102 89142 89084
89104 89145 89086
89030 89106 89146 89113 89044
89031 89109 89147 89118 89085
89108 89119 89148 89131 89134
89110 89122 89149 89143 89135
89115 89156 89178 89144 89138
89121 89169 89183 89166 89179
High Medium-High
Medium Medium-Low
Low
LowMedium-LowMediumMedium-HighHigh
SummaryValley-wide NRI

City of Las Vegas
City of Las Vegas zip codes in bold
LowMedium-LowMediumMedium-HighHigh
SummaryValley-wide NRI
89011
89014
89074
89081
89103
89107
89117
89120
89123
89128
89129
89015 89130 89002
89032 89139 89012
89101 89141 89052
89102 89142 89084
89104 89145 89086
89030 89106 89146 89113 89044
89031 89109 89147 89118 89085
89108 89119 89148 89131 89134
89110 89122 89149 89143 89135
89115 89156 89178 89144 89138
89121 89169 89183 89166 89179
High Medium-High
Medium Medium-Low
Low

What Areas Within the City have the Highest Economic Risk?*
(*) NOTE: City of Las Vegas NRI is calculated independently from the valley-wide NRI, so areas within the City can be compared to one another.

Charleston
Rancho
N. LVB
LowMedium-LowMediumMedium-HighHigh
SummaryCity of Las Vegas NRI

89107
89117
89128
89129
89101 89130 89131
89102 89145 89143
89108 89104 89146 89144 89134
89110 89106 89149 89166 89138
High Medium-High
Medium Medium-Low
Low
SummaryCity of Las Vegas NRI
LowMedium-LowMediumMedium-HighHigh

SummaryCity of Las Vegas NRI
89107
89117
89128
89129
89101 89130 89131
89102 89145 89143
89108 89104 89146 89144 89134
89110 89106 89149 89166 89138
High Medium-High
Medium Medium-Low
Low
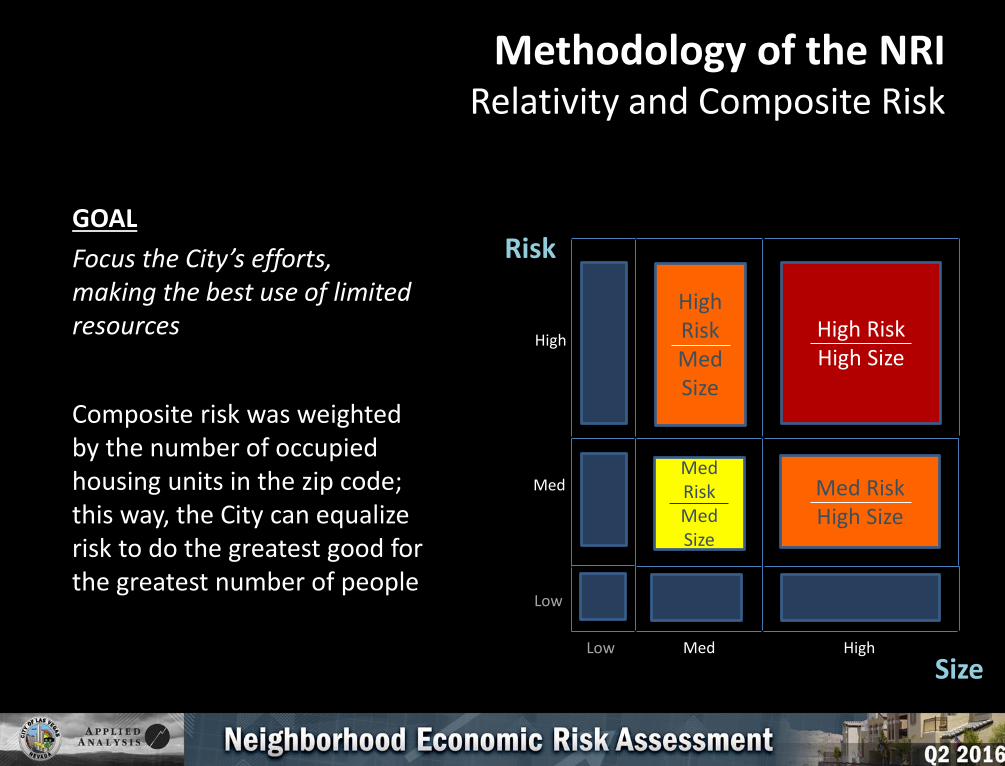
SummaryCity of Las Vegas NRI
Zip Code 89108 89110City
AverageLV Valley Average
TANF RecipientsPer 1,000 Population
15.1 15.6 11.7 10.3
Medicaid RecipientsPer 1,000 Population
308.1 314.5 246.0 225.7
SNAP RecipientsPer 1,000 Population
222.3 226.9 176.1 160.6
Unemployment Ins.Per 1,000 Population
12.0 10.9 10.9 11.3
ForeclosuresPer 1,000 Total Housing Units
3.3 4.1 2.6 2.6
Residential VacanciesPer 1,000 Total Housing Units 33.0 30.8 63.5 72.4
Commercial Vacancy 17.2% 6.7% 13.9% 15.1%
Bank Owned HomesPer 1,000 Total Housing Units
17.5 22.2 14.7 14.1

elements: a constituent part; necessary data values on which calculations or conclusions are based

Elements of the NRI
Employment Instability

Top 10 Zip Codes(Zip Codes Within the City noted in Bold)
Zip Codes
Unemployment Insurance Claims
(per 1,000 POP)
Valley-wide Mean
(per 1,000 POP)
Unemployment Insurance Claims
Index Value
89104 16.4 11.3 145
89121 14.2 11.3 125
89086 14.1 11.3 125
89183 14.0 11.3 124
89120 13.8 11.3 122
89179 13.8 11.3 122
89169 13.4 11.3 119
89032 13.3 11.3 118
89156 13.3 11.3 117
89113 13.2 11.3 117
Elements of the NRIUnemp. Insurance | Valley-wide Summary Data
Employment Instability

Elements of the NRIUnemp. Insurance | Valley-wide Distribution Map
Employment Instability
LowMedium-LowMediumMedium-HighHigh
The rate of unemployment insurance claims per 1,000 residents continued to drop. The rate fell to 11.3 from 11.5 last quarter (down 2.1 percent).

Elements of the NRIUnemp. Insurance | Valley-wide Distribution Map
Employment Instability City of Las Vegas
Zip Codes
LowMedium-LowMediumMedium-HighHigh
The rate of unemployment insurance claims per 1,000 residents continued to drop. The rate fell to 11.3 from 11.5 last quarter (down 2.1 percent).

Top 5 Zip Codes In the City of Las Vegas
Zip Codes
Unemployment Insurance Claims
(per 1,000 POP)
CLV Mean(per 1,000 POP)
Unemployment Insurance Claims
Index Value
89104 16.4 10.9 150
89146 12.9 10.9 118
89108 12.0 10.9 110
89107 11.8 10.9 108
89128 11.7 10.9 107
Elements of the NRIUnemp. Insurance | CLV Summary Data
Mean unemployment insurance claims per 1,000 residents:
Valley-wide 11.3City of Las Vegas 10.9
Employment Instability

Elements of the NRIUnemp. Insurance | CLV Distribution Map
Charleston
Rancho
N. LVB
Employment Instability
LowMedium-LowMediumMedium-HighHigh
The rate of unemployment insurance claims per 1,000 residents continued to drop. The rate fell to 10.9 from 11.2 last quarter (down 2.4 percent).

Elements of the NRI
Neighborhood Instability

Top 10 Zip Codes(Zip Codes Within the City noted in Bold)
Zip Codes
Foreclosures (per 1,000 HU)
Valley-wide Mean
(per 1,000 HU)
Foreclosures Index Value
89156 4.5 2.6 176
89130 4.2 2.6 165
89110 4.1 2.6 159
89179 4.0 2.6 158
89142 4.0 2.6 156
89143 4.0 2.6 155
89120 3.9 2.6 155
89032 3.9 2.6 154
89086 3.8 2.6 149
89015 3.8 2.6 149
Elements of the NRIForeclosures | Valley-wide Summary Data
Neighborhood Instability

Elements of the NRIForeclosures | Valley-wide Distribution Map
Neighborhood Instability
LowMedium-LowMediumMedium-HighHigh
The rate of foreclosures per 1,000 housing units continued to decline. The rate fell to 2.6 from 2.7 last quarter (down 5.4 percent).

Elements of the NRIForeclosures | Valley-wide Distribution Map
Neighborhood Instability City of Las Vegas
Zip Codes
LowMedium-LowMediumMedium-HighHigh
The rate of foreclosures per 1,000 housing units continued to decline. The rate fell to 2.6 from 2.7 last quarter (down 5.4 percent).

Top 5 Zip CodesIn the City of Las Vegas
Zip Codes
Foreclosures (per 1,000 HU)
CLV Mean(per 1,000 HU)
Foreclosures Index Value
89130 4.2 2.6 163
89110 4.1 2.6 157
89143 4.0 2.6 153
89138 3.4 2.6 130
89108 3.3 2.6 128
Elements of the NRIForeclosures | CLV Summary Data
Mean foreclosures per 1,000 housing units:City of Las Vegas 2.6Valley-wide 2.6
Neighborhood Instability

Elements of the NRIForeclosures | CLV Distribution Map
Neighborhood Instability
LowMedium-LowMediumMedium-HighHigh
Charleston
Rancho
N. LVB
Note: While the rate of foreclosures per 1,000 housing units decreased from 2.7 to 2.6 both valley- and city-wide, the percentage changes differ due to rounding.
The rate of foreclosures per 1,000 housing units continued to decline. The rate dropped to 2.6 from 2.7 last quarter (down 5.2 percent).

Top 10 Zip Codes(Zip Codes Within the City noted in Bold)
Zip Codes
Residential Vacancies (per 1,000 HU)
Valley-wide Mean
(per 1,000 HU)
ResidentialVacancies
Index Value
89109 686.0 72.4 948
89086 206.6 72.4 285
89106 186.9 72.4 258
89179 170.1 72.4 235
89101 161.1 72.4 223
89169 156.9 72.4 217
89166 146.8 72.4 203
89011 129.8 72.4 179
89102 124.9 72.4 173
89178 124.1 72.4 171
Elements of the NRIResidential Vacancy | Valley-wide Summary Data
Neighborhood Instability

Elements of the NRIResidential Vacancy | Valley-wide Distribution Map
Neighborhood Instability
LowMedium-LowMediumMedium-HighHigh
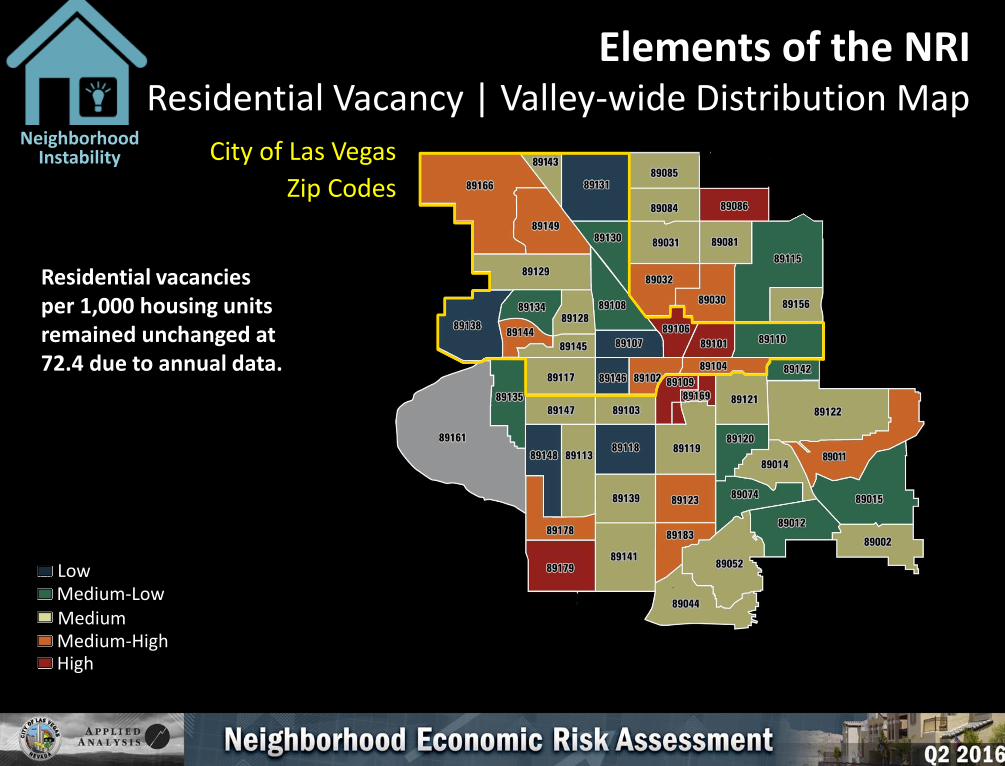
Residential vacancies per 1,000 housing units remained unchanged at 72.4 due to annual data.
Neighborhood Instability City of Las Vegas
Zip Codes
LowMedium-LowMediumMedium-HighHigh
Elements of the NRIResidential Vacancy | Valley-wide Distribution Map
Residential vacancies per 1,000 housing units remained unchanged at 72.4 due to annual data.

Top 5 Zip CodesIn the City of Las Vegas
Zip Codes
ResidentialVacancies
(per 1,000 HU)
CLV Mean(per 1,000 HU)
ResidentialVacancies
Index Value
89106 186.9 63.5 294
89101 161.1 63.5 254
89166 146.8 63.5 231
89102 124.9 63.5 197
89104 100.8 63.5 159
Elements of the NRIResidential Vacancy | CLV Summary Data
Mean residential vacancies per 1,000 housing units:
Valley-wide 72.4City of Las Vegas 63.5
Neighborhood Instability

Elements of the NRIResidential Vacancy | CLV Distribution Map
Neighborhood Instability
LowMedium-LowMediumMedium-HighHigh
Charleston
Rancho
N. LVB
Similarly, within the City, the rate of residential vacancies per 1,000 housing units remained unchanged at 63.5 due to annual data.

Top 10 Zip Codes(Zip Codes Within the City noted in Bold)
Zip Codes
CommercialVacancy
RateValley-wide
Mean
Commercial Vacancy Rate Index Value
89115 40.6% 15.1% 269
89011 33.2% 15.1% 220
89109 25.3% 15.1% 168
89118 22.4% 15.1% 148
89169 21.0% 15.1% 139
89119 19.7% 15.1% 130
89113 19.4% 15.1% 129
89012 19.3% 15.1% 128
89103 19.1% 15.1% 127
89102 19.1% 15.1% 127
Elements of the NRICommercial Vacancy | Valley-wide Summary Data
Neighborhood Instability

Elements of the NRICommercial Vacancy | Valley-wide Distribution Map
Neighborhood Instability
LowMedium-LowMediumMedium-HighHigh
Note: Zip codes in grey (excluding 89161 which is not part of the index) have no material commercial space.
Valley-wide commercial vacancy continued to drop. The vacancy rate fell to 15.1 percent from 15.6 percent last quarter (down 0.5 percentage point). 89115 had the highest vacancy rate (40.6 percent), pushing 89011 to the second-highest spot (33.2 percent). The higher vacancy rate in 89115 was due to the closing of a Wal-Mart, which added 206,300 SF of vacant inventory back to the market.

Neighborhood Instability City of Las Vegas
Zip Codes
LowMedium-LowMediumMedium-HighHigh
Elements of the NRICommercial Vacancy | Valley-wide Distribution Map
Note: Zip codes in grey (excluding 89161 which is not part of the index) have no material commercial space.
Valley-wide commercial vacancy continued to drop. The vacancy rate fell to 15.1 percent from 15.6 percent last quarter (down 0.5 percentage point). 89115 had the highest vacancy rate (40.6 percent), pushing 89011 to the second-highest spot (33.2 percent). The higher vacancy rate in 89115 was due to the closing of a Wal-Mart, which added 206,300 SF of vacant inventory back to the market.

Top 5 Zip CodesIn the City of Las Vegas
Zip Codes
CommercialVacancy
RateCLV
Mean
CommercialVacancy RateIndex Value
89102 19.1% 13.9% 137
89143 19.0% 13.9% 136
89129 18.1% 13.9% 130
89108 17.2% 13.9% 123
89128 16.7% 13.9% 120
Elements of the NRICommercial Vacancy | CLV Summary Data
Mean commercial vacancy rate:Valley-wide 15.1%City of Las Vegas 13.9%
Neighborhood Instability

Elements of the NRICommercial Vacancy | CLV Distribution Map
Neighborhood Instability
LowMedium-LowMediumMedium-HighHigh
Charleston
Rancho
N. LVB
Note: Zip codes in grey have no material commercial space.
City-wide commercial vacancy continued to decline. The rate fell to 13.9 percent from 14.7 percent last quarter (down 0.8 percentage point). 89102 had the highest vacancy rate at 19.1 percent.
Top 10 Zip Codes(Zip Codes Within the City noted in Bold)
Zip Codes
Bank Owned Homes
(per 1,000 HU)
Valley-wide Mean
(per 1,000 HU)
Bank Owned Homes
Index Value
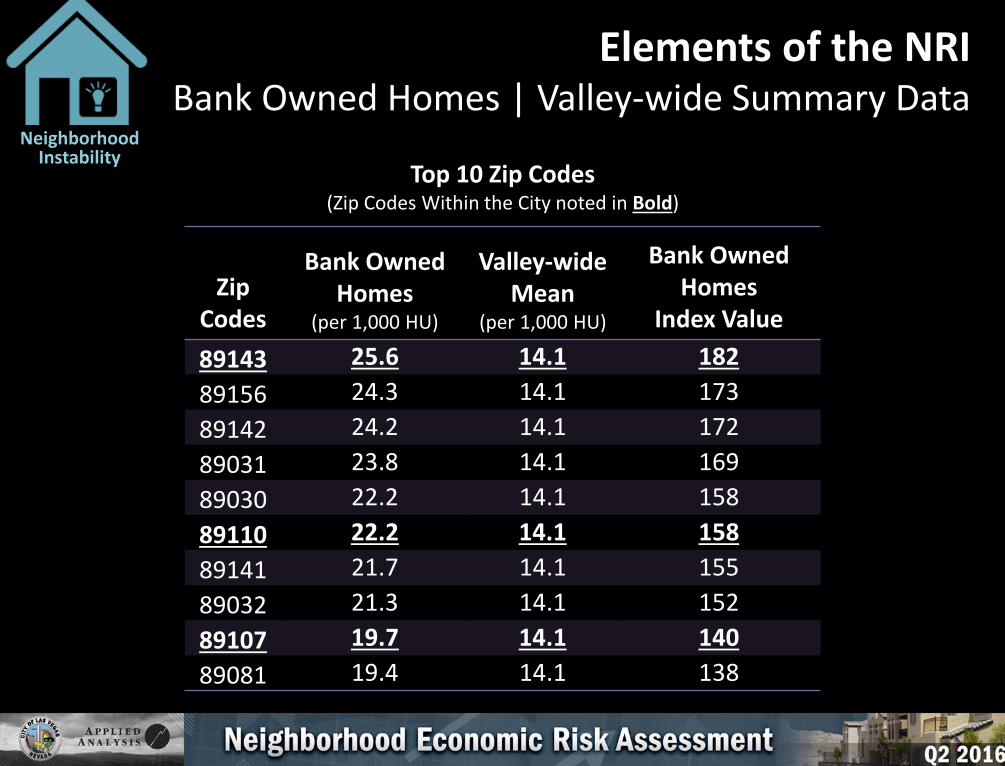
89143 25.6 14.1 182
89156 24.3 14.1 173
89142 24.2 14.1 172
89031 23.8 14.1 169
89030 22.2 14.1 158
89110 22.2 14.1 158
89141 21.7 14.1 155
89032 21.3 14.1 152
89107 19.7 14.1 140
89081 19.4 14.1 138
Elements of the NRIBank Owned Homes | Valley-wide Summary Data
Neighborhood Instability

Elements of the NRIBank Owned Homes | Valley-wide Distribution Map
Neighborhood Instability
LowMedium-LowMediumMedium-HighHigh
The rate of bank owned homes per 1,000 housing units continued to drop. The rate fell to 14.1 from 14.3 last quarter (down 1.4 percent).

Elements of the NRIBank Owned Homes | Valley-wide Distribution Map
Neighborhood Instability City of Las Vegas
Zip Codes
LowMedium-LowMediumMedium-HighHigh
The rate of bank owned homes per 1,000 housing units continued to drop. The rate fell to 14.1 from 14.3 last quarter (down 1.4 percent).

Top 5 Zip CodesIn the City of Las Vegas
Zip Codes
Bank Owned Homes
(per 1,000 HU)
CLV Mean(per 1,000 HU)
Bank Owned Homes
Index Value
89143 25.6 14.7 174
89110 22.2 14.7 151
89107 19.7 14.7 134
89130 18.3 14.7 124
89131 18.2 14.7 124
Elements of the NRIBank Owned Homes | CLV Summary Data
Mean bank owned homes per 1,000 housing units:
City of Las Vegas 14.7Valley-wide 14.1
Neighborhood Instability

Elements of the NRIBank Owned Homes | CLV Distribution Map
Neighborhood Instability
LowMedium-LowMediumMedium-HighHigh
Charleston
Rancho
N. LVB
The rate of bank owned homes per 1,000 housing units continued to decline. The rate dropped to 14.7 from 14.8 last quarter (down 0.8 percent).

Elements of the NRI
Household Instability

Top 10 Zip Codes(Zip Codes Within the City noted in Bold)
Zip Codes
TANF Recipients (per 1,000 POP)
Valley-wide Mean
(per 1,000 POP)
TANF Recipients
Index Value
89106 33.8 10.3 328
89030 33.1 10.3 322
89101 28.8 10.3 280
89115 24.7 10.3 240
89169 23.7 10.3 230
89102 21.8 10.3 212
89104 21.8 10.3 211
89156 15.9 10.3 154
89119 15.8 10.3 153
89110 15.6 10.3 151
Elements of the NRITANF | Valley-wide Summary Data
Household Instability

Elements of the NRITANF | Valley-wide Distribution Map
LowMedium-LowMediumMedium-HighHigh
Household Instability
The rate of TANF recipients per 1,000 residents continued to decline. The rate dropped to 10.3 from 10.6 last quarter (down 3.2 percent).

Elements of the NRITANF | Valley-wide Distribution Map
City of Las Vegas
Zip Codes
LowMedium-LowMediumMedium-HighHigh
Household Instability
The rate of TANF recipients per 1,000 residents continued to decline. The rate dropped to 10.3 from 10.6 last quarter (down 3.2 percent).

Top 5 Zip CodesIn the City of Las Vegas
Zip Codes
TANF Recipients (per 1,000 POP)
CLV Mean(per 1,000 POP)
TANF Recipients
Index Value
89106 33.8 11.7 289
89101 28.8 11.7 246
89102 21.8 11.7 187
89104 21.8 11.7 186
89110 15.6 11.7 133
Elements of the NRITANF | CLV Summary Data
Mean TANF recipients per 1,000 residents:City of Las Vegas 11.7Valley-wide 10.3
Household Instability

Elements of the NRITANF | CLV Distribution Map
LowMedium-LowMediumMedium-HighHigh
Charleston
Rancho
N. LVB
Household Instability
Within the City, the rate of TANF recipients per 1,000 residents continued to decline. The rate fell to 11.7 from 12.1 last quarter (down 3.0 percent).

Top 10 Zip Codes(Zip Codes Within the City noted in Bold)
Zip Codes
SNAP Recipients(per 1,000 POP)
Valley-wide Mean
(per 1,000 POP)
SNAP Recipients
Index Value
89106 430.7 160.6 268
89101 401.9 160.6 250
89030 363.6 160.6 226
89104 323.4 160.6 201
89169 302.2 160.6 188
89115 292.4 160.6 182
89102 285.0 160.6 177
89119 253.5 160.6 158
89109 251.4 160.6 157
89121 239.9 160.6 149
Elements of the NRISNAP | Valley-wide Summary Data
Household Instability
Elements of the NRISNAP | Valley-wide Distribution Map
LowMedium-LowMediumMedium-HighHigh
Household Instability
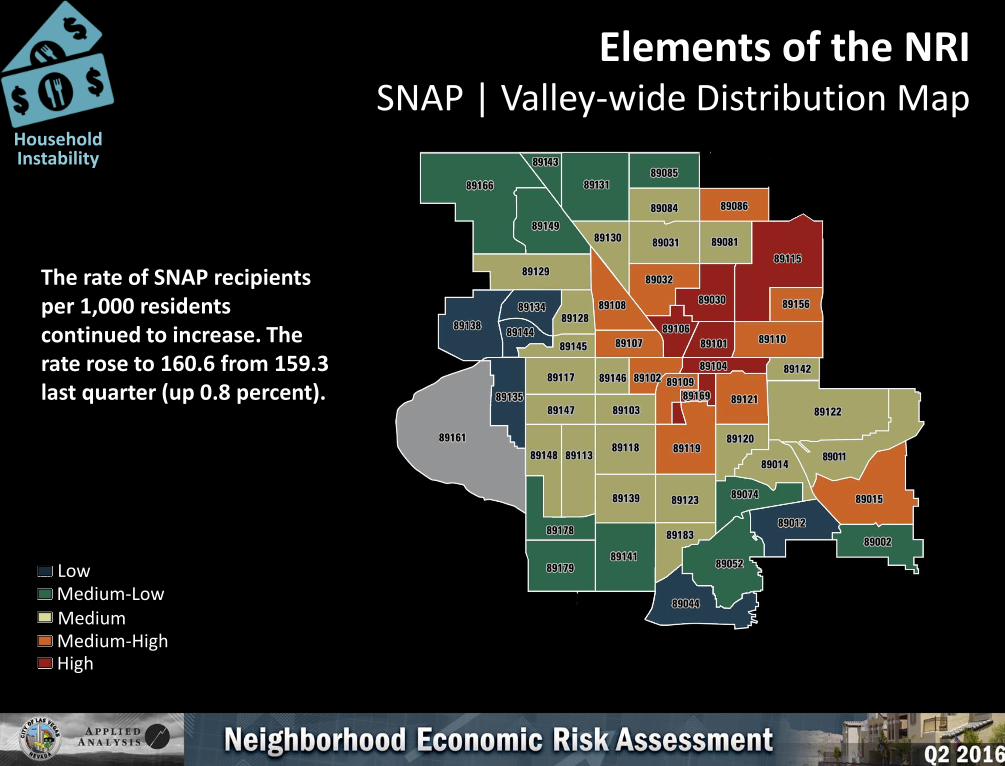
The rate of SNAP recipients per 1,000 residents continued to increase. The rate rose to 160.6 from 159.3 last quarter (up 0.8 percent).

Elements of the NRISNAP | Valley-wide Distribution Map
City of Las Vegas
Zip Codes
LowMedium-LowMediumMedium-HighHigh
Household Instability
The rate of SNAP recipients per 1,000 residents continued to increase. The rate rose to 160.6 from 159.3 last quarter (up 0.8 percent).
Top 5 Zip CodesIn the City of Las Vegas
Zip Codes
SNAP Recipients (per 1,000 POP)
CLV Mean(per 1,000 POP)
SNAP RecipientsIndex Value
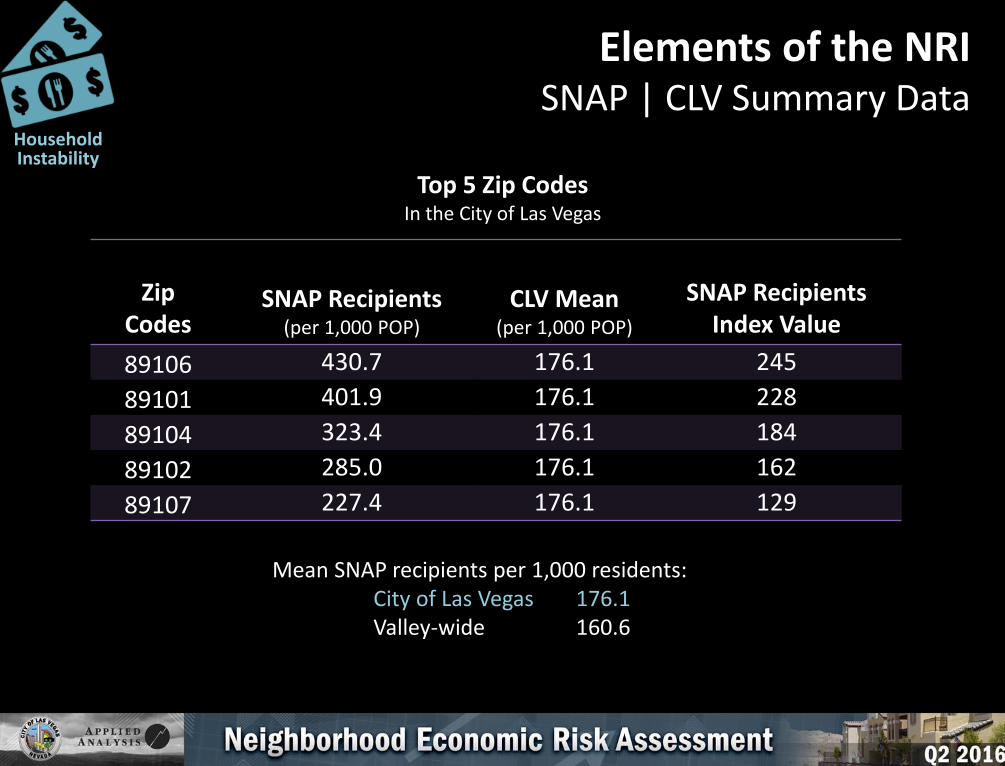
89106 430.7 176.1 245
89101 401.9 176.1 228
89104 323.4 176.1 184
89102 285.0 176.1 162
89107 227.4 176.1 129
Elements of the NRISNAP | CLV Summary Data
Mean SNAP recipients per 1,000 residents:City of Las Vegas 176.1Valley-wide 160.6
Household Instability
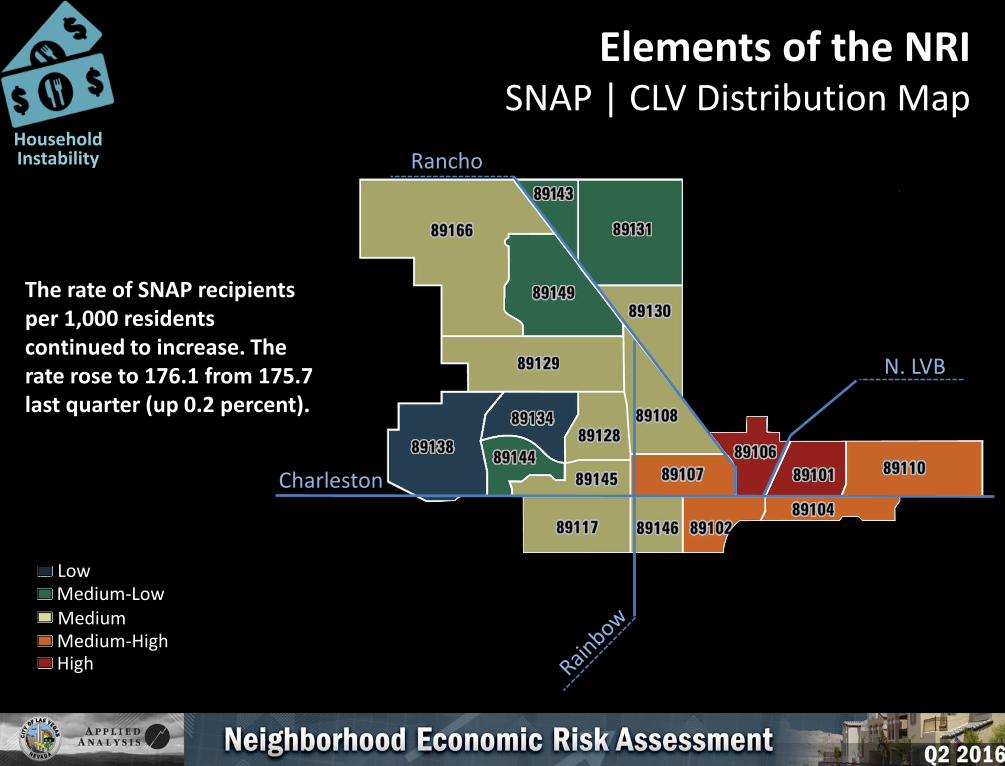
Elements of the NRISNAP | CLV Distribution Map
LowMedium-LowMediumMedium-HighHigh
Charleston
Rancho
N. LVB
Household Instability
The rate of SNAP recipients per 1,000 residents continued to increase. The rate rose to 176.1 from 175.7 last quarter (up 0.2 percent).

Top 10 Zip Codes(Zip Codes Within the City noted in Bold)
Zip Codes
Medicaid Recipients(per 1,000 POP)
Valley-wide Mean
(per 1,000 POP)
Medicaid RecipientsIndex Value
89106 534.0 225.7 237
89101 497.0 225.7 220
89030 479.9 225.7 213
89104 423.2 225.7 188
89115 374.4 225.7 166
89102 365.0 225.7 162
89169 357.5 225.7 158
89109 340.3 225.7 151
89107 322.9 225.7 143
89156 318.6 225.7 141
Elements of the NRIMedicaid | Valley-wide Summary Data
Household Instability

Elements of the NRIMedicaid | Valley-wide Distribution Map
LowMedium-LowMediumMedium-HighHigh
Household Instability
The rate of Medicaid recipients per 1,000 residents continued to increase. The rate rose to 225.7 from 219.7 last quarter (up 2.7 percent).

Elements of the NRIMedicaid | Valley-wide Distribution Map
City of Las Vegas
Zip Codes
LowMedium-LowMediumMedium-HighHigh
Household Instability
The rate of Medicaid recipients per 1,000 residents continued to increase. The rate rose to 225.7 from 219.7 last quarter (up 2.7 percent).

Top 5 Zip CodesIn the City of Las Vegas
Zip Codes
Medicaid Recipients
(per 1,000 POP)
CLV Mean(per 1,000 POP)
Medicaid Recipients
Index Value
89106 534.0 246.0 217
89101 497.0 246.0 202
89104 423.2 246.0 172
89102 365.0 246.0 148
89107 322.9 246.0 131
Elements of the NRIMedicaid | CLV Summary Data
Mean Medicaid recipients per 1,000 residents:City of Las Vegas 246.0Valley-wide 225.7
Household Instability

Elements of the NRIMedicaid | CLV Distribution Map
LowMedium-LowMediumMedium-HighHigh
Charleston
Rancho
N. LVB
Household Instability
The rate of Medicaid recipients per 1,000 residents continued to increase. The rate rose to 246.0 from 240.6 last quarter (up 2.3 percent).

Elements of the NRI
Composite Risk
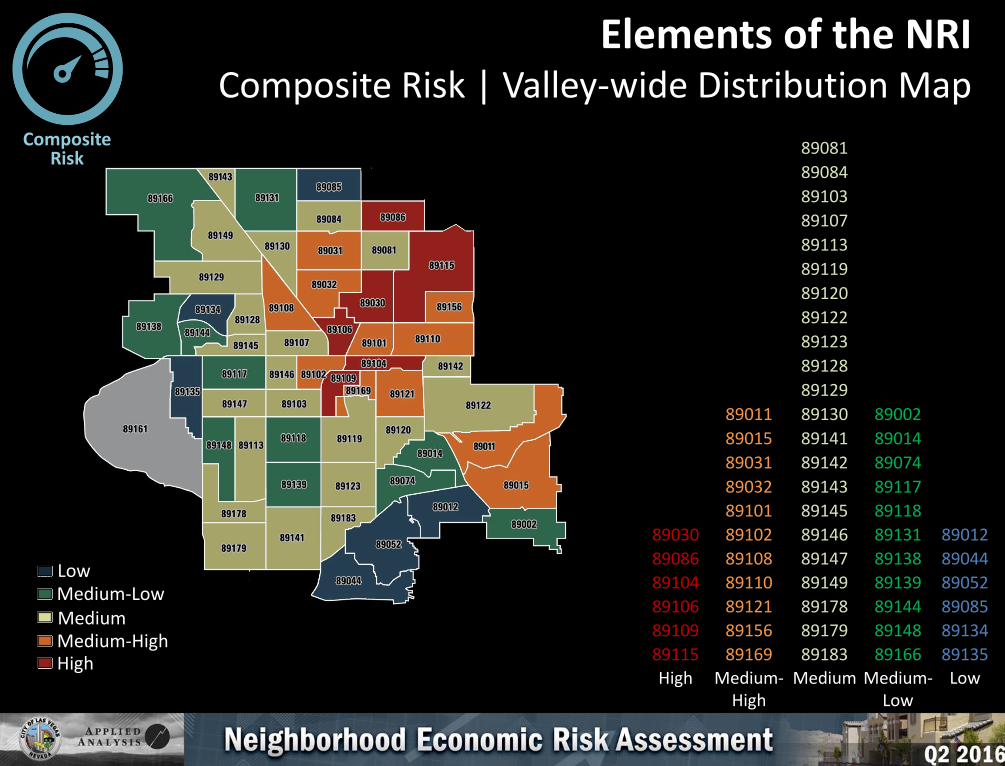
Elements of the NRIComposite Risk | Valley-wide Distribution Map
89081
89084
89103
89107
89113
89119
89120
89122
89123
89128
89129
89011 89130 89002
89015 89141 89014
89031 89142 89074
89032 89143 89117
89101 89145 89118
89030 89102 89146 89131 89012
89086 89108 89147 89138 89044
89104 89110 89149 89139 89052
89106 89121 89178 89144 89085
89109 89156 89179 89148 89134
89115 89169 89183 89166 89135
High Medium-High
Medium Medium-Low
Low
LowMedium-LowMediumMedium-HighHigh
Composite Risk

City of Las Vegas
City of Las Vegas zip codes in bold
LowMedium-LowMediumMedium-HighHigh
Composite Risk
Elements of the NRIComposite Risk | Valley-wide Distribution Map
89081
89084
89103
89107
89113
89119
89120
89122
89123
89128
89129
89011 89130 89002
89015 89141 89014
89031 89142 89074
89032 89143 89117
89101 89145 89118
89030 89102 89146 89131 89012
89086 89108 89147 89138 89044
89104 89110 89149 89139 89052
89106 89121 89178 89144 89085
89109 89156 89179 89148 89134
89115 89169 89183 89166 89135
High Medium-High
Medium Medium-Low
Low

89107
89128
89130
89143
89101 89145 89117
89102 89146 89129
89104 89108 89149 89131 89134
89106 89110 89166 89144 89138
High Medium-High
Medium Medium-Low
Low
Elements of the NRIComposite Risk | CLV Distribution Map
LowMedium-LowMediumMedium-HighHigh
Composite Risk
How does the Composite Risk Index differ from the
Neighborhood Risk Index?

Review of the NRI Methodology
1) A relative level of risk was assigned to each zip code for all risk factors (as shown in the elements of the NRI series).
2) Risk factors are combined to create a Composite Risk Index. The Composite Risk Index assigns a weight to each risk factor.
3) To create the Neighborhood Risk Index, the Composite Risk Index is weighted by occupied housing units. Zip codes with the highest risk and highest number of occupied housing units can be found and targeted.

Risk factors are assigned a weight of the total 100 percent distribution. TANF recipients, for example, are
assigned a weight of 8.3 percent.

The Composite Risk Index is weighted by occupied housing units to find and target zip codes with the highest risk and
highest number of occupied housing units, creating the NRI.

This implies that two zip codes with equally high composite risk may be
ranked differently based on their number of occupied housing units.

Top 10 Zip Codes (Zip Codes Within the City noted in Bold)
Zip CodesOccupied
Housing UnitsComposite Risk
(Factor Weighted Average)
Neighborhood Risk Index(NRI)
89115 19,493 140.1 100
89108 27,449 117.9 92
89030 13,638 141.6 89
89110 22,487 120.2 88
89031 21,613 120.4 87
89121 24,777 114.6 86
89104 12,466 138.9 85
89032 14,547 131.9 84
89101 14,548 129.6 83
89106 8,989 148.8 81
NRI | Valley-wide Summary Data
Zip codes with high Composite Risk may not always have equally high Neighborhood Risk once occupied housing units are factored in.

Top 5 Zip Codes In the City of Las Vegas
Zip CodesOccupied
Housing UnitsComposite Risk
(Factor Weighted Average)
Neighborhood Risk Index
(NRI)
89108 27,449 116.0 100
89110 22,487 117.3 93
89104 12,466 137.0 90
89101 14,548 127.1 86
89106 8,989 145.6 84
NRI | CLV Summary Data
Zip codes with high Composite Risk may not always have equally high Neighborhood Risk once occupied housing units are factored in.
Additional Considerations

Increasing Severity
Alternative Measures of RiskFood Insecurity
Note: Data is unchanged from last quarter due to annual data.
Food insecurity remained unchanged due to annual data.
