city of london 2012 corporate energy … infrastructure serving the city of london city of london...
TRANSCRIPT
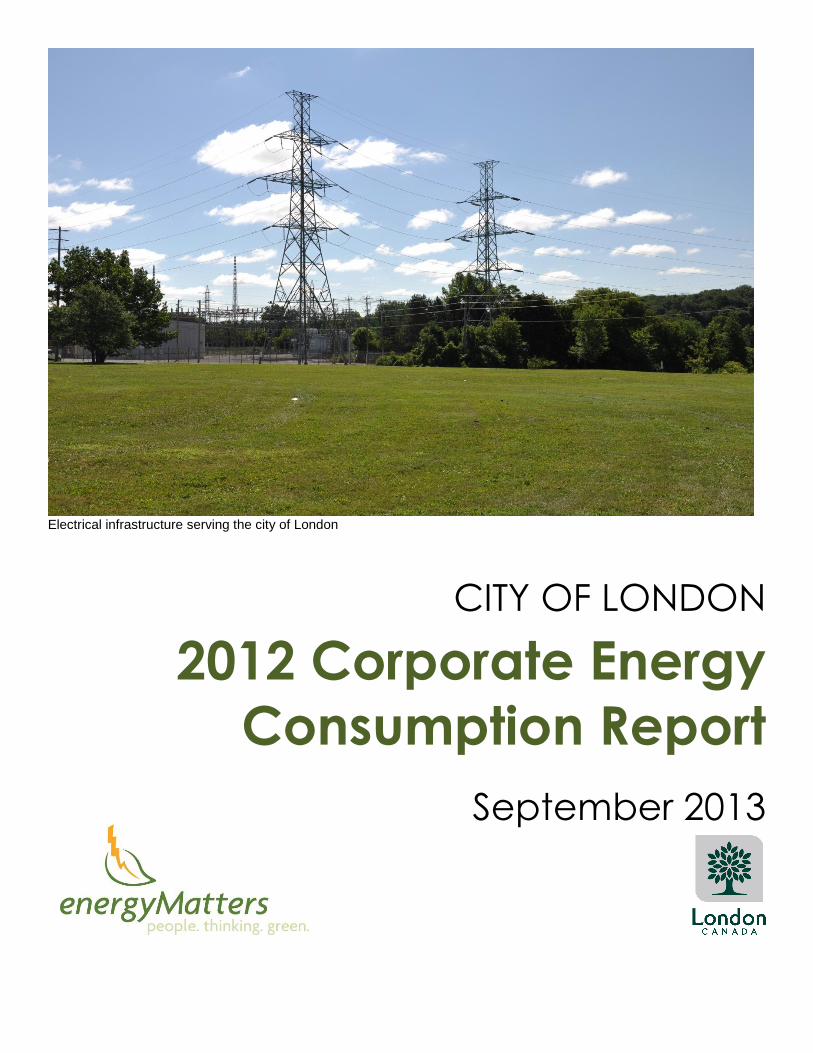
Electrical infrastructure serving the city of London
CITY OF LONDON
2012 Corporate Energy
Consumption Report
September 2013
TABLE OF CONTENTS
CORPORATE ENERGY MANAGEMENT - UPDATE ............................................................................................. 3
1 CORPORATE ENERGY CONSUMPTION – Getting Started… .................................................................... 6
2 CORPORATE ENERGY CONSUMPTION OVERVIEW................................................................................... 6
3 CORPORATE ENERGY ANNUAL SUMMARY .............................................................................................. 8
3.1 TOTAL CORPORATE ENERGY CONSUMPTION .................................................................................................... 8
3.1.1 ENERGY CONSUMPTION BY COMMODITY .................................................................................................... 8
3.1.2 ENERGY CONSUMPTION BY SERVICE AREA ................................................................................................. 10
3.1.3 TOTAL CORPORATE ENERGY CONSUMPTION PER CAPITA BY SERVICE AREA ................................................... 12
3.1.4 TOTAL CORPORATE ENERGY CONSUMPTION SUMMARY ............................................................................... 13
3.2 TOTAL CORPORATE ENERGY COSTS .............................................................................................................. 14
3.2.1 ENERGY COSTS BY COMMODITY............................................................................................................... 14
3.2.2 ENERGY COSTS BY SERVICE AREA ............................................................................................................ 16
3.2.3 ENERGY COSTS PER CAPITA ..................................................................................................................... 18
3.2.4 TOTAL CORPORATE ENERGY COST SUMMARY ............................................................................................. 19
4 CORPORATE ENERGY COST AVOIDANCE .............................................................................................. 19
5 CORPORATE GREENHOUSE GAS EMISSIONS ......................................................................................... 20
5.1 TOTAL CORPORATE GREENHOUSE GAS EMISSIONS BY COMMODITY ................................................................. 20
5.2 TOTAL CORPORATE GREENHOUSE GAS EMISSIONS BY SERVICE AREA ............................................................... 22
City of London | 2012 Corporate Consumption Report 3
CORPORATE ENERGY MANAGEMENT - UPDATE Energy Management is a key component in managing facilities and infrastructure in today’s
economy. The City of London has provided leadership in energy conservation and
sustainable energy for more than 15 to 20 years.
In compliance with the Green Energy Act and the Ontario Regulation 397/11, the City of
London is required to report on their energy consumption and greenhouse gas (GHG)
emissions annually beginning in 2013 and to develop and implement energy conservation
and demand management (CDM) plans starting in 2014.
In the development of the 2013 submission and the 2014 CDM plan, the City recognized the
importance to report the Ontario regulation requirements but to go one step further and
capture past and current energy management activities to set the stage of where we stand
today. This resulted in the development of a series of reports and initiatives that inter-relate
to the development and support the future CDM Plan in 2014.
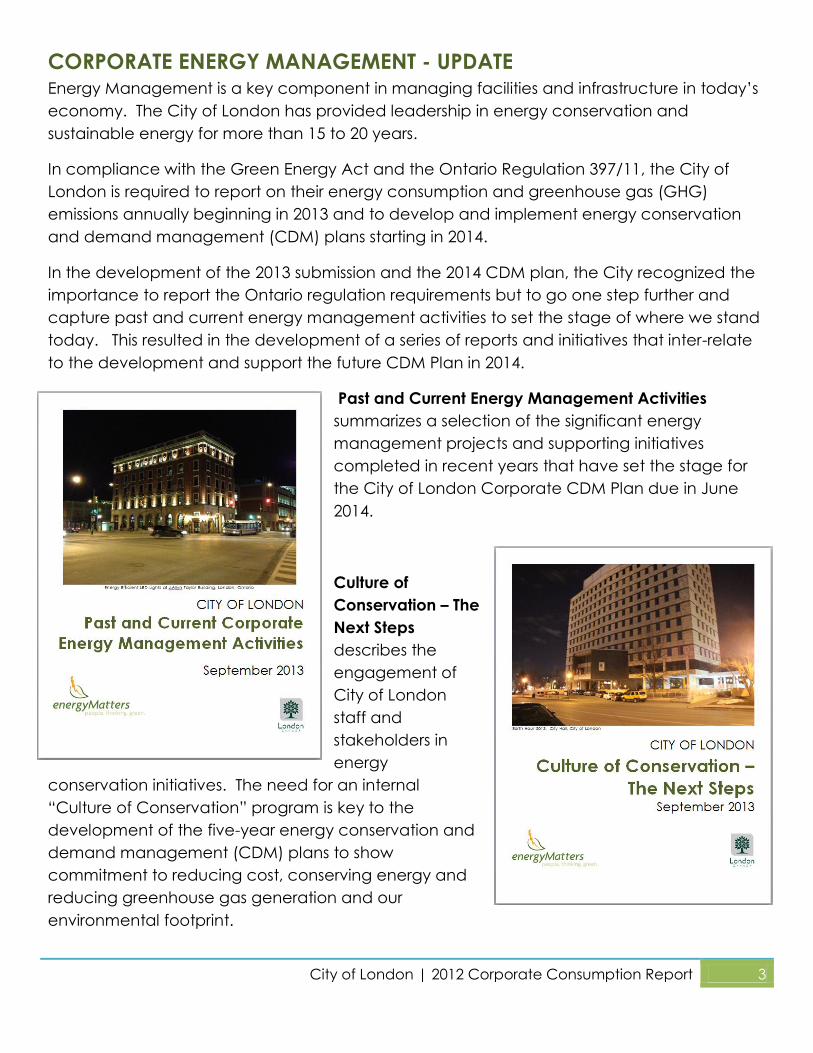
Past and Current Energy Management Activities
summarizes a selection of the significant energy
management projects and supporting initiatives
completed in recent years that have set the stage for
the City of London Corporate CDM Plan due in June
2014.
Culture of
Conservation – The
Next Steps
describes the
engagement of
City of London
staff and
stakeholders in
energy
conservation initiatives. The need for an internal
“Culture of Conservation” program is key to the
development of the five-year energy conservation and
demand management (CDM) plans to show
commitment to reducing cost, conserving energy and
reducing greenhouse gas generation and our
environmental footprint.
City of London | 2012 Corporate Consumption Report 4
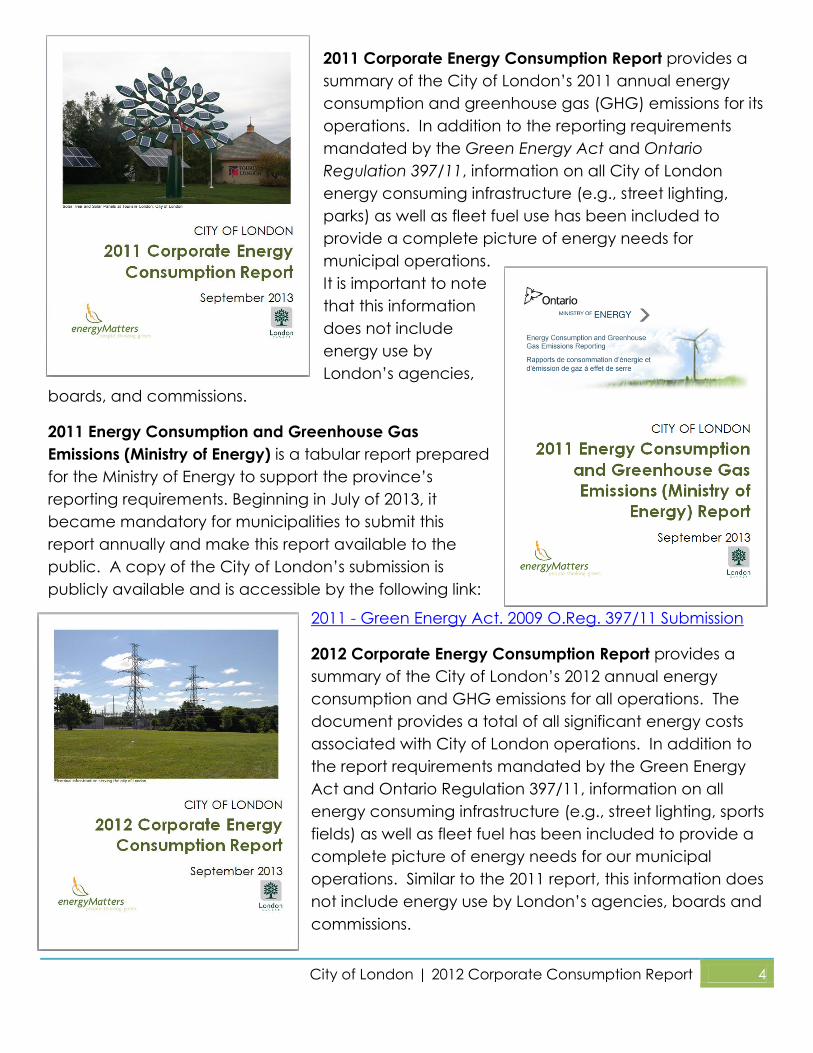
2011 Corporate Energy Consumption Report provides a
summary of the City of London’s 2011 annual energy
consumption and greenhouse gas (GHG) emissions for its
operations. In addition to the reporting requirements
mandated by the Green Energy Act and Ontario
Regulation 397/11, information on all City of London
energy consuming infrastructure (e.g., street lighting,
parks) as well as fleet fuel use has been included to
provide a complete picture of energy needs for
municipal operations.
It is important to note
that this information
does not include
energy use by
London’s agencies,
boards, and commissions.
2011 Energy Consumption and Greenhouse Gas
Emissions (Ministry of Energy) is a tabular report prepared
for the Ministry of Energy to support the province’s
reporting requirements. Beginning in July of 2013, it
became mandatory for municipalities to submit this
report annually and make this report available to the
public. A copy of the City of London’s submission is
publicly available and is accessible by the following link:
2011 - Green Energy Act. 2009 O.Reg. 397/11 Submission
2012 Corporate Energy Consumption Report provides a
summary of the City of London’s 2012 annual energy
consumption and GHG emissions for all operations. The
document provides a total of all significant energy costs
associated with City of London operations. In addition to
the report requirements mandated by the Green Energy
Act and Ontario Regulation 397/11, information on all
energy consuming infrastructure (e.g., street lighting, sports
fields) as well as fleet fuel has been included to provide a
complete picture of energy needs for our municipal
operations. Similar to the 2011 report, this information does
not include energy use by London’s agencies, boards and
commissions.
City of London | 2012 Corporate Consumption Report 5
Next Steps:
Corporate Energy Reporting – Ministry of Energy Requirements. With the preparation of the
previous reports and measures, the City of London has set the stage for preparing a strategic
plan to focus on corporate energy goals and objectives for energy conservation, energy
efficiency, renewable energy, and energy demand management. This report will be called
the Corporate CDM Plan and will fulfill the reporting requirements for the Ministry of Energy’s
Green Energy Act and the Ontario Regulation 397/11. Two reports are to be submitted by
July 1, 2014.
2012 – Green Energy Act. 2009 O Reg. 397/11 Submission
The Energy Consumption and GHG Emissions Template for 2012 will be updated and
provided to public agencies by the Ministry of Energy in order for them to comply with the
reporting requirement component of Regulation 397/11 under the Green Energy Act, 2009.
2014 – City of London Corporate Energy CDM Plan
Regulation 397/11 under the Green Energy Act, 2009 requires public agencies to develop
Conservation and Demand Management (CDM) plans starting in 2014 that include:
Reporting on annual energy consumption
The public agency’s goals and objectives for conserving and otherwise reducing
energy consumption and managing its demand for energy
Proposed measures under its CDM plan and the cost and saving estimates for these
proposed measures
A description of any renewable energy generation facilities and amount of energy
produced on an annual basis
City of London | 2012 Corporate Consumption Report 6
1 CORPORATE ENERGY CONSUMPTION – GETTING STARTED…
The 2012 Energy Consumption Report complements the City of London’s 2011 annual energy
consumption and greenhouse gas (GHG) emissions for its operations required by the Green
Energy Act Ontario Regulation 397/11. In addition to the Act requirements, this report
includes information on fleet fuel use and all City of London infrastructure to provide a
complete picture of energy needs for municipal operations. It is important to note that this
information does not include energy use by London’s agencies, boards, and commissions.
The report provides a summary of the annual energy consumption and GHG emissions for
current 2012 operations complete with comparable historical data for electricity, natural
gas, district energy (steam & chilled water), and fuel (diesel & gasoline).
This information will help assist with setting goals to contain and/or reduce the financial and
environmental impacts of energy use in corporate facilities and operations.
2 CORPORATE ENERGY CONSUMPTION OVERVIEW
The 2012 Corporate Energy Consumption Report provides a summary of the City of London’s
2012 annual energy consumption and GHG emissions for all operations. The document
provides a total of all significant energy costs associated with City of London operations. In
addition to the report requirements mandated by the Green Energy Act and Ontario
Regulation 397/11, information on all energy consuming infrastructure (e.g., street lighting,
sports fields) as well as fleet fuel has been included to provide a complete picture of energy
needs for our municipal operations.
Similar to 2011, this information does not include energy use by London’s agencies, boards
and commissions.
The Corporation spent approximately $16.2 million on energy, a decrease of 2 percent
from 2011. Electricity represents approximately 75 percent of corporate energy costs.
The Corporation consumed approximately 190 million “equivalent” kilowatt-hours
(ekWh) of energy, a decrease of 6 percent from 2011.
In terms of service delivery to Londoners, corporate energy use per person dropped by
10 percent from 2007 levels. This reduction can be attributed to recent energy
conservation measures and facility upgrades, as well as above-average winter
temperatures in 2012 that reduced the need for building heat. These energy savings
required a financial investment which produces both annual savings (true savings)
and an accumulating avoided future cost (money that would have been spent under
a ‘business as usual’ model):
City of London | 2012 Corporate Consumption Report 7
o Energy costs in 2012 were $750,000 less than they would have been if the City still
used energy at 2007 levels. This number would be even higher if compared against
the year 2000.
o The City has accumulated more than $1.5 million in avoided energy costs so far
since 2007 due to improved energy efficiency in service delivery and capital
investments.
o Between 2007 and 2012, the City spent between $300,000 to $600,000 per year in
operating costs associated with energy management staff, feasibility studies, and
other consulting costs.
o In this same period, the City spent between $250,000 and $1 million per year in
capital investments related to energy-efficiency projects. These investments create
energy savings every year over the life of the investment
o Energy cost for each commodity increases each year. Therefore, sustained energy
reductions become more important each year as each unit of energy consumed
becomes more expensive with rising energy prices.
Energy-related greenhouse gas emissions were 29,200 tonnes in 2012, a reduction of 34
percent from the baseline year of 2007. This is mainly due to the reduced use of coal-fired
power plants to generate electricity in Ontario.
Methods of Measurement
The City of London procured software in 2007 to log monthly utility bills for our municipally-
owned and administered buildings and facilities. The EnergyCap software has the capability
to track, monitor and capture data to assist the City of London with reporting consumption
and providing historical data.
Fleet data is provided from its software system Petrovend which is used for tracking vehicle
fuelling at City of London Operation Centres.
Limitations of Measurement
The annual energy consumption and greenhouse gas emissions for the City of London do not
include our Agencies, Boards & Commissions, nor does it include energy consumed in leased
office space where the utility costs are incorporated in the leasing agreements.
Annual transportation fuel consumption and GHG emissions for the City of London do not
include fuel consumption and emissions produced from the use of personal vehicles, railway
or air travel for work related tasks by staff or by contracted services by the City of London.
City of London | 2012 Corporate Consumption Report 8
3 CORPORATE ENERGY ANNUAL SUMMARY
In 2012, the City of London’s corporate energy summary is categorized by consumption and
the total cost of annual energy procured by commodity. Currently the City of London is
capable of tracking annual electricity, natural gas, steam, chilled water, diesel and gasoline
consumptions and costs. This allows the City of London to show the variances in costs
associated to consumption.
The City of London has averaged the 2012 energy consumptions and cost data in
comparison to London’s population. This allows the City to demonstrate and relay to
Londoners the energy consumed in relationship to service delivery provided by the
corporation.
The City of London uses 2007 as a baseline, due to the fact that this is the first set of utility
data within the EnergyCap software to track, monitor and capture data for tracking
purposes and to help form baseline calculations.
3.1 TOTAL CORPORATE ENERGY CONSUMPTION
With the use of EnergyCap software, the City of London has the ability to breakdown and
report annual energy consumption by the commodity and by Service Area.
3.1.1 ENERGY CONSUMPTION BY COMMODITY
Table 1 – Consumption by Commodity Comparison 2011-2012
In comparison to 2011, the City of London’s total energy consumption and percentage of
usage defined by commodity has shown a 6% reduction in 2012 as shown in Table 1.
Energy Consumption (ekWh) 2011 2012 Variance % Change
Electricity 111,804,000 108,533,000 (3,271,000) -3%
Natural Gas 53,265,000 46,264,000 (7,001,000) -13%
Steam 2,921,000 2,592,000 (329,000) -11%
Chilled Water 2,256,000 1,801,000 (455,000) -20%
Diesel Fuel 21,472,000 20,778,000 (694,000) -3%
Gasoline 6,944,000 7,083,000 139,000 2%
Total City Of London 198,662,000 187,051,000 (11,611,000) -6%
City of London | 2012 Corporate Consumption Report 9
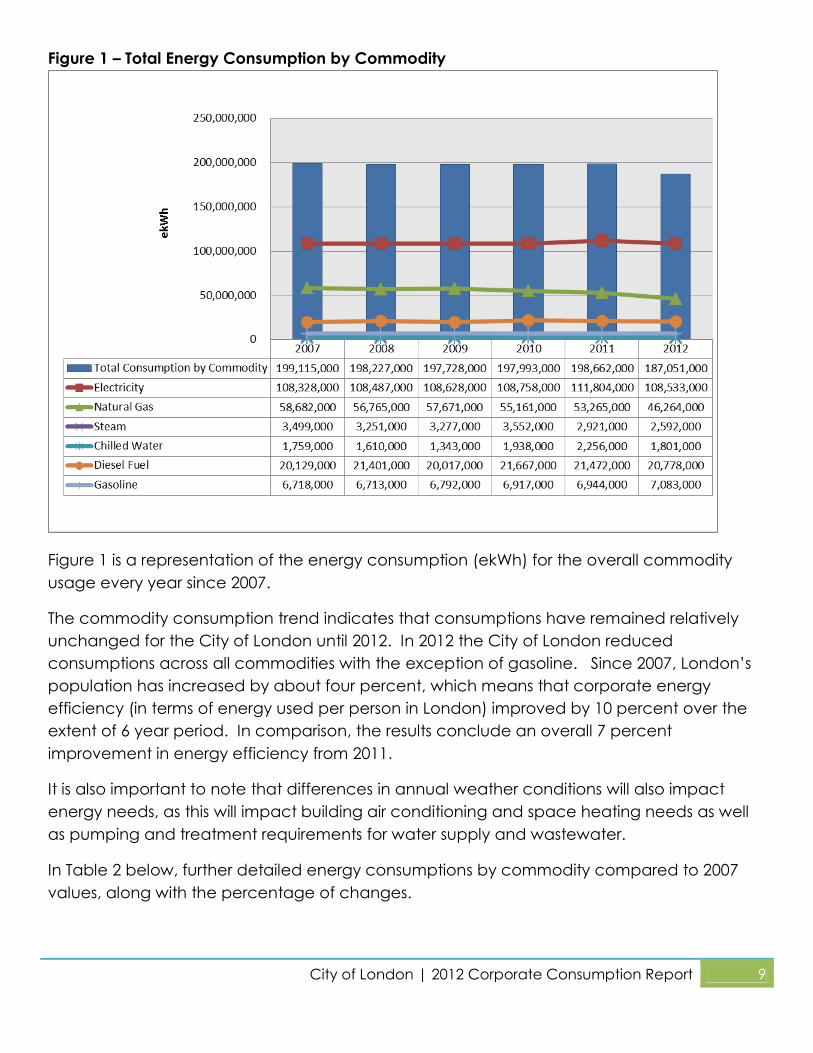
Figure 1 – Total Energy Consumption by Commodity
Figure 1 is a representation of the energy consumption (ekWh) for the overall commodity
usage every year since 2007.
The commodity consumption trend indicates that consumptions have remained relatively
unchanged for the City of London until 2012. In 2012 the City of London reduced
consumptions across all commodities with the exception of gasoline. Since 2007, London’s
population has increased by about four percent, which means that corporate energy
efficiency (in terms of energy used per person in London) improved by 10 percent over the
extent of 6 year period. In comparison, the results conclude an overall 7 percent
improvement in energy efficiency from 2011.
It is also important to note that differences in annual weather conditions will also impact
energy needs, as this will impact building air conditioning and space heating needs as well
as pumping and treatment requirements for water supply and wastewater.
In Table 2 below, further detailed energy consumptions by commodity compared to 2007
values, along with the percentage of changes.
City of London | 2012 Corporate Consumption Report 10
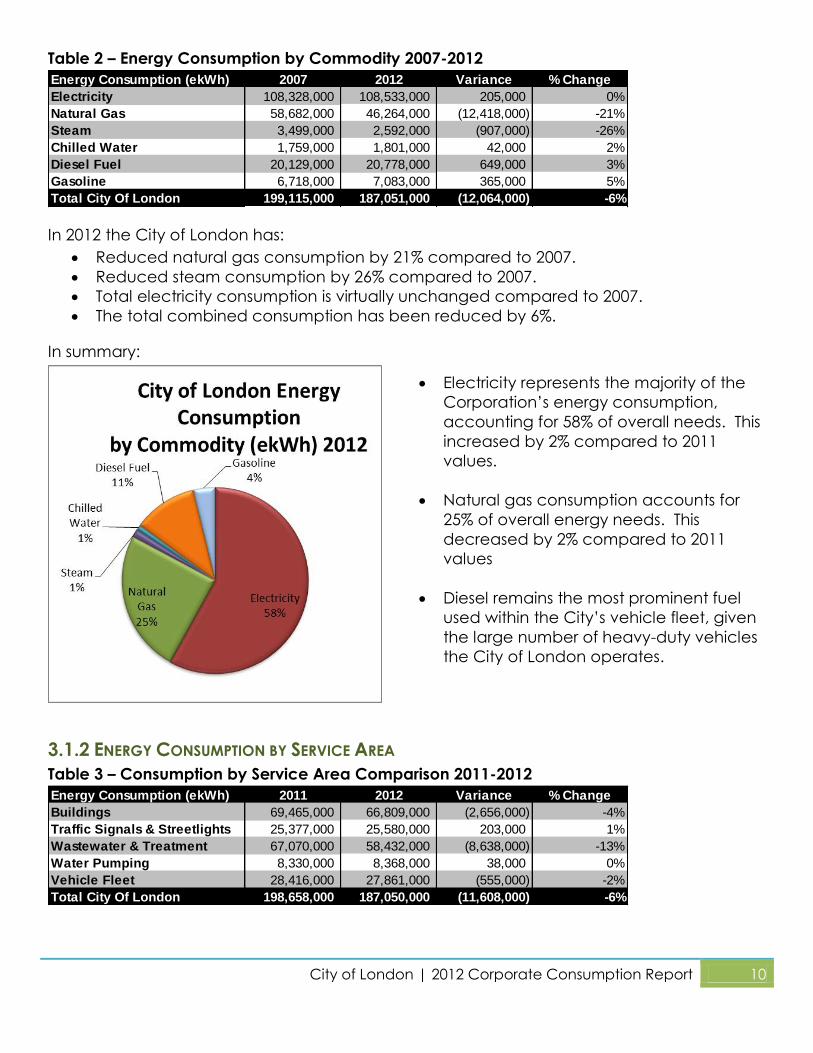
Table 2 – Energy Consumption by Commodity 2007-2012
In 2012 the City of London has:
Reduced natural gas consumption by 21% compared to 2007.
Reduced steam consumption by 26% compared to 2007.
Total electricity consumption is virtually unchanged compared to 2007.
The total combined consumption has been reduced by 6%.
In summary:
3.1.2 ENERGY CONSUMPTION BY SERVICE AREA
Table 3 – Consumption by Service Area Comparison 2011-2012
Energy Consumption (ekWh) 2007 2012 Variance % Change
Electricity 108,328,000 108,533,000 205,000 0%
Natural Gas 58,682,000 46,264,000 (12,418,000) -21%
Steam 3,499,000 2,592,000 (907,000) -26%
Chilled Water 1,759,000 1,801,000 42,000 2%
Diesel Fuel 20,129,000 20,778,000 649,000 3%
Gasoline 6,718,000 7,083,000 365,000 5%
Total City Of London 199,115,000 187,051,000 (12,064,000) -6%
Energy Consumption (ekWh) 2011 2012 Variance % Change
Buildings 69,465,000 66,809,000 (2,656,000) -4%
Traffic Signals & Streetlights 25,377,000 25,580,000 203,000 1%
Wastewater & Treatment 67,070,000 58,432,000 (8,638,000) -13%
Water Pumping 8,330,000 8,368,000 38,000 0%
Vehicle Fleet 28,416,000 27,861,000 (555,000) -2%
Total City Of London 198,658,000 187,050,000 (11,608,000) -6%
Electricity represents the majority of the
Corporation’s energy consumption,
accounting for 58% of overall needs. This
increased by 2% compared to 2011
values.
Natural gas consumption accounts for
25% of overall energy needs. This
decreased by 2% compared to 2011
values
Diesel remains the most prominent fuel
used within the City’s vehicle fleet, given
the large number of heavy-duty vehicles
the City of London operates.
City of London | 2012 Corporate Consumption Report 11
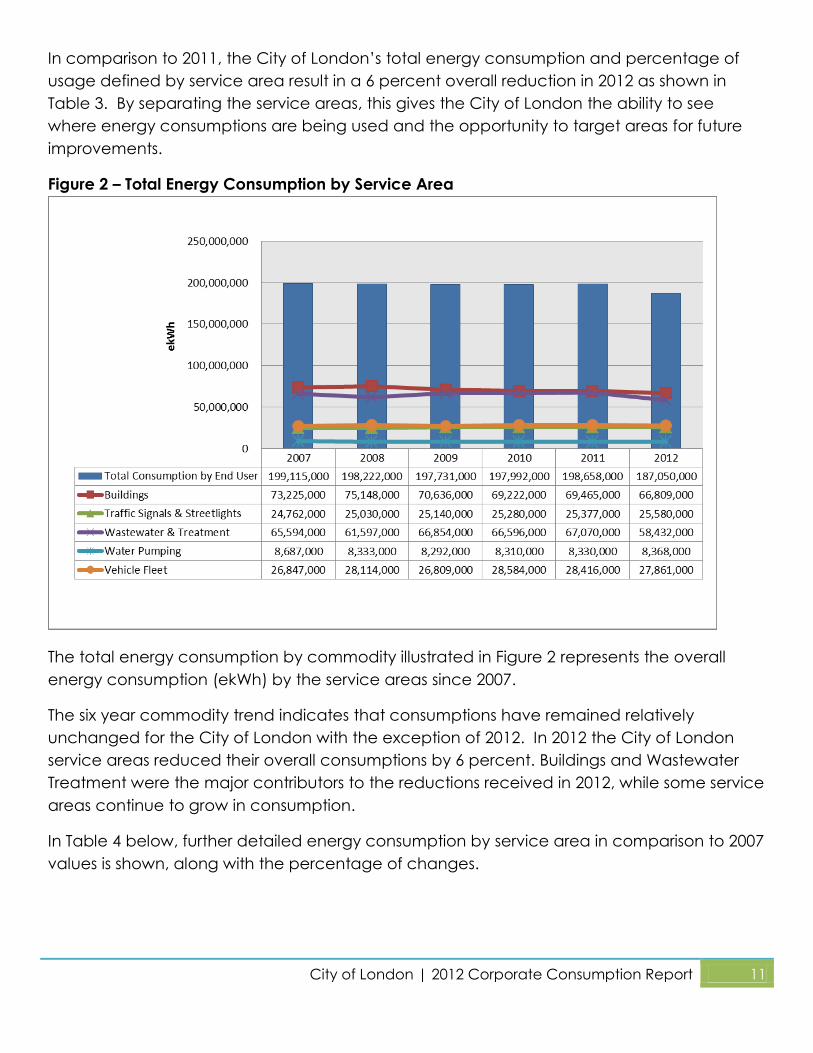
In comparison to 2011, the City of London’s total energy consumption and percentage of
usage defined by service area result in a 6 percent overall reduction in 2012 as shown in
Table 3. By separating the service areas, this gives the City of London the ability to see
where energy consumptions are being used and the opportunity to target areas for future
improvements.
Figure 2 – Total Energy Consumption by Service Area
The total energy consumption by commodity illustrated in Figure 2 represents the overall
energy consumption (ekWh) by the service areas since 2007.
The six year commodity trend indicates that consumptions have remained relatively
unchanged for the City of London with the exception of 2012. In 2012 the City of London
service areas reduced their overall consumptions by 6 percent. Buildings and Wastewater
Treatment were the major contributors to the reductions received in 2012, while some service
areas continue to grow in consumption.
In Table 4 below, further detailed energy consumption by service area in comparison to 2007
values is shown, along with the percentage of changes.
City of London | 2012 Corporate Consumption Report 12
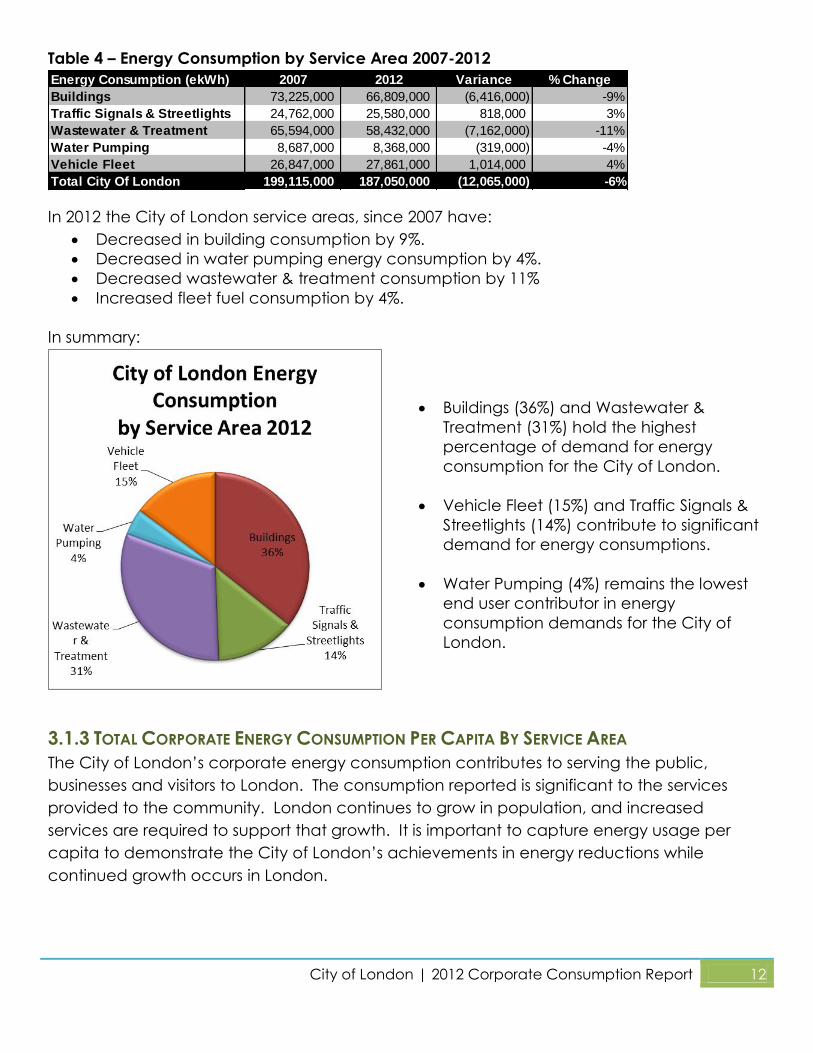
Table 4 – Energy Consumption by Service Area 2007-2012
In 2012 the City of London service areas, since 2007 have:
Decreased in building consumption by 9%.
Decreased in water pumping energy consumption by 4%.
Decreased wastewater & treatment consumption by 11%
Increased fleet fuel consumption by 4%.
In summary:
3.1.3 TOTAL CORPORATE ENERGY CONSUMPTION PER CAPITA BY SERVICE AREA
The City of London’s corporate energy consumption contributes to serving the public,
businesses and visitors to London. The consumption reported is significant to the services
provided to the community. London continues to grow in population, and increased
services are required to support that growth. It is important to capture energy usage per
capita to demonstrate the City of London’s achievements in energy reductions while
continued growth occurs in London.
Energy Consumption (ekWh) 2007 2012 Variance % Change
Buildings 73,225,000 66,809,000 (6,416,000) -9%
Traffic Signals & Streetlights 24,762,000 25,580,000 818,000 3%
Wastewater & Treatment 65,594,000 58,432,000 (7,162,000) -11%
Water Pumping 8,687,000 8,368,000 (319,000) -4%
Vehicle Fleet 26,847,000 27,861,000 1,014,000 4%
Total City Of London 199,115,000 187,050,000 (12,065,000) -6%
Buildings (36%) and Wastewater &
Treatment (31%) hold the highest
percentage of demand for energy
consumption for the City of London.
Vehicle Fleet (15%) and Traffic Signals &
Streetlights (14%) contribute to significant
demand for energy consumptions.
Water Pumping (4%) remains the lowest
end user contributor in energy
consumption demands for the City of
London.
City of London | 2012 Corporate Consumption Report 13
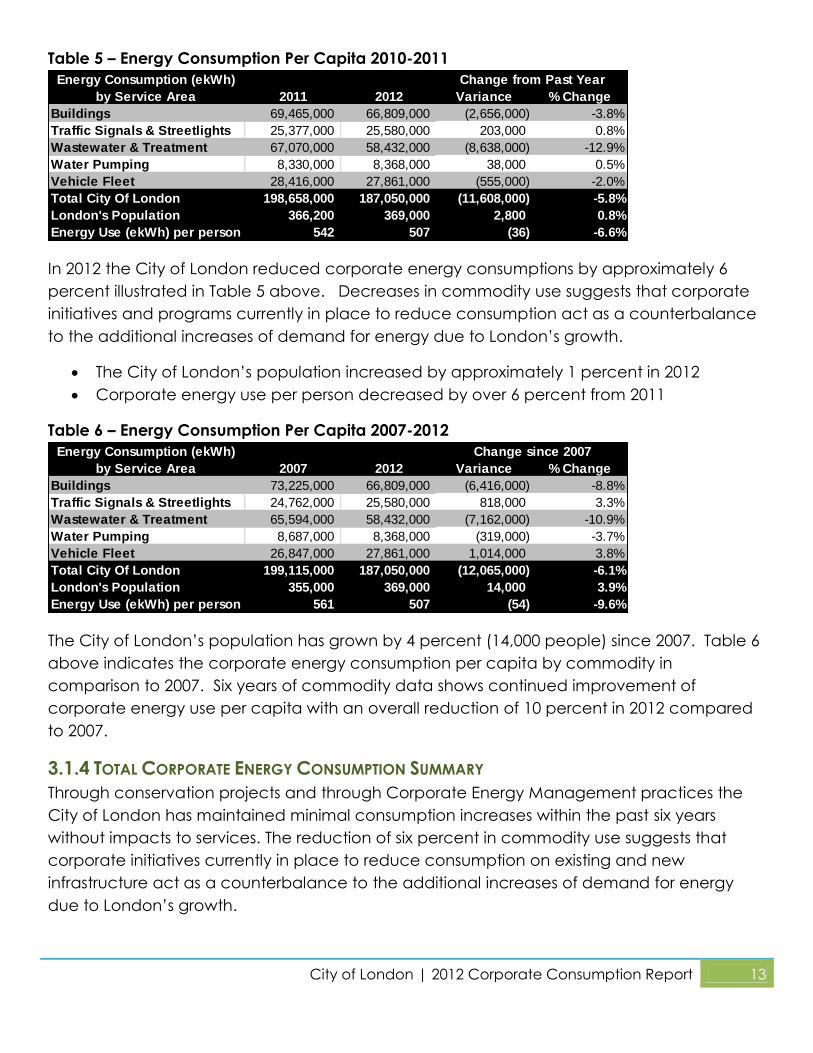
Table 5 – Energy Consumption Per Capita 2010-2011
In 2012 the City of London reduced corporate energy consumptions by approximately 6
percent illustrated in Table 5 above. Decreases in commodity use suggests that corporate
initiatives and programs currently in place to reduce consumption act as a counterbalance
to the additional increases of demand for energy due to London’s growth.
The City of London’s population increased by approximately 1 percent in 2012
Corporate energy use per person decreased by over 6 percent from 2011
Table 6 – Energy Consumption Per Capita 2007-2012
The City of London’s population has grown by 4 percent (14,000 people) since 2007. Table 6
above indicates the corporate energy consumption per capita by commodity in
comparison to 2007. Six years of commodity data shows continued improvement of
corporate energy use per capita with an overall reduction of 10 percent in 2012 compared
to 2007.
3.1.4 TOTAL CORPORATE ENERGY CONSUMPTION SUMMARY
Through conservation projects and through Corporate Energy Management practices the
City of London has maintained minimal consumption increases within the past six years
without impacts to services. The reduction of six percent in commodity use suggests that
corporate initiatives currently in place to reduce consumption on existing and new
infrastructure act as a counterbalance to the additional increases of demand for energy
due to London’s growth.
2011 2012 Variance % Change
Buildings 69,465,000 66,809,000 (2,656,000) -3.8%
Traffic Signals & Streetlights 25,377,000 25,580,000 203,000 0.8%
Wastewater & Treatment 67,070,000 58,432,000 (8,638,000) -12.9%
Water Pumping 8,330,000 8,368,000 38,000 0.5%
Vehicle Fleet 28,416,000 27,861,000 (555,000) -2.0%
Total City Of London 198,658,000 187,050,000 (11,608,000) -5.8%
London's Population 366,200 369,000 2,800 0.8%
Energy Use (ekWh) per person 542 507 (36) -6.6%
Energy Consumption (ekWh)
by Service Area
Change from Past Year
2007 2012 Variance % Change
Buildings 73,225,000 66,809,000 (6,416,000) -8.8%
Traffic Signals & Streetlights 24,762,000 25,580,000 818,000 3.3%
Wastewater & Treatment 65,594,000 58,432,000 (7,162,000) -10.9%
Water Pumping 8,687,000 8,368,000 (319,000) -3.7%
Vehicle Fleet 26,847,000 27,861,000 1,014,000 3.8%
Total City Of London 199,115,000 187,050,000 (12,065,000) -6.1%
London's Population 355,000 369,000 14,000 3.9%
Energy Use (ekWh) per person 561 507 (54) -9.6%
Energy Consumption (ekWh)
by Service Area
Change since 2007
City of London | 2012 Corporate Consumption Report 14
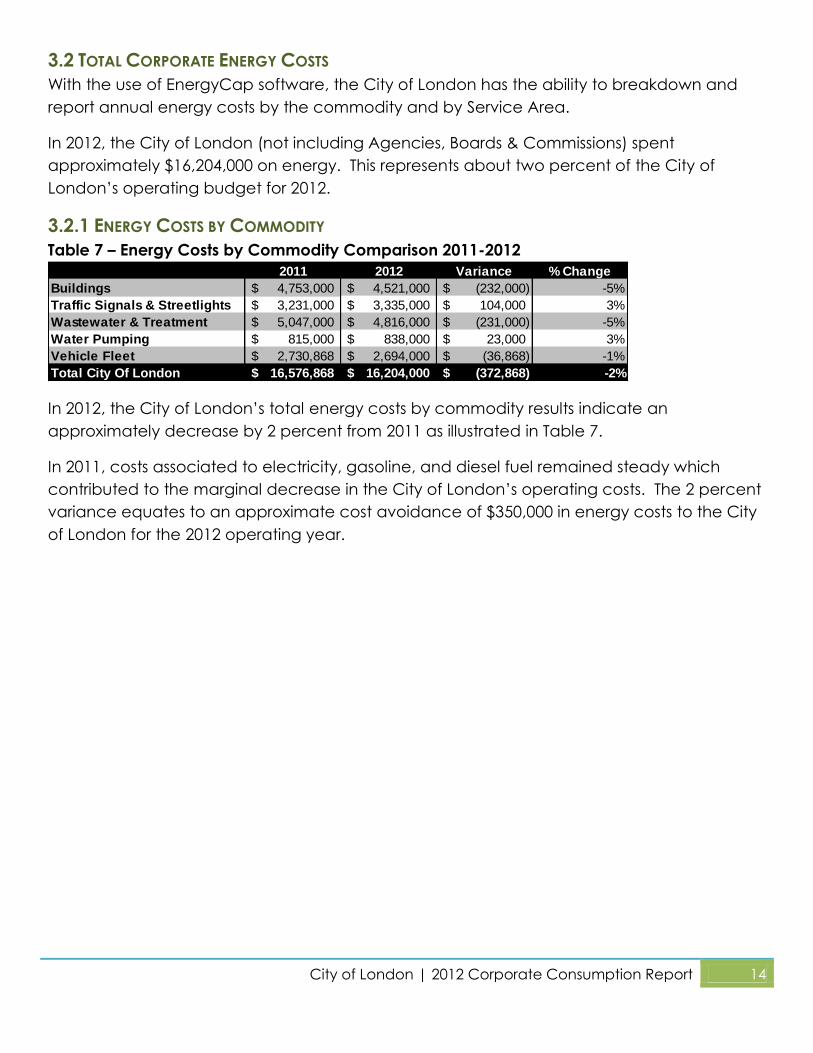
3.2 TOTAL CORPORATE ENERGY COSTS
With the use of EnergyCap software, the City of London has the ability to breakdown and
report annual energy costs by the commodity and by Service Area.
In 2012, the City of London (not including Agencies, Boards & Commissions) spent
approximately $16,204,000 on energy. This represents about two percent of the City of
London’s operating budget for 2012.
3.2.1 ENERGY COSTS BY COMMODITY
Table 7 – Energy Costs by Commodity Comparison 2011-2012
In 2012, the City of London’s total energy costs by commodity results indicate an
approximately decrease by 2 percent from 2011 as illustrated in Table 7.
In 2011, costs associated to electricity, gasoline, and diesel fuel remained steady which
contributed to the marginal decrease in the City of London’s operating costs. The 2 percent
variance equates to an approximate cost avoidance of $350,000 in energy costs to the City
of London for the 2012 operating year.
2011 2012 Variance % Change
Buildings 4,753,000$ 4,521,000$ (232,000)$ -5%
Traffic Signals & Streetlights 3,231,000$ 3,335,000$ 104,000$ 3%
Wastewater & Treatment 5,047,000$ 4,816,000$ (231,000)$ -5%
Water Pumping 815,000$ 838,000$ 23,000$ 3%
Vehicle Fleet 2,730,868$ 2,694,000$ (36,868)$ -1%
Total City Of London 16,576,868$ 16,204,000$ (372,868)$ -2%
City of London | 2012 Corporate Consumption Report 15
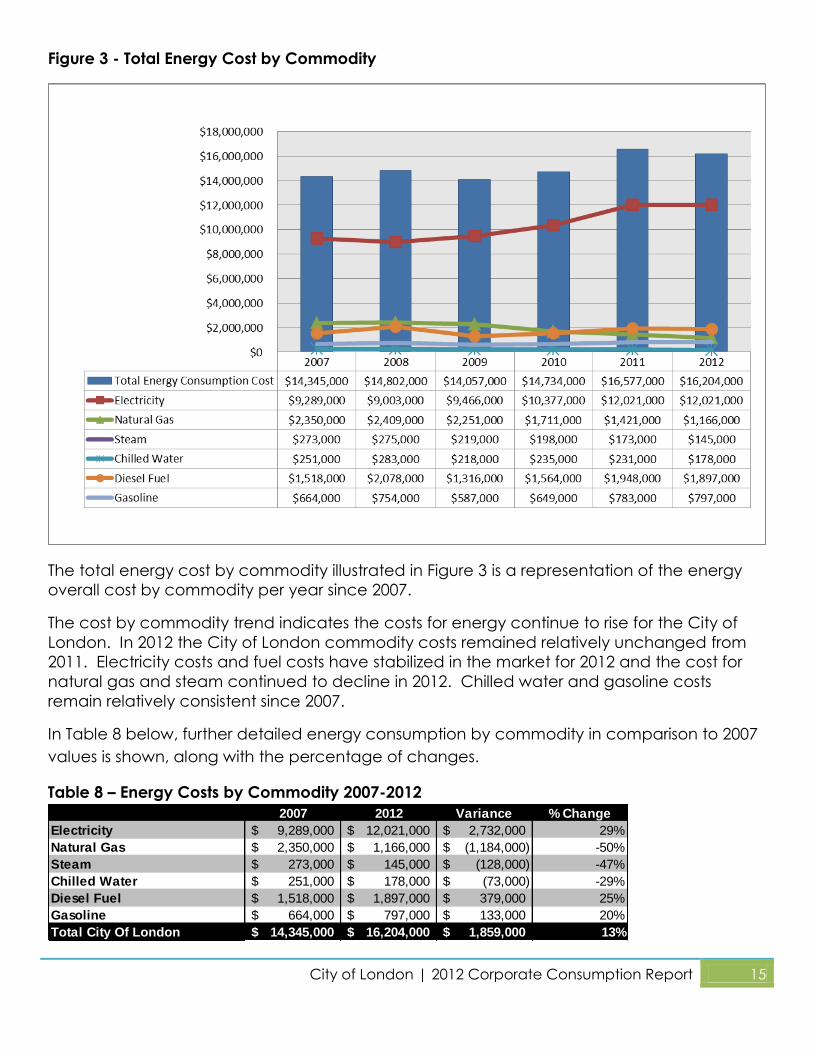
Figure 3 - Total Energy Cost by Commodity
The total energy cost by commodity illustrated in Figure 3 is a representation of the energy
overall cost by commodity per year since 2007.
The cost by commodity trend indicates the costs for energy continue to rise for the City of
London. In 2012 the City of London commodity costs remained relatively unchanged from
2011. Electricity costs and fuel costs have stabilized in the market for 2012 and the cost for
natural gas and steam continued to decline in 2012. Chilled water and gasoline costs
remain relatively consistent since 2007.
In Table 8 below, further detailed energy consumption by commodity in comparison to 2007
values is shown, along with the percentage of changes.
Table 8 – Energy Costs by Commodity 2007-2012
2007 2012 Variance % Change
Electricity 9,289,000$ 12,021,000$ 2,732,000$ 29%
Natural Gas 2,350,000$ 1,166,000$ (1,184,000)$ -50%
Steam 273,000$ 145,000$ (128,000)$ -47%
Chilled Water 251,000$ 178,000$ (73,000)$ -29%
Diesel Fuel 1,518,000$ 1,897,000$ 379,000$ 25%
Gasoline 664,000$ 797,000$ 133,000$ 20%
Total City Of London 14,345,000$ 16,204,000$ 1,859,000$ 13%
City of London | 2012 Corporate Consumption Report 16
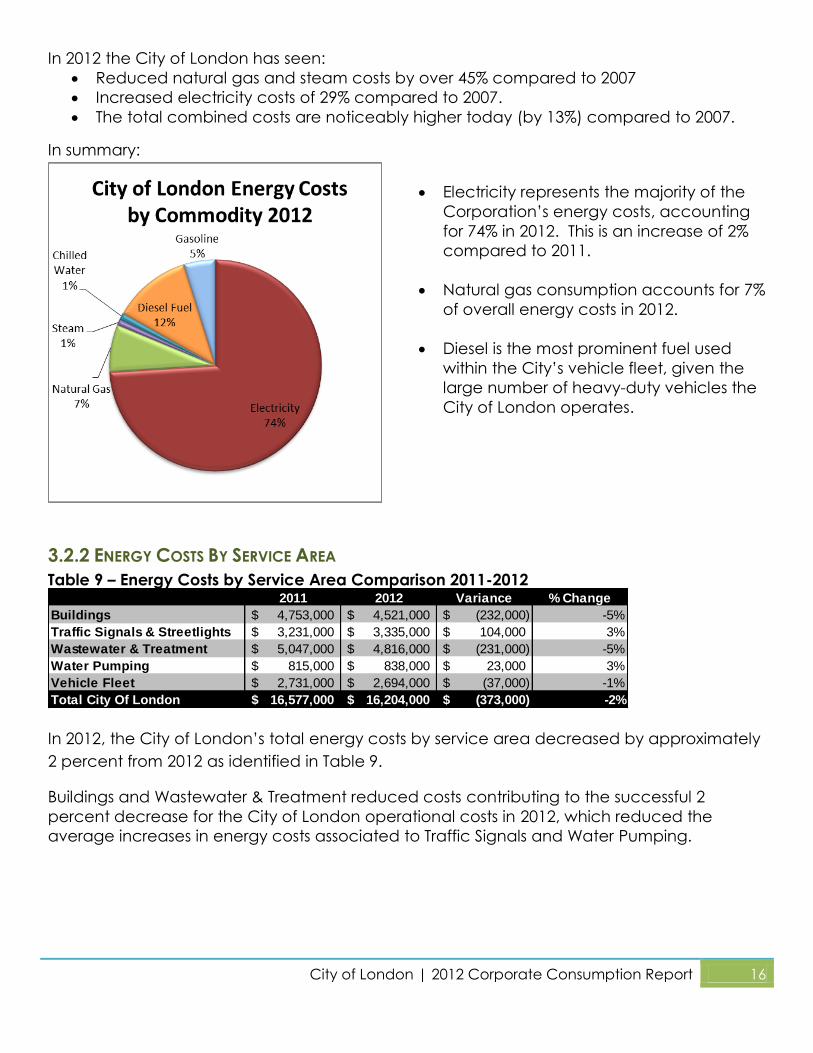
In 2012 the City of London has seen:
Reduced natural gas and steam costs by over 45% compared to 2007
Increased electricity costs of 29% compared to 2007.
The total combined costs are noticeably higher today (by 13%) compared to 2007.
In summary:
Electricity represents the majority of the
Corporation’s energy costs, accounting
for 74% in 2012. This is an increase of 2%
compared to 2011.
Natural gas consumption accounts for 7%
of overall energy costs in 2012.
Diesel is the most prominent fuel used
within the City’s vehicle fleet, given the
large number of heavy-duty vehicles the
City of London operates.
3.2.2 ENERGY COSTS BY SERVICE AREA
Table 9 – Energy Costs by Service Area Comparison 2011-2012
In 2012, the City of London’s total energy costs by service area decreased by approximately
2 percent from 2012 as identified in Table 9.
Buildings and Wastewater & Treatment reduced costs contributing to the successful 2
percent decrease for the City of London operational costs in 2012, which reduced the
average increases in energy costs associated to Traffic Signals and Water Pumping.
2011 2012 Variance % Change
Buildings 4,753,000$ 4,521,000$ (232,000)$ -5%
Traffic Signals & Streetlights 3,231,000$ 3,335,000$ 104,000$ 3%
Wastewater & Treatment 5,047,000$ 4,816,000$ (231,000)$ -5%
Water Pumping 815,000$ 838,000$ 23,000$ 3%
Vehicle Fleet 2,731,000$ 2,694,000$ (37,000)$ -1%
Total City Of London 16,577,000$ 16,204,000$ (373,000)$ -2%
City of London | 2012 Corporate Consumption Report 17
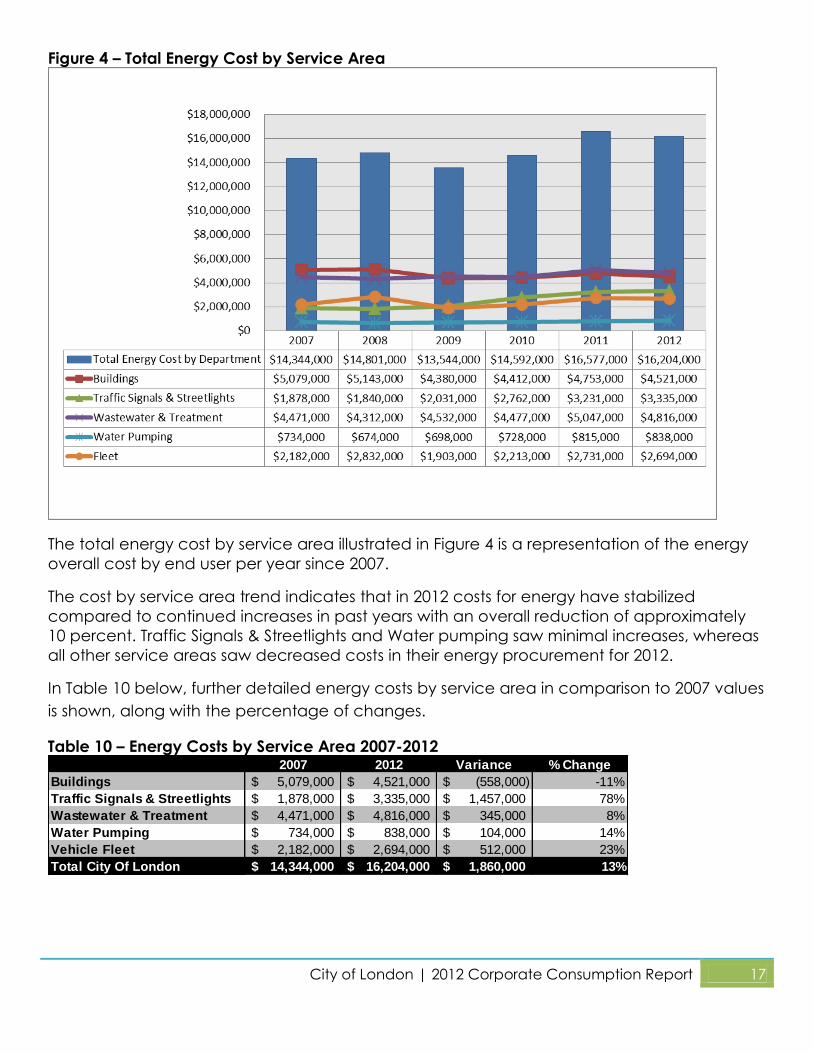
Figure 4 – Total Energy Cost by Service Area
The total energy cost by service area illustrated in Figure 4 is a representation of the energy
overall cost by end user per year since 2007.
The cost by service area trend indicates that in 2012 costs for energy have stabilized
compared to continued increases in past years with an overall reduction of approximately
10 percent. Traffic Signals & Streetlights and Water pumping saw minimal increases, whereas
all other service areas saw decreased costs in their energy procurement for 2012.
In Table 10 below, further detailed energy costs by service area in comparison to 2007 values
is shown, along with the percentage of changes.
Table 10 – Energy Costs by Service Area 2007-2012
2007 2012 Variance % Change
Buildings 5,079,000$ 4,521,000$ (558,000)$ -11%
Traffic Signals & Streetlights 1,878,000$ 3,335,000$ 1,457,000$ 78%
Wastewater & Treatment 4,471,000$ 4,816,000$ 345,000$ 8%
Water Pumping 734,000$ 838,000$ 104,000$ 14%
Vehicle Fleet 2,182,000$ 2,694,000$ 512,000$ 23%
Total City Of London 14,344,000$ 16,204,000$ 1,860,000$ 13%
City of London | 2012 Corporate Consumption Report 18
In 2012 the City of London service areas have seen:
Decreased building energy costs by 11% compared to 2007
Increased traffic signals & streetlight costs by 78% compared to 2007
The total combined energy costs by end user are 13% higher today compared to 2007
In summary:
Wastewater pumping and treatment
represents the majority of the
Corporation’s energy costs by service
area, accounting for 30% for 2012
Buildings continue to account for 28% of
overall end user energy costs compared
to 2012
Street lighting & traffic signals are the
third highest contributor in energy
consumed by end user at 20%
3.2.3 ENERGY COSTS PER CAPITA
The operation, maintenance and services provided by the City of London contribute to the
overall corporate energy costs associated to serving the public, businesses and visitors of
London.
Table 11 – Energy Costs Per Capita 2011-2012
In 2012 the City of London reduced corporate energy costs by approximately 2 percent
compared to 2011. Table 11 above reflects the corporate energy costs per capita by
service area for the City of London. Decreased cost suggests that corporate initiatives and
2011 2012 Variance % Change
Buildings 4,753,000$ 4,521,000$ (232,000)$ -4.9%
Traffic Signals & Streetlights 3,231,000$ 3,335,000$ 104,000$ 3.2%
Wastewater & Treatment 5,047,000$ 4,816,000$ (231,000)$ -4.6%
Water Pumping 815,000$ 838,000$ 23,000$ 2.8%
Fleet 2,731,000$ 2,694,000$ (37,000)$ -1.4%
Total City Of London 16,577,000$ 16,204,000$ (373,000)$ -2.3%
London's Population 366,200 369,000 2,800 0.8%
Energy costs per person 45$ 44$ (1.35)$ -3.0%
Energy Costs by Service Area
Change from Past Year
City of London | 2012 Corporate Consumption Report 19
programs currently in place support the City of London to reduce energy costs as the city
continues to see growth. In 2012:
The City of London’s population increased by approximately 1 percent
Corporate energy costs per person decreased by 3 percent
Table 12 – Energy Costs Per Capita by Service Area 2007-2012
The City of London’s population has grown by 4 percent (14,000 people) since 2007. Table
12 above indicates the corporate energy costs per capita by service area in comparison to
2007. Six years of commodity data shows continued energy cost increases for corporate
energy with an overall increase of 9 percent in corporate energy use per capita from 2007.
3.2.4 TOTAL CORPORATE ENERGY COST SUMMARY
Total corporate energy costs continue to increase, with the price of electricity in Ontario
being the major contributor. However, corporate energy management practices by the
City of London to include cost avoidance measures through procurement, building retrofits,
and other conservation measures assist in continued efforts to reduce amounts of energy to
help avoid the market cost increase.
The City of London is committed to reducing energy costs. 2012 indicates positive returns to
this commitment. The energy improvements and cost avoidance measures being
implemented today are helping to avoid and sustain the market changes and inflation costs
the City of London is faced with in the associated costs to procure energy.
4 CORPORATE ENERGY COST AVOIDANCE
In terms of service delivery to Londoners, energy use per person has dropped by 10 percent
since 2007 levels. This energy reduction can be attributed to recent energy conservation
and facility upgrades, as well as above average seasonal winter temperatures in 2012
compared to 2007 data.
2007 2012 Variance % Change
Buildings 5,079,000$ 4,521,000$ (558,000)$ -11.0%
Traffic Signals & Streetlights 1,878,000$ 3,335,000$ 1,457,000$ 77.6%
Wastewater & Treatment 4,471,000$ 4,816,000$ 345,000$ 7.7%
Water Pumping 734,000$ 838,000$ 104,000$ 14.2%
Fleet 2,182,000$ 2,694,000$ 512,000$ 23.5%
Total City Of London 14,344,000$ 16,204,000$ 1,860,000$ 13.0%
London's Population 355,000 369,000 14,000 3.9%
Energy costs per person 40$ 44$ 3.51$ 8.7%
Energy Costs by Service Area
Change since 2007
City of London | 2012 Corporate Consumption Report 20
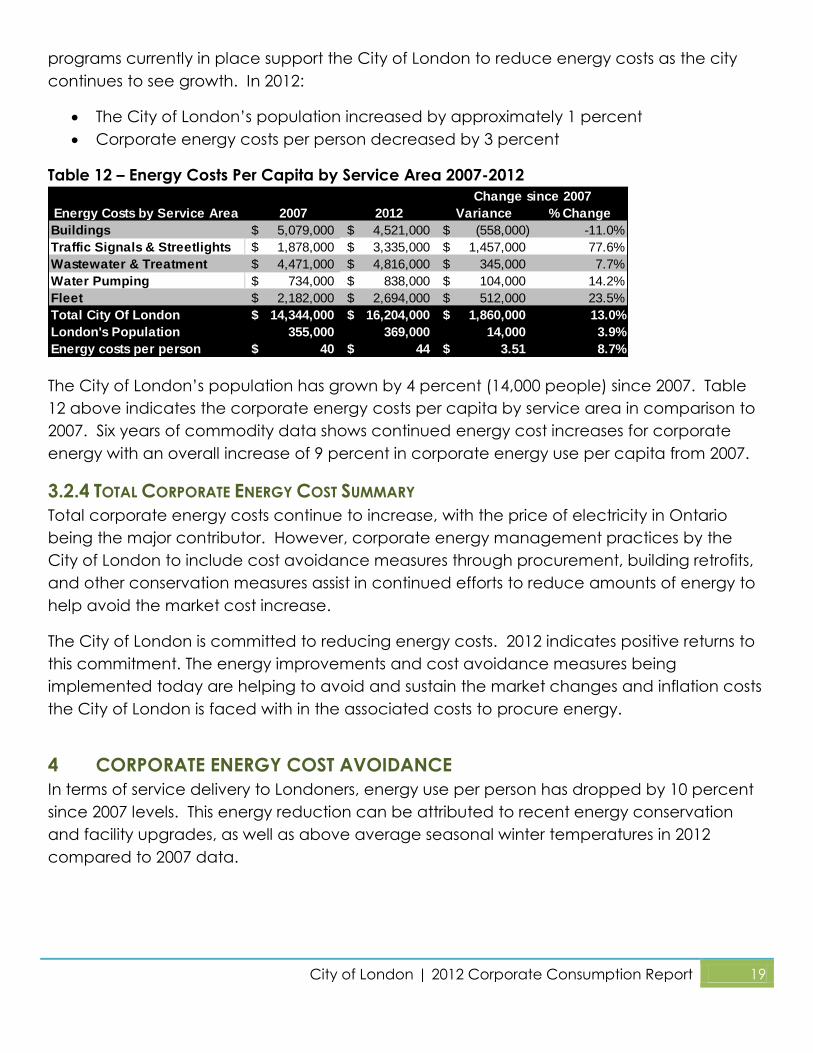
Table 13 – Energy Costs Per Capita by Service Area 2007-2012
Approximately $750,000 in energy costs were avoided in 2012 compared to 2007 levels, and
more than $1.5 million in energy savings have been accumulated since 2007.
Figure 5 – Avoided Energy Costs
5 CORPORATE GREENHOUSE GAS EMISSIONS
In 2012 the City of London’s corporate GHG emissions can be summarized by commodity
and by service area. Based on the City of London’s current use of electricity, natural gas,
steam, chilled water, diesel and gasoline consumptions and costs, GHG emissions can be
calculated. The total GHG reflects the municipal operations and can be measured annually
back to 2007. This allows the City of London to show trends in GHG emissions over the last six
years.
5.1 TOTAL CORPORATE GREENHOUSE GAS EMISSIONS BY COMMODITY
In 2012, the City of London’s energy-related greenhouse gas emissions by commodity
decreased by 34 percent from 2007. This is a 2 percent increase in reductions of greenhouse
gas emissions from 2011.
2007 2012 Variance % Change
Electricity 305 294 (11) -3.6% (434,000)$
Natural Gas 165 125 (40) -24.2% (282,000)$
Steam 10 7 (3) -28.7% (42,000)$
Chilled Water 5 5 (0) -1.5% (3,000)$
Diesel Fuel 57 56 (0) -0.7% (13,000)$
Gasoline 19 19 0 1.4% 11,000$
Total City Of London 561 507 (54) -9.6% ($763,000)
Energy Consumption (ekWh)
by Commodity per person
Change since 2007 2007-2012
Avoided Costs
$13,000,000
$14,000,000
$15,000,000
$16,000,000
$17,000,000
$18,000,000
2007 2008 2009 2010 2011 2012
Total Energy Costs Business-As-Usual (2007 Baseline) vs Actual
Projected Business-as-Usual Energy Costs Actual Energy Costs
$1.5 million Accumulated Savings
City of London | 2012 Corporate Consumption Report 21
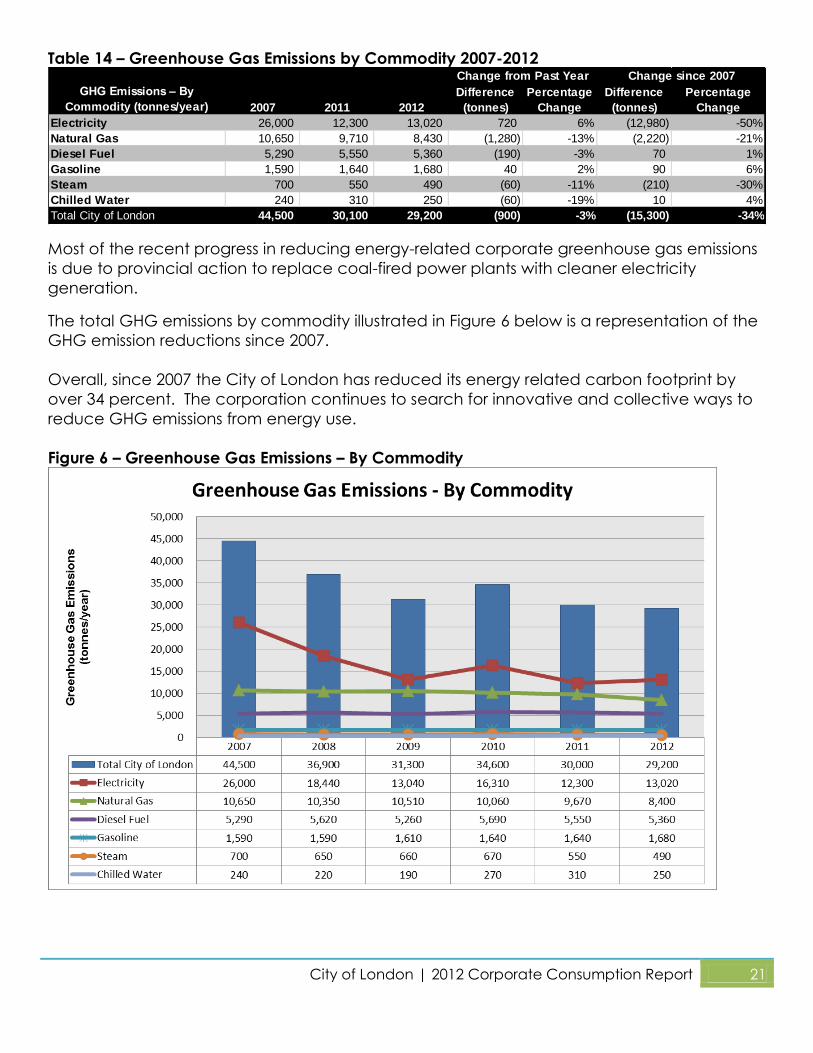
Table 14 – Greenhouse Gas Emissions by Commodity 2007-2012
Most of the recent progress in reducing energy-related corporate greenhouse gas emissions
is due to provincial action to replace coal-fired power plants with cleaner electricity
generation.
The total GHG emissions by commodity illustrated in Figure 6 below is a representation of the
GHG emission reductions since 2007.
Overall, since 2007 the City of London has reduced its energy related carbon footprint by
over 34 percent. The corporation continues to search for innovative and collective ways to
reduce GHG emissions from energy use.
Figure 6 – Greenhouse Gas Emissions – By Commodity
2007 2011 2012
Difference
(tonnes)
Percentage
Change
Difference
(tonnes)
Percentage
Change
Electricity 26,000 12,300 13,020 720 6% (12,980) -50%
Natural Gas 10,650 9,710 8,430 (1,280) -13% (2,220) -21%
Diesel Fuel 5,290 5,550 5,360 (190) -3% 70 1%
Gasoline 1,590 1,640 1,680 40 2% 90 6%
Steam 700 550 490 (60) -11% (210) -30%
Chilled Water 240 310 250 (60) -19% 10 4%
Total City of London 44,500 30,100 29,200 (900) -3% (15,300) -34%
Change from Past Year Change since 2007
GHG Emissions – By
Commodity (tonnes/year)
City of London | 2012 Corporate Consumption Report 22
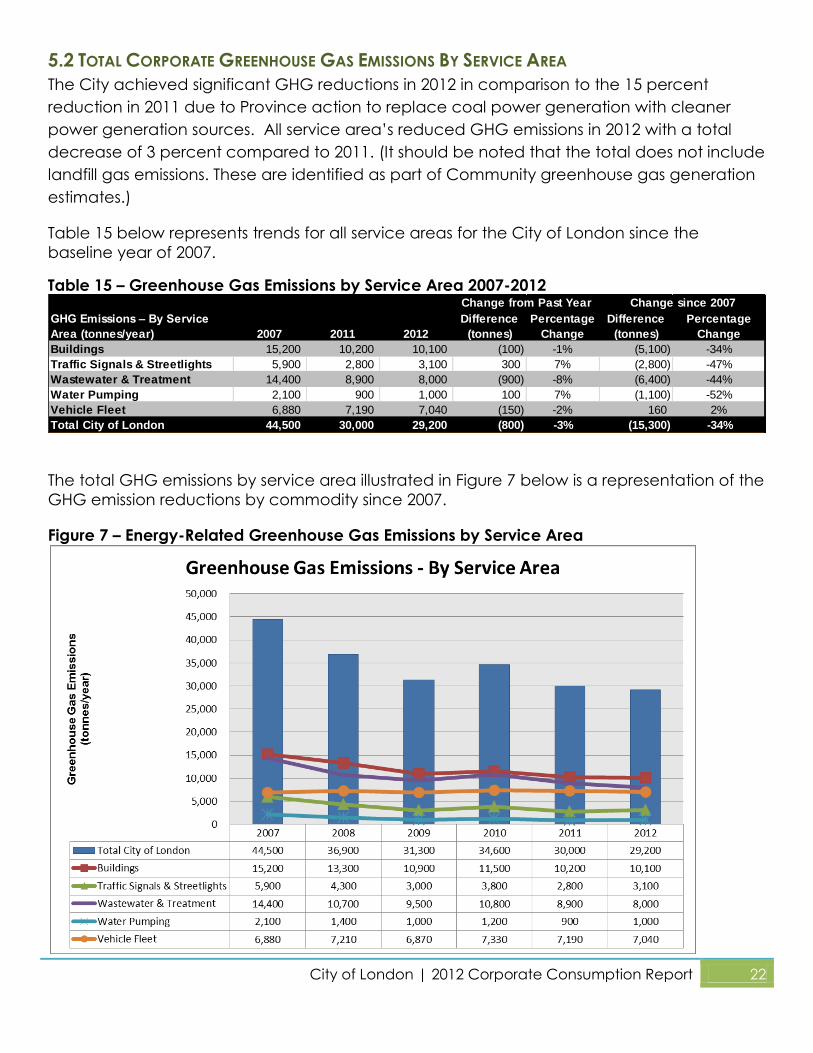
5.2 TOTAL CORPORATE GREENHOUSE GAS EMISSIONS BY SERVICE AREA
The City achieved significant GHG reductions in 2012 in comparison to the 15 percent
reduction in 2011 due to Province action to replace coal power generation with cleaner
power generation sources. All service area’s reduced GHG emissions in 2012 with a total
decrease of 3 percent compared to 2011. (It should be noted that the total does not include
landfill gas emissions. These are identified as part of Community greenhouse gas generation
estimates.)
Table 15 below represents trends for all service areas for the City of London since the
baseline year of 2007.
Table 15 – Greenhouse Gas Emissions by Service Area 2007-2012
The total GHG emissions by service area illustrated in Figure 7 below is a representation of the
GHG emission reductions by commodity since 2007.
Figure 7 – Energy-Related Greenhouse Gas Emissions by Service Area
GHG Emissions – By Service
Area (tonnes/year) 2007 2011 2012
Difference
(tonnes)
Percentage
Change
Difference
(tonnes)
Percentage
Change
Buildings 15,200 10,200 10,100 (100) -1% (5,100) -34%
Traffic Signals & Streetlights 5,900 2,800 3,100 300 7% (2,800) -47%
Wastewater & Treatment 14,400 8,900 8,000 (900) -8% (6,400) -44%
Water Pumping 2,100 900 1,000 100 7% (1,100) -52%
Vehicle Fleet 6,880 7,190 7,040 (150) -2% 160 2%
Total City of London 44,500 30,000 29,200 (800) -3% (15,300) -34%
Change from Past Year Change since 2007
City of London | 2012 Corporate Consumption Report 23
Overall, since 2007 the City of London has reduced its energy related carbon footprint by
over 34 percent (not including landfills). The corporation continues to search for innovative
and collective ways to reduce GHG emissions from energy use.
Y:\Shared\Environmental Programs\Energy Management\Corporate Energy Reporting\Corporate Energy Plans\Current\2012 Energy
Consumption Report September 2013.docx