city of montréal economic report - portail...
TRANSCRIPT

ECONOMIC REPORT City of Montréal

The 2004 Economic Report is a publication of the Ville de Montréal, Service de la mise en valeur du territoire et du patrimoine,
Direction de la planification stratégique.
This report was written by Chantal Langelier, with the assistance of Suzanne Chantal, Benoît Van de Walle, Farah Fouron and Gisèle Boni, under the supervision of Guy DeRepentigny, Division Chief, Planification économique et sectorielle.
Production was co-ordinated by Danielle Dionne, of the Direction des communications et des relations avec les citoyens.
Translation: Terry Knowles Design: Octane
ISBN 2-7647-0508-5Legal deposit – Bibliothèque nationale du Québec, 2005
Legal deposit – Library and Archives of Canada, 2005
Aussi disponible en français.

ECONOMIC REPORT1
2004 ECONOMIC REPORT 3
2004 at a Glance: Encouraging Trends 4Indicators pointing to economic growth 4
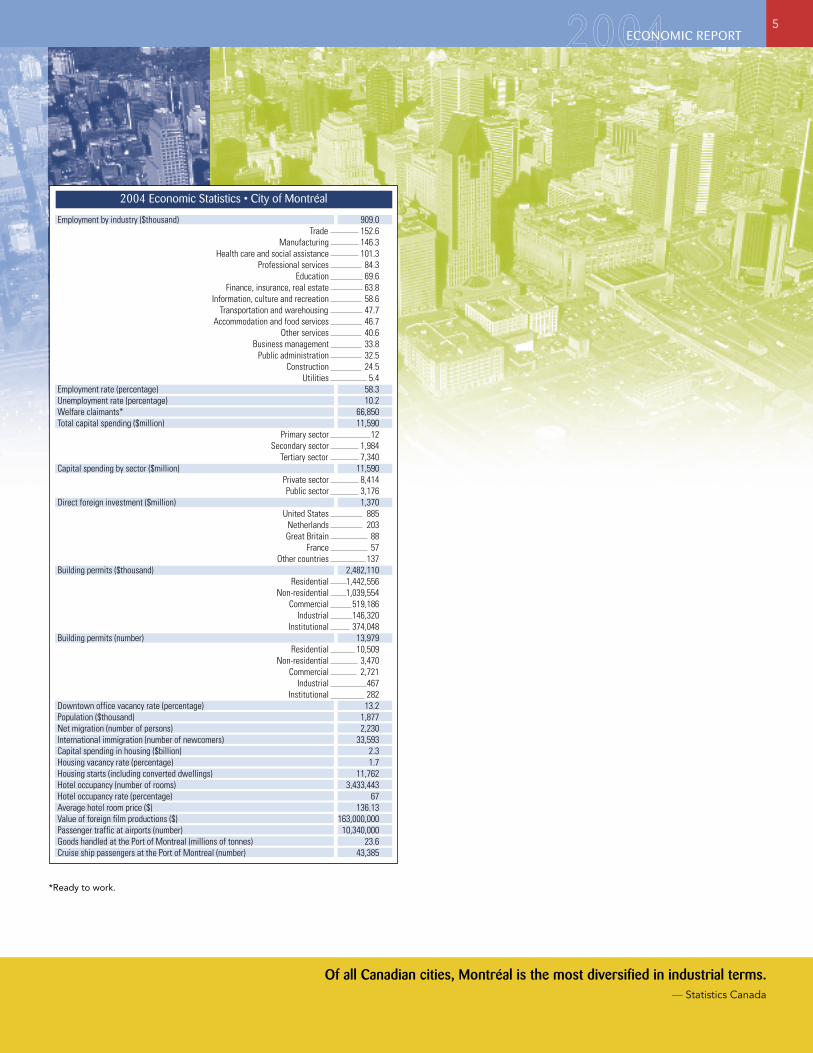
2004 Economic Statistics – City of Montréal 5
Labour Market 6Montréal posts over 900,000 jobs 6
Manufacturing leads in job creation 6
Employment rate reaches a historic peak in 2004 6
Unemployment down in 2004 7
Fewer welfare claimants 7
Capital Spending 8Capital investment of $11.6 billion 8
Most investment from the private sector 8
Largest proportion of investment in the tertiary sector 8
Direct foreign investment: nearly $1.4 billion in 2004 10
Building permits: a new peak of $2.5 billion in 2004 11
Office vacancy rate up 11
Population 12Montréal’s population up constantly since 1998 12
Net migration positive in 2004, but still tenuous 12
International immigration in 2004: highest since the early 1990s 13
Housing 13$9 billion invested in the housing sector between 2000 and 2004 13
Close to 40% of new dwellings in the metropolitan area are located in Montréal proper 13
A thriving resale market 14
Housing shortage being absorbed 14
Tourism 15Better performance in 2004 15
Hotel occupancy rates up as compared with 2003 15
Average hotel room price remains stable 15
Film 16A more difficult year for the industry, with fewer foreign productions 16
Transportation 16The best results in 20 years at the Port of Montreal 16
A record number of passengers at Montréal airports 17
Outlook for the Greater Metropolitan Area 18
Appendix 1 Montréal’s weight in the greater metropolitan area 19
Appendix 2 Construction projects in progress 21
Table of contents


ECONOMIC REPORT3
The Economic Report, a new annual publication by
the City of Montréal, reviews the main indicators that illustrate
the municipality’s economic activities. For the most part,
the report focuses on Montréal proper.
This report is intended to complement those produced
by the Montréal Metropolitan Community and Montréal
International, both of which consider the greater
metropolitan area in a North American context.
Together with the City of Montréal, these bodies are members
of a research committee made up of different regional
economic partners, and this report is one of the results
of their co-operation.
As time goes on, this publication will be adjusted so as to serve
as an operating report for the City’s economic development
strategy and action plan.
2004 Economic Report
“The seven cities you need to know now: Beirut, Buenos Aires, Hamburg, Manchester, Montreal, Stockholm, Valencia.” — Wallpaper Navigator magazine
4 DIRECTION DE LA PLANIFICATION STRATÉGIQUE SERVICE DE LA MISE EN VALEUR DU TERRITOIRE ET DU PATRIMOINE
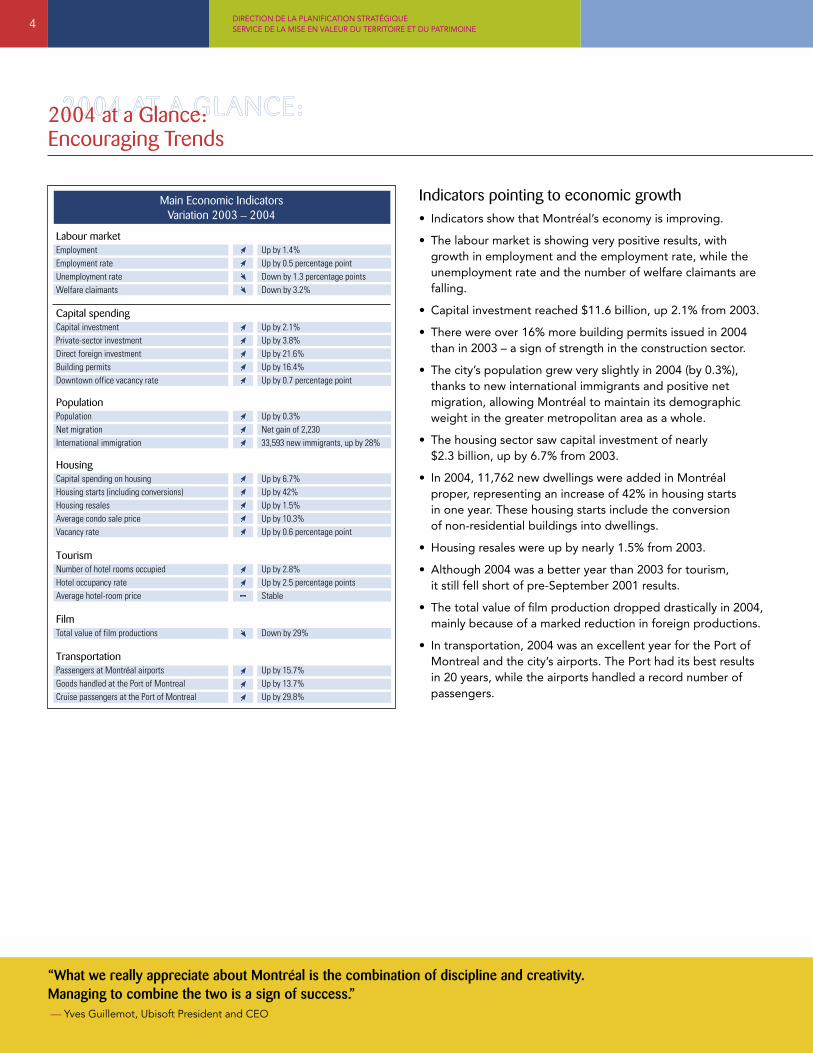
Indicators pointing to economic growth• Indicators show that Montréal’s economy is improving.
• The labour market is showing very positive results, with growth in employment and the employment rate, while the unemployment rate and the number of welfare claimants are falling.
• Capital investment reached $11.6 billion, up 2.1% from 2003.
• There were over 16% more building permits issued in 2004 than in 2003 – a sign of strength in the construction sector.
• The city’s population grew very slightly in 2004 (by 0.3%), thanks to new international immigrants and positive net migration, allowing Montréal to maintain its demographic weight in the greater metropolitan area as a whole.
• The housing sector saw capital investment of nearly $2.3 billion, up by 6.7% from 2003.
• In 2004, 11,762 new dwellings were added in Montréal proper, representing an increase of 42% in housing starts in one year. These housing starts include the conversion of non-residential buildings into dwellings.
• Housing resales were up by nearly 1.5% from 2003.
• Although 2004 was a better year than 2003 for tourism, it still fell short of pre-September 2001 results.
• The total value of film production dropped drastically in 2004, mainly because of a marked reduction in foreign productions.
• In transportation, 2004 was an excellent year for the Port of Montreal and the city’s airports. The Port had its best results in 20 years, while the airports handled a record number of passengers.
2004 at a Glance: Encouraging Trends
“What we really appreciate about Montréal is the combination of discipline and creativity. Managing to combine the two is a sign of success.” — Yves Guillemot, Ubisoft President and CEO
���������������������������������������������
������������������������ �������������������������� ��������������������������������������������� ����������������������������������������������� ������������
����������������������������������� ������������������������������������ ������������������������������������ ���������������������������� ���������������������������������������� ��������������������������
��������������������� ������������������������ ������������������������������������������� ��������������������������������
����������������������������������� ������������������������������������������������� �������������������������� ����������������������������������� ������������������������ ��������������������������
�������������������������������������� ������������������������������� ���������������������������������������������������� ������
������������������������������������ �����������
���������������������������������������������� ������������������������������������������������� ����������������������������������������������������� �����������
ECONOMIC REPORT5
2004 at a Glance: Encouraging Trends
Of all Canadian cities, Montréal is the most diversified in industrial terms. — Statistics Canada
*Ready to work.
���������������������������������������
����������������������������������������������
������������������������������
������������������������������������������������������������������
�������������������������������������������������������������
���������������������������������
���������������������������������
����������������������������������������������������������������������������������������������������������������������
������������������������������
����������������������������������������������������
���������������������������
��������������������������������������������������
������������������������
���������������������
���������������������������������������
�������������������������
�����������������������
������������������������������������
�������������������������
�����������������������
��������������������������������������������������������������������������������������������������������������������������������������������������������������������������������������������������������������������������������������������������������������������������������������������������������������������������������������������������������������������������������������������������������������������������������������������������������������������������������������������������������������������������������������������������������������
�������������������������������������������
������������������������������������������������������������
�����������
������������
������������
���������������������
����������
������������������������������
���������������������������������
����������
������
��������������
������������
���������������
��������
���������������������
����������

6 DIRECTION DE LA PLANIFICATION STRATÉGIQUE SERVICE DE LA MISE EN VALEUR DU TERRITOIRE ET DU PATRIMOINE
Labour Market
Montréal posts over 900,000 jobs• Statistics Canada compiled 909,000 jobs* in Montréal proper
in 2004, i.e. a gain of 1.4% over the previous year.
• 12,800 positions were created in 2004, bringing the number of new jobs over the past ten years to 151,700.
• One out of every two jobs in the greater metropolitan area is located in Montréal proper; this percentage has been stable over the past ten years.
���������������
�����
����������
���������������
�����
���� ���� ���� ���� ���� ���� ���� ���� ���� ����
���
�����
�����
�����
����
���
����������������������������������������
�����
���
���
���
���
��������������������������
Manufacturing leads in job creation • Employment growth in 2004 was concentrated in
manufacturing (+7,700 jobs) and information, culture and recreation (+5,300 jobs).
• On the other hand, accommodation and food services and business services sustained major losses, of 8,900 and 3,900 jobs, respectively.
�����
�����
����
����
��
������������������������������������������������������������������
����� ����� ����� �����
���� ���� ������ ������������
������
���������������
�������������������������������
�������������������������
�������
���
����
�����
�
����
����
����
�����
����
�����
����
����
����
����
�����
���
���
����
����
��
����
����
���
����
����
����
����
����
�
����
�
����
����
����
����
����
�
����
����
�����
����
�����
����
����
�
����
�����
����
�
����
����
�
����
����
����
�����
����
�����
����
����
�����
���
����
����
����
����
����
��
����
���
����
����
����
����
�
�������������������������������������������������������
Employment rate reaches a historic peak in 2004• The employment rate of 58.3% in 2004 can be described
as a historic peak.
• The flood of women onto the labour market in the past 30 years and a significant improvement in education levels explain this growth.
• Since 1995, the employment rate has risen by 6.9 percentage points.
���� ���� ���� ���� ���� ���� ���� ���� ���� ����
����
����
��
���������������������������������������������
��
��
��
���� ���� ����
��������
���� ����
��������
����
��������������������������
Montréal ranks second in North America for the concentration of workers in the “super-creative niche.”
— Richard Florida, Louis Musante and Kevin Stolarick, Catalytix
*Data from the Labour Force Survey (LFS) must be used with circumspection. The LFS looks at individuals and records the number of people employed by place of residence. Only the census systematically evaluates employment by place of work. Taking these facts into account, in 2001 there were 863,100 people employed in Montréal and 1,113,000 jobs.

ECONOMIC REPORT7
Labour Market
Unemployment down in 2004• Following a brief jump to 11.5% in 2003, the unemployment
rate shrank back to 10.2% in 2004. Although the jobless rate was higher in 2004 than in the period from 2000 to 2002, the proportion of jobless people has improved considerably from the 1990s, when the rate stood at about 14%.
���� ���� ���� ���� ���� ���� ���� ���� ���� ����
����
����
��
�����������������������������������������������
����
����
���
��������������������������
���
��������
����
�������
��������
����
���
Fewer welfare claimants*• The decline in the number of welfare claimants is excellent
news, and another indicator of the city’s economic well-being.
• In 2004, just under 66,900 Montrealers were receiving welfare – close to 2,200 fewer than in the previous year, and the lowest number in the past ten years.
�������������������������������������������������������������������������
������ ������ ������
������
������
�������
������
������������
�������
�������
������
���������� ���� ���� ���� ���� ���� ���� ���� ���� ����
���
�����
�����
����
��
�����������������������������������������������
Montréal ranks fourth in the world as a “gaming hot spot” for the development of video games. — Wired magazine
* Ready to work.

8 DIRECTION DE LA PLANIFICATION STRATÉGIQUE SERVICE DE LA MISE EN VALEUR DU TERRITOIRE ET DU PATRIMOINE
Most investment from the private sector• In 2004, more than $8.4 billion was invested by the private
sector, up by 3.8% as compared with 2003.
• Public-sector investment has also risen considerably over the past two years, to exceed $3 billion.
����������������������������������������������������������������������������
������������
���� ���� ���� ���� ����
����������
���������� �����
����� ��������������� �������
�����
�
�������������� �������������
������
�����
�����
�����
�
Largest proportion of investment in the tertiary sector• Capital spending in Montréal has remained quite stable from
year to year. Fluctuations become more obvious if one looks at the individual subsectors, however.
�������������������������������������������������������������������������
�����
���
������������
���� ���� ���� ���� ����
�������������� ���������������� ���������������
��������������������������
�
����� ����� ����� ����� �����
����� ����� ����� ����� �����
������ ����
Capital Spending
Capital investment of $11.6 billion• Capital investment in Montréal proper rose by 2.1% in 2004.
The Institut de la statistique du Québec (ISQ) estimates 2004 capital spending at $11.6 billion.
• Close to $57 billion has been invested in Montréal since 2000.
�����
���
����������������������������������������������
������������
���� ���� ���� ���� ����
������
������
������������
������������
������
������
������
������
“[Montréal’s] assets: very attractive fiscal and economic conditions for entrepreneurs, along with a quite remarkable quality of urban life.” — Valérie Lion, L’Express International

ECONOMIC REPORT9
���������������������������� ����������������������������������������������� ���������� ������������������������� ������������ �������������� ���������� ���������������������������������� ������������������������� ������������������������������������� ���
������������
��������������������������������������������
���������������
Capital Spending
Rate of increase in capital spending
by industry subsector (NAICS classification)
City of Montréal • 2000 — 2004
• For instance, some secondary sector components, like paper and primary metal manufacturing, have seen average annual growth of about 24% and 34% since 2000.
• In the tertiary sector, educational services (23%), utilities (11%) and trade (6%) also showed strong growth.
• On the other hand, there was a sharp drop in capital spending in other sectors – an average annual decrease of 25% in investment in textile mills between 2000 and 2004, for instance. The information and culture industries also suffered substantial declines in investment, of about 28%. The most serious drops by far, however, were in computer and electronic products, where investment has fallen by an annual average of 38% since 2000.
��������������������������������� ����������������������������������������� ������������������� ��������������� ������������������� ��������������������������������������� ������������������������������� ���������� ������������������������������������������������� ��������������� ������������������������������ ������������������������� ����������������������������������������������������� ������������� ������������� �������������� ������������������������������������ ���������������������������� ����
������������
����������������������������������������������
���������������
Montreal is the only Canadian city among the planet’s emerging high-tech hot spots. — Business 2.0 Magazine
The
Gra
nde
Bib
lioth
èque
: G
iova
nni D
e P
aoli
10 DIRECTION DE LA PLANIFICATION STRATÉGIQUE SERVICE DE LA MISE EN VALEUR DU TERRITOIRE ET DU PATRIMOINE
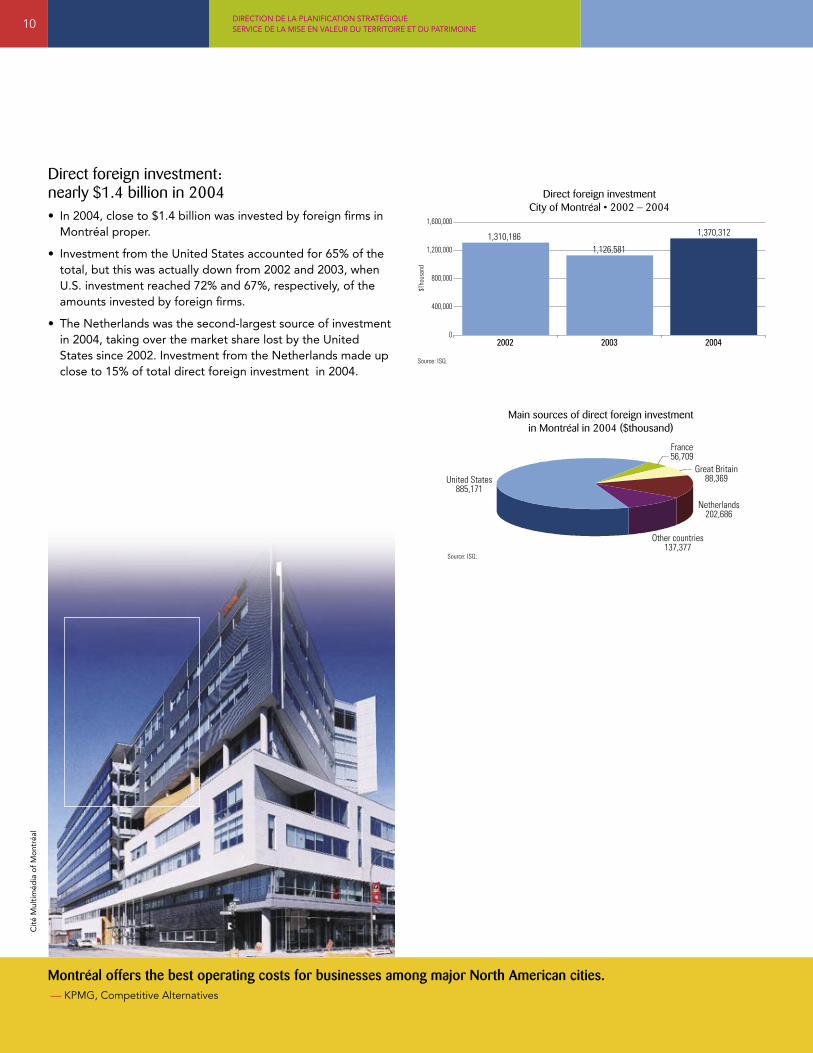
Direct foreign investment: nearly $1.4 billion in 2004• In 2004, close to $1.4 billion was invested by foreign firms in
Montréal proper.
• Investment from the United States accounted for 65% of the total, but this was actually down from 2002 and 2003, when U.S. investment reached 72% and 67%, respectively, of the amounts invested by foreign firms.
• The Netherlands was the second-largest source of investment in 2004, taking over the market share lost by the United States since 2002. Investment from the Netherlands made up close to 15% of total direct foreign investment in 2004.
�������������������������������������������������������
������������
����
����
�
������������������
������������������
���������
�������
�������
����� ���� ����
������������������������������������������������������������������������
������������
��������������������
������������
�������������������
������������������
����������������������
Montréal offers the best operating costs for businesses among major North American cities. — KPMG, Competitive Alternatives
Cit
é M
ulti
méd
ia o
f M
ont
réal
ECONOMIC REPORT11
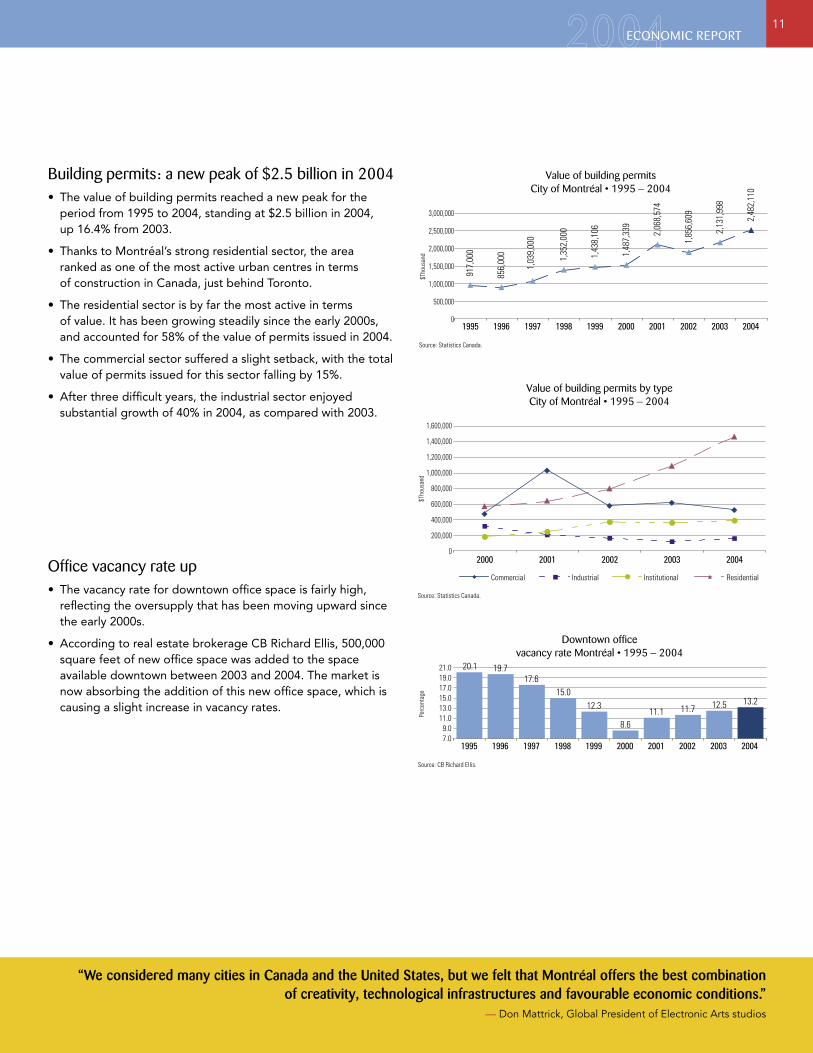
Office vacancy rate up • The vacancy rate for downtown office space is fairly high,
reflecting the oversupply that has been moving upward since the early 2000s.
• According to real estate brokerage CB Richard Ellis, 500,000 square feet of new office space was added to the space available downtown between 2003 and 2004. The market is now absorbing the addition of this new office space, which is causing a slight increase in vacancy rates.
��������������������������������������������������
���� ���� ������������
��������
�������
����������������������������
������
����
����
��
���� ���� ���� ���� ���� ���� ���� ���� ���� ����
�������������������������
Building permits: a new peak of $2.5 billion in 2004• The value of building permits reached a new peak for the
period from 1995 to 2004, standing at $2.5 billion in 2004, up 16.4% from 2003.
• Thanks to Montréal’s strong residential sector, the area ranked as one of the most active urban centres in terms of construction in Canada, just behind Toronto.
• The residential sector is by far the most active in terms of value. It has been growing steadily since the early 2000s, and accounted for 58% of the value of permits issued in 2004.
• The commercial sector suffered a slight setback, with the total value of permits issued for this sector falling by 15%.
• After three difficult years, the industrial sector enjoyed substantial growth of 40% in 2004, as compared with 2003.
�������������������������������������������������������
��������������������������
���� ���� ���� ���� ���� ���� ���� ���� ���� ����
����
���
����
��� ����
����
�
����
����
�
����
����
�
����
����
�
����
����
�
����
����
�
����
����
�
����
����
�
����
����
�
���������
���������
���������
���������
���������
�������
�
���������������������������������������������������������������
��������������������������
���������
���������
���������
���������
�������
�������
�������
�������
����� ���� ���� ���� ����
����
����
�
���������� ���������� ������������� �����������
“We considered many cities in Canada and the United States, but we felt that Montréal offers the best combination of creativity, technological infrastructures and favourable economic conditions.”
— Don Mattrick, Global President of Electronic Arts studios

12 DIRECTION DE LA PLANIFICATION STRATÉGIQUE SERVICE DE LA MISE EN VALEUR DU TERRITOIRE ET DU PATRIMOINE
Population
Montréal’s population up constantly since 1998• The population of Montréal grew by 0.3% between 2003
and 2004, reaching 1,877,000.
• These population estimates by the Institut de la statistique du Québec show that the city’s population has been rising steadily since 1998.
• Population growth is estimated at 4% for the 1995–2004 period, with the largest gains since 1999.
����������������������������������������
���� ���� ���� ���� ���� ���� ���� ���� ���� ����
������������
�����
�����
�����
�����
����
����
�����
����� ����� �����
��������������� �����
����������
Net migration positive in 2004, but still tenuous• In recent years, Montréal has enjoyed positive net migration in
general, aside from the 2002-2003 period. This is a significant change from the trends of the early 1990s, when annual net migration was negative year after year.
• It is estimated that 2,230 more people arrived than left in 2004. This figure is attributable to positive net international migration, which reached 29,300.
• Net interprovincial and intraprovincial migration were both negative in 2003–2004. Nonetheless, Montréal remains an attractive destination for young people aged 15 to 25. They are the only age group for which net migration was positive, likely because of the large number of universities and colleges in the city.
��������������������������������������������
������������
�����
����������
�����
������������
�����
������
������
�����
�����
�
������
������
�������
���
�����
�����
���
���� ���� ���� ���� ���� ���� ���� ���� ���� ����
������������
Montréal is Canada’s most bilingual city and the most diverse in cultural terms. — Association for Canadian Studies
*Years from July 1 to June 30

ECONOMIC REPORT13
Housing
$9 billion invested in the housing sector between 2000 and 2004• The Institut de la statistique du Québec estimates capital
expenditures specific to the housing sector at over $9 billion for the 2000-2004 period.
• 2004 was the best year in terms of amounts invested: $2.3 billion, or nearly 7% more than in 2003.
���������������������������������������������������������
������������
����������
�����
����� ����������
�����
�����
�
�����
���
���� ���� ���� ���� ����
Close to 40% of new dwellings in the metropolitan area are located in Montréal proper• Upwards of 35,000 dwellings were delivered in the space of
five years, with the peak in 2004. In that single year, taking account both of data on housing starts compiled by the Canada Mortgage and Housing Corporation and of figures on converted non-residential buildings, there were 11,762 new dwellings in Montréal, for an increase of 42% from the previous year.
• In 2004, 39.7% of new dwellings built in the metropolitan area were in Montréal.
�������������������������������������
�������������������������������
�������������������������������
�����
������
����������
���������� �����
����������
������
������
�����
�����
����� ���� ���� ���� ���� ���� ���� ���� �����
���
�����
�����
��
International immigration in 2004: Highest since the early 1990s• The number of immigrants to Montréal in 2003-2004 was
the highest in the past 12 years. All in all, 33,593 newcomers settled in Montréal in 2004, a number unequalled since 1991-1992.
• On the other hand, 4,321 people left Montréal to settle abroad in 2004.
���������������������������������������������������
������ ������
������
������
������
������������������
������
������
������
������
������
������
������
���
�����
�����
���
���� ���� ���� ���� ���� ���� ���� ���� ���� ����
������������
Montréal ranks with other major Canadian cities as the safest in North America. — Mercer quality of life index
*Years from July 1 to June 30
* In 2004, the total number of conversions was estimated at 950 units.

14 DIRECTION DE LA PLANIFICATION STRATÉGIQUE SERVICE DE LA MISE EN VALEUR DU TERRITOIRE ET DU PATRIMOINE
A thriving resale market• Overall, housing resales increased by nearly 20% between
2000 and 2004; condo (divided co-ownership) resales were up by 46.2%.
• Average housing prices are climbing faster than inflation. Between 2000 and 2004, the average price of a single-family home rose by 64.8%. In constant 2000 dollars, the actual increase was 51.2%. For condos, these percentages were 61.8% and 48.4%, respectively.
• The thriving market is attractive for owners, but puts home ownership further out of reach for low-income households.
���������������������������������������������
������������
������
������
�����
�
���
�����
�����
����
�����
�������������������������������������������������
���� ���� ���� ���� ����
������������������ ����� ����
�����������������������������������������������������������������������������
�������
�������
�������
�������
�������
�������
������
�
����
����
����
�����
�
������������������������������������������������� ��������������� ���������������������
���� ���� ���� ���� ����
����
����
����
����
����
����
����
����
����
����
����
����
����
����
����
����
����
����
����
����
����������������������������������������������������������������
����
����
����
����
����
����
����
����
����
����
����
����
����
����
����
����
����
����
����
����
�������
�������
�������
�������
������
�
����
����
����
�����
�
������������������������������������������������� ��������������� ���������������������
���� ���� ���� ���� ����
Housing shortage being absorbed• The new housing on the market has led to higher vacancy
rates in Montréal; although most new dwellings are not actually intended for rent, the greater supply of housing for sale has freed up more rental accommodation.
• In 2004, vacancy rates for privately owned rental properties with three or more dwellings was 1.7%. This rate had fallen to 0.6% at the height of the housing crisis, back in 2001. Despite this improvement, however, fewer units are available at a reasonable price; the vacancy rate for units costing $600 or less (gross monthly rent) is 1.2%.
• In 2004, rental housing starts were up sharply in Montréal, at 4,562 units, corresponding to an increase of 265% from the previous year. Both the social and private components of AccèsLogis and Affordable Housing Québec have had an impact: in 2004 alone, an estimated 2,091 rental units were subsidized (for families, seniors and special clienteles such as the homeless and young people re-entering the community).
�������������������������������������������
������
���
������ ���
������
���
���
���
���
���
���
���
����
����
��
���� ���� ���� ���� ���� ���� ���� ���� ���� ����
�������������
Montréal ranks fifth in North America for quality of life. — Mercer quality of life index
*Privately owned buildings with three or more rental units

ECONOMIC REPORT15
Tourism
Better performance in 2004• Tourism has had its ups and downs since 2001. The sector was
hard hit by the events of September 2001 and the increase in the Canadian dollar, and has been trying its best to recapture the vitality of the late 1990s.
• The percentage of hotel rooms occupied indicates the health of the tourism sector in the area. Although 2004 was definitely better than 2003, the industry has yet to return to the results observed prior to September 2001.
• Nonetheless, the number of rooms rented in 2004 was up by 2.8% from the previous year.
���������������������������������������������������������������������
��������� ���������
������������������
���������
���������
���������
���������
���������
���������
���
���
����������������������������������������������
���� ���� ���� ���� ����
Hotel occupancy rates up as compared with 2003• The occupancy rate reflects the performance of the hotel
industry. In 2004, Montréal’s rate was 2.5 percentage points higher than in 2003.
• Overall, however, the hotel industry is now absorbing the new rooms added in recent years, a situation that is pushing down occupancy rates.
��������������������������������������������������
����
����
����
��������
����
����
����
����
����
����
��
����������������������������������������������
���� ���� ���� ���� ����
“For 11 days in 2004, close to two million people poured into the city to enjoy 500 concerts, 350 of them free. That year the Guinness Book of World Records declared the Montréal event the world’s largest jazz festival.”
— Ludovic Hirtzmann, Match du monde
Average hotel room price remains stable• The average hotel room price has been stable for the past
three years, at about $136.
• The growth in the supply of hotel rooms in the city, along with the impact of the events of September 2001, has stabilized rates for the moment.
����������������������������������������������������������
����������������������������������������������
������
������
������
������
���������
���
���
���
���
�
���� ���� ���� ���� ����

16 DIRECTION DE LA PLANIFICATION STRATÉGIQUE SERVICE DE LA MISE EN VALEUR DU TERRITOIRE ET DU PATRIMOINE
Film
Transportation
The best results in 20 years at the Port of Montreal• The Port of Montreal reported its best results in 20 years in
terms of the quantity of goods handled. Traffic reached 23.6 million tonnes, up 2.8 million tonnes from 2003 (13.7%).
• According to Port management, the strong economy and the arrival of new shipping companies stimulated traffic in 2004. The growth in trade with China also had a positive impact on operations in many North American ports.
• There were also many more cruise ship passengers than the average in recent years. Over 43,000 passengers came ashore in Montréal, making 2004 the best year since 1991.
������������������������������������������������
�������� ���� ����
���� ����
����
����
���� ����
��
��
��
��
��
����
����
����
��
���� ���� ���� ���� ���� ���� ���� ���� ���� ����
�������������������������
�������������������������������������������������������������������
�������������������������
������������
������ ������
������
������
������
������
������������
������
������
������
������
���
���
���� ���� ���� ���� ���� ���� ���� ���� ���� ����
A more difficult year for the industry, with fewer foreign productions• After two excellent years in 2002 and 2003, the value of film
productions dropped sharply in 2004, largely because of the decline in foreign productions. That decline in turn was due mainly to stiff international competition.
• The value of foreign productions in Montréal fell by more than half, from $388 million in 2003 to $163 million for 2004 as a whole.
• On the other hand, local productions more or less maintained the average for recent years, at $478 million.
������������������������������������������������������������
��������������������������������������������������������������������������������������
����������������������������������������
���
���
���
���
���
���
�
����
����
����
����
����
���
�
���� ���� ���� ���� ���� ���� ���� ����
����� ��������
�����
� ���
���
���
��� ��
�
���
���
���
���
���
���
���
���
���
“As you may have gathered, filmmaking can be complex and challenging. We are very grateful that we found in Montréal the services and professional attitudes which so facilitated our work. The quality of these services make all the difference.” — Martin Scorsese, in a letter to the Mayor of Montréal, after shooting the film The Aviator, winner of five Oscars

ECONOMIC REPORT17
A record number of passengers at Montréal airports• 2004 was a record year for passenger traffic at Montréal’s
airports – the first time the number of passengers exceeded 10 million.
• This increase of 1.4 million passengers over 2003’s figures allowed traffic levels to match and even surpass pre-September 2001 figures.
• Low domestic fares and Air Canada’s recovery during the year contributed to this increase in the number of passengers. The growth on the domestic market exceeded 20%, while transborder and international markets progressed by 11.9% and 12.2%, respectively.
• All passenger traffic at Mirabel Airport was transferred to Pierre Elliott Trudeau International Airport on November 1, 2004.
�������������������������������������������������
���
���
���
��� ���
����
���
���
���
���
����
����
���
���
���
���
����
����
����
����
��
���� ���� ���� ���� ���� ���� ���� ���� ���� ����
������������������������������
Montréal ranks first in Canada and third in North America as most popular city for international conventions. — Union of International Associations
Qua
rtie
r in
tern
atio
nal:
Soci
été
du
Hav
re d
e M
ont
réal

18 DIRECTION DE LA PLANIFICATION STRATÉGIQUE SERVICE DE LA MISE EN VALEUR DU TERRITOIRE ET DU PATRIMOINE
Outlook for the Greater Metropolitan Area
• Conditions are good at the moment for the economic growth of Montréal and surrounding area.
• According to forecasts by the Conference Board of Canada, growth in coming years should even outstrip the metropolitan area’s 2004 performance.
• All indicators for the 2005-2009 period are on the upswing, with the exception of the unemployment rate, which should stabilize in 2009.
• Since Montréal’s economy accounts for close to 75% of the overall regional economy, this positive outlook for the metropolitan area augurs well for the city.
���
����������
��������������
�����������������
�����������������
��������������
������������
�����������������������������������������������������������������������������������
���������������������������
���� ���� ���� ���� ����
���
���
���
���
���
����
���
���
���
���
���
���
����
���
���
���
���
���
���
����
���
���
���
���
���
���
����
���
���
���
���
���
���
����
���
“What draws us here is the talent.” — Walter Feiler, Vice-President, Research and Development, SAP Labs Canada
Bo
mb
ard
ier
*Census Metropolitan Area

ECONOMIC REPORT19

20 DIRECTION DE LA PLANIFICATION STRATÉGIQUE SERVICE DE LA MISE EN VALEUR DU TERRITOIRE ET DU PATRIMOINE
Montréal’s weight in the greater metropolitan area
������������������������� ����������������
�������������
��������������������
�����������
��������������������������������������������������������������������
��������
��������
����������
����������
���������������������������
�������������������������������������������
����������������
���������������
����������
������������
����������������������������������������������������������������������
���������
�����������
�����������
���������������������������
�������������������������������������������
�����������������
���������������
����������
����������������������������������������������������������������
����
�������
��������
��������������������������������������������������������
������
����������
����
������������������������������������������������������
������������������
������������������������������������������������������
����������������������������������������
�����������������������������������������������������������������
���������������������������������������������
����������������������������������������
���������������������
�������������������������������������������������������������������������
������������������������������
����������������������������������������������������
���������������������������
����������������������������������������
�������������������������
�����������������������
�������������������������������������
�������������������������
�����������������������
�����������������������������������������������������������������������������������������������������������������������������������������������������������������������������������������������
*CMA stands for Census Metropolitan Area.


22 DIRECTION DE LA PLANIFICATION STRATÉGIQUE SERVICE DE LA MISE EN VALEUR DU TERRITOIRE ET DU PATRIMOINE
Sites of $50 million or moreSite Owner Type of construction Value ($M) Begin End
Montréal Caisse de dépôt Construction of an office building 400.0 2000/10 2004/08 Viger/McGill/St. Antoine streets et placement du Québec
Dorval ADM - Montréal-Trudeau Airport International Pier (Phase 2) 356.0 2003/04 2005/06 airport
Montréal Société de transport Renovation of fixed equipment - Métro 342.0 2003/11 2005/08 de Montréal (STM)
Montréal Pétro-Canada Modification of plant to upgrade 245.0 2003/03 2005/12 11701 Sherbrooke St. East to standards
Montréal PTT Poly Canada Plant 190.0 2002/05 2004/05 3500 Broadway Ave. (Shell Chemicals Canada)
Montréal Concordia University University pavilions 172.0 2002/05 2005/06 St. Catherine/Guy Loyola Campus (engineering and visual arts)
Port of Montréal Société du Port de Montréal Extension and renovation 125.0 2004/01 2008/12 of port facilities
Montréal Sudenco Residential development 125.0 1999/11 2005/01 Near Highway 40 and golf courses
Montréal UQAM - Science Complex University pavilions 110.0 2003/09 2005/09 145 Président-Kennedy
Montréal Ministère des Transports Redevelopment of intersection 110.0 2002/03 2004/11 Highway 40/L’Acadie Blvd.
Montréal Université de Montréal Biomedical and pharmaceutical 102.0 2003/01 2004/12 University campus Marcelle-Coutu Pavilion complex
St.Laurent SITQ Multiple-use complex, 100.0 1998/07 2004/06 Côte-Vertu/Cavendish/Highway 40 Complexe Sphèretech
Montréal Mouvement Desjardins Office building (Phase 2) 100.0 2002/07 2004/09 1360 René-Lévesque Blvd. West “Cité du commerce électronique”
Montréal Axor for Groupe CGI Office building (Phase 1) 100.0 2001/06 2004/03 1350 René-Lévesque Blvd. West “Cité du commerce électronique”
Montréal École polytechnique de Montréal University pavilions, 100.0 2003/06 2005/06 University campus “Pavillons Lassonde”
St. Laurent Bombardier Immobilier Residential development 100.0 1998/12 2005/01 and golf course “Bois-Francs II”
Montréal Terry Pomerantz Recycling of industrial buildings 100.0 2000/03 2005/04 1 du Port Ave. into housing units
Ile-des-Soeurs Corporation Proment Residential development 100.0 2003/01 2004/12 des Sommets Blvd. “Sommets sur le fleuve” Phase 2
Montréal SIQ La Grande Bibliothèque Transformation of commercial 97.4 2001/06 2004/10 1650 Berri Street building into a library
Montréal Les Constructions Residential development 90.0 2003/11 2005/06 333 Sherbrooke Street East Beau-Design Groupe Avantage
Montréal Ministère des Transports Rebuilding of highway 80.7 2003/04 2004/11 Highway 40, Sources Blvd./Highway 520
Ile-des-Soeurs Corporation Proment Residential development Phase 3 80.0 2003/02 2004/12 110 des Sommets Blvd. “Les Sommets sur le fleuve”
Pointe-Claire Lakeshore General Hospital Extension and renovation of hospital 75.0 2000/05 2005/04 160 Stillview
Montréal Benny Farm community Residential development 75.0 2004/03 2006/07 Notre-Dame-de-Grâce neighbourhood property fund
Montréal Pétro-Canada Modernization of refinery 70.0 2002/01 2004/04 11701 Sherbrooke St. East
Ste-Anne-de-Bellevue Ste-Anne Hospital Extension and modernization 67.7 2004/01 2007/03 of hospital
ECONOMIC REPORT23
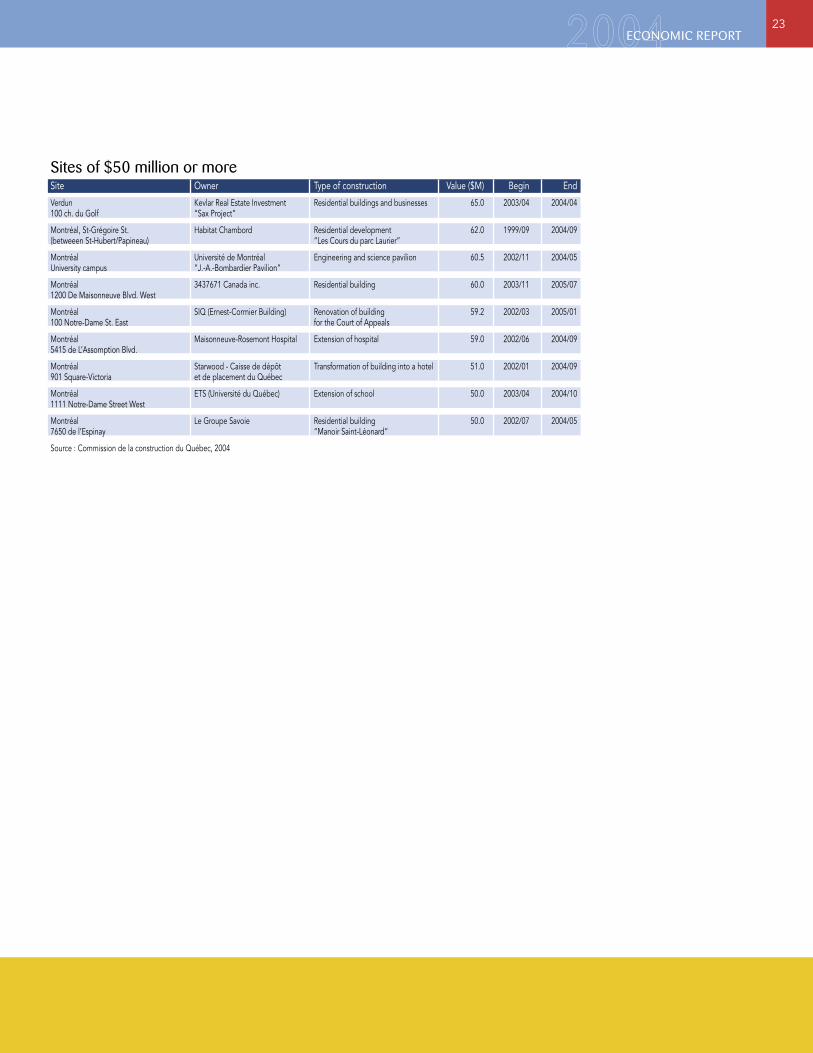
Sites of $50 million or moreSite Owner Type of construction Value ($M) Begin End
Verdun Kevlar Real Estate Investment Residential buildings and businesses 65.0 2003/04 2004/04 100 ch. du Golf “Sax Project”
Montréal, St-Grégoire St. Habitat Chambord Residential development 62.0 1999/09 2004/09 (betweeen St-Hubert/Papineau) “Les Cours du parc Laurier”
Montréal Université de Montréal Engineering and science pavilion 60.5 2002/11 2004/05 University campus “J.-A.-Bombardier Pavilion”
Montréal 3437671 Canada inc. Residential building 60.0 2003/11 2005/07 1200 De Maisonneuve Blvd. West
Montréal SIQ (Ernest-Cormier Building) Renovation of building 59.2 2002/03 2005/01 100 Notre-Dame St. East for the Court of Appeals
Montréal Maisonneuve-Rosemont Hospital Extension of hospital 59.0 2002/06 2004/09 5415 de L’Assomption Blvd.
Montréal Starwood - Caisse de dépôt Transformation of building into a hotel 51.0 2002/01 2004/09 901 Square-Victoria et de placement du Québec
Montréal ETS (Université du Québec) Extension of school 50.0 2003/04 2004/10 1111 Notre-Dame Street West
Montréal Le Groupe Savoie Residential building 50.0 2002/07 2004/05 7650 de l’Espinay “Manoir Saint-Léonard”
Source : Commission de la construction du Québec, 2004

24 DIRECTION DE LA PLANIFICATION STRATÉGIQUE SERVICE DE LA MISE EN VALEUR DU TERRITOIRE ET DU PATRIMOINE
Sites between $20 million and $49.9 millionSite Owner Type of construction Value ($M) Begin End
Montréal Les Projets Europa Residential building 48.0 2001/12 2004/12 50 McGill
Montréal Université de Montréal and CNRC University pavilion 46.5 2002/01 2004/02 Université de Montréal campus (Centre de technologie en aérospatiale)
Montréal Corporation immobilière Busac Transformation of building into offices 45.0 2003/01 2004/12 1 Place Olympique
Montréal Shell Canada Upgrading to standards 45.0 2003/03 2004/07
Montréal Château Drummond Residential building 45.0 2003/05 2005/06 2000 Drummond
Montréal McGill University Music Pavilion 44.0 2003/04 2005/04 Aylmer/Sherbrooke
Montréal STM Renovation - Métro station, Phase 2 43.4 2003/08 2005/12
Montréal Groupe St-Luc Habitation Residential development 42.6 1997/01 2004/12 Beaubien/Pie-IX “La Cité Paul-Sauvé”
Montréal Groupe Lépine Residential buildings 40.0 2002/01 2004/07 Stanley/Drummond streets
Montréal Institut de tourisme Renovation of school 39.0 2002/10 2004/12 Rigaud/St-Denis streets et d’hôtellerie du Québec
Montréal Place Desjardins Renovation of office buildings - 36.0 1998/06 2004/03 Ste-Catherine/Jeanne-Mance streets and businesses Complexe Desjardins
Montréal Développements Domaine Residential building “Le Concorde” 36.0 2004/03 2005/10 Président-Kennedy/de la Concorde streets
Montréal SIQ Renovation of Court House 35.0 2002/01 2004/12 1 Notre-Dame Street East
Montréal Les Entreprises El-Pine Residential development 35.0 1999/10 2004/07 Jean-Girard/St-Sulpice streets
Montréal Public Works Office building 34.0 2002/11 2004/02 740 Bel-Air St. and Government Services Canada
Montréal Société en commandite Angus Residential building 32.0 2002/03 2005/05 3185 Rachel St. East
Montréal J. Maasen and E. Savoie Redevelopment of factory into 30.0 2002/04 2004/12 1751 St-Patrick St. “Écolofts d’Argenson” apartments and businesses
Montréal Samcon inc. Residential development 30.0 2003/11 2005/08 Christophe-Colomb Ave. North “Domaine André-Grasset”
Lachine 9130 - 9336 Québec inc. Residential development 30.0 2003/10 2004/08 32nd Avenue/Sherbrooke “Les Cours Sherbrooke”
Montréal Développements Residential building 30.0 2003/12 2005/06 5845 Marc-Chagall La Marquise Côté St-Luc inc.
Montréal Société Immobilière Cavendish Residential building 30.0 2004/02 2004/05 5775 Cavendish Blvd.
Pointe-Claire Mallinckrodt Medical Extension of plant 28.0 2003/06 2004/08 7500 Trans-Canada Highway
Montréal Société en commandite Angus Home for senior citizens 27.0 2003/06 2005/05 3200 Omer-Lavallée
Dorval ADM Redevelopment of airport 26.8 2003/11 2004/11 airport (domestic departures)
Montréal Sainte-Jeanne-d’Arc Hospital Hospital center for long-term care 26.7 2002/03 2004/10 3570 St-Urbain St.
Rivière-des-Prairies St-Luc Habitation Residential development 26.0 1998/09 2004/09 P.-Baillargeon/41st Avenue and Immeubles Beaumont “Les Cours P.-Baillargeon”
ECONOMIC REPORT25
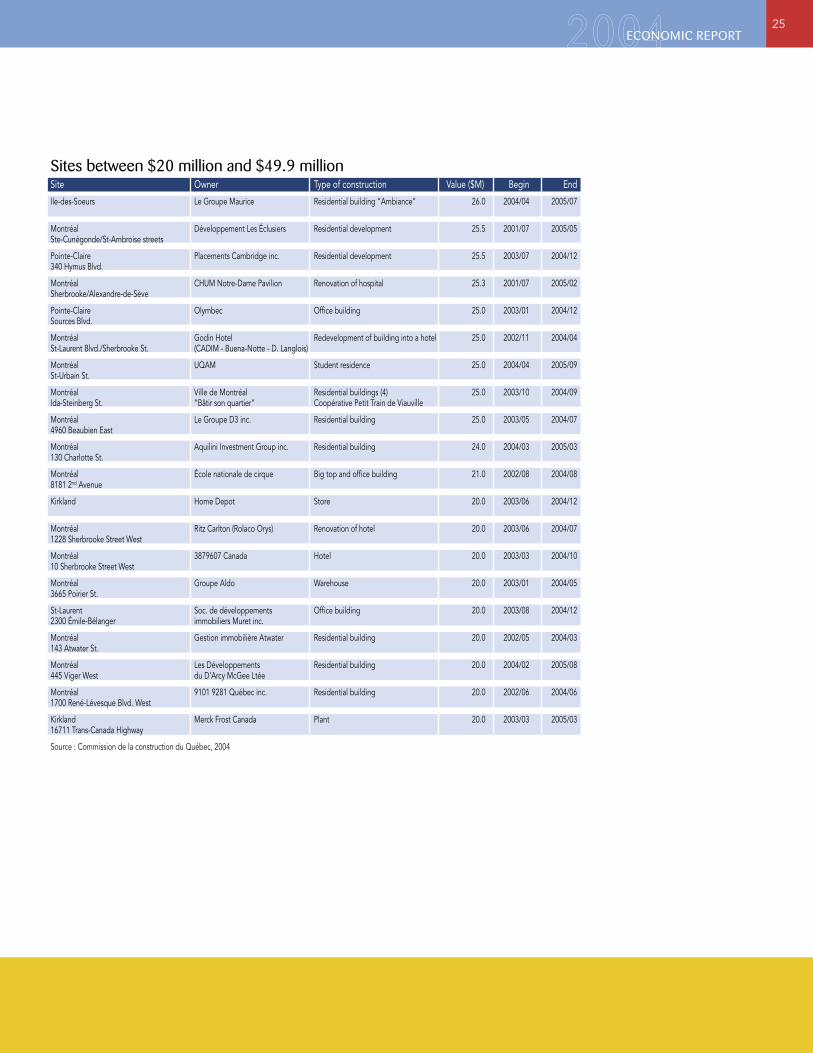
Sites between $20 million and $49.9 millionSite Owner Type of construction Value ($M) Begin End
Ile-des-Soeurs Le Groupe Maurice Residential building “Ambiance” 26.0 2004/04 2005/07
Montréal Développement Les Éclusiers Residential development 25.5 2001/07 2005/05 Ste-Cunégonde/St-Ambroise streets
Pointe-Claire Placements Cambridge inc. Residential development 25.5 2003/07 2004/12 340 Hymus Blvd.
Montréal CHUM Notre-Dame Pavilion Renovation of hospital 25.3 2001/07 2005/02 Sherbrooke/Alexandre-de-Sève
Pointe-Claire Olymbec Office building 25.0 2003/01 2004/12 Sources Blvd.
Montréal Godin Hotel Redevelopment of building into a hotel 25.0 2002/11 2004/04 St-Laurent Blvd./Sherbrooke St. (CADIM - Buena-Notte - D. Langlois)
Montréal UQAM Student residence 25.0 2004/04 2005/09 St-Urbain St.
Montréal Ville de Montréal Residential buildings (4) 25.0 2003/10 2004/09 Ida-Steinberg St. “Bâtir son quartier” Coopérative Petit Train de Viauville
Montréal Le Groupe D3 inc. Residential building 25.0 2003/05 2004/07 4960 Beaubien East
Montréal Aquilini Investment Group inc. Residential building 24.0 2004/03 2005/03 130 Charlotte St.
Montréal École nationale de cirque Big top and office building 21.0 2002/08 2004/08 8181 2nd Avenue
Kirkland Home Depot Store 20.0 2003/06 2004/12
Montréal Ritz Carlton (Rolaco Orys) Renovation of hotel 20.0 2003/06 2004/07 1228 Sherbrooke Street West
Montréal 3879607 Canada Hotel 20.0 2003/03 2004/10 10 Sherbrooke Street West
Montréal Groupe Aldo Warehouse 20.0 2003/01 2004/05 3665 Poirier St.
St-Laurent Soc. de développements Office building 20.0 2003/08 2004/12 2300 Émile-Bélanger immobiliers Muret inc.
Montréal Gestion immobilière Atwater Residential building 20.0 2002/05 2004/03 143 Atwater St.
Montréal Les Développements Residential building 20.0 2004/02 2005/08 445 Viger West du D’Arcy McGee Ltée
Montréal 9101 9281 Québec inc. Residential building 20.0 2002/06 2004/06 1700 René-Lévesque Blvd. West
Kirkland Merck Frost Canada Plant 20.0 2003/03 2005/03 16711 Trans-Canada Highway
Source : Commission de la construction du Québec, 2004

26 DIRECTION DE LA PLANIFICATION STRATÉGIQUE SERVICE DE LA MISE EN VALEUR DU TERRITOIRE ET DU PATRIMOINE
Sites between $10 million and $19.9 millionSite Owner Type of construction Value ($M) Begin End
Montréal Immeubles Heywood inc. Residential building 19.0 2003/11 2005/02 6803 Heywood
Montréal S.B.I. Management Ltée Residential buildings 19.0 2004/03 2005/03 77 to 83 Rachel Street East
Ile-des-Soeurs Le Domaine de la Forêt Residential building 18.7 2003/01 2004/10 1 ch. de la Pointe
Montréal Ville de Montréal Rebuilding of tunnel 18.6 2003/07 2004/11 Atwater Tunnel
Montréal Marché central métropolitain Shopping centre 18.0 2004/03 2004/12 8981 l’Acadie Blvd.
Montréal STCUM Rebuilding and redevelopment 17.6 2003/07 2004/05 8845 St-Laurent Blvd. of maintenance workshop
Montréal Soc. en commandite Morzarive Residential building 17.5 2002/10 2004/10 7095 Gouin Blvd. East
Pointe-Claire Le Groupe Marine TMG inc. Residential building 17.5 2004/09 2005/11 300 Hymus Blvd.
Montréal Ville de Montréal Aquatic centre 17.0 2003/12 2005/06 Île Ste-Hélène
Montréal Institut de recherches Extension of the research centre 17.0 2002/10 2004/09 110 des Pins Ave. cliniques de Montréal
Montréal 4164598 Canada inc. Residential building “Le Luxor” 17.0 2004/03 2005/08 6803 Abraham de Sola
LaSalle Merlin Immobilier Residential development 16.6 2003/05 2004/08 800 Gagné “Le Cavalier de LaSalle”
Montréal Ville de Montréal Public market and underground parking 16.0 2004/01 2004/12 7035 Casgrain St. “Jean-Talon Market”
Montréal Groupe Canvar Residential building “Profil O” 16.0 2003/07 2004/12 Cité du Havre Pierre Varadi et Léon Wildstein
Montréal SLEB 1 inc. Modification of industrial building 16.0 2003/02 2005/06 10 Ontario St. West into a housing building
Rue du Marché central Cinémas Guzzo Cinema Complex 15.0 2004/04 2005/05
Montréal Le Saint-Honoré Multiple-use building 15.0 2003/07 2005/07 71 rue de la Commune St.
Montréal Franko Rosaria Lasenza Warehouse 15.0 2003/08 2004/02 11430 Albert-Hudon
Montréal St. James United Church Rebuilding of church 15.0 1995/04 2007/10 451 St.Catherine St. West
Montréal True North Properties Residential and commercial 15.0 2003/08 2004/10 1225 Notre-Dame St. West development “Terrasse Windsor”
Montréal Timber Cheek & Investment inc. Renovation of residential 15.0 2003/10 2004/12 440-450 Sherbrooke St. East and commercial building
Montréal Cie immobilière Residential development 15.0 2003/06 2004/11 1673 à 1699, St-Patrick Gueymard & Ass. Ltée
Montréal Entreprises Earl Luger inc. Residential building 15.0 2004/05 2006/06 1650, Sherbrooke Ouest
Montréal, Highway 40 Ministère des Transports Rebuilding of highway 14.3 2004/07 2004/12 (Anjou Interchange, Charles-De-Gaulle Bridge)
Montréal, Distribution centre, The Brick Warehouse and offices 14.0 2003/08 2004/04 10001 Métropolitain Blvd. East
Montréal, 11519 Pelletier Soc. en commandite Home for senior citizens 14.0 2004/05 2005/05 immobilière Solim

ECONOMIC REPORT27
Sites between $10 million and $19.9 millionSite Owner Type of construction Value ($M) Begin End
Montréal Corporation d’hébergement Renovation of hospital centre 13.9 2004/05 2005/01 11844 Bois-de-Boulogne du Québec “St-Joseph de la Providence”
Montréal La Société immobilière Camont Renovation and extension 13.5 2002/05 2004/02 455 St. Antoine St. West of office building
Montréal, Notre-Dame-de-Grâce Tunnel Ministère des transports Rebuilding of tunnel 13.4 2004/04 2004/08 Highway 15
Montréal La Société de développement Angus Office building 13.0 2002/04 2004/04 2901 Rachel St. East
Pointe-Claire Lumen Div. de Sonepar Dist. inc Store 13.0 2003/05 2004/05 117 Hymus Blvd.
Montréal Ste-Justine Hospital Renovation of hospital 13.0 2001/12 2005/03 Côte-Ste-Catherine Rd.
Montréal St-Joseph-de-la-Providence Renovation and modernization 13.0 2004/08 2005/12 11844 de Bois-de-Boulogne Hospital of hospital
Montréal Tennis Canada Extension of facilities 12.8 2003/10 2004/07 Jarry St./ St-Laurent Blvd.
Montréal Conseil national de recherche Research centre 12.3 2002/09 2004/03 5145 Decelles St. du Canada
Montréal Ogilvy’s Renovation of store 12.0 2004/06 2004/11 1307 Ste-Catherine St. West
St-Laurent Les Entreprises Samig ltée Home for senior citizens 12.0 2004/06 2005/06 1200 Alexis-Nihon
Montréal Ville de Montréal Sewers and waterworks 12.0 2002/12 2004/04 Perras Blvd.
Montréal Conception Rachel Julien Alex Redevelopment of church into 12.0 2002/07 2004/05 6655 St-Laurent Blvd. & Rafaelle Const. inc. residential building
Anjou San Carlo Construction Residential building 12.0 2004/03 2005/04 “Villa Latella”
Montréal Les constructions Sydobert inc. Residential building, 12.0 2003/10 2005/05 15500 Sherbrooke St. East Les Crystalliques sur le golf
St-Laurent Les Terrasses de la Gare Residential buildings 12.0 2003/09 2004/12 985 - 995 Muir Montpellier SNC
Pointe-Claire Groupe GJC Lavoie Residential development 12.0 2003/07 2005/12 Harry-Worth St.
Senneville Clintrials Biorecherches ltée Extension of laboratory 12.0 2003/10 2004/12 87 Senneville Rd.
Montréal Oeuvres de La Maison du Père Drop-in centre 11.7 2003/06 2004/05 René-Lévesque/St-Hubert
Montréal Conception Habitat 2000 inc. Residential building 11.0 2003/09 2004/10 3598 Angrignon Blvd.
Lachine Développement Rose-Bleu Residential development 11.0 2004/02 2007/04 Victoria St./19th Ave./Remembrance “Cours des Rosiers”
Montréal Le Jardin en ville Residential development 10.9 2002/11 2004/05 St-Grégoire/St-André sts.
Lachine Merlin immobilier inc. Residential building 10.5 2004/08 2005/07 2900 Notre-Dame St.
Montréal Ville de Montréal Residential building 10.2 2002/03 2004/05 Rachel St. “Centre Préfontaine”
Montréal 3911349 Canada Community Centre 10.0 2002/01 2005/04 4700 Dagenais St.
Montréal CEPSUM - Université de Montréal Rebuilding of sports facilities 10.0 2003/06 2004/02 Édouard-Montpetit Blvd.

28 DIRECTION DE LA PLANIFICATION STRATÉGIQUE SERVICE DE LA MISE EN VALEUR DU TERRITOIRE ET DU PATRIMOINE
Sites between $10 million and $19.9 millionSite Owner Type of construction Value ($M) Begin End
Montréal Cité des arts du cirque - TOHU Big top - arts - and greeting pavilion 10.0 2003/06 2004/08 2275 des Regattiers St.
Montréal Quebecor Renovation of office building 10.0 2004/03 2004/12 612 St-Jacques St. West
Montréal Ministère des Transports Rebuilding of tunnel 10.0 2002/05 2004/03 L.-H.-Lafontaine Tunnel
Montréal Samcon Residential development (Phase 1) 10.0 2003/11 2004/12 8800 Christophe-Colomb
Montréal FTQ and CP Railway Residential development 10.0 2003/02 2004/12 St-Michel Blvd./Rachel St. “Square Angus” (Phase 1)
St-Laurent Groupe immobilier Scalia Residential building 10.0 2003/11 2004/12 840 Muir
Montréal Daniel Révah - Patrick Lévy Renovation of residential building 10.0 2003/10 2004/12 10 and 12 St-Jacques West “Thémis Building”
Montréal Les Habitations Lapoudrière Residential building 10.0 2003/07 2005/05 110 Rhéaume St.
Montréal Cegerco Residential building 10.0 2004/03 2004/12 334 Notre-Dame St. East “Le 334 Notre-Dame”
Lachine Excellence Construction Residential building 10.0 2004/04 2006/05 500 Sherbrooke St.
Source : Commission de la construction du Québec, 2004
ECONOMIC REPORT29
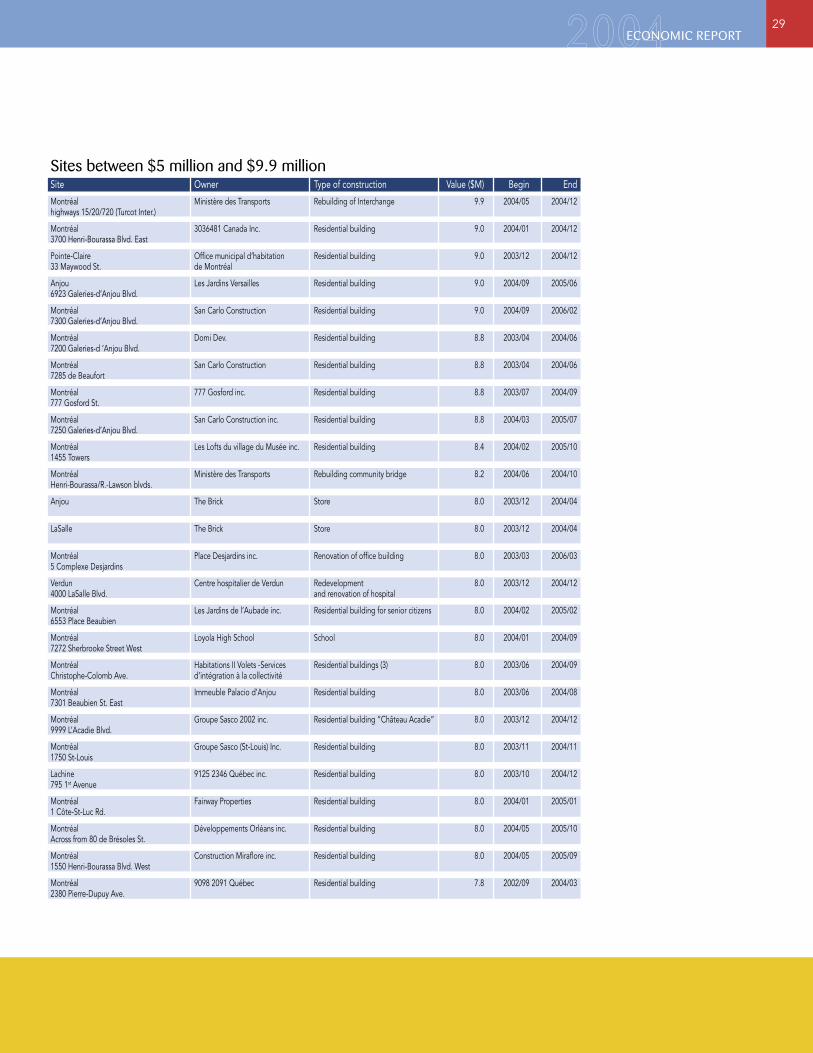
Sites between $5 million and $9.9 millionSite Owner Type of construction Value ($M) Begin End
Montréal Ministère des Transports Rebuilding of Interchange 9.9 2004/05 2004/12 highways 15/20/720 (Turcot Inter.)
Montréal 3036481 Canada Inc. Residential building 9.0 2004/01 2004/12 3700 Henri-Bourassa Blvd. East
Pointe-Claire Office municipal d’habitation Residential building 9.0 2003/12 2004/12 33 Maywood St. de Montréal
Anjou Les Jardins Versailles Residential building 9.0 2004/09 2005/06 6923 Galeries-d’Anjou Blvd.
Montréal San Carlo Construction Residential building 9.0 2004/09 2006/02 7300 Galeries-d’Anjou Blvd.
Montréal Domi Dev. Residential building 8.8 2003/04 2004/06 7200 Galeries-d ‘Anjou Blvd.
Montréal San Carlo Construction Residential building 8.8 2003/04 2004/06 7285 de Beaufort
Montréal 777 Gosford inc. Residential building 8.8 2003/07 2004/09 777 Gosford St.
Montréal San Carlo Construction inc. Residential building 8.8 2004/03 2005/07 7250 Galeries-d’Anjou Blvd.
Montréal Les Lofts du village du Musée inc. Residential building 8.4 2004/02 2005/10 1455 Towers
Montréal Ministère des Transports Rebuilding community bridge 8.2 2004/06 2004/10 Henri-Bourassa/R.-Lawson blvds.
Anjou The Brick Store 8.0 2003/12 2004/04
LaSalle The Brick Store 8.0 2003/12 2004/04
Montréal Place Desjardins inc. Renovation of office building 8.0 2003/03 2006/03 5 Complexe Desjardins
Verdun Centre hospitalier de Verdun Redevelopment 8.0 2003/12 2004/12 4000 LaSalle Blvd. and renovation of hospital
Montréal Les Jardins de l’Aubade inc. Residential building for senior citizens 8.0 2004/02 2005/02 6553 Place Beaubien
Montréal Loyola High School School 8.0 2004/01 2004/09 7272 Sherbrooke Street West
Montréal Habitations II Volets -Services Residential buildings (3) 8.0 2003/06 2004/09 Christophe-Colomb Ave. d’intégration à la collectivité
Montréal Immeuble Palacio d’Anjou Residential building 8.0 2003/06 2004/08 7301 Beaubien St. East
Montréal Groupe Sasco 2002 inc. Residential building “Château Acadie” 8.0 2003/12 2004/12 9999 L’Acadie Blvd.
Montréal Groupe Sasco (St-Louis) Inc. Residential building 8.0 2003/11 2004/11 1750 St-Louis
Lachine 9125 2346 Québec inc. Residential building 8.0 2003/10 2004/12 795 1st Avenue
Montréal Fairway Properties Residential building 8.0 2004/01 2005/01 1 Côte-St-Luc Rd.
Montréal Développements Orléans inc. Residential building 8.0 2004/05 2005/10 Across from 80 de Brésoles St.
Montréal Construction Miraflore inc. Residential building 8.0 2004/05 2005/09 1550 Henri-Bourassa Blvd. West
Montréal 9098 2091 Québec Residential building 7.8 2002/09 2004/03 2380 Pierre-Dupuy Ave.
30 DIRECTION DE LA PLANIFICATION STRATÉGIQUE SERVICE DE LA MISE EN VALEUR DU TERRITOIRE ET DU PATRIMOINE
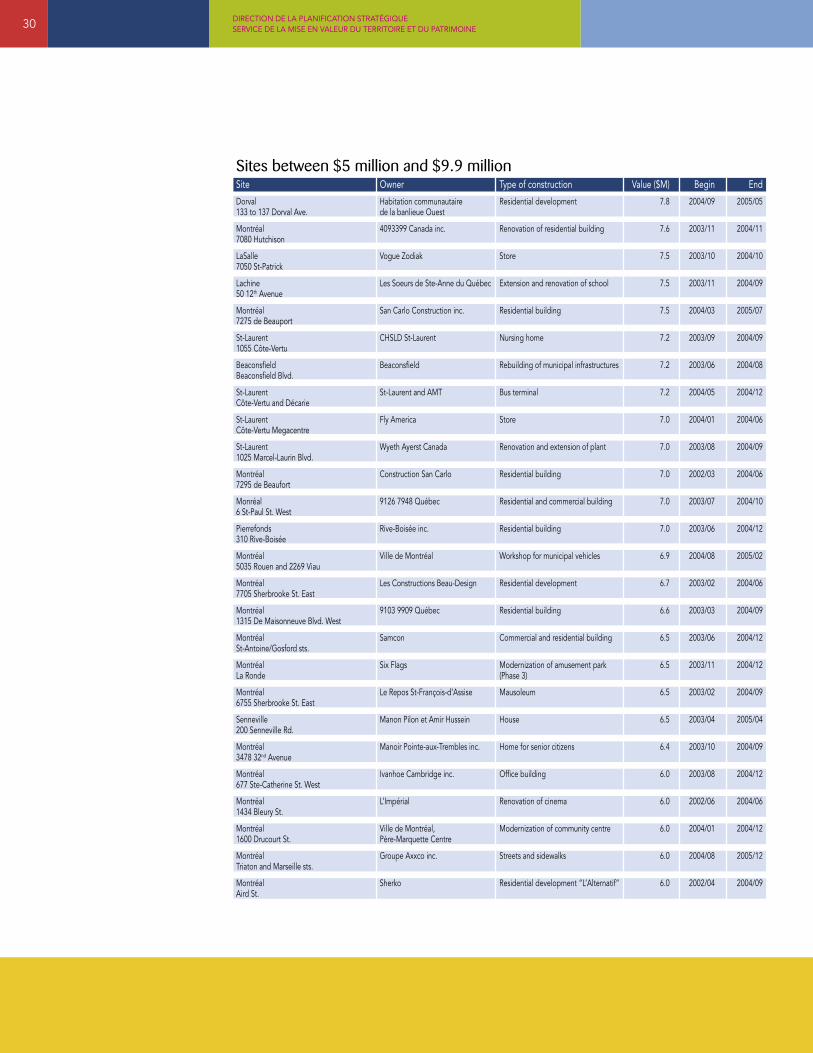
Sites between $5 million and $9.9 millionSite Owner Type of construction Value ($M) Begin End
Dorval Habitation communautaire Residential development 7.8 2004/09 2005/05 133 to 137 Dorval Ave. de la banlieue Ouest
Montréal 4093399 Canada inc. Renovation of residential building 7.6 2003/11 2004/11 7080 Hutchison
LaSalle Vogue Zodiak Store 7.5 2003/10 2004/10 7050 St-Patrick
Lachine Les Soeurs de Ste-Anne du Québec Extension and renovation of school 7.5 2003/11 2004/09 50 12th Avenue
Montréal San Carlo Construction inc. Residential building 7.5 2004/03 2005/07 7275 de Beauport
St-Laurent CHSLD St-Laurent Nursing home 7.2 2003/09 2004/09 1055 Côte-Vertu
Beaconsfield Beaconsfield Rebuilding of municipal infrastructures 7.2 2003/06 2004/08 Beaconsfield Blvd.
St-Laurent St-Laurent and AMT Bus terminal 7.2 2004/05 2004/12 Côte-Vertu and Décarie
St-Laurent Fly America Store 7.0 2004/01 2004/06 Côte-Vertu Megacentre
St-Laurent Wyeth Ayerst Canada Renovation and extension of plant 7.0 2003/08 2004/09 1025 Marcel-Laurin Blvd.
Montréal Construction San Carlo Residential building 7.0 2002/03 2004/06 7295 de Beaufort
Monréal 9126 7948 Québec Residential and commercial building 7.0 2003/07 2004/10 6 St-Paul St. West
Pierrefonds Rive-Boisée inc. Residential building 7.0 2003/06 2004/12 310 Rive-Boisée
Montréal Ville de Montréal Workshop for municipal vehicles 6.9 2004/08 2005/02 5035 Rouen and 2269 Viau
Montréal Les Constructions Beau-Design Residential development 6.7 2003/02 2004/06 7705 Sherbrooke St. East
Montréal 9103 9909 Québec Residential building 6.6 2003/03 2004/09 1315 De Maisonneuve Blvd. West
Montréal Samcon Commercial and residential building 6.5 2003/06 2004/12 St-Antoine/Gosford sts.
Montréal Six Flags Modernization of amusement park 6.5 2003/11 2004/12 La Ronde (Phase 3)
Montréal Le Repos St-François-d’Assise Mausoleum 6.5 2003/02 2004/09 6755 Sherbrooke St. East
Senneville Manon Pilon et Amir Hussein House 6.5 2003/04 2005/04 200 Senneville Rd.
Montréal Manoir Pointe-aux-Trembles inc. Home for senior citizens 6.4 2003/10 2004/09 3478 32nd Avenue
Montréal Ivanhoe Cambridge inc. Office building 6.0 2003/08 2004/12 677 Ste-Catherine St. West
Montréal L’Impérial Renovation of cinema 6.0 2002/06 2004/06 1434 Bleury St.
Montréal Ville de Montréal, Modernization of community centre 6.0 2004/01 2004/12 1600 Drucourt St. Père-Marquette Centre
Montréal Groupe Axxco inc. Streets and sidewalks 6.0 2004/08 2005/12 Triaton and Marseille sts.
Montréal Sherko Residential development “L’Alternatif” 6.0 2002/04 2004/09 Aird St.

ECONOMIC REPORT31
Sites between $5 million and $9.9 millionSite Owner Type of construction Value ($M) Begin End
Montréal 363005 Canada Residential building 6.0 2002/08 2004/09 4300 De Maisonneuve Blvd. West
Montréal Le Chopin Condominium Residential building 6.0 2003/03 2004/07 2545 Modugno
Montréal Phénix Notre-Dame Residential building 6.0 2003/05 2004/12 650 Notre-Dame St. West
Kirkland Groupe immobilier Grilli inc. Residential buildings 6.0 2003/05 2004/08 17150 and 17250 Hymus Blvd.
Montréal Groupe Samcon Residential development 6.0 2003/07 2004/12 150 to 166, Faillon St. West
Montréal Investissements Residential building 6.0 2003/10 2004/12 10350 les Galeries-d’Anjou Blvd. Groupe Montclair inc.
Montréal Résidence au fil de l’eau Residential building 6.0 2003/09 2004/09 7015 Gouin Blvd. East
Montréal Développements Terra Monde inc. Residential building 6.0 2003/09 2004/10 1415 des Pins Ave.
Montréal Collège Régina Assumpta Extension of school 5.8 2004/03 2004/09 1750 Sauriol St. East
Montréal Développement Sainte-Hélène Residential building 5.3 2003/10 2004/11 425 Ste-Hélène St.
Montréal La Coopérative d’habitation Residential building 5.3 2004/07 2004/12 8751-8761, 9th Avenue Résidence Casa Blanca
Montréal Centre communautaire et culturel Rebuilding of centre 5.2 2004/06 2004/12 1086 Clark chinois de Montréal
Montréal Ville de Montréal Home for senior citizens 5.2 2004/03 2005/02 St-Antoine St.
Montréal Alliance Prével Transformation of plant 5.2 2004/05 2005/05 William/de l’Inspecteur sts. into a residential building
Montréal Cité Nordelec Renovation of office buildings 5.0 2000/09 2004/10 1751 Richardson
Montréal Ville de Montréal Public square “Place Valois” 5.0 2004/09 2005/12 Hochelaga/Maisonneuve neighbourhood
Montréal Place Bonaventure Commercial building 5.0 2003/03 2004/12 900 De La Gauchetière West
Montréal Human Resources Canada Rebuilding of office building 5.0 2003/06 2004/10 715 Peel St.
Montréal Placements St-Mathieu Office building 5.0 2001/09 2004/09 275 St-Jacques St. West
Montréal Pasquin St-Jean et ass. inc. Store 5.0 2003/07 2004/10 41 St-Jacques St. West
Dollard-des-Ormeaux Adonis Market Store 5.0 2003/11 2004/11 4601 Sources Blvd.
Montréal Provigo inc. Store 5.0 2003/10 2004/04 2535 Masson St.
Pierrefonds Hershey Rose Residential development 5.0 2003/03 2004/12
Baie d’Urfé Corporation Maxwell Home for senior citizens 5.0 2003/04 2004/03 Surrey St. 9118 5298 Québec
Montréal 4151291 Canada Residential building 5.0 2003/04 2004/09 7335 St-Laurent Blvd.
Pierrefonds Groupe Dubcan Développement Residential building 5.0 2003/05 2004/07 St-Jean Blvd.

32 DIRECTION DE LA PLANIFICATION STRATÉGIQUE SERVICE DE LA MISE EN VALEUR DU TERRITOIRE ET DU PATRIMOINE
Sites between $5 million and $9.9 millionSite Owner Type of construction Value ($M) Begin End
Pierrefonds Immeubles Saba Residential building 5.0 2003/07 2004/12 16609 to 16709 Pierrefonds Blvd.
Montréal 4136985 Canada inc. Residential building 5.0 2003/09 2004/12 65 René-Lévesque Blvd. East Groupe Canvar
Montréal S.P. Holdings Residential development 5.0 2004/01 2005/04 5803 Tommy-Douglas St.
Dollard-des-Ormeaux CMI Construction inc. Residential building 5.0 2003/09 2004/12 120 Donnacona
Montréal Coopération d’habitation Residential building 5.0 2004/05 2004/12 1100 St-Antoine St. East La Porte du Bourg
Montréal Avantis Cellulaire inc. Residential building 5.0 2004/08 2005/07 3465 Côte-des-Neiges Rd.
Montréal Le Clos St-Ambroise inc. Residential building 5.0 2003/10 2005/02 3830 St-Ambroise St.
St-Laurent AstraZeneca Expansion of research centre 5.0 2004/06 2004/12 7171 Frédérick-Banting St.

Economy
Montréal International www.montrealinternational.com
Conference Board of Canada www.conferenceboard.ca
Board of Trade of Metropolitan Montreal www.ccmm.qc.ca
Transportation
Port of Montreal www.port-montreal.com
Aéroports de Montréal www.admtl.com
Tourism
Tourisme Montréal www.tourisme-montreal.org
Public administration
Ville de Montréal www.ville.montreal.qc.ca
Montréal Metropolitan Community www.cmm.qc.ca
Institut de la statistique du Québec www.stat.gouv.qc.ca
Statistics Canada www.statcan.ca
Direction de la santé publique www.santepub-mtl.qc.ca
Capital spending
Canada Mortgage and Housing Corporation www.schl.ca
Commission de la construction du Québec www.ccq.org
CB Richard Ellis www.cbre.ca
For more information
on the economic
components of Montréal
and the metropolitan area:

ville.montreal.qc.ca