city of seattle construction industry labor market assessment€¦ · city of seattle construction...
TRANSCRIPT

City of Seattle Construction Industry Labor Market Assessment
March 2014
Submitted to:
City of Seattle Purchasing and Contracting Services Submitted by:

Community Attributes tells data-rich stories about communities that are important to decision-makers.
Chris Mefford, President & CEO
Analysts: Spencer Cohen
Erin Gengo Elliot Weiss
Community Attributes Inc. 1411 Fourth Ave, Suite 770
Seattle, WA 98115 206.523.6683
www.communityattributes.com

EXECUTIVE SUMMARY Background and Purpose
City of Seattle contracting leaders desire to expand access to economic opportunity for those historically facing barriers to construction industry jobs (women, people of color and otherwise disadvantaged individuals, particularly those who are also Seattle residents). The City wishes to increase construction employment and optimize career ladders to improve access to these jobs. This report provides an evaluation of the Construction labor market and workforce availability, to increase understanding of availability and barriers for hiring of "target workers", for City of Seattle Public Works contracts. Target workers include local women, people of color, and the economically and socially disadvantaged. The report seeks to serve the City Council, Mayor, City staff, and the City Construction Careers Advisory Committee (CCAC) which was established by Council Resolution in 2013. The Resolution tasked the CCAC to recommend to City Council and the Mayor any policies, methods or programs appropriate for the City, which would enhance private contractor hiring of local target workers.
This study evaluates the workforce in the Construction industry and identifies the current and projected supply of labor that is willing and motivated to work on the City of Seattle’s Capital Improvement Program (CIP). Employment in the construction industry is made up of a migratory workforce. The labor market analysis focuses on Seattle’s residential workforce as well as the broader labor market which includes King, Pierce, and Snohomish counties. This analysis estimates the quantity and demographic composition of the region’s Construction labor force to understand opportunities for the City to hire target workers for Capital Improvement Program (CIP).
This analysis establishes supply and demand of the region’s Construction workforce through 2019 and a baseline scenario for the existing labor pool absent any policy intervention. The model then analyzes the outcome of different target hiring scenarios for City of Seattle Public Works projects on the projected Construction workforce for local women, people of color, and the economically and socially disadvantaged.
Seattle PCS Construction Industry March 2014 Page i Labor Market Assessment

Findings The gap between the supply and demand is the surplus or deficit of regional workers needed to satisfy forecasted local Construction employment. The analysis measures the workforce gap for all Construction employment, including workers in administrative and managerial positions, as well as for sector workers in trades only found in Construction, such as framers.
For both the overall Construction industry and the Construction trades alone, economic forecasts suggest a surplus of workers will exist through 2019. The surplus is projected to decline from 8.0% in 2013 to 4.9% in 2019 for the former segment of Construction labor, and from 9.4% in 2013 to 5.8% in 2019 for the latter population (Exhibit E1).
Exhibit E1. Gap Analysis for Construction Supply and Demand Segment of Labor Force Measure 2013 (est.) 2014 2019
Total Construction Employment
Demand 95,400 97,800 110,500 Supply 103,700 104,300 116,200 Difference 8,300 6,500 5,700 Surplus 8.0% 6.2% 4.9%
Construction Trades Only (non-baccalaureate)
Demand 67,600 69,500 79,300 Supply 74,600 74,900 84,200 Difference 7,000 5,400 4,900 Surplus 9.4% 7.2% 5.8%
Sources: Puget Sound Regional Council; Conway Pedersen Economics; IPEDs; Washington State Employment Security Department; Washington State Department of Labor & Industries; Community Attributes, 2014.
Forecasts from the Puget Sound Regional Council and from Conway Pedersen Economics (evaluated independently and analyzed together) suggest demand for workers in Construction trades in the tri-county region is 97,800 in 2014 and will increase by 13% through 2019 to 110,500. Regional public works projects will require between 13,200 and 14,900 workers annually, and, on average, 400 FTEs each year will be required to complete work associated with the City of Seattle’s Capital Improvement Program. Because construction workers often are not on the job site full-time for a year, this does not necessarily equate to 400 workers annually.
Seattle PCS Construction Industry March 2014 Page ii Labor Market Assessment

Demographic Composition of Construction Workers In 2014, 77% of all workers in Construction in King, Snohomish, and Pierce counties are white males, and the remaining 23% comprises people of color and women. Representation of women and people of color is higher among new entrants to the labor force through apprenticeships and accredited completions than the overall workforce, the latter including both 2-year and 4-year degreed programs. However, women and people of color also have higher rates of apprenticeship cancellations than do their white male counterparts.
In the absence of policy interventions, the infusion of new workers coming from apprenticeships and educational programs will gradually change the existing demographic composition over time to a workforce that is slightly more racially diverse, with higher female composition.
In addition to the known supply of workers for the Construction industry, the City is also interested understanding and targeting the potential supply of workers who are qualified and motivated to work in Construction, but who are not engaged in any training pipeline. Exhibit E2 combines City criteria into a single map of potential areas of targeted outreach to that population.
Seattle PCS Construction Industry March 2014 Page iii Labor Market Assessment

Seattle PCS Construction Industry March 2014 Page iv Labor Market Assessment

Blank.
Seattle PCS Construction Industry March 2014 Page v Labor Market Assessment

CONTENTS
Executive Summary ............................................................................................................................... i Introduction .......................................................................................................................................... 1 Construction Sector Employment and Workforce Profile ................................................................ 3 Supply and Demand for Construction Workers ............................................................................... 19 Gap Analysis ....................................................................................................................................... 50 Opportunities for Discussion ............................................................................................................ 51 Next Steps ........................................................................................................................................... 53 Glossary ............................................................................................................................................... 55 Appendices .......................................................................................................................................... 56
Seattle PCS Construction Industry March 2014 Page vi Labor Market Assessment

Blank
Seattle PCS Construction Industry March 2014 Page vii Labor Market Assessment

INTRODUCTION Background and Purpose
This study evaluates the Construction labor market and workforce availability for King, Pierce, and Snohomish counties combined, in an effort to understand the sources of demand and supply for the regional Construction workforce. This analysis focuses on the regional Construction workforce, reflecting the labor market. Where possible, this analysis attempts to provide data for the city of Seattle to provide more local context for policy consideration.
The City of Seattle is interested in expanding access to economic opportunity by increasing construction employment and providing career ladders for those historically facing barriers to jobs in the construction industry (women, people of color and otherwise disadvantaged individuals, and particularly those who are also Seattle residents). This project provides an evaluation of the Construction labor market and workforce availability, in order to increase understanding of availability and barriers for hiring of target workers including local women, people of color, and the economically and socially disadvantaged, for City of Seattle Public Works contracts.
This report serves the City Council, Mayor, City staff, and the City Construction Careers Advisory Committee (CCAC) which was established by Council Resolution in 2013. The Resolution tasked CCAC to recommend to City Council and the Mayor any policies, methods or programs appropriate for the City, which would enhance private contractor hiring of local target workers.
The analysis provides an understanding of the current availability of such Construction trade workers; the potential availability of such workers given effective recruitment and training strategies; how much future work is likely to be generated by regional public agencies and for which trades; and the degree that the City might be able to influence hiring based on those data. The study provides a platform for additional agency coordination and cooperation to foster regional collaboration on municipal contracting to support target workers.
Methods This analysis uses available secondary data, stakeholder interviews, and data from the City of Seattle Purchasing and Contracting Services to estimate current and projected labor supply and demand in the Construction Industry for King, Snohomish, and Pierce counties. The study includes analysis of the City’s Capital Improvement Program (CIP), and contract labor requirements. Other sources of data include Employment Security Division employment and unemployment claims data, U.S. Census Bureau demographic data, Washington State
Seattle PCS Construction Industry March 2014 Page 1 Labor Market Assessment

Department of Labor & Industries apprenticeship data, and National Center for Education Statistics completions data.
Organization of Report The report includes the following sections:
• Construction Sector Employment and Workforce Profile. An introduction to the size of employment, occupations, and workforce pathways in the Construction sector for King, Pierce, and Snohomish counties.
• Supply and Demand for Construction Workers. The study employs Construction forecasts to examine demand, supply, and forecasted gap for the labor force.
• Opportunities for Discussion. An assessment of the potential impact of targeted hiring criteria.
• Glossary. A reference guide for definitions and key terms used throughout the report.
• Appendix of Supporting Analytics. A compendium of exhibits produced from interim analysis that supported development of this report.
Seattle PCS Construction Industry March 2014 Page 2 Labor Market Assessment

CONSTRUCTION SECTOR EMPLOYMENT AND WORKFORCE PROFILE Sector Employment
This section establishes context for the Construction sector for King, Pierce and Snohomish counties, and for the City of Seattle where possible, including a Construction sector definition and trends in sector jobs.
Exhibit 1 displays the NAICS (North American Industry Classification System1) codes that this study considers core to the Construction industry. NAICS codes were developed by the U.S. Census Bureau and are used to classify business establishments for the purpose of economic data collection and analysis. While this study primarily focuses on non-residential Construction because that is where most public works activity is reflected, firms who are prime contractors for the City are also sometimes found in residential NAICS categories.
Exhibit 1. NAICS Codes in the Construction Industry
Source: WA Employment Security Department QCEW, 2012.
Exhibit 2 presents a snapshot of total employment in King, Pierce, and Snohomish counties in 2013. In Construction subsectors, Specialty Trade Contractors (NAICS 238) employ the most workers of all Construction subsectors. Construction of Buildings (NAICS 236) employs the second-most workers, with Heavy and Civil Engineering (NAICS 237) employing the fewest.
1 See Glossary for more information and other definitions.
NAICS Code Description NAICS Code Description23 Construction
236 Construction of Buildings 238 Specialty Trade Contractors (Residential and Non-residential)New single‑family general contractors Poured foundation contractorsNew multifamily general contractors Structural steel contractorsNew housing for-sale builders Framing contractorsResidential remodelers Masonry contractorsIndustrial building construction Glass and glazing contractorsCommercial building construction Roofing contractorsOther industries Siding contractors
237 Heavy and Civil Engineering Construction Other exterior contractorsWater and sewer system construction Electrical contractorsOil and gas pipeline construction Plumbing and hvac contractorsPower and communication system construction Other equipment contractorsLand subdivision Drywall contractorsHighway, street, and bridge construction Painting contractorsOther heavy construction Flooring contractorsOther industries Tile and terrazzo contractors
Finish carpentry contractorsOther finishing contractorsSite preparation contractorsAll other trade contractors
Seattle PCS Construction Industry March 2014 Page 3 Labor Market Assessment
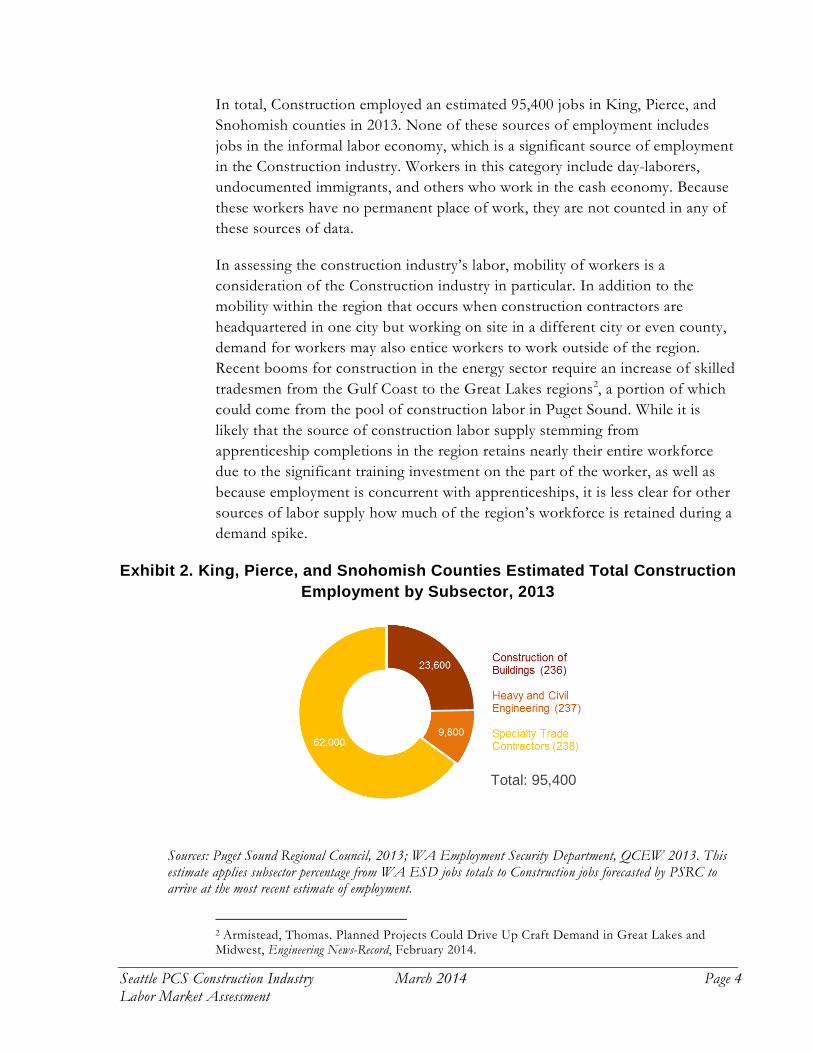
In total, Construction employed an estimated 95,400 jobs in King, Pierce, and Snohomish counties in 2013. None of these sources of employment includes jobs in the informal labor economy, which is a significant source of employment in the Construction industry. Workers in this category include day-laborers, undocumented immigrants, and others who work in the cash economy. Because these workers have no permanent place of work, they are not counted in any of these sources of data.
In assessing the construction industry’s labor, mobility of workers is a consideration of the Construction industry in particular. In addition to the mobility within the region that occurs when construction contractors are headquartered in one city but working on site in a different city or even county, demand for workers may also entice workers to work outside of the region. Recent booms for construction in the energy sector require an increase of skilled tradesmen from the Gulf Coast to the Great Lakes regions2, a portion of which could come from the pool of construction labor in Puget Sound. While it is likely that the source of construction labor supply stemming from apprenticeship completions in the region retains nearly their entire workforce due to the significant training investment on the part of the worker, as well as because employment is concurrent with apprenticeships, it is less clear for other sources of labor supply how much of the region’s workforce is retained during a demand spike.
Exhibit 2. King, Pierce, and Snohomish Counties Estimated Total Construction Employment by Subsector, 2013
Sources: Puget Sound Regional Council, 2013; WA Employment Security Department, QCEW 2013. This estimate applies subsector percentage from WA ESD jobs totals to Construction jobs forecasted by PSRC to arrive at the most recent estimate of employment.
2 Armistead, Thomas. Planned Projects Could Drive Up Craft Demand in Great Lakes and Midwest, Engineering News-Record, February 2014.
Total: 95,400
Seattle PCS Construction Industry March 2014 Page 4 Labor Market Assessment

Exhibit 3 shows Seattle employment in the Construction industry from 2003-2013 (in NAICS 23), compared with employment in the larger area of King, Pierce, and Snohomish counties. The City of Seattle lost 33% of its Construction jobs between 2008 and 2011; King, Pierce, and Snohomish counties lost slightly more (37%) during that time period. However, employment has increased by 5.1% in the City of Seattle and by 7.9% in King, Pierce, and Snohomish counties from 2011 into 2013.
Exhibit 3. Construction Jobs in Seattle, King, Pierce, and Snohomish Counties, 2003-2013
Sources: Puget Sound Regional Council 2013; WA Employment Security Department, QCEW 2013; U.S. Census Bureau Non-employer Statistics, 2013; Community Attributes, 2014. Estimates for the City of Seattle sum actual values of covered employment as reported by PSRC with estimated non-employer jobs, calculated based on the relationship between non-employers to covered employment for the Seattle MSA.
Exhibit 4 disaggregates jobs by subsector within Construction for 2003-2013. For all three subsectors, total post-recession employment in that subsector in 2013 was still lower than the pre-recession levels of employment. Between 2007 and 2011 both subsectors of Specialty Trade Contractors, and Heavy and Civil
Seattle PCS Construction Industry March 2014 Page 5 Labor Market Assessment

Engineering Construction, experienced a decline of nearly 33%; the Construction of Buildings employment subcategory lost slightly more during that time (34%). Jobs increased for all three subsectors beginning in 2011, by 10% for Construction of Buildings, by 5% for Heavy and Civil Engineering Construction, and by 4% for Specialty Trade Contractors. Heavy and Civil Engineering Construction lost fewer jobs, suggesting the demand for that subsector fluctuates less than other subsectors of Construction; this is the subsector employed the most for Seattle public works.
Exhibit 4. Construction Jobs by Subsector, King, Pierce and Snohomish Counties, 2003-2013
Sources: U.S. Census Bureau Non-employer Statistics, 2013; WA Employment Security Department, QCEW 2013.
Exhibit 5 estimates subsector activity within the City of Seattle from 2003 to 2013. Between 2008 and 2011, Construction of Buildings and Specialty Trade Contractors lost 36% and 34% of their construction jobs, respectively. Heavy and Civil Engineering Construction experienced a significantly smaller relative loss of jobs (20%) during the same time period. The increase of jobs beginning in 2011 was largest for Construction of Buildings, with a 12% increase between 2011 and 2013. Heavy and Civil Engineering and Specialty Trade Contractors experienced a smaller relative increase in jobs during that time period with a 2% and 3% respective increase.
Construction employment is highly seasonal, as evidenced by Exhibit 6, which displays seasonally and non-seasonally adjusted data from 2010 to 2012. Generally, employment is lower in the beginning and the end of the year and
Seattle PCS Construction Industry March 2014 Page 6 Labor Market Assessment

higher during the summer. In an attempt to smooth out this seasonality, this report either uses seasonally adjusted data, or creates a moving average.
Exhibit 5. Construction Jobs by Subsector, City of Seattle, 2003-2013
Sources: WA Employment Security Department; Community Attributes Inc. 2014.
Exhibit 6. Seasonally Adjusted vs. Not Seasonally Adjusted Construction Employment: King, Pierce, and Snohomish Counties, 2010-2012
Source: WA Employment Security Department CES, 2013.
Seattle PCS Construction Industry March 2014 Page 7 Labor Market Assessment
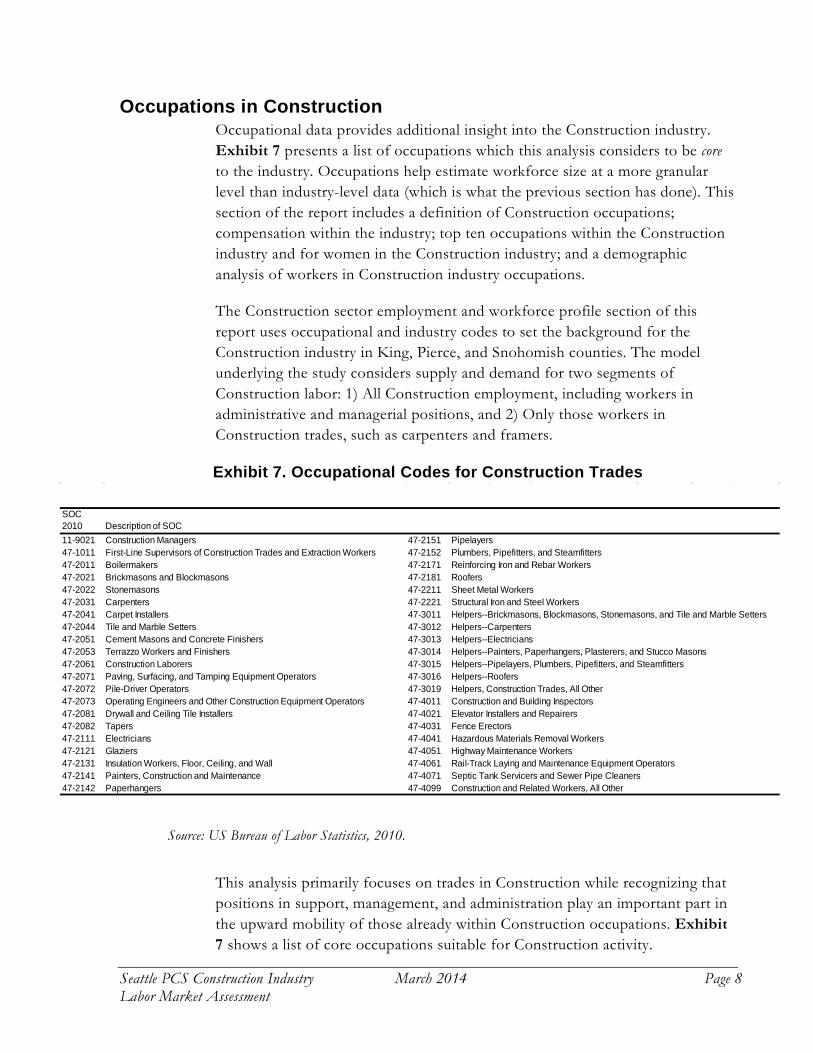
Occupations in Construction Occupational data provides additional insight into the Construction industry. Exhibit 7 presents a list of occupations which this analysis considers to be core to the industry. Occupations help estimate workforce size at a more granular level than industry-level data (which is what the previous section has done). This section of the report includes a definition of Construction occupations; compensation within the industry; top ten occupations within the Construction industry and for women in the Construction industry; and a demographic analysis of workers in Construction industry occupations.
The Construction sector employment and workforce profile section of this report uses occupational and industry codes to set the background for the Construction industry in King, Pierce, and Snohomish counties. The model underlying the study considers supply and demand for two segments of Construction labor: 1) All Construction employment, including workers in administrative and managerial positions, and 2) Only those workers in Construction trades, such as carpenters and framers.
Exhibit 7. Occupational Codes for Construction Trades
Source: US Bureau of Labor Statistics, 2010.
This analysis primarily focuses on trades in Construction while recognizing that positions in support, management, and administration play an important part in the upward mobility of those already within Construction occupations. Exhibit 7 shows a list of core occupations suitable for Construction activity.
SOC 2010 Description of SOC11-9021 Construction Managers 47-2151 Pipelayers47-1011 First-Line Supervisors of Construction Trades and Extraction Workers 47-2152 Plumbers, Pipefitters, and Steamfitters47-2011 Boilermakers 47-2171 Reinforcing Iron and Rebar Workers47-2021 Brickmasons and Blockmasons 47-2181 Roofers47-2022 Stonemasons 47-2211 Sheet Metal Workers47-2031 Carpenters 47-2221 Structural Iron and Steel Workers47-2041 Carpet Installers 47-3011 Helpers--Brickmasons, Blockmasons, Stonemasons, and Tile and Marble Setters47-2044 Tile and Marble Setters 47-3012 Helpers--Carpenters47-2051 Cement Masons and Concrete Finishers 47-3013 Helpers--Electricians47-2053 Terrazzo Workers and Finishers 47-3014 Helpers--Painters, Paperhangers, Plasterers, and Stucco Masons47-2061 Construction Laborers 47-3015 Helpers--Pipelayers, Plumbers, Pipefitters, and Steamfitters47-2071 Paving, Surfacing, and Tamping Equipment Operators 47-3016 Helpers--Roofers47-2072 Pile-Driver Operators 47-3019 Helpers, Construction Trades, All Other47-2073 Operating Engineers and Other Construction Equipment Operators 47-4011 Construction and Building Inspectors47-2081 Drywall and Ceiling Tile Installers 47-4021 Elevator Installers and Repairers47-2082 Tapers 47-4031 Fence Erectors47-2111 Electricians 47-4041 Hazardous Materials Removal Workers47-2121 Glaziers 47-4051 Highway Maintenance Workers47-2131 Insulation Workers, Floor, Ceiling, and Wall 47-4061 Rail-Track Laying and Maintenance Equipment Operators47-2141 Painters, Construction and Maintenance 47-4071 Septic Tank Servicers and Sewer Pipe Cleaners47-2142 Paperhangers 47-4099 Construction and Related Workers, All Other
Seattle PCS Construction Industry March 2014 Page 8 Labor Market Assessment

Occupations in this list contain trades such as sheet metal workers and pipe layers, to supervisory and management activities such as Construction managers and supervisors, to “helpers”, and laborers. Occupations are known by their “SOC” Codes (see the Glossary for more definitions).
Within the Construction industry, occupational concentration differs according to the unit of geography or industry subsector analyzed. Carpenters, Laborers, and Supervisors are among the largest Construction occupations by number of employees for the three-county area in 2012. Exhibit 8 displays the top ten occupations employed in NAICS code 233.
Exhibit 8. Ten Most Prevalent Occupations in the Construction Industry; King, Pierce and Snohomish Counties, 2012
Source: WA Employment Security Department, 2012; US Bureau of Labor Statistics, 2013.
3 Occupational concentration by subsector of Construction is included in Appendix A.
Seattle PCS Construction Industry March 2014 Page 9 Labor Market Assessment

Occupations in the Construction industry pay higher wages than the overall median annual wage, as evidenced by Exhibit 9, which displays the 15 highest-paying occupations in Construction (NAICS 23). Seattle’s Construction managers and other supervisory positions are the highest paid positions. However, trades such as electricians and sheet metal workers also pay good wages. On average, the median annual wage of the occupations in this analysis is $53,000—nearly $7,000 higher than the median annual wage for all construction occupations combined. For context, an average median annual wage of all Helpers (laborers) is included.
Exhibit 9. Selected Construction Occupations by Median Annual Wage; King, Pierce, and Snohomish Counties, 2012
Source: US Bureau of Labor Statistics Occupational Employment Statistics, 2012.
Exhibits 10 and 11 show the composition of the workforce engaged in Construction occupations for the three-county area, as well as for the City of Seattle (based on place of work) by race in 2012. A majority (80%) of the Construction workforce is white, while 20% are people of color. Compared to the larger population of King, Pierce, and Snohomish counties, where 70% of the population is white and 30% are people of color, the Construction
Seattle PCS Construction Industry March 2014 Page 10 Labor Market Assessment

workforce is less diverse4. See Appendix A, Exhibit 16 for racial composition of the three-county area.
Exhibit 10. Composition of Workforce by Workplace Geography in Construction Occupations by Race: Workplace in King, Pierce, and
Snohomish Counties, 2012
Source: US Census Bureau EEO Tabulation 2006-2010 by Workplace Geography, 2013, Community Attributes, 2014. ‘Other’ includes Hispanic, Pacific Islander, More than one Race, and all others not listed.
Exhibit 11. Composition of Workforce by Workplace Geography in Construction Occupations by Race: Workplace in City of Seattle, 2012
Sources: US Census Bureau American Community Survey, 2013; Puget Sound Regional Council, 2014; Community Attributes, 2014. ‘Other’ includes Hispanic, Pacific Islander, More than one Race, and all others not listed.
4 Source: U.S. Census Bureau, ACS 5-year estimates, 2012.
20% People of Color
26% People of Color
Seattle PCS Construction Industry March 2014 Page 11 Labor Market Assessment

Exhibit 12. Composition of Workforce by Workplace Geography in Construction Occupations by Gender: Workplace in King, Pierce, and
Snohomish Counties, 2012
Source: US Census Bureau EEO Tabulation 2006-2010 by Workplace Geography, 2013.
Exhibit 12 displays the Construction workforce by sex in King, Pierce, and Snohomish counties; 96% of the workforce is male. The Supply Model section of this report contains a further breakdown of gender and race for each source of new entrants into the workforce. Exhibit 13 displays the top ten Construction occupations in which women are employed for King, Pierce, and Snohomish counties in 2010. These occupations span from management and supervisory roles, such as Construction managers, to the trades which are typically more male-dominated, like carpenters and electricians.
Exhibit 13. Top Ten Construction Occupations for Women by Workplace Geography: King, Pierce, and Snohomish Counties, 2010
Source: US Census Bureau EEO Tabulation 2006-2010 by Workplace Geography, 2013.
OccupationTotal Women in Occupation
Construction managers 1,110 Construction laborers 710 First-line supervisors of construction trades and extraction workers 510 Painters, construction and maintenance 380 Carpenters 375 Electricians 355 Construction equipment operators except paving, surfacing, and tamping equipment operators 220 Construction and building inspectors 200 Pipelayers, plumbers, pipefitters, and steamfitters 135 Sheet metal workers 120
Women
Men
Seattle PCS Construction Industry March 2014 Page 12 Labor Market Assessment

The construction sector workforce is aging. Between 2000 and 2012, the share of construction workers in King County between the ages of 55 to 64 nearly doubled, increasing from 6% to 13% (Exhibit 14). The share of workers between the ages 25 and 34 fell from 28% in 2000 to 26% of total construction employment, in 2012. Going further back in time, this age group’s share of construction employment has declined from a high of more than two thirds of all workers in the early 1990s. Based on historic trends, by 2019 this share of construction employment will fall to 20% of all workers, while workers between 55 and 64 will increase to 14.1% within King County (Exhibit 15).
Exhibit 14. Distribution of King County Construction Workforce by Age Group, 2000-2012
Sources: Washington State Employment Security Department, 2013; Community Attributes, 2014.
Above Age 64
Ages 55-64
Ages 45-54
Ages 35-44
Ages 25-34
Under Age 25
Seattle PCS Construction Industry March 2014 Page 13 Labor Market Assessment

Exhibit 15. Historic and Predicted (Trend Line) Growth in Shares of Construction Workforce by Select Age Groups, 1992-2019
Sources: Washington State Employment Security Department, 2013; Community Attributes, 2014.
Ages 55-64
Ages 35-44
Ages 45-54 Historic Estimated (2013) and
Trend Line Growth
Seattle PCS Construction Industry March 2014 Page 14 Labor Market Assessment

Workforce Training Avenues The Workforce Training Avenues section of this report establishes context for the subsequent supply model to better understand the career pathways for new workers entering the workforce in Construction, as well as ways in which existing workers can change careers. This section clarifies pathways into the Construction workforce; distinguishes those occupations within the sector which require less or more training; outlines the union role in the Construction workforce; and gives an overview of selected registered apprenticeships in Construction.
Exhibit 16 displays potential pathways into the Construction workforce, from apprenticeships registered by Washington’s Department of Labor and Industries, to on the job training, to educational programs (many of which apply credit for apprenticeship completion towards an Associate Degree) in Construction trades. Non-registered apprenticeships are not regulated by the State of Washington Labor and Industries, and the awarding source of their credential varies.
Exhibit 16. Construction Workforce Pipeline
Source: Community Attributes, 2014.
Seattle PCS Construction Industry March 2014 Page 15 Labor Market Assessment

Exhibit 17 is a schematic of the Construction workforce and the role unions and trade associations play in representing and providing workers for the industry. According to Washington’s Department of Labor and Industries, apprenticeship is “a combination of on-the-job training (OJT) & related classroom instruction under the supervision of a journey-level craft person or trade professional in which workers learn the practical & theoretical aspects of a highly skilled occupation”. After completing an apprenticeship program, the worker's journey-level status provides an additional benefit of nationwide mobility at journey level scale. Apprenticeships are paid until journey-level status is achieved.
Exhibit 17. Construction Workforce and Representatives of the Construction Workforce
Source: Community Attributes, 2014.
Seattle PCS Construction Industry March 2014 Page 16 Labor Market Assessment

Exhibit 18 displays an overview of selected registered apprenticeships including the sponsors of the apprenticeships, the occupations trained for, and the term of the apprenticeship. Most registered apprenticeships are sponsored by multiple agencies, such as unions in conjunction with public and private employers. Excluding statewide programs which cover all counties, King County has 23 registered apprenticeship programs in Construction trades; Snohomish County has 22; Pierce County has 23.
Exhibit 18. Overview of Selected Registered Apprenticeship Programs; King, Pierce, and Snohomish Counties
Source: Washington Department of Labor & Industries, 2013.
Apprenticeship Occupations Trained TermSeattle Area Plumbers, Housing Plumbers, Pipefitters, HVAC/Refrigeration
Housing Plumber; HVAC/Refrigeration Mechanic; Maintenance Plumber/Steamfitter; Marine Pipefitter; Pipefitter; Plumber; Residential Service Mechanic
6,000-10,000 hours
Western Washington Sheet Metal Joint Apprenticeship Training Committee (JATC)
HVAC Service Technician; HVAC Test, Adjust and Balance Technician; Marine Sheet Metal Worker; Sheet Metal Worker
4,000-9,000 hours
Washington State UBC Joint Apprenticeship Training Committee (JATC)
Acoustical Applicator; Boat Builder; Bridge Carpenter; Cabinet Maker; Carpenter; Carpenter, Piledriver; Carpenter, Scaffold Erector; Dock and Wharf Builder; Drywall Finisher; Insulation Applicator; Millwright; Lather, 2,600-8,000 hours
INC/Associated General Contractors Heavy Equipment Operators; Carpenters Apprenticeship 6,000-8,000 hours
Western Washington Masonry Trades Apprenticeship Committee
Tilesetter; Brick and Block Finisher; Bricklayer; Marble Setter; Pointer, Cleaner and Caulker; Terrazzo Worker; Tile, Terrazzo and Marble Finisher
Inland Empire Roofers & Employers Roofer 4,200 hours
Seattle PCS Construction Industry March 2014 Page 17 Labor Market Assessment

Exhibit 19 presents an overview of selected occupations in the core Construction industry, grouped by level of training. Most occupations require moderate on-the-job training. Construction Managers are the only occupation in our analysis which require a Bachelor’s Degree or higher as educational training. High skill occupations include carpenters, brick and stone masons, and plumbers. The Bureau of Labor Statistics defines moderate-term-on-the-job training as training that takes more than one month and up to 12 months; they define long-term-on-the-job training as training that takes more than 12 months.
Exhibit 19. Level of Training Required for Construction Occupations
Source: US Bureau of Labor Statistics, 2013.
Work experience in a related occupation Moderate-term on-the-job training Long-term on-the-job trainingFirst-Line Supervisors of Construction Trades Carpet Installers BoilermakersConstruction and Building Inspectors
Floor Layers, Except Carpet, Wood, and Hard Tiles Brickmasons and BlockmasonsFloor Sanders and Finishers StonemasonsCement Masons and Concrete Finishers CarpentersConstruction Laborers Tile and Marble Setters Operators Terrazzo Workers and FinishersPile-Driver Operators ElectriciansOperating Engineers and Other Construction Equipment Operators GlaziersDrywall and Ceiling Tile Installers Plumbers, Pipefitters, and SteamfittersTapers Plasterers and Stucco MasonsPainters, Construction and Maintenance Reinforcing Iron and Rebar WorkersPaperhangers Structural Iron and Steel WorkersPipelayers Elevator Installers and RepairersRoofersSheet Metal WorkersFence ErectorsHazardous Materials Removal WorkersHighway Maintenance Workers CleanersSegmental Pavers
Seattle PCS Construction Industry March 2014 Page 18 Labor Market Assessment

SUPPLY AND DEMAND FOR CONSTRUCTION WORKERS Forecasted Demand
Jobs forecasts for construction represent the realized intersection of supply and theoretical demand for Construction workers. In the case of Construction, demand reflects broader growth of the regional economy; the need for buildings and other physical capital investments; and builders’ ability and willingness to implement construction projects. Demand for Construction comes primarily from three sectors of the regional economy:
1. Commercial and industrial growth and need for space and facilities; 2. Public sector capital investments, for example, new regional investments
by school districts, cities, and state and federal agencies; and 3. Household demand for new housing stock.
These three sources of demand are not mutually exclusive—private sector demand for housing can reflect an increase in commercial jobs as the economy grows. Likewise, increases in the regional population create added pressure on the existing housing inventory and infrastructure, eventually resulting in new investments in both. Each type of investment has a varying distribution of subcontractors by subsector and activity (e.g., engineering firms, wholesalers, builders) with implications for required employment.
In this analysis, demand for Construction jobs is derived primarily from the Puget Sound Regional Council’s (PSRC) long-term regional forecast. Exhibit 20 is the observed and projected growth in the construction and resources sector as forecasted by PSRC.
Seattle PCS Construction Industry March 2014 Page 19 Labor Market Assessment

In 2012, there were an estimated 93,200 total construction jobs across the counties of King, Pierce, and Snohomish, of which roughly 78% were covered jobs.5 In 2013, total construction jobs across the three-county region are estimated to have increased to 95,400, including 74,200 covered jobs.
Exhibit 20. Observed and Projected Growth in Total Employment in King, Pierce and Snohomish Counties, 2000-2040
Source: Puget Sound Regional Council, 2013.
5 See Glossary for definition of covered work.
Seattle PCS Construction Industry March 2014 Page 20 Labor Market Assessment

To estimate future total employment in the Construction sector, PSRC’s compound annual growth rate (CAGR) for years 2013 to 2019 for the construction and resources sector is applied to a base year of 2013. Projections of construction employment broken out by covered and self-employed workers are presented in Exhibit 21. The long-term employment forecast for the region reflects jobs by place of business location.
In the Construction industry, where workers move from site to site, jobs based in the three-county region can include projects done in other parts of Washington or elsewhere. Similarly, construction projects in the three-county region can be completed by businesses located outside the region—these workers, belonging to an outside firm, would thus not be included in these forecast totals. This may be more acute in areas along the fringe of the delimited three-county region, like construction firms from Skagit County that complete work in Snohomish County. Nevertheless, long-term estimates provide important insight into Construction demand and the extent to which the local supply of qualified and available workers can compete for these jobs.
Exhibit 21. Construction Employment by Classification, 2012-2019, King, Pierce and Snohomish Counties
Sources: Puget Sound Regional Council, 2014; Community Attributes, 2014.
Covered Employment
Self-employed
Seattle PCS Construction Industry March 2014 Page 21 Labor Market Assessment

Conway Pedersen provides independent economic forecasts for the Puget Sound Region. Exhibit 22 presents historic Construction employment and compares the Conway Pederson with the PSRC forecast. By 2019, employment in Construction is estimated to reach 110,500 workers. Construction employment in neither the PSRC nor Conway Pedersen forecasts is projected to come close to a recent peak of more than 141,000 workers as late as 2008 during the crest of the real estate bubble in the region.
Exhibit 22. Construction Employment across King, Pierce and Snohomish Counties, 2000-2019
Sources: Puget Sound Regional Council, 2013; Conway Pedersen Economics, 2014; Community Attributes, 2014.
Demand by Type of Investment and Source This portion of the analysis divides the forecasts of Construction activity into sources of demand, primarily distinguishing demand from private investment from demand for municipal and public sector capital projects, such as those projects in the City of Seattle Capital Improvement Plan.
The PSRC long-term economic forecast drives estimates of Construction employment in this analysis and represents employment required to fulfill Construction demand.6 The analysis in this study disaggregates Construction jobs forecasts into jobs supporting public and private development to understand and to compare public sector demand with City of Seattle CIP demand.
6 The jobs forecasts exclude undocumented labor hours and the informal labor market; provided that share of Construction labor remains consistent over time, the jobs forecast should reflect changes in Construction activity.
Historic
Seattle PCS Construction Industry March 2014 Page 22 Labor Market Assessment

Private Sector Construction Demand Regional growth in population and employment generally drives private sector demand for Construction, which will hire construction workers otherwise suited for public works construction projects. Between 2014 and 2019 the number of households across King, Pierce and Snohomish counties is forecast to grow 1.2% per year. This growth is expected to translate in 0.9% annual growth in single-family households per year and 1.3% for multifamily households. To accommodate this growth, an estimated 106,900 new housing units will be built across the three-county region, which means that more than 145 million square feet of new construction space will be required (Exhibit 23).
Growth in commercial, industrial, and retail space is another important driver of construction demand. More than 53 million square feet of new construction are forecast to be built over the 2014-2019 period. For example, between 2015 and 2017, approximately 380,000 square feet of new retail and office space will be built for Amazon in downtown Seattle. Other major sources of commercial demand for construction include the Spring District in Bellevue and the Overlake developments in Redmond.
Exhibit 23. Forecast New Residential Construction, King, Pierce, and Snohomish Counties, 2013-2019
Sources: Puget Sound Regional Council, 2013; RS Means, 2013; CoStar, 2013; CBRE, 2013, Community Attributes, 2014.
Single Family Units
Multi-Family Units
Seattle PCS Construction Industry March 2014 Page 23 Labor Market Assessment
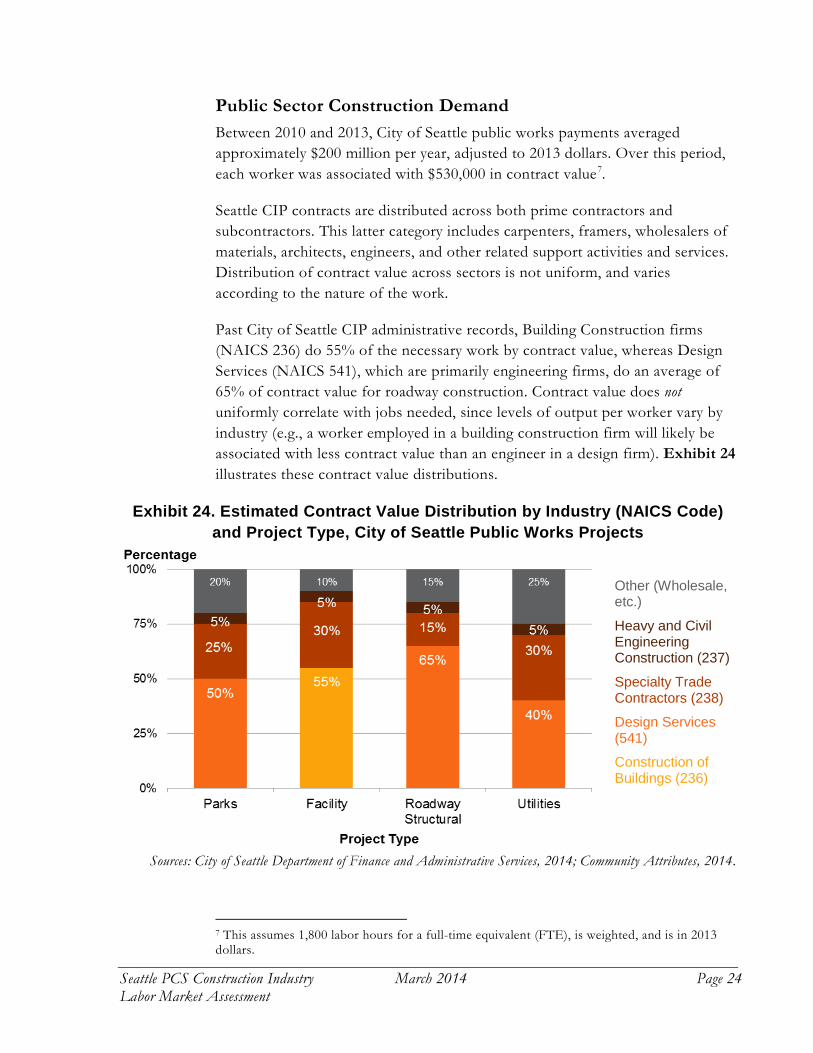
Public Sector Construction Demand Between 2010 and 2013, City of Seattle public works payments averaged approximately $200 million per year, adjusted to 2013 dollars. Over this period, each worker was associated with $530,000 in contract value7.
Seattle CIP contracts are distributed across both prime contractors and subcontractors. This latter category includes carpenters, framers, wholesalers of materials, architects, engineers, and other related support activities and services. Distribution of contract value across sectors is not uniform, and varies according to the nature of the work.
Past City of Seattle CIP administrative records, Building Construction firms (NAICS 236) do 55% of the necessary work by contract value, whereas Design Services (NAICS 541), which are primarily engineering firms, do an average of 65% of contract value for roadway construction. Contract value does not uniformly correlate with jobs needed, since levels of output per worker vary by industry (e.g., a worker employed in a building construction firm will likely be associated with less contract value than an engineer in a design firm). Exhibit 24 illustrates these contract value distributions.
Exhibit 24. Estimated Contract Value Distribution by Industry (NAICS Code) and Project Type, City of Seattle Public Works Projects
Sources: City of Seattle Department of Finance and Administrative Services, 2014; Community Attributes, 2014.
7 This assumes 1,800 labor hours for a full-time equivalent (FTE), is weighted, and is in 2013 dollars.
Other (Wholesale, etc.)
Heavy and Civil Engineering Construction (237)
Specialty Trade Contractors (238)
Design Services (541)
Construction of Buildings (236)
Seattle PCS Construction Industry March 2014 Page 24 Labor Market Assessment

The types of projects included in a CIP shape the amount of employment demand. Projects with greater ratios of output (revenues)-to-worker will require fewer employees for each $1 million of city investments. For example, statewide between 2009 and 2012 the average job in Heavy and Civil Engineering Construction was associated with $251,000 in business revenues, compared with an average of $157,600 among Specialty Trade Contractors. For any given project, the greater share of the contract going to Specialty Trade Contractors compared with Heavy and Civil Engineering Construction, the more actual FTEs would be needed to complete the project; alternatively, for the same size of contract (by dollar value), if a larger share is awarded to Heavy and Civil Engineering Construction firms, the less FTEs will be associated with the project.
Based on Capital Improvement Plans through 2019 for the City of Seattle, parks have the smallest share by contract value, whereas utilities and roadway construction represent the largest shares by dollar value. These totals translate into the largest sources of CIP employment demand through 2019. Exhibit 25 presents these employment estimated demand breakouts for forecast CIP spending.
Exhibit 25. Estimated Employment Demand Distribution for City of Seattle Public Works Projects, 2014-2019
Sources: City of Seattle Department of Finance and Administrative Services; Washington State Department of Revenue; Washington State Employment Security Department; U.S. Bureau of Economic Analysis; Community Attributes, 2014.
In 2012, City of Seattle public works contracts supported an estimated 322 Full-time Equivalents (FTE), including workers from both prime contractors and subcontractors. Federal, state, and county public works expenditures support
Parks
Utilities
Roadway Structural
Facilities
Seattle PCS Construction Industry March 2014 Page 25 Labor Market Assessment

many more jobs, including many large, multi-year infrastructure projects. Assuming the City of Seattle spends an average of $200 million per year (2013 dollars) on public works projects between 2014 and 2019, this spending would support 400 FTEs per year, based on 1,800 labor hours per year. Disaggregated components of construction demand are presented in Exhibit 26 below.
Exhibit 26. Construction Employment by Source of Demand, Historic and Forecast
Source of Employment Demand 2013 2014 2015 2016 2017 2018 2019 Public Works 13,200 13,400 13,700 14,000 14,300 14,600 14,900
State & County 8,500 8,700 8,800 9,000 9,200 9,400 9,600 Cities 1,300 1,300 1,300 1,400 1,400 1,400 1,500
Seattle 400 400 400 400 400 400 400 All other jurisdictions* 900 900 900 900 900 900 900
Federal 3,400 3,500 3,500 3,600 3,700 3,800 3,900 Employment from Private Sector Development** 82,200 84,400 86,500 88,700 90,900 93,200 95,600 Total Construction Employment 95,400 97,800 100,200 102,700 105,200 107,800 110,500
City of Seattle share of regional Public Works Employment Demand 3.0% 3.0% 2.9% 2.9% 2.8% 2.7% 2.7%
Sources: City of Seattle Department of Finance and Administrative Services, 2014; Puget Sound Regional Council, 2013; RS Means, 2013; CoStar, 2013; CBRE, 2013, Community Attributes, 2014.
*All other towns and cities in King, Pierce, and Snohomish counties. **Private Sector Development includes the construction of space associated with employment in Manufacturing/WTU, Retail/Food Services, FIRE/Services, Construction and Resources, as well as single-family and multifamily housing. Note: Estimated City of Seattle CIP-supported employment is rounded to the nearest 100th.
Seattle PCS Construction Industry March 2014 Page 26 Labor Market Assessment
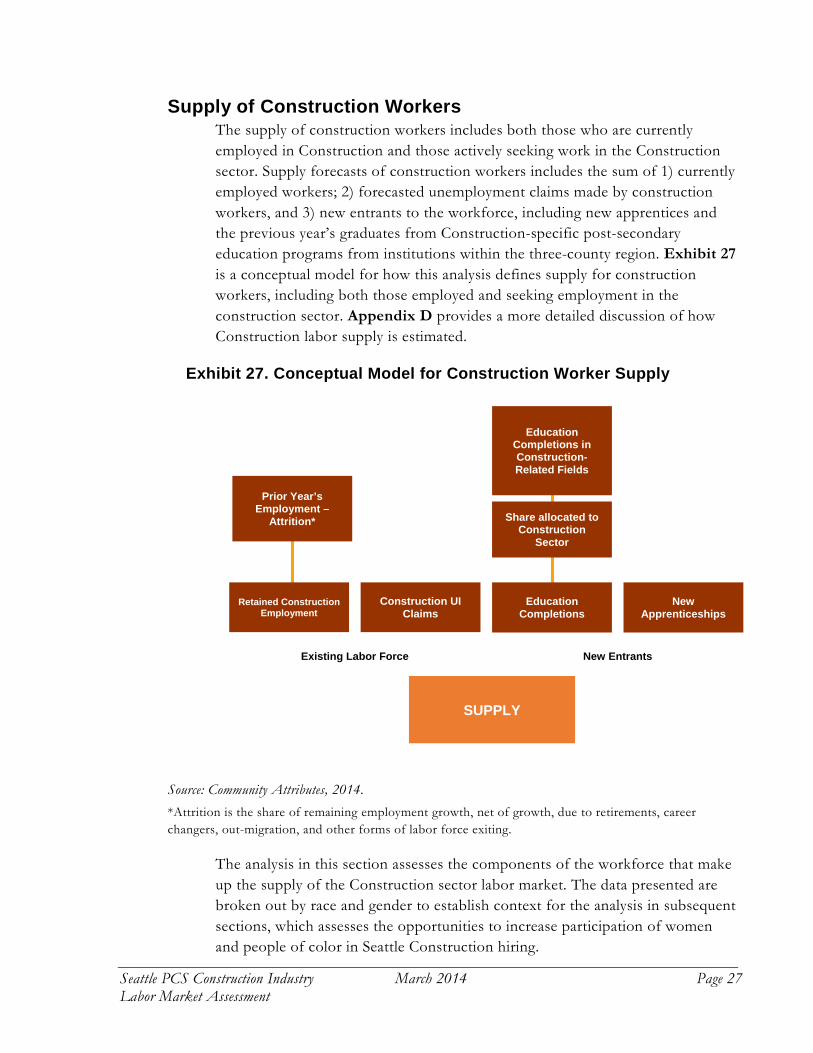
Supply of Construction Workers The supply of construction workers includes both those who are currently employed in Construction and those actively seeking work in the Construction sector. Supply forecasts of construction workers includes the sum of 1) currently employed workers; 2) forecasted unemployment claims made by construction workers, and 3) new entrants to the workforce, including new apprentices and the previous year’s graduates from Construction-specific post-secondary education programs from institutions within the three-county region. Exhibit 27 is a conceptual model for how this analysis defines supply for construction workers, including both those employed and seeking employment in the construction sector. Appendix D provides a more detailed discussion of how Construction labor supply is estimated.
Exhibit 27. Conceptual Model for Construction Worker Supply
Source: Community Attributes, 2014. *Attrition is the share of remaining employment growth, net of growth, due to retirements, career changers, out-migration, and other forms of labor force exiting.
The analysis in this section assesses the components of the workforce that make up the supply of the Construction sector labor market. The data presented are broken out by race and gender to establish context for the analysis in subsequent sections, which assesses the opportunities to increase participation of women and people of color in Seattle Construction hiring.
SUPPLY
Retained Construction Employment
Construction UI Claims
Share allocated to Construction
Sector
Education Completions
New Apprenticeships
Prior Year’s Employment –
Attrition*
Education Completions in Construction-Related Fields
Existing Labor Force New Entrants
Seattle PCS Construction Industry March 2014 Page 27 Labor Market Assessment

Existing Construction Workforce This analysis utilizes the Washington State Employment Security Department’s (ESD) annual occupational employment forecast for the first supply source, which is treated as the carry-over, or “retained” workforce. This segment of the workforce represents those workers who were employed in the prior year and remained employed in construction in the current year, net of employment exits such as retirements, career changes, and out-migration.
Unemployment Claimants Unemployment insurance (UI) claimants per year are estimated based on the historic, statistical relationship between regional unemployment and Construction-specific UI claims, divided by construction employment. This correlation is then applied to a forecast of annual regional unemployment to estimate future construction unemployment insurance claims8. Estimates are then added to supply totals. In 2013 the regional unemployment rate was 5.9%, and within the three-county region, the average number of UI claims made by construction workers summed to 9,000 (Exhibit 28).9
Exhibit 28. Historic and Forecast Construction Sector Unemployment Claims
Sources: Puget Sound Regional Council, 2013; Conway Pedersen Economics, 2014; Washington State Employment Security Department, 2014; Community Attributes, 2014.
8 Conway Pedersen Economics is the source for the unemployment rate forecasts. 9 UI claims are reported monthly and by the categories “initial,” “continued,” “exhausted,” and “first payments.” To estimate annual claims for construction workers (those who previously worked in construction before losing employment), first payments are subtracted from the sum of initial and continued claims (to avoid double-counting) by month and then averaged over the 12-month period.
UI Claims, Historic UI Claims, Forecast
Seattle PCS Construction Industry March 2014 Page 28 Labor Market Assessment

Unemployment claims in construction largely comprise non-management positions, as seen in Exhibit 29. Construction Laborers, Carpenters, and Electricians are the top three occupations in construction that are unemployed in the three-counties. A claimant can receive state unemployment benefits for up to 26 weeks, so these data do not reflect the long-term unemployed in construction.
Exhibit 29. Top 10 Construction Occupations in Continued Unemployment Claims, King, Pierce and Snohomish Counties, December 2013
Source: ESD, 2013.
Racial composition of unemployment claims for Construction trades mirrors that of the greater tri-county workforce in Construction occupations, displayed in Exhibit 30. As of December 2013, 23% of the unemployment claims in Construction are from people of color, compared with 20% people of color in the overall construction workforce. Exhibit A16 in Appendix A shows racial composition of the general population of the three-county area for reference, where 70% of the population is white, and 30% are people of color. Additionally, Exhibit 42 in the Supply Summary compiles all racial profiles of all populations in this analysis for ease of comparison.
Seattle PCS Construction Industry March 2014 Page 29 Labor Market Assessment

Exhibit 30. Racial Composition of Unemployment Claimants, King, Pierce and Snohomish Counties, December 2013
Source: ESD, 2013. ‘Other’ includes Hispanic, Pacific Islander, More than one Race, and all others not listed.
Educational Completions In order to assess the implications of current-state talent production on future supply, 2012 post-secondary completions in construction curriculum programs are used as a constant throughout the forecast years. Completers allocated to the construction industry are done so by way of the share of each associated completion occupation in the construction industry; Appendix D provides further explanation of these calculations.
Most workers in construction trades who graduate from accredited educational institutions are in management and supervisory roles (Exhibit 31). The analysis that follows assesses the construction employment demand and supply across the entire construction workforce and focuses on positions requiring less than a baccalaureate degree.
23% People of Color
Seattle PCS Construction Industry March 2014 Page 30 Labor Market Assessment
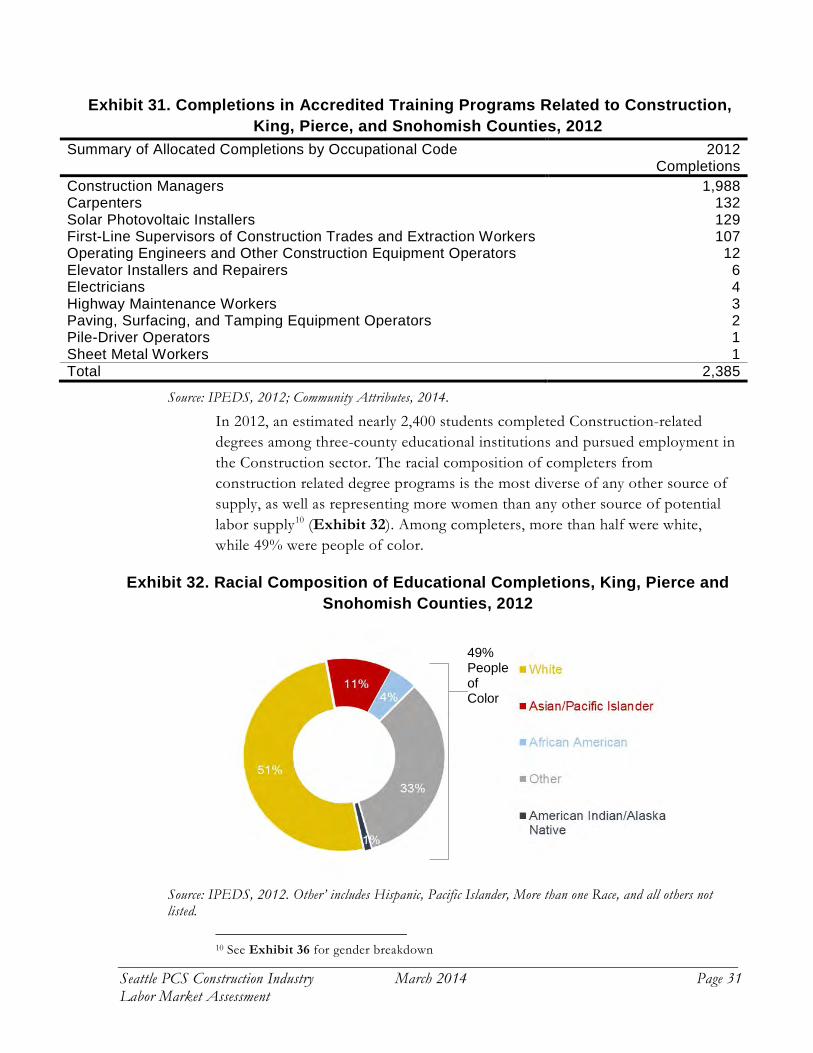
Exhibit 31. Completions in Accredited Training Programs Related to Construction, King, Pierce, and Snohomish Counties, 2012
Summary of Allocated Completions by Occupational Code 2012 Completions
Construction Managers 1,988 Carpenters 132 Solar Photovoltaic Installers 129 First-Line Supervisors of Construction Trades and Extraction Workers 107 Operating Engineers and Other Construction Equipment Operators 12 Elevator Installers and Repairers 6 Electricians 4 Highway Maintenance Workers 3 Paving, Surfacing, and Tamping Equipment Operators 2 Pile-Driver Operators 1 Sheet Metal Workers 1 Total 2,385
Source: IPEDS, 2012; Community Attributes, 2014.
In 2012, an estimated nearly 2,400 students completed Construction-related degrees among three-county educational institutions and pursued employment in the Construction sector. The racial composition of completers from construction related degree programs is the most diverse of any other source of supply, as well as representing more women than any other source of potential labor supply10 (Exhibit 32). Among completers, more than half were white, while 49% were people of color.
Exhibit 32. Racial Composition of Educational Completions, King, Pierce and Snohomish Counties, 2012
Source: IPEDS, 2012. Other’ includes Hispanic, Pacific Islander, More than one Race, and all others not listed.
10 See Exhibit 36 for gender breakdown
49% People of Color
Seattle PCS Construction Industry March 2014 Page 31 Labor Market Assessment

Apprenticeships Workers completing apprenticeships in the construction industry must finish their program in order to attain journey-level status, but many do not. Instead, some cancel out, transfer to another program, or suspend the program entirely. Apprenticeship completions represent the workforce immediately available to work in construction, and the first three exhibits of the Apprenticeship section analyzes only those who complete apprenticeship programs. Because the City is also interested in understanding the barriers of hiring people of color and women face in construction work, the latter portion of this section quantifies how much of this population cancels, transfers, and suspends apprenticeship programs, relative to white males.
Apprenticeship Completions The supply of workforce from apprenticeship completions has totaled around 750 completions each year for the core occupations in Construction (Exhibit 33). However, because completions data are updated continuously for the following year, the total number of completions for 2013 can be considered incomplete.
Exhibit 33. Registered Apprenticeship Completions in Construction Occupations, King, Pierce and Snohomish Counties, 2009 to 2013
Source: Washington Department of Labor and Industries, 2013.
Seattle PCS Construction Industry March 2014 Page 32 Labor Market Assessment

Exhibit 34 shows apprenticeship completions by occupation for King, Pierce, and Snohomish Counties, from 2009 to 2013. Electricians comprise the largest number of completions over the time period, with Carpenters second, and Laborers third. Electricians, Plumbers, Pipefitters, and Steamfitters, and Sheet Metal Workers are occupations in which the completion counts have generally increased over this period; Carpenter and Construction Laborer completion counts have generally decreased over this period.
Exhibit 34. Apprenticeship Completion Count in Construction Trades by Occupation, King, Pierce, and Snohomish Counties, 2009-2013
Source: Washington Department of Labor & Industries, 2013.
SOC Code Occupation 2009 2010 2011 2012 2013 Total47-2132 Insulation Workers, Mechanical 1 1 47-2022 Stonemasons 1 1 2 47-3013 Helpers--Electricians 8 8 47-2044 Tile and Marble Setters 3 1 3 2 9
47-3011
Helpers--Brickmasons, Blockmasons, Stonemasons, and Tile and Marble Setters 2 4 1 3 10
47-2161 Plasterers and Stucco Masons 3 4 3 1 11
47-4099Construction and Related Workers, All Other 2 5 5 1 13
47-2151 Pipelayers 10 6 16 47-2041 Carpet Installers 3 2 8 4 17 47-2011 Boilermakers 2 7 7 10 1 27 47-2021 Brickmasons and Blockmasons 12 5 6 5 6 34 47-2082 Tapers 17 11 7 2 37
47-2131Insulation Workers, Floor, Ceiling, and Wall 16 10 7 5 2 40
47-2181 Roofers 9 11 16 13 12 61
47-2051Cement Masons and Concrete Finishers 26 18 3 15 7 69
47-2141Painters, Construction and Maintenance 31 14 18 7 6 76
47-2073
Operating Engineers and Other Construction Equipment Operators 25 15 19 18 8 85
47-2121 Glaziers 25 13 18 27 12 95 47-4021 Elevator Installers and Repairers 38 37 7 14 15 111 47-2081 Drywall and Ceiling Tile Installers 72 55 51 31 16 225 47-2211 Sheet Metal Workers 37 46 42 60 48 233 47-2221
Workers 59 42 46 77 30 254
47-2152Plumbers, Pipefitters, and Steamfitters 56 42 63 69 63 293
47-2061 Construction Laborers 101 96 78 82 48 405 47-2031 Carpenters 148 166 158 114 42 628 47-2111 Electricians 136 121 171 173 187 788 Total 829 729 741 740 509 3,548
Seattle PCS Construction Industry March 2014 Page 33 Labor Market Assessment

Exhibit 35. Racial Composition of Apprenticeship Completers in Construction Occupations, King, Pierce and Snohomish Counties, 2012
Source: Washington Department of Labor and Industries, 2013; Community Attributes, 2014. ‘Other’ includes Hispanic, Pacific Islander, More than one Race, and all others not listed.
Exhibit 35 maps the racial composition of apprenticeship completers in core Construction occupations in 2012. Compared with the racial composition of those completing educational programs which are suitable for Construction, those completing apprenticeships in the Construction workforce are less diverse (27% people of color, compared with 49% people of color in educational completions).
27% People of Color
Seattle PCS Construction Industry March 2014 Page 34 Labor Market Assessment

Apprenticeship Cancellations, Transfers, and Suspensions Fewer people of color and women complete apprenticeship programs related to construction, and more cancel out of their apprenticeship programs. The subsequent exhibits examine this by sex and by race.
Exhibit 36. Construction Apprenticeship Status by Sex: King, Pierce and Snohomish Counties, 2009-2013
Source: Washington Department of Labor and Industries, 2013; Community Attributes, 2014.
Exhibit 36 is a count of all construction apprenticeships by sex and status of apprenticeship between 2009 and 2013. The subsequent Supply Summary shows the composition of males and females who completed their apprenticeships between 2009 and 2013.
Seattle PCS Construction Industry March 2014 Page 35 Labor Market Assessment

Exhibit 37 is a deeper analysis into status of apprenticeship (not simply looking at completions) showing that in the three-counties from 2009-2013, fewer women attained journey-level status when compared to men. Among construction apprenticeships, females cancelled, transferred, or suspended their construction apprenticeship programs more than males. Females also completed their apprenticeship programs at lower rates than did males.
Exhibit 37. Construction Apprenticeship Status by Race: King, Pierce and Snohomish Counties, 2009-2013
Source: Washington Department of Labor and Industries, 2013; Community Attributes, 2014.
Seattle PCS Construction Industry March 2014 Page 36 Labor Market Assessment

Exhibit 38 disaggregates the percentage of completions, cancellations, transfers, and suspensions by race in construction apprenticeships between 2009 and 2013 for the three-county area. African Americans and Hispanics had the highest percentage of cancellations, as well as the lowest percentage of completions.
Exhibit 38. Construction Apprenticeship Status by Disaggregated Race: King, Pierce and Snohomish Counties, 2009-2013
Source: Washington Department of Labor and Industries, 2013; Community Attributes, 2014.
WhiteAfrican American Hispanic
Native American
More than one Race
Not Classified
Not Specified
Pacific Islander Asian
Completed 49% 31% 33% 35% 36% 39% 48% 39% 50%Cancelled 46% 65% 64% 59% 61% 48% 45% 54% 46%Transfer 3% 3% 3% 4% 1% 12% 6% 4% 2%Suspended 2% 2% 1% 2% 2% 0% 0% 3% 1%Total 100% 100% 100% 100% 100% 100% 100% 100% 100%
Seattle PCS Construction Industry March 2014 Page 37 Labor Market Assessment

Supply Summary Exhibit 39 combines the three components of Construction workforce supply for King, Pierce, and Snohomish counties. Unemployment Claims comprise over 70% of potential Construction workforce, though claims are highly seasonal. Educational completions account for nearly a quarter of potential supply, and apprenticeship completions account for a relatively small portion of potential supply (about 7%).
Exhibit 39. Potential Composition of Annual Entrants to the Construction Workforce
Sources: Washington Department of Labor and Industries, 2013; IPEDS, 2013; Washington State ESD, 2013; Community Attributes, 2014.
Seattle PCS Construction Industry March 2014 Page 38 Labor Market Assessment
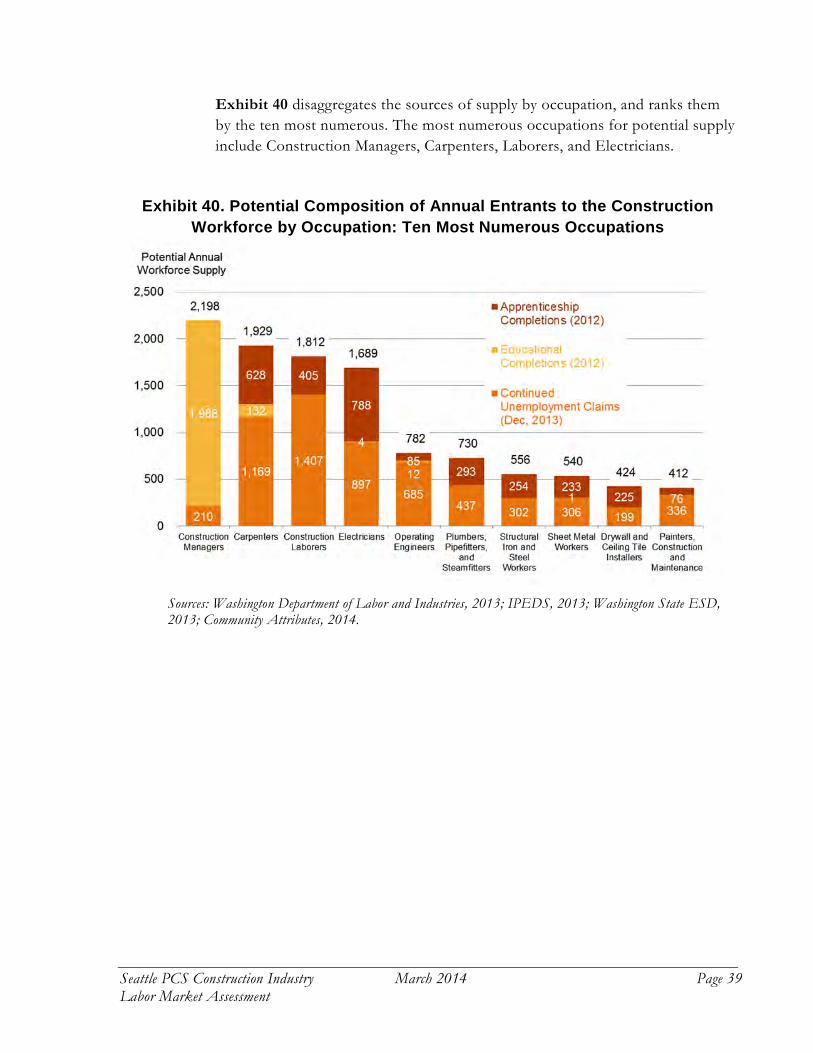
Exhibit 40 disaggregates the sources of supply by occupation, and ranks them by the ten most numerous. The most numerous occupations for potential supply include Construction Managers, Carpenters, Laborers, and Electricians.
Exhibit 40. Potential Composition of Annual Entrants to the Construction Workforce by Occupation: Ten Most Numerous Occupations
Sources: Washington Department of Labor and Industries, 2013; IPEDS, 2013; Washington State ESD, 2013; Community Attributes, 2014.
Seattle PCS Construction Industry March 2014 Page 39 Labor Market Assessment

Exhibit 41. Summary of all Racial Profiles in this Analysis by Population and Geography
Source: Community Attributes, 2014. ‘Other’ includes Hispanic, Pacific Islander, More than one Race, and all others not listed.
Exhibit 41 summarizes all racial composition reported in this report by population and geography for ease of comparison, including the general population in the three-county area and the City of Seattle, construction workers in the three-county area and the City of Seattle, and the three sources of added supply to the Construction Industry.
Population Geography White
Asian/ Pacific Islander
African American Other
American Indian/Alaska Native Source
General Population King, Pierce, Snohomish Counties 70% 11% 5% 13% 1%
U.S. Census Bureau, 2012 ACS 5-year estimates
General Population City of Seattle 70% 14% 8% 7% 1%U.S. Census Bureau, 2010 Decennial Census
Construction Workers
King, Pierce, Snohomish Counties 80% 5% 3% 11% 1%
2006-2010 by Workplace Geography, 2013
Construction Workers City of Seattle 74% 10% 5% 11% 1%
U.S. Census Bureau, 2012 ACS 5-year estimates
Construction UI Claimants
King, Pierce, Snohomish Counties 77% 3% 4% 14% 2% ESD, 2013
Educational Completions
King, Pierce, Snohomish Counties 51% 11% 4% 33% 1% IPEDS, 2012
Apprenticeship Completions
King, Pierce, Snohomish Counties 73% 5% 7% 13% 2%
Washington Department of Labor and Industries, 2013
Seattle PCS Construction Industry March 2014 Page 40 Labor Market Assessment
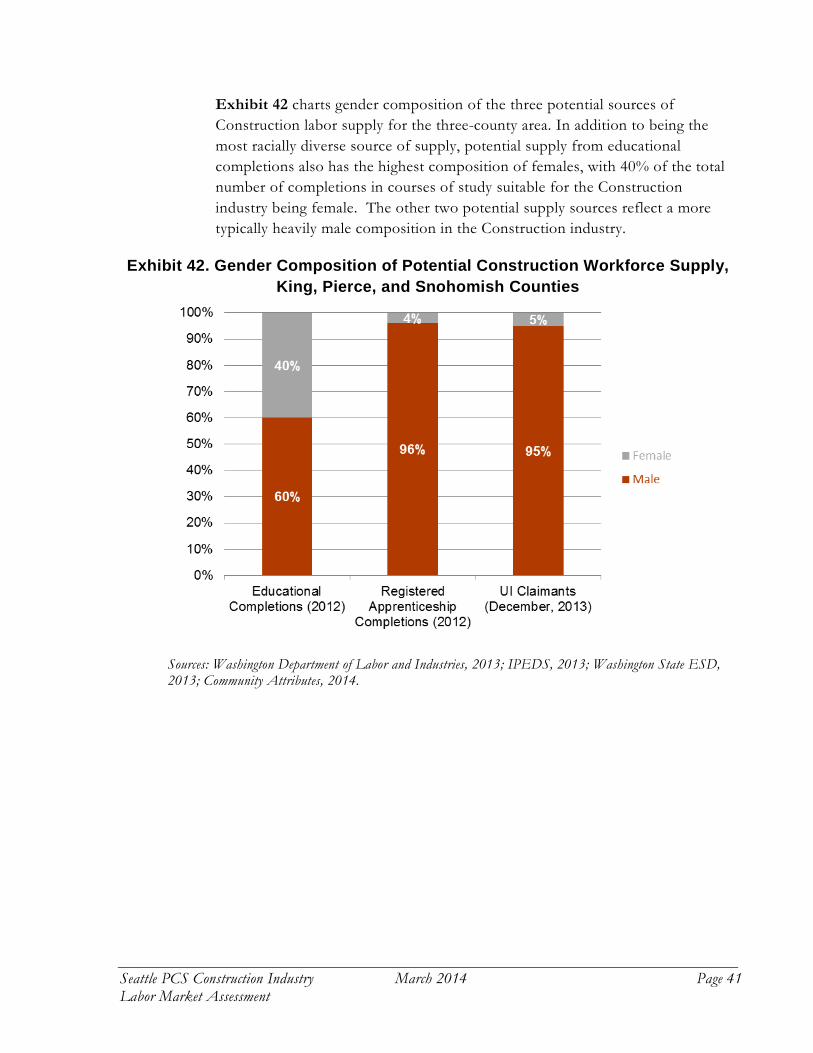
Exhibit 42 charts gender composition of the three potential sources of Construction labor supply for the three-county area. In addition to being the most racially diverse source of supply, potential supply from educational completions also has the highest composition of females, with 40% of the total number of completions in courses of study suitable for the Construction industry being female. The other two potential supply sources reflect a more typically heavily male composition in the Construction industry.
Exhibit 42. Gender Composition of Potential Construction Workforce Supply, King, Pierce, and Snohomish Counties
Sources: Washington Department of Labor and Industries, 2013; IPEDS, 2013; Washington State ESD, 2013; Community Attributes, 2014.
Seattle PCS Construction Industry March 2014 Page 41 Labor Market Assessment

Targeting Potential Workers In addition to the known supply of workers for the Construction industry, the City is also interested understanding and targeting the potential supply of workers who are qualified and motivated to work in Construction, but who are not engaged in any training pipeline. This section of the analysis explores this population, which is defined as those living in the City of Seattle who are people of color, who are living below 200% of the federal Poverty Line11, and who are between the working ages of 18 and 64 years old.
The City of Seattle has developed a list of distressed zip codes intended for targeted recruiting on the Seawall Replacement Project based on the above criteria. The 15 zip codes in Seattle (with several extending outside the city limits) are home to approximately 43% of all construction workers living within Seattle; among women and people of color who are employed in Construction, 57% of those living in Seattle reside in these zip codes. The largest estimated number of Construction workers who are women or people of color in 2014 live in Rainier Valley/Rainier Beach (zip code 98118, 8% of all targeted demographic Construction workers), Northgate (zip code 98125, 7%), and South Beacon Hill/South Park (zip code 98108, 6%). Exhibit 43 below presents the ten largest distressed zip codes by share of Seattle-based women and people of color employed in Construction in 2014 (estimated).
Exhibit 43. Ten Largest Distressed Zip Codes by Share of Total (Employed) Women and People of Color Construction Workers, 2014
Sources: U.S. Census Bureau American Community Survey, 2013; Puget Sound Regional Council, 2013; Community Attributes, 2014.
11 For a family of two, the 200% 2014 poverty line is $31,460.
Seattle PCS Construction Industry March 2014 Page 42 Labor Market Assessment

Exhibits 44 and 45 map these criteria for the City of Seattle by acre for 2012. While those living under the 200% federal poverty line are dispersed across the city, people of color are more concentrated in the southern portion of Seattle. Exhibit 46 combines both criteria into a single map of potential areas of targeted outreach. When combined, the map shows pockets of those who meet both criteria scattered across the city, as well as in South Seattle.
Exhibit 47 looks at the unemployed population in the city. Unemployment is another criterion for workers who are motivated to work in Construction. General unemployment is concentrated in Downtown Seattle. Exhibit 48 maps only unemployment claims in the Construction Industry for 2013. Magnolia (zip code 98199) and Rainier Valley/Columbia City (98118) have the highest concentration of construction unemployment claims in the city. Appendix E contains these analyses on a per capita basis.
Seattle PCS Construction Industry March 2014 Page 43 Labor Market Assessment

Seattle PCS Construction Industry March 2014 Page 44 Labor Market Assessment

Seattle PCS Construction Industry March 2014 Page 45 Labor Market Assessment

Seattle PCS Construction Industry March 2014 Page 46 Labor Market Assessment

Seattle PCS Construction Industry March 2014 Page 47 Labor Market Assessment

Seattle PCS Construction Industry March 2014 Page 48 Labor Market Assessment

In 2013, an estimated 193,500 residents of the City of Seattle population were people of color, of which 63,200 were of low income status. Within this group, roughly two thirds (40,400 individuals) were between the working ages of 18 to 64, equal to 6.4% of the total City of Seattle population in 2013.
Broken out by zip code, the largest number of individuals that meet the above criteria are estimated to be in zip code 98118 (Rainier Valley, with 4,600 individuals). The seven largest zip codes by number of individuals meeting these criteria are presented in Exhibit 49.
Exhibit 49. Targeted Recruitment Demographic Population Citywide and by Zip Codes, City of Seattle, 2013
People of Color
People of Color AND
Low Income
People of Color, Low Income, AND
Appropriate Age Share of
Total Pop
City-wide, 2013 193,500 63,200 40,400 6.4%
By Zip Code (Top 7 by Targeted Group) 98118 21,300 8,400 4,600 14.1%
98105 7,700 3,600 3,400 12.3% 98178 12,500 4,700 2,600 14.0% 98108 11,900 4,200 2,300 13.0% 98122 7,500 2,700 2,100 9.5% 98144 10,300 3,300 2,000 10.2% 98133 10,300 3,200 2,000 6.1%
Sources: American Community Survey, 2014; Community Attributes, 2014.
Seattle PCS Construction Industry March 2014 Page 49 Labor Market Assessment

GAP ANALYSIS Once supply and demand forecasts are derived, the two are compared each year to assess the relative surplus of deficit of regional workers needed to satisfy forecast construction employment. Two measures of the workforce are assessed:
• All construction employment, including workers in non-construction positions, such as administrative and accounting positions; and
• Only those workers in occupations deemed construction-specific, such as carpenters and framers.
In 2013, there were an estimated 95,400 construction jobs in the three-county region, compared with a total estimated workforce of 103,700 (Exhibit 50). The differences between the two—8,300 full-time equivalent (FTE) positions—was equal to 8.0% of total estimated labor supply, considered a labor surplus.12 Over time, the difference between demand for jobs and available workforce will converge as demand for jobs increases, though in 2019 jobs demand are expected to grow slightly less than overall construction supply.
Exhibit 50. Gap Analysis for Construction Supply and Demand
Segment of Labor Force Measure
2013 (est.) 2014 2015 2016 2017 2018 2019
Total Construction Employment
Demand 95,400 97,800 100,200 102,700 105,200 107,800 110,500 Supply 103,700 104,300 106,600 108,900 110,900 113,200 116,200 Difference 8,300 6,500 6,400 6,200 5,700 5,400 5,700 Surplus 8.0% 6.2% 6.0% 5.7% 5.1% 4.8% 4.9%
Construction Trades Only (non-baccalaureate)
Demand 67,600 69,500 71,600 73,600 75,500 77,400 79,300 Supply 74,600 74,900 76,800 78,700 80,200 82,000 84,200 Difference 7,000 5,400 5,200 5,100 4,700 4,600 4,900 Surplus 9.4% 7.2% 6.8% 6.5% 5.9% 5.6% 5.8%
Sources: Puget Sound Regional Council, 2013; Conway Pedersen Economics, 2014; IPEDs, 2014; Washington State Employment Security Department, 2014; Washington State Department of Labor & Industries, 2014; Community Attributes, 2014.
12 The surplus is not the same as an unemployment rate. The former measure, used in this analysis, counts all jobs as FTEs and compares FTEs utilized versus excess FTEs, and is thus different from the unemployment rate, which considers any work as employed. For reference, nationally in December 2013 the unemployment rate for construction and extraction workers was 12.1%. No similar measure at the county or state-level is made available.
Seattle PCS Construction Industry March 2014 Page 50 Labor Market Assessment

OPPORTUNITIES FOR DISCUSSION The hiring criteria set by the City of Seattle for Capital Improvement Program (CIP) projects can have implications for the pipeline of qualified workers to fill these positions. In 2013, an estimated 23% of the construction labor force were women and/or people of color. Among new entrants to the workforce, women and people of color composed 27% of apprenticeships and 34% of new completions from local two-year accredited educational institutions in construction-related programs.
A targeted hiring policy for the Capital Improvement Program would directly impact City construction employment positions. The City of Seattle is estimated to support the equivalent of 400 full time workers through CIP spending, but the City’s leadership in hiring will have broader impacts to the labor force through expanding apprenticeships to satisfy these criteria. For example, in 2014, if the City of Seattle were to establish hiring criteria requiring that 50% of workers on CIP projects come from the target demographics, then the City would hire an additional 106 target workers more than the baseline scenario across the entire construction workforce. In other words, if 400 workers were randomly selected for CIP work, 94 workers in this group would be expected to be either female and/or people of color, requiring another 106 workers of the same demographic background to satisfy a hiring criteria of 50%.
These 106 workers would need to come from either the existing labor force, or through apprenticeship programs via targeted recruiting or expansion of existing programs. In 2014, an estimated 509 workers will complete construction sector apprenticeships. In the baseline scenario, an estimated 27% of apprenticeships each year are either female and/or people of color. If all these apprentices are employed in businesses that participate in Seattle CIP projects, then there would be no need to recruit additional workers. However, this would imply that the pool of businesses participating in CIP projects is not representative of the entire construction labor force.
Forecasts of new apprentices vary from year to year. In 2017, new apprenticeships are expected grow to 895 positions. Assuming a 50% hiring criteria each year and a slight increase in the share of the target demographic in the overall labor supply, an additional 104 new female and/or non-white workers would be needed above the baseline, workforce-wide level. In this scenario, assuming all apprenticeship programs participate in City of Seattle CIP projects, either: 1) the recruitment of target workers into apprenticeship programs would need to increase from 27% to 38%; 2) apprenticeship programs would need to recruit an additional 104 women and/or people of color from the population at large; or 3) apprenticeship programs, with no change in the
Seattle PCS Construction Industry March 2014 Page 51 Labor Market Assessment

baseline recruitment rate, would need to expand overall recruitment from 895 positions to at least 1,277 positions.
Over time, the size of the overall labor pool will increase due to construction demand throughout the economy. If the labor demand from City of Seattle CIP projects remains constant at 400 workers per year, then maintaining labor hiring criteria will require continual efforts to meet goals. However, while the annual number of new recruits may be small, the cumulative effect through 2019 can be substantial. For instance, in the baseline scenario (no policy intervention), an estimated 950 women and/or people of color would either be participating in or have completed a construction-related apprenticeship between 2014 and 2019. If the City of Seattle sustains hiring criteria of 50% women and/or people of color and pursues a targeted apprenticeship recruitment effort to achieve this level, the number of new targeted demographic apprentices would cumulatively sum to 1,580, representing an overall increase from 27% to 46% (Exhibit 51).
Exhibit 51. New Apprenticeships among Target Demographic, Baseline and 50% Hiring Criteria Scenario
Targeted Demographic Apprenticeships 2014 2015 2016 2017 2018 2019 Cumulative,
'14-'19 Baseline 140 90 160 240 160 160 950 Total with intervention (50% hiring criteria) 250 200 270 340 260 260 1,580 All apprenticeships, no expansion of programs 510 330 570 900 580 580 3,470 New share of apprenticeships to targeted demographic 49.1% 61.0% 47.0% 38.0% 45.1% 45.1% 45.5%
Source: Community Attributes, 2014. Note: cumulative amounts may not sum exactly due to rounding.
The net increase in apprenticeships necessary to satisfy hiring criteria will vary widely, based on the target level. If the City of Seattle maintains a hiring criteria of 35% through 2019 and supports apprenticeship programs as the sole source of new workers to satisfy this level, there would be a net increase of 280 new apprentices belonging to the target demographic. If the City sets the criteria at 75%, the cumulative net increase would reach 1,220 participants (Exhibit 52).
Seattle PCS Construction Industry March 2014 Page 52 Labor Market Assessment
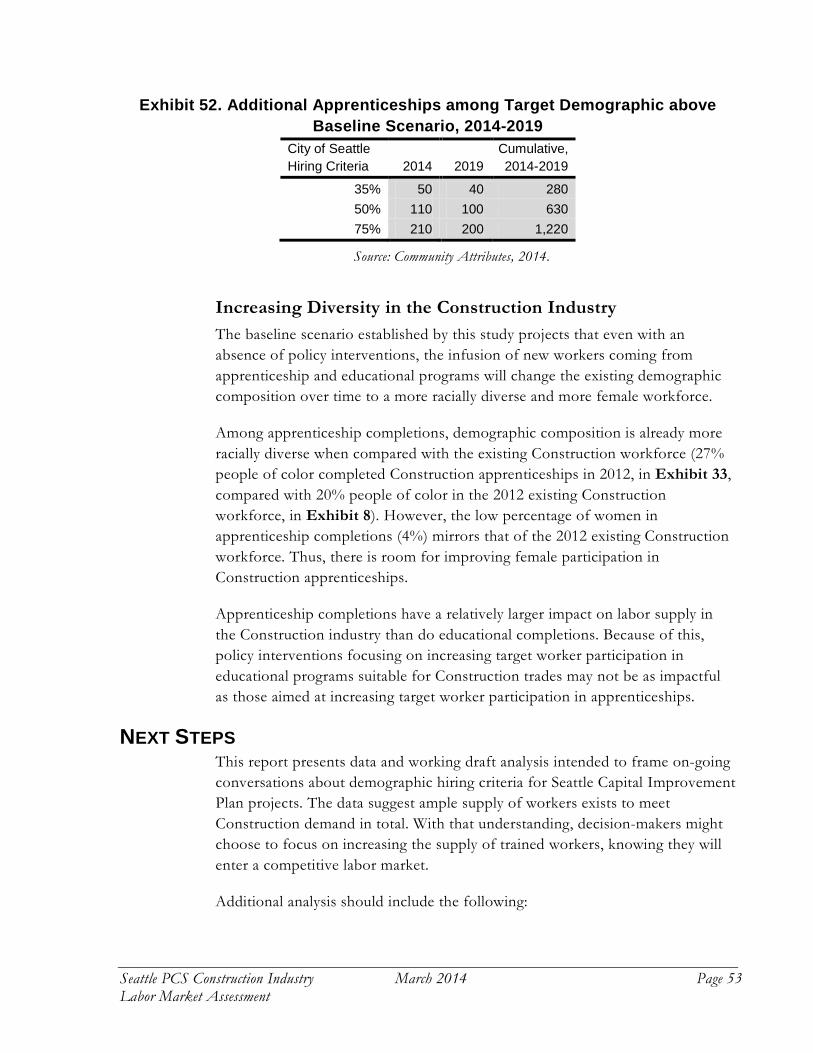
Exhibit 52. Additional Apprenticeships among Target Demographic above Baseline Scenario, 2014-2019
City of Seattle Hiring Criteria 2014 2019
Cumulative, 2014-2019
35% 50 40 280 50% 110 100 630 75% 210 200 1,220
Source: Community Attributes, 2014.
Increasing Diversity in the Construction Industry The baseline scenario established by this study projects that even with an absence of policy interventions, the infusion of new workers coming from apprenticeship and educational programs will change the existing demographic composition over time to a more racially diverse and more female workforce.
Among apprenticeship completions, demographic composition is already more racially diverse when compared with the existing Construction workforce (27% people of color completed Construction apprenticeships in 2012, in Exhibit 33, compared with 20% people of color in the 2012 existing Construction workforce, in Exhibit 8). However, the low percentage of women in apprenticeship completions (4%) mirrors that of the 2012 existing Construction workforce. Thus, there is room for improving female participation in Construction apprenticeships.
Apprenticeship completions have a relatively larger impact on labor supply in the Construction industry than do educational completions. Because of this, policy interventions focusing on increasing target worker participation in educational programs suitable for Construction trades may not be as impactful as those aimed at increasing target worker participation in apprenticeships.
NEXT STEPS This report presents data and working draft analysis intended to frame on-going conversations about demographic hiring criteria for Seattle Capital Improvement Plan projects. The data suggest ample supply of workers exists to meet Construction demand in total. With that understanding, decision-makers might choose to focus on increasing the supply of trained workers, knowing they will enter a competitive labor market.
Additional analysis should include the following:
Seattle PCS Construction Industry March 2014 Page 53 Labor Market Assessment

• Detailed review of the assumptions and City-owned data that drive the analysis in this draft report
• Discussions of strategies based on the theory that an overall labor shortage does not exist, but rather that trained workers will enter a competitive market
• Additional modeling of training programs, with more complete understanding of training available and program capacity
• Assessment of the City’s ability to influence workforce training participation
• Examination into construction firm hiring practices to understand if increasing the diversity of the workforce does lead to increased worker hours on city projects, or if other hiring barriers exist
Seattle PCS Construction Industry March 2014 Page 54 Labor Market Assessment

GLOSSARY Covered Employment – all employees working in a firm and protected by the unemployment insurance system. Covered employment includes all employment except self-employed workers, unpaid family workers, workers in certain not-for-profit organizations, and several other small (primarily seasonal) worker categories. Roughly 90% of workers in Washington are classified as covered employment, though this percentage varies by industry sector. Source: U.S. Bureau of Labor Statistics.
CIP- stands for Capital Improvement Plan/Program. A Capital Improvement Plan or Program is a short-range plan which identifies capital projects and equipment purchases for a municipality.
Crosswalk – a reference table that identifies the kinds of occupations in different industry sector. Washington State Employment Security Department publishes an annual crosswalk by county.
Employment Security Department (ESD) – primary state agency for gathering employment data. ESD publishes four resources utilized in this study: 1) covered employment estimates, as reported in the Quarterly Census of Employment and Wages (QCEW) series; 2) current employment statistics, based on monthly surveys of employers; 3) occupational employment estimates by industry; and 4) occupational employment forecasts.
Full-Time Equivalent (FTE) – A full-time equivalent employee. This is the definition of a workload of an employed person to allow for comparison. In this analysis, an FTE is equated with 1,800 annual labor hours.
Non-Employer – A non-employer business is one that has no paid employees, has annual business receipts of $1,000 or more ($1 or more in the Construction industries), and is subject to federal income taxes. The business may include more than one owner, working as partners. Source: US Census Bureau.
North American Industry Classification System (NAICS) – System of industry codes used to collect and organize important economic data, such as employment, number of businesses, and wages.
Standard Occupational Classification (SOC) – System of codes used to collect and organize employment and wage data by occupation.
Seattle PCS Construction Industry March 2014 Page 55 Labor Market Assessment

APPENDIX A: CONSTRUCTION EMPLOYMENT BY COUNTY AND CONSTRUCTION SUBSECTOR
Appendix A contains employment data in the Construction sector, broken out by county, and by subsector of construction, and by source of data. Previously in the report, where employment totals are reported, they include both sources of employment (covered and non-employer counts). These exhibits disaggregate that total employment by source of data. Exhibits A1 through A3 show Construction jobs by subsector, and by county, for 2003 through 2013.
Exhibit A1. King County Construction Jobs by Subsector, 2003-2013
Source: WA Employment Security Department, QCEW, 2013; only includes covered jobs.
Seattle PCS Construction Industry March 2014 Page 56 Labor Market Assessment

Exhibit A2. Pierce County Construction Jobs by Subsector, 2003-2013
Source: WA Employment Security Department QCEW, 2013; only includes covered jobs.
Exhibit A3. Snohomish County Construction Jobs by Subsector, 2003-2013
Source: WA Employment Security Department QCEW, 2013; only includes covered jobs.
Seattle PCS Construction Industry March 2014 Page 57 Labor Market Assessment

Exhibit A4. Washington State Non-employer Construction Employment by Construction Subsector, 2004-2011
Source: U.S. Census Bureau Non-employer Statistics, 2013; only includes non-employer jobs which are not eligible for unemployment insurance (non-covered jobs).
Exhibit A4 displays non-employer jobs in the Construction subsectors in Washington State, for 2004-2011. Exhibit A5 is a snapshot of 2012 employment by the three-county region, and by Washington State for comparison. Exhibit A6 shows the relative composition of each Construction subsector to the total Construction workforce, by county and by state.
Exhibit A5. Construction Jobs by Subsector, Three-County Region & WA State, 2012
Source: WA Employment Security Department QCEW, 2013; only includes covered jobs.
Seattle PCS Construction Industry March 2014 Page 58 Labor Market Assessment

Exhibit A6. Construction Jobs by Subsector, 3-County Region & WA State, 2012
Source: WA Employment Security Department QCEW, 2013; only includes covered jobs.
Exhibits A7, A8, and A9 show jobs in Construction by subsector and county for 2003-2013, for comparison. Exhibits A10, A11, and A12 break out Construction subsectors by further subsector, for Washington State, from 2003-2012.
Seattle PCS Construction Industry March 2014 Page 59 Labor Market Assessment

Exhibit A7. Heavy & Civil Engineering Employment, by County, 2003-2013
Source: WA Employment Security Department QCEW, 2013; only includes covered jobs.
Exhibit A8. Construction of Buildings, by County, 2003-2013
Source: WA Employment Security Department QCEW, 2013; only includes covered jobs.
Seattle PCS Construction Industry March 2014 Page 60 Labor Market Assessment

Exhibit A9. Specialty Trade Contractor Jobs, by County, 2003-2013
Source: WA Employment Security Department QCEW, 2013; only includes covered jobs.
Exhibit A10. WA State Construction Jobs in NAICS 237: Heavy & Civil Engineering Construction, 2003-2012
Source: WA Employment Security Department QCEW, 2013; only includes covered jobs.
Seattle PCS Construction Industry March 2014 Page 61 Labor Market Assessment

Exhibit A11. WA State Construction Jobs in NAICS 236: Construction of Buildings, 2003-2012
Source: WA Employment Security Department QCEW, 2013; Sectors highlighted are those most relevant for CIP contracting; only includes covered jobs.
Exhibit A12. WA State Construction Jobs in NAICS 238: Selected Nonresidential Specialty Trade Contractors 2003-2012
Source: WA Employment Security Department QCEW, 2013; only includes covered jobs.
Seattle PCS Construction Industry March 2014 Page 62 Labor Market Assessment

Exhibit A 13 shows the top ten occupations in each subsector of Construction for King, Pierce, and Snohomish counties in 2012. Each subsector of Construction has its own composition of occupations visible in these exhibits.
Exhibit A13. Top 10 Occupations Employed in NAICS 236- Construction of Buildings: King, Pierce and Snohomish Counties, 2012
Source: ESD Occupations by NAICS Matrix, 2012; only includes covered jobs.
Exhibit A14. Top 10 Occupations Employed in NAICS 237- Heavy & Civil Engineering Construction: King, Pierce and Snohomish Counties, 2012
Source: ESD Occupations by NAICS Matrix, 2012; only includes covered jobs.
Seattle PCS Construction Industry March 2014 Page 63 Labor Market Assessment

Exhibit A15. Top 10 Occupations Employed in NAICS 238- Specialty Trade Contractors: King, Pierce and Snohomish Counties, 2012
Source: ESD Occupations by NAICS Matrix, 2012; only includes covered jobs.
Exhibit A16. Composition of General Population by Race: King, Pierce, and Snohomish Counties, 2012
Source: U.S. Census Bureau, ACS 5-year estimates, 2012.
30% People of Color
Seattle PCS Construction Industry March 2014 Page 64 Labor Market Assessment

APPENDIX B: CONSTRUCTION EMPLOYMENT FORECASTS Appendix B contains employment forecasts for the Construction Industry in the Puget Sound Region, as well as in King, Pierce, and Snohomish counties. Exhibit B1 is from Conway Pedersen’s Puget Sound forecast, and Exhibit B2 shows observed (actual) and projected covered employment in the Construction industry to 2020.
Exhibit B1. Puget Sound Percent Change in Construction Jobs, 1987-2024
Source: Conway Pedersen, 2013.
Seattle PCS Construction Industry March 2014 Page 65 Labor Market Assessment

Exhibit B2. Observed and Projected Growth in Employment in the Construction Sector, King, Pierce and Snohomish Counties, 2003-2020
Source: Puget Sound Regional Council, 2013; Conway Pedersen, 2013.
Seattle PCS Construction Industry March 2014 Page 66 Labor Market Assessment

APPENDIX C: DATA SOURCES Exhibit C1. Data Sources Used
Type of Data Used Source of Data
Covered job estimates Washington State Employment Security Department
Occupational data; Wages by occupation
Bureau of Labor Statistics
Washington State Input-Output Table
Washington State Office of Financial Management
Non-employer job estimates
U.S. Census Bureau
Demographic data by occupation/industry
U.S. Census Bureau
Capital Improvement Program (CIP) Data
City of Seattle
Supply Model Data Integrated Postsecondary Education Data System (for educational completions and demographic composition); Washington State Department of Labor & Industries (for apprenticeship completions and demographic composition); Washington State ESD (for unemployment claims and demographic composition); and the U.S. Census Bureau (for “workers likely to work”)
Construction Sector Forecasts
Conway Pedersen Economics, Inc. Regional Forecast; Puget Sound Regional Council long-term regional forecast
Source: Community Attributes, Inc., 2014.
Seattle PCS Construction Industry March 2014 Page 67 Labor Market Assessment

APPENDIX D: METHODS The Construction sector is defined through a list of core industry codes (see Exhibit 1 for the list of codes), which is then quantified in terms of historical and current jobs, by the three-county area of King, Snohomish, and Pierce counties. For a more detailed analysis, the sector is also analyzed as a collection of occupations which gives insight into how to view the supply of labor for the industry, and helps give more detail about workforce details, like wages. Data sources are outlined in Exhibit C1.
Demand Demand forecasts represent filled jobs, which in economic theory represents the intersection of supply and theoretical demand for employment. Construction jobs moreover reflect other key drivers in the regional economy, such as the growth in economic activity resulting in demand for new commercial and retail space, or population growth putting upward pressure on the existing inventory of housing stock. Construction employment is thus largely a function of other key elements of the economy.
The forecast totals in this analysis are derived from the Puget Sound Regional Council’s (PSRC) long-term economic forecast. Importantly, there is a much greater degree of independent contracting and self-employment in construction relative to other sectors of the economy. The PSRC’s forecast does not include a forecast specific to construction; instead, totals are reported by county for “construction and resources.” However, within this larger category, construction jobs constitute on average 94% of all covered jobs; in this analysis, the growth rate for this category is then applied to the historic estimates of total jobs (covered and self-employed) for the construction sector to arrive at forecast estimates for years 2014 through 2019.
Sources of Demand Public sector construction employment demand is the key driver of private sector demand—the latter is the remainder once public sector employment demand is calculated, controlled to the PSRC-derived forecast totals for construction job. Several sources are utilized in this approach, including gross business income and employment data and the 2007 Washington State Input-Output Model.
First, the ratio of gross business income (GBI) to construction worker (covered and self-employed) was calculated statewide, the denominator derived from the 2007 Washington State Input-Output Model transactions table. This ratio—$215,200 per worker—was the multiplied by the PSRC-provided estimates of
Seattle PCS Construction Industry March 2014 Page 68 Labor Market Assessment

total construction employment in the three-county region, resulting in estimated regional contracts in 2012 of nearly $20.1 billion.
Next, the Washington State Input-Output Model was used to distribute this contract value by source of demand. Within the model, two construction sectors are included with estimated sales by source of demand. These include: 1) intermediate purchases, i.e. sales to other businesses; 2) households, e.g., contractor renovations to homes; 3) private investment, of which a large share represent contract work for developers; 4) state and local government; 5) federal government; 6) sales outside of Washington state; and 7) foreign exports. Construction sector sales to the state, local, and federal government were calculated as a percentage of total sales (or output). This percentage was then applied to the estimated contract value for 2012 to arrive at total construction sales (or gross receipts) to each level of government. For example, according to the model, the two construction sectors included in the model, on a weighted average basis, sell 10.5% of total output by value to state and local governments, with another 3.6% to the federal government, while 46.2% goes to private investment (e.g., developers) and 3.7% to households.
Once the above contract value is distributed by source, the statewide ratio of gross business income (GBI) per worker is applied to these totals to arrive at employment needed to satisfy these sales. For example, because 10.5% of total construction demand by value comes from state and local governments (including counties and cities), an estimated $2.1 billion in sales are estimated to this source of demand in 2012. Applying the statewide GBI per worker average results in a demand for 9,800 workers need in the three-county region; added to this are another 3,400 jobs needed to satisfy federal contracts. Importantly, while these results are reported as jobs, the same worker can work on both private sector and public sector projects—estimates thus reflect full-time equivalents.
To calculate City of Seattle public works demand, a four-year weighted average of CIP contract value per worker was calculated, based on City of Seattle Department of Finance and Administrative Services administrative records. These data include labor hours for all workers participating in CIP projects, including prime contractors and subcontractors, and total contract value. Based on conversions with the City, an annual estimate of $200 million in CIP spending was applied for each year between 2014 and 2019, resulting in an average count of 400 workers per year supported by City of Seattle public works projects.
To further estimate additional jobs supported by municipality-level public works across the three-county region, a per capita measure was introduced and
Seattle PCS Construction Industry March 2014 Page 69 Labor Market Assessment

applied—the ratio of CIP contract value in Seattle per worker divided by the sum of jobs and people in Seattle. This approach, when extrapolated to all cities, provides additional weight to regions that are both populous and employment centers, two major factors driving maintenance, repair, and new investments in infrastructure.
To account for changes in public sector demand over time, projected growth in the sum of population and employment was applied to total public works employment demand, state & county, and federal sources. City of Seattle public works employment demand was held constant at 400 workers, and remaining municipality-sourced demand was treated as the remainder after accounting for all other public sector sources. Lastly, private sector employment demand was treated as the remainder after accounting for all types of public sector demand.
Alternative Approach to Forecasting Demand In an alternative approach, private sector and public school-derived (higher education and K-12) demand is calculated by estimating demand for additional square footage needed to accommodate new workers by sector, and then priced out based on industry standards for cost per square foot by development type. To arrive at employment needed to satisfy project demand, the distribution of project costs by contractor type are then calculated and applied; estimated productivity per sector is then used to arrive at number of workers needed.13 The form of analysis also consults population forecasts, utilizing industry standards for single and multi-family housing square footage and costs calculated, and then used to estimate construction employment demand. Exhibit D1 presents the estimated breakouts of contracts by value across construction and related sectors for different types of projects.
13 Costs represent those incurred by the developer, and are therefore below the actual retail sale price of a property denominated in square footage. Productivity in the construction sector is difficult to estimate due to the mobility of the construction workforce and due to seasonality. In this analysis, the Washington State Input-Output Model is used to develop such a measure.
Seattle PCS Construction Industry March 2014 Page 70 Labor Market Assessment

Exhibit D1. Estimated Contract Value Distribution by Industry (NAICS Code) and Project Type
Source: Community Attributes, 2014.
Supply Construction workforce supply includes both those who are currently employed in Construction and those actively seeking work in the Construction sector. The supply of Construction workers is defined as the sum of the following sources:
• Carry-over employed workers in Construction from the previous year, net of retirements, career changers, and out-migration—what is referred to as “churn and attrition”;
• Forecast unemployment claims made by Construction workers; and • New entrants to the workforce, which includes new apprentices in
Construction trades as well as the previous year’s graduates from Construction-specific post-secondary education programs from institutions within the three-county region.
Carry-over employed workers represent those workers who were employed the year before and remain in the construction employment base in the current year, while accounting for movement across businesses in the construction sector. The Washington State Employment Security Department’s Occupation Employment Forecast is used to estimate the number of total openings per
Other (Wholesale, etc.)
Heavy and Civil Engineering Construction (237)
Design Services (541)
Specialty Trade Contractors (238)
Construction of Buildings (236)
Seattle PCS Construction Industry March 2014 Page 71 Labor Market Assessment

occupation due net of growth. Each year, ESD projects total and growth-induced job openings per occupation. The difference between total and growth-induced openings represents openings created through attrition, which refers to out-migration, retirements, movement of workers from one employer to another, even if within the same industry, and other types of job separation. Among construction-specific occupations, this “churn and attrition” effect equals roughly 2.5% of total employment based on ESD occupational employment-industry crosswalks. Based on conversations with ESD and analysis of labor force ageing trends, half of this, or 1.25%, was applied as an estimate of job openings attributable to attrition, or labor force exiting. A retained, or carried-over, workforce is thus discounted by this attrition rate, which results in an annual retained workforce of employed workers of 98.75% of the projected total. These remaining workers represent participants in the labor force (i.e., supply) who remain employed. For each occupation, total forecast openings due to labor market exiting are allocated to the construction sector based on the share of total employment of each occupation in the construction sector, based on historic data.
Unemployment insurance claims represent those workers who remain in the construction labor force, are not employed, but are qualified and motivated to work in construction. Unemployment insurance claims are reported by sector and include initial claims, continued claims, and exhausted claims. The ratio of historic ratio of UI claims to total employment in construction and the regional unemployment rate are used to extrapolate forecast UI claims in construction into the future, using the forecast annual regional unemployment rates for years 2014 to 2019 by Conway Pedersen Economics.
New entrants to the workforce include accredited program completions in construction-related fields (e.g., construction management, community college programs related to construction) and new apprenticeships. For the latter, apprenticeship completions are treated as equivalent to new openings.
Seattle PCS Construction Industry March 2014 Page 72 Labor Market Assessment

APPENDIX E: ADDITIONAL MAPS
Seattle PCS Construction Industry March 2014 Page 73 Labor Market Assessment

Seattle PCS Construction Industry March 2014 Page 74 Labor Market Assessment

Seattle PCS Construction Industry March 2014 Page 75 Labor Market Assessment

Seattle PCS Construction Industry March 2014 Page 76 Labor Market Assessment