seattle city light1 seattle city light • fingertip facts seattle city light • fingertip facts 2...
TRANSCRIPT

Printed on recycled paper.
SEATTLECITY LIGHTFINGERTIP FACTS
CU
STO
MER
INFO
RM
ATION
GU
IDE
OUR VisiOn:To set the standard—to deliver the best customer service experience of any utility in the nation.
OUR MissiOn:Seattle City Light is dedicated to exceeding our customers’ expectations in producing and delivering environmentally responsible, safe, low-cost, and reliable power.
OUR ValUes:Excellence, Accountability, Trust, and Stewardship
SEATTLE CITy LIGhT • FINGERTIP FACTS1 SEATTLE CITy LIGhT • FINGERTIP FACTS 2
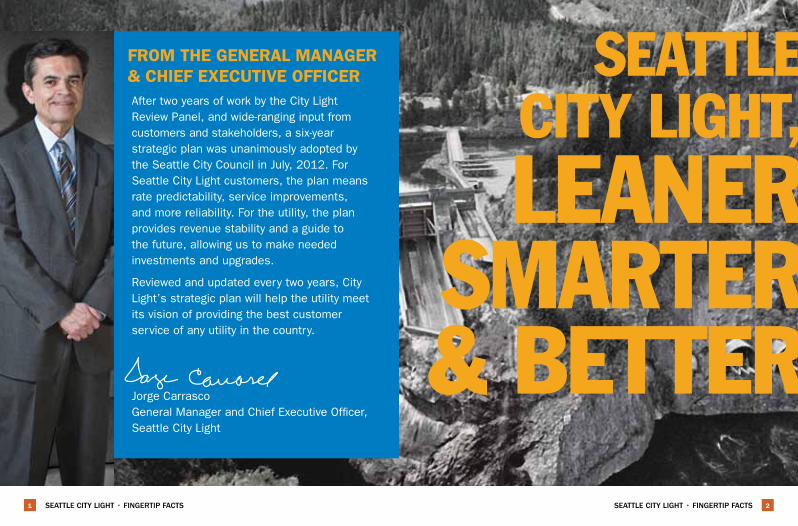
After two years of work by the City Light Review Panel, and wide-ranging input from customers and stakeholders, a six-year strategic plan was unanimously adopted by the Seattle City Council in July, 2012. For Seattle City Light customers, the plan means rate predictability, service improvements, and more reliability. For the utility, the plan provides revenue stability and a guide to the future, allowing us to make needed investments and upgrades.
Reviewed and updated every two years, City Light’s strategic plan will help the utility meet its vision of providing the best customer service of any utility in the country.
Jorge Carrasco General Manager and Chief Executive Officer, Seattle City Light
FROM the GeneRal ManaGeR & ChieF exeCUtiVe OFFiCeR SEATTLE
CITY LIGHT, LEANER
SMARTER& BETTER

SEATTLE CITy LIGhT • FINGERTIP FACTS3 SEATTLE CITy LIGhT • FINGERTIP FACTS 4
Our dams on the upper Skagit River – Ross, Diablo and Gorge – and Boundary Dam on the Pend Oreille River are industry models. Through careful resource management and habitat protection we are improving endangered fish populations in Puget Sound. We are also doing our part to reduce harmful levels of greenhouse gases by achieving net-zero carbon dioxide emissions each year since 2005.
Looking into the future for new, renewable energy is our challenge and our opportunity. We see increased conservation as our “power plant” of the future. The resources we don’t use today will provide power for our future.
For more information about Seattle City Light, visit www.seattle.gov/light.
We’Re yOUR eleCtRiC UtilityEX
PERI
ENCE
Guided by a young visionary named J.D. Ross, the Cedar Falls power plant was completed and Seattle’s streetlights were illuminated in January of 1905. In April of 1910, the city’s charter was amended to create a Light and Power Department – eventually to become known as Seattle City Light. We have a long and proud history of innovation and stewardship. J.D. Ross’ legacy of utility leadership continues today at City Light as we face a world challenged by global climate change.
On March 4, 1902, seattle voters took
the bold step of approving bonds to build
a hydroelectric power plant on the city’s
newly established Cedar River watershed.
the power generated would supply
electricity to the city’s streetlights.

SEATTLE CITy LIGhT • FINGERTIP FACTS5 SEATTLE CITy LIGhT • FINGERTIP FACTS 6
seattle City liGht exeCUtiVe teaM
Jorge CarrascoGeneral Manager and CEO [email protected]
sephir hamilton Chief of Staff [email protected]
Jim BaggsInternal Compliance Officer/Interim Power Supply and Environmental Affairs Officer [email protected]
Jeff BishopChief Financial Officer [email protected]
DaVonna JohnsonHuman Resources Officer [email protected]
Phil WestCustomer Service and Energy Delivery Officer [email protected]
left to right: Jeff Bishop, chief financial officer; Jorge Carrasco, general manager and CeO; Phil West, customer service and energy delivery officer; Jim Baggs, compliance officer/interim power supply and environmental affairs officer; DaVonna Johnson, human resources officer; and sephir hamilton, chief of staff.

SEATTLE CITy LIGhT • FINGERTIP FACTS7 SEATTLE CITy LIGhT • FINGERTIP FACTS 8
Outage hotline ................................................. 206.684.7400
electrical life-support equipment Program ....... 206.684.3020
Customer service Center .................................. 206.684.3000
Out of area calls 800.862.1181 (Interpreters are available for customers who do not speak English.)
Account Information, Payment Assistance, Payment Locations, Bill Information and Dispute Resolution, Rates Information, and Green Renewable Energy Information
tty/hearing impaired ...................................... 206.233.7241
after-hours electrical emergency line .............. 206.706.0051
electrical service and streetlight service North of Denny Way ......................................... 206.615.0600 South of Denny Way ....................................... 206.386.4200
streetlight Problems ........................................ 206.684.7056
Conservation information ................................ 206.684.3800(Residential, Commercial and Industrial)
tree trimming/Vegetation Management ........... 206.386.1663
skagit tours www.SkagitTours.com ................... 206.684.3030
General Manager’s Office ................................. 206.684.3200
Communications and Public affairs .................. 206.684.3090
Key PhOne nUMBeRs
seattle City light administrative Office Seattle City Light Visitor Center and Executive Offices 700 5th Avenue, Suite 3200 Seattle, WA 98104-5031 (5th Avenue between Columbia and Cherry streets)
Mailing Address: P.O. Box 34023 Seattle, WA 98124-4023
General Manager’s Office 206.684.3200 Communications and Public Affairs 206.684.3090 Customer Service 206.684.3000 www.seattle.gov/light
Non-English Language Portal: www.seattle.gov/html/citizen/language.htm
north service Center 1300 N. 97th Street Seattle, WA 98103 206.615.0600
south service Center 3613 4th Avenue S. Seattle, WA 98134 206.386.4200
COntaCts

SEATTLE CITy LIGhT • FINGERTIP FACTS9 SEATTLE CITy LIGhT • FINGERTIP FACTS 10
Seattle Neighborhood Payment Locations /continued, next page
PayMent lOCatiOns
seattle City light service Centers
north service Center*1300 N. 97th Street Monday - Friday, 8:30 a.m. - 4:30 p.m.
south service Center* 3613 4th Avenue S. Monday - Friday, 8:30 a.m. - 4:30 p.m.
seattle neighborhood Payment locations
Ballard 5604 22nd Avenue N.W. Monday - Friday, 9 a.m. - 5 p.m. Saturday, 10 a.m. - 2 p.m.
Central 2301 S. Jackson Street, Suite 208 Monday - Friday, 9 a.m. - 7 p.m. Saturday, 9 a.m. - 5 p.m.
*Payment drop boxes are located outside near the main entrances.
Downtown
Utilities Payment Center 700 5th Avenue, Suite 2777 Monday - Friday, 8 a.m. - 5 p.m.
City treasurer’s Office 700 5th Avenue, Suite 4250 Monday - Friday, 8 a.m. - 5 p.m.
seattle Municipal tower Customer service Center 700 5th Avenue 4th Floor Lobby Monday - Friday, 8 a.m. - 5 p.m.
seattle Municipal tower Payment Drop Boxes 700 5th Avenue 4th Floor Lobby and 6th Avenue and Cherry Street (outside at the SE corner of the building)
City hall Payment Drop Box5th Avenue and Cherry Street 1st Floor Lobby (by the elevators)
Note: Credit card payments are not accepted in payment drop boxes.
SEATTLE CITy LIGhT • FINGERTIP FACTS11
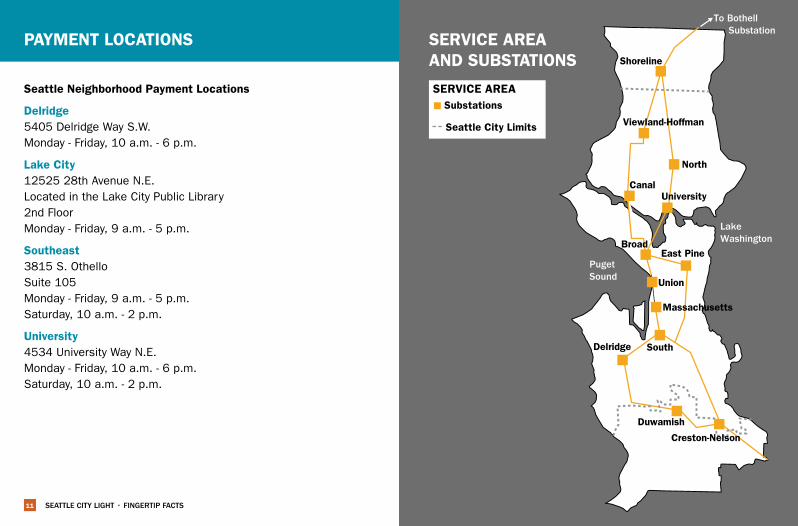
seattle neighborhood Payment locations
Delridge 5405 Delridge Way S.W. Monday - Friday, 10 a.m. - 6 p.m.
lake City12525 28th Avenue N.E. Located in the Lake City Public Library 2nd Floor Monday - Friday, 9 a.m. - 5 p.m.
southeast 3815 S. Othello Suite 105 Monday - Friday, 9 a.m. - 5 p.m. Saturday, 10 a.m. - 2 p.m.
University 4534 University Way N.E. Monday - Friday, 10 a.m. - 6 p.m. Saturday, 10 a.m. - 2 p.m.
Puget Sound
Lake Washington
Creston-Nelson
Duwamish
Delridge South
Massachusetts
Union
East PineBroad
UniversityCanal
North
Shoreline
To Bothell Substation
Viewland-Hoffman
seRViCe aRea anD sUBstatiOns
seRViCe aRea
n substations
seattle City limits
PayMent lOCatiOns

SEATTLE CITy LIGhT • FINGERTIP FACTS13 SEATTLE CITy LIGhT • FINGERTIP FACTS 14
For the year ended December 31, 2012, the most current data available.
CUstOMeR statistiCs (unaudited)
Average Number Megawatt-hours* of Customers
Residential 362,658 3,098,745
Non-Residential 39,950 6,367,897
Total 402,608 9,466,642
*Amounts include an allocation for the net change in unbilled revenue.
For the year ended December 31, 2012, the most current data available.
Seattle City Light, a department of the City of Seattle, is one of the nation’s largest municipally owned utilities in terms of the number of customers served. City Light is supported by revenues from its customers, not taxes. In fact, City Light pays substantial taxes to state and local governments.
GeneRal inFORMatiOn
Service Area Population 776,336
Service Area Size 131.31 sq. mi.
Personnel (full-time equivalent positions) 1,811
Major Substations 15
Unit Substations 3
Commercial and Industrial Power Transformers 56
Transmission Circuit Miles 656
Distribution Circuit Miles 2,310
Network Distribution Circuit Miles* 216
Meters 418,000
* Includes the downtown business district, First Hill, and the University District.
2012 USES OF POWER
SERVICES
Non–Residential
Residential
OTHER
Wholesale & other
Seattle City Light operationsand losses
(in percent megawatt-hours)
22.5%
45.3
%
5.3%
26.9
%

SEATTLE CITy LIGhT • FINGERTIP FACTS15 SEATTLE CITy LIGhT • FINGERTIP FACTS 16
Seattle City Light is proud to offer its residents some of the lowest electricity rates in the nation and the Northwest.
Note: Source of national data: Department of Energy (www.eia.doe.gov/cneaf/electricity/epa/epa_sum.html; www.eia.doe.gov/cneaf/electricity/epm/epm_sum.html).
*2012 national average annual consumption data not available; 2012 national average rate data is preliminary; 2011 national average annual consumption data added; 2011 national average rate data updated.
2008
Kilowatt-hours used (in billions) Number of customers (in thousands)
2009 2010 2011 2012
3.25
3.15
3.05
364
360
356
352
348
344
340
Average customers
Kilowatt hours used
RESIDENTIAL CONSUMPTION
2008 2009 2010 2011 2012
Kilowatt-hours used (in billions) Number of customers (in thousands)6.55
6.50
6.45
6.40
6.35
6.30
6.25
40
39
NON-RESIDENTIAL CONSUMPTION
Average customers
Kilowatt hours used
aVeRaGe Rate PeR KilOWatt-hOUR
2008 2009 2010 2011 2012
AVERAGE RESIDENTIAL RATES
12
10
8
6
0
2
4
Seattle National
(in cents per kilowatt-hour)
For the year ended December 31, 2012*

Burlington Biomass
Columbia RidgeLandfill Gas
Potholes East Canal 66 (GCPHA)
R.D. SmithEltopia Branch Canal (GCPHA)
Summer Falls (GCPHA)
Main Canal (GCPHA)
CanaDa
iDahOOReGOn
WashinGtOn
Lucky Peak
Priest Rapids
Boundary Dam
Ross DamDiablo Dam
Gorge DamNewhalem
South Fork ToltCedar Falls
High Ross Agreement
Stateline Wind ProjectLake Washington
Puget Sound
LakeCity
WestSeattle
UW
QueenAnne
CapitolHill
RainierValley
Magnolia
Ballard
5
5
90
seRViCe teRRitORy
Legend
Burien
Lake Forest Park
Renton
SeaTac
Seattle
Shoreline
Tukwila
Service Area
UnincorporatedKing County
Normandy Park
eneRGy ResOURCes
Seattle City Light serves approximately 403,000 customers in the City of Seattle and eight adjacent jurisdictions.
Owned Hydro
Treaty Rights From British Columbia
Long-Term Hydro Contracts (in addition to the BPA contract; GCPHA is the Grand Coulee Project Hydroelectric Authority)
Other Long-Term Contracts
SEATTLE CITy LIGhT • FINGERTIP FACTS17

SEATTLE CITy LIGhT • FINGERTIP FACTS19 SEATTLE CITy LIGhT • FINGERTIP FACTS 20
City Light Locations Date in Capacity % of Plants Service (MW) Total
Boundary Pend Oreille River 8/23/671 1,050.0 58.0
Ross Skagit River 12/30/52 352.6 19.5
Gorge Skagit River 9/27/24 199.2 11.0
Diablo Skagit River 10/20/36 159.3 8.8
Cedar Falls Cedar River 10/14/04 30.0 1.7
S. Fork Tolt S. Fork Tolt River 11/20/95 16.6 0.9
Newhalem Newhalem Creek 1921 2.3 0.1
Total System Generation Capability 1,810.0 100.0
POWeR sUPPly GeneRateD By City liGht
1 Two additional hydro units of 399 MW capacity installed in 1986.
Meeting Our Customers’ Power needs
Seattle’s city-owned hydroelectric plants depend on rain and snow as their fuel. In years with normal precipitation, our facilities supply more than half of Seattle’s power needs. We make up the difference by purchasing power from outside the region.
2012 FUel Mix
Generation Type Percentage
Hydro 89.8
Nuclear* 4.4
Wind 3.9
Coal* .8
Other** .6
Landfill Gases .5
Total 100.0
* Represents a portion of the power purchased from Bonneville Power Administration.
** Includes natural gas, biomass, waste, petroleum, landfill gases, and other fuels.
2012 SOURCES OF POWER
GENERATED
Boundary
Skagit
Cedar Falls & South Fork Tolt
TREATY
PURCHASED
BPA
Other
BC Hydro
(in percent megawatt-hours)
40.2
%
21.1%
2.3% 1.4%
7.9%
27.1%

SEATTLE CITy LIGhT • FINGERTIP FACTS21 SEATTLE CITy LIGhT • FINGERTIP FACTS 22
COnseRVatiOn PROGRaMs
energy savings
Seattle City Light has operated conservation programs for 35 years. In 2012, conservation reduced City Light’s electric system load by 1,196,732 megawatt–hours. That is enough electricity to power 140,000 Seattle homes – over one-third of our residential service. These savings accrued from measures installed from 1982 to 2012. If all the energy savings acquired through City Light’s conservation programs since 1977 had been available in 2012, this could power the homes of six cities the size of Seattle for one year – or double the entire utility load for 2012.
Carbon Dioxide emissions Reductions
In 2012, the release of more than 765,908 metric tons of carbon dioxide into the atmosphere was avoided because of our programs. That is equivalent to 168,500 households driving one fewer car for a year. This impact will continue for the next 16 years, as long as the conservation measures installed continue to save energy.
COnseRVatiOn CUstOMeRs
save on electric Bills
n From 1977 to 2012, program participants saved $806 million on their bills. Half of these savings went to residential customers.
n In 2012, conservation customers reduced their City Light bills by $84 million.
ANNUAL ENERGY SAVED THROUGH CONSERVATION
140,000
160,000
120,000
100,000
80,000
60,000
40,000
20,000
0
(megawatt-hours)
2008
2009
2010
2011
2012