city of torrance, california financial report
TRANSCRIPT

City of Torrance, CaliforniaComprehensive Annual
FinancialReport
Twin Towers Flag - 43rd Armed Forces Day Parade
City of Torrance Veterans Memorial
Torrance City Hall
Wilson Park Sports Center
James R. Armstrong Theater
Fiscal Year Ended June 30, 2017Department of Finance


Fiscal Year Ended June 30, 2017
FinancialCOMPREHENSIVE ANNUAL
Introductory Section
OFTorranceCity
Torrance City Hall
R E P O R T
v I N T R O D U C T O R Y S E C T I O N v


Fiscal Year Ended June 30, 2017
FinancialCOMPREHENSIVE ANNUAL
Financial Section
OFTorranceCity
R E P O R T
v F I N A N C I A L S E C T I O N v


ManagementDiscussion & Analysis
Managem
entD
iscussion & A
nalysis
OFTorranceCity
v D E P A R T M E N T O F F I N A N C E v
Council Chamber


5
MANAGEMENT DISCUSSION AND ANALYSIS
The management discussion and analysis of the City of Torrance’s financial performance provides an overview of the City’s financial activities for the fiscal year ended June 30, 2017. It is recommended this overview be read in conjunction with the City’s transmittal letter and the accompanied financial statements in order to obtain a thorough understanding of the City’s financial condition at June 30, 2017. FINANCIAL HIGHLIGHTS
The City’s total net position, assets and deferred outflows less liabilities and deferred inflows, at fiscal year-end is $184.0 million compared to $175.6 million for the 2015-16 fiscal year. This represents an increase of $8.4 million primarily due to the net difference between projected and actual earnings on CalPERS pension plan investments.
During the year, the City’s governmental activities revenues exceeded expenditures by $6.4 million. With transfers of $7.8 million to fund business type activities, net position decreased by $1.5 million.
In the City’s business-type activities, expenditures exceeded revenues and transfers by $1.9 million.
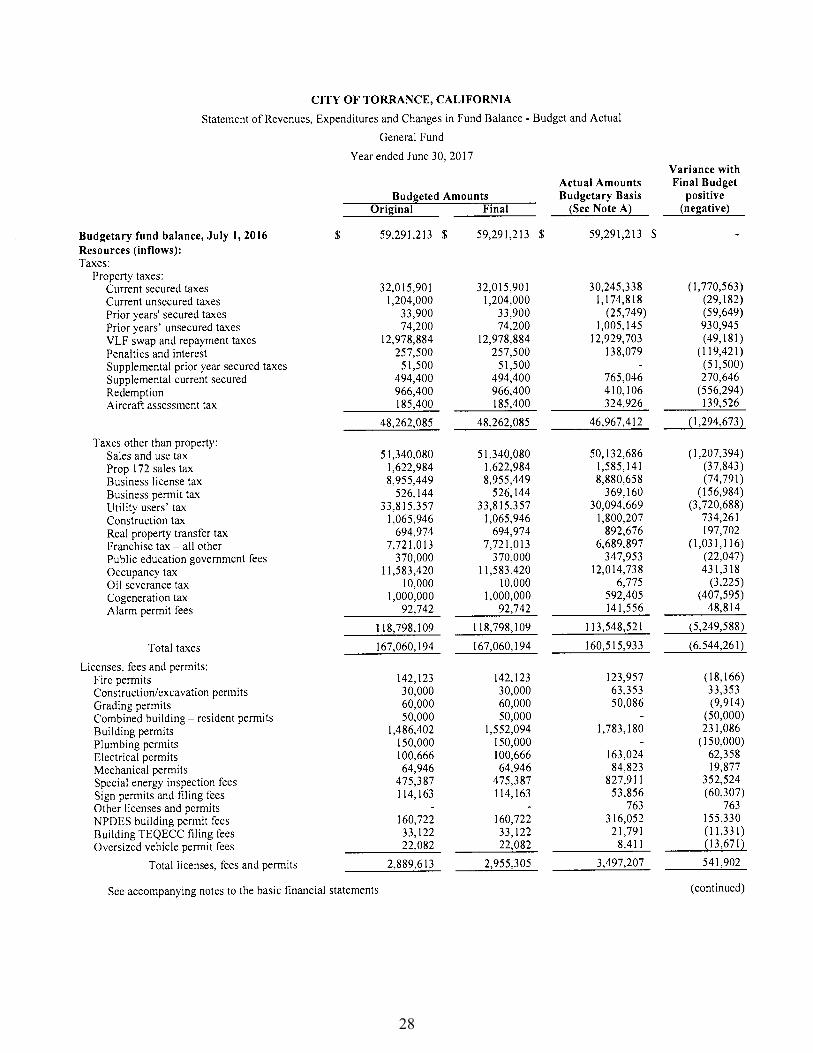
The General Fund reported an excess of revenues over expenditures of
$9.2 million before a net transfers out of $13.6 million resulting in a decrease to its fund balance of $4.4 million during the year.
USING THIS ANNUAL REPORT This annual report consists of a series of financial statements. The Statement of Net Position and the Statement of Activities provide information about the financial activities of the City as a whole and presents a longer futuristic view of the City’s finances. For government activities, fund financial statements tell how services were financed in the short-term as well as what remains for future spending. Fund financials also report the City’s operations in greater detail compared to the government-wide statements by providing information about the City’s most significant funds. The remaining statements provide financial information about activities where the City acts solely as a trustee or agent for the benefit of those outside of the government. REPORTING THE CITY AS A WHOLE The Statement of Net Position and the Statement of Activities One of the most important questions asked about the City’s finances is, “Is the City as a whole better off or worse as a result of the year’s activities?” The Statement of Net Position and the Statement of Activities report
6
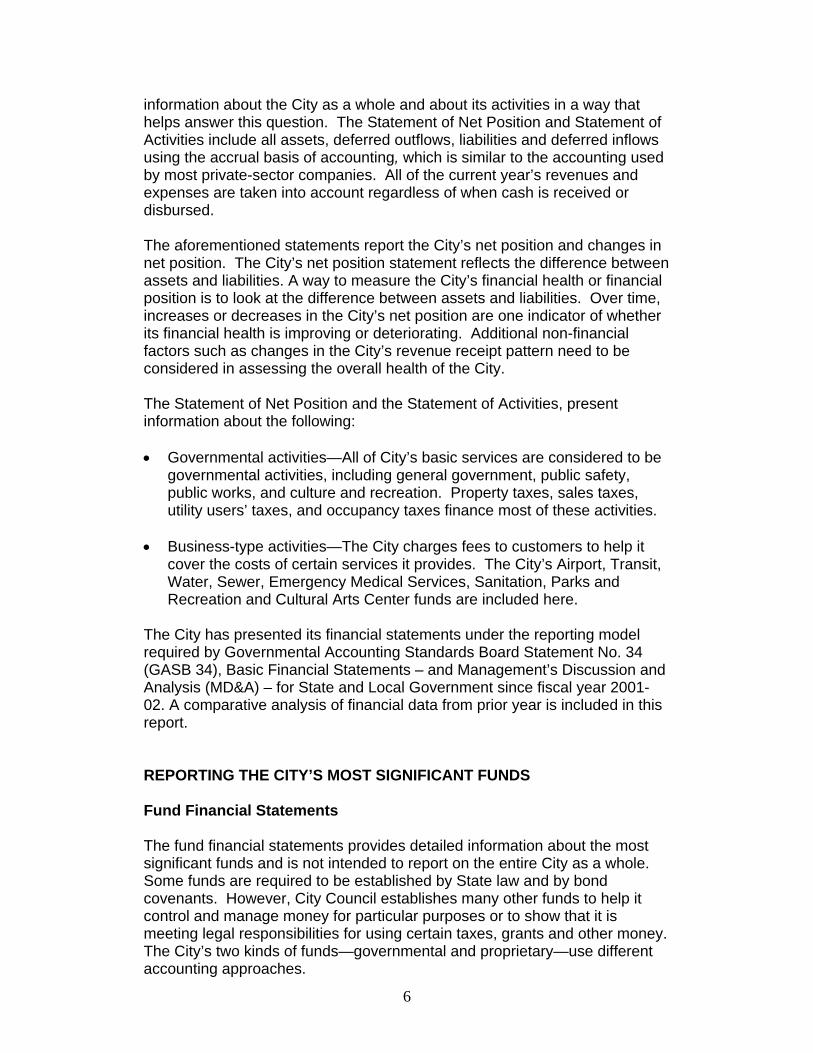
information about the City as a whole and about its activities in a way that helps answer this question. The Statement of Net Position and Statement of Activities include all assets, deferred outflows, liabilities and deferred inflows using the accrual basis of accounting, which is similar to the accounting used by most private-sector companies. All of the current year’s revenues and expenses are taken into account regardless of when cash is received or disbursed. The aforementioned statements report the City’s net position and changes in net position. The City’s net position statement reflects the difference between assets and liabilities. A way to measure the City’s financial health or financial position is to look at the difference between assets and liabilities. Over time, increases or decreases in the City’s net position are one indicator of whether its financial health is improving or deteriorating. Additional non-financial factors such as changes in the City’s revenue receipt pattern need to be considered in assessing the overall health of the City. The Statement of Net Position and the Statement of Activities, present information about the following: Governmental activities—All of City’s basic services are considered to be
governmental activities, including general government, public safety, public works, and culture and recreation. Property taxes, sales taxes, utility users’ taxes, and occupancy taxes finance most of these activities.
Business-type activities—The City charges fees to customers to help it
cover the costs of certain services it provides. The City’s Airport, Transit, Water, Sewer, Emergency Medical Services, Sanitation, Parks and Recreation and Cultural Arts Center funds are included here.
The City has presented its financial statements under the reporting model required by Governmental Accounting Standards Board Statement No. 34 (GASB 34), Basic Financial Statements – and Management’s Discussion and Analysis (MD&A) – for State and Local Government since fiscal year 2001-02. A comparative analysis of financial data from prior year is included in this report. REPORTING THE CITY’S MOST SIGNIFICANT FUNDS Fund Financial Statements The fund financial statements provides detailed information about the most significant funds and is not intended to report on the entire City as a whole. Some funds are required to be established by State law and by bond covenants. However, City Council establishes many other funds to help it control and manage money for particular purposes or to show that it is meeting legal responsibilities for using certain taxes, grants and other money. The City’s two kinds of funds—governmental and proprietary—use different accounting approaches.

7
Governmental funds— Majority of the City’s basic services are reported in
governmental funds. Governmental funds account for the resources (revenues received) and the uses (services provided to residential and business community) of money that flows into and out of these funds and money left at year-end that is available for spending. These funds are reported using an accounting method called modified accrual accounting, which measures cash and all other financial assets that can readily be converted to cash. The government fund statements provide a detailed short-term view of the City’s general government operations and the basic services rendered. Governmental fund information helps determine whether there are more or less financial resources that can be spent in the near future to finance the City’s programs. A description of the relationship (or differences) between the governmental activities (reported in the Statement of Net Position and the Statement of Activities) and governmental funds is shown in the reconciliation at the bottom of the fund financial statements.
Proprietary funds (which includes Enterprise and Internal Service funds)
are funds that account for the City’s operations that are financed and operated in a manner similar to a private business enterprise. Proprietary funds are reported in the same way that all activities are reported in the Statement of Net Position and the Statement of Activities. The City’s enterprise funds (a component of proprietary funds) are the same as the business-type activities we report in the government-wide statements but provide more detail and additional information, such as cash flows, for enterprise funds. The City uses internal service funds to report activities that provide supplies and services for other programs and activities within the City such as the Self Insurance Fund and Fleet Services Fund and it also accounts for inter-fund charges to the City’s departments for post-employment benefits in the Post Employment Fund.
THE CITY AS TRUSTEE Reporting the City’s Fiduciary Responsibilities All of the City’s fiduciary activities are reported in separate Statement of Fiduciary Assets and Liabilities. We exclude these activities from the City’s other financial statements because the City cannot use these assets to finance its operations. The City is responsible for ensuring that the assets reported in these funds are used for their intended purposes.

8
FINANCIAL ANALYSIS OF THE CITY AS A WHOLE Net position. The City’s net position for fiscal year 2016-17 compared to 2015-16 is shown in Table 1:
Table 1 Net Position (In Millions)
Governmental Business-Type
Activities Activities Total
2017 2016 2017 2016 2017 2016
Current and other assets $211.7 $168.0 $64.6 $65.7 $276.3 $233.7 Capital assets 328.9 322.7 157.6 159.0 486.5 481.7
Total assets 540.6 490.7 222.2 224.7 762.8 715.4
Deferred outflows of resources 78.1 31.2 15.8 5.4 93.9 36.6
Long-term debt (511.9) (452.7) (72.0) (58.7) (583.9) (511.4) Other liabilities (55.2) (13.8) (13.9) (14.6) (69.1) (28.4)
Total liabilities (567.1) (466.5) (85.9) (73.3) (653.0) (539.8)
Deferred inflows of resources (15.8) (29.2) (3.9) (7.4) (19.7) (36.6)
Net investment in capital assets 269.8 272.4 156.1 157.6 425.9 430.0 Restricted 46.0 49.3 - 46.0 49.3 Unrestricted (280.0) (295.5) (7.9) (8.2) (287.9) (303.7)
Net Position $35.8 $26.2 $148.2 $149.4 $184.0 $175.6
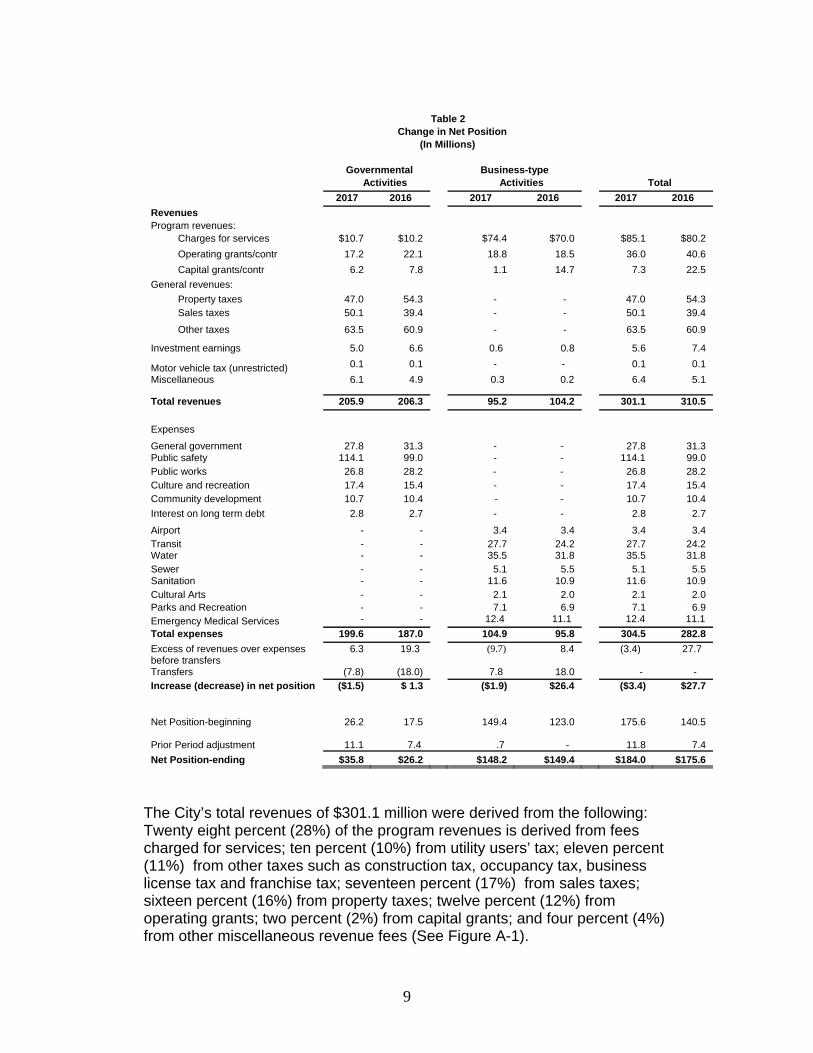
Net position of the City’s governmental activities amounted to $35.8 million. $269.8 million is invested in capital assets such as land, buildings, machinery, infrastructure, equipment and other improvements; $46.0 million is restricted for streets & highways, capital projects, community development, public safety and debt service; and (280.0) million is unrestricted. The net position of the City’s governmental activities increased by $9.6 million ($35.8 million compared to $26.2 million in 2015-16). Net position of the City’s business-type activities amounted to $148.2 million. $156.1 million is invested in capital assets, and ($7.9) million is unrestricted. The net position of the City’s business-type activities decreased by 1.2 million ($148.2 million compared to $149.4 million in 2015-16). Changes in net position. The City’s total revenues are $301.1 million and total costs of all programs and services are $304.5 million which amounted to a change in net position of ($3.4) million during the year (See Table 2).
9
Table 2
Change in Net Position
(In Millions) Governmental Business-type Activities Activities Total
2017 2016 2017 2016 2017 2016
Revenues Program revenues:
Charges for services $10.7 $10.2 $74.4 $70.0 $85.1 $80.2 Operating grants/contr 17.2 22.1 18.8 18.5 36.0 40.6 Capital grants/contr 6.2 7.8 1.1 14.7 7.3 22.5
General revenues: Property taxes 47.0 54.3 - - 47.0 54.3 Sales taxes 50.1 39.4 - - 50.1 39.4
Other taxes 63.5 60.9 - - 63.5 60.9
Investment earnings 5.0 6.6 0.6 0.8 5.6 7.4
Motor vehicle tax (unrestricted) 0.1 0.1 - - 0.1 0.1 Miscellaneous 6.1 4.9 0.3 0.2 6.4 5.1
Total revenues 205.9 206.3 95.2 104.2 301.1 310.5
Expenses General government 27.8 31.3 - - 27.8 31.3 Public safety 114.1 99.0 - - 114.1 99.0 Public works 26.8 28.2 - - 26.8 28.2 Culture and recreation 17.4 15.4 - - 17.4 15.4 Community development 10.7 10.4 - - 10.7 10.4 Interest on long term debt 2.8 2.7 - - 2.8 2.7
Airport - - 3.4 3.4 3.4 3.4 Transit - - 27.7 24.2 27.7 24.2 Water - - 35.5 31.8 35.5 31.8 Sewer - - 5.1 5.5 5.1 5.5 Sanitation - - 11.6 10.9 11.6 10.9 Cultural Arts - - 2.1 2.0 2.1 2.0 Parks and Recreation - - 7.1 6.9 7.1 6.9 Emergency Medical Services - - 12.4 11.1 12.4 11.1 Total expenses 199.6 187.0 104.9 95.8 304.5 282.8
Excess of revenues over expenses before transfers
6.3 19.3 (9.7) 8.4 (3.4) 27.7
Transfers (7.8) (18.0) 7.8 18.0 - - Increase (decrease) in net position ($1.5) $ 1.3 ($1.9) $26.4 ($3.4) $27.7
Net Position-beginning
26.2 17.5 149.4 123.0
175.6
140.5
Prior Period adjustment 11.1 7.4 .7 -
11.8
7.4 Net Position-ending $35.8 $26.2 $148.2 $149.4 $184.0 $175.6
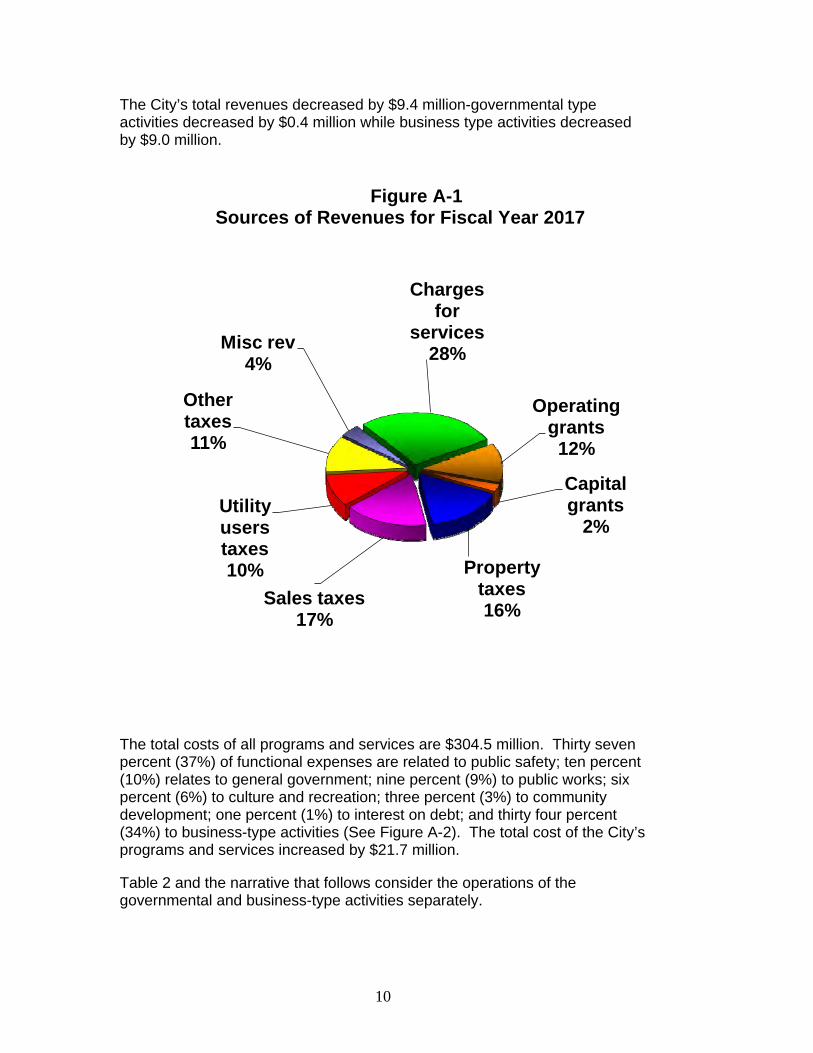
The City’s total revenues of $301.1 million were derived from the following: Twenty eight percent (28%) of the program revenues is derived from fees charged for services; ten percent (10%) from utility users’ tax; eleven percent (11%) from other taxes such as construction tax, occupancy tax, business license tax and franchise tax; seventeen percent (17%) from sales taxes; sixteen percent (16%) from property taxes; twelve percent (12%) from operating grants; two percent (2%) from capital grants; and four percent (4%) from other miscellaneous revenue fees (See Figure A-1).
10
The City’s total revenues decreased by $9.4 million-governmental type activities decreased by $0.4 million while business type activities decreased by $9.0 million. Figure A-1 Sources of Revenues for Fiscal Year 2017
Charges for
services28%
Operating grants12%
Capitalgrants
2%
Property taxes16%
Sales taxes17%
Utility users taxes10%
Other taxes11%
Misc rev4%
The total costs of all programs and services are $304.5 million. Thirty seven percent (37%) of functional expenses are related to public safety; ten percent (10%) relates to general government; nine percent (9%) to public works; six percent (6%) to culture and recreation; three percent (3%) to community development; one percent (1%) to interest on debt; and thirty four percent (34%) to business-type activities (See Figure A-2). The total cost of the City’s programs and services increased by $21.7 million. Table 2 and the narrative that follows consider the operations of the governmental and business-type activities separately.

11
Figure A-2 Functional Expenses for Fiscal Year 2017
Business type
activities34%
Public works
9%
Culture/recr6%
Interest1%
Public safety37%
Communitydevelopment
3%
Gen gov't10%
Governmental Activities The major revenues for the City’s governmental activities were property taxes, construction taxes and permits, business licenses/permits, utility users’ taxes, franchise fees, sales taxes and occupancy taxes. Revenues for the City’s governmental activities decrease by 0.2 percent or $0.4 million. This is primarily due to the decrease in operating and capital grants during the year. The total expenses of the governmental activities increase by 6.8 percent or $12.6 million. The increase is primarily due to the public safety pension expenses. Table 3 presents the cost of each of the City’s largest programs: public safety, public works, culture and recreation, general government, community development as well as each program’s net cost (total cost less fees generated by the activities and intergovernmental aid). The cost of all governmental activities this year was $199.6. $165.4 million of these activities were paid through City taxes, sales taxes, investment

12
earnings and other miscellaneous fees; $10.7 million was paid by those who directly benefited from the programs; and $23.5 million was funded by other governments and organizations that subsidized certain programs with operating grants and contributions.
Table 3 Governmental Activities (In Millions)
Total cost of services
Net cost of services
2017 2016 2017 2016
General government $27.8 $31.3 $23.9 $27.4 Public safety * 114.1 99.0 103.2 89.6 Public works 26.8 28.2 16.0 8.7 Culture and recreation 17.4 15.4 15.6 14.6 Community development 10.7 10.4 3.9 4.0 Others 2.8 2.7 2.8 2.7 Total $199.6 $187.0 $165.4 $147.0
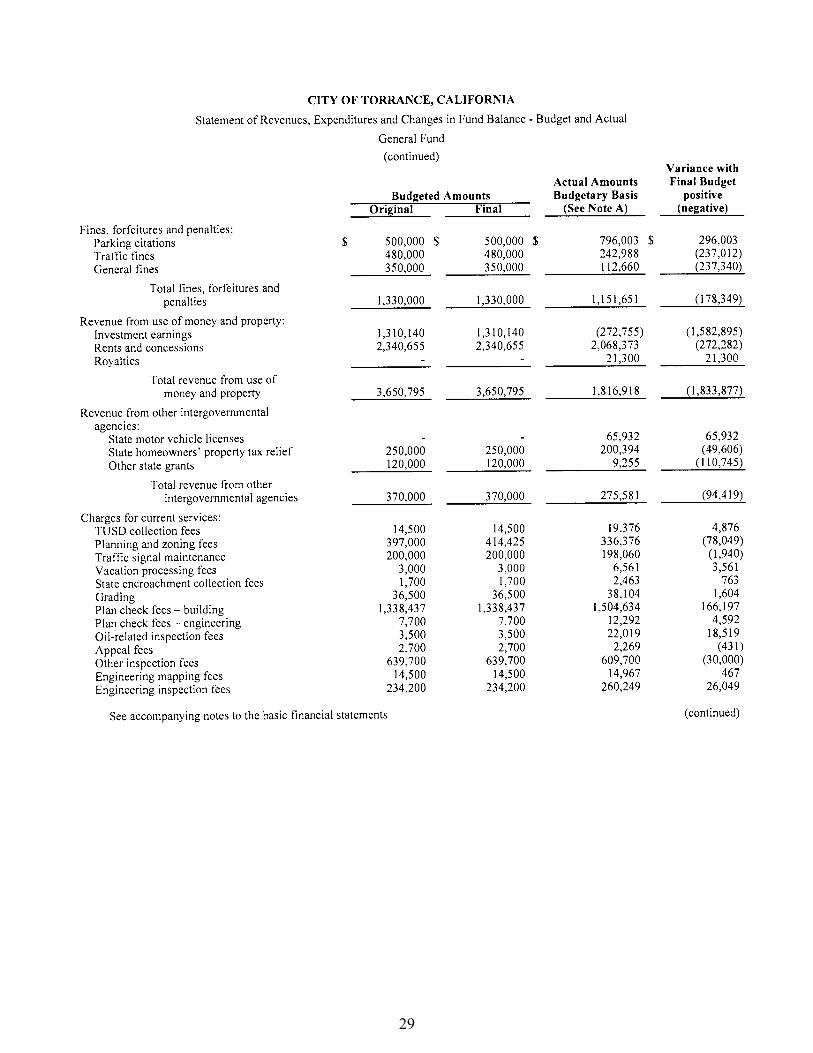
* This does not include the costs of Emergency Medical Services which is reported in the Enterprise Funds. Business-type Activities Revenues of the City’s business-type activities amounts to $95.2 million and expenses are $104.9 million (Refer to Table 2). The revenues are derived from service fees, operating and capital grants and contributions. Revenues decreased by $9.0 million ($95.2 million compared to $104.2 million in 2015-16). The excess of expenses over revenues before transfers is $9.7 million and with a net transfer in of $7.8 million, the business-type activities had a decrease of $1.9 million during the year. This was primarily due to a decrease in Transit capital grants this year. In fiscal year 2015-16 capital grants received was $14.7 million compared to $1.0 this year. There were 24 CNG buses that were purchased in 2015-16. FINANCIAL ANALYSIS OF THE CITY’S FUNDS
Governmental funds As the City completed the year, its governmental funds reported a combined
fund balance of $118.5 million. General Fund is the only fund reported as a major fund this year.
The decrease in General fund balance is $4.4 million this year primarily due to transfers to the Capital Improvement Fund for capital projects and transfers made to the Post Employment Fund.

13
Enterprise funds The Enterprise Funds provide the same basic type of information found in the
government-wide financial statements but in more detail. The major funds reported are the Transit System Fund, Water Fund, Sewer Fund and Emergency Medical Services Fund. The Transit Fund has a decrease in fund equity of $2.4 million this year due to the decrease in capital grants received this year. The Water fund equity increase by $1.8 million due to increase in water sales. Increase is due to the deactivation of the Level 2 Water supply shortage stage. The current water supply shortage stage was lowered to the more appropriate base level conservation restrictions due to the substantial improvement in California’s water supplies. The Sewer fund equity decreased by $1.3 million because of lower revenues received compared to the increasing cost of operations, maintenance and capital expenditures. On December 6, 2016, a public hearing was held and a resolution was adopted that approved a series of annual rate increase for a five year period (2017-2021) in the City’s sewer (wastewater) collection service rate effective January 1, 2017. The Emergency Services fund equity increase by $0.2 million primarily due to transfers received from the General Fund. General Fund Budgetary Highlights Over the course of the year, the City has made revisions to its budget upon City Council’s approval. The budget amendments fall into the following categories: Program modifications presented to the Finance and Governmental
Operations Committee during its first quarter and mid-year budget review presentations. Upon approval of the Finance and Governmental Operations Committee, these program modifications were taken to City Council for further approval.
Budget transfers within the respective General Fund departments are also
subject to approval by the department head and City Manager’s Office. First Quarter program modifications that were approved:
Adjustment of Community Services’ two .6 Maintenance workers to one 1.0 Lead Maintenance worker for the Park Services Turf Management Plan.
Restructuring of the Human Resources and Civil Service Divisions Approval of Debt Management Policy Finance Department Reorganization Restructuring of Fire Department General Services addition of 1.0 Staff Assistant
14
Mid-Year program modification that was approved:
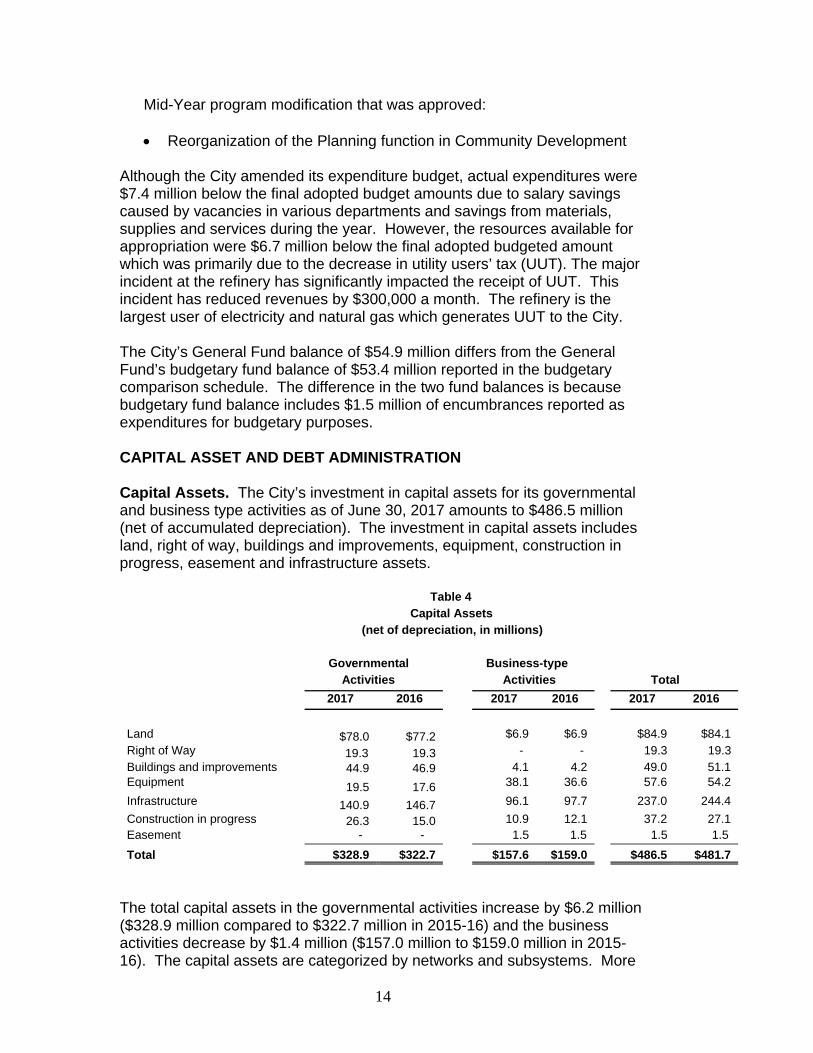
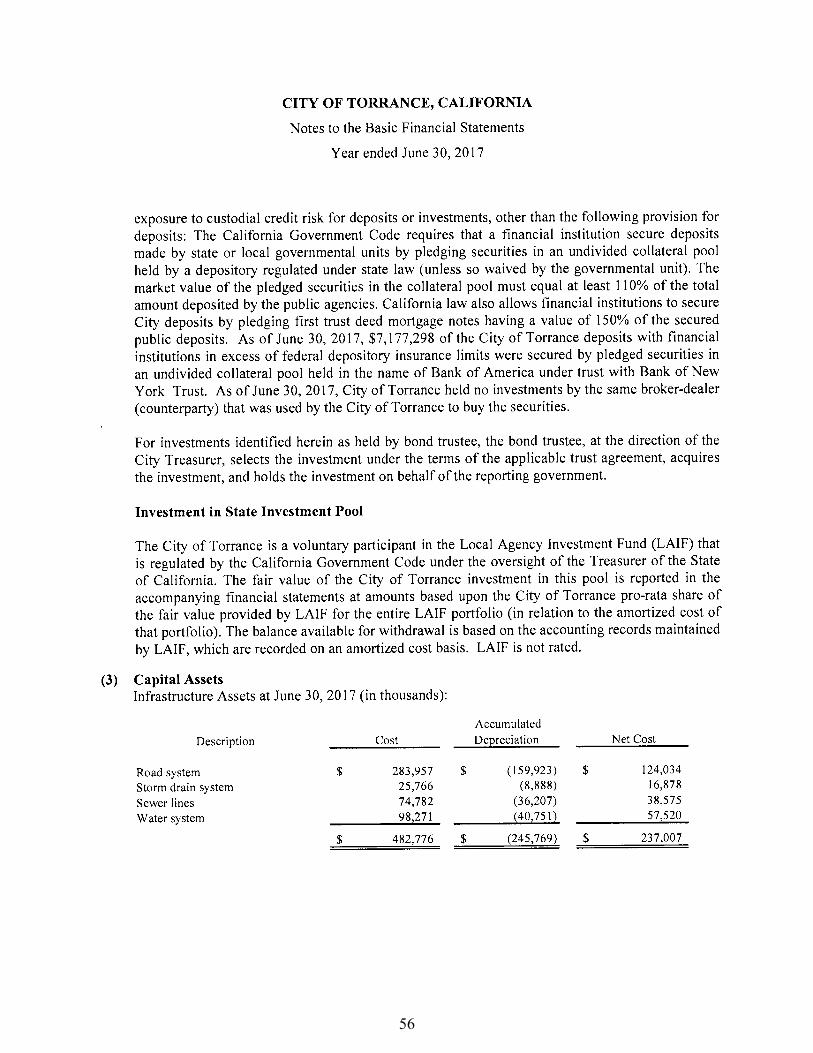
Reorganization of the Planning function in Community Development Although the City amended its expenditure budget, actual expenditures were $7.4 million below the final adopted budget amounts due to salary savings caused by vacancies in various departments and savings from materials, supplies and services during the year. However, the resources available for appropriation were $6.7 million below the final adopted budgeted amount which was primarily due to the decrease in utility users’ tax (UUT). The major incident at the refinery has significantly impacted the receipt of UUT. This incident has reduced revenues by $300,000 a month. The refinery is the largest user of electricity and natural gas which generates UUT to the City. The City’s General Fund balance of $54.9 million differs from the General Fund’s budgetary fund balance of $53.4 million reported in the budgetary comparison schedule. The difference in the two fund balances is because budgetary fund balance includes $1.5 million of encumbrances reported as expenditures for budgetary purposes. CAPITAL ASSET AND DEBT ADMINISTRATION Capital Assets. The City’s investment in capital assets for its governmental and business type activities as of June 30, 2017 amounts to $486.5 million (net of accumulated depreciation). The investment in capital assets includes land, right of way, buildings and improvements, equipment, construction in progress, easement and infrastructure assets.
Table 4 Capital Assets (net of depreciation, in millions) Governmental Business-type Activities Activities Total
2017 2016 2017 2016 2017 2016
Land $78.0 $77.2 $6.9 $6.9 $84.9 $84.1 Right of Way 19.3 19.3 - - 19.3 19.3 Buildings and improvements 44.9 46.9 4.1 4.2 49.0 51.1 Equipment 19.5 17.6 38.1 36.6 57.6 54.2 Infrastructure 140.9 146.7 96.1 97.7 237.0 244.4 Construction in progress 26.3 15.0 10.9 12.1 37.2 27.1 Easement - - 1.5 1.5 1.5 1.5
Total $328.9 $322.7 $157.6 $159.0 $486.5 $481.7
The total capital assets in the governmental activities increase by $6.2 million ($328.9 million compared to $322.7 million in 2015-16) and the business activities decrease by $1.4 million ($157.0 million to $159.0 million in 2015-16). The capital assets are categorized by networks and subsystems. More

15
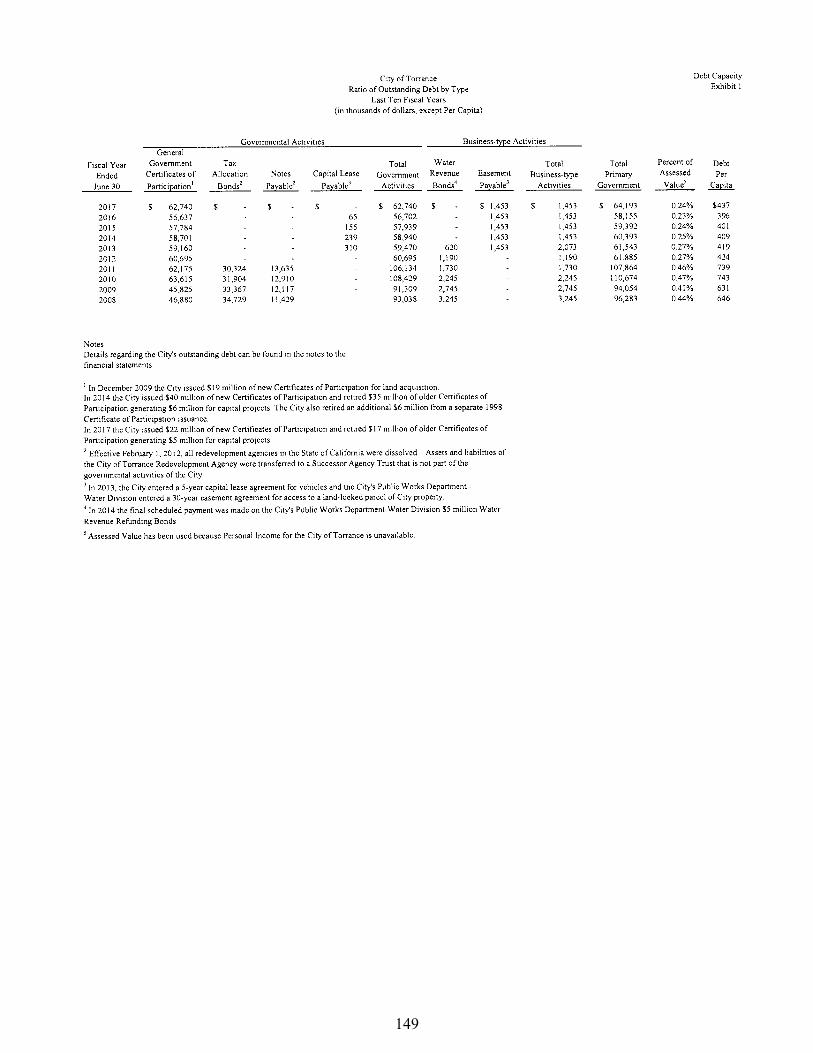
detail information about the City’s capital assets and its activities during the year is shown in Note 3 of the notes to the basic financial statements. Long-term debt. At the end of the fiscal year, the City had total bonded debt outstanding of $60.5 million as shown in Table 5. More detailed information about the City’s long-term liabilities is presented in Notes 6 and 7 of the notes to the basic financial statements.
Table 5 Outstanding Debt (In Millions) Governmental Business-type Activities Activities Total
2017 2016 2017 2016 2017 2016
Revenue bonds and notes (backed by specific tax and fee revenues) $60.5 $56.0 $ - $ - $60.5 $56.0
During fiscal year 2016-17 the total debt of the City increased by $4.5 million. The increase is primarily due to the Public Property Financing issuance of $22.1 million 2016 Refunding Certificates of Participation that refinance the 2009 Certificates of Participation issued by the Torrance Public Financing Authority that was used to finance the acquisition of the 15 acres of real property for a Transit Regional Center. Portion of the 2016 proceeds will be used for the construction of capital improvements related to an emergency operations center and any other public capital improvements selected by the City. The City’s General Fund rating for the 2014 and 2016 Certificates of Participation is “AA” by Standard and Poors. Per City Charter Article 4 Section 412, the City shall not incur any bonded indebtedness for public improvements, which shall in the aggregate exceed 3.75% of the assessed value of all the real and personal property of the City. The current debt limitation for the City is $987.1 million which is in excess of the City’s outstanding debt. ECONOMIC FACTORS AND NEXT YEAR’S BUDGETS AND RATES Key Highlights of the 2017-18 Budget The City Council adopted in May 23, 2017, the first year (2017-18 fiscal year) of the Two Year Operating budget. This budget is balanced and forecasts a balance budget throughout the next five years. The five year projection reflects revenue growth between 2.2% to 3.5% which is consistent with the five-year forecast presented in 2015-16. Additional budget projections through fiscal year 2020-21 are also balanced.

16
Council also approved the second year appropriation of $24.3 million of the City’s Five-Year Capital Budget Plan. The Capital Plan contains two separate actions plans:
1) the Facilities, Equipment, Automation Plan (FEAP) and 2) the Infrastructure Action Plan (IAP).
The City has been highly successful in competing for tens of millions of dollars in Measure R funds and federal grants. The benefits enjoyed from the award of these funds and grants are the Crenshaw Boulevard Intersection Improvements and 208th Street Extension, 186th Street Improvements at Columbia Park, Crenshaw Boulevard Rehabilitation (Sepulveda Blvd to Skypark Dr Pacific Coast Highway to South City Limit and 182nd Street to North City Limit, ), Intersection Improvements-Hawthorne Boulevard Pacific Coast Highway), Sidewalk Repair for handicap accessibility, Anza/Vista Montana/Pacific Coast Highway Intersection Improvements, I-405 at 182nd Street/Crenshaw Boulevard Operational Improvements and the upcoming Regional Transit Terminal Center. Budget Issues: Self-Insurance Fund The budget increases the General Fund contribution by an additional $100,000 annually for the 2017-18 through the five year forecast Workforce: The City is experiencing an increase in employee retirements and staff turnover as the current workforce ages. Efforts toward recruitment indicate a shortage of viable qualified candidates. Employee Memorandum of Understanding: Current memorandums of understanding expired in June 2017 for Police and Fire. All Miscellaneous group memorandums will expire in December of 2017. Contract negotiations are in process. Employee Pension:
The City is primarily a service organization with 76% of the General Fund budget in labor
Pension costs are based on the state CalPERS actuarial evaluation. Recent revisions have impacted City pension costs as follows: - Decreasing return on investments by 0.25% from 7.75% to 7.5%,
then to 7.0% in the next 3 fiscal years. - Limiting amortization to no greater than 30 years (fixed). - Increasing mortality age assumptions.
CalPERS pension costs as percentage of the budget is 15.6%. This Projected to peak at 18.4% of budget in the 2022-23 fiscal year. The City also makes additional contributions to reduce pension liabilities
The City has implemented “tiered” pension benefits that transfers more of pension cost to new employees while reducing some pension Benefits. This plan currently realizes savings of over $2 million annually which will increase as new employees are hired.

17
Other Post-Employment Benefits (OPEB): Other Post-Employment Benefits continues to be fully funded OPEB are mainly for health benefits for retirees of roughly $115
a month for retired Miscellaneous employees and up to an additional $130 to $225 a month for Fire and Police retirees.
Third Party Non-Revocable Trust: The City will be entering a third party non-revocable trust for PERS pension obligations to provide budgetary flexibility and diversification of pension assets from PERS. Accumulated interest earnings could be used to offset current pension expense. The use of principal can additionally be used for the City’s contribution to reduce the City’s annual pension expenses. CONTACTING THE CITY’S FINANCIAL MANAGEMENT
This financial report is designed to provide our citizens, taxpayers, customers, and investors and creditors with a general overview of the City’s finances and to demonstrate the City’s accountability for the money it receives. If you have any questions, about this report or need additional financial information, contact the City of Torrance Finance Department, 3031 Torrance Blvd., Torrance, California 90503.

18
(This page intentionally left blank)
Basic FinancialStatem
entsBasicFinancial Statements
OFTorranceCity
v D E P A R T M E N T O F F I N A N C E v
City of Torrance Veteran’s Memorial

Governm
ent – Wide
Financial Statements
Government - WideFinancial Statements
OFTorranceCity
v D E P A R T M E N T O F F I N A N C E v
Torrance Police Station


19

20

21

22

Governmental FundFinancial Statements
OFTorranceCity
v D E P A R T M E N T O F F I N A N C E v
Madrona Marsh
Governm
ental Fund Financial Statem
ents


23

24

25
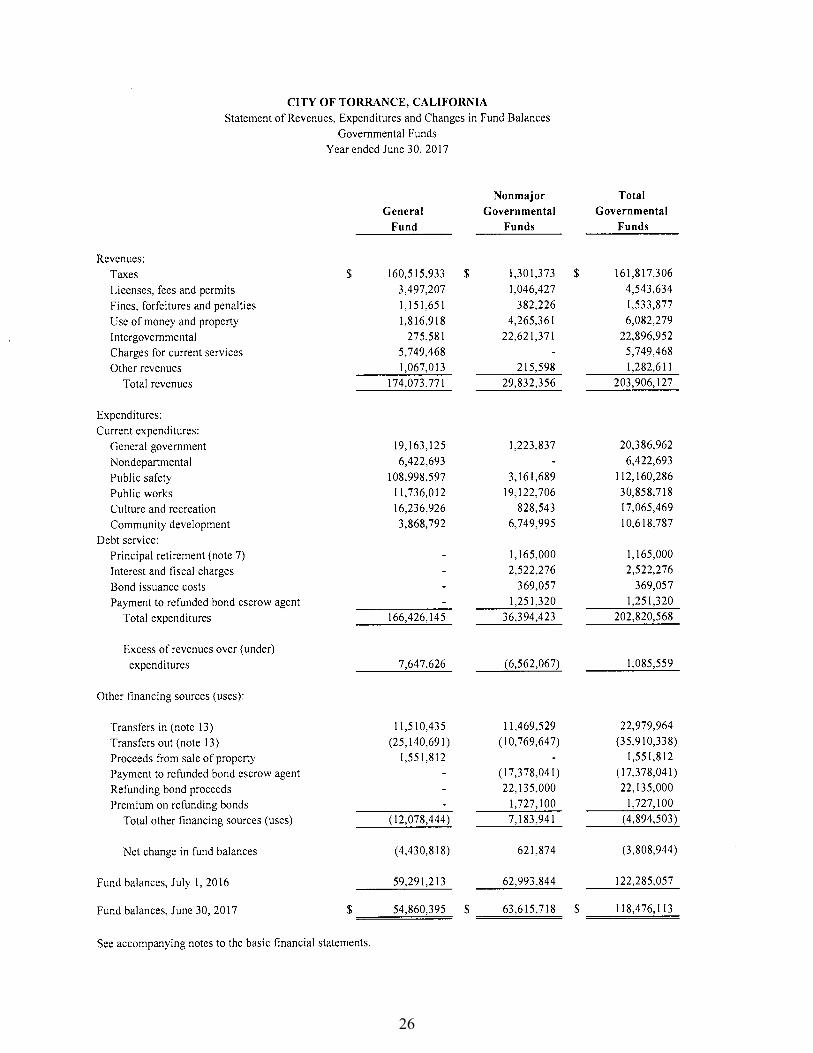
26

27
28
29

30

31

32

Proprietary FundFinancial Statem
ents
OFTorranceCity
Proprietary FundFinancial Statements
v D E P A R T M E N T O F F I N A N C E v
Zamperini Field - Torrance Municipal Airport


33

34

35

36

Fiduciary FundFinancial Statem
ents
OFTorranceCity
Fiduciary FundFinancial Statements
v D E P A R T M E N T O F F I N A N C E v
Japanese Garden


37

38

Notes to B
asicFinancial Statem
ents
OFTorranceCity
Notes to BasicFinancial Statements
v D E P A R T M E N T O F F I N A N C E v
Katy Geissert Library


39

40

41
42

43

44
45

46

47

48

49

50

51

52

53

54

55
56

57

58

59

60

61

62

63

64

65

66

67

68

69

70

71

72

73

74

75

76

77

78

79

80

81

82

83

84

85
86

87
88

89

90

91

92
93
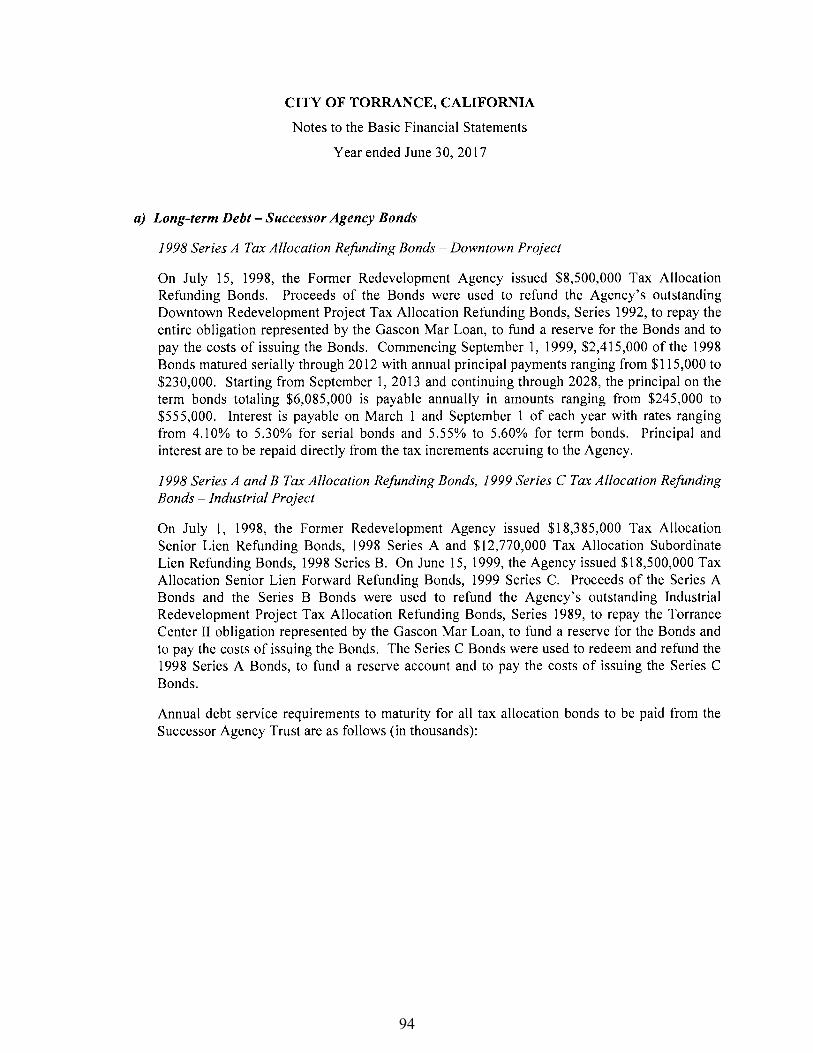
94

95

96

97

98

Required Supplem
entaryInform
ation
OFTorranceCity
RequiredSupplementary Information
v D E P A R T M E N T O F F I N A N C E v
Wilson Park

99

100

101

102

103

104

105

106

Com
bining FinancialStatem
ents & Schedules
OFTorranceCity
Combining FinancialStatements and Schedules
v D E P A R T M E N T O F F I N A N C E v
Armed Forces Day Parade


OFTorranceCity
Non-MajorGovernmental Funds
v D E P A R T M E N T O F F I N A N C E v
Stanley Remelmeyer Cable Building
Non-M
ajorG
overnmental Funds


107
108

OFTorranceCity
Torrance Cultural Arts Center
Special Revenue Funds are used to account for the proceeds of specific revenue sources (other than expendable and nonexpendable trusts) that are restricted by law to expenditure for specified purposes.
The PARKS AND RECREATION FACILITIES FUND is used to account for the revenues and expenditures in connection with the City’s park and recreation facilities tax.
The RENTAL ASSISTANCE PROGRAM FUND is used to account for the operations of the Federal rental assistance program which provides relief for lower income families.
The SEISMIC EDUCATION FUND is used to account for the training and developing of the City’s staff on seismic activities.
The STREET LIGHTING ASSESSMENT FUND is used to account for the revenues and expenditures associated with the maintenance and use of the City’s street lighting system.
The DRAINAGE IMPROVEMENT FUND is used to account for the revenues and expenditures in connection with the improvement of the City’s drainage system.
The PARKS REHABILITATION AND OPEN SPACE FUND is used to account for the resources generated by a fee imposed on new dwelling construction and certain remodeling of dwellings.
The PROPOSITION A FUND is used to develop and improve local public transit, paratransit and related transportation infrastucture.
The PROPOSITION C FUND is used to improve transit service and operations, reduce traffic congestion, improve air quality, efficiently operate and improve the condition of the streets and freeways utilized by public transit and reduce foreign fuel dependence.
Non-Major Special Revenue FundsThe MEASURE R LOCAL RETURN AND HIGHWAY FUND is used for planning, right of way acquisitions, engineering, administration, construction, improvement, maintenance, and operation of public streets and roads, highways and exclusive public mass transit guide ways.
The VANPOOL RIDESHARE FUND is used to account for rideshare revenues from Prop C and fares, and to account for rideshare expenses.
The BICYCLE TRANSPORTATION FUND is used to ac-count for the revenues and expenditures in connection with the City’s bicycle transportation program.
The ANIMAL CONTROL FUND is used to account for animal licenses, permits and operations of the Animal Control Program.
The LOW MOD HOUSING FUND is used to account for the revenues and expenditures in connection with developing and managing affordable housing for low, very low and extreme low income households.
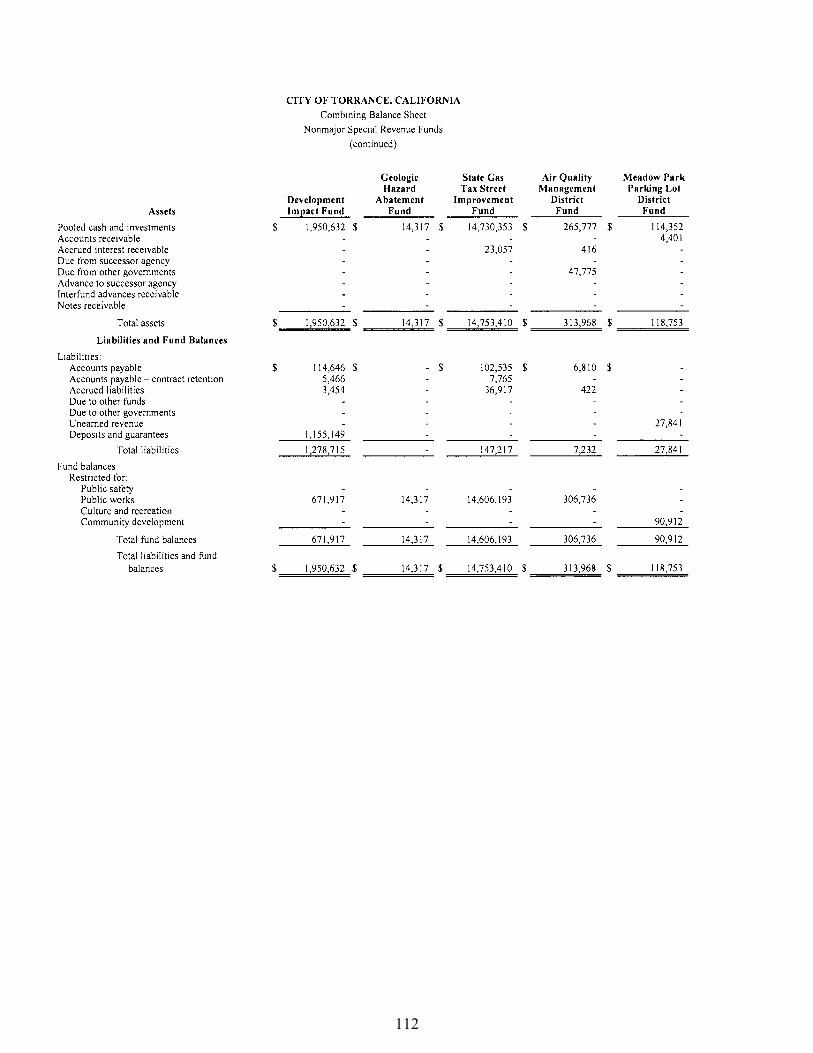
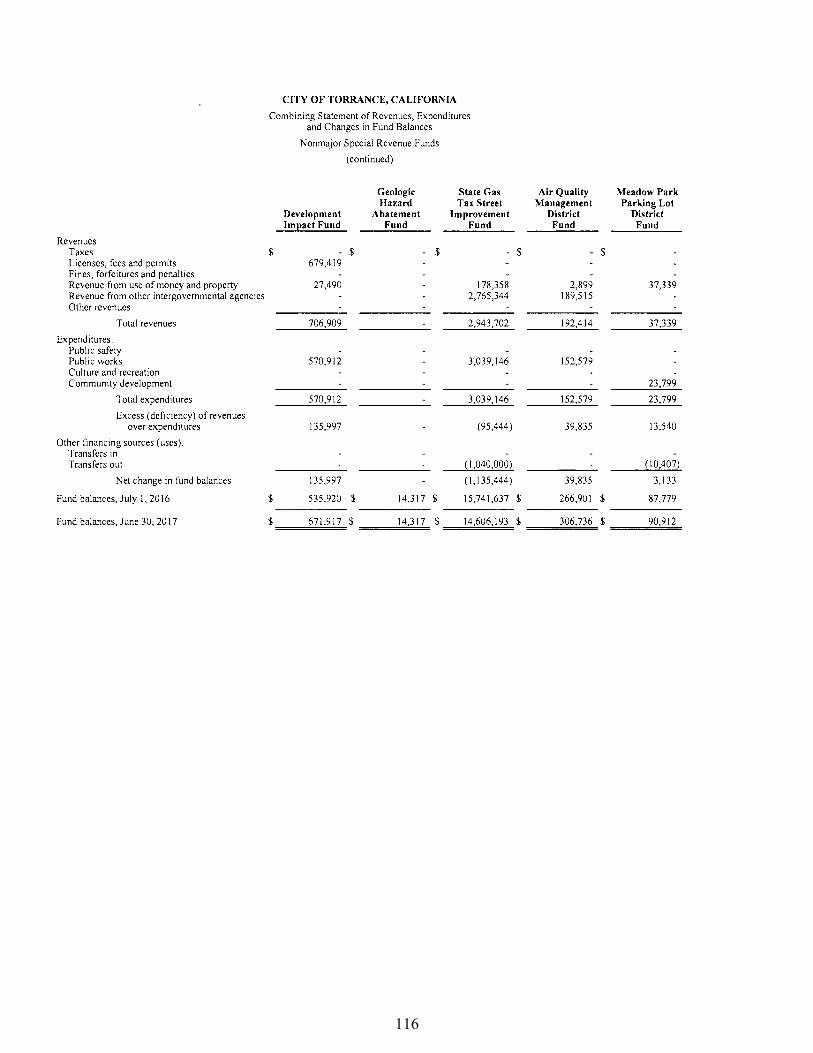
The DEVELOPMENT IMPACT FUND is used to account for the transportation, utility undergrounding, sewer, storm drain, Police & Fire impact fees that will be used to finance facilities identified by the study’s needs list.
The GEOLOGIC HAZARD ABATEMENT FUND is used to account for the costs of installation and construction of improvements necessary to the prevention, mitigation, abatement, or control of a geologic hazard within the City.
The STATE GAS TAX STREET IMPROVEMENT FUND is used to account for the State gasoline tax revenues received from the State which are used for maintenance and improvement of the City’s streets.
The AIR QUALITY MANAGEMENT DISTRICT FUND is used to account for City compliance with air quality management regulations.
The MEADOW PARK PARKING LOT DISTRICT FUND is used to account for the revenues and expenditures generated through the cleaning and maintenance of the Meadow Park parking lot district.
The POLICE INMATE WELFARE FUND is comprised of any money, refund, rebate or commission received from a telephone company or pay telephone provider when the money is attributable to the use of pay telephones which are primarily used by inmates while incarcerated.
The GRANTS AND DONATIONS FUND is used to account for monies received for the purpose of providing educational, cultural and recreational needs of the community and for specific infrastructure projects.
The COMMUNITY DEVELOPMENT BLOCK GRANT FUND is used to account for the funds allocated by the US Department of Housing and Urban Development to the City for community and infrastructure development.
The FEDERAL HOUSING AND REHABILITATION FUND is used to account for the activities of the Federal Housing and Rehabilitation Grant.
The ASSET FORFEITURE FUND is used to account for resources used solely for investigation, detection and prosecution of criminal activities. This includes the purchase of equipment, investigation training, and developing/acquir-ing personnel resources.
The PROPOSITION 1B FUND is used to account for monies received from the State out of the State general obligation bonds for the purpose of providing roadway extension, rehabilitation and reconstruction.
The DNA SAMPLING FUND is used to account for DNA sampling of arrestees that is reimbursed by the State.
v D E P A R T M E N T O F F I N A N C E v
Non-M
ajorSpecial R
evenue Funds


109

110

111
112

113

114

115
116

117

118

OFTorranceCity
Torrance Beach
Non-Major Capital Project Funds
v D E P A R T M E N T O F F I N A N C E v
The Capital Project funds are used to account for resources used for the acquisition or construction of major capital facilities, except for those financed by certain Special Revenue and Proprietary Funds.
The CAPITAL IMPROVEMENT FUND is used to account for construction of street improvements, storm drain and building improvements and other capital projects within the City.
The TORRANCE PUBLIC PROPERTY FINANCING CAPITAL PROJECT FUND is used to account for construction of capital improvements related to an emergency operation center and any other public capital improvements selected by the city.
Non-M
ajorC
apital Project Funds


119

120

OFTorranceCity
Wilson Park
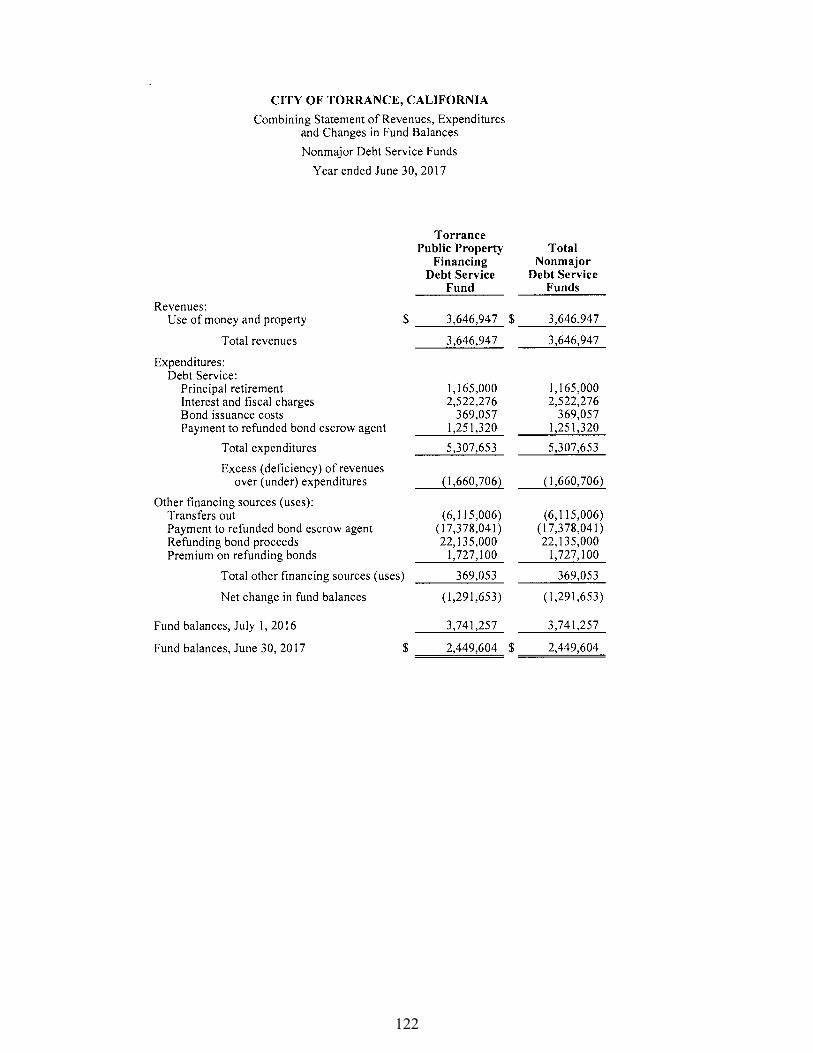
The Debt Service funds are used to account for the accumulation of resources for, and the payment of, principal and interest on specific long-term obligations of the City.
The TORRANCE PUBLIC PROPERTY FINANCING DEBT SERVICE FUND is used to account for debt service related to certificates of participation issued to provide for the refinance of a lease obligation that financed certain facilities and capital improvements within the City and the acquisition of real property for a regional transit center.
Non-Major Debt Service Funds
v D E P A R T M E N T O F F I N A N C E v
Non-M
ajorD
ebt Service Funds


121
122

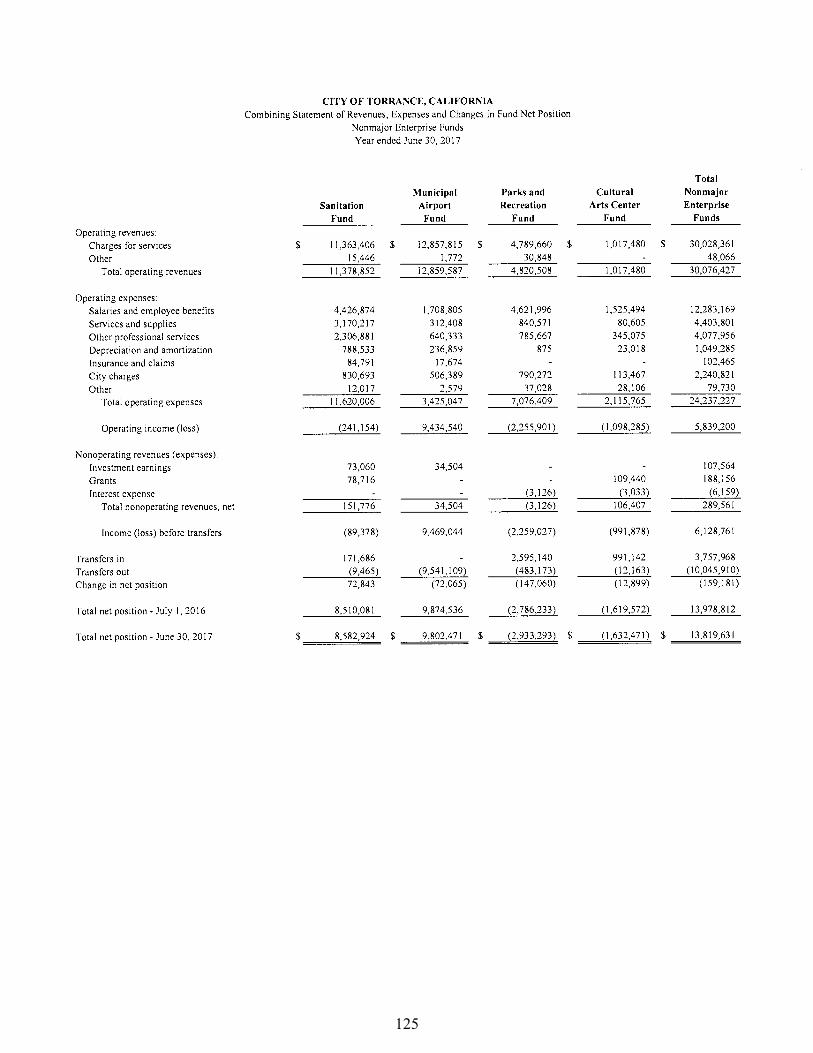
Non-MajorEnterprise Funds
OFTorranceCity
v D E P A R T M E N T O F F I N A N C E v
James Armstrong Theatre
Non-M
ajorEnterprise Funds


123

124
125

126

Internal Service Funds
OFTorranceCity
v D E P A R T M E N T O F F I N A N C E v
Fleet
The Internal Service funds are used to account for financing of goods or services provided by one City department to other departments of the City and to other governmental units on a cost-reimbursement basis.
The SELF-INSURANCE FUND is used to finance and account for the City’s risk management and self-insurance programs.
The FLEET SERVICES FUND is used to finance and account for the City’s vehicular equipment.
The POSTEMPLOYMENT/COMP ABSENCES FUND is used to account for interfund charges to the City’s departments for postemployment benefits and compensated absences.
Internal Service Funds


127

128

129

130

OFTorranceCity
City’s Sports Complex
The Agency funds are used to account for assets held by the City in a fiduciary capacity for individuals, governmental entities and others.
Agency FundsThe SPECIAL DEPOSITS FUND is used to account for private donations, deposits and other funds disbursements on projects of the general government.
The FLEXIBLE BENEFITS FUND is used to account for unspent pre-tax benefits funds collected from the participating employees of the City.
The ENVIRONMENTAL TRUST FUND is used to account for the cost of analysis and evalua-tion of air pollutants potentially derived from refineries.
v D E P A R T M E N T O F F I N A N C E v
The PROPERTY ROOM EVIDENCE FUND is used to account for the safekeeping and disbursement of evidence held in the Police property room.
The TORRANCE TOURISM BUSI- NESS IMPROVEMENT DISTRICT FUND is used to account for funds contributed by lodging businesses to market the area, including promotional activities, special events, and programs in order to increase business.
Agency Funds


131

132

133

134

Fiscal Year Ended June 30, 2017
(Not covered by Independent Auditors’ Report)
FinancialCOMPREHENSIVE ANNUAL
OFTorranceCity
R E P O R T
v S T A T I S T I C A L S E C T I O N v
Statistical Section


135

136

137

138

139
140

141

142

143

144

145

146

147

148
149

150

151

152

153

154

155

156

157
158

Fiscal Year Ended June 30, 2017
(Not covered by Independent Auditors’ Report)
FinancialCOMPREHENSIVE ANNUAL
OFTorranceCity
R E P O R T
v O T H E R S U P P L E M E N T A R Y I N F O R M A T I O N v
Pacific Electric Railway - El Prado Bridge
Other Supplem
entaryInform
ation


159

160

161

162

163

164

165

166

167

168
169

170