city of troy financial presentation
DESCRIPTION
Troy Mayor Patrick Madden led a public forum in the city's 2015 and first quarter 2016 financial reports.TRANSCRIPT

City of Troy, New York
1

Overview Of Presentation
• This presentation will review the following three topics in the General Fund: – A brief review of the 2015 Annual Update Document filed with the New York State
Comptroller’s Office of all three operating funds
– A macro level review of the revenues and expenditures as of March 31, 2016 in all three operating funds
– Areas of potential concern going forward in 2016 within the General Fund
• This presentation is to be used as supplement to the written report issued to City Council on April 15, 2016.
• All totals for 2015 & 2016 are unaudited as of the date of this presentation but have been reviewed thoroughly by the City Comptroller’s Office.
2

City of Troy, New York
Fiscal Year 2015
General Fund
3

Overview Of 2015 General Fund Revenues & Expenditures
2015 Actual 2015 Adjusted Budget
Difference
Revenues 65,982,216 66,796,006 (813,790)
Expenditures 65,287,704 66,796,006 (1,508,302)
Difference 694,512 0 694,512
64,500,000
65,000,000
65,500,000
66,000,000
66,500,000
67,000,000
Revenues Expenditures
Actual
Budget
60,000,000
62,000,000
64,000,000
66,000,000
Revenues
Expenditures
4

2011 – 2015 General Fund Revenues
64,249,403
65,671,462
64,050,448
64,481,396
65,982,216
63,500,000
64,500,000
65,500,000
66,500,000
2011 2012 2013 2014 2015
5
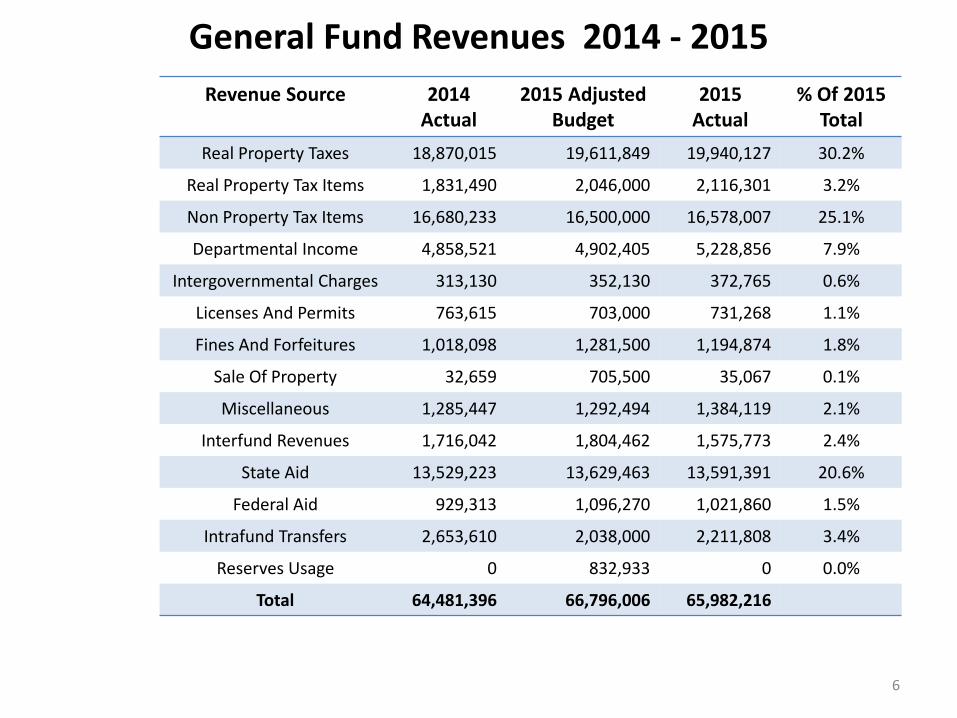
General Fund Revenues 2014 - 2015
Revenue Source 2014 Actual
2015 Adjusted Budget
2015 Actual
% Of 2015 Total
Real Property Taxes 18,870,015 19,611,849 19,940,127 30.2%
Real Property Tax Items 1,831,490 2,046,000 2,116,301 3.2%
Non Property Tax Items 16,680,233 16,500,000 16,578,007 25.1%
Departmental Income 4,858,521 4,902,405 5,228,856 7.9%
Intergovernmental Charges 313,130 352,130 372,765 0.6%
Licenses And Permits 763,615 703,000 731,268 1.1%
Fines And Forfeitures 1,018,098 1,281,500 1,194,874 1.8%
Sale Of Property 32,659 705,500 35,067 0.1%
Miscellaneous 1,285,447 1,292,494 1,384,119 2.1%
Interfund Revenues 1,716,042 1,804,462 1,575,773 2.4%
State Aid 13,529,223 13,629,463 13,591,391 20.6%
Federal Aid 929,313 1,096,270 1,021,860 1.5%
Intrafund Transfers 2,653,610 2,038,000 2,211,808 3.4%
Reserves Usage 0 832,933 0 0.0%
Total 64,481,396 66,796,006 65,982,216
6

2011 – 2015 General Fund Expenditures
66,271,022
65,691,794
64,890,866
65,516,784
65,287,704
64,500,000
65,000,000
65,500,000
66,000,000
66,500,000
2011 2012 2013 2014 2015
7
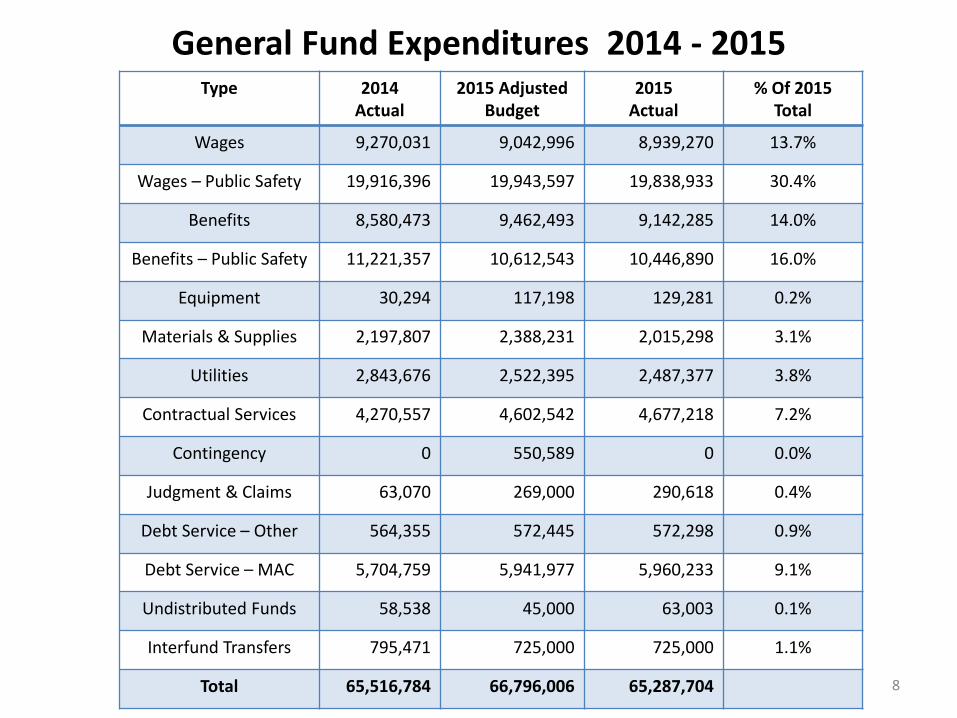
General Fund Expenditures 2014 - 2015 Type 2014
Actual 2015 Adjusted
Budget 2015
Actual % Of 2015
Total
Wages 9,270,031 9,042,996 8,939,270 13.7%
Wages – Public Safety 19,916,396 19,943,597 19,838,933 30.4%
Benefits 8,580,473 9,462,493 9,142,285 14.0%
Benefits – Public Safety 11,221,357 10,612,543 10,446,890 16.0%
Equipment 30,294 117,198 129,281 0.2%
Materials & Supplies 2,197,807 2,388,231 2,015,298 3.1%
Utilities 2,843,676 2,522,395 2,487,377 3.8%
Contractual Services 4,270,557 4,602,542 4,677,218 7.2%
Contingency 0 550,589 0 0.0%
Judgment & Claims 63,070 269,000 290,618 0.4%
Debt Service – Other 564,355 572,445 572,298 0.9%
Debt Service – MAC 5,704,759 5,941,977 5,960,233 9.1%
Undistributed Funds 58,538 45,000 63,003 0.1%
Interfund Transfers 795,471 725,000 725,000 1.1%
Total 65,516,784 66,796,006 65,287,704 8

General Fund Balance As Of December 31, 2015
2014 2015 Difference
Beginning Balance 12,933,141 11,897,752 (1,035,389)
Add (Surplus) / Less (Deficit) (1,035,389) 694,512 1,639,901
Ending Balance 11,897,752 12,592,264 694,512
• The AUD calculates a surplus / deficit based on total actual revenues received during the fiscal year and does not account for any budgeted use of reserves as revenues.
9

2015 General Fund Balance
Classification Example 2014 2015
Nonspendable Fund Balance Prepaid Expenses 30,490 1,341,884
Restricted Fund Balance Reserves 10,636,895 11,269,611
Committed Fund Balance Restricted Monies Passed By City Council 0 0
Assigned Fund Balance Encumbrances 153,625 72,593
Unassigned Fund Balance Unrestricted Monies 1,076,473 (91,824)
Total Fund Balance 11,897,753 12,592,264
14,163,641
13,773,568
12,933,150
11,897,753
12,592,264
11,500,000
12,500,000
13,500,000
14,500,000
2011 2012 2013 2014 2015 10

City of Troy, New York
Fiscal Year 2015
Water Fund
11

Overview Of 2015 Water Fund Revenues & Expenditures
2015 Actual 2015 Adjusted Budget
Difference
Revenues 13,421,427 12,872,636 548,791
Expenditures 11,767,265 12,872,636 (1,105,371)
Difference 1,654,162 0 1,654,162
10,500,000
11,500,000
12,500,000
13,500,000
Revenues Expenditures
Actual
Budget
5,000,000
8,000,000
11,000,000
14,000,000
Revenues
Expenditures
12

2011 – 2015 Water Fund Revenues
12,233,280
12,737,059
12,056,619
12,928,460
13,421,427
12,000,000
12,250,000
12,500,000
12,750,000
13,000,000
13,250,000
13,500,000
2011 2012 2013 2014 2015
13

Water Fund Revenues 2014 - 2015
Revenue Source 2014 Actual
2015 Adjusted Budget
2015 Actual
% Of 2015 Total
Metered Sales – City Of Troy 4,561,053 4,750,000 4,560,360 34.0%
Metered Sales – Outside Communities 7,186,561 7,015,562 7,734,335 57.6%
Unmetered Sales 394,829 260,000 283,329 2.1%
Use Of Money & Property 212,441 210,000 245,584 1.8%
Permits 12,265 12,000 15,030 0.1%
Sale Of Property 89,182 51,000 47,767 0.4%
Miscellaneous 93,750 70,705 102,452 0.8%
Interfund Revenues 327,000 327,000 327,000 2.4%
State Aid 12,092 0 26,392 0.2%
Federal Aid 36,275 0 79,177 0.6%
Intrafund Transfers 3,011 0 0 0.0%
Reserves Usage 0 176,369 0 0.0%
Total 12,928,460 12,872,636 13,421,427
14

2011 – 2015 Water Fund Expenditures
11,928,899
13,165,434
16,898,502
14,240,267
11,767,265
11,000,000
12,500,000
14,000,000
15,500,000
17,000,000
2011 2012 2013 2014 2015
15

Water Fund Expenditures 2014 - 2015
Type 2014 Actual
2015 Adjusted Budget
2015 Actual
% Of 2015 Total
Wages 2,969,345 3,242,523 3,017,663 25.7%
Benefits 1,709,623 1,646,764 1,580,585 13.4%
Equipment 10,623 131,983 40,462 0.3%
Materials & Supplies 1,933,913 2,090,807 1,731,092 14.7%
Utilities 416,744 458,500 323,896 2.8%
Contractual Services 1,579,700 1,819,492 1,610,885 13.7%
Services Due Other Funds 934,209 934,209 934,209 7.9%
Intrafund Transfers 2,472,000 1,972,000 1,972,000 16.8%
Debt Service 574,110 576,358 556,473 4.7%
Capital Fund Transfer 1,640,000 0 0 0.0%
Total 14,240,267 12,872,636 11,767,265
16

Historical Review Of Transfers Between Water & General Funds
Year Amount Passed In Original Budget
Actual Annual Total Of Transfer
Difference
2010 – Services 759,209 759,209 0
2010 – Profits 1,472,000 1,472,000 0
2011 – Services 759,209 759,209 0
2011 – Profits 1,972,000 1,972,000 0
2012 – Services 759,209 759,209 0
2012 – Profits 1,972,000 1,972,000 0
2013 – Services 759,209 759,209 0
2013 – Profits 1,972,000 1,972,000 0
2014 – Services 934,209 934,209 0
2014 – Profits 2,472,000 2,472,000 0
2015 – Services 934,209 934,209 0
2015 – Profits 1,972,000 1,972,000 0
17

Water Fund Balance As Of December 31, 2015 2014 2015
Beginning Balance 4,347,204 3,035,397
Add: Revenues 12,928,460 13,421,427
Less: Operating Expenditures (10,128,267) (9,795,265)
Operating Surplus (Deficit) 2,800,193 3,626,162
Less: Interfund Transfers To General (2,472,000) (1,972,000)
Less: Transfers To Capital Fund (1,640,000) 0
Ending Balance 3,035,397 4,689,559
• The AUD calculates a surplus / deficit based on total actual revenues received during the fiscal year and does not account for any budgeted use of reserves as revenues.
18

City of Troy, New York
Fiscal Year 2015
Sewer Fund
19

Overview Of 2015 Sewer Fund Revenues & Expenditures
2015 Actual 2015 Adjusted Budget
Difference
Revenues 3,911,787 4,547,176 (635,389)
Expenditures 4,005,894 4,547,176 (541,282)
Difference (94,107) 0 (94,107)
3,000,000
3,400,000
3,800,000
4,200,000
4,600,000
Revenues Expenditures
Actual
Budget
3,500,000
3,600,000
3,700,000
3,800,000
3,900,000
4,000,000
4,100,000
Revenues
Expenditures
20

2011 – 2015 Sewer Fund Revenues
2,191,260
2,308,668
2,904,752
3,567,496
3,911,787
2,000,000
2,500,000
3,000,000
3,500,000
4,000,000
2011 2012 2013 2014 2015
21

Sewer Fund Revenues 2014 - 2015
Revenue Source 2014 Actual
2015 Adjusted Budget
2015 Actual
% Of 2015 Total
Sewer Rents – City Of Troy 2,929,672 4,037,500 3,607,110 92.2%
Sewer Rents – Rensselaer County 141,054 141,053 143,875 3.7%
Sewer Charges 121,333 103,100 135,422 3.5%
Use Of Money & Property 152 1,000 253 0.0%
Miscellaneous 23,137 27,221 25,127 0.6%
State Aid 88,037 0 0 0.0%
Federal Aid 264,111 0 0 0.0%
Reserves Usage 0 237,302 0 0.0%
Total 3,567,496 4,547,176 3,911,787
22
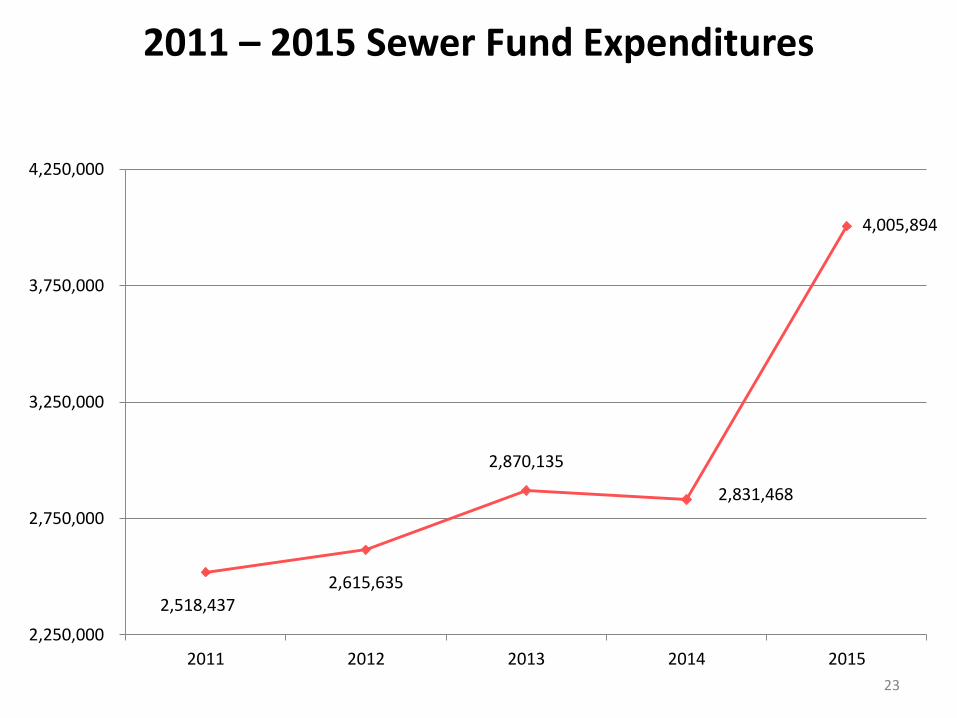
2011 – 2015 Sewer Fund Expenditures
2,518,437 2,615,635
2,870,135
2,831,468
4,005,894
2,250,000
2,750,000
3,250,000
3,750,000
4,250,000
2011 2012 2013 2014 2015
23

Sewer Fund Expenditures 2014 - 2015
Type 2014 Actual
2015 Adjusted Budget
2015 Actual
% Of 2015 Total
Wages 873,478 921,029 880,448 22.0%
Benefits 526,056 552,504 525,191 13.1%
Equipment 23,843 23,000 21,490 0.4%
Materials & Supplies 203,591 259,032 196,323 4.9%
Utilities 9,859 15,859 7,825 0.2%
Combined Sewer Overflow 471,100 1,121,270 868,886 21.7%
Contractual Services 169,984 195,793 52,074 1.3%
Intrafund Transfer - General 327,000 327,000 327,000 8.2%
Intrafund Transfer – Water 152,209 152,332 152,209 3.8%
Contingency 0 18,652 0 0.0%
Debt Service 74,348 60,705 74,448 1.9%
Debt Service Fund Transfer 0 900,000 900,000 22.5%
Total 2,831,468 4,547,176 4,005,894
24

Sewer Fund Balance As Of December 31, 2015
2014 2015 Difference
Beginning Balance 126,236 862,264 736,028
Add (Surplus) / Less (Deficit) 736,028 (94,107) (830,135)
Ending Balance 862,264 768,157 (94,107)
• The AUD calculates a surplus / deficit based on total actual revenues received during the fiscal year and does not account for any budgeted use of reserves as revenues.
25
City of Troy, New York
Fiscal Year 2016 – First Quarter Quarterly Financial Report
General Fund
As Of March 31, 2016
26

Overview Of General Fund Revenues • 2016 First Quarter Total
$14,381,045
• 2015 First Quarter Total
$13,375,680
• 2016 – 2015 Dollar Change
$1,005,365
• 2016 – 2015 Percent Change
7.52%
• 2016 First Quarter Total
$14,381,045
• 2016 Budget Total
$68,120,975
• Difference Between Budget And Actual
($53,739,930)
• Percent Of Budget Received
21.11%
12,383,914
12,467,154
13,055,468
13,375,680
14,381,045
12,000,000
12,750,000
13,500,000
14,250,000
15,000,000
2012 2013 2014 2015 2016 27

Real Property Taxes • 2016 First Quarter Total
$10,811,462
• 2015 First Quarter Total
$10,084,015
• 2016 – 2015 Dollar Change
$727,447
• 2016 – 2015 Percent Change
7.21%
• 2016 First Quarter Total
$10,811,462
• 2016 Budget Total
$20,852,598
• Difference Between Budget And Actual
($9,771,136)
• Percent Of Budget Received
52.53%
51.02%
51.75%
51.10%
51.42%
52.53%
50.50%
51.25%
52.00%
52.75%
2012 2013 2014 2015 2016 28

Departmental Income • 2016 First Quarter Total
$1,349,753
• 2015 First Quarter Total
$1,022,657
• 2016 – 2015 Dollar Change
$327,096
• 2016 – 2015 Percent Change
31.98%
• 2016 First Quarter Total
$1,349,753
• 2016 Budget Total
$5,226,982
• Difference Between Budget And Actual
($3,877,229)
• Percent Of Budget Received
25.82%
1,158,088
1,034,345
1,330,953
1,022,657
1,349,753
1,000,000
1,100,000
1,200,000
1,300,000
1,400,000
2012 2013 2014 2015 2016 29

What Makes Up Departmental Income?
• The following revenue sources make up Departmental Income
– General Government Support $34,590 10.58% • Treasurer's Fees
– Public Safety $317,880 67.35% • Vacant Building Fees
– Health $213,521 12.03% • Ambulance Billing
– Transportation $214,387 31.07% • Parking Garages & Lots
– Recreation $139,791 9.89% • Golf Fees
– Home & Community Services $429,584 78.11% • Recycling Charges
30

Licenses & Permits • 2016 First Quarter Total
$283,298
• 2015 First Quarter Total
$75,792
• 2016 – 2015 Dollar Change
$207,506
• 2016 – 2015 Percent Change
273.78%
• 2016 First Quarter Total
$283,298
• 2016 Budget Total
$616,000
• Difference Between Budget And Actual
($332,702)
• Percent Of Budget Received
45.99%
129,845
254,369
76,936 75,792
283,298
50,000
100,000
150,000
200,000
250,000
300,000
2012 2013 2014 2015 2016 31

Fines & Forfeitures • 2016 First Quarter Total
$273,182
• 2015 First Quarter Total
$170,166
• 2016 – 2015 Dollar Change
$103,016
• 2016 – 2015 Percent Change
60.54%
• 2016 First Quarter Total
$273,182
• 2016 Budget Total
$1,228,500
• Difference Between Budget And Actual
($955,018)
• Percent Of Budget Received
22.24%
288,598
214,939
174,392 170,166
273,182
100,000
150,000
200,000
250,000
300,000
2012 2013 2014 2015 2016 32

Overview Of General Fund Expenditures • 2016 First Quarter Total
$18,321,899
• 2015 First Quarter Total
$16,968,739
• 2016 – 2015 Dollar Change
$1,353,160
• 2016 – 2015 Percent Change
7.97%
• 2016 First Quarter Total
$18,321,899
• 2016 Budget Total
$68,120,975
• Budget Dollars Remaining
$49,799,076
• Percent Of Budget Expended
26.90%
16,974,832
17,794,367
17,329,687
16,968,739
18,321,899
16,500,000
17,000,000
17,500,000
18,000,000
18,500,000
2012 2013 2014 2015 2016 33
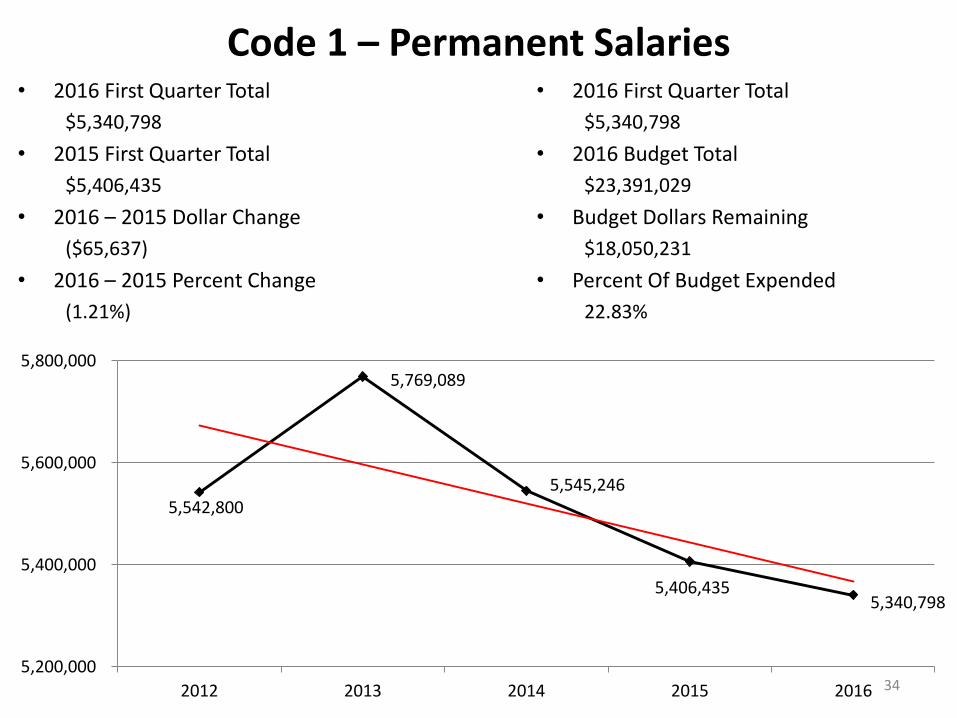
Code 1 – Permanent Salaries • 2016 First Quarter Total
$5,340,798
• 2015 First Quarter Total
$5,406,435
• 2016 – 2015 Dollar Change
($65,637)
• 2016 – 2015 Percent Change
(1.21%)
• 2016 First Quarter Total
$5,340,798
• 2016 Budget Total
$23,391,029
• Budget Dollars Remaining
$18,050,231
• Percent Of Budget Expended
22.83%
5,542,800
5,769,089
5,545,246
5,406,435 5,340,798
5,200,000
5,400,000
5,600,000
5,800,000
2012 2013 2014 2015 2016 34

Code 1 – Overtime • 2016 First Quarter Total
$63,737
• 2015 First Quarter Total
$252,211
• 2016 – 2015 Dollar Change
($188,474)
• 2016 – 2015 Percent Change
(74.73%)
• 2016 First Quarter Total
$63,737
• 2016 Budget Total
$383,500
• Budget Dollars Remaining
$319,763
• Percent Of Budget Expended
16.62%
86,842 87,316
211,096
252,211
63,737 50,000
125,000
200,000
275,000
2012 2013 2014 2015 2016 35

Code 1 – Police Overtime • 2016 First Quarter Total
$208,673
• 2015 First Quarter Total
$127,742
• 2016 – 2015 Dollar Change
$80,931
• 2016 – 2015 Percent Change
63.36%
• 2016 First Quarter Total
$208,673
• 2016 Budget Total
$918,635
• Budget Dollars Remaining
$709,962
• Percent Of Budget Expended
22.72%
105,722
157,848
175,037
127,742
208,673
100,000
140,000
180,000
220,000
2012 2013 2014 2015 2016 36

Code 1 – Fire Overtime • 2016 First Quarter Total
$314,368
• 2015 First Quarter Total
$145,399
• 2016 – 2015 Dollar Change
$168,969
• 2016 – 2015 Percent Change
116.21%
• 2016 First Quarter Total
$314,368
• 2016 Budget Total
$1,045,000
• Budget Dollars Remaining
$730,632
• Percent Of Budget Expended
30.08%
2012 2013 2014 2015 2016
Minimum Manning 55,295 89,859 59,597 75,749 96,766
Regular Overtime 152,811 229,831 93,772 69,650 217,602
Total 208,106 319,690 153,369 145,399 314,368
25,000
125,000
225,000
325,000
37

Code 3 – Materials & Supplies • 2016 First Quarter Total
$761,387
• 2015 First Quarter Total
$1,105,495
• 2016 – 2015 Dollar Change
($344,108)
• 2016 – 2015 Percent Change
(31.13%)
• 2016 First Quarter Total
$761,387
• 2016 Budget Total
$2,301,141
• Budget Dollars Remaining
$1,539,754
• Percent Of Budget Expended
33.09%
774,316
1,002,777
996,270
1,105,495
761,387 750,000
825,000
900,000
975,000
1,050,000
1,125,000
2012 2013 2014 2015 2016 38

Code 4 – Contractual Services • 2016 First Quarter Total
$2,087,911
• 2015 First Quarter Total
$1,773,263
• 2016 – 2015 Dollar Change
$314,648
• 2016 – 2015 Percent Change
17.74%
• 2016 First Quarter Total
$2,087,911
• 2016 Budget Total
$7,782,155
• Budget Dollars Remaining
$5,694,244
• Percent Of Budget Expended
26.83%
1,998,844
2,266,752
2,060,028
1,773,263
2,087,911
1,700,000
1,900,000
2,100,000
2,300,000
2012 2013 2014 2015 2016 39

Codes 6/7 – Debt Service • 2016 First Quarter Total
$4,350,948
• 2015 First Quarter Total
$4,261,333
• 2016 – 2015 Dollar Change
$89,615
• 2016 – 2015 Percent Change
2.10%
• 2016 First Quarter Total
$4,350,948
• 2016 Budget Total
$6,742,802
• Budget Dollars Remaining
$2,391,854
• Percent Of Budget Expended
64.53%
3,753,612
4,064,183
3,909,138
4,261,333 4,350,948
3,600,000
3,800,000
4,000,000
4,200,000
4,400,000
2012 2013 2014 2015 2016 40

How Have Pension Costs Been Budgeted
• Until the 2015 budget pension costs were budgeted based on the New York State fiscal year of April 1 thru March 31 of the subsequent year
• In 2015 the City budgeted for a time period of April 1, 2015 thru December 31, 2015 to allow for a one time budgetary savings which was reviewed and approved by the New York State Comptroller’s Office, the City’s independent auditing firm and the then Troy City Council
• In 2016 the City budgeted for pension costs covering a time period of January 1, 2016 thru December 31, 2016
2013 Budget = 04/01/2013 – 03/31/2014 2014 Budget = 04/01/2014 – 03/31/2015 2015 Budget = 04/01/2015 – 12/31/2015 2016 Budget = 01/01/2016 – 12/31/2016
41
Components Of The City Of Troy’s Retirement Bill
• Current year expense • Expense for employees from January 1, 2016 thru December 31, 2016
• Current year amortization • Amount of current year expense being amortized over future years for
payment
• Prior year payback • Payback of prior year of amortized costs
• Net payment • Current year expense – Current year amortization + Prior year payback
42

Code 8 – Pension
• The total Pension cost in the first quarter of 2016 was $1,235,894
• First year of pension expenditures being recorded during the first quarter of the fiscal year – Due to the budgeting practice change made during 2015
• City records the actual pension expenditures at the time the bill is received
• Amounts recorded in 2016 represent the payment made in December 2015 for the time period of January 1, 2016 thru March 31, 2016
• By prepaying the first quarter pension expenditures it allowed for the City to receive a discount
43

Code 8 – Health Insurance • 2016 First Quarter Total
$2,906,399
• 2015 First Quarter Total
$2,730,485
• 2016 – 2015 Dollar Change
$175,914
• 2016 – 2015 Percent Change
6.44%
• 2016 First Quarter Total
$2,906,399
• 2016 Budget Total
$11,789,458
• Budget Dollars Remaining
$8,883,059
• Percent Of Budget Expended
24.65%
2,900,424
2,452,726
2,567,432
2,730,485
2,906,399
2,400,000
2,550,000
2,700,000
2,850,000
3,000,000
2012 2013 2014 2015 2016 44

Code 8 – Dental Insurance • 2016 First Quarter Total
$147,235
• 2015 First Quarter Total
$159,365
• 2016 – 2015 Dollar Change
($12,130)
• 2016 – 2015 Percent Change
(7.61%)
• 2016 First Quarter Total
$147,235
• 2016 Budget Total
$604,550
• Budget Dollars Remaining
$457,315
• Percent Of Budget Expended
24.35%
163,671
160,424
146,531
159,365
147,235
145,000
150,000
155,000
160,000
165,000
2012 2013 2014 2015 2016 45

Areas To Focus On Going Forward In Fiscal Year
• Sale Of Property – One Monument Square $650,000
– Scolite $500,000
• Public Safety Overtime – Historical trends show it rising as the year progresses
• Sales Tax
• Ambulance Billing – Current year amounts trending shows will reach budgeted revenue of $1,700,000
• Parking Tickets – Amnesty Program
– Increased Collections
• Franchise settlement – Expiration of Time Warner contract with the City Of Troy
46

City of Troy, New York
Fiscal Year 2016 – First Quarter Quarterly Financial Report
Water Fund
As Of March 31, 2016
47

Overview Of Water Fund Revenues • 2016 First Quarter Total
$1,758,309
• 2015 First Quarter Total
$2,229,619
• 2016 – 2015 Dollar Change
($471,310)
• 2016 – 2015 Percent Change
(21.14%)
• 2016 First Quarter Total
$1,758,309
• 2016 Budget Total
$12,904,325
• Difference Between Budget And Actual
($11,146,016)
• Percent Of Budget Received
13.63%
2,722,191
2,107,546
1,786,774
2,229,619
1,758,309 1,750,000
1,950,000
2,150,000
2,350,000
2,550,000
2,750,000
2012 2013 2014 2015 2016 48

City Water Sales • 2016 First Quarter Total
$939,936
• 2015 First Quarter Total
$1,164,368
• 2016 – 2015 Dollar Change
($224,432)
• 2016 – 2015 Percent Change
(19.27%)
• 2016 First Quarter Total
$939,936
• 2016 Budget Total
$4,770,000
• Difference Between Budget And Actual
($3,830,064)
• Percent Of Budget Received
19.71%
1,173,587
843,685
914,591
1,164,368
939,936
800,000
900,000
1,000,000
1,100,000
1,200,000
2012 2013 2014 2015 2016 49

Outside Community Water Sales • 2016 First Quarter Total
$506,494
• 2015 First Quarter Total
$606,730
• 2016 – 2015 Dollar Change
($100,236)
• 2016 – 2015 Percent Change
(16.52%)
• 2016 First Quarter Total
$506.494
• 2016 Budget Total
$7,122,737
• Difference Between Budget And Actual
($6,616,243)
• Percent Of Budget Received
7.11%
433,342
489,836
469,226
606,730
506,494
420,000
470,000
520,000
570,000
620,000
2012 2013 2014 2015 2016 50

Overview Of Water Fund Expenditures • 2016 First Quarter Total
$2,869,236
• 2015 First Quarter Total
$3,060,312
• 2016 – 2015 Dollar Change
($191,076)
• 2016 – 2015 Percent Change
(6.24%)
• 2016 First Quarter Total
$2,869,236
• 2016 Budget Total
$12,904,325
• Budget Dollars Remaining
$10,035,089
• Percent Of Budget Expended
22.23%
3,470,329
3,293,061
2,991,299
3,060,312
2,869,236
2,700,000
2,900,000
3,100,000
3,300,000
3,500,000
2012 2013 2014 2015 2016 51

Code 1 – Overtime • 2016 First Quarter Total
$64,446
• 2015 First Quarter Total
$49,117
• 2016 – 2015 Dollar Change
$15,329
• 2016 – 2015 Percent Change
31.21%
• 2016 First Quarter Total
$64,446
• 2016 Budget Total
$185,500
• Budget Dollars Remaining
$121,054
• Percent Of Budget Expended
34.74%
66,205
40,104
47,703
49,117
64,446
35,000
40,000
45,000
50,000
55,000
60,000
65,000
70,000
2012 2013 2014 2015 2016 52

Code 3 – Materials & Supplies • 2016 First Quarter Total
$861,443
• 2015 First Quarter Total
$1,147,593
• 2016 – 2015 Dollar Change
($286,150)
• 2016 – 2015 Percent Change
(24.93%)
• 2016 First Quarter Total
$861,443
• 2016 Budget Total
$1,972,426
• Budget Dollars Remaining
$1,110,983
• Percent Of Budget Expended
43.67%
887,698
1,093,740
970,220
1,147,593
861,443
800,000
900,000
1,000,000
1,100,000
1,200,000
2012 2013 2014 2015 2016 53

Code 4 – Contractual Services • 2016 First Quarter Total
$845,548
• 2015 First Quarter Total
$829,378
• 2016 – 2015 Dollar Change
$16,170
• 2016 – 2015 Percent Change
1.95%
• 2016 First Quarter Total
$845,548
• 2016 Budget Total
$5,378,158
• Budget Dollars Remaining
$4,532,610
• Percent Of Budget Expended
15.72%
832,767
902,186
934,741
829,378
845,548
820,000
850,000
880,000
910,000
940,000
2012 2013 2014 2015 2016 54

City of Troy, New York
Fiscal Year 2016 – First Quarter Quarterly Financial Report
Sewer Fund
As Of March 31, 2016
55

Overview Of Sewer Fund Revenues • 2016 First Quarter Total
$972,117
• 2015 First Quarter Total
$1,301,842
• 2016 – 2015 Dollar Change
($329,725)
• 2016 – 2015 Percent Change
(25.33%)
• 2016 First Quarter Total
$972,117
• 2016 Budget Total
$4,472,852
• Difference Between Budget And Actual
($3,500,735)
• Percent Of Budget Received
21.73%
533,568
457,644
623,831
1,301,842
972,117
400,000
600,000
800,000
1,000,000
1,200,000
1,400,000
2012 2013 2014 2015 2016 56

Sewer Rents • 2016 First Quarter Total
$786,344
• 2015 First Quarter Total
$957,387
• 2016 – 2015 Dollar Change
($171,043)
• 2016 – 2015 Percent Change
(17.87%)
• 2016 First Quarter Total
$786,344
• 2016 Budget Total
$4,201,252
• Difference Between Budget And Actual
($3,414,098)
• Percent Of Budget Received
18.72%
507,602
431,805
584,628
957,387
786,344
400,000
550,000
700,000
850,000
1,000,000
2012 2013 2014 2015 2016 57

Overview Of Sewer Fund Expenditures • 2016 First Quarter Total
$869,326
• 2015 First Quarter Total
$858,086
• 2016 – 2015 Dollar Change
$11,240
• 2016 – 2015 Percent Change
1.31%
• 2016 First Quarter Total
$869,326
• 2016 Budget Total
$4,472,852
• Budget Dollars Remaining
$3,603,526
• Percent Of Budget Expended
19.44%
1,311,947
1,196,378
948,985
858,086 869,326
800,000
950,000
1,100,000
1,250,000
1,400,000
2012 2013 2014 2015 2016 58

Code 1 – Overtime • 2016 First Quarter Total
$21,115
• 2015 First Quarter Total
$9,522
• 2016 – 2015 Dollar Change
$11,593
• 2016 – 2015 Percent Change
121.76%
• 2016 First Quarter Total
$21,115
• 2016 Budget Total
$85,000
• Budget Dollars Remaining
$63,885
• Percent Of Budget Expended
24.84%
43,614
10,277 10,416 9,522
21,115
-
10,000
20,000
30,000
40,000
50,000
2012 2013 2014 2015 2016 59

Code 3 – Materials & Supplies • 2016 First Quarter Total
$82,404
• 2015 First Quarter Total
$73,604
• 2016 – 2015 Dollar Change
$8,800
• 2016 – 2015 Percent Change
11.96%
• 2016 First Quarter Total
$82,404
• 2016 Budget Total
$260,194
• Budget Dollars Remaining
$177,790
• Percent Of Budget Expended
31.67%
121,983
90,863
136,376
73,604
82,404
60,000
80,000
100,000
120,000
140,000
2012 2013 2014 2015 2016 60

Code 4 – Contractual Services • 2016 First Quarter Total
$482,499
• 2015 First Quarter Total
$504,092
• 2016 – 2015 Dollar Change
($21,593)
• 2016 – 2015 Percent Change
(4.28%)
• 2016 First Quarter Total
$482,499
• 2016 Budget Total
$1,132,730
• Budget Dollars Remaining
$650,231
• Percent Of Budget Expended
42.60%
886,025
858,434
525,637
504,092 482,499
400,000
500,000
600,000
700,000
800,000
900,000
2012 2013 2014 2015 2016 61

City of Troy, New York
62