city of union city, california comprehensive annual
TRANSCRIPT

california
Comprehensive Annual Financial Report for the Fiscal Year Ended June 30, 2019
C I T Y O F U N I O N C I T Y, C A L I F O R N I A

CITY OF UNION CITY, CALIFORNIA
COMPREHENSIVE ANNUAL FINANCIAL REPORT
FOR THE FISCAL YEAR ENDED JUNE 30, 2019
Prepared by the
Finance Department of the City of Union City

City of Union City
Table of Contents
Page Introductory Section
Table of Contents ........................................................................................................................................................ i Letter of Transmittal .................................................................................................................................................. v Regional Map ......................................................................................................................................................... xiii Commissions, Committees and Boards ...............................................................................................................xiv Directory of City Officials ....................................................................................................................................... xv Organizational Chart ..............................................................................................................................................xvi Certificate of Achievement for Excellence in Financial Reporting - Government Finance Officers Association ..................................................................................................... xvii
Financial Section
Independent Auditor’s Report ............................................................................................................................... 1
Management’s Discussion and Analysis .............................................................................................................. 5
Basic Financial Statements:
Government-Wide Financial Statements: Statement of Net Position ............................................................................................................................. 28 Statement of Activities ................................................................................................................................... 30
Fund Financial Statements: Governmental Funds Financial Statements: Balance Sheet ............................................................................................................................................... 36 Reconciliation of the Governmental Funds Balance Sheet to the Government-Wide Statement of Net Position .......................................................................... 38 Statement of Revenues, Expenditures and Changes in Fund Balances .............................................. 40 Reconciliation of the Governmental Funds Statement of Revenues, Expenditures and Changes in Fund Balances to the Government-Wide Statement of Activities ............................................................................................................................ 42
Proprietary Fund Financial Statements: Statement of Net Position .......................................................................................................................... 45 Statement of Revenues, Expenses and Changes in Net Position ......................................................... 46 Statement of Cash Flows ............................................................................................................................ 47
Fiduciary Fund Financial Statements: Statement of Fiduciary Net Position ........................................................................................................ 50 Statement of Changes in Fiduciary Net Position.................................................................................... 51
Notes to Basic Financial Statements ................................................................................................................... 53
i

City of Union City
Table of Contents
Page Financial Section, Continued
Required Supplementary Information: Budgetary Basis of Accounting: Budgetary Control and Budgetary Accounting .......................................................................................... 104 Budgetary Comparison Schedule, General Fund ....................................................................................... 105 Budgetary Comparison Schedule, Low-Moderate Income Housing Special Revenue Fund ........................................................................ 106 Schedule of Changes in the Net Pension Liability and Related Ratios .................................................... 107 Schedule of City’s Proportionate Share of the Net Pension Liability ...................................................... 108 Schedule of Pension Contributions ............................................................................................................... 109 Schedule of Changes in Net OPEB Liability and Related Ratios During the Measurement Period ............................................................................................................................. 110 Schedule of OPEB Contributions .................................................................................................................. 111
Supplementary Information:
Non-Major Governmental Funds: Combining Balance Sheet ............................................................................................................................... 118 Combined Statement of Revenues, Expenditures and Changes in Fund Balances .................................................................................................................. 126
Schedules of Revenues, Expenditures and Changes in Fund Balances – Budget and Actual: Measure B/ACTIA Special Revenue Fund .............................................................................................. 133 Special Parks Special Revenue Fund ......................................................................................................... 134 State Gas Tax Special Revenue Fund ........................................................................................................ 135 Street Lights and Landscaping Special Revenue Fund ........................................................................... 136 Housing and Community Development Special Revenue Fund .......................................................... 137 HOME Special Revenue Fund .................................................................................................................... 138 DIPSA Development Special Revenue Fund ........................................................................................... 139 CFD Maintenance Districts Special Revenue Fund ................................................................................ 140 EMS Enhancement Special Revenue Fund ............................................................................................... 141 Traffic Signalization Special Revenue Fund ............................................................................................. 142 Supplemental Law Enforcement Special Revenue Fund ....................................................................... 143 Clean Water Program Special Revenue Fund .......................................................................................... 144 Recycling and Waste Management Special Revenue Fund ................................................................... 145 Used Oil Block Grant Special Revenue Fund ........................................................................................... 146 Housing In-Lieu Special Revenue Fund ................................................................................................... 147 Public Safety Parcel Tax Special Fund ...................................................................................................... 148 Union Landing PBID Special Revenue Fund ........................................................................................... 149 Alameda County Waste Import Mitigation Special Fund ...................................................................... 150 Solid Waste Management Special Revenue Fund ................................................................................... 151 Asset Seizure Fund ..................................................................................................................................... 152 Measure F Special Revenue Fund .............................................................................................................. 153
ii
City of Union City
Table of Contents
Page Financial Section, Continued
Supplementary Information, Continued
Schedules of Revenues, Expenditures and Changes in Fund Balances – Budget and Actual, Continued: CUPA Enforcement Special Revenue Fund ............................................................................................ 154 Youth Violence Prevention & Intervention Fund .................................................................................... 155 Measure D Waste Reduction/Recycling Special Revenue Fund .......................................................... 156 Affordable Housing Special Revenue Fund ............................................................................................. 157 Public Art Special Revenue Fund .............................................................................................................. 158 Measure BB Fund ......................................................................................................................................... 159 Cable TV PEG Special Revenue Fund ....................................................................................................... 160 Rent Mediation/Eviction Protection Special Revenue Fund ................................................................. 161 Traffic Congestion Fund ............................................................................................................................ 162 SB 1 Maintenance & Rehab Fund .............................................................................................................. 163 Pension Obligation Bonds Debt Service Fund ......................................................................................... 164 Community Facilities District Debt Services Fund ................................................................................. 165
Internal Service Funds: Combining Statement of Net Position .......................................................................................................... 168 Combining Statement of Revenues, Expenses and Changes in Net Position ......................................... 169 Combining Statement of Cash Flows ........................................................................................................... 170
Fiduciary Funds: Combining Statement of Fiduciary Net Position ........................................................................................ 172 Combining Statement of Changes in Fiduciary Net Position ................................................................... 173
General Fund: Combining Balance Sheet ............................................................................................................................... 176 Combining Statement of Revenues, Expenditures and Changes in Fund Balances .............................. 178
Schedule of Revenues, Expenditures and Changes in Fund Balances – Budget and Actual: General Fund ................................................................................................................................................... 180 Post-Employment Medical Benefits Special Revenue Fund ..................................................................... 181 Fire Equipment Acquisition Special Revenue Fund................................................................................... 182 Leisure Revolving Special Revenue Fund ................................................................................................... 183 Allied Waste Vehicle Special Fund ............................................................................................................... 184 Code Enforcement Special Revenue Fund ................................................................................................... 185 Corporation Yard and Fuel Facility Maintenance Special Revenue Fund .............................................. 186
iii
City of Union City
Table of Contents
Page Statistical Section (Unaudited)
Net Position by Component ................................................................................................................................. 190 Changes in Net Position ........................................................................................................................................ 192 Fund Balances of Governmental Funds .............................................................................................................. 196 Changes in Fund Balances of Governmental Funds ......................................................................................... 198 Assessed Value and Estimated Actual Value of Taxable Property ................................................................ 202 Direct and Overlapping Property Tax Rates ...................................................................................................... 203 Principal Property Tax Payers ............................................................................................................................. 204 Principal Tax Levies and Collections .................................................................................................................. 205 Special Assessment Collections ........................................................................................................................... 206 Property Values and Construction ...................................................................................................................... 207 Ratios of Outstanding Debt by Type .................................................................................................................. 210 Ratios of General Bonded Debt Outstanding ................................................................................................... 211 Schedule of Direct and Overlapping Debt ......................................................................................................... 212 Legal Debt Margin Information ........................................................................................................................... 213 Pledged-Revenue Coverage ................................................................................................................................. 215Bank Deposit Summary ........................................................................................................................................ 218 General Fund Expenditures by Function ........................................................................................................... 219 General Fund Revenues by Function .................................................................................................................. 220 Taxable Sales Transactions ................................................................................................................................... 221 Taxable Sales Transactions by Type of Business ............................................................................................... 222 Adopted and Final Budget for 2018-19 and 2019-20 Adopted Budget for Unrestricted General Fund ................................................................................................................................ 223 Summary of Revenues, Expenditures, and Changes in Fund Balance – General Fund .............................. 224 Pooled Investment Portfolio ................................................................................................................................. 225 Demographic and Economic Statistics ................................................................................................................ 226 Principal Employers .............................................................................................................................................. 227 Full-time and Part-time City Employees (Full-Time Equivalents FTE's) by Department ........................... 228 Operating Indicators by Function ....................................................................................................................... 230 Capital Asset Statistics .......................................................................................................................................... 231 Miscellaneous Statistics ......................................................................................................................................... 232
iv

February 11, 2021
To the Honorable Mayor, Members of the City Council and Citizens of Union City, California
We are pleased to submit the Comprehensive Annual Financial Report (CAFR) for the City of Union City for the fiscal year ended June 30, 2019. The Government Code of the State of California requires general law cities, such as the City of Union City, to have their financial statements audited by an independent certified public accountant at the end of each fiscal year and issue a complete set of financial statements. The financial statements are presented in conformity with generally accepted accounting principles and audited in accordance with generally accepted auditing standards.
This report was prepared by the City’s Finance Department and the responsibility for the accuracy of the data presented in this report and the completeness and fairness of the presentation, including all disclosures, rests with the City’s management. We believe the data presented is accurate in all material respects; that it is presented in a manner designed to fairly set forth the financial position and changes in financial position of the City as measured by the financial activities of its governmental funds, business-type funds, each major fund, and the aggregate remaining non-major governmental funds. In addition, the report contains all disclosures necessary to enable the reader to gain the maximum understanding of the City’s financial affairs. In order to ensure that there is a reasonable basis for assuming responsibility for the information contained in the financial report, management has established an internal control framework that is designed to protect the City’s assets from loss, theft or misuse and provide assurance that the accounting system and its underlying data are reliable. Because the cost of internal controls should not outweigh their benefits, the City’s comprehensive framework of internal controls has been designed to provide reasonable rather than absolute assurance that the financial statements will be free from material misstatements.
Badawi and Associates was engaged to audit the City’s basic financial statements. The goal of an independent audit is to provide users of the financial report with reasonable assurance that the financial statements of the City for the fiscal year ended June 30, 2019, are free of material misstatements.
The independent audit involved a review of internal controls; examining, on a test basis, evidence supporting the amounts and disclosures in the financial statements; assessing the accounting principles used and significant estimates made by management; and evaluating the overall financial presentation. The independent auditors concluded that there was a reasonable basis for rendering an unmodified opinion on
v
the City’s financial statements for the fiscal year ended June 30, 2019. The independent auditor’s report is presented as the first component of the financial section of this report.
The independent audit of the financial statements is also typically conducted in conjunction with the federally mandated Single Audit. The standards governing the Single Audit require the independent auditor report on items beyond fair presentation of the financial statements, including internal controls and compliance with legal requirement involving the administration of federal awards. A Single Audit Report on Federal Award Programs was not required or prepared in fiscal year 2019 because the City had less than $750,000 in federal grant expenditures.
Generally accepted accounting principles require that management provide a narrative introduction, overview, and analysis to accompany the basic financial statements in the form of Management’s Discussion and Analysis (MD&A). This letter of transmittal is designed to complement the MD&A and should be read in conjunction with it. The MD&A immediately follows the independent auditor’s report.
Delayed Issuance of This CAFR
The issuance of this CAFR was delayed due to a cyberattack on City information systems in September 2019 that required City staff to restore its financial records. Financial records were ultimately restored; however, this restoration delayed completion and issuance of this CAFR. The City overcame this attack and implemented improvements in its information security infrastructure, systems and protocols to prevent future attacks to the fullest extent possible and has implemented new backup technologies to allow recovery in the event of future attacks.
Profile of the City
General Information: The City was incorporated in 1959, unifying the Alvarado and Decoto Districts. At that time, there were approximately 6,000 citizens living in the area. City boundaries now encompass an 18-square-mile area located between the cities of Oakland to the north and San Jose to the south, along the eastern shore of the San Francisco Bay. The City’s population has now grown to more than 74,000 residents. Union City’s proximity to major highways, bridges, airports, public transportation, colleges and universities, and cultural and recreational areas make it a desirable community in which to live and work. The City is a family-oriented community where the focus is on the enrichment of the quality of life for its citizens.
Government Structure: The City has a Council-Manager form of government with the Mayor and City Council forming the legislative body that represents the community. The City shifted from at-large elections to district elections for City Council members in 2019. The first district election, District 1, was held in November 2020. The remaining three districts will hold district elections in 2022 to coincide with the terms of the current elected officials. The Mayor is elected at-large and was reelected in November 2020 for a final term. All elected officials may serve for up to three consecutive four-year terms.
The City Council is responsible for developing policies, passing ordinances, adopting the budget, hiring both the City Manager and City Attorney, and approving appointments of department heads and nominees
vi

to advisory commissions and committees. The City Manager is responsible for the administration of City services, the day-to-day operations of the City and the implementation of Council policies.
Union City is a general law city which operates under the provisions of state law. Like other general law cities, Union City has limited ability to set tax rates. The State Constitution establishes a maximum property tax rate and limits the growth of the assessed valuation of properties. The property tax collected is allocated among the jurisdictions in the City’s tax rate areas based on criteria established by the California legislature. The base rate and tax base of the City’s other major general revenue source—sales tax—is also set by the state legislature.
Increases in existing local taxes and any new taxes require voter approval. Taxes used for general purposes are subject to approval by a simple majority of voters. Taxes levied for specific purposes require a two-thirds majority of voters, as do property tax levies that are used to pay for debt issued to construct capital assets. Special property tax assessments must be approved by a two-thirds vote, with the voting rights apportioned based on the benefit of the assessments. Fees for facilities and services are subject to requirements that they not be set at levels that exceed the reasonable costs of providing the services. The balance generated by the difference between fee revenues and the related expenditures is retained and designated for services and facilities that benefit the fee payers.
Services Provided: The City provides the full range of services normally associated with a municipality. These include public safety, which encompasses police, fire, emergency medical services and code enforcement; construction and maintenance of streets, parks and other infrastructure; social and recreation services; planning, economic development and housing programs; and general administrative services. Fire suppression and emergency medical services are provided to the City under a contract agreement with the Alameda County Fire Department. The City also operates a transit and paratransit bus system that is coordinated with the services of other transit providers including the Bay Area Rapid Transit (BART) rail system, AC Transit and Dumbarton Express bus services. The City manages franchises for solid waste disposal, recycling, cable television and gas and electric services.
Other common municipal services delivered within the City’s boundaries, such as water, wastewater treatment, education, libraries, regional parks and flood and vector control, are provided by other governmental agencies either directly to Union City residents or under contract with the City.
Component Unit: The financial statements included in this CAFR present the City and the Community Facilities Districts (the Districts) as its component unit. A component unit is a legally separate entity for which the elected officials of the primary government are financially accountable. The Districts were established by the City pursuant to the Mello-Roos Community Facilities Act of 1981, as amended. These followed public hearings and a landholder election at which over a two-thirds majority vote authorized the Districts to incur bonded indebtedness and the levy of special taxes. The Districts include the Dyer Street Triangle (1997-1) that was levied to build infrastructure and is now commonly referenced as the Union Landing retail area, and four CFDs for the purpose of maintenance and services (1996-1, 2005-1 and 2006-1). There are no other governmental units over which the City Council has financial accountability.
vii

Budget: Subject to an appropriation limit established pursuant to state law, management prepares a biennial operating budget along with a five-year capital improvement plan. Through the budget process, the City’s goals and objectives are prioritized. The proposed budget is presented to the citizens at public hearings prior to adoption by the City Council. After due deliberation, City Council adopts the resolution appropriating the City’s resources. This resolution approves both years of the biennial operating budget. Budget amendments, for either or both years, require City Council approval. A fixed biennial budget is required for the General Fund, Special Revenue funds and Debt Service funds. Capital projects are appropriated in the capital improvement plan on a project-length basis. Budgets for proprietary funds are also adopted by City Council to serve as a financial plan.
The legal level of budgetary control is at the fund level. The City Manager is authorized to reallocate resources within a fund. Department Heads are permitted to reallocate non-payroll resources among the programs within their department and within the same fund. Budget revisions that reallocate dollars between funds or that alter the total budget amount require City Council approval. The City’s budget is integrated in the accounting system, which provides management with timely access to financial information. Unexpended or unencumbered operating appropriations lapse at the end of the fiscal year. Encumbrances, representing purchase orders outstanding at year end, are reappropriated in the following year’s budget. Appropriations for capital projects are appropriated on a project-length basis since completion of a project may span more than one fiscal year.
Economic Condition and Outlook
As in most cities in the San Francisco Bay Area (Bay Area), the City’s housing market and consumer spending drives its economy. Increased confidence in the pre-COVID-19 pandemic economy led businesses to upgrade or add to their facilities within the City. Property taxes, the General Fund’s major revenue source, increased in total by over $750,000 or 3.4% over the prior year. Property taxes represent 41% of General Fund revenue.
Sales tax revenues increased by $180,000 or 1.1% over the prior fiscal year. While sales taxes remain strong, the onset of the COVID-19 pandemic recession (discussed below) could impact brick and mortar retail sales.
Other General Fund tax revenue sources such as transient occupancy and franchise tax revenues increased by $205,000 or 2.5%. These items combined with property tax and sales tax account for 85.7% of all General Fund revenues.
Development of City-owned property along Mission Boulevard is progressing with Mid-Pen Housing and is expected to produce 81 housing units to include a certain number of low-income units.
The Station District master planning process continues to move forward. The City signed an option agreement with Woodstock Development to construct 1.2 million square feet of office and retail space on a three-acre site in the Station District. They are progressing with development plans. Windflower, LLC completed a 243-unit mixed-use residential development and has approval for an additional 443 residential units. Construction on this second phase is expected to begin soon.
viii
The City’s Community and Economic Development Department continues to work closely with merchant associations to promote businesses in their area. Union City is home to a number of bio-medical businesses, and the City continues to reach out to that and other markets as new commercial office space is currently being developed.
Subsequent to the end of FY 2018-19, but prior to release of this report, the Novel Coronavirus Disease, commonly referred to as COVID-19, was discovered in December 2019 and was declared a world-wide pandemic by the World Health Organization on March 11, 2020. At that same time, the United States began to see rising cases and death rates associated with the disease. California proclaimed a state of emergency on March 4, 2020. The Alameda County Health Officer issued a stay-at-home directive, as did most other Bay Area counties, on March 16, 2020. The effect of the stay-at-home orders placed significant restrictions on businesses and residents in an effort to reduce the sudden spike in cases that would require acute medical care.
Union City was impacted just as the rest of the region and state have been impacted. The City was required to cease recreation programs, and non-public-safety workers were required to work from home. Many of the businesses in the City were required to shut down or significantly restrict operations, with the exception of non-essential businesses such as food stores, gas stations, hardware stores, and businesses that supported community infrastructure and housing. Sales tax revenues were impacted, but the changes made to sales tax allocation as a result of the South Dakota v. Wayfair, Inc. judgment has offset what might otherwise be a significant deterioration in sales tax revenues.
Due to the stay-at-home orders across the Western United States and the rest of the country, non-essential travel was discontinued. The City’s transient occupancy tax generators saw their operations decrease significantly during the start of the peak travel season in the region.
2019-20 and 2020-21 Biennial Budget: In June of 2019, the City Council adopted its biennial budget. General Fund reserves were expected to remain above the minimum reserve policy of 20% of annual operating expenditures. General Fund reserves were expected to be drawn down by a total of $6.2 million over the biennium period. The deficit is the result of rising pension costs, increased fire services costs through the contract with Alameda County Fire Department, and revenues that are unable to keep pace with the rising cost of providing services. However, the City has been fortunate enough to maintain General Fund reserves to weather these deficits while the City seeks to implement a fiscal sustainability plan to address budgetary shortfalls.
Long-Term Fiscal Sustainability Planning: The City has a long history of preparing long-range forecasts to identify trends in revenue and expenditure growth, impacts on reserve levels, and to help guide the City Council in policy choices regarding service levels and need for increased revenue sources. At year end, available reserves that include unassigned as well as assigned funds available at the City Council’s discretion are at 35% of budgeted FY 2019-20 expenditures, but were expected to be drawn down to the minimum reserve level of 20% by the end of FY 2020-21. In light of the COVID-19 pandemic recession, the City took proactive steps to update its fiscal model to identify impacts from the recession. Furthermore, the City implemented various cost saving strategies to reduce expenditures by over $1.2 million in FY 2020-21.
ix
Tax Measures: In November of 2018, the citizens approved Measure DD, a Cannabis Tax, which could possibly generate up to $1.4 million annually to the General Fund when all operating licenses have been issued and the businesses achieve full operation. The citizens voted down Measure EE, a Real Property Transfer Tax and Charter City initiative that was anticipated to provide $5.0 million annually to the General Fund. Measure QQ, the public safety parcel tax that helps funds public safety services, generates over $4 million per year, but expires at the end of FY 2020-21. In advance of that expiration, the City Council submitted for voter approval a utility users’ tax measure (Measure WW) in the November 2020 general election, which was approved by voters. The measure will allow the City to enact a new 5% utility users tax (UUT) on gas, electricity, video and telecommunications services that is expected to generate nearly $5.5 million in annual General Fund revenues, net of exemptions for seniors and low-income customers, starting in April 2021.
Relevant Fiscal Policies: The City’s Fiscal Management Policy authorizes the use of one-time revenues for capital projects or one-time costs, and it seeks to minimize borrowing costs and preserve access to credit. City Management also prepares an annual multi-year forecast of the City’s operating revenues and expenditures to demonstrate the likely impact on the General Fund reserves for City Council to consider. The City utilizes the budgetary control feature in its financial system. This feature validates whether funds are available, at the program level, each time a requisition is entered. If there are not sufficient funds to cover the proposed purchase cost, the user will not be able to create a requisition unless a budget transfer is made.
In fiscal year 2011-12, the City Council established an administrative contingency as part of the Fiscal Management Policy. The amount to be set aside each year is to equal 0.5% of the audited annual expenditures of the General Fund in the prior fiscal year. The City Manager is given the authority to approve funding for unforeseen costs or new programs that were not anticipated during the budget development process.
Major Initiatives:
Five-Year Strategic Plan – In October 2020, the City Council adopted its five-year strategic plan, which included a renewed community vision, mission and values. It also included 59 strategies that are identified to achieve five strategic goals:
A. Financial Stability and Sustainability – Foster fiscal health through disciplined long-term planning, cost control, heightened efficiency, increased revenue and cost recovery;
B. Governance and Organization Effectiveness – Produce high-quality services to the community through a commitment to local government best practices and employee development, support and retention;
C. Economic, Community Development and Public Safety – Institute forward-thinking business, land use development, housing, social services, and public safety strategies that promote community growth and innovation;
D. Environmental Sustainability and Infrastructure – Create a healthy, sustainable community and maintain and improve the City’s infrastructure; and
x
E. Communication and Outreach – Build strong connections with community partners, residents and employees.
The City Council’s immediate top priorities within the Strategic Plan are as follows:
1. Establishing a comprehensive fiscal stability and sustainability plan to address the General Fund’s long-term structural deficit;
2. Determining the level of authorization of a Utility Users’ Tax and developing an informational plan;
3. Developing a plan to reduce the costs and increase revenue for Community and Recreation Services;
4. Facilitating the build-out of the greater Station District Area through the construction of the Quarry Lakes Parkway, upgrades to the BART Station, completion of the pedestrian rail crossing, and the sale and development of City-owned land; and
5. Developing a multi-departmental approach to address homelessness through coordination with staff, community organizations and Alameda County.
Long Term Forecasting Model— To support development of a fiscal sustainability plan, the City developed a long-term fiscal model that forecasts a 10-year horizon with emphasis being placed on General Fund unassigned fund balances, capital and liability reserves and other key economic and fiscal indicators. This forecasting tool was updated in August 2020 due to the COVID-19 pandemic and its recessionary impacts to fully understand the implications and inform decisions made by City Management and City Council to support the City’s long-term fiscal sustainability.
Implementation of the Utility Users’ Tax – The approval of Measure WW will increase General Fund revenue sources by 10% when fully implemented in April 2021. Implementation of this measure will include outreach to all electric, gas, video and telecommunications providers, as well as all community members.
Intermodal Station District— As indicated in the Council’s Strategic Plan, the creation of the Intermodal Station District, the area surrounding the Union City BART Station, is the City’s premier redevelopment project. The former 105-acre brownfield site and under-utilized land is being transformed into a vibrant transit-oriented neighborhood consisting of housing, shopping and offices, focused around a community plaza. The BART Station has been remodeled into an Intermodal Station with multiple transit providers. BART Phase I—consisting of new multiple points of access for pedestrians and buses, reconfigured parking lots that will enable the parking lots to be easily converted to offices without disrupting access to the Station, a new 16-bay bus facility with solar collectors that power the BART Station, improved passenger circulation and widened platforms on the south-bound side of the Station, a dynamic glass façade, and improved landscaping—was completed in December 2010. BART awarded a construction contract for BART Phase II in 2013. BART Phase II will create a new east entrance to the BART Station and provide direct access to the new East Plaza, Pedestrian Promenade and Playground. Construction drawings are completed and construction commenced in summer 2019 and is on schedule to be completed in 2021. A plan for a future passenger rail station, serving the Capital Corridor, Dumbarton Rail and ACE, which will be integrated into the Intermodal Station, is being considered.
xi
Awards
The Government Finance Officers Association of the United States and Canada (GFOA) awarded a Certificate of Achievement for Excellence in Financial Reporting to Union City for its comprehensive annual financial report (CAFR) for the fiscal year ended June 30, 2018. This was the 30th consecutive year that the government had achieved this prestigious award. In order to be awarded a Certificate of Achievement, a government must publish an easily readable and efficiently organized comprehensive annual financial report. This report must satisfy both generally accepted accounting principles and applicable legal requirements.
A Certificate of Achievement is valid for a period of one year. Due to unforeseen circumstances regarding the City’s information technology platform, our current comprehensive annual financial report is unable to be submitted for the Certificate of Achievement Program due to the delay in its issuance. However, we have prepared this report under the guidelines established under the GFOA’s Certificate of Achievement Program.
The City has also received the Distinguished Budget Presentation Award from GFOA for the City’s adopted biennial budget for fiscal years 2019-20 and 2020-21. This is the sixth consecutive budget document to receive this award. In order to qualify for the award program, the City must publish a budget document that meets program criteria as a policy document, as an operations guide, as a financial plan and as a communications device.
Acknowledgements
I would like to express my appreciation for the dedicated efforts of the staff of the Finance Department, who were essential in the preparation of this report. I also wish to thank the members of the various City departments who assisted in and contributed to the preparation of this report.
Sincere appreciation is also expressed to our auditors, Badawi and Associates, for their support and assistance.
My thanks are also extended to Mayor Carol Dutra-Vernaci and the City Council for their support and establishment of the standards of excellence that are embodied in both this report and in the community they serve.
Respectfully submitted,
_____________________________ Joan Malloy City Manager
xii

REGIONAL MAP
xii
xiii

CITY OF UNION CITY, CALIFORNIA
COMMISSIONS, COMMITTEES AND BOARDS AT JUNE 30, 2019
Commission Chairperson Number of Members
Planning Harris Mojadedi 5 + alternates
Park and Recreation Caroline Abellar 7 + alternates
Senior Citizens Harbhajan Dosanjh 7 + alternates
Human Relations Derrick Richardson 7 + alternates
Youth Jaden Gray 5 + alternates
Committees and Boards:
Audit Committee
Sports Advisory Committee
Public Art Board – currently inactive
xiv

CITY OF UNION CITY, CALIFORNIA
DIRECTORY OF CITY OFFICIALS AT JUNE 30, 2019
CITY COUNCIL
Carol-Dutra-Vernaci Mayor
Emily Duncan Jaime Patiño Councilmember Councilmember
Pat Gacoscos Gary Singh Councilmember Vice Mayor
CITY STAFF
Antonio Acosta City Manager
Mark Evanoff Kristopher J. Kokotaylo Deputy City Manager City Attorney
Marilou Ayupan Joan Malloy Interim Public Works Director Economic & Community
Development Director
Jill Stavosky Mark Carlson, CPA Community & Recreation
Services Director Finance Director Human Resources
Jarred Rinetti Police Chief
xv

Citizens of Union City
Mayor & City Council
City Manager
City Manager's
Office
City Clerk
Waste Management
Public Information
Finance
Finance & Budget
Information Technology
Risk Management
Human Resources
Economic & Community
Development
Planning
Housing & Community
Development
Building Services
Environmental Programs
Public Works
Engineering
Street Maintenance
Streetlights & Signalization
Park Maintenance
Building Maintenance
Community & Recreation
Services
Youth & Family
Services
Recreation
Police Department
Administration
Operation
Fire Services
Fire Prevention
Fire Suppression
City Attorney
xvi
xvii

This page intentionally left blank.
xviii
INDEPENDENT AUDITOR’S REPORT
To the Honorable Mayor and Members of City Council of the City of Union City Union City, California
Report on the Financial Statements
We have audited the accompanying financial statements of the governmental activities, the business-type activities, each major fund, and the aggregate remaining fund information of the City of Union City, California (City), as of and for the year ended June 30, 2019, and the related notes to the financial statements, which collectively comprise the City’s basic financial statements as listed in the table of contents.
Management’s Responsibility for the Financial Statements
Management is responsible for the preparation and fair presentation of these financial statements in accordance with accounting principles generally accepted in the United States of America; this includes the design, implementation, and maintenance of internal control relevant to the preparation and fair presentation of financial statements that are free from material misstatement, whether due to fraud or error.
Auditor’s Responsibility
Our responsibility is to express opinions on these financial statements based on our audit. We conducted our audit in accordance with auditing standards generally accepted in the United States of America and the standards applicable to financial audits contained in Government Auditing Standards, issued by the Comptroller General of the United States. Those standards require that we plan and perform the audit to obtain reasonable assurance about whether the financial statements are free from material misstatement.
An audit involves performing procedures to obtain audit evidence about the amounts and disclosures in the financial statements. The procedures selected depend on the auditor’s judgment, including the assessment of the risks of material misstatement of the financial statements, whether due to fraud or error. In making those risk assessments, the auditor considers internal control relevant to the entity’s preparation and fair presentation of the financial statements in order to design audit procedures that are appropriate in the circumstances, but not for the purpose of expressing an opinion on the effectiveness of the entity’s internal control. Accordingly, we express no such opinion. An audit also includes evaluating the appropriateness of accounting policies used and the reasonableness of significant accounting estimates made by management, as well as evaluating the overall presentation of the financial statements.

Honorable Mayor and Members of City Council of the City of Union City
Union City, California Page 2
We believe that the audit evidence we have obtained is sufficient and appropriate to provide a basis for our audit opinions.
Opinions
In our opinion, the financial statements referred to above present fairly, in all material respects, the respective financial position of the governmental activities, the business-type activities, each major fund, and the aggregate remaining fund information of the City, as of June 30, 2019, and the respective changes in financial position, and, where applicable, cash flows thereof for the year then ended in accordance with accounting principles generally accepted in the United States of America.
Other Matters
Required Supplementary Information
Accounting principles generally accepted in the United States of America require that the management’s discussion and analysis, budgetary comparison information for the general fund and major special revenue funds, pension related schedules and OPEB related schedules on pages 5-24 and 104-111 be presented to supplement the basic financial statements. Such information, although not a part of the basic financial statements, is required by the Governmental Accounting Standards Board, who considers it to be an essential part of financial reporting for placing the basic financial statements in an appropriate operational, economic, or historical context. We have applied certain limited procedures to the required supplementary information in accordance with auditing standards generally accepted in the United States of America, which consisted of inquiries of management about the methods of preparing the information and comparing the information for consistency with management’s responses to our inquiries, the basic financial statements, and other knowledge we obtained during our audit of the basic financial statements. We do not express an opinion or provide any assurance on the information because the limited procedures do not provide us with sufficient evidence to express an opinion or provide any assurance.
Other Information
Our audit was conducted for the purpose of forming opinions on the financial statements that collectively comprise the City’s basic financial statements. The introductory section, combining and individual nonmajor fund financial statements, combining and individual general fund financial statements, budget comparison information for other governmental funds on pages 118-186 and statistical section, are presented for purposes of additional analysis and are not a required part of the basic financial statements.
The combining and individual nonmajor fund financial statements, combining and individual general fund financial statements, and budget comparison information for other governmental funds on pages 118-186 are the responsibility of management and were derived from and relate directly to the underlying accounting and other records used to prepare the basic financial statements. Such information has been subjected to the auditing procedures applied in the audit of the basic financial statements and certain additional procedures, including comparing and reconciling such information
2
Honorable Mayor and Members of City Council of the City of Union City
Union City, California Page 3
directly to the underlying accounting and other records used to prepare the basic financial statements or to the basic financial statements themselves, and other additional procedures in accordance with auditing standards generally accepted in the United States of America. In our opinion, the combining and individual nonmajor fund financial statements, combining and individual general fund financial schedules, and budget comparison information for other governmental funds on pages 118-186 are fairly stated in all material respects in relation to the basic financial statements as a whole.
The introductory and statistical sections have not been subjected to the auditing procedures applied in the audit of the basic financial statements and, accordingly, we do not express an opinion or provide any assurance on them.
Other Reporting Required by Government Auditing Standards
In accordance with Government Auditing Standards, we have also issued our report dated February 11, 2021, on our consideration of the City’s internal control over financial reporting and on our tests of its compliance with certain provisions of laws, regulations, contracts, and grant agreements and other matters. The purpose of that report is to describe the scope of our testing of internal control over financial reporting and compliance and the results of that testing, and not to provide an opinion on internal control over financial reporting or on compliance. That report is an integral part of an audit performed in accordance with Government Auditing Standards in considering City’s internal control over financial reporting and compliance.
Badawi and Associates Certified Public Accountants Berkeley, California February 11, 2021
3

This page intentionally left blank.
4

MANAGEMENT’S DISCUSSION AND ANALYSIS
This section offers the reader a narrative introduction and a readily understandable analytical overview of the City of Union City’s (the City) financial activities and performance for the fiscal year (FY) ended June 30, 2019. Summary reports showing comparisons of current financial information with that of the previous year are included to enhance the clarity and usefulness of the reports. To gain a broad perspective of the City and its financial activities, we encourage the reader to consider the information presented here in conjunction with the information that has been provided in the letter of transmittal presented in the beginning of this report.
Financial Highlights
At the end of FY 2018-19, the City’s government wide financial statements reported combined ending net position of $239,863,865, a decrease of ($3,161,714) from the prior fiscal year’s net position;
Government wide revenues totaled $93,979,592, a decrease of ($2,655,212) or (2.7%) from prior year;
Government wide expenditures totaled $97,141,306, a decrease of ($8,713,660) or (8.2%) from prior year.
Overview of the Financial Statements
The City’s annual financial report consists of three components: (a) management’s discussion andanalysis; (b) the basic financial statements; and (c) required supplementary information.
(a) The management’s discussion and analysis, the first component, is this particular section of the report.
(b) The basic financial statements are divided into three parts. The first of these is the government-wide financial statements consisting of a Statement of Net Position and a Statement of Activities. These statements are designed to provide readers with a broad overview of the City’s finances in a manner similar to that of a private-sector business.
The second part is the fund financial statements, which focus on individual parts of the City’s operation in more detail than the government-wide statements.
The third part, the notes to basic financial statements, explains the information in the financial statements and provides more detailed data.
(c) The final component, required supplementary information, further explains and supports the data presented in the financial statements.
5
GOVERNMENT-WIDE FINANCIAL STATEMENTS
These statements provide information about the City as a whole. The Statement of Net Position presents information on all the City’s assets and liabilities, with the difference between the two reported as net position. Over time, increases or decreases in net position may serve as a useful indicator of whether the financial position of the City is improving or declining.
The Statement of Activities presents information that shows how the City’s net position has changed during the fiscal year. All changes in net position are reported as soon as the underlying event giving rise to the change occurs, regardless of the timing of related cash flows. Thus, revenues and expenses are reported in this statement for certain items that will result in cash flows in future fiscal periods. Examples are uncollected revenues and earned employee compensation.
The government-wide financial statements distinguish functions of the City that are principally supported by taxes and intergovernmental revenues (governmental activities) from those functions that are intended to recover all or a significant portion of their costs through user fees and charges (business-type activities). The governmental activities of the City of Union City include general government, public safety, highways and streets, economic development and recreation and culture. The business-type activities of the City consist of the Transit and Paratransit bus operations.
The government-wide financial statements include not only the City itself (the primary government), but also the legally separate component unit, Community Facilities District No. 97-1 (Dyer Street Triangle).
FUND FINANCIAL STATEMENTS
The fund financial statements provide more detailed information about the City’s most significant funds. A fund is a grouping of related accounts that is used to maintain control over resources that have been segregated for specific activities or objectives. The City, like other local governments, uses fund accounting to ensure and demonstrate compliance with finance-related regulations and legal requirements. All of the funds of the City can be divided into three categories: governmental funds, proprietary funds, and fiduciary funds.
Governmental funds are used to account for most of the City’s basic services reported as governmental activities in the government-wide financial statements. Governmental fundsfocus on a detailed short-term view of the inflows and outflows of spendable resources and the balances left at the end of the fiscal year. Such information may be useful in determining what financial resources are available in the near future to finance the City’s programs. Because the focus of governmental funds is narrower than that of the government-wide financial statements, it is useful to compare the information presented for governmental funds with similar information presented in the Statement of Activities in
6
the government-wide financial statements. By doing so, readers may better understand the long-term impact of the government’s near-term financing decisions. Both the governmental fund balance sheet and the governmental fund statement of revenues, expenditures and changes in fund balances provide a reconciliation to facilitate this comparison between governmental funds and governmental activities.
The City maintains individual governmental funds, organized according to their type (general, special revenue, debt service and capital project). Information is presented separately in the governmental funds balance sheets and in the governmental funds statements of revenue, expenditures and changes in fund balance for the following major funds: General Fund, City of Union City as Successor Agency to the Redevelopment Low- and Moderate-Income Housing Special Revenue Fund, Capital Improvement Fund and Public Improvement Fund. Data for the remaining non-major governmental funds (Other Governmental Funds) are combined into a single, aggregated presentation. Information for each of these Other Governmental Funds is provided toward the end of the financial section.
The City adopts an annual appropriated budget for its General Fund. A budgetary comparison statement has been provided for the General Fund to demonstrate compliance with this budget.
Proprietary funds are used to account for services for which the City charges customers—either outside customers or internal departmental units within the City. There are two types of proprietary funds maintained by the City:
o Enterprise funds report the same functions presented as business-type activities in the government-wide financial statements. The City uses enterprise funds to account for the activities of its Transit and Paratransit operations.
o Internal service funds are used to accumulate and allocate costs internally among the City’s various functions. The City uses internal service funds to account for its general liability insurance, workers compensation insurance and the City Garage operations. Because these services predominately benefit governmental rather than business-type functions, they have been included within the governmental activities in the government-wide financial statements. The internal service funds are combined into a single, aggregated presentation in the proprietary fund financial statements. Information for each of the internal service funds is provided in the form of combining statements presented elsewhere in this report.
Fiduciary funds are used to account for resources held for the benefit of parties outside the government. The City has four fiduciary funds: POA Retiree Medical Trust Fund that accounts for assets set aside by both the City and Employees by MOU agreement for Other Postemployment Benefits, Redevelopment Property Tax Trust Fund that accounts for activities related to the former Redevelopment Area bonds, PARS OPEB Trust Fund that
7
accounts for additional funds set aside for OPEB-related costs, and PARS Pension Trust Fund that accounts for assets set aside for pension-related costs. The City is responsible for ensuring that the assets reported in these funds are used for their intended purpose. The resources of these funds are not available to support the City’s own programs; therefore, these funds are not reflected in the government-wide financial statements. The accounting used for fiduciary funds is much like that used for proprietary funds.
NOTES TO THE BASIC FINANCIAL STATEMENTS
The Notes to Basic Financial Statements provide additional information that is essential to a full understanding of the data provided in the government-wide and fund financial statements.
Required Supplementary Information
In addition to the basic financial statements and accompanying notes, this report also presents certain required supplementary information. This information includes budgetary comparison schedules for the General Fund and the City of Union City as Successor Agency to the Redevelopment Agency Low-Moderate Income Special Revenue Fund, as well as the funded status of the City’s pension plans.
The combining and individual fund financial statements and schedules, referred to earlier in connection with non-major governmental funds and internal service funds, are presented immediately following the required supplementary information.
8
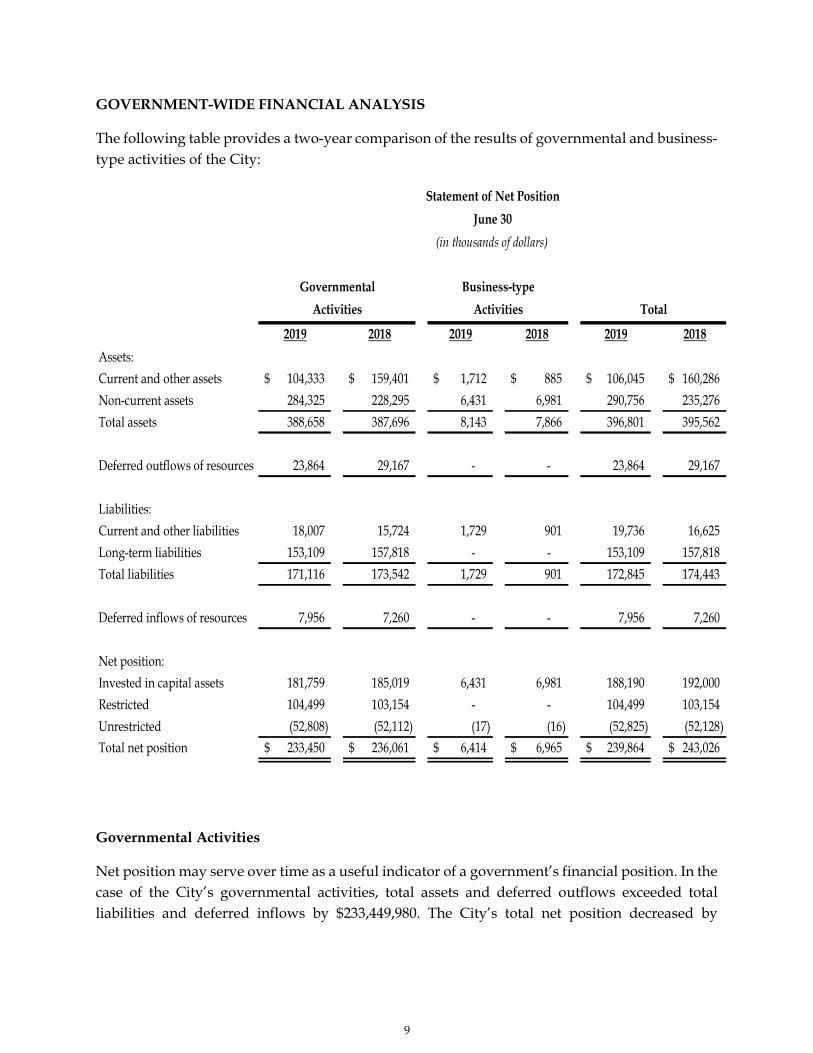
GOVERNMENT-WIDE FINANCIAL ANALYSIS
The following table provides a two-year comparison of the results of governmental and business-type activities of the City:
Governmental Activities
Net position may serve over time as a useful indicator of a government’s financial position. In the case of the City’s governmental activities, total assets and deferred outflows exceeded total liabilities and deferred inflows by $233,449,980. The City’s total net position decreased by
9
($2,610,642) or (1.1%) over last fiscal year. Significant factors contributing to this decrease include the following:
Current assets increased by $4,429,053 or 4.4% – Cash and investments increased by $5,929,839 due to timing of disbursements; and receivables decreased by ($1,416,013) due primarily to a decrease in intergovernmental receivables of ($1,539,924) relative to capital improvement funds and a receivable for Measure WW funds in the prior year.
Noncurrent assets decreased by ($3,467,306) or (1.2%) —Non-depreciable capital assets decreased by ($1,867,569) due to completion of various capital projects; and depreciable capital assets decreased by ($1,517,092) due to depreciation net of additions to capital infrastructure.
Current liabilities increased by $2,282,546 or 14.5%—Accounts payable increased $1,777,788 due to timing of invoice activity; accrued payroll decreased ($527,120) due to timing of payroll; deposits payable increased $867,579 due primarily to increased State asset seizures by Police, increased developer deposits received, and increased cash-in-lieu of bonds received; and the balance of activity in other liability accounts netting to a decrease of ($35,701).
Long-term liabilities decreased by ($4,709,527) or (3.0%) – Pension liabilities decreased ($2,762,631) and OPEB liabilities decreased by ($634,777) due to reductions in unfunded actuarial liabilities from positive investment earnings in underlying assets; long-term debt decreased ($1,935,646) due to debt service; accrued workers’ compensation claims increased by $378,675 due to higher claims exposure; and the balance of increase of $244,852 is a combination of other long-term liabilities.
The three categories of net position are classified as net investment in capital assets, restricted or unrestricted.
Net investment in capital assets represents capital assets net of accumulated depreciation and related debt. Unlike the capital assets reported in business-type activities, these assets are not income-generating, but rather they are used to provide services to the community; these assets, therefore, are not available for future spending. Net investment in capital assets decreased by ($3,260,097) or (1.8%) due to depreciation expense that outpaced new capital improvements.
Restricted net assets represent resources that are subject to external restrictions on how they may be used. These restrictions may be imposed by creditors, grantors and the laws or regulations of other governmental agencies. Net assets are restricted for capital projects, debt service, housing and community development, public safety, street maintenance and improvements and other specific purposes. Total restricted net assets increased by $1,345,284 or 1.3% due in large part to increases in net assets held for housing in-lieu, solid waste management, and road maintenance from California SB1 Road Maintenance and Rehabilitation funds.
10

Unrestricted net position is the “residual” component of net position; that is, it is the portion of net position that does not meet the definitions of “invested in capital assets” or “restricted assets.” The unrestricted amount may be used to meet the City’s ongoing obligations. At the end of this fiscal year, the City’s governmental activities reported a deficit in unrestricted net position of ($52,808,167), which increased by a further deficit of ($695,829) or (1.3 %) due, in large part, to increases in net pension and OPEB liabilities.
Business-Type Activities
The City’s business-type activities consist of transit and paratransit operations. These operations are funded by passenger fares, Measure B and Measure BB sales taxes and operating grants from the Transit Development Act (TDA) and State Transit Assistance (STA). The operating grants are passed through to the City from a regional transportation agency, the Metropolitan Transportation Commission (MTC). At the end of each fiscal year, unspent TDA and STA operating grant funds are returned to MTC, which holds these funds for future use by the City’s transit operations. Capital projects are financed by capital grants, which, with a few exceptions, are reimbursement based.
In the case of the City’s business-type activities, total assets exceeded total liabilities by $6,413885. Total net position decreased by $(551,072) or (7.9%) compared to last fiscal year. Significant factors contributing to these changes include the following:
Current assets increased by $827,609 or 93.6%—Cash increased $97,448 primarily due to timing of receipts and payment of current liabilities. Receivables increased by $730,161, that largest element of which related to operating grants receivable from the regional transportation authority at year end.
Noncurrent assets decreased by ($550,901) or (7.9%)—This change was a result of capital additions of $364,478 and depreciation expense of ($915,379). A total of $931,302 of fully depreciated equipment and machinery were disposed during the year.
Current liabilities increased by $827,780 or 91.9%—Accounts payable increased by $347,361, and due to other agencies increased by $178,839, both due to timing of payment to vendors and other agencies at year end. Unearned revenue increased by $308,187 due to operating grant proceeds received before year end for services to be provided in the following year. The remaining balance of ($6,607) represents net changes in various other liabilities over the prior year.
The largest classification of net position, net investment in capital assets, decreased by ($550,901), reflecting the change in capital asset activity that was described above. Unrestricted net position decreased by ($171) due to nearly breakeven operations excluding depreciation.
11
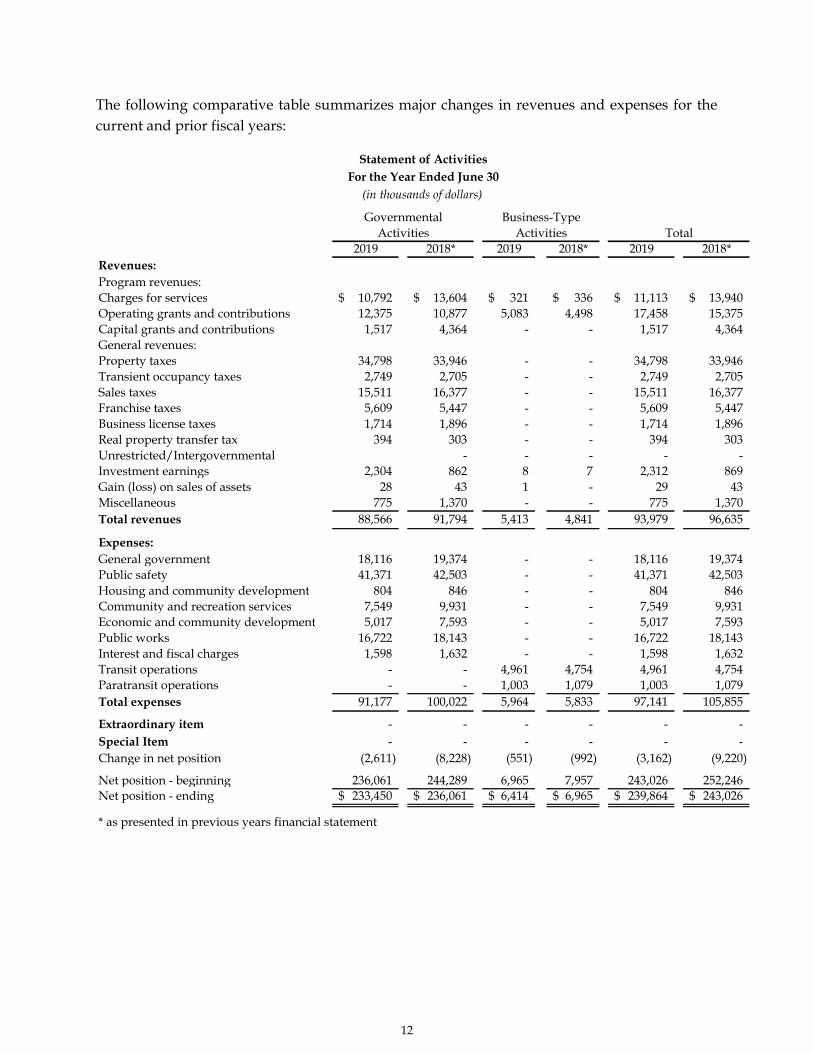
The following comparative table summarizes major changes in revenues and expenses for the current and prior fiscal years:
12

Governmental Activities
Total revenues decreased by ($3,227,055) or (3.5%) from last fiscal year. Significant items are as follows:
Charges for Services decreased by ($2,811,675) or (20.6%) – The largest part of the decrease related to public works fees and charges, which declined by ($2,819,331) as significant development and infrastructure projects in the rights of way were constructed in FY 2017-18 that were out of the ordinary.
Operating and Capital Grants increased by $1,498,832 or 13.8% – Grant revenues increased in economic and community development by $471,611, and public works grant revenues increased by $885,523, which collectively comprises the majority of these increases. The City received increased grant revenues from state SB 1 roads maintenance funds to fund capital projects, and increased operating grant revenues in housing in-lieu funds to fund housing projects.
Property Tax increased $852,322 or 2.5%—Modest increases in residential sales values in the City coupled with the state California CPI index for 2017 allowing for Proposition 13 increases in assessed valuation by the 2% cap led to the increases in property tax revenues.
Sales Tax decreased by ($865,881) or (5.3%)— Prior year Bradley-Burns sales tax was higher than typical due to one-time adjustments for sales taxes misallocated to another City that were corrected last year.
Franchise Tax increased by $161,239 or 3.0% - The largest source of franchise taxes are from solid waste disposal, which increased by $224,418 or 6.8%. Taxes from electric, gas and cable TV fell by a total of ($78,471) or (5.4%) due to reduced rates, consumption and subscribership.
Total government-wide expenses decreased by ($8,844,720) or (8.8%) from last fiscal year. Significant items are as follows:
During the prior year the City made a contribution to the PARS 115 Pension Trust of $12,000,000. This amount was recognized as an expense across governmental activities based on their respective share of pension activity. Funding for the Pension Trust in the current year returned to normal funding levels.
Business-Type Activities
The City’s business-type activities, consisting of fixed-route transit service and paratransit services experienced a decrease in net position. These activities receive their revenues from passenger fares, fees for use of transit facilities, two regional sales taxes established for transportation purposes and operating and capital grants. The City owns the buses and
13
paratransit vans, while the drivers and vehicle maintenance are provided through a contractual agreement with a transportation carrier.
Passenger fares account for the largest portion of charges for services. Monthly bus passes allow unlimited boarding, and they are sold to general (adult), youth and senior/disabled riders. Paratransit service is an advanced reservation transportation service for those with a certified disability that prevents them from using the City’s fixed-route service. Paratransit tickets are purchased in advance of use and do not have an expiration date. The transit system also receives nominal amounts from the sale of advertising space on its vehicles and from charges to other local transportation providers for the use of the bus wash.
Unrestricted/intergovernmental revenues are composed of Transit’s and Paratransit’s share of Measure B and Measure BB funds (regional sales taxes dedicated to transportation-related purposes) and Transit Development Act (TDA) and State Transit Assistance (STA) operating grants. Each year, the City submits a claim to the Metropolitan Transportation Commission (MTC) requesting funding assistance from TDA and STA sources. Because it can be difficult to project certain expenses, such as fuel costs, the City typically requests an additional allocation from MTC at mid-year. For both Transit and Paratransit, farebox and non-farebox revenues are considered to be spent first, followed by Measure B and Measure BB revenues and finally TDA and/or STA funding. At the end of each fiscal year, any unspent TDA and STA operating grant funds are returned to MTC.
Total revenues increased $571,843 or 11.8% from the prior year. Significant items are as follows:
Charges for service decreased ($15,959) or (4.7%) due to decreased ridership.
Operating grants increased $585,239 or 13.0% - The City received greater operating grants from the Metropolitan Transportation Commission to support operation of the City’s bus transit system.
Total expenses increased $131,060 or 2.2% from the prior fiscal year. Significant items are as follows:
Purchased transportation increased by $317,821 or 11.5% - Costs with the bus operator increased due to an increased contract price.
Payroll and administration decreased by ($117,087) or (16.5%) – Personnel vacancies were the primary reason for the decrease.
Depreciation decreased by ($76,476) or (7.7%) – Several assets were retired in the current year, resulting in lower depreciation expense.
14
FINANCIAL ANALYSIS OF THE GOVERNMENTAL FUNDS
The City uses fund accounting to ensure and demonstrate compliance with finance-related legal requirements.
Governmental funds: The focus of the City’s governmental funds is to provide information on near-term inflows, outflows and balances of spendable resources. This information is useful in assessing the City’s financing requirements.
Following GASB 54, Fund Balance Reporting and Governmental Fund Type Definitions, fund balances are classified as non-spendable, restricted, committed, assigned or unassigned. Detailed information regarding the fund balance classifications is found in Note 9 in the Notes to Basic Financial Statements.
Fund balance increased by $3,707,944 or 2.9% for all funds. Fund balance of the City’s major funds increased by $372,607 or less than 0.4%, while fund balance of non-major funds increased by $3,335,337 or 11.5%.
The following non-major funds experienced the following changes in fund balance as a result of current year operations (scoped as +/- $130,000 and amounts to 83% of the change in fund balance for the year):
ACTC Measure B – Increase of $176,914 or 13.4%. Positive sales tax receipts from Measure B.
Street Lights and Landscaping – Increase of $384,825 or 85.3%. While operating costs exceeded revenues by $158,004, planned transfers in from the General Fund supported the provision of lights and landscaping maintenance throughout the City.
Community Facilities Districts Maintenance – Increase of $133,955 or 42.5%. Greater than anticipated special assessments coupled with expenditure savings in public works operating costs.
Clean Water Program – Increase of $345,991 or 194.1%. Expenditure savings from public works operational costs.
Housing In-Lieu – Increase of $870,795 or 43.1%. The City anticipated significant development activities that would generate housing in-lieu fees in the current year. The City anticipated a nearly $800,000 surplus this year as it develops its plans for investing in affordable housing projects.
Union Landing PBID – Increase of $152,468 or 76.5%. Results from the collection of PBID imposed self-assessments for marketing and outreach in excess of expenditures during the current year.
15
Solid Waste Management – Decrease of ($243,601) or (27.7%). Continued annual decline of an original one-time fund source. The fund is expected to have 1-2 years of operating resources remaining.
Measure F – Decrease of ($301,916) or (36.2%). Anticipated construction projects and maintenance efforts charged to the fund, which is funded from countywide $10 motor vehicle registration fees for transportation-related projects.
Public Art – Increase of $130,942 or 18.6%. Lower than anticipated funds received from developers that were subject to the public art fee related expenditures for public art projects. The amended budget assumed an increase of $616,000 in fund balance.
Measure BB – Decrease of ($172,004) or (16.2%). Anticipated construction projects and maintenance efforts charged to the fund, which is funded from a countywide sales tax for local streets maintenance and safety, and bike/pedestrian paths and safety projects.
SB 1 Road Maintenance and Rehab – Increase of $909,240 or 433%. Delayed capital improvement projects coupled with greater-than-anticipated revenues from the state related to SB 1 road maintenance and rehabilitation funds.
Pension Obligation Bonds Debt Service – Increase of $394,747 or 11.5%. Excess funding from operating funds for debt service on pension obligation bonds led to an increase in fund balance greater than the nearly $153,000 increase planned in the original budget.
Measure WW Capital Projects – Increase of $765,190 (percentage not meaningful as prior year was overdrawn by $756,672). Timing of grants received from the East Bay Regional Parks District bond measure. Funds were expended in prior year in advance of the receipt of the grant revenues which were delayed in the prior year.
General Fund: Included as part of the General Fund for reporting purposes are several funds that are budgeted as special revenue funds but that do not meet the criteria for classification as a special revenue fund in accordance with generally accepted accounting principles. These funds are identified, and their individual fund activities are presented, in the Supplementary Informationsection of this report.
The General Fund is the primary operating fund of the City. At current fiscal year end, the General Fund reported a total fund balance of $22,210,136, an increase of $499,217 or 2.3% from the prior year. The nonspendable and assigned fund balances of those funds categorized in the City’s ledger as “special revenue” but included in the General Fund for reporting purposes are included in these totals. For detailed information regarding fund balances, please see Note 9 in Notes to Basic Financial Statements. The fund balances are broken out as follows:
Nonspendable—A total of $292,496, or 1.3% of total General Fund balances, that represent prepaid costs and short-term notes receivable.
16
Restricted—A total of $26,509, or 0.1%, that represent state-mandated revenue collected under SB 1186 that is to be used to ensure compliance with disabled accessibility requirements.
Assigned—A total of $9,554,832, or 43.0%. Assigned funds include $6,887,482 for items such as economic uncertainty, capital improvements, compensated absences, encumbrances or unfulfilled purchase orders and litigation; $908,065 for retirement and benefits; $800,077 for maintenance of the corporate yard and fuel facility $492,566 for community and recreation programs; $328,537 for waste vehicle impact; $121,028 for acquisition of fire equipment; and $17,077 for code enforcement.
Unassigned—A total of $12,336,299, or 55.6%. This represents amounts that are available for future use.
Significant variances in General Fund revenue and expenditure from the prior year are analyzed below.
Revenues—Total revenues increased $1,948,664 or 3.2% from the prior fiscal year.
Taxes and assessments – Increase of $1,232,636 or 2.6% as described below:
o Property taxes – Increase of $755,579 or 3.4% due primarily to modest increases in residential sales values in the City coupled with the state California CPI index for 2017 allowing for Proposition 13 increases in assessed valuation by the 2% cap.
o Sales tax – Increase of $180,019 or 1.1%. Prior year Bradley-Burns sales tax was higher than typical due to one-time adjustments for sales taxes misallocated to another City that were corrected last year. Measure AA local transactions and use tax increased by 5% from the prior year due to continued economic growth.
o Transient occupancy tax – Increase of $44,110 or 1.6%. Hotel TOT revenues declined ($10,625) or (0.4%) due to a softening of occupancy rates. AirBnB revenues increased by $54,735 or 72.4% due to a full year of revenues collected in the current year.
o Franchise tax – Increase of $161,239 or 3.0%. The largest source of franchise taxes are from solid waste disposal, which increased by $224,418 or 6.8%. Taxes from electric, gas and cable TV fell by a total of ($78,471) or (5.4%) due to reduced rates, consumption and subscribership.
Licenses, permits and fees revenues – Decreased by ($57,286) or (1.3%). Business licenses revenues decreased by ($181,639) or (9.6%). Development-related permits increased by a net of $122,250 or 7.5% due to increased development activity.
Investment revenue – Increase of $734,731 or 192.2%, primarily as a result of one-time gain on sale of securities of $870,420.
17
The balance of all other General Fund revenue accounts increased by $38,583 or 0.4%.
Expenditures—Total expenditures increased by $4,431,653 or 7.7%. Significant items are discussed below:
General Government – Increase of $1,307,967 or 15.6%. Contributions towards Pension and OPEB trust accounts of $791,302 and costs associated with the November 2018 election of $172,529 were the primary reasons for the increase. Public Safety – Increase of $1,349,909 or 4.0%. Personnel costs for police personnel increased by $814,279 or 4.3% primarily due to increased pension costs. Fire contractual services with Alameda County Fire Department increased by $547,191 or 5.3% due to underlying personnel costs of firefighters. Community and Recreation Services – Increase of $384,985 or 6.5%. Personnel cost increases included compensation increases of $98,558 or 2.6% due to increased labor rates for part-time staff due to state minimum wage law and pension cost increases of $136,424 or 14.1% due to increasing pension rates. Economic and Community Development – Increase of $499,505 or 16.4%. Primary increase is due to increased development activity that required the City to contract for plan application review and plan check services, which accounted for $430,663 of the total. Remaining increases related primarily to other contractual services needed to process development applications. Public Works – Decrease of ($44,655) or (0.8%). Personnel costs decreased by ($177,429) or 8.8% primarily due to staffing vacancies and unfilled positions. As a result, contracted services increased by $51,461 or 2.0% in order to backfill some of the staffing vacancies. Supplies costs increased by $81,313 or 8.4% primarily due to increased fuel costs from rising gas prices. Capital Outlay – Increase of $486,167 or 77.3%. Increased capital investment in equipment due primarily to the leased acquisition of a new fire truck. Debt Service – Increase of $447,775 or 125%. New capital leases for network infrastructure and IT equipment led to the increase in debt service.
Other Financing Sources (Uses) – The City leased a new fire truck in the amount of $1,027,847, which is recognized as a financing source. Net transfers out from the General Fund increased, thereby reducing General Fund resources by ($841,897) compared to the prior year. The more significant transfers were to the Street Lights and Landscaping and EMS Enhancement funds to support operations.
For other funds consolidated with the General Fund for reporting purposes, the following funds reported significant changes to their fund balance:
Post-Employment Medical Fund—Fund balance decreased by ($501,082) or (35.6%) as a result of payments for current year OPEB expense.
18
Leisure Revolving Fund – Fund balance decreased by ($228,110) or (30.6%) due primarily to increased compensation costs that were not passed on in the form of increased fees and charges.
For the City’s other major funds, the following items are of note:
The Low and Moderate Income Housing Special Revenue Fund accounts for the housing assets that were transferred from the dissolved Redevelopment Agency’s housing funds. The City has a balance of $30,153,729 in loans receivable from various low- to moderate-income housing agencies associated with housing projects that were funded by the former Redevelopment Agency, the largest of which is due from the Mid-Peninsula Housing Coalition. Receivables will be collected based on tax increment revenues, and these loans are considered recognized obligations of the Successor Agency and will be repaid with sufficient property tax increment revenues. Fund balance grew by $196,843 or 0.6% due to recognition of interest income received on loans receivable during the year, net of expenses for operating the low- and moderate-income housing programs.
The Capital Improvement Fund accounts for activities that are financed through grants and contributions from other agencies. Since grant funds and contributions from other agencies are received on a reimbursement basis, there can be substantial timing differences between expenditures and reimbursements. Funds received more than 60 days after year end are classified as deferred revenues creating a negative adjustment to equity. Fund balance increased by $1,420,559, but ended the year with a negative fund balance of ($787,835). Grant revenues reimbursing the City for capital investments made in the prior year were the primary reason for the increase in fund balance. Future grant revenues are anticipated to resolve the remaining negative fund balance.
The Public Improvement Fund was created to track expenditures related to the remaining redevelopment construction bonds, property held for sale and certain notes and accounts receivable. The decrease in the fund balance of $(1,744,013) or (3.6%) results from $3,071,294 in capital project and operational costs being spent on eligible projects during the year, net of $1,329,781 in investment earnings, grants, and equity transfers in from depreciable asset investment.
GENERAL FUND BUDGETARY HIGHLIGHTS
The Schedule of Revenues, Expenditures and Changes in Fund Balance Budget-to-Actual comparison for the General Fund can be found in the Required Supplementary Information section of this report.
The City prepares a biennial budget document. The budget for the first year of the cycle is independent of the budget for the second year. Fiscal year 2018-19 was the second year of the City’s biennial budget cycle. During the course of the fiscal year, net budget amendments were submitted to the City Council for approval in the amount of $2,231,382 for an increase in
19
expenditures. Net revenue projections remained unchanged. The following represent material amendments to the original fiscal year 2018-19 General Fund expenditure budget:
Expenditures— Expenditure increases were requested for rollover of funds from the previous year end for expenditure in the current year of $909,000, transfer to PARS Pension and PARS OPEB of $791,302, professional consulting contracts and contractual services agreements totaling $216,451, supplies of $168,873, and travel and other miscellaneous items totaling $145,755.
CAPITAL ASSETS AND DEBT ADMINISTRATION
Capital Assets
Governmental Activities – At the end of the FY 2018-19 fiscal year, the City had an investment in capital assets totaling $224,910,462. This represents a net decrease of ($3,384,662) or (1.5%) from the prior fiscal year. Included in this net number are current-year additions to construction in progress (CIP) of $5,255,143, transfers out of CIP to permanent fixed assets of ($7,101,801), non-CIP related fixed asset additions of $657,796, retirements (net of depreciation) of ($20,911), and depreciation of $8,618,894. Significant details are as follows:
Additions to CIP—Major additions include $1,754,578 for the Shorty Garcia Park playing surface infill project; $1,027,847 for the acquisition of a new fire truck; and $982,677 for Phase 2 of the City’s Intermodal BART station improvements project.
CIP Transferred to Fixed Assets—The transfers included $4,771,252 for H Street/Green Street improvements; $1,765,201 for the Shorty Garcia Park playing surface infill project; and $449,120 for Veterans Memorial Park improvements.
Non-CIP-related Additions—These additions included a new fire truck, network infrastructure, IT equipment, and various other equipment.
All depreciable assets were depreciated from their acquisition date through the end of the fiscal year. Individual fund financial statements record capital asset acquisitions as expenditures.
Business-type Activities – The City had an investment in capital assets of $6,430,690, a ($550,901) decrease from the prior year. Included in this net number are additions of $364,478 and depreciation of $915,379. During the year, $931,302 in fully-depreciated equipment and machinery were disposed. Depreciation on the business-type assets is calculated from the date of acquisition through the end of the fiscal year.
Comparative reports of the City’s capital assets for governmental and business-type activities are presented below and summarize the changes during the year.
Additional information about the City’s capital assets can be found in Note 6 in Notes to Basic Financial Statements.
20

Debt Administration
The City has outstanding debt in the form of pension obligation bonds issued to fund a portion of the unfunded accrued actuarial liability to the State’s CalPERS retirement system; special tax refunding bonds that were issued to finance infrastructure improvements in the Dyer Street Triangle (Union Landing) area and various capital lease obligations related to energy efficiency/seismic retrofit improvements, information technology equipment and Police communications equipment. In addition, in the current fiscal year, the City assumed lease financing in the amount of $1,027,847 for a new fire truck and a total of $103,414 for information technology equipment.
Additional information regarding the City’s long-term obligations can be found in Note 7 in Notes to Basic Financial Statements.
Economic Factors and Budget Outlook
Cyberattack on City Information Systems
Like many other local governments over the past few years, in September 2019, the City was victim to a cyberattack that affected all information systems, including the City’s financial systems. Financial records were restored, but this restoration delayed completion of the City’s CAFR for the year ending June 30, 2019. The City overcame this attack and implemented improvements in its information security infrastructure, systems and protocols to prevent future attacks to the fullest extent possible and has implemented new backup technologies to allow recovery in the event of future attacks.
21
COVID-19 Pandemic
The Novel Coronavirus Disease, commonly referred to as COVID-19, was discovered in December 2019 and was declared a world-wide pandemic by the World Health Organization on March 11, 2020. At that same time, the United States began to see rising cases and death rates associated with the disease. California proclaimed a state of emergency on March 4, 2020. The Alameda County Health Officer issued a stay-at-home directive, as did most other Bay Area counties, on March 16, 2020. The effect of the stay-at-home orders placed significant restrictions on businesses and residents in an effort to reduce the sudden spike in cases that would require acute medical care.
Union City was impacted just as the rest of the region and state have been impacted. The City was required to cease recreation programs, and non-public-safety workers were required to work from home. Many of the businesses in the City were required to shut down or significantly restrict operations, with the exception of non-essential businesses such as food stores, gas stations, hardware stores, and businesses that supported community infrastructure and housing. Sales tax revenues were impacted, but the changes made to sales tax allocation as a result of the South Dakota v. Wayfair, Inc. judgment has offset what might otherwise be a significant deterioration in sales tax revenues.
Due to the stay-at-home orders across the Western United States and the rest of the country, non-essential travel was discontinued. The City’s transient occupancy tax generators saw their operations decrease significantly during the start of the peak travel season in the region.
Economy
If it were not for the impacts from the COVID-19 pandemic, the City’s economy had shown continued improvements similar to other cities throughout the state. The General Fund, the City’s primary operating fund from which the traditional services associated with local government are provided (police, fire, community development, engineering, recreation, etc.), continues to be affected by economic downturns. The elasticity of key revenues sources such as sales tax, transient occupancy tax, business license fees, and building permits is something that the City keeps a close watch upon. The City has buffeted these downturns through the use of reserves and key decisions relative to compensation and benefits for employees and identifying other cost-saving measures.
As the economy improved over the last several years, the city maintained its financial position that allowed it to weather the impacts of the COVID-19 pandemic recession. However, additional fiscal concerns are on the near horizon. The City expects significant increases in pension costs to phase in over the next several fiscal years, based on information from the California Public Employee’s Retirement System, which is anticipated to have a significant impact on the City’s personnel costs.
22
The City’s public safety parcel tax (Measure QQ) will expire in June 2021, which generates nearly $4.2 million in annual tax revenues to support public safety expenditures. However, the implementation of a voter-approved utility users’ tax measure (Measure WW) in November 2020 will allow the City to realize General Fund revenues, net of exemptions for senior and low-income customers, projected to total over $5.5 million annually starting in April 2021 that will provide relief to the City’s General Fund and its ability to support economic growth and service delivery in the coming years.
The current economic outlook is more favorable than in recent years; but the City continues to take a conservative approach to future projections.
Budget Outlook
Union City prides itself on the outstanding quality of services it provides to the community, and has taken all efforts to preserve services during these economically challenging times. The City adopted a biennial budget for FY 2019-20 and 2020-21 that focused on maintaining service levels while addressing a potential long-term fiscal gap in the City’s General Fund operations.
As the COVID-19 pandemic recession began, the City prepared an updated General Fund long-range fiscal model. The resulting forecast indicated a potential ongoing deficit that averaged nearly $8 million per year that, if not corrected, could potentially exhaust General Fund reserves by FY 2022-23. The forecast indicated that the City would need to implement budget solutions totaling $6.5 million in FY 2021-22, and an additional $4 million in solutions in FY 2024-25. The primary cause of the projected fiscal gap is the expiration of two tax measures: Measure QQ public safety parcel tax that expires at the end of FY 2020-21; and Measure AA local transactions and use (or local sales) tax from which expires in FY 2024-25.
Over the course of the past few years, the City has taken several steps to address the long-range fiscal gap in its General Fund. While voters rejected measures that would have allowed the City to collect real property transfer taxes in 2018, voters did approve Measure DD, the cannabis business tax measure, which is anticipated to generate $1,400,000 annually when all licenses are issued and fully operational.
Prior to and as a result of the pandemic recession that descended upon the City in March 2020, the City took several steps to further address the projected fiscal gap in the General Fund, including eliminating vacant positions, closing a fire station that reduced costs for contracted fire services with Alameda County Fire Department, pausing all recreation programs, cutting travel and training budgets, offering early retirements where appropriate and eliminating those vacated positions, disbanding the COPPS unit and the drug and gang taskforce, disbanding the school resource officer program, and reducing community center and library hours.
While the City develops and implements a fiscal sustainability plan, the City Council submitted for voter approval a utility users’ tax measure (Measure WW) in the November 2020 general
23
election. The measure would allow the City to enact a new 5% utility users tax (UUT) on gas, electricity, video and telecommunications services that, net of exemptions for senior and low-income customers, would generate nearly $5.5 million in annual General Fund revenues. Voters approved the measure in that election, and the new UUT will be collected starting in April 2021. The COVID-19 pandemic recession notwithstanding, the new UUT is expected to provide revenue sources to allow the City’s General Fund to solve its structural fiscal gap, maintain reserves above the City’s minimum reserve of 20% of annual operating expenditures, and maintain service levels to the community. Future strategies will need to address the expiration of the Measure AA local sales tax measure in FY 2024-25.
The City continues to monitor its revenues and expenditures throughout the year so that budget amendments can be made in response to changing economic conditions. The City’s budget may be viewed online at https://www.unioncity.org/253/Financial-Reports.
Request for Information
This financial report is designed to provide a general overview of the City’s finances for all those with an interest. Questions concerning any of the information provided in this report, or requests for additional information, should be addressed to the Finance Department, City of Union City, 34009 Alvarado-Niles Road, Union City, California 94587, or by e-mail [email protected].
24
BASIC FINANCIAL STATEMENTS
25

This page intentionally left blank
26
GOVERNMENT-WIDE FINANCIAL STATEMENTS
27

City of Union CityStatement of Net PositionJune 30, 2019
Governmental Business-TypeActivities Activities Total
ASSETS
Current assets:Cash and investments 89,056,274$ 736,912$ 89,793,186$ Restricted cash and investments 3,582,899 - 3,582,899Receivables:
Tax 4,026,776 256,361 4,283,137Accounts, net 820,575 - 820,575Interest 3,987,931 - 3,987,931Intergovernmental 2,834,506 718,852 3,553,358
Prepaid items and deposits 23,665 - 23,665Total current assets 104,332,626 1,712,125 106,044,751
Noncurrent assets:Loans receivable 37,622,090 - 37,622,090Land held for resales, net of allowance for decline in value 21,792,711 - 21,792,711Capital assets:
Non-depreciable 61,871,727 - 61,871,727Depreciable, net 163,038,735 6,430,690 169,469,425
Total capital assets 224,910,462 6,430,690 231,341,152Total noncurrent assets 284,325,263 6,430,690 290,755,953
TOTAL ASSETS 388,657,889 8,142,815 396,800,704DEFERRED OUTFLOWS OF RESOURCES Deferred outflows related to debt refunding 265,619 - 265,619 Deferred employer OPEB contributions 1,153,781 - 1,153,781 Deferred outflows related to OPEB 1,797,869 - 1,797,869 Deferred employer pension contributions 8,369,373 - 8,369,373 Deferred outflows related to pension 12,277,217 - 12,277,217 TOTAL DEFERRED OUTFLOWS OF RESOURCES 23,863,859 - 23,863,859
(Continued)
Primary Government
See accompanying Notes to Basic Financial Statements.
28

City of Union CityStatement of Net PositionJune 30, 2019
Governmental Business-TypeActivities Activities Total
Primary Government
LIABILITIES
Current liabilities:Accounts payable 5,379,144 547,796 5,926,940Accrued payroll 1,615,164 - 1,615,164Interest payable 561,437 - 561,437Deposits payable 2,789,814 - 2,789,814Other accrued liabilities 815,230 56 815,286Due to other agencies 41,991 857,091 899,082Unearned revenue 846,206 308,187 1,154,393Accrued general liabilities claims - due within one year 167,463 - 167,463Accrued workers' compensation claims - due within one year 930,597 - 930,597Compensated absences - due within one year 1,714,933 15,800 1,730,733Long-term debt - due within one year 3,144,347 - 3,144,347 Total current liabilities 18,006,326 1,728,930 19,735,256
Noncurrent liabilities: Net pension liabilities 78,191,275 - 78,191,275
Net OPEB liability 7,655,816 - 7,655,816 Accrued liability for capital projects 35,064,070 - 35,064,070
Accrued general liabilities claims - due in more than one year 954,042 - 954,042Accrued workers' compensation claims - due in more than one year 4,109,403 - 4,109,403Compensated absences - due in more than one year 322,735 - 322,735Long-term debt - due in more than one year 26,811,922 - 26,811,922
Total noncurrent liabilities 153,109,263 - 153,109,263TOTAL LIABILITIES 171,115,589 1,728,930 172,844,519
DEFERRED INFLOWS OF RESOURCES
Deferred inflow related to pension 7,400,532 - 7,400,532 Deferred inflow related to OPEB 555,647 - 555,647
TOTAL DEFERRED OUTFLOWS OF RESOURCES 7,956,179 - 7,956,179
NET POSITIONNet investment in capital assets 181,758,983 6,430,690 188,189,673Restricted for:
Capital projects 46,229,416 - 46,229,416Debt service 5,229,367 - 5,229,367Community development 38,620,616 - 38,620,616Specific projects and programs 14,419,765 - 14,419,765
Total restricted 104,499,164 - 104,499,164
Unrestricted (52,808,167) (16,805) (52,824,972)
TOTAL NET POSITION 233,449,980$ 6,413,885$ 239,863,865$
(Concluded)
29
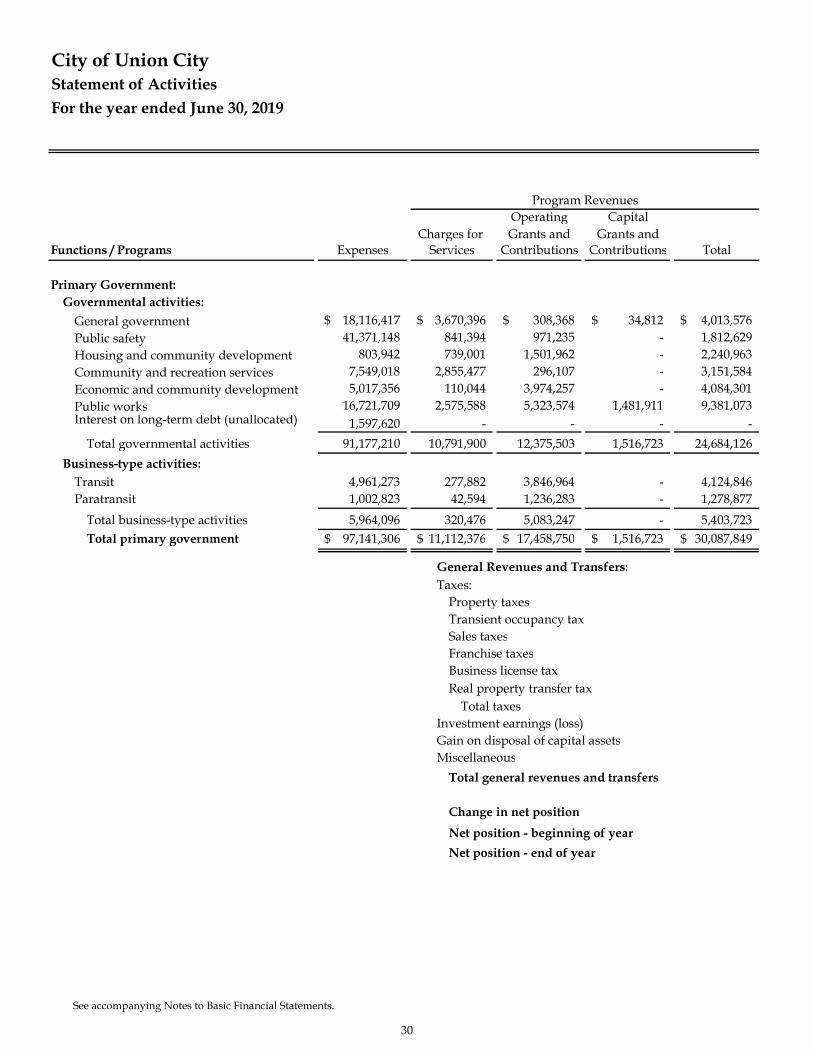
City of Union CityStatement of Activities For the year ended June 30, 2019
Operating CapitalCharges for Grants and Grants and
Functions / Programs Expenses Services Contributions Contributions Total
Primary Government:Governmental activities:
General government 18,116,417$ 3,670,396$ 308,368$ 34,812$ 4,013,576$ Public safety 41,371,148 841,394 971,235 - 1,812,629Housing and community development 803,942 739,001 1,501,962 - 2,240,963Community and recreation services 7,549,018 2,855,477 296,107 - 3,151,584Economic and community development 5,017,356 110,044 3,974,257 - 4,084,301Public works 16,721,709 2,575,588 5,323,574 1,481,911 9,381,073Interest on long-term debt (unallocated) 1,597,620 - - - -
Total governmental activities 91,177,210 10,791,900 12,375,503 1,516,723 24,684,126Business-type activities:
Transit 4,961,273 277,882 3,846,964 - 4,124,846Paratransit 1,002,823 42,594 1,236,283 - 1,278,877
Total business-type activities 5,964,096 320,476 5,083,247 - 5,403,723Total primary government 97,141,306$ 11,112,376$ 17,458,750$ 1,516,723$ 30,087,849$
General Revenues and Transfers:Taxes:
Property taxesTransient occupancy taxSales taxesFranchise taxesBusiness license taxReal property transfer tax
Total taxesInvestment earnings (loss)Gain on disposal of capital assetsMiscellaneous
Total general revenues and transfers
Change in net positionNet position - beginning of yearNet position - end of year
Program Revenues
See accompanying Notes to Basic Financial Statements.
30
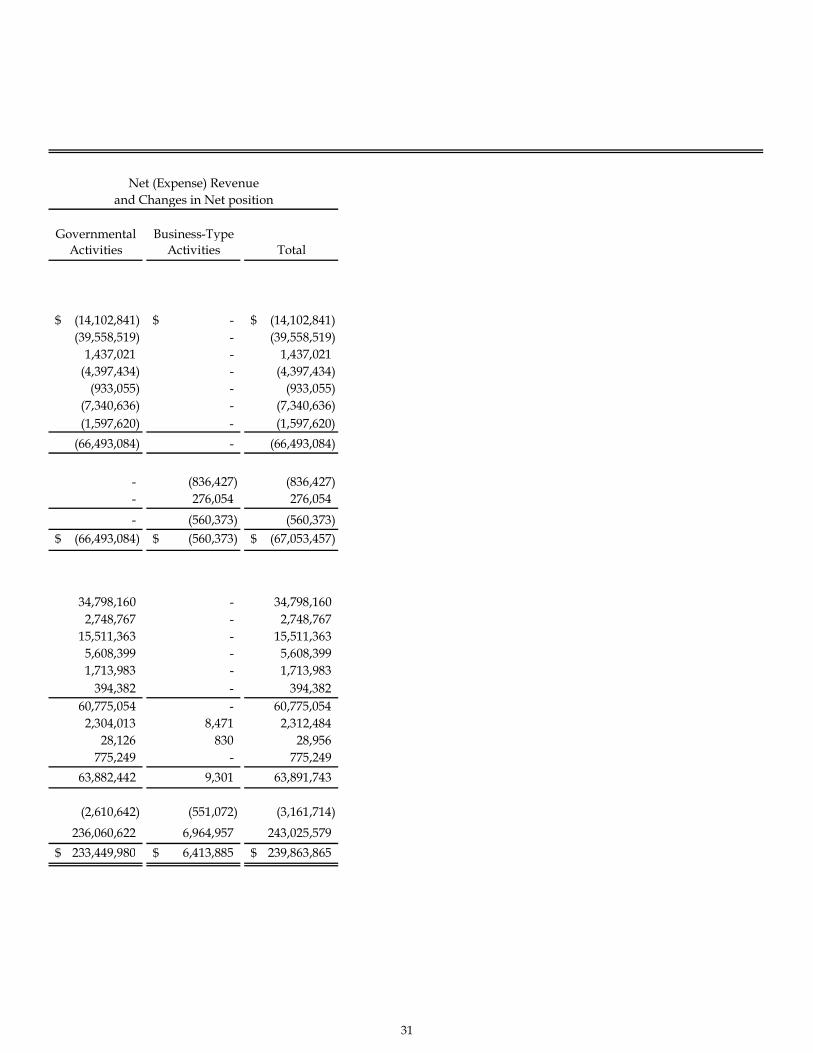
Governmental Business-TypeActivities Activities Total
(14,102,841)$ -$ (14,102,841)$ (39,558,519) - (39,558,519)
1,437,021 - 1,437,021(4,397,434) - (4,397,434)
(933,055) - (933,055)(7,340,636) - (7,340,636)(1,597,620) - (1,597,620)
(66,493,084) - (66,493,084)
- (836,427) (836,427)- 276,054 276,054- (560,373) (560,373)
(66,493,084)$ (560,373)$ (67,053,457)$
34,798,160 - 34,798,1602,748,767 - 2,748,767
15,511,363 - 15,511,3635,608,399 - 5,608,3991,713,983 - 1,713,983
394,382 - 394,38260,775,054 - 60,775,054
2,304,013 8,471 2,312,48428,126 830 28,956
775,249 - 775,24963,882,442 9,301 63,891,743
(2,610,642) (551,072) (3,161,714)236,060,622 6,964,957 243,025,579233,449,980$ 6,413,885$ 239,863,865$
and Changes in Net positionNet (Expense) Revenue
31

This page intentionally left blank
32

FUND FINANCIAL STATEMENTS
Governmental Fund Financial StatementsProprietary Fund Financial StatementsFiduciary Fund Financial Statements
33

This page intentionally left blank
34

GOVERNMENTAL FUND FINANCIAL STATEMENTS
General Fund General Fund is the general operating fund of the City. This fund accounts for all financial resources andactivities not required to be accounted for in other funds.
Low-Moderate Income Housing Special Revenue FundTo account for housing assets that were transferred from the dissolved Redevelopment Agency's Low- andModerate-Income Housing Fund which have been specifically defined by Assembly Bill 1484.
Capital Improvement FundTo account for major equipment acquisition or construction projects funded primarily by grants.
Public Improvement FundEstablished by City Council resolution, the funding source is the 2011 Tax Allocation Bond proceeds released bythe bond trustee to the City. These funds will be used to continue the public improvements undertaken by theformer Redevelopment Agency.
35
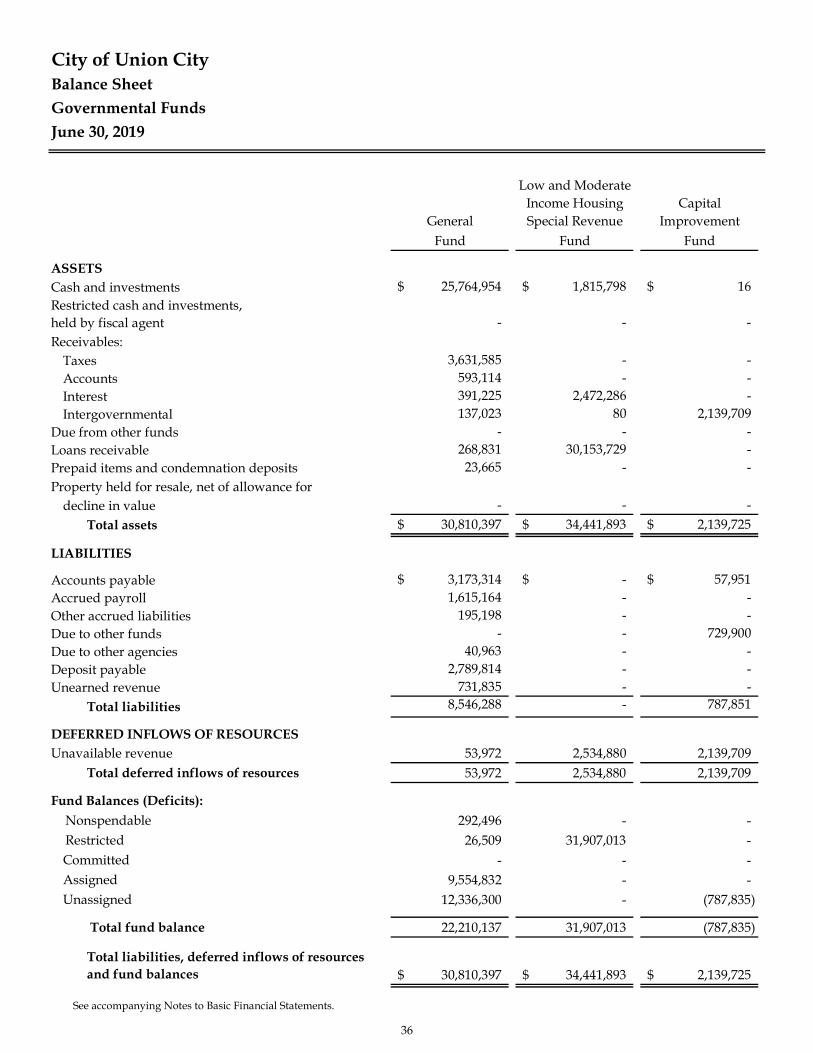
Balance SheetGovernmental FundsJune 30, 2019
Low and ModerateIncome Housing Capital
General Special Revenue ImprovementFund Fund Fund
ASSETSCash and investments 25,764,954$ 1,815,798$ 16$ Restricted cash and investments, held by fiscal agent - - -Receivables:
Taxes 3,631,585 - -Accounts 593,114 - -Interest 391,225 2,472,286 -Intergovernmental 137,023 80 2,139,709
Due from other funds - - -Loans receivable 268,831 30,153,729 -Prepaid items and condemnation deposits 23,665 - -Property held for resale, net of allowance for
decline in value - - -Total assets 30,810,397$ 34,441,893$ 2,139,725$
LIABILITIES
Accounts payable 3,173,314$ -$ 57,951$ Accrued payroll 1,615,164 - -Other accrued liabilities 195,198 - -Due to other funds - - 729,900Due to other agencies 40,963 - -Deposit payable 2,789,814 - -Unearned revenue 731,835 - -
Total liabilities 8,546,288 - 787,851
DEFERRED INFLOWS OF RESOURCESUnavailable revenue 53,972 2,534,880 2,139,709
Total deferred inflows of resources 53,972 2,534,880 2,139,709
Fund Balances (Deficits): Nonspendable 292,496 - - Restricted 26,509 31,907,013 -
Committed - - -Assigned 9,554,832 - -Unassigned 12,336,300 - (787,835)
Total fund balance 22,210,137 31,907,013 (787,835)
Total liabilities, deferred inflows of resources and fund balances 30,810,397$ 34,441,893$ 2,139,725$
City of Union City
See accompanying Notes to Basic Financial Statements.
36
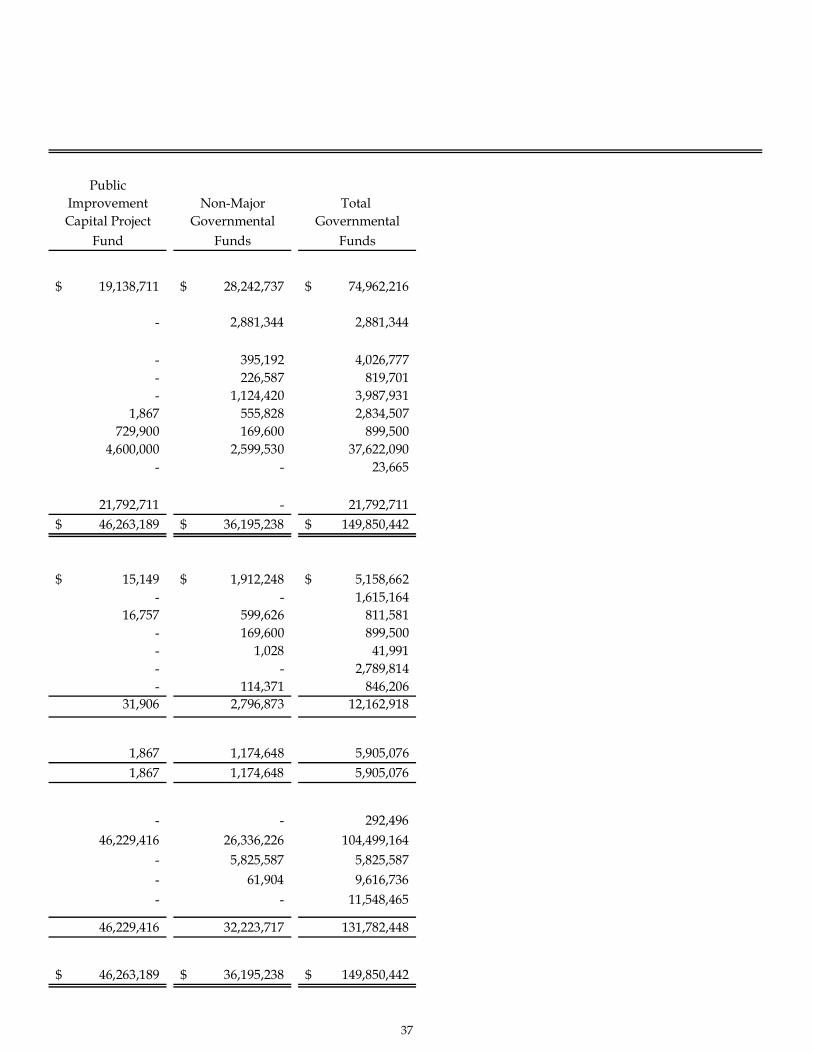
PublicImprovement Non-Major Total Capital Project Governmental Governmental
Fund Funds Funds
19,138,711$ 28,242,737$ 74,962,216$
- 2,881,344 2,881,344
- 395,192 4,026,777- 226,587 819,701- 1,124,420 3,987,931
1,867 555,828 2,834,507729,900 169,600 899,500
4,600,000 2,599,530 37,622,090- - 23,665
21,792,711 - 21,792,71146,263,189$ 36,195,238$ 149,850,442$
15,149$ 1,912,248$ 5,158,662$ - - 1,615,164
16,757 599,626 811,581- 169,600 899,500- 1,028 41,991- - 2,789,814- 114,371 846,206
31,906 2,796,873 12,162,918
1,867 1,174,648 5,905,0761,867 1,174,648 5,905,076
- - 292,49646,229,416 26,336,226 104,499,164
- 5,825,587 5,825,587- 61,904 9,616,736- - 11,548,465
46,229,416 32,223,717 131,782,448
46,263,189$ 36,195,238$ 149,850,442$
37

City of Union CityReconciliation of the Governmental Funds Balance Sheetto the Government-Wide Statement of Net Position
Total Fund Balances - Total Governmental Funds 131,782,448$
Capital assets used in governmental activities were not current financial resources.Therefore, they were not reported in the Governmental Funds Balance Sheet. Except forthe internal service funds reported below, the capital assets were adjusted as follows:
Government-Wide Statement of
Net Position Internal Service
Funds
- Non-depreciable 61,871,727$ -$ 61,871,727- Depreciable, net 163,038,735 2,016,460 161,022,275
Total capital assets 224,910,462$ 2,016,460$ 222,894,002
In the Government-wide Financial Statements, accounting losses on debt refunding are amortized over the life of the bonds. However this loss in not reported in governmental fund activity 265,619
In the Government-Wide Financial Statements, deferred employer contributions forpension and OPEB, certain differences between actuarial estimates and actual results,and other adjustments resulting from changes in assumptions and benefits are deferredin the current year.
Deferred outflow of resources - OPEB 2,951,650Deferred inflow of resources - OPEB (555,647)Deferred outflow of resources - pension 20,646,590Deferred inflow of resources - pension (7,400,532) 15,642,061
Interest payable on long-term debt did not require current financial resources.Therefore, interest payable was not reported as a liability in Governmental FundsBalance Sheet. (561,437)
Deferred inflows of resources recorded in the Fund Financial Statements resulting fromactivities in which revenues were earned but funds were not available are reclassified asrevenues in the Government-Wide Financial Statements. 5,905,076
Internal Service Funds were used by management to charge the costs of certainactivities, such as insurance, to individual funds. The assets and liabilities of the Internal Service Funds were included in governmental activities in the Government-WideStatement of Net Position. 10,406,827
Long-term liabilities were not due and payable in the current period. Therefore, theywere not reported in the Governmental Funds Balance Sheet.
Government-Wide Statement of
Net Position Internal Service
Funds - Net pension liability (78,191,275)$ -$ (78,191,275) - Net OPEB liability (7,655,816) - (7,655,816)- Compensated absences - due within one year (1,714,933) (14,325) (1,700,608)- Compensated absences - due in more than one year (322,735) (6,157) (316,578)- Accrued liabilities for capital projects (35,064,070) - (35,064,070)- Long-term debt - due within one year (3,144,347) - (3,144,347)- Long-term debt - due in more than one year (26,811,922) - (26,811,922)
Total long-term liabilities (152,905,098)$ (20,482)$ (152,884,616)
Net Position of Governmental Activities 233,449,980$
June 30, 2019
Amounts reported for governmental activities in the Statement of Net Position weredifferent because:
See accompanying Notes to Basic Financial Statements.
38

This page intentionally left blank
39
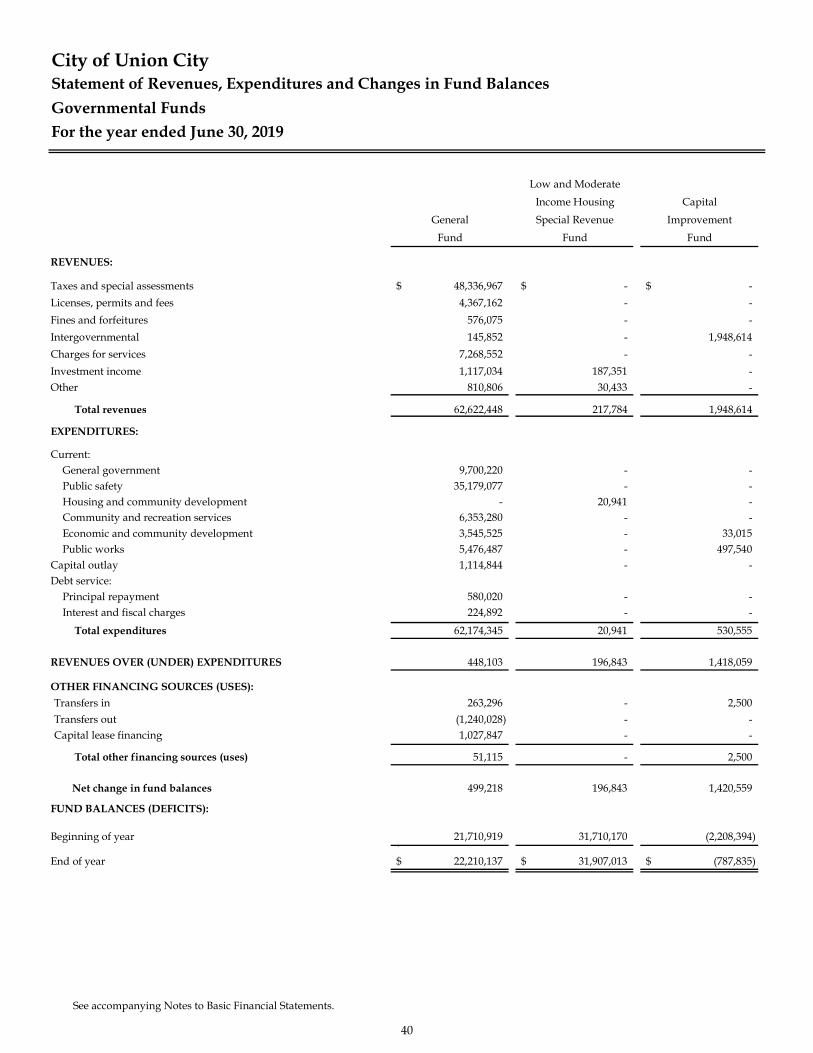
City of Union City
Governmental FundsFor the year ended June 30, 2019
Low and ModerateIncome Housing Capital
General Special Revenue ImprovementFund Fund Fund
REVENUES:
Taxes and special assessments 48,336,967$ -$ -$ Licenses, permits and fees 4,367,162 - -Fines and forfeitures 576,075 - -Intergovernmental 145,852 - 1,948,614Charges for services 7,268,552 - -Investment income 1,117,034 187,351 -Other 810,806 30,433 -
Total revenues 62,622,448 217,784 1,948,614
EXPENDITURES:
Current:General government 9,700,220 - -Public safety 35,179,077 - -Housing and community development - 20,941 -Community and recreation services 6,353,280 - -Economic and community development 3,545,525 - 33,015Public works 5,476,487 - 497,540
Capital outlay 1,114,844 - -Debt service:
Principal repayment 580,020 - -Interest and fiscal charges 224,892 - -
Total expenditures 62,174,345 20,941 530,555
REVENUES OVER (UNDER) EXPENDITURES 448,103 196,843 1,418,059
OTHER FINANCING SOURCES (USES):Transfers in 263,296 - 2,500Transfers out (1,240,028) - -Capital lease financing 1,027,847 - -
Total other financing sources (uses) 51,115 - 2,500
Net change in fund balances 499,218 196,843 1,420,559
FUND BALANCES (DEFICITS):
Beginning of year 21,710,919 31,710,170 (2,208,394)`
End of year 22,210,137$ 31,907,013$ (787,835)$
Statement of Revenues, Expenditures and Changes in Fund Balances
See accompanying Notes to Basic Financial Statements.
40

PublicImprovement Non-Major Total Capital Project Governmental Governmental
Fund Funds Funds
-$ 15,197,575$ 63,534,542$ - - 4,367,162- - 576,075
146,098 4,687,360 6,927,924- 1,017,413 8,285,965
531,143 552,029 2,387,557652,540 2,846,205 4,339,984
1,329,781 24,300,582 90,419,209
- 964,577 10,664,797- 5,482,084 40,661,161- 767,204 788,145- 765,220 7,118,500
979,188 393,383 4,951,1112,092,106 9,824,977 17,891,110
- 283,224 1,398,068
- 2,429,047 3,009,067- 1,139,775 1,364,667
3,071,294 22,049,491 87,846,626
(1,741,513) 2,251,091 2,572,583
- 1,278,028 1,543,824(2,500) (297,196) (1,539,724)
- 103,414 1,131,261
(2,500) 1,084,246 1,135,361
(1,744,013) 3,335,337 3,707,944
47,973,429 28,888,380 128,074,504
46,229,416$ 32,223,717$ 131,782,448$
41
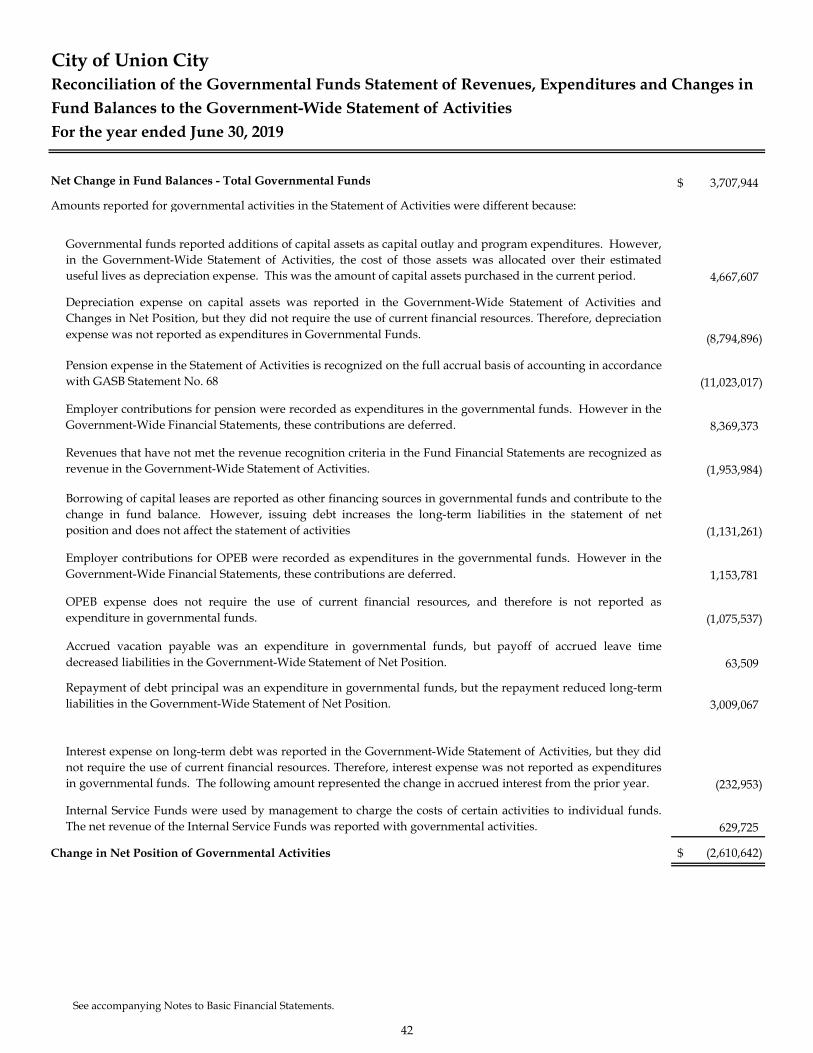
City of Union CityReconciliation of the Governmental Funds Statement of Revenues, Expenditures and Changes in Fund Balances to the Government-Wide Statement of Activities For the year ended June 30, 2019
Net Change in Fund Balances - Total Governmental Funds 3,707,944$
Governmental funds reported additions of capital assets as capital outlay and program expenditures. However,in the Government-Wide Statement of Activities, the cost of those assets was allocated over their estimateduseful lives as depreciation expense. This was the amount of capital assets purchased in the current period. 4,667,607
Depreciation expense on capital assets was reported in the Government-Wide Statement of Activities andChanges in Net Position, but they did not require the use of current financial resources. Therefore, depreciationexpense was not reported as expenditures in Governmental Funds. (8,794,896)
Pension expense in the Statement of Activities is recognized on the full accrual basis of accounting in accordancewith GASB Statement No. 68 (11,023,017)
Employer contributions for pension were recorded as expenditures in the governmental funds. However in theGovernment-Wide Financial Statements, these contributions are deferred. 8,369,373
Revenues that have not met the revenue recognition criteria in the Fund Financial Statements are recognized asrevenue in the Government-Wide Statement of Activities. (1,953,984)
Borrowing of capital leases are reported as other financing sources in governmental funds and contribute to thechange in fund balance. However, issuing debt increases the long-term liabilities in the statement of netposition and does not affect the statement of activities (1,131,261)
Employer contributions for OPEB were recorded as expenditures in the governmental funds. However in theGovernment-Wide Financial Statements, these contributions are deferred. 1,153,781
OPEB expense does not require the use of current financial resources, and therefore is not reported asexpenditure in governmental funds. (1,075,537)
Accrued vacation payable was an expenditure in governmental funds, but payoff of accrued leave timedecreased liabilities in the Government-Wide Statement of Net Position. 63,509
Repayment of debt principal was an expenditure in governmental funds, but the repayment reduced long-termliabilities in the Government-Wide Statement of Net Position. 3,009,067
Interest expense on long-term debt was reported in the Government-Wide Statement of Activities, but they didnot require the use of current financial resources. Therefore, interest expense was not reported as expendituresin governmental funds. The following amount represented the change in accrued interest from the prior year. (232,953)
Internal Service Funds were used by management to charge the costs of certain activities to individual funds.The net revenue of the Internal Service Funds was reported with governmental activities. 629,725
Change in Net Position of Governmental Activities (2,610,642)$
Amounts reported for governmental activities in the Statement of Activities were different because:
See accompanying Notes to Basic Financial Statements.
42
PROPRIETARY FUND FINANCIAL STATEMENTS
Transit Fund
To account for the operation and management of the City's bus system. This system is operated andmaintained by an independent transit management company under contract with the City.
Paratransit Fund
To account for the operation and management of the City's paratransit system. The system is operated andmaintained by an independent transit management company under contract with the City.
Internal Service Fund
Used to finance and account for special activities and services performed by a designated department forother departments in the City on a cost reimbursement basis.
43

This page intentionally left blank
44
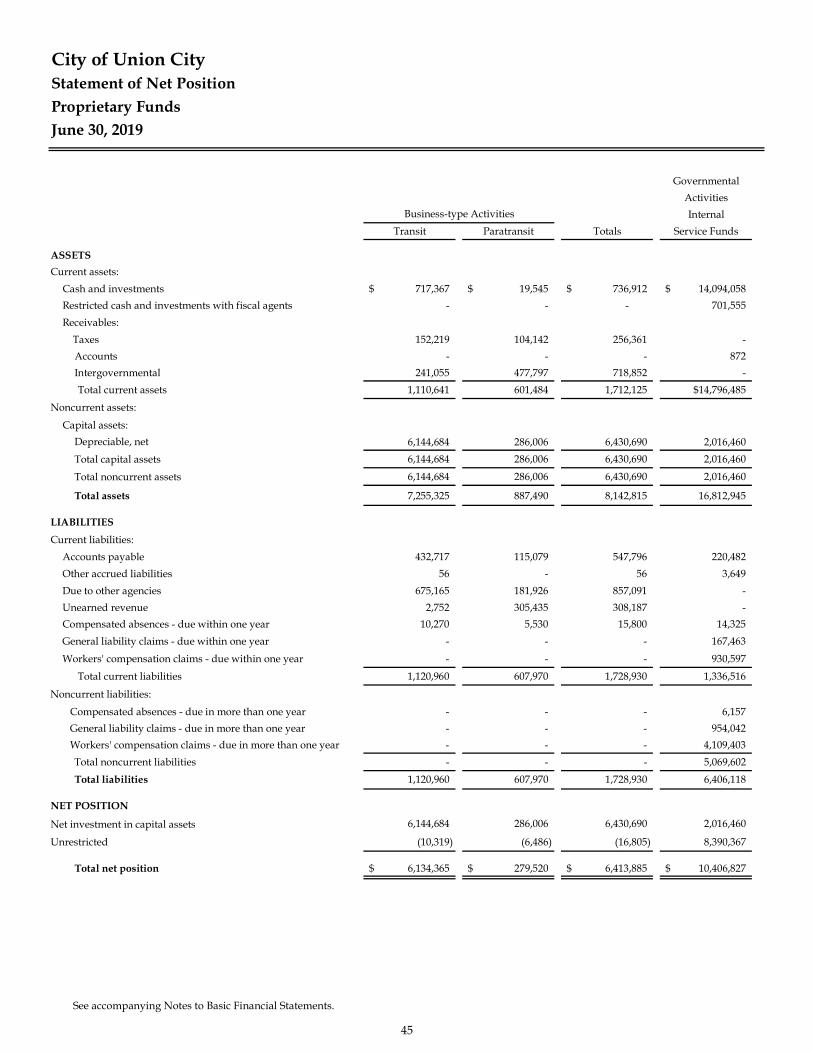
Statement of Net PositionProprietary FundsJune 30, 2019
GovernmentalActivitiesInternal
Transit Paratransit Totals Service Funds
ASSETSCurrent assets:
Cash and investments 717,367$ 19,545$ 736,912$ 14,094,058$ Restricted cash and investments with fiscal agents - - - 701,555Receivables: Taxes 152,219 104,142 256,361 -
Accounts - - - 872Intergovernmental 241,055 477,797 718,852 -
Total current assets 1,110,641 601,484 1,712,125 $14,796,485
Noncurrent assets:
Capital assets:Depreciable, net 6,144,684 286,006 6,430,690 2,016,460Total capital assets 6,144,684 286,006 6,430,690 2,016,460
Total noncurrent assets 6,144,684 286,006 6,430,690 2,016,460
Total assets 7,255,325 887,490 8,142,815 16,812,945
LIABILITIESCurrent liabilities:
Accounts payable 432,717 115,079 547,796 220,482Other accrued liabilities 56 - 56 3,649Due to other agencies 675,165 181,926 857,091 -Unearned revenue 2,752 305,435 308,187 -Compensated absences - due within one year 10,270 5,530 15,800 14,325General liability claims - due within one year - - - 167,463
Workers' compensation claims - due within one year - - - 930,597
Total current liabilities 1,120,960 607,970 1,728,930 1,336,516
Noncurrent liabilities:
Compensated absences - due in more than one year - - - 6,157 General liability claims - due in more than one year - - - 954,042 Workers' compensation claims - due in more than one year - - - 4,109,403
Total noncurrent liabilities - - - 5,069,602Total liabilities 1,120,960 607,970 1,728,930 6,406,118
NET POSITION
Net investment in capital assets 6,144,684 286,006 6,430,690 2,016,460
Unrestricted (10,319) (6,486) (16,805) 8,390,367
Total net position 6,134,365$ 279,520$ 6,413,885$ 10,406,827$
Business-type Activities
City of Union City
See accompanying Notes to Basic Financial Statements.
45
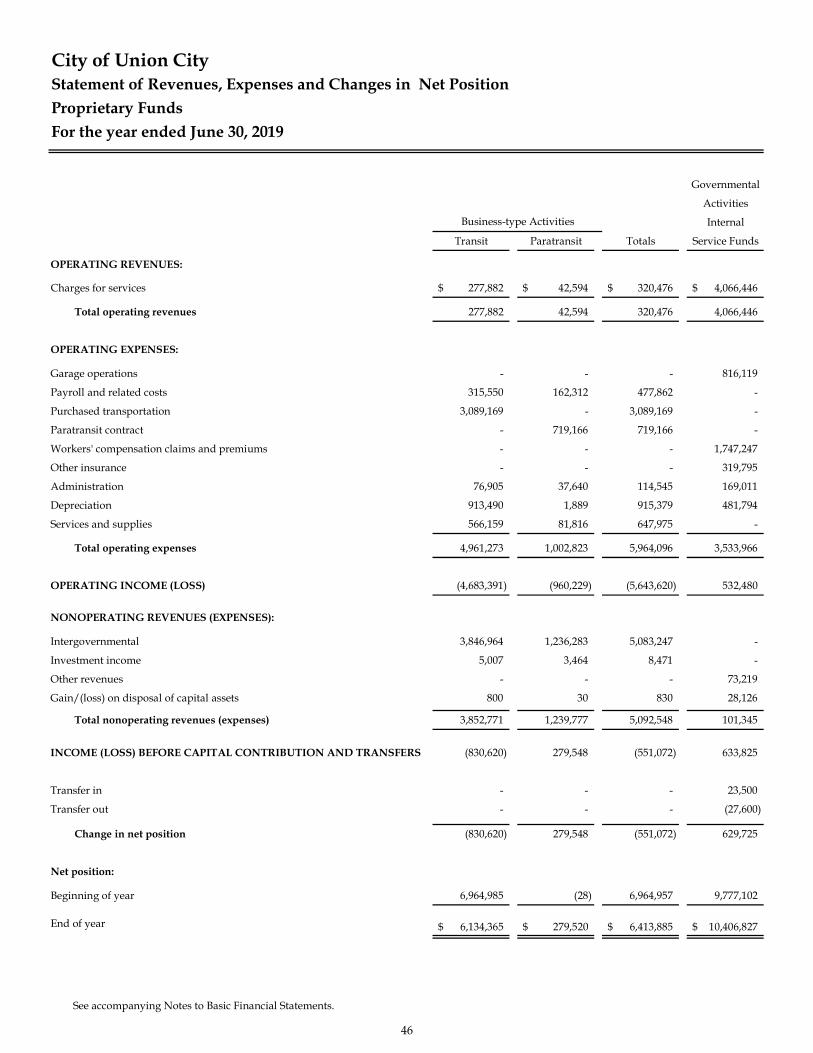
City of Union CityStatement of Revenues, Expenses and Changes in Net PositionProprietary FundsFor the year ended June 30, 2019
Governmental
Activities
Internal
Transit Paratransit Totals Service Funds
OPERATING REVENUES:
Charges for services 277,882$ 42,594$ 320,476$ 4,066,446$
Total operating revenues 277,882 42,594 320,476 4,066,446
OPERATING EXPENSES:
Garage operations - - - 816,119
Payroll and related costs 315,550 162,312 477,862 -
Purchased transportation 3,089,169 - 3,089,169 -
Paratransit contract - 719,166 719,166 -
Workers' compensation claims and premiums - - - 1,747,247
Other insurance - - - 319,795
Administration 76,905 37,640 114,545 169,011
Depreciation 913,490 1,889 915,379 481,794
Services and supplies 566,159 81,816 647,975 -
Total operating expenses 4,961,273 1,002,823 5,964,096 3,533,966
OPERATING INCOME (LOSS) (4,683,391) (960,229) (5,643,620) 532,480
NONOPERATING REVENUES (EXPENSES):
Intergovernmental 3,846,964 1,236,283 5,083,247 -
Investment income 5,007 3,464 8,471 -
Other revenues - - - 73,219
Gain/(loss) on disposal of capital assets 800 30 830 28,126
Total nonoperating revenues (expenses) 3,852,771 1,239,777 5,092,548 101,345
INCOME (LOSS) BEFORE CAPITAL CONTRIBUTION AND TRANSFERS (830,620) 279,548 (551,072) 633,825
Transfer in - - - 23,500
Transfer out - - - (27,600)
Change in net position (830,620) 279,548 (551,072) 629,725
Net position:
Beginning of year 6,964,985 (28) 6,964,957 9,777,102
End of year 6,134,365$ 279,520$ 6,413,885$ 10,406,827$ 6,134,365 279,520 10,406,827
Business-type Activities
See accompanying Notes to Basic Financial Statements.
46
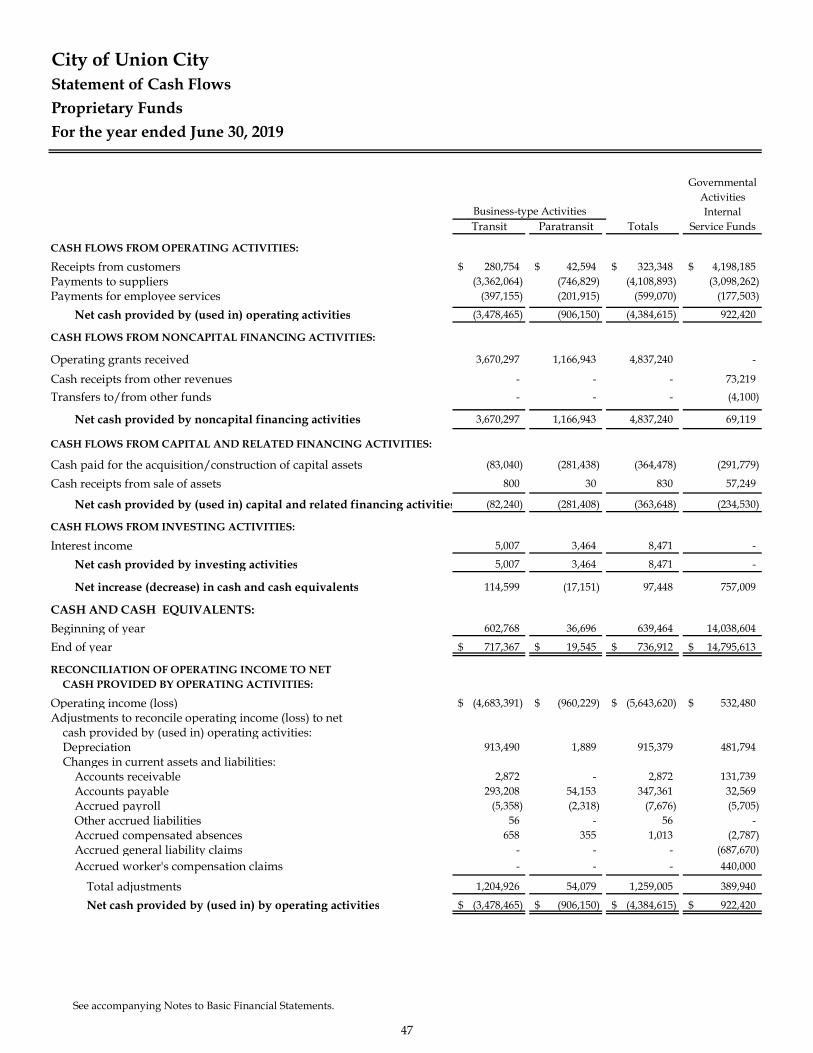
Statement of Cash FlowsProprietary FundsFor the year ended June 30, 2019
GovernmentalActivitiesInternal
Transit Paratransit Totals Service Funds
CASH FLOWS FROM OPERATING ACTIVITIES:
Receipts from customers 280,754$ 42,594$ 323,348$ 4,198,185$ Payments to suppliers (3,362,064) (746,829) (4,108,893) (3,098,262)Payments for employee services (397,155) (201,915) (599,070) (177,503)
Net cash provided by (used in) operating activities (3,478,465) (906,150) (4,384,615) 922,420
CASH FLOWS FROM NONCAPITAL FINANCING ACTIVITIES: - --
Operating grants received 3,670,297 1,166,943 4,837,240 -
Cash receipts from other revenues - - - 73,219
Transfers to/from other funds - - - (4,100)
Net cash provided by noncapital financing activities 3,670,297 1,166,943 4,837,240 69,119
CASH FLOWS FROM CAPITAL AND RELATED FINANCING ACTIVITIES:
Cash paid for the acquisition/construction of capital assets (83,040) (281,438) (364,478) (291,779)
Cash receipts from sale of assets 800 30 830 57,249
Net cash provided by (used in) capital and related financing activities (82,240) (281,408) (363,648) (234,530)
CASH FLOWS FROM INVESTING ACTIVITIES:
Interest income 5,007 3,464 8,471 -
Net cash provided by investing activities 5,007 3,464 8,471 -
Net increase (decrease) in cash and cash equivalents 114,599 (17,151) 97,448 757,009
CASH AND CASH EQUIVALENTS:Beginning of year 602,768 36,696 639,464 14,038,604
End of year 717,367$ 19,545$ 736,912$ 14,795,613$
RECONCILIATION OF OPERATING INCOME TO NETCASH PROVIDED BY OPERATING ACTIVITIES:
Operating income (loss) (4,683,391)$ (960,229)$ (5,643,620)$ 532,480$ Adjustments to reconcile operating income (loss) to net
cash provided by (used in) operating activities:Depreciation 913,490 1,889 915,379 481,794Changes in current assets and liabilities:
Accounts receivable 2,872 - 2,872 131,739Accounts payable 293,208 54,153 347,361 32,569Accrued payroll (5,358) (2,318) (7,676) (5,705)Other accrued liabilities 56 - 56 -Accrued compensated absences 658 355 1,013 (2,787)Accrued general liability claims - - - (687,670)Accrued worker's compensation claims - - - 440,000
Total adjustments 1,204,926 54,079 1,259,005 389,940
Net cash provided by (used in) by operating activities (3,478,465)$ (906,150)$ (4,384,615)$ 922,420$
City of Union City
Business-type Activities
See accompanying Notes to Basic Financial Statements.
47

This page intentionally left blank
48

FIDUCIARY FUND FINANCIAL STATEMENTS
Resources held and administered by the City when acting in a fiduciary capacity for other organizations orgovernments are accounted for in fiduciary funds. The activities of these funds are excluded from thegovernment-wide financial statements. The City's reports activity in the following fiduciary funds:
Pension and Other Postemployment Benefits Trust FundsPension and Other Post Employment Benefits Trust Funds are used to report the activities of the City'semployee benefit plans. They account for the City's contributions to the employee benefits plans anddisbursements made for employee retirement benefits, withdrawals, postemployment benefits as well asadministrative expenses.
Private Purpose Trust FundsPrivate-purpose trust funds account for resources of all other trust arrangements in which principal andincome benefit individuals, private organizations, or other governments. The City maintains the followingPrivate Purpose Trust Fund:
Redevelopment Property Tax Trust FundTo account for property taxes that would have been redevelopment property tax increment had theRedevelopment Agency not been dissolved. The property taxes are distributed semi-annually by the CountyAuditor-Controller's Office and are used to pay enforceable obligations and Successor Agency administrativecosts. This fund also accounts for all non-housing assets transferred from the dissolved RedevelopmentAgency.
49

Statement of Fiduciary Net PositionFiduciary FundsJune 30, 2019
Pension and OtherPostemployment Redevelopment
Benefits Property Tax Trust Funds Trust Fund
ASSETS
Cash and investments 99$ 6,734,942$ Restricted cash and investments:
Cash and equivalents 860,512 2Mutual funds - Equity 10,750,068 -Mutual fund - Fixed income 14,724,490 -
Total assets 26,335,169 6,734,944
DEFERRED OUTFLOW OF RESOURCESDeferred loss on refunding bonds - 8,524,707
Total deferred outflow of resources - 8,524,707
LIABILITIES
Interest payable - 1,385,605
Bonds payable: Due in one year - 3,650,000 Due in more than one year - 131,115,112
Total liabilities - 136,150,717
Net position restricted for Held in trust for employee pension benefits 13,371,107 -Held in trust for employee OPEB benefits 12,964,062 -Held in trust for the City's Successor Agency - (120,891,066)
Net position held in trust 26,335,169$ (120,891,066)$
City of Union City
See accompanying Notes to Basic Financial Statements.
50
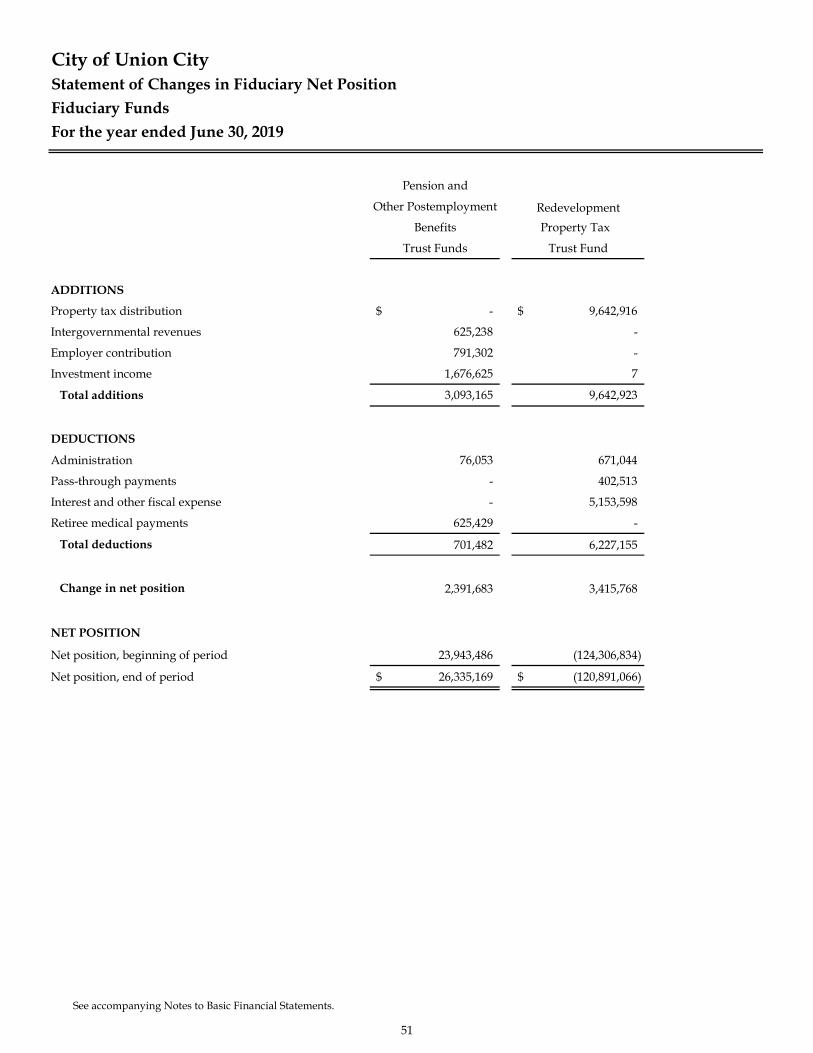
Statement of Changes in Fiduciary Net PositionFiduciary FundsFor the year ended June 30, 2019
Pension and
Other Postemployment RedevelopmentBenefits Property Tax
Trust Funds Trust Fund
ADDITIONS
Property tax distribution -$ 9,642,916$
Intergovernmental revenues 625,238 -
Employer contribution 791,302 -
Investment income 1,676,625 7
Total additions 3,093,165 9,642,923
DEDUCTIONS
Administration 76,053 671,044
Pass-through payments - 402,513
Interest and other fiscal expense - 5,153,598
Retiree medical payments 625,429 -
Total deductions 701,482 6,227,155
Change in net position 2,391,683 3,415,768
NET POSITION
Net position, beginning of period 23,943,486 (124,306,834)
Net position, end of period 26,335,169$ (120,891,066)$
City of Union City
See accompanying Notes to Basic Financial Statements.
51

This page intentionally left blank.
52
City of Union City Notes to Basic Financial Statements For the year ended June 30, 2019
1. SUMMARY OF SIGNIFICANT ACCOUNTING POLICIES
The basic financial statements of the City of Union City (City) have been prepared in conformity with generally accepted accounting principles (GAAP) as applied to governmental agencies. The Governmental Accounting Standards Board (GASB) is the accepted standard setting body for establishing governmental accounting and financial reporting principles. Descriptions of the more significant of the City’s accounting policies follow.
A. Reporting Entity
The City was incorporated on January 26, 1959, as a General Law city, and it operates under a Council-Manager form of government. The City Council consists of five elected members. The following services are provided by the City to its citizens: public safety, highways and streets, community and recreation services, public improvements, planning and zoning, transit, and general administrative services.
B. Basis of Accounting and Measurement Focus
The accounts of the City are organized on the basis of funds, each of which is considered a separate accounting entity. The operations of each fund are accounted for with a separate set of self-balancing accounts that comprise its assets, liabilities, fund equity, revenues, and expenditures or expenses as appropriate. Governmental resources are allocated to and accounted for in individual funds based upon the purposes for which they are to be spent and the means by which spending activities are controlled.
Government-Wide Financial Statements
The City’s government-wide financial statements include a Statement of Net Position and a Statement of Activities. These statements present summaries of governmental and business-type activities for the City, accompanied by a total column. Fiduciary activities of the City are not included in these statements.
These government-wide financial statements are presented on an “economic resources” measurement focus and the accrual basis of accounting. Accordingly, all of the City’s assets and liabilities, including capital assets, as well as infrastructure assets, and long-term liabilities, are included in the accompanying Statement of Net Position. The Statement of Activities presents changes in net position. Under the accrual basis of accounting, revenues are recognized in the period in which they are earned, while expenses are recognized in the period in which the liability is incurred.
Certain types of transactions are reported as program revenues for the City in three categories: Charges for services Operating grants and contributions Capital grants and contributions
Certain eliminations have been made as prescribed by GASB Statement No. 34 with regard to interfund activities, payables and receivables. All internal balances in the Statement of Net Position have been eliminated except those representing balances between the governmental activities and the business-type activities, which are presented as internal balances and eliminated in the total primary government column. In the Statement of Activities, internal service fund transactions have been eliminated; however, those transactions between governmental and business-type activities have not been eliminated. The following interfund activities have been eliminated:
Due to/from other funds Transfers in/out Interfund charges
53
City of Union City Notes to Basic Financial Statements For the year ended June 30, 2019
1. SUMMARY OF SIGNIFICANT ACCOUNTING POLICIES, Continued
B. Basis of Accounting and Measurement Focus, Continued
Government-Wide Financial Statements, Continued
The City applies all applicable GASB pronouncements, including all NCGA Statements and Interpretations currently in effect.
Governmental Fund Financial Statements
Governmental fund financial statements include a Balance Sheet and a Statement of Revenues, Expenditures and Changes in Fund Balances for all major governmental funds and non-major funds aggregated. An accompanying schedule is presented to reconcile and explain the differences in net assets as presented in these statements to the net position presented in the government-wide financial statements. The City has presented all major funds that met the applicable criteria.
The City reports the following major governmental funds:
General Fund—This fund is used to account for all financial resources and activities not required to be accounted for in other funds.
Low and Moderate Income Housing Special Revenue Fund—This fund is used to account for housing assets that were transferred from the dissolved Redevelopment Agency’s Low- and Moderate-Income Housing Fund, which have been specifically defined by Assembly Bill 1484. With the dissolution of the Redevelopment Agency, this fund no longer receives property tax increment revenue. The primary revenue sources are now investment income and interest from notes receivable, which are restricted for housing purposes.
Capital Improvement Fund—This fund is used to account for the acquisition of equipment or construction projects that are funded by grants.
Public Improvement Fund—This fund is used to account for public improvements that had previously been funded by the Community Redevelopment Agency of the City.
All governmental funds are accounted for on a spending or “current financial resources” measurement focus and the modified accrual basis of accounting. Accordingly, only current assets and current liabilities are included on the Balance Sheet. The Statement of Revenues, Expenditures and Changes in Fund Balances presents increases (revenues and other financing sources) and decreases (expenditures and other financing uses) in net current assets. Under the modified accrual basis of accounting, revenues are recognized in the accounting period in which they become both measurable and available to finance expenditures of the current period.
Revenues are recorded when received in cash, except for revenues subject to accrual (generally, those received within 90 days of year-end), which are recognized when due. The primary revenue sources, which have been treated as susceptible to accrual by the City, are property tax, sales tax, intergovernmental revenues and other taxes. Expenditures are recorded in the accounting period in which the related fund liability is incurred.
54
City of Union City Notes to Basic Financial Statements For the year ended June 30, 2019
1. SUMMARY OF SIGNIFICANT ACCOUNTING POLICIES, Continued
B. Basis of Accounting and Measurement Focus, Continued
Governmental Fund Financial Statements, Continued
Deferred inflows arise when potential revenues do not meet both the “measurable” and “available” criteria for recognition in the current period. Deferred inflows also arise when the government receives resources before it has a legal claim to them, as when grant monies are received prior to incurring qualifying expenditures. In subsequent periods, when both revenue recognition criteria are met or when the government has a legal claim to the resources, the deferred inflow is removed from the combined Balance Sheet and recognized as revenue.
The reconciliations of the fund financial statements to the government-wide financial statements are provided to explain the differences created by the integrated approach of GASB Statement No. 34.
Proprietary Fund Financial Statements
Proprietary fund financial statements include a Statement of Net Position, a Statement of Revenues, Expenses and Changes in Fund Net Position, and a Statement of Cash Flows, for each major proprietary fund.
A separate column representing internal service funds is also presented in these statements. However, internal service balances and activities are combined with the governmental activities in the government-wide financial statements.
Proprietary funds are accounted for using the “economic resources” measurement focus and the accrual basis of accounting. Accordingly, all assets and liabilities (whether current or noncurrent) are included on the Statement of Net Position. The Statement of Revenues, Expenses and Changes in Fund Net Position presents increases (revenues) and decreases (expenses) in total net position. Under the accrual basis of accounting, revenues are recognized in the period in which they are earned, while expenses are recognized in the period in which the liability is incurred.
The City reports the following enterprise funds:
Transit Fund— This fund accounts for the operation and management of the City’s bus system. The City provides oversight of the management of the transit system while an independent transit company, under contract with the City, handles the operations.
Paratransit Fund— This fund accounts for the operation and management of the City’s paratransit transportation system. This system is managed by the City, while the operations are provided by an independent transit company under contract with the City.
Internal service fund balances and activities have been combined with governmental activities in the government-wide financial statements.
The City maintains the following internal service funds:
Workers Compensation Self-Insurance Fund—This fund accounts for disbursements made for insurance premiums, medical expenses and legal expenses to an independent claims administrator for distribution to employees who qualify to receive benefits under the law.
General Liability Self-Insurance Fund—This fund was established to account for the processing of general liability insurance premiums, claims and settlements.
Garage Operations Fund—This fund is used to account for the acquisition and maintenance of the City’s vehicles.
55
City of Union City Notes to Basic Financial Statements For the year ended June 30, 2019
1. SUMMARY OF SIGNIFICANT ACCOUNTING POLICIES, Continued
B. Basis of Accounting and Measurement Focus, Continued
Proprietary Fund Financial Statements, Continued
Operating revenues in the proprietary funds are those revenues that are generated from the primary operation or purpose of the fund. All other revenues are reported as non-operating revenues. Operating expenses are those expenses that are essential to the primary operation of the fund. All other expenses are reported as non-operating expenses.
Fiduciary Fund Financial Statements
Fiduciary fund financial statements consist of a Statement of Fiduciary Net Position and a Statement of Changes in Fiduciary Net Position. The fiduciary funds are accounted for using the accrual basis of accounting.
The City reports the following fiduciary funds:
POA Retiree Medical Trust Fund—This fund accounts for assets held by the City. The City’s trust fund accounts for the post-retirement healthcare benefits for eligible members of the Police Officers Association. The financial activities of these funds are excluded from the government-wide financial statements, but they are presented in separate fiduciary fund financial statements.
Redevelopment Property Trust Fund—This fund accounts for property taxes that would have been redevelopment property tax increment had the RDA not been dissolved. The property taxes, which are distributed semi-annually by the County Auditor-Controller’s Office, are used to pay amounts due on enforceable obligations and Successor Agency administrative costs. This fund also accounts for certain non-housing assets and liabilities transferred from the dissolved Redevelopment Agency to the Redevelopment Successor Agency, which are legally restricted for uses specified by debt covenants, grant restrictions and enforceable obligations.
PARS Pension Trust Fund— This newly created fund accounts for funds held by the Public Agency Retirement Services (PARS) 115 Trust for pensions.
PARS OPEB Trust Fund— This fund accounts for funds held by the Public Agency Retirement Services (PARS) 115 Trust for other postemployment benefits (OPEB).
C. Cash, Cash Equivalents and Investments
The City pools its available cash for investment purposes. The City’s cash and cash equivalents comprise cash on hand, demand deposits, and short-term investments with original maturity of three months or less from date of acquisition. Cash and cash equivalents are combined with investments and displayed as Cash and Investments.
In accordance with GASB Statement No. 40, Deposit and Investment Disclosures (Amendment of GASB Statement No. 3), certain disclosure requirements for deposits and investment risks were made in the following areas:
1. Interest Rate Risk 2. Credit Risk
Overall Custodial Credit Risk Concentrations of Credit Risk
56
City of Union City Notes to Basic Financial Statements For the year ended June 30, 2019
1. SUMMARY OF SIGNIFICANT ACCOUNTING POLICIES, Continued
C. Cash, Cash Equivalents and Investments, Continued
In addition, other disclosures are specified, including use of certain methods to present deposits and investments, highly sensitive investments and credit quality at year-end.
In accordance with GASB Statement No. 31, Accounting and Financial Reporting for Certain Investments and for External Investment Pools, highly liquid market investments with maturities of one year or less at time of purchase are stated at amortized cost. All other investments are stated at fair value. Market value is used as fair value for those securities for which market quotations are readily available.
The City participates in the Local Agency Investment Fund (LAIF)—an investment pool managed by the State of California. The LAIF has invested a portion of pooled funds in structured notes and asset-backed securities. The LAIF’s investments are subject to credit risk with the full faith and credit of the State of California collateralizing these investments. In addition, these structured notes and asset-backed securities are subject to market risk as to change in interest rates.
D. Restricted Cash and Investments
Certain restricted cash and investments are held by fiscal agents for the redemption of bonded debt and for acquisition and construction of capital projects. Cash and investments are also restricted for deposits held for others within the enterprise funds.
E. Receivables
During the course of normal operations, the City carries various receivable balances for taxes, interest, services and special assessments. Accounts receivables are shown net of an allowance for doubtful accounts.
F. Interfund Transactions
Interfund transactions comprise loans, services-provided reimbursements or transfers. Activities between funds that are representative of lending/borrowing arrangements outstanding at the end of the fiscal year are referred to as either “due to/from funds” (i.e., the current portion of interfund loans) or “advances to/from other funds” (i.e., the noncurrent portion of interfund loans). Any residual balances outstanding between the governmental activities and business-type activities are reported in the government-wide financial statements as “internal balances.”
Services provided, deemed to be at market or near market rates, are treated as revenues and expenditures/expenses. Reimbursements occur when one fund incurs a cost, charges the appropriate benefiting fund and reduces its related cost as a reimbursement. All other interfund transactions are treated as transfers. Transfers between governmental or proprietary funds are netted as part of the reconciliation to the government-wide financial statements presentation.
G. Capital Assets
Capital assets, including intangibles, are recorded at historical cost or estimated historical cost when actual cost is not available. Donated capital assets, donated works of art and similar items, and capital assets received in a service concession arrangement are reported at acquisition value rather than fair value. The City defines capital assets as assets with an initial, individual cost of more than $5,000 and an estimated useful life in excess of one year. Assets acquired with grant funds may be capitalized even though their individual cost is less than $5,000.
57
City of Union City Notes to Basic Financial Statements For the year ended June 30, 2019
1. SUMMARY OF SIGNIFICANT ACCOUNTING POLICIES, Continued
G. Capital Assets, Continued
Depreciation is provided using the straight-line method, which means the cost of the asset is divided by its expected useful life in years and the result is charged to expense each year until the asset is fully depreciated. The purpose of depreciation is to spread the cost of capital assets equitably among all users over the life of these assets. The amount charged to depreciation expense each year represents that year’s pro-rata share of the cost of capital assets.
Major outlays for capital assets and improvements are capitalized as projects are constructed. Interest incurred during the construction phase is reflected in the capitalized value of the asset constructed, net of interest earned on the invested proceeds over the same period.
Governmental Accounting Standards Board (GASB) Statement No. 34 requires the inclusion of infrastructure capital assets in the local government’s basic financial statements. In accordance with GASB Statement No. 34, the City has included the value of all infrastructure into its basic financial statements.
The City defines infrastructure as the basic physical assets that allow the City to function, which consists of two major categories:
Roadways Recreation, such as major park facilities and landscaped areas, park trails and bike paths used by the City in the conduct of its business
The City elected to use the Basic Approach, as defined by GASB Statement No. 34, for infrastructure reporting. The City conducted a valuation of its infrastructure assets as of June 30, 2004. This valuation determined the estimated acquisition cost using one of the following methods:
1. Use of historical records where available 2. Standard unit costs appropriate for the construction/acquisition date 3. Present cost indexed by a reciprocal factor of the price increase from the construction/acquisition date to
the current date
The accumulated depreciation, defined as the total depreciation from the date of construction/acquisition to the current date. The book value was then computed by deducting the accumulated depreciation from the original cost. The City updates its infrastructure each year. Depreciation is calculated using the straight-line method and industry accepted life expectancies of the assets as follows:
H. Compensated Absences
Compensated absences are comprised of earned but unused administrative leave, compensated time off in lieu of overtime pay and earned but unused vacations hours, all of which are payable to the employee upon separation of employment. The maximum hours of each compensated leave type that may be accrued is determined by bargaining unit agreements. The liability for compensated absences includes salary-related benefits, where applicable. The City’s liability for compensated absences is recorded at the entity-wide level in the Statement of Net Position for governmental activities and in proprietary funds as appropriate.
Compensated absences are liquidated by the fund that has recorded the liability. The long-term portion of governmental activities compensated absences is liquidated primarily by the General Fund.
Buildings and improvements 10-40 yearsMachinery and equipment 5-15 yearsInfrastructure 5-40 years
58

City of Union City Notes to Basic Financial Statements For the year ended June 30, 2019
1. SUMMARY OF SIGNIFICANT ACCOUNTING POLICIES, Continued
I. Long-Term Debt
Government-Wide Financial Statements—Long-term debt and other long-term obligations are reported as liabilities in the appropriate activities.
Bond premiums and discounts are deferred and amortized over the life of the bonds using the effective-interest method. Bonds payable are reported net of the applicable bond premium or discount. Bond issuance costs are reported as deferred charges and amortized over the term of the related debt.
Fund Financial Statements—The governmental fund financial statements do not present long-term debt but it is shown in the Reconciliation of the Governmental Funds Balance Sheet to the Government-Wide Statement of Net Position.
J. Property Taxes
Alameda County assesses properties and bills, collects, and remits property taxes, including delinquencies and penalties, to the City. Secured and unsecured property taxes are levied on January 1 of the preceding fiscal year.
Property tax levies are recorded as revenue and receivables in the fiscal year of levy provided they are collected during the fiscal year or within ninety days of the year end.
Secured property tax is due in two installments, on November 1 and March 1, and becomes a lien on those dates. It becomes delinquent after December 10 and April 10, respectively. Unsecured property tax is due on July 1, and becomes delinquent on August 31. The term ‘unsecured’ refers to taxes on personal property other than real estate, land or buildings. These taxes are secured by liens on the properties being taxed.
K. Deferred Outflows/Inflows of Resources
In addition to assets, the statement of financial position will sometimes report a separate section for deferred outflows of resources. This separate financial statement element, deferred outflows of resources, represents a consumption of net position that applies to a future period(s) and thus will not be recognized as an outflow of resources (expense/expenditure) until then. The City has the following items that qualify for reporting in this category: deferred outflows related to debt refunding, deferred employer OPEB contributions, deferred outflows related to OPEB, deferred employer pension contributions, and deferred outflows related to pension.
In addition to liabilities, the statement of financial position will sometimes report a separate section for deferred inflows of resources. This separate financial statement element, deferred inflows of resources, represents an acquisition of net position that applies to future period(s) and thus will not be recognized as an inflow of resources (revenue) until that time. The City reports the following items in this category: unavailable revenue and amounts related to changes in the City’s pension and OPEB liabilities that are deferred and amortized over a period of time. Unavailable revenue arises under the modified accrual basis of accounting and, accordingly, is only reported in the governmental funds Balance Sheet. These amounts are deferred and will be recorded as an inflow of resources in the period that the amounts become available. Certain changes in the City’s pension liability are required to be deferred and reflected in pension expense over a closed amortization period. Deferred inflows related to OPEB will be recognized in future OPEB expense.
59
City of Union City Notes to Basic Financial Statements For the year ended June 30, 2019
1. SUMMARY OF SIGNIFICANT ACCOUNTING POLICIES, Continued
L. Net Position / Fund Balance
In the government-wide financial statements, net position is classified in the following categories:
Net Investment in Capital Assets—Consists of capital assets, net of accumulated depreciation, reduced by outstanding debt attributed to the acquisition, construction or improvement of the assets.
Restricted Net Position—Consists of funds restricted by external creditors, grantors, contributors, laws or regulations of other governments.
Unrestricted Net Position—Consists of any amounts that do not meet the definition of net investment in capital assets or restricted net position.
Fund balances of governmental funds are classified in one of five categories:
Nonspendable Fund Balance—Represents that portion of fund balance that includes amounts that are either 1) not in a spendable form or 2) legally or contractually required to be maintained intact. Amounts considered not in a spendable form include items that are not expected to be converted to cash such as prepaid items and long-term notes receivable.
Restricted Fund Balance—Represents that portion of fund balance that reflects constraints placed on the use of resources (other than nonspendable items) that are either 1) externally imposed by creditors, such as through debt covenants, grantors, contributors or the laws and regulations of other governments; or 2) imposed by law through constitutional provisions or enabling legislation. These restrictions may be effectively changed only with the consent of the resource provider.
Committed Fund Balance—Represents that portion of fund balance that includes amounts that can only be used for specific purposes pursuant to constraints imposed by formal action of the City Council, the City’s government’s highest level decision making authority. In order for funds to be considered committed, an ordinance describing the proposed action must be introduced at a City Council meeting. At the following City Council meeting, a second reading of the ordinance is made and the ordinance is adopted. The ordinance must be published in the City’s official newspaper of publication within 15 days of adoption. Ordinances are then codified in the City’s municipal code. Those funds collected and expended for specific purposes defined in the City’s municipal code report committed fund balances. The established constraints remain binding until City Council takes action to amend the applicable section of municipal code.
Assigned Fund Balance—Represents that portion of fund balance that includes amounts that are constrained by the City’s intended use of the resources but that are neither restricted nor committed. Assignments of fund balance may be made by City Council resolution. Actions made by resolution are not codified into the municipal code. In addition, the City Council has given the City Manager the authority to assign portions of fund balance for use for specific purposes. From time to time, the City receives new revenue sources that are neither restricted by outside constraints nor committed by formal action of City Council. If the City Manager and Finance Director agree that the activities to be funded by the new revenue source should be accounted for separately from General Fund activity, a new fund is created. The new fund is included as part of the General Fund for reporting purposes and the fund balance is categorized as assigned. From time to time, other City funds may perform work that is reimbursed by third parties. The net activity (reimbursements received less City expenditures) is classified as assigned fund balance.
60

City of Union City Notes to Basic Financial Statements For the year ended June 30, 2019
1. SUMMARY OF SIGNIFICANT ACCOUNTING POLICIES, Continued
L. Net Position / Fund Balance, Continued
Unassigned Fund Balance—Represents that portion of fund balance that includes amounts that are not contained in any of the other fund balance categories. The General Fund is the only governmental fund that may report a positive amount as unassigned fund balance. For all other governmental funds, only negative balances may be reported as unassigned fund balance.
When an expenditure is incurred for purposes for which both restricted and unrestricted funds are available, it is the City’s policy to apply the restricted net assets first. The City also considers committed funds to be spent first, assigned funds to be spent second and unassigned funds to be spent last when an expenditure is incurred for purposes for which committed, assigned and unassigned fund balance is available.
M. Use of Estimates
The preparation of the basic financial statements in conformity with generally accepted accounting principles requires management to make estimates and assumptions. These estimates and assumptions affect the reported amounts of assets and liabilities and the disclosures of contingent assets and liabilities. In addition, estimates affect the reported amount of expenses. Actual results could differ from these estimates and assumptions.
N. Pension and Other Postemployment Benefits
For purposes of measuring the net pension liability, deferred outflows/inflows of resources related to pensions and pension expense, information about the fiduciary net position of the City’s California Public Employees’ Retirement System (CalPERS) and plans (Plans), and additions to/deductions from the Plans’ fiduciary net position, has been determined on the same basis as it is reported by CalPERS. For this purpose, benefit payments (including refunds of employee contributions) are recognized when due and payable in accordance with the benefit terms. Investments are reported at fair value. For this report, the following timeframes are used:
Valuation Date June 30, 2017 Measurement Date June 30, 2018 Measurement Period July 1, 2017 to June 30, 2018
For purposes of measuring the net OPEB liability, deferred outflows/inflows of resources related to OPEB and OPEB expense, information about the fiduciary net position of the City’s plan (OPEB Plan) and additions to/deductions from the OPEB Plan’s fiduciary net position have been determined on the same basis. For this purpose, benefit payments are recognized when currently due and payable in accordance with the benefit terms. Investments are reported at fair value. Generally accepted accounting principles require that the reported results must pertain to liability and asset information within certain defined timeframes. For this report, the following timeframes are used:
Valuation Date June 30, 2017 Measurement Date June 30, 2018 Measurement Period July 1, 2017 to June 30, 2018
61
City of Union City Notes to Basic Financial Statements For the year ended June 30, 2019
1. SUMMARY OF SIGNIFICANT ACCOUNTING POLICIES, Continued
O. New Pronouncements
In 2019, the City adopted new accounting standards in order to conform to the following Governmental Accounting Standards Board Statements:
GASB Statement No. 83, Certain Asset Retirement Obligations – The objective of this statement is to provide financial statement users with information about asset retirement obligations (AROs) that were not addressed in GASB standards by establishing uniform accounting and financial reporting requirements for these obligations. The requirements of this statement did not apply to the City for the current fiscal year.
GASB Statement No. 88, Certain Disclosures Related to Debt, including Direct Borrowings and Direct Placements – The objective of this statement is to improve consistency in the information that is disclosed in notes to government financial statements related to debt, including direct borrowings and direct placements, and to provide financial statement users with additional essential information about debt. The requirements of this statement did not apply to the City for the current fiscal year.
62
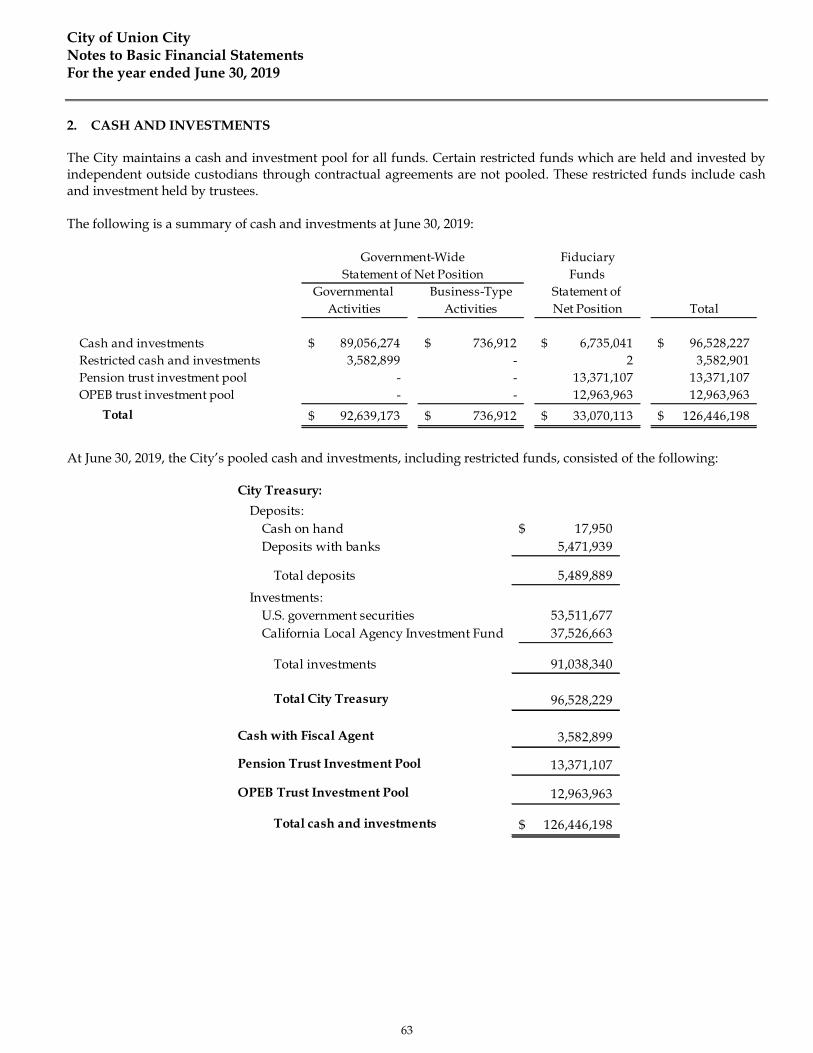
City of Union City Notes to Basic Financial Statements For the year ended June 30, 2019
2. CASH AND INVESTMENTS
The City maintains a cash and investment pool for all funds. Certain restricted funds which are held and invested by independent outside custodians through contractual agreements are not pooled. These restricted funds include cash and investment held by trustees.
The following is a summary of cash and investments at June 30, 2019:
At June 30, 2019, the City’s pooled cash and investments, including restricted funds, consisted of the following:
63
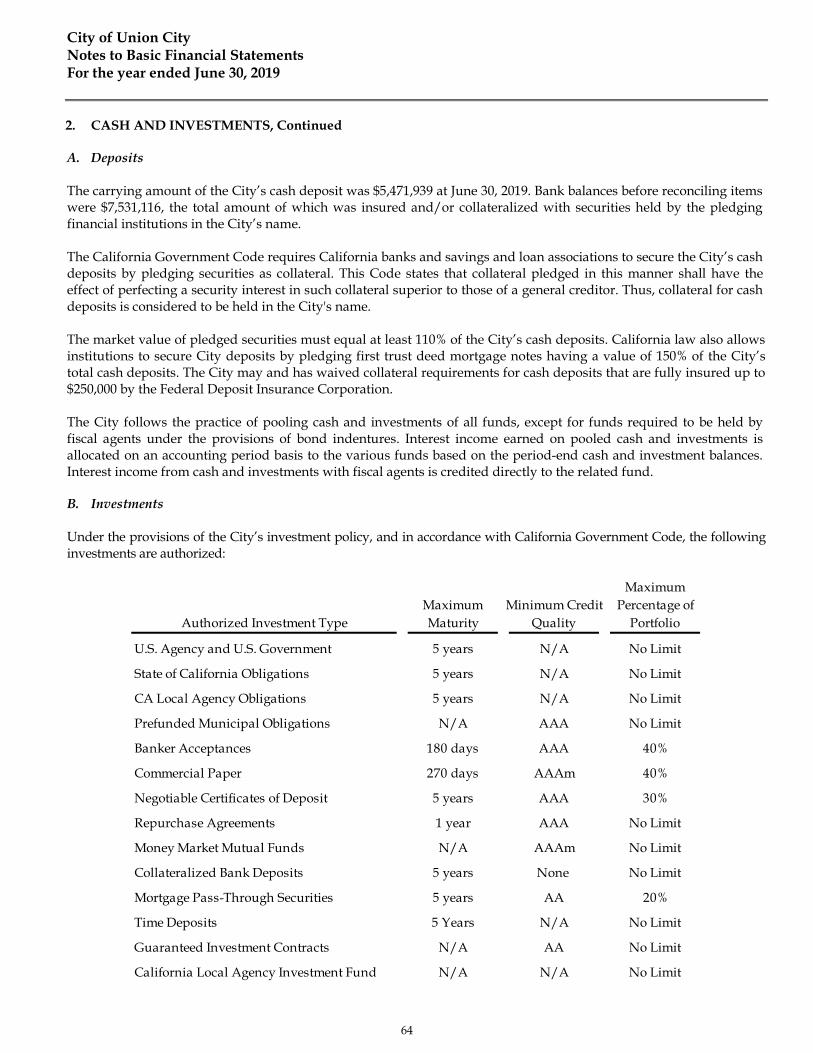
City of Union City Notes to Basic Financial Statements For the year ended June 30, 2019
2. CASH AND INVESTMENTS, Continued
A. Deposits
The carrying amount of the City’s cash deposit was $5,471,939 at June 30, 2019. Bank balances before reconciling items were $7,531,116, the total amount of which was insured and/or collateralized with securities held by the pledging financial institutions in the City’s name.
The California Government Code requires California banks and savings and loan associations to secure the City’s cash deposits by pledging securities as collateral. This Code states that collateral pledged in this manner shall have the effect of perfecting a security interest in such collateral superior to those of a general creditor. Thus, collateral for cash deposits is considered to be held in the City's name.
The market value of pledged securities must equal at least 110% of the City’s cash deposits. California law also allows institutions to secure City deposits by pledging first trust deed mortgage notes having a value of 150% of the City’s total cash deposits. The City may and has waived collateral requirements for cash deposits that are fully insured up to $250,000 by the Federal Deposit Insurance Corporation.
The City follows the practice of pooling cash and investments of all funds, except for funds required to be held by fiscal agents under the provisions of bond indentures. Interest income earned on pooled cash and investments is allocated on an accounting period basis to the various funds based on the period-end cash and investment balances. Interest income from cash and investments with fiscal agents is credited directly to the related fund.
B. Investments
Under the provisions of the City’s investment policy, and in accordance with California Government Code, the following investments are authorized:
64
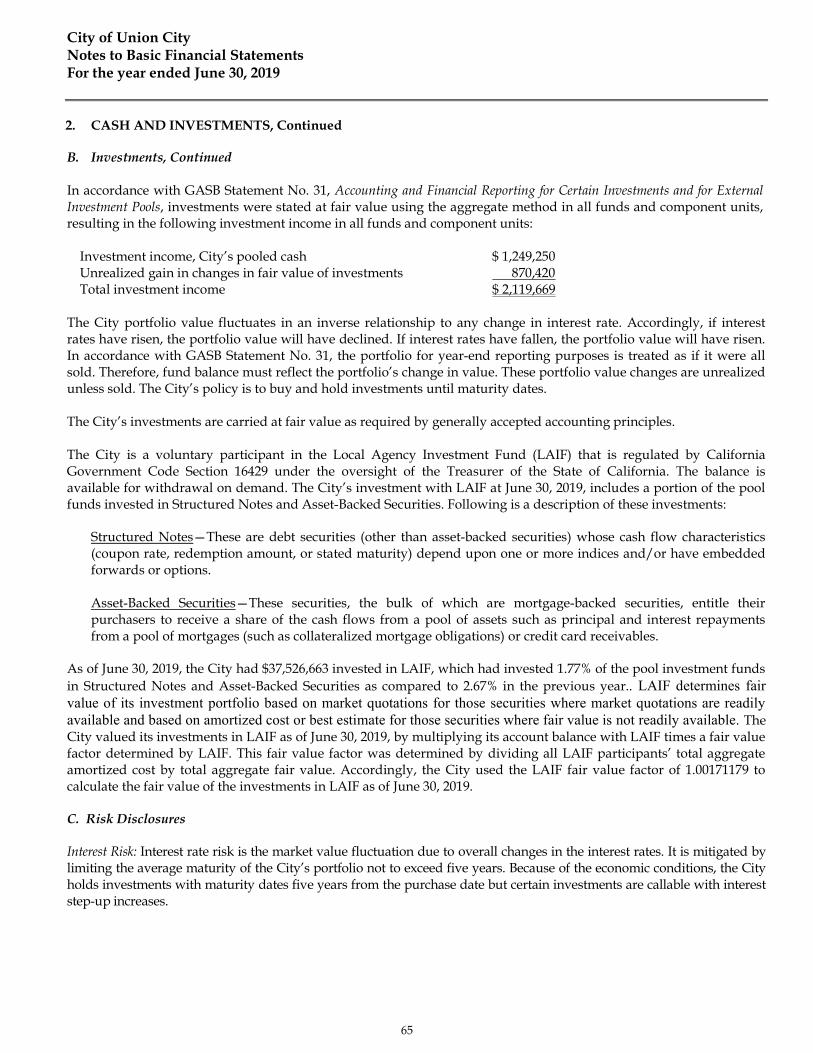
City of Union City Notes to Basic Financial Statements For the year ended June 30, 2019
2. CASH AND INVESTMENTS, Continued
B. Investments, Continued
In accordance with GASB Statement No. 31, Accounting and Financial Reporting for Certain Investments and for External Investment Pools, investments were stated at fair value using the aggregate method in all funds and component units, resulting in the following investment income in all funds and component units:
Investment income, City’s pooled cash $ 1,249,250 Unrealized gain in changes in fair value of investments 870,420 Total investment income $ 2,119,669
The City portfolio value fluctuates in an inverse relationship to any change in interest rate. Accordingly, if interest rates have risen, the portfolio value will have declined. If interest rates have fallen, the portfolio value will have risen. In accordance with GASB Statement No. 31, the portfolio for year-end reporting purposes is treated as if it were all sold. Therefore, fund balance must reflect the portfolio’s change in value. These portfolio value changes are unrealized unless sold. The City’s policy is to buy and hold investments until maturity dates.
The City’s investments are carried at fair value as required by generally accepted accounting principles.
The City is a voluntary participant in the Local Agency Investment Fund (LAIF) that is regulated by California Government Code Section 16429 under the oversight of the Treasurer of the State of California. The balance is available for withdrawal on demand. The City’s investment with LAIF at June 30, 2019, includes a portion of the pool funds invested in Structured Notes and Asset-Backed Securities. Following is a description of these investments:
Structured Notes—These are debt securities (other than asset-backed securities) whose cash flow characteristics (coupon rate, redemption amount, or stated maturity) depend upon one or more indices and/or have embedded forwards or options.
Asset-Backed Securities—These securities, the bulk of which are mortgage-backed securities, entitle their purchasers to receive a share of the cash flows from a pool of assets such as principal and interest repayments from a pool of mortgages (such as collateralized mortgage obligations) or credit card receivables.
As of June 30, 2019, the City had $37,526,663 invested in LAIF, which had invested 1.77% of the pool investment funds in Structured Notes and Asset-Backed Securities as compared to 2.67% in the previous year.. LAIF determines fair value of its investment portfolio based on market quotations for those securities where market quotations are readily available and based on amortized cost or best estimate for those securities where fair value is not readily available. The City valued its investments in LAIF as of June 30, 2019, by multiplying its account balance with LAIF times a fair value factor determined by LAIF. This fair value factor was determined by dividing all LAIF participants’ total aggregate amortized cost by total aggregate fair value. Accordingly, the City used the LAIF fair value factor of 1.00171179 to calculate the fair value of the investments in LAIF as of June 30, 2019.
C. Risk Disclosures
Interest Risk: Interest rate risk is the market value fluctuation due to overall changes in the interest rates. It is mitigated by limiting the average maturity of the City’s portfolio not to exceed five years. Because of the economic conditions, the City holds investments with maturity dates five years from the purchase date but certain investments are callable with interest step-up increases.
65

City of Union City Notes to Basic Financial Statements For the year ended June 30, 2019
2. CASH AND INVESTMENTS, Continued
C. Risk Disclosures, Continued
At June 30, 2019, the City had the following investment maturities:
Credit Risk: Credit risk is the loss of value of an investment due to a downgrade of its rating or the failure or impairment of its issuer. It is the City's policy to limit its investments in these investment types to the top rating issued by nationally recognized statistical rating organizations (NRSROs), including raters Standard & Poor's and Moody's Investor's Service. At June 30, 2019, the City's credit risks, expressed on a percentage basis, were as follows:
Custodial Credit Risk: For an investment, custodial credit risk is the risk that, in the event of the failure of the counterparty, the City will not be able to recover the value of its investments or collateral securities that are in the possession of an outside party. As the collateral is held by a trustee in the City’s name, none of the investments were subject to custodial credit risk.
D. Fair Value Measurement
The City acquires its investments with the expectation of future income or profit and is subject to GASB Statement No. 72, Fair Value Measurement and Application. Investments (except for money market accounts, time deposits, and commercial paper) are measured at fair value on a recurring basis. Recurring fair value measurements are those that GASB Statements require or permit in the statement of net position at the end of each reporting period. Fair value measurements are categorized based on the valuation inputs used to measure an asset’s fair value: Level 1 inputs are quoted prices in active markets for identical assets; Level 2 inputs are significant other observable inputs; Level 3 inputs are significant unobservable inputs. Investment fair value measurements at June 30, 2019, are described below.
66
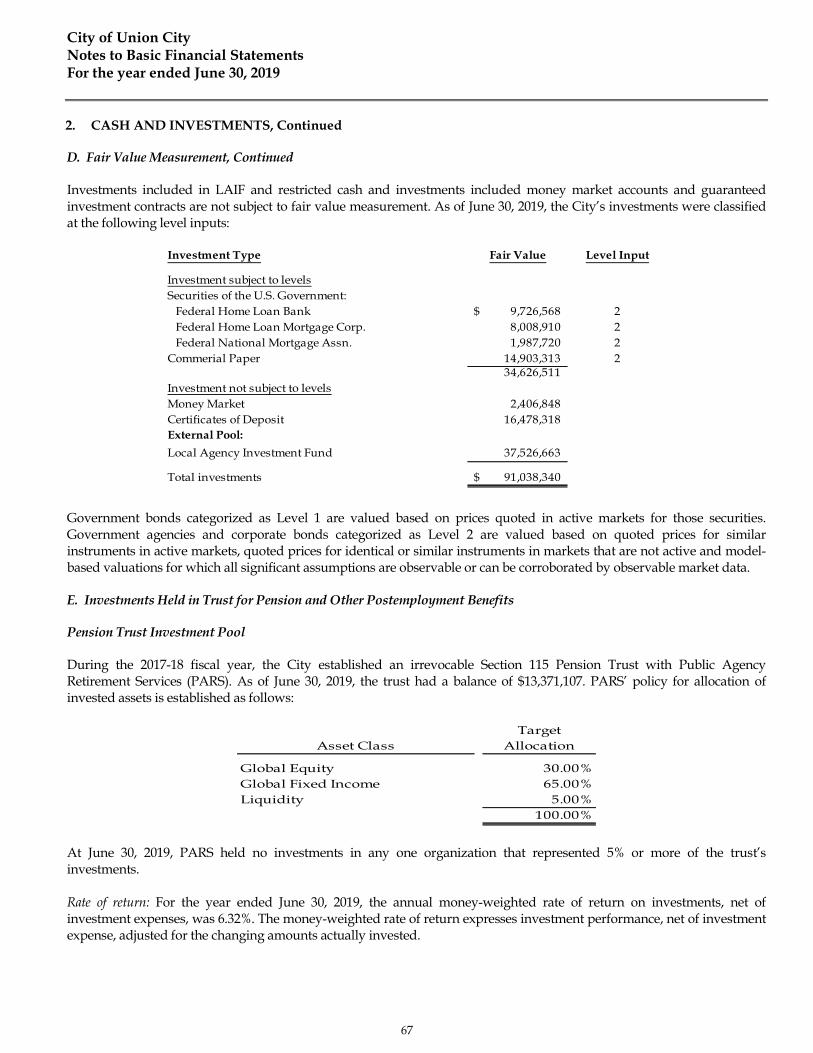
City of Union City Notes to Basic Financial Statements For the year ended June 30, 2019
2. CASH AND INVESTMENTS, Continued
D. Fair Value Measurement, Continued
Investments included in LAIF and restricted cash and investments included money market accounts and guaranteed investment contracts are not subject to fair value measurement. As of June 30, 2019, the City’s investments were classified at the following level inputs:
Government bonds categorized as Level 1 are valued based on prices quoted in active markets for those securities. Government agencies and corporate bonds categorized as Level 2 are valued based on quoted prices for similar instruments in active markets, quoted prices for identical or similar instruments in markets that are not active and model-based valuations for which all significant assumptions are observable or can be corroborated by observable market data.
E. Investments Held in Trust for Pension and Other Postemployment Benefits
Pension Trust Investment Pool
During the 2017-18 fiscal year, the City established an irrevocable Section 115 Pension Trust with Public Agency Retirement Services (PARS). As of June 30, 2019, the trust had a balance of $13,371,107. PARS’ policy for allocation of invested assets is established as follows:
At June 30, 2019, PARS held no investments in any one organization that represented 5% or more of the trust’s investments.
Rate of return: For the year ended June 30, 2019, the annual money-weighted rate of return on investments, net of investment expenses, was 6.32%. The money-weighted rate of return expresses investment performance, net of investment expense, adjusted for the changing amounts actually invested.
67
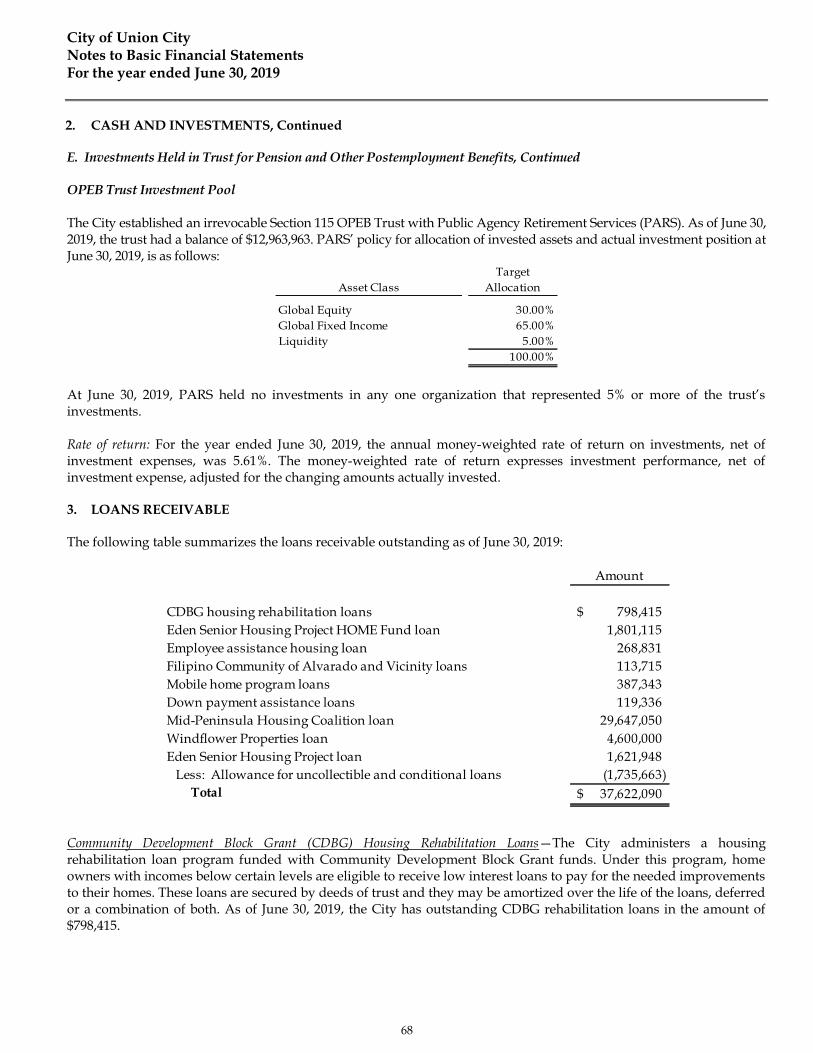
City of Union City Notes to Basic Financial Statements For the year ended June 30, 2019
2. CASH AND INVESTMENTS, Continued
E. Investments Held in Trust for Pension and Other Postemployment Benefits, Continued
OPEB Trust Investment Pool
The City established an irrevocable Section 115 OPEB Trust with Public Agency Retirement Services (PARS). As of June 30, 2019, the trust had a balance of $12,963,963. PARS’ policy for allocation of invested assets and actual investment position at June 30, 2019, is as follows:
At June 30, 2019, PARS held no investments in any one organization that represented 5% or more of the trust’s investments.
Rate of return: For the year ended June 30, 2019, the annual money-weighted rate of return on investments, net of investment expenses, was 5.61%. The money-weighted rate of return expresses investment performance, net of investment expense, adjusted for the changing amounts actually invested.
3. LOANS RECEIVABLE
The following table summarizes the loans receivable outstanding as of June 30, 2019:
Community Development Block Grant (CDBG) Housing Rehabilitation Loans—The City administers a housing rehabilitation loan program funded with Community Development Block Grant funds. Under this program, home owners with incomes below certain levels are eligible to receive low interest loans to pay for the needed improvements to their homes. These loans are secured by deeds of trust and they may be amortized over the life of the loans, deferred or a combination of both. As of June 30, 2019, the City has outstanding CDBG rehabilitation loans in the amount of $798,415.
68

City of Union City Notes to Basic Financial Statements For the year ended June 30, 2019
3. LOANS RECEIVABLE, Continued
Eden Senior Housing Project HOME Fund Loan—In May 2000, the City entered into a Disposition and Development Agreement (DDA) with Eden Housing for Union City Senior Village Independent Living Development (Independent Living Development). Through the Home Investment Partnership Act program (HOME funds), the City has agreed to provide a loan of $2,200,000, which Eden Housing can draw down as needed. Eden Housing has drawn down $1,801,115 in HOME funds as of June 30, 2019. The loan, which is due in 40 years and bears interest at 3%, will be repaid from residual receipts generated by the project. As June 30, 2019, the balance on this loan is $1,801,115.
Employee Assistance Housing Loan —The City offers a housing assistance loan to full-time employees who meet certain criteria. The employee must be a first-time Union City homebuyer and the purchased home must be used as the employee’s primary residence. The loans are secured by first deeds of trust and interest is adjusted annually, each February 1. The interest rate on the loan is the same as the rate of interest earned on City funds on deposit with the California Local Agency Investment Fund (LAIF) as of December 31 of the previous calendar year. Principal and interest are paid bi-weekly through payroll deductions. At June 30, 2019, the City has one outstanding loan in the amount of $268,831.
Filipino Community of Alvarado and Vicinity (FCAV)—The former Redevelopment Agency loaned $124,235 for the rehabilitation of the Holly House and to retain its uses as affordable housing and meeting center of the Filipino Community of Alvarado and Vicinity. The loan is deferred, and it matures in 2028. The loan bears interest at 7%, which is also deferred. In July 2007, the City and the FCAV entered into an agreement that set forth the terms for the repayment of the $124,235 loan and other loans provided to the FCAV under the CDBG program. As of June 30, 2019, an allowance for uncollectible accounts has been established against the loan for $113,715.
Mobile Home Program—This Redevelopment Agency program provided assistance to low- and moderate- income individuals to purchase mobile homes. The loans bear interest at 5%, with principal and interest due monthly. The loan maturities range between 10 and 30 years from the date of loans. With the dissolution of the Redevelopment Agency, these loans are now accounted for in the City of Union City as Successor Agency to the Redevelopment Agency Low-Moderate Income Housing Fund. As of June 30, 2019, the City has outstanding mobile home program loans totaling $387,343.
Down Payment Assistance Loans—In June 2003, the Redevelopment Agency entered into an agreement with the Neighborhood Housing Services Silicon Valley (NHSSV) to fund a down payment assistance program using tax increment revenue received in the Redevelopment Agency Low-Moderate Income Housing Fund. The Redevelopment Agency provided $1,000,000 in funding. In late June 2015, NHSSV informed the City that they would be closing their operations. Accordingly, in November 2015, undisbursed funds were returned to the City and the down payment assistance loans were conveyed to the City. As June 30, 2019, $119,336 in down payment assistance loans is outstanding.
Mid-Peninsula Housing Coalition—In August 2004, the Redevelopment Agency provided Mid-Peninsula Housing Coalition, doing business as MP Mission Associates, L.P., a loan of $4,150,000 to build 120 affordable family rental units on Mission Boulevard (the “Mission Gateway” project). The loan is to be repaid in 55 years at 3% interest from residual receipts generated by the project. As of June 30, 2019, the balance on this loan is $4,150,000.
In April 2010, the Redevelopment Agency provided Mid-Peninsula Housing Coalition, doing business as MP Union City TOD I, L.P., a loan of $20,417,748 to build 100 affordable housing units on Block 4 in the Station District (Phase 1 of the “Station Center” project). This loan is to be repaid in 55 years at 0.25% interest. As of June 30, 2019, the balance on this loan is $20,380,766.
69

City of Union City Notes to Basic Financial Statements For the year ended June 30, 2019
3. LOANS RECEIVABLE, Continued
In March 2011, the Redevelopment Agency provided Mid-Peninsula Housing Coalition, doing business as MP Union City TOD II, L.P., a loan of $5,116,284 to build 55 affordable housing units on Block 4 of the Station District (Phase 2 of the “Station Center” project). This loan is to be repaid in 55 years at 3% interest. As of June 30, 2019, the balance on this loan is $5,116,284. The completed Station Center project includes 155 affordable housing units and two manager units.
With the dissolution of the Redevelopment Agency, these loans are now accounted for in the City of Union City as Successor Agency to the Redevelopment Agency Low-Moderate Income Housing Fund.
Windflower Properties Loan—In September 2014, the City entered into a Disposition and Development Agreement (DDA) with Windflower Properties, LLC, (Windflower) to convey Block 3 of the Station District to Windflower for the development of a market-rate housing/mixed-use development consisting of 243 residential units, ground-floor retail space, parking and related amenities. In the DDA, Windflower agrees to pay the City $4,600,000 for Block 3 of the Station District within 5 years of completing the development. As of June 30, 2019, the balance on this loan is $4,600,000.
Eden Senior Housing Project Loan—The City’s former Redevelopment Agency had made available up to $1,800,000 through a development loan for this project. Through June 30, 2019, $1,621,948 has been drawn down by Eden Senior Housing. Repayment of this loan may be forgiven if certain conditions are met; accordingly, an allowance for conditional loans has been recorded in the amount of $1,621,948. With the dissolution of the Redevelopment Agency, this loan is now accounted for in the City of Union City as Successor Agency to the Redevelopment Agency Low-Moderate Income Housing Fund.
4. UNEARNED REVENUE AND UNAVAILABLE REVENUES
A. Government-Wide Financial Statements
Unearned revenues represent amounts received in advance of services to be provided. At June 30, 2019, the following unearned revenues were recorded in the government-wide financial statements:
B. Fund Financial Statements
At June 30, 2019, unearned revenues were as follows:
70
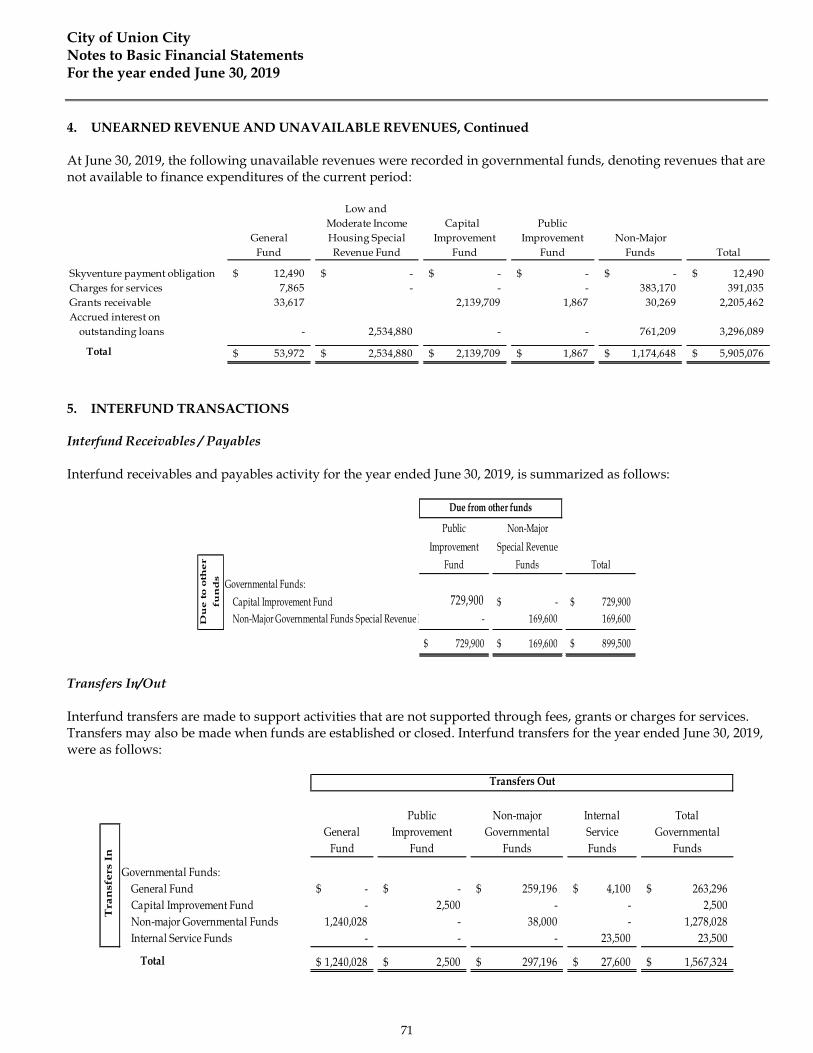
City of Union City Notes to Basic Financial Statements For the year ended June 30, 2019
4. UNEARNED REVENUE AND UNAVAILABLE REVENUES, Continued
At June 30, 2019, the following unavailable revenues were recorded in governmental funds, denoting revenues that are not available to finance expenditures of the current period:
5. INTERFUND TRANSACTIONS
Interfund Receivables / Payables
Interfund receivables and payables activity for the year ended June 30, 2019, is summarized as follows:
Transfers In/Out
Interfund transfers are made to support activities that are not supported through fees, grants or charges for services. Transfers may also be made when funds are established or closed. Interfund transfers for the year ended June 30, 2019, were as follows:
71

City of Union City Notes to Basic Financial Statements For the year ended June 30, 2019
6. CAPITAL ASSETS
Capital asset activity for the year ended June 30, 2019, was as follows:
72

City of Union City Notes to Basic Financial Statements For the year ended June 30, 2019
6. CAPITAL ASSETS, Continued
Governmental activities capital assets include non-depreciable capital assets for $35,064,070 which per agreement, will be transferred from the City to an agency upon completion. This future obligation to the agency is represented by a long-term liability for $35,064,070 in the Government-Wide Statement of Net Position.
73
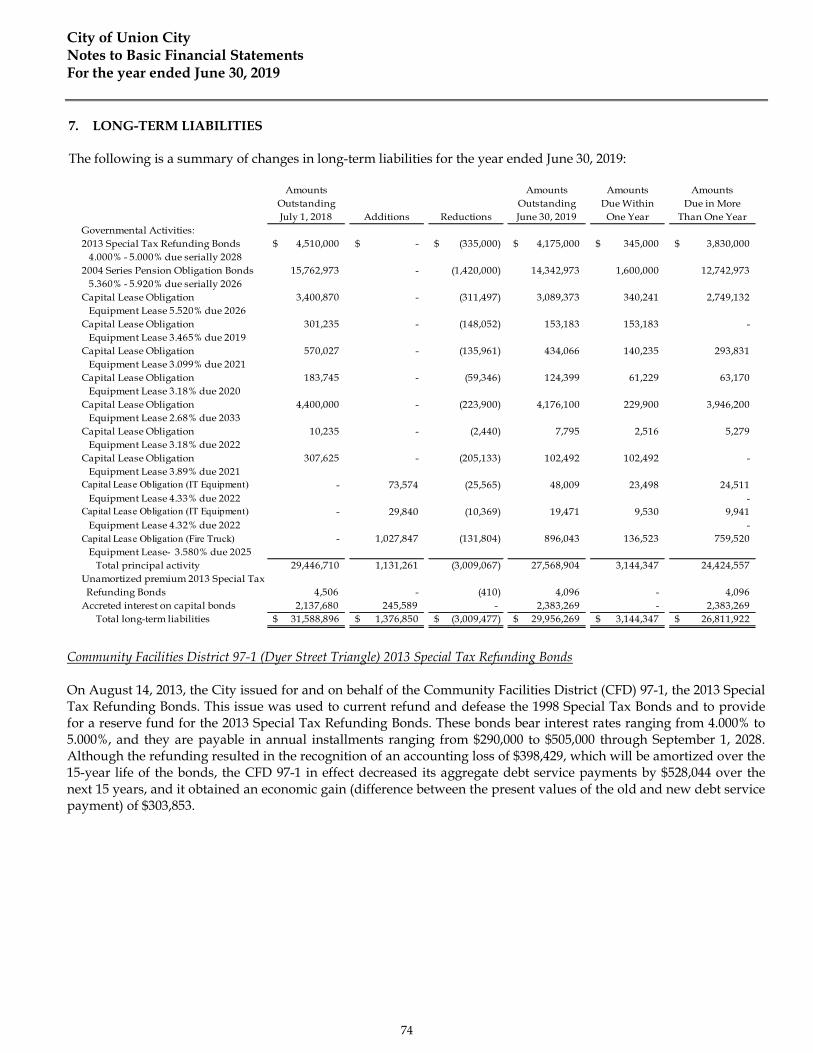
City of Union City Notes to Basic Financial Statements For the year ended June 30, 2019
7. LONG-TERM LIABILITIES
The following is a summary of changes in long-term liabilities for the year ended June 30, 2019:
Community Facilities District 97-1 (Dyer Street Triangle) 2013 Special Tax Refunding Bonds
On August 14, 2013, the City issued for and on behalf of the Community Facilities District (CFD) 97-1, the 2013 Special Tax Refunding Bonds. This issue was used to current refund and defease the 1998 Special Tax Bonds and to provide for a reserve fund for the 2013 Special Tax Refunding Bonds. These bonds bear interest rates ranging from 4.000% to 5.000%, and they are payable in annual installments ranging from $290,000 to $505,000 through September 1, 2028. Although the refunding resulted in the recognition of an accounting loss of $398,429, which will be amortized over the 15-year life of the bonds, the CFD 97-1 in effect decreased its aggregate debt service payments by $528,044 over the next 15 years, and it obtained an economic gain (difference between the present values of the old and new debt service payment) of $303,853.
74

City of Union City Notes to Basic Financial Statements For the year ended June 30, 2019
7. LONG-TERM LIABILITIES, Continued
2004 Pension Obligations Bonds
On June 17, 2004, the City issued bonds in the amount of $22,997,973 to fund a portion of the City’s unfunded accrued actuarial liability to the California Public Employees’ Retirement System (PERS). Interest payments are payable semi-annually on January 1 and July 1. The bonds are comprised of $21,475,000 of current interest bonds and $1,522,973 of capital appreciation bonds. The bonds in the amount of $3,920,000 mature through July 1, 2014, and bear interest at the rate of 5.36% term bond. The bonds in the amount of $6,335,000 mature through July 1, 2019, and bear interest at the rate of 5.71% term bond. The bonds in the amount of $11,220,000 mature through July 1, 2026, and bear interest at the rate of 5.92% term bond. The accreted values of the capital appreciation bonds are $3,015,000 and $3,140,000, and they are due July 1, 2025, and July 1, 2026, respectively. Cumulative interest expense recognized on the capital appreciation bonds through June 30, 2019, is $2,383,269. The bonds are funded by the City’s general revenue. The bonds are insured by MBIA Insurance Corporation.
Capital Lease Obligations
On October 10, 2010, the City entered into an equipment lease/purchase agreement under the taxable Build America Bond program. The proceeds from this lease were used to acquire, install and lease equipment designed to improve energy efficiency within the City. Equipment in the amount of $4,820,559 is reflected in the governmental activities capital asset schedule. The lease proceeds were held by a custodian and funds were drawn down on a reimbursement basis. The interest rate on the lease proceeds is 5.52%; the Internal Revenue Service reimburses the City 35% of the interest payment. At this fiscal year-end, $3,089,373 is outstanding.
On June 29, 2012, the City entered into an equipment lease-purchase agreement for the acquisition of Motorola communications equipment. The lease has a term of seven years. The equipment is leased to the City for lease payments that will be sufficient to meet the debt service obligations of the leasing arrangement. At the end of the leasing period, the title to the equipment will pass to the City. Communications equipment in the amount of $970,179 is included in the governmental activities capital asset schedule. Because they are similar to debt, the present value of the total payments to be made by the City is recorded as long-term debt. $153,183 remains outstanding at the end of this fiscal year.
On July 23, 2015, the City entered into a lease-purchase agreement for the acquisition of network infrastructure equipment. The lease has a term of seven years. The equipment is leased to the City for lease payments that will be sufficient to meet the debt service obligations of the leasing arrangement. At the end of the leasing period, the title to the equipment will pass to the City. Because they are similar to debt, the present value of the total payments to be made by the City is recorded as long-term debt. $434,066 remains outstanding at the end of this fiscal year.
On August 22, 2016, the City entered into a lease-purchase agreement for the acquisition of network infrastructure equipment. The lease has a term of five years. The equipment is leased to the City for lease payments that will be sufficient to meet the debt service obligations of the leasing arrangement. At the end of the leasing period, the title to the equipment will pass to the City. Because they are similar to debt, the present value of the total payments to be made by the City is recorded as long-term debt. $124,399 remains outstanding at the end of this fiscal year.
On November 1, 2016, the City entered into a lease-purchase agreement for the energy upgrade of various City facilities. The lease has a term of seventeen years. The equipment is leased to the City for lease payments that will be sufficient to meet the debt service obligations of the leasing arrangement. At the end of the leasing period, the title to the equipment will pass to the City. Because they are similar to debt, the present value of the total payments to be made by the City is recorded as long-term debt. $4,176,100 remains outstanding at the end of this fiscal year.
75

City of Union City Notes to Basic Financial Statements For the year ended June 30, 2019
7. LONG-TERM LIABILITIES, Continued
On October 10, 2017, the City entered into a lease-purchase agreement for the acquisition of network infrastructure equipment. The lease has a term of five years. The equipment is leased to the City for lease payments that will be sufficient to meet the debt service obligations of the leasing arrangement. At the end of the leasing period, the title to the equipment will pass to the City. Because they are similar to debt, the present value of the total payments to be made by the City is recorded as long-term debt. $7,795 remains outstanding at the end of this fiscal year.
On June 20, 2018, the City entered into a lease-purchase agreement for the acquisition of network infrastructure equipment. The lease has a term of three years. The equipment is leased to the City for lease payments that will be sufficient to meet the debt service obligations of the leasing arrangement. At the end of the leasing period, the title to the equipment will pass to the City. Because they are similar to debt, the present value of the total payments to be made by the City is recorded as long-term debt. $102,492 remains outstanding at the end of this fiscal year.
On March 18, 2019, the City entered into a lease-purchase agreement for the acquisition of IT equipment with Hewlett-Packard Financial Services Company. The lease has a term of three years. The equipment is leased to the City for lease payments that will be sufficient to meet the debt service obligations of the leasing arrangement. At the end of the leasing period, the title to the equipment will pass to the City. Because they are similar to debt, the present value of the total payments to be made by the City is recorded as long-term debt. $48,009 remains outstanding at the end of this fiscal year.
On June 20, 2018, the City entered into a lease-purchase agreement for the acquisition of network infrastructure equipment. The lease has a term of three years. The equipment is leased to the City for lease payments that will be sufficient to meet the debt service obligations of the leasing arrangement. At the end of the leasing period, the title to the equipment will pass to the City. Because they are similar to debt, the present value of the total payments to be made by the City is recorded as long-term debt. $19,471 remains outstanding at the end of this fiscal year.
On February 21, 2018, the City entered into a lease-purchase agreement for the acquisition of network infrastructure equipment with PNC Equipment Finance LLC. The lease has a term of three years. The equipment is leased to the City for lease payments that will be sufficient to meet the debt service obligations of the leasing arrangement. At the end of the leasing period, the title to the equipment will pass to the City. Because they are similar to debt, the present value of the total payments to be made by the City is recorded as long-term debt. $896,043 remains outstanding at the end of this fiscal year.
76

City of Union City Notes to Basic Financial Statements For the year ended June 30, 2019
7. LONG-TERM LIABILITIES, Continued
The following schedule illustrates the debt service requirements to maturity for governmental activities as of June 30, 2019, exclusive of the premium on the Special Tax Bonds and the accreted interest on the Pension Obligation capital appreciation bonds:
Pledges of Revenues
Special Tax Bonds/Special Tax Refunding Bonds Community Facilities District 97-1 (Dyer Street Triangle)
The City had pledged the special tax revenues assessed on property owners in the Community Facilities District 97-1 (CFD) to the payment of the principal, interest and any premium on the 2013 Special Tax Refunding Bonds Community Facilities District 97-1 (Dyer Street Triangle). Special tax revenues are defined as the proceeds of the special tax levies within the CFD and received by the City, including any scheduled payment and any prepayments thereof, interest earned on the proceeds and the proceeds of the redemption or sale of property sold as a result of foreclosure of the lien of the special taxes to the amount of said lien and interest thereon. Special tax revenues do not include any penalties collected in connection with delinquent special taxes. Annual principal and interest payments on the bonds are expected to require approximately 94 percent of special tax revenues received. The total principal and interest remaining on the bonds is $5,221,651 payable through September 2028. For the current fiscal year, principal and interest paid with special tax revenues and total special revenues received were $335,000 and $191,024, respectively.
77
City of Union City Notes to Basic Financial Statements For the year ended June 30, 2019
7. LONG-TERM LIABILITIES, Continued
Summary of Long-Term Debt without City Commitment
Los Robles Apartments Multi-Family Housing Revenue Bond
The City assisted Los Robles Apartments Associates, L.P., in the refinancing of their existing multi-family housing revenue bonds at more attractive interest rates. This project provides 140 housing units. These bonds are secured by a deed of trust on the property and are payable by rent and tax-credit equity. Neither the faith and credit nor the taxing power of the City, the State, or any political subdivision thereof are pledged for the payment of the principal or interest on the bonds. The outstanding balance due on these bonds at June 30, 2019, is $9,596,274.
8. COMPENSATED ABSENCES
The City records a liability to recognize the financial effect of unused vacation and other compensated absences. The total liability for unused vacation and other compensated absences is $2,053,468 at June 30, 2019.
9. FUND BALANCES
A. Classification of Governmental Fund Balances
Governmental fund balances represent the net current assets of each fund. Net current assets generally represents a fund’s cash and receivables, less its liabilities. Implementation of Governmental Accounting Standards Board (GASB) Statement No. 54, Fund Balance Reporting and Governmental Fund Type Definitions, became effective with fiscal periods beginning after June 15, 2010. GASB 54 has replaced the fund balance definitions of reserved, unreserved-designated and unreserved-undesignated with the following classifications:
Nonspendable fund balance—The portion of fund balance that represents amounts that are not in a spendable form or are required to remain intact.
78
City of Union City Notes to Basic Financial Statements For the year ended June 30, 2019
9. FUND BALANCES, Continued
A. Classification of Governmental Fund Balances, Continued
Restricted fund balance—The portion of fund balance that represents amounts constrained to specific purposes by their providers, such as grantors, bondholders or higher levels of government, through constitutional provisions or by enabling legislation.
Committed fund balance—The portion of fund balance constrained to specific purposes by a government itself, using its highest level of decision-making authority. Committed amounts cannot be used for any other purpose unless the government takes the same highest level action to remove or change the constraint.
Assigned fund balance—The portion of fund balance that represents amounts the government intends to use for a specific purpose. The intent can be expressed by the governing body or by an official to whom the governing body delegates the authority.
Unassigned fund balance—The portion of fund balance that represents amounts available for any purpose. Only the General Fund may report a positive unassigned balance amount. Negative unassigned fund balance amounts can exist in any fund.
Under GASB Statement No. 54, reserve for encumbrances is no longer reported on the face of the financial statements. In the General Fund, the $621,286 reported as encumbrances in assigned fund balance represents purchase orders outstanding at the end of the year for goods ordered prior to June 30, 2019, but not delivered as of fiscal year-end, and work remaining on consulting or construction contracts. General Government has outstanding purchase orders of $196,640, of which $52,272 is for project monitoring and fire, environmental, and cannabis consulting services (City Manager); $78,899 is for IT support and maintenance; and $65,469 is for audit, tax consulting, and payment services (Finance). The Public Safety (Police) Department has outstanding purchase orders of $167,473, with $25,937 for administration; $22,152 for training; $4,987 for investigation; $55,724 for patrol; $8,206 for communications; and, $50,467 for operations. The Public Works Department has outstanding purchase orders of $157,848, with $72,166 for administration; $21,141 for traffic engineering; $58,286 for building/ground administration and maintenance; $8,375 for park maintenance; and, $6,255 for land surveyor services. The Community and Recreation Services Department has outstanding purchase orders of $6,956 for youth and recreation programs. The Economic and Community Development Department has outstanding purchase orders of $92,369, with $42,839 for the general plan amendment services contract; $44,632 for contract services, including contract planners and building inspectors; and $4,898 for project administration.
79
City of Union City Notes to Basic Financial Statements For the year ended June 30, 2019
9. FUND BALANCES, Continued
B. Classificati1on of Governmental Fund Balances, Continued
The following table represents amounts reported under the GASB Statement No. 54 fund balance classifications:
80
City of Union City Notes to Basic Financial Statements For the year ended June 30, 2019
9. FUND BALANCES, Continued
B. Classification of Governmental Fund Balances, Continued
Encumbrance balances by major funds and non-major funds as of June 30, 2019 are:
10. DEFICIT FUND BALANCES
At June 30, 2019, the following funds had a deficit fund balance:
The Capital Improvement fund receives its revenues through grant reimbursements. SinNotesce the grants are reimbursable, there is a delay between incurring expenditures and the processing of the related billings and receiving payments. The deficit will be reduced as reimbursements are received.
11. DEFINED BENEFIT PENSION PLAN
A. Summary of Pension Plan Balances
Pension related balances presented on the Statement of Net Position as of June 30, 2019, by individual plan are described in the following table:
81

City of Union City Notes to Basic Financial Statements For the year ended June 30, 2019
11. DEFINED BENEFIT PENSION PLAN, Continued
B. CalPERS Miscellaneous Plan - Agent Multiple-Employer Defined Benefit Plan
General Information about the Plan
Plan Description—All miscellaneous qualified permanent and probationary employees are eligible to participate in the City’s pension plans administered by the California Public Employees’ Retirement System (CalPERS), which acts as a common investment and administrative agent for its participating member employers. Benefit provisions under the Plans are established by State statute and City resolution. CalPERS issues publicly available reports, available on the CalPERS website, that include a full description of the pension plans, including benefit provisions, assumptions and membership information.
Benefits provided — CalPERS provides retirement and disability retirement benefits, annual cost-of-living adjustments, and death benefits to plan members and beneficiaries. Benefits are based on years of credited service, equal to one year of full-time employment. Members with five years of total service are eligible to retire at age 50 with statutorily reduced benefits. The retirement benefit, payable monthly for life, is based on a formula which varies depending on the employee’s retirement plan, date of hire, and participation in a public retirement plan prior to City employment. The death benefit is one of the following: the Basic Death Benefit, the 1957 Survivor Benefit, or the Optional Settlement 2W Death Benefit. The cost-of-living adjustments for each plan are applied as specified by the Public Employees’ Retirement Law.
On October 26, 2010, the City amended its contract with CalPERS to provide a two-tier retirement formula plan. Employees hired on or after November 24, 2010, would fall under second-tier plans. On January 1, 2013, the Public Employees’ Pension Reform Act (PEPRA) took effect. PEPRA distinguishes between “Classic” employees, who were in a public retirement plan prior to January 1, 2013, and “new” employees, who first became a member of a public retirement plan on or after January 1, 2013. “Classic” employees, hired by the City on or after November 24, 2010, are eligible for Tier 2 benefits while new employees are eligible for the retirement benefits established by PEPRA.
A summary of the benefit formulas follows:
Prior to On or After On or AfterHire date November 24, 2010 November 24, 2010 January 1, 2013Benefit formula 2.5% @ 55 2.0% @ 60 2.0% @ 62Average final compensation period 12 months 36 months 36 monthsBenefit vesting schedule 5 years service 5 years service 5 years serviceBenefit payments monthly for life monthly for life monthly for lifeRetirement age 55 60 62Monthly benefits, as a % of eligible compensation 2.500% 2.000% 2.000%Required employee contribution rates 8.000% 7.000% 7.000%Required employer contribution rates 10.283% 10.283% 10.283%Required UAL payment $2,172,408
Miscellaneous Members
82

City of Union City Notes to Basic Financial Statements For the year ended June 30, 2019
11. DEFINED BENEFIT PENSION PLAN, Continued
B. CalPERS Miscellaneous Plan - Agent Multiple-Employer Defined Benefit Plan, Continued
General Information about the Plan, Continued
Covered Employees—At the measurement date June 30, 2018, the most recent data available, the following Miscellaneous employees were covered by the benefit terms:
Miscellaneous Inactive employees or beneficiaries currently receiving benefits 199 Inactive employees entitled to but not yet receiving benefits 287 Active employees 199 Total 701
Contributions—Section 20814(C) of the California Public Employees’ Retirement Law (PERL) requires that the employer contribution rates for all public employers be determined on an annual basis by the actuary and shall be effective on the July 1 following notice of a change in the rate. Funding contributions for both Plans are determined annually on an actuarial basis as of June 30 by CalPERS. The actuarially determined rate is the estimated amount necessary to finance the costs of benefits earned by employees during the year, with additional amount to finance any unfunded accrued liability. The City is required to contribute the difference between the actuarially determined rate and the contribution rate of employees.
Net Pension Liability
The City’s net pension liability for Miscellaneous employees is measured as the total pension liability less the pension plan’s fiduciary net position. The net pension liability of the Plan is measured as of June 30, 2018, and the total pension liability for the plan used to calculated the net pension liability was determined by an actuarial valuation as of June 30, 2017, rolled forward to June 30, 2018, using standard update procedures.
Actuarial Assumptions—The total pension liabilities in the June 30, 2017, actuarial valuations were determined using the following actuarial assumptions:
83
City of Union City Notes to Basic Financial Statements For the year ended June 30, 2019
11. DEFINED BENEFIT PENSION PLAN, Continued
B. CalPERS Miscellaneous Plan - Agent Multiple-Employer Defined Benefit Plan, Continued
Net Pension Liability, Continued
The underlying mortality assumptions and all other actuarial assumptions used in the June 30, 2017 valuation were based on the results of an actuarial experience study for the period 1997 to 2011. Further details of the Experience Study can be found on the CalPERS website.
Discount Rate—The discount rate used to measure the total pension liability was 7.15% for the Plan. To determine whether the municipal bond rate should be used in the calculation of a discount rate for the plan, CalPERS stress tested plans that would most likely result in a discount rate that would be different from the actuarially assumed discount rate. Based on the testing, none of the tested plans run out of assets. Therefore, the current 7.15 percent discount rate is adequate and the use of the municipal bond rate calculation is not necessary. The long term expected discount rate of 7.15 percent will be applied to all plans in the Public Employees Retirement Fund (PERF). The stress test results are presented in a detailed report that can be obtained from the CalPERS website.
The long-term expected rate of return on pension plan investments was determined using a building-block method in which best-estimate ranges of expected future real rates of return (expected returns, net of pension plan investment expense and inflation) are developed for each major asset class.
In determining the long-term expected rate of return, CalPERS took into account both short-term and long-term market return expectations as well as the expected pension fund (Public Employees’ Retirement Fund) cash flows. Such cash flows were developed assuming that both members and employers will make their required contributions on time and as scheduled in all future years. Using historical returns of all the funds’ asset classes, expected compound (geometric) returns were calculated over the short-term (first 10 years) and the long-term (11-60 years) using a building-block approach. Using the expected nominal returns for both short-term and long-term, the present value of benefits was calculated for each fund. The expected rate of return was set by calculating the single equivalent expected return that arrived at the same present value of benefits for cash flows as the one calculated using both short-term and long-term returns. The expected rate of return was then set equivalent to the single equivalent rate calculated above and rounded down to the nearest one quarter of one percent.
The following table reflects the long-term expected real rate of return by asset class. The rate of return was calculated using the capital market assumptions applied to determine the discount rate and asset allocation. The target allocation shown was adopted by the CalPERS Board effective July 1, 2016.
84
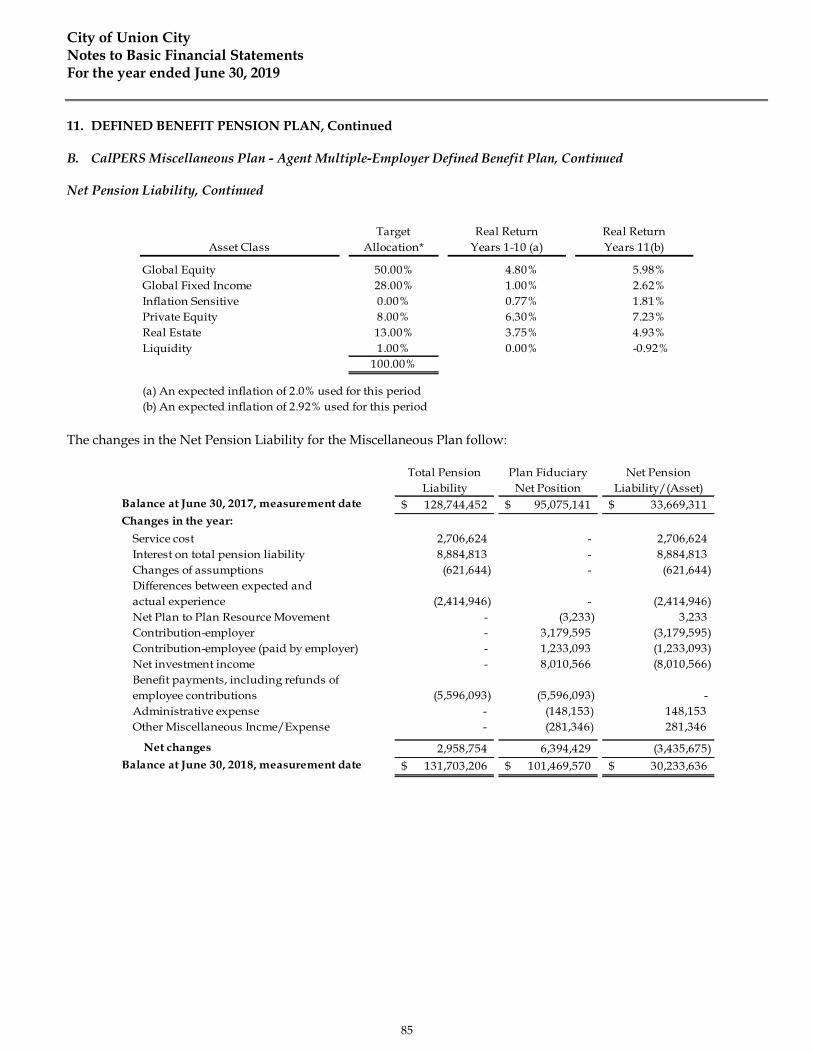
City of Union City Notes to Basic Financial Statements For the year ended June 30, 2019
11. DEFINED BENEFIT PENSION PLAN, Continued
B. CalPERS Miscellaneous Plan - Agent Multiple-Employer Defined Benefit Plan, Continued
Net Pension Liability, Continued
The changes in the Net Pension Liability for the Miscellaneous Plan follow:
85
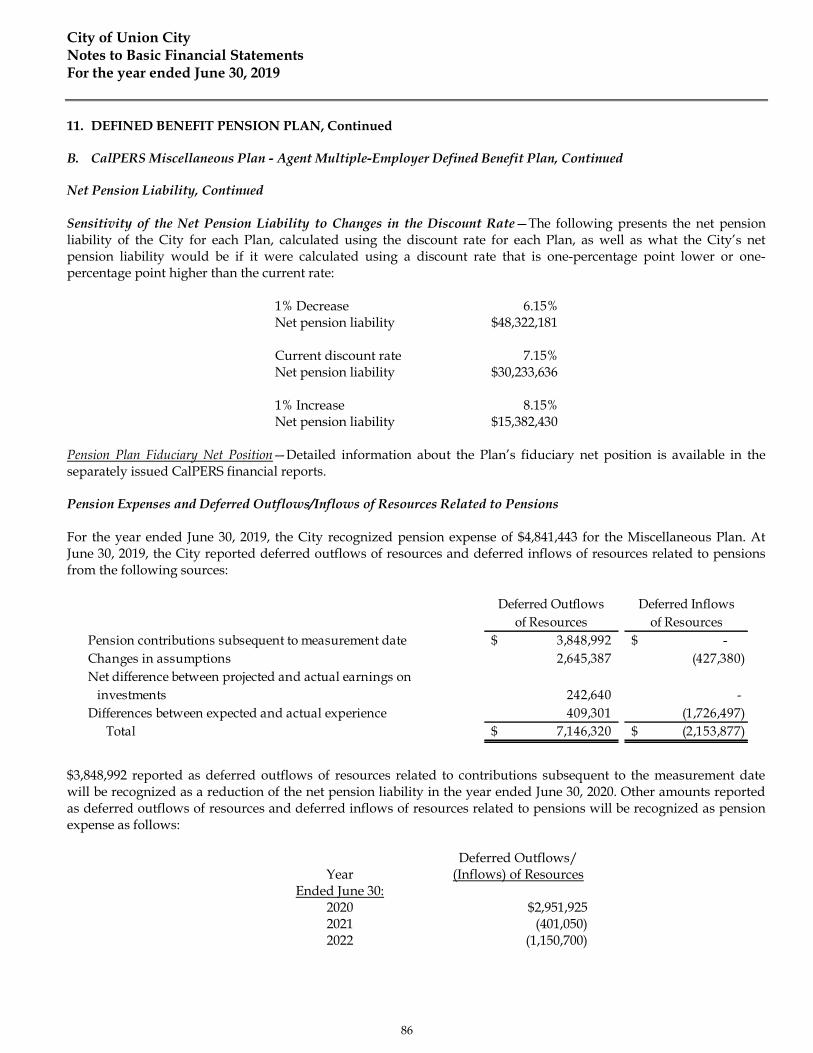
City of Union City Notes to Basic Financial Statements For the year ended June 30, 2019
11. DEFINED BENEFIT PENSION PLAN, Continued
B. CalPERS Miscellaneous Plan - Agent Multiple-Employer Defined Benefit Plan, Continued
Net Pension Liability, Continued
Sensitivity of the Net Pension Liability to Changes in the Discount Rate—The following presents the net pension liability of the City for each Plan, calculated using the discount rate for each Plan, as well as what the City’s net pension liability would be if it were calculated using a discount rate that is one-percentage point lower or one-percentage point higher than the current rate:
Pension Plan Fiduciary Net Position—Detailed information about the Plan’s fiduciary net position is available in the separately issued CalPERS financial reports.
Pension Expenses and Deferred Outflows/Inflows of Resources Related to Pensions
For the year ended June 30, 2019, the City recognized pension expense of $4,841,443 for the Miscellaneous Plan. At June 30, 2019, the City reported deferred outflows of resources and deferred inflows of resources related to pensions from the following sources:
$3,848,992 reported as deferred outflows of resources related to contributions subsequent to the measurement date will be recognized as a reduction of the net pension liability in the year ended June 30, 2020. Other amounts reported as deferred outflows of resources and deferred inflows of resources related to pensions will be recognized as pension expense as follows:
Year Ended June 30:
Deferred Outflows/ (Inflows) of Resources
2020 $2,951,9252021 (401,050)2022 (1,150,700)
1% Decrease 6.15%Net pension liability $48,322,181
Current discount rate 7.15%Net pension liability $30,233,636
1% Increase 8.15%Net pension liability $15,382,430
86
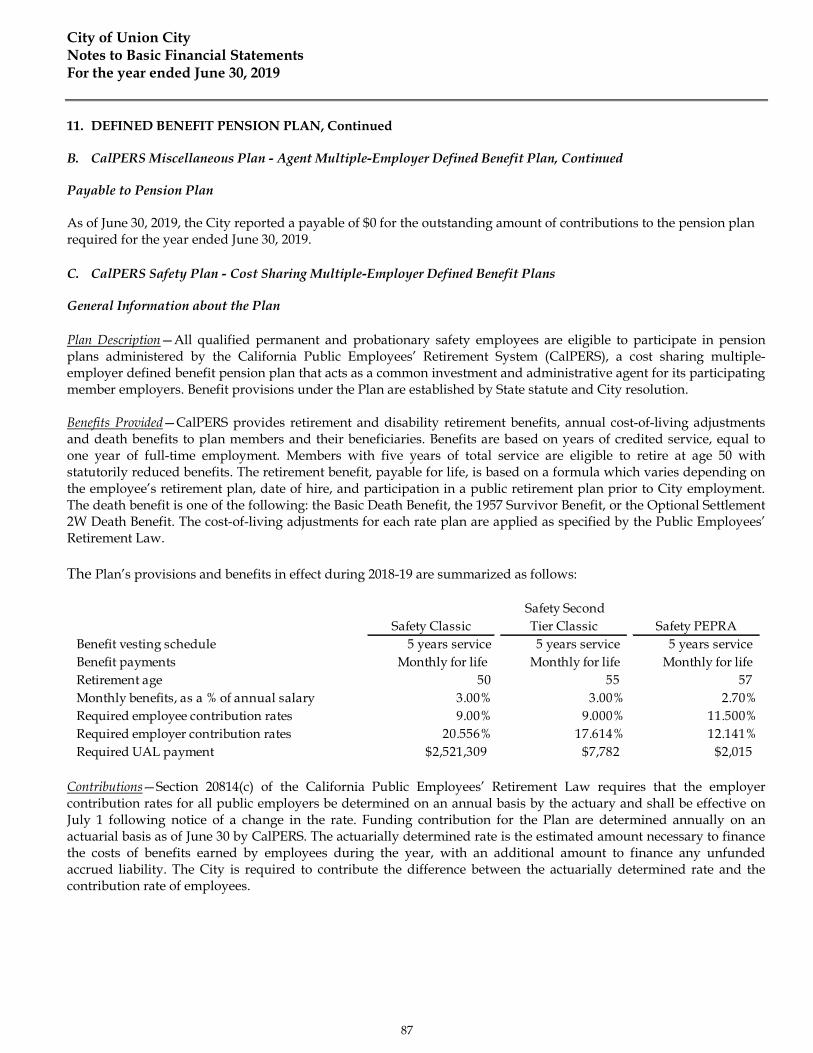
City of Union City Notes to Basic Financial Statements For the year ended June 30, 2019
11. DEFINED BENEFIT PENSION PLAN, Continued
B. CalPERS Miscellaneous Plan - Agent Multiple-Employer Defined Benefit Plan, Continued
Payable to Pension Plan
As of June 30, 2019, the City reported a payable of $0 for the outstanding amount of contributions to the pension plan required for the year ended June 30, 2019.
C. CalPERS Safety Plan - Cost Sharing Multiple-Employer Defined Benefit Plans
General Information about the Plan
Plan Description—All qualified permanent and probationary safety employees are eligible to participate in pension plans administered by the California Public Employees’ Retirement System (CalPERS), a cost sharing multiple-employer defined benefit pension plan that acts as a common investment and administrative agent for its participating member employers. Benefit provisions under the Plan are established by State statute and City resolution.
Benefits Provided—CalPERS provides retirement and disability retirement benefits, annual cost-of-living adjustments and death benefits to plan members and their beneficiaries. Benefits are based on years of credited service, equal to one year of full-time employment. Members with five years of total service are eligible to retire at age 50 with statutorily reduced benefits. The retirement benefit, payable for life, is based on a formula which varies depending on the employee’s retirement plan, date of hire, and participation in a public retirement plan prior to City employment. The death benefit is one of the following: the Basic Death Benefit, the 1957 Survivor Benefit, or the Optional Settlement 2W Death Benefit. The cost-of-living adjustments for each rate plan are applied as specified by the Public Employees’ Retirement Law.
The Plan’s provisions and benefits in effect during 2018-19 are summarized as follows:
Contributions—Section 20814(c) of the California Public Employees’ Retirement Law requires that the employer contribution rates for all public employers be determined on an annual basis by the actuary and shall be effective on July 1 following notice of a change in the rate. Funding contribution for the Plan are determined annually on an actuarial basis as of June 30 by CalPERS. The actuarially determined rate is the estimated amount necessary to finance the costs of benefits earned by employees during the year, with an additional amount to finance any unfunded accrued liability. The City is required to contribute the difference between the actuarially determined rate and the contribution rate of employees.
87
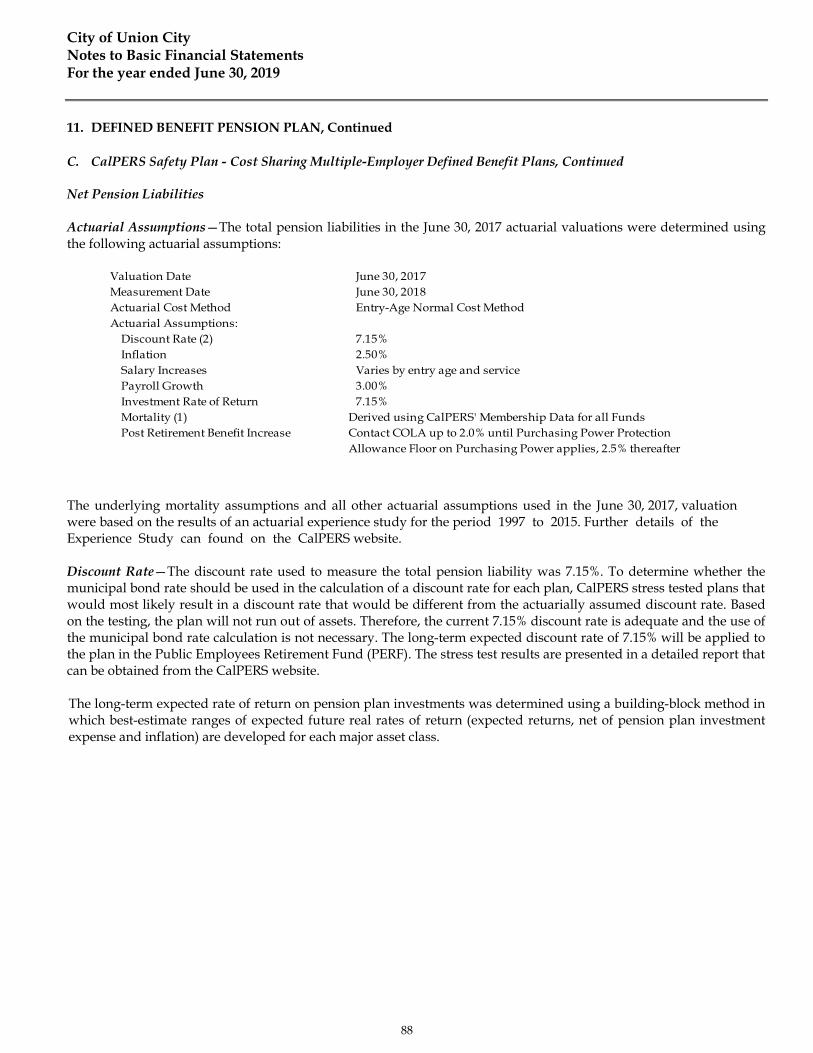
City of Union City Notes to Basic Financial Statements For the year ended June 30, 2019
11. DEFINED BENEFIT PENSION PLAN, Continued
C. CalPERS Safety Plan - Cost Sharing Multiple-Employer Defined Benefit Plans, Continued
Net Pension Liabilities
Actuarial Assumptions—The total pension liabilities in the June 30, 2017 actuarial valuations were determined using the following actuarial assumptions:
The underlying mortality assumptions and all other actuarial assumptions used in the June 30, 2017, valuation were based on the results of an actuarial experience study for the period 1997 to 2015. Further details of the Experience Study can found on the CalPERS website.
Discount Rate—The discount rate used to measure the total pension liability was 7.15%. To determine whether the municipal bond rate should be used in the calculation of a discount rate for each plan, CalPERS stress tested plans that would most likely result in a discount rate that would be different from the actuarially assumed discount rate. Based on the testing, the plan will not run out of assets. Therefore, the current 7.15% discount rate is adequate and the use of the municipal bond rate calculation is not necessary. The long-term expected discount rate of 7.15% will be applied to the plan in the Public Employees Retirement Fund (PERF). The stress test results are presented in a detailed report that can be obtained from the CalPERS website.
The long-term expected rate of return on pension plan investments was determined using a building-block method in which best-estimate ranges of expected future real rates of return (expected returns, net of pension plan investment expense and inflation) are developed for each major asset class.
88

City of Union City Notes to Basic Financial Statements For the year ended June 30, 2019
11. DEFINED BENEFIT PENSION PLAN, Continued
C. CalPERS Safety Plan - Cost Sharing Multiple-Employer Defined Benefit Plans, Continued
Net Pension Liabilities, Continued
In determining the long-term expected rate of return, CalPERS took into account both short-term and long-term market return expectations as well as the expected pension fund cash flows. Using historical returns of all the funds’ asset classes, expected compound returns were calculated over the short-term (first 10 years) and the long-term (11-60 years) using a building-block approach. Using the expected nominal returns for both short-term and long-term, the present value of benefits was calculated for each fund. The expected rate of return was set by calculating the single equivalent expected return that arrived at the same present value of benefits for cash flows as the one calculated using both short-term and long-term returns. The expected rate of return was then set equivalent to the single equivalent rate calculated above and rounded down to the nearest one quarter of one percent.
The following table reflects the long-term expected real rate of return by asset class. The rate of return was calculated using the capital market assumptions applied to determine the discount rate and asset allocation. The target allocation shown was adopted by the CalPERS Board effective on July 1, 2016.
As of June 30, 2019, the City reported its proportionate share of the net pension liability of the Safety Plan as follows:
The City’s net pension liability of the Plan is measured as the proportionate share of the total net pension liability of the Plan. The net pension liability of the Plan is measured as of June 30, 2018, using an actuarial valuation as of June 30, 2017 rolled forward to June 30, 2018, using standard update procedures. The City’s proportion of the net pension liability was based on a projection of the City’s long-term share of contributions to the pension plan relative to the projected contributions of all participating employers, actuarially determined. The City’s proportionate share of the net pension liability as of measurement dates June 30, 2017, and 2018, was as follows:
89
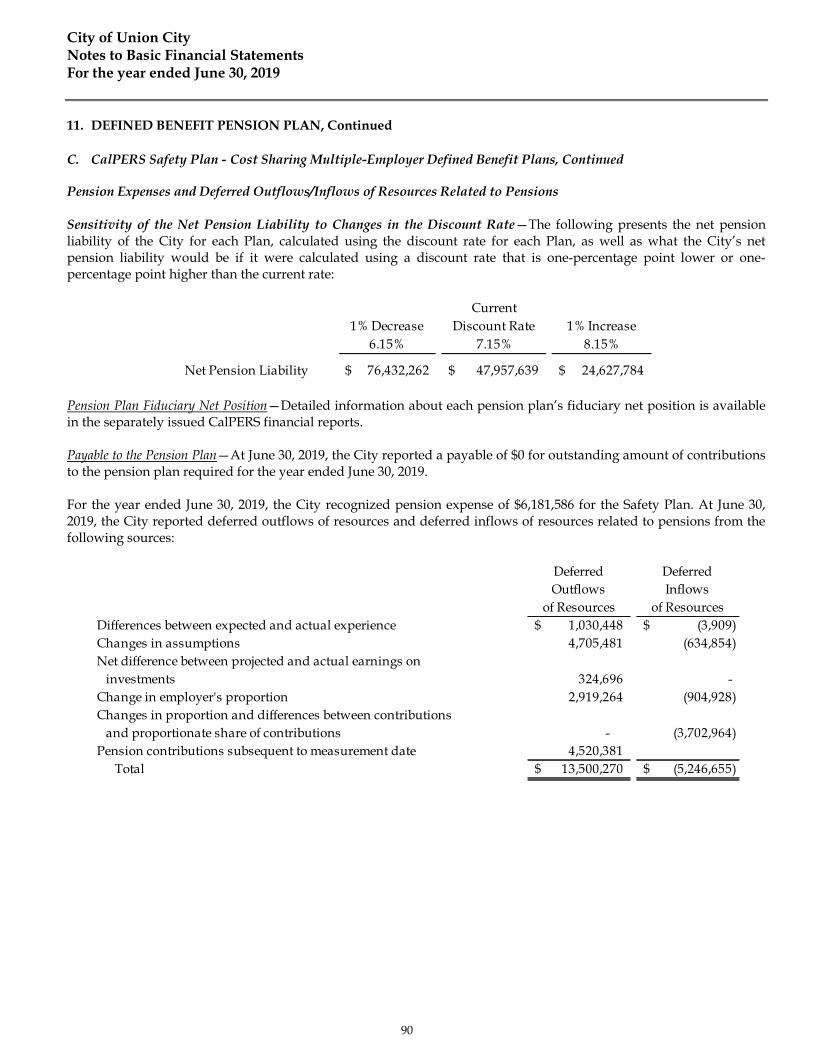
City of Union City Notes to Basic Financial Statements For the year ended June 30, 2019
11. DEFINED BENEFIT PENSION PLAN, Continued
C. CalPERS Safety Plan - Cost Sharing Multiple-Employer Defined Benefit Plans, Continued
Pension Expenses and Deferred Outflows/Inflows of Resources Related to Pensions
Sensitivity of the Net Pension Liability to Changes in the Discount Rate—The following presents the net pension liability of the City for each Plan, calculated using the discount rate for each Plan, as well as what the City’s net pension liability would be if it were calculated using a discount rate that is one-percentage point lower or one-percentage point higher than the current rate:
Pension Plan Fiduciary Net Position—Detailed information about each pension plan’s fiduciary net position is available in the separately issued CalPERS financial reports.
Payable to the Pension Plan—At June 30, 2019, the City reported a payable of $0 for outstanding amount of contributions to the pension plan required for the year ended June 30, 2019.
For the year ended June 30, 2019, the City recognized pension expense of $6,181,586 for the Safety Plan. At June 30, 2019, the City reported deferred outflows of resources and deferred inflows of resources related to pensions from the following sources:
90
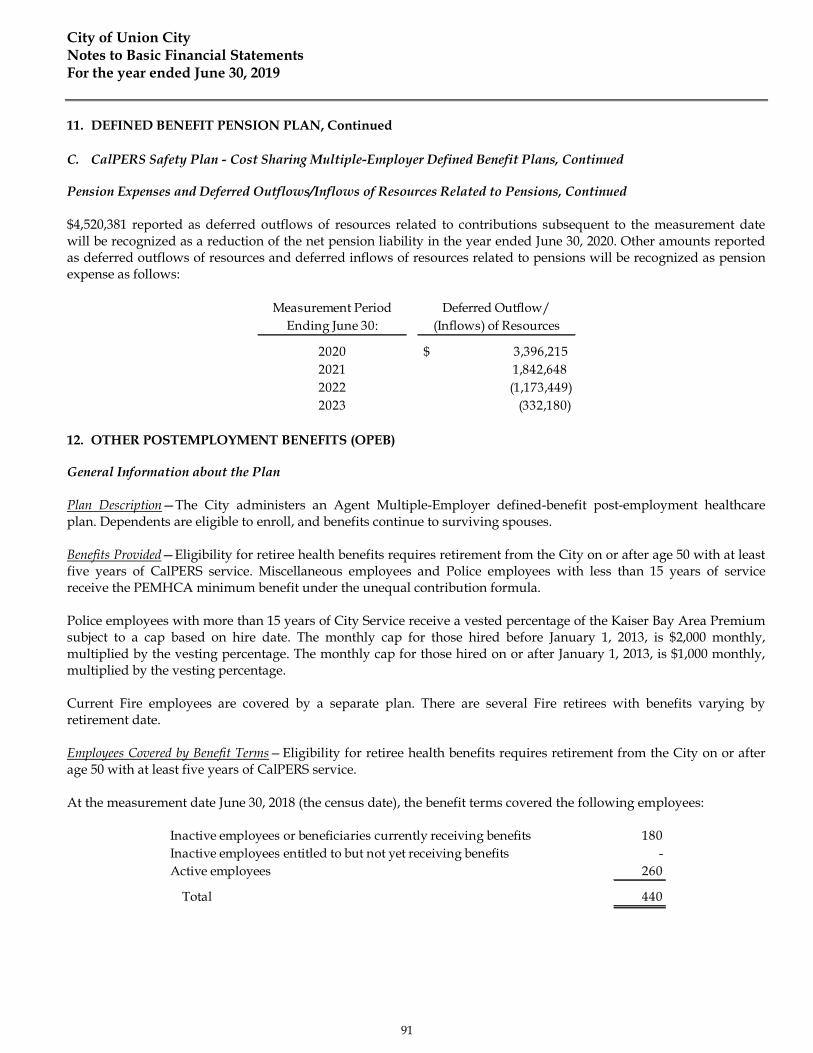
City of Union City Notes to Basic Financial Statements For the year ended June 30, 2019
11. DEFINED BENEFIT PENSION PLAN, Continued
C. CalPERS Safety Plan - Cost Sharing Multiple-Employer Defined Benefit Plans, Continued
Pension Expenses and Deferred Outflows/Inflows of Resources Related to Pensions, Continued
$4,520,381 reported as deferred outflows of resources related to contributions subsequent to the measurement date will be recognized as a reduction of the net pension liability in the year ended June 30, 2020. Other amounts reported as deferred outflows of resources and deferred inflows of resources related to pensions will be recognized as pension expense as follows:
12. OTHER POSTEMPLOYMENT BENEFITS (OPEB)
General Information about the Plan
Plan Description—The City administers an Agent Multiple-Employer defined-benefit post-employment healthcare plan. Dependents are eligible to enroll, and benefits continue to surviving spouses.
Benefits Provided—Eligibility for retiree health benefits requires retirement from the City on or after age 50 with at least five years of CalPERS service. Miscellaneous employees and Police employees with less than 15 years of service receive the PEMHCA minimum benefit under the unequal contribution formula.
Police employees with more than 15 years of City Service receive a vested percentage of the Kaiser Bay Area Premium subject to a cap based on hire date. The monthly cap for those hired before January 1, 2013, is $2,000 monthly, multiplied by the vesting percentage. The monthly cap for those hired on or after January 1, 2013, is $1,000 monthly, multiplied by the vesting percentage.
Current Fire employees are covered by a separate plan. There are several Fire retirees with benefits varying by retirement date.
Employees Covered by Benefit Terms—Eligibility for retiree health benefits requires retirement from the City on or after age 50 with at least five years of CalPERS service.
At the measurement date June 30, 2018 (the census date), the benefit terms covered the following employees:
91

City of Union City Notes to Basic Financial Statements For the year ended June 30, 2019
12. OTHER POSTEMPLOYMENT BENEFITS (OPEB), Continued
General Information about the Plan, Continued
Contributions—The City makes contributions as benefits come due (pay as you go).
Net OPEB Liability
The City's net OPEB liability was measured as of June 30, 2018, and the total OPEB liability used to calculate the net OPEB liability was determined by an actuarial valuation as of June 30, 2017.
Actuarial Assumptions—The total OPEB liability in the June 30, 2017, actuarial valuation was determined using the following actuarial assumptions, applied to all periods included in the measurement, unless otherwise specified:
Discount Rate—The discount rate used to measure the total OPEB liability is 6.75%. This is the expected long-term rate of return on District assets using the Moderate Index PLUS strategy within the Public Agency Retirement Services (PARS). The projection of cash flows used to determine the discount rate assumed that the City contribution will be made at rates equal to the actuarially determined contribution rates. Based on those assumptions, the OPEB plan's fiduciary net position is projected to cover all future OPEB payments. Therefore, the discount rate was set equal to the long-term expected rate of return.
92
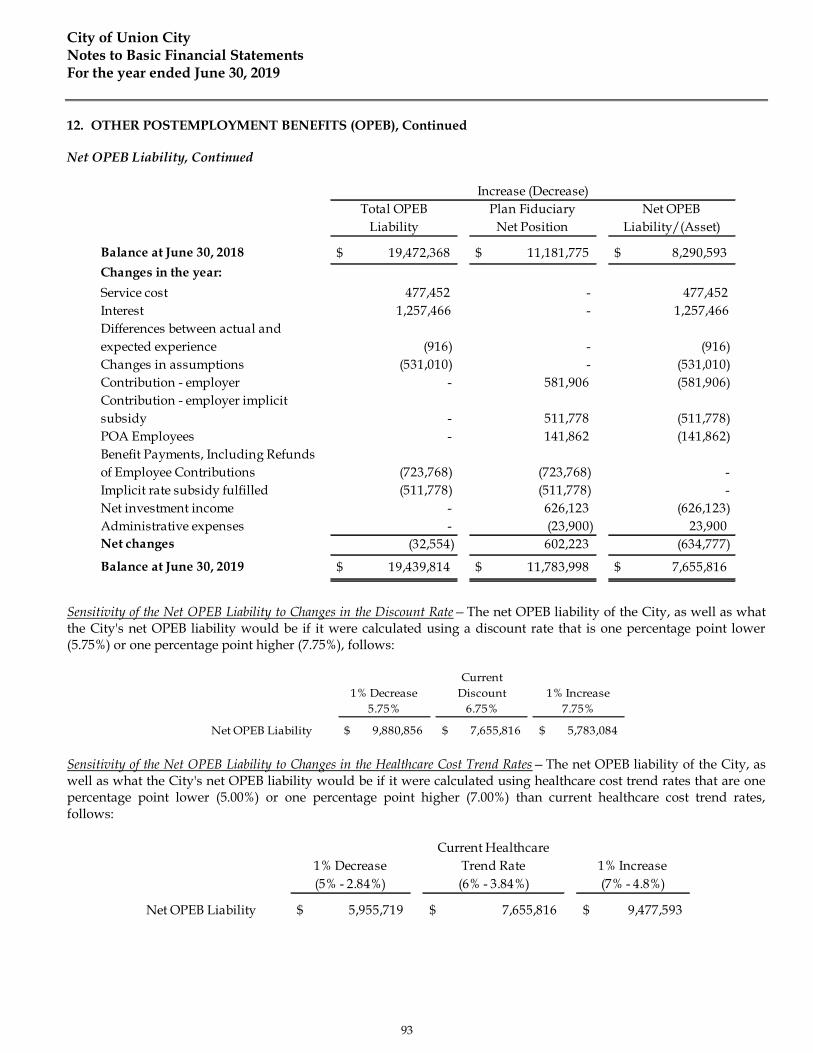
City of Union City Notes to Basic Financial Statements For the year ended June 30, 2019
12. OTHER POSTEMPLOYMENT BENEFITS (OPEB), Continued
Net OPEB Liability, Continued
Sensitivity of the Net OPEB Liability to Changes in the Discount Rate—The net OPEB liability of the City, as well as what the City's net OPEB liability would be if it were calculated using a discount rate that is one percentage point lower (5.75%) or one percentage point higher (7.75%), follows:
Sensitivity of the Net OPEB Liability to Changes in the Healthcare Cost Trend Rates—The net OPEB liability of the City, as well as what the City's net OPEB liability would be if it were calculated using healthcare cost trend rates that are one percentage point lower (5.00%) or one percentage point higher (7.00%) than current healthcare cost trend rates, follows:
93
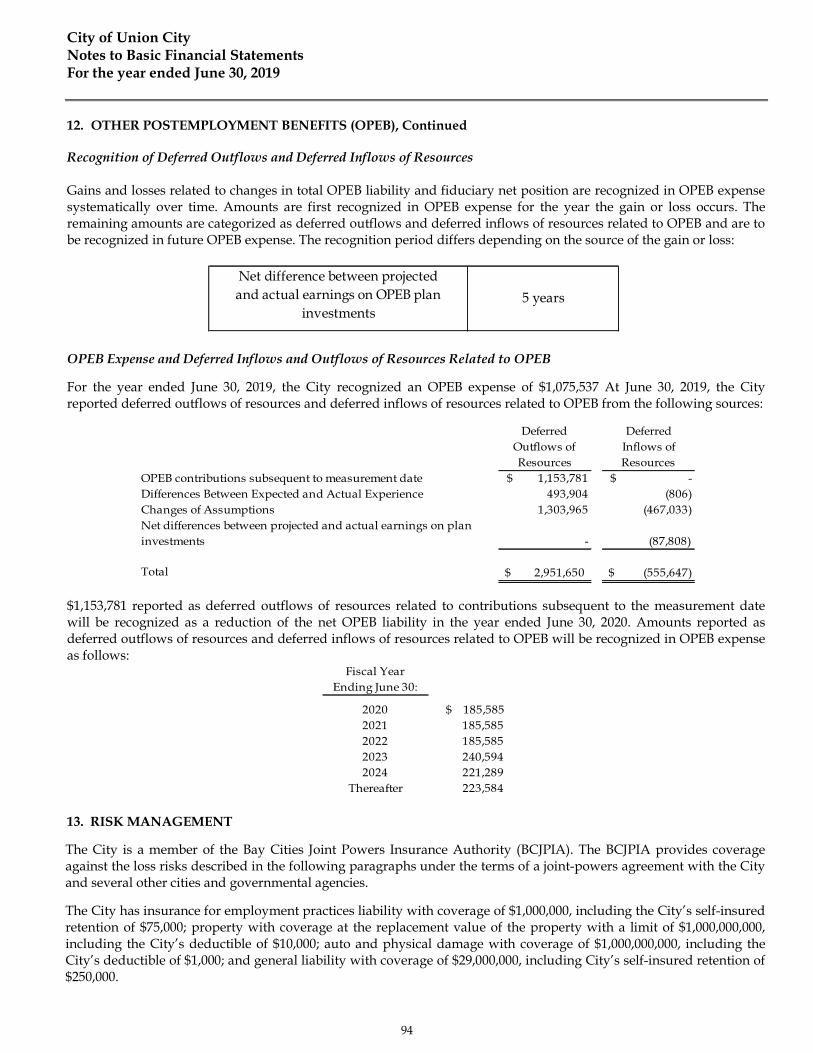
City of Union City Notes to Basic Financial Statements For the year ended June 30, 2019
12. OTHER POSTEMPLOYMENT BENEFITS (OPEB), Continued
Recognition of Deferred Outflows and Deferred Inflows of Resources
Gains and losses related to changes in total OPEB liability and fiduciary net position are recognized in OPEB expense systematically over time. Amounts are first recognized in OPEB expense for the year the gain or loss occurs. The remaining amounts are categorized as deferred outflows and deferred inflows of resources related to OPEB and are to be recognized in future OPEB expense. The recognition period differs depending on the source of the gain or loss:
OPEB Expense and Deferred Inflows and Outflows of Resources Related to OPEB
For the year ended June 30, 2019, the City recognized an OPEB expense of $1,075,537 At June 30, 2019, the City reported deferred outflows of resources and deferred inflows of resources related to OPEB from the following sources:
$1,153,781 reported as deferred outflows of resources related to contributions subsequent to the measurement date will be recognized as a reduction of the net OPEB liability in the year ended June 30, 2020. Amounts reported as deferred outflows of resources and deferred inflows of resources related to OPEB will be recognized in OPEB expense as follows:
13. RISK MANAGEMENT
The City is a member of the Bay Cities Joint Powers Insurance Authority (BCJPIA). The BCJPIA provides coverage against the loss risks described in the following paragraphs under the terms of a joint-powers agreement with the City and several other cities and governmental agencies.
The City has insurance for employment practices liability with coverage of $1,000,000, including the City’s self-insured retention of $75,000; property with coverage at the replacement value of the property with a limit of $1,000,000,000, including the City’s deductible of $10,000; auto and physical damage with coverage of $1,000,000,000, including the City’s deductible of $1,000; and general liability with coverage of $29,000,000, including City’s self-insured retention of $250,000.
94
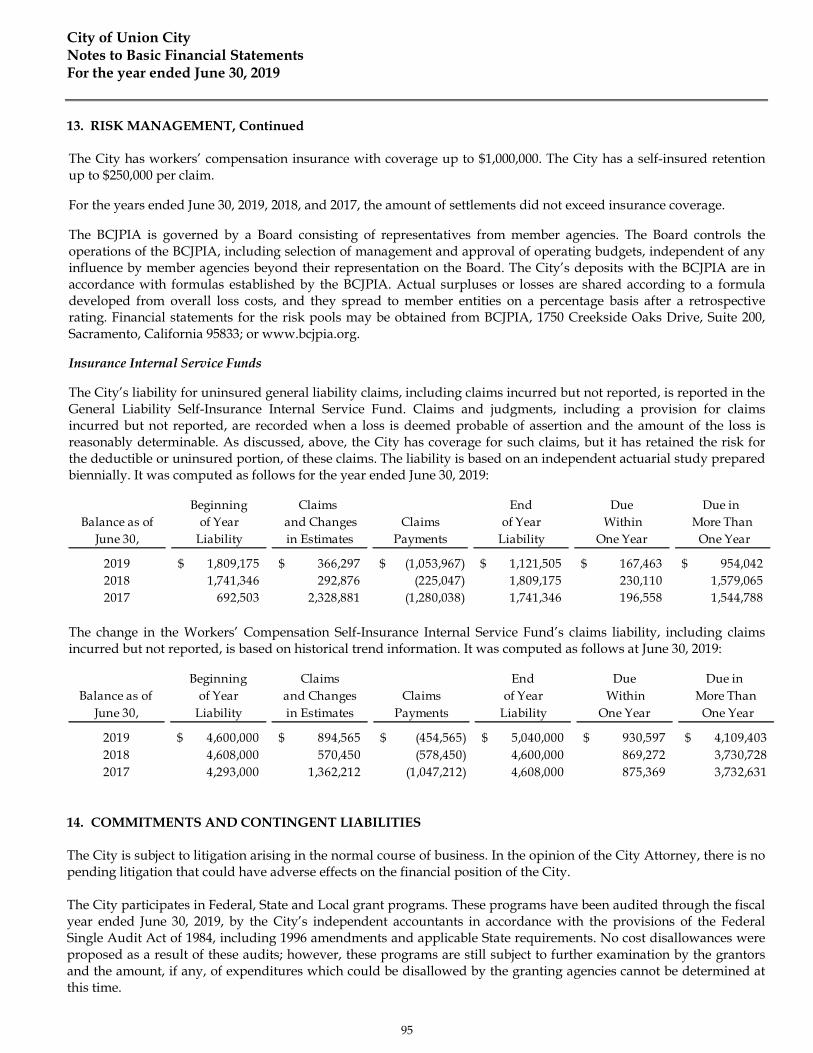
City of Union City Notes to Basic Financial Statements For the year ended June 30, 2019
13. RISK MANAGEMENT, Continued
The City has workers’ compensation insurance with coverage up to $1,000,000. The City has a self-insured retention up to $250,000 per claim.
For the years ended June 30, 2019, 2018, and 2017, the amount of settlements did not exceed insurance coverage.
The BCJPIA is governed by a Board consisting of representatives from member agencies. The Board controls the operations of the BCJPIA, including selection of management and approval of operating budgets, independent of any influence by member agencies beyond their representation on the Board. The City’s deposits with the BCJPIA are in accordance with formulas established by the BCJPIA. Actual surpluses or losses are shared according to a formula developed from overall loss costs, and they spread to member entities on a percentage basis after a retrospective rating. Financial statements for the risk pools may be obtained from BCJPIA, 1750 Creekside Oaks Drive, Suite 200, Sacramento, California 95833; or www.bcjpia.org.
Insurance Internal Service Funds
The City’s liability for uninsured general liability claims, including claims incurred but not reported, is reported in the General Liability Self-Insurance Internal Service Fund. Claims and judgments, including a provision for claims incurred but not reported, are recorded when a loss is deemed probable of assertion and the amount of the loss is reasonably determinable. As discussed, above, the City has coverage for such claims, but it has retained the risk for the deductible or uninsured portion, of these claims. The liability is based on an independent actuarial study prepared biennially. It was computed as follows for the year ended June 30, 2019:
The change in the Workers’ Compensation Self-Insurance Internal Service Fund’s claims liability, including claims incurred but not reported, is based on historical trend information. It was computed as follows at June 30, 2019:
14. COMMITMENTS AND CONTINGENT LIABILITIES
The City is subject to litigation arising in the normal course of business. In the opinion of the City Attorney, there is no pending litigation that could have adverse effects on the financial position of the City.
The City participates in Federal, State and Local grant programs. These programs have been audited through the fiscal year ended June 30, 2019, by the City’s independent accountants in accordance with the provisions of the Federal Single Audit Act of 1984, including 1996 amendments and applicable State requirements. No cost disallowances were proposed as a result of these audits; however, these programs are still subject to further examination by the grantors and the amount, if any, of expenditures which could be disallowed by the granting agencies cannot be determined at this time.
95
City of Union City Notes to Basic Financial Statements For the year ended June 30, 2019
15. DEVELOPMENT AND PARTICIPATION AGREEMENTS
A. Mid-Peninsula Housing Coalition
In August 2004, the Redevelopment Agency provided Mid-Peninsula Housing Coalition, doing business as MP Mission Associates, L.P., a loan of $4,150,000 to build 120 affordable family rental units on Mission Boulevard (the “Mission Gateway” project). The loan is to be repaid in 55 years at 3% interest from residual receipts generated by the project. As of June 30, 2019, the balance on this loan, including unpaid accrued interest, is $5,799,625.
In April 2010, the Redevelopment Agency provided Mid-Peninsula Housing Coalition, doing business as MP Union City TOD I, L.P., a loan of $20,417,748 to build 100 affordable housing units on Block 4 in the Station District (Phase 1 of the “Station Center” project). This loan is to be repaid in 55 years at 0.25% interest. As of June 30, 2019, the balance on this loan, including unpaid accrued interest, is $20,604,463.
In March 2011, the Redevelopment Agency provided Mid-Peninsula Housing Coalition, doing business as MP Union City TOD II, L.P., a loan of $5,116,284 to build 55 affordable housing units on Block 4 of the Station District (Phase 2 of the “Station Center” project). This loan is to be repaid in 55 years at 3% interest. As of June 30, 2019, the balance on this loan, including unpaid accrued interest, is $5,715,248. The completed Station Center project includes 155 affordable housing units and two manager units.
With the dissolution of the Redevelopment Agency, these loans are now accounted for in the City of Union City as Successor Agency to the Redevelopment Agency Low-Moderate Income Housing Fund.
16. SUCCESSOR AGENCY TRUST FOR FORMER COMMUNITY REDEVELOPMENT AGENCY
On December 29, 2011, the California Supreme Court upheld Assembly Bill 1X 26 (the Bill) that provides for the dissolution of all redevelopment agencies in the State of California. This action has impacted the reporting entity of the City of Union City that previously had reported a redevelopment agency within the reporting entity of the City as a blended component unit.
The Bill provides that upon dissolution of a redevelopment agency, either the City or another unit of local government will agree to serve as the “successor agency” to hold the assets until they are distributed to other units of state and local government. On January 24, 2012, by Resolution 4260-12, the City Council elected to become the Successor Agency for the former redevelopment agency in accordance with the bill.
After enactment of the law, which occurred on June 28, 2011, redevelopment agencies in the State of California cannot enter into new projects, obligations or commitments. Subject to the control of a newly established oversight board, remaining assets can only be used to pay enforceable obligations in existence at the date of dissolution (including the completion of any unfinished projects that were subject to legally enforceable contractual commitments).
In future fiscal years, successor agencies will only be allocated revenue in the amount that is necessary to pay the estimated annual installment payments on enforceable obligations of the former redevelopment agency until all enforceable obligations of the prior redevelopment agency have been paid in full and all assets have been liquidated.
The Bill directs the State Controller of the State of California to review the propriety of any transfers of assets between redevelopment agencies and other public bodies that occurred after January 1, 2011. If the public body that received such transfers is not contractually committed to a third party for the expenditure or encumbrance of those assets, the State Controller is required to order the available assets to be transferred to the public body designated as the successor agency by the Bill.
96
City of Union City Notes to Basic Financial Statements For the year ended June 30, 2019
17. SUCCESSOR AGENCY TRUST FOR FORMER COMMUNITY REDEVELOPMENT AGENCY, Continued
Management believes, in consultation with legal counsel, that the obligations of the former redevelopment agency due to the City are valid enforceable obligations payable by the successor agency trust under the requirements of the Bill. The City’s position on this issue is not a position of settled law and there is considerable legal uncertainty regarding this issue. It is reasonably possible that a legal determination may be made at a later date by an appropriate judicial authority that would resolve this issue unfavorably to the City.
In accordance with the timeline set forth in the Bill, as modified by the California Supreme Court on December 29, 2011, all redevelopment agencies in the State of California were dissolved and ceased to operate as a legal entity as of February 1, 2012. Prior to that date, the final seven months of activity of the Redevelopment Agency continued to be reported in the governmental funds of the City. After the date of dissolution, the assets and activities of the dissolved Redevelopment Agency are reported in the Redevelopment Property Tax Trust Fund, a fiduciary fund (private-purpose trust fund) in the financial statements of the City.
The transfer of assets and liabilities of the former Redevelopment Agency as of February 1, 2012, (effectively the same date as January 31, 2012) from governmental funds of the City to fiduciary funds was reported in the governmental funds as an extraordinary loss (or gain) in the governmental fund financial statements. The receipt of these assets and liabilities as of January 31, 2012, was reported in the private-purpose trust fund as an extraordinary loss.
A. Cash and Investments
The City of Union City maintains a cash and investment pool that is available for all City activities, including those of the Successor Agency Trust fund. The Successor Agency’s Cash and investments reported in the Statement of Fiduciary Net Position as of June 30, 2019, consisted of the following:
The City manages the Successor Agency’s cash and investments in a manner consistent with the rest of its cash and investment pool. See Note 2 for additional information regarding the type of investments and risks.
97

City of Union City Notes to Basic Financial Statements For the year ended June 30, 2019
17. SUCCESSOR AGENCY TRUST FOR FORMER COMMUNITY REDEVELOPMENT AGENCY, Continued
B. Loans Receivable
The Successor Agency has the following loan receivable outstanding as of June 30, 2019:
On January 1, 2011, the Redevelopment Agency agreed to provide Abaxis, Inc., a loan of $1,000,000 to rehabilitate the buildings it leases. The rehabilitation was to include, without limitation, the installation of tenant improvements designed to improve the capacity and efficiency of the company’s operations to accommodate an expansion of workforce and the installation of new capital equipment. Loan funds were disbursed to Abaxis, Inc. on a reimbursement basis. The outstanding principal balance of the note bears interest at 5% simple annual interest accruing from the date of, and on the amount of, the loan disbursement to Abaxis, Inc. As of June 30, 2019, Abaxis, Inc., has drawn down $1,000,000. The loan may be forgiven if certain criteria are met; accordingly, a $1,000,000 allowance for doubtful accounts has been recorded.
C. Long-Term Liabilities
Upon the dissolution of the Redevelopment Agency, the balances of long-term liabilities were transferred from the former Redevelopment Agency to the Successor Agency. The balances of these long-term liabilities, represented by tax allocation bonds (TAB), as of June 30, 2019, follow:
98

City of Union City Notes to Basic Financial Statements For the year ended June 30, 2019
17. SUCCESSOR AGENCY TRUST FOR FORMER COMMUNITY REDEVELOPMENT AGENCY, Continued
C. Long-Term Liabilities
2007 Community Redevelopment Agency Refunding Tax Allocation Bonds
On July 11, 2007, the former Redevelopment Agency issued bonds in the amount of $32,905,000 to advance refund a portion of the Agency’s outstanding 1999 tax allocation bonds. The refunding was done in order to take advantage of lower interest rates. The net present value debt service savings is $2,190,807. Interest payments are due semi-annually, on April 1 and October 1. Principal payments became due beginning October 1, 2013. On July 6, 2017, the outstanding balance of $31,129,661, which comprises $30,425,000 of principal plus $704,661 of unamortized premium, was refunded by the issuance of the 2017 Series B Tax Allocation Refunding Bonds. The issuance of the refunding bonds is discussed in a separate note.
2011 Community Redevelopment Agency Tax Allocation Bonds
On March 2, 2011, the former Redevelopment Agency issued bonds in the amount of $29,590,000 to finance specific projects in the Redevelopment Project Area. The majority of the projects pertain to the Intermodal Station Area by the Union City BART station. Interest payments are payable semi-annually, on December 1 and June 1. The bonds in the amount of $1,850,000 mature through December 2013, and they bear interest at the rate of 3.000%. The bonds in the amount of $340,000 mature December 2014, and they bear an interest rate of 3.750%. The bonds in the amount of $27,400,000 mature through December 2033, and they bear interest rates between 4.000% and 6.875%. These bonds are subordinate to the Tax Allocation Bond Series 2001A, 2001B, 2003A, 2005, 2010 and the Refunding Tax Allocation Bond Series 2007. On July 6, 2017, the outstanding balance of $26,041,554, which comprises $26,270,000 of principal less $228,446 of unamortized discount, was refunded by the issuance of the 2017 Series A Tax Allocation Refunding Bonds. The issuance of the refunding bonds is discussed in a separate note.
2015 Series A Tax Allocation Refunding Bonds
On November 12, 2015, the Successor Agency issued tax-exempt refunding tax allocation bonds in the amount of $72,135,000 to current refund the outstanding balances of the 2001 Series A, 2003A, and 2005 tax allocations bonds and to advance refund the outstanding balance of the 2010 tax allocation bonds. The escrow agent will hold amounts in an escrow fund for the 2010 TAB in amounts sufficient to advance refund the bonds on the first optional redemption date of October 1, 2020. The refunding was done in order to take advantage of lower interest rates. The net present value debt service savings are $2,090,770 on the 2001 Series A, $914,228 on the 2003A, $3,454,929 on the 2005 and $17,380 on the 2010 tax allocation bonds. Interest payments are due semi-annually, on April 1 and October 1; principal payments are due October 1. $60,910,000 in serial bonds, bearing interest rates between 2.000% and 5.000%, matures October 1, 2036. Term bonds of $11,225,000, bearing an interest rate of 3.625%, are due October 1, 2038.
2015 Series B Tax Allocation Refunding Bonds
On November 12, 2015, the Successor Agency issued taxable refunding tax allocation bonds in the amount of $5,005,000 to current refund the outstanding balance of the 2001 Series B tax allocation bonds. The refunding was done in order to take advantage of lower interest rates. The net present value debt service savings is $1,329,377. Interest payments are due semi-annually, on April 1 and October 1; principal payments are due October 1. $2,690,000 in serial bonds, bearing interest rates between 1.000% and 4.000%, are due October 1, 2026. Term bonds of $1,230,000, bearing an interest rate of 4.250%, are due October 1, 2030. Term bonds of $1,085,000, bearing an interest rate of 4.500%, are due on October 1, 2033.
99

City of Union City Notes to Basic Financial Statements For the year ended June 30, 2019
17. SUCCESSOR AGENCY TRUST FOR FORMER COMMUNITY REDEVELOPMENT AGENCY, Continued
C. Long-Term Liabilities, Continued
2017 Series A Tax Allocation Refunding Bonds
On July 6, 2017, the Successor Agency issued tax-exempt refunding tax allocation bonds in the amount of $22,930,000 to advance refund the outstanding balance of the 2011 tax allocation bonds. The escrow agent will hold amounts in an escrow fund for the 2011 bonds in amounts sufficient to advance refund the bonds on the first optional redemption date of December 1, 2021. The refunding was done in order to take advantage of lower interest rates. The net present value debt service savings is $4,480,653. Interest payments are due semi-annually, on April 1 and October 1; principal payments are due October 1. $22,930,000 in serial bonds, bearing interest rates between 3.000% and 5.000%, mature beginning October 1, 2019, and annually thereafter through October 1, 2033.
2017 Series B Tax Allocation Refunding Bonds
On July 6, 2017, the Successor Agency issued tax-exempt refunding tax allocation bonds in the amount of $25,710,000 to current refund the outstanding balance of the 2007 tax allocation bonds. The refunding was done in order to take advantage of lower interest rates. The net present value debt service savings is $6,096,158. Interest payments are due semi-annually, on April 1 and October 1; principal payments are due October 1. $25,710,000 in serial bonds, bearing interest rates between 2.000% and 5.000%, mature beginning October 1, 2018, and annually thereafter through October 1, 2033.
The following schedule illustrates the debt-service requirements to maturity for the Successor Agency as of June 30, 2019:
100

City of Union City Notes to Basic Financial Statements For the year ended June 30, 2019
17. SUCCESSOR AGENCY TRUST FOR FORMER COMMUNITY REDEVELOPMENT AGENCY, Continued
C. Long-Term Liabilities, Continued
Pledge of Revenue:
Tax Allocation Bonds
The former Redevelopment Agency had pledged its tax increment revenue to pay the debt service on the tax allocation bonds. With the elimination of the Redevelopment Agency on January 31, 2012, this outstanding debt has been assumed by the Successor Agency. The security for this debt will be property tax revenues to be distributed by the County pursuant to Assembly Bill 1X26 and AB 1484, whereby the outstanding tax allocation bonds are considered enforceable obligations. As such, the Successor Agency will receive property taxes sufficient to meet the annual debt service requirement each year until the bonds are fully retired. Total principal and interest remaining on these bonds is $193,209,671. The annual debt service requirements are shown in the above schedule. For the fiscal year ended June 30, 2019, $5,153,599 of property tax revenue was used for payment of bonded debts.
D. DEVELOPMENT AND PARTICIPATION AGREEMENTS
Union Landing (Dyer Street Triangle)
In 1998, the City formed the Community Facilities District 97-1 (the District), which is within the former Redevelopment Agency project area known as the Dyer Street Triangle. The District issued $8,000,000 in special tax bonds to be used for the design, acquisition and construction of public facilities. The debt service payments on these bonds are made from the special taxes levied on properties within the District. The former Redevelopment Agency entered into agreements with the following property owners in the District, through Owner Participation Agreements (OPA), to pay or reimburse them for any special taxes assessed given certain conditions. With the dissolution of the Redevelopment Agency, responsibility for the payments associated with these OPAs has been assigned to the Successor Agency.
Syufy OPA—In October 1997, the Redevelopment Agency approved and amended an OPA with Sycal Properties, Inc., and Syufy Enterprises, whereby Syufy would demolish a drive-in theater and redevelop the subject property. Syufy also provided property to the Redevelopment Agency for road improvements to Dyer Street and Union Landing Drive. This OPA provides that the Redevelopment Agency will pay for the special taxes levied on them by the CFD No. 97-1 1998 Special Tax Bonds. In fiscal year 2018-19, $205,685 was paid to the property owners pursuant to this agreement.
Pappas OPA—In December 1997, the Redevelopment Agency approved an OPA with Pappas Union City LP and Louie J. Pappas and Voula L. Pappas (collectively known as Pappas), whereby Pappas would redevelop certain parcels within the subject property. Pappas also provided property to the Redevelopment Agency for road improvements to Dyer Street and Union Landing Drive. The Pappas OPA provides that the Redevelopment Agency will pay for the special taxes levied on them by the CFD No. 97-1 1998 Special Tax Bonds. In fiscal year 2018-19, $191,359 was paid to Pappas Union City LP pursuant to this agreement.
E. COMMITMENTS AND CONTINGENT LIABILITIES
The following table represents material commitments for fiscal year 2018-19 that will be included on the recognized obligation payment schedule presented to the State Department of Finance. These obligations are subject to review and approval by the State.
101

City of Union City Notes to Basic Financial Statements For the year ended June 30, 2019
18. COVID-19 PANDEMIC
During December 2019, the Novel Corona Virus Disease (COVID-19) was discovered. The COVID-19 was subsequently declared a world-wide pandemic by the World Health Organization on March 11, 2020. On March 4, 2020, California State Governor Gavin Newson proclaimed a State of Emergency as a result of the threat of the COVID-19 in the State of California which led to a mandated shelter in place order. The resulting financial disruption is ongoing and the City has recognized some revenue losses during fiscal year 19-20 as a result. Although these losses are not significant thus far, the ultimate impact is uncertain at this time and the City management continue to monitor the situation.
102

REQUIRED SUPPLEMENTARYINFORMATION
103
City of Union City Required Supplementary Information For the year ended June 30, 2019
1. BUDGETARY BASIS OF ACCOUNTING
A. Budgetary Control and Budgetary Accounting
The City’s budget is the mechanism through which priorities are established and resources are allocated. By resolution, the City Council adopts a biennial operating budget. The budget is adopted on a basis consistent with generally accepted accounting principles (GAAP). Annual appropriations are made for the General Fund, Special Revenue fund and Debt Service funds, with each year of the two-year budget independent of the other. The annual operating budget is effective July 1, and it lapses the following June 30. At the fund level, expenditures may not legally exceed appropriations. Budgetary control is maintained at the department level. Within each fund, department Directors have the authority to make budget transfers between non-payroll related line item accounts and programs under their control. Requests for budget transfers from payroll to non-payroll accounts require the approval of the City Manager. The City Manager is also authorized to approve budget transfers between departments within the same fund. Any budget revisions that will alter the total appropriation of any fund and transfers between funds must be approved by City Council resolution. These revisions are reflected in the final budget information presented in the comparison schedules. Unexpended appropriations lapse at the end of each fiscal year.
The City’s five-year capital improvement plan serves as the basis for the budgets in the capital improvement funds. Appropriations for capital improvement funds are adopted at the same time as the operating budget. These appropriations are made in the year the project is scheduled to commence and are effective for the life of the project. Amendments to capital budgets may be approved by City Council at any time during the project’s life. As a result, budget-to-actual schedules are not presented.
Under encumbrance accounting, purchase orders, contracts and other commitments for the expenditure of resources are recorded in governmental funds as restricted, committed, or assigned fund balance at fiscal year-end. In the following fiscal year, the encumbered amounts are reappropriated in order to honor the outstanding commitments. Unexpended capital improvement appropriations are carried forward into the new fiscal year so that the projects may be completed.
The following pages present the budget comparison schedules for the General Fund and the Special Revenue Major Governmental Funds.
104
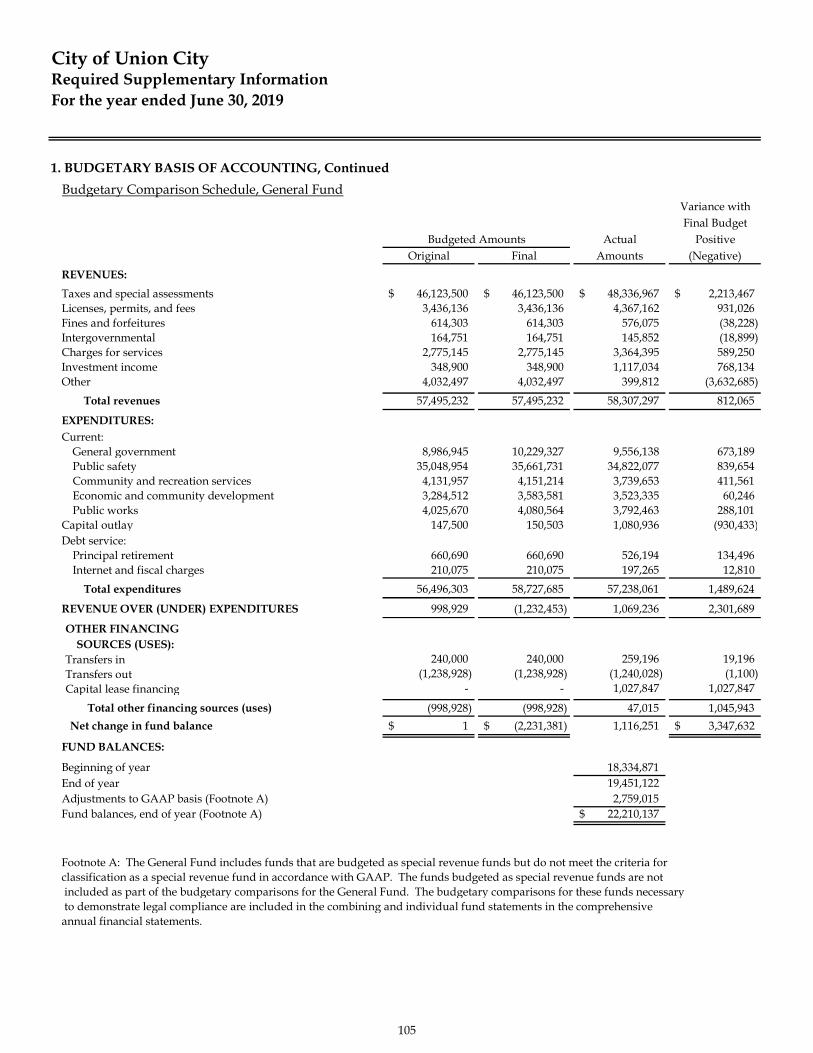
1. BUDGETARY BASIS OF ACCOUNTING, ContinuedBudgetary Comparison Schedule, General Fund
Variance withFinal Budget
Actual PositiveOriginal Final Amounts (Negative)
REVENUES:Taxes and special assessments 46,123,500$ 46,123,500$ 48,336,967$ 2,213,467$ Licenses, permits, and fees 3,436,136 3,436,136 4,367,162 931,026Fines and forfeitures 614,303 614,303 576,075 (38,228)Intergovernmental 164,751 164,751 145,852 (18,899)Charges for services 2,775,145 2,775,145 3,364,395 589,250Investment income 348,900 348,900 1,117,034 768,134Other 4,032,497 4,032,497 399,812 (3,632,685)
Total revenues 57,495,232 57,495,232 58,307,297 812,065
EXPENDITURES:Current:
General government 8,986,945 10,229,327 9,556,138 673,189Public safety 35,048,954 35,661,731 34,822,077 839,654Community and recreation services 4,131,957 4,151,214 3,739,653 411,561Economic and community development 3,284,512 3,583,581 3,523,335 60,246Public works 4,025,670 4,080,564 3,792,463 288,101
Capital outlay 147,500 150,503 1,080,936 (930,433)Debt service:
Principal retirement 660,690 660,690 526,194 134,496Internet and fiscal charges 210,075 210,075 197,265 12,810
Total expenditures 56,496,303 58,727,685 57,238,061 1,489,624
REVENUE OVER (UNDER) EXPENDITURES 998,929 (1,232,453) 1,069,236 2,301,689
OTHER FINANCINGSOURCES (USES):
Transfers in 240,000 240,000 259,196 19,196Transfers out (1,238,928) (1,238,928) (1,240,028) (1,100)Capital lease financing - - 1,027,847 1,027,847
Total other financing sources (uses) (998,928) (998,928) 47,015 1,045,943 Net change in fund balance 1$ (2,231,381)$ 1,116,251 3,347,632$
FUND BALANCES:
Beginning of year 18,334,871End of year 19,451,122Adjustments to GAAP basis (Footnote A) 2,759,015Fund balances, end of year (Footnote A) 22,210,137$
Footnote A: The General Fund includes funds that are budgeted as special revenue funds but do not meet the criteria for classification as a special revenue fund in accordance with GAAP. The funds budgeted as special revenue funds are not included as part of the budgetary comparisons for the General Fund. The budgetary comparisons for these funds necessary to demonstrate legal compliance are included in the combining and individual fund statements in the comprehensive annual financial statements.
Budgeted Amounts
City of Union CityRequired Supplementary InformationFor the year ended June 30, 2019
105
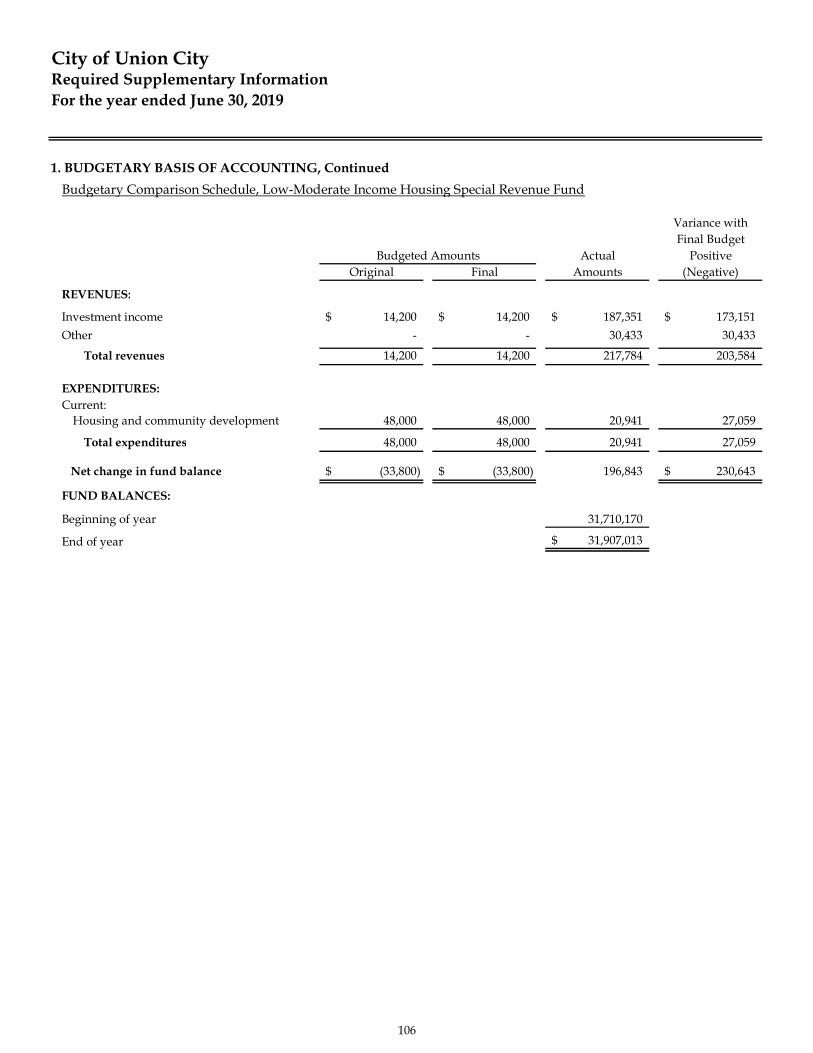
1. BUDGETARY BASIS OF ACCOUNTING, ContinuedBudgetary Comparison Schedule, Low-Moderate Income Housing Special Revenue Fund
Variance withFinal Budget
Actual PositiveOriginal Final Amounts (Negative)
REVENUES:
Investment income 14,200$ 14,200$ 187,351$ 173,151$ Other - - 30,433 30,433
Total revenues 14,200 14,200 217,784 203,584
EXPENDITURES:Current:
Housing and community development 48,000 48,000 20,941 27,059
Total expenditures 48,000 48,000 20,941 27,059
Net change in fund balance (33,800)$ (33,800)$ 196,843 230,643$
FUND BALANCES:
Beginning of year 31,710,170
End of year 31,907,013$
Budgeted Amounts
City of Union CityRequired Supplementary InformationFor the year ended June 30, 2019
106
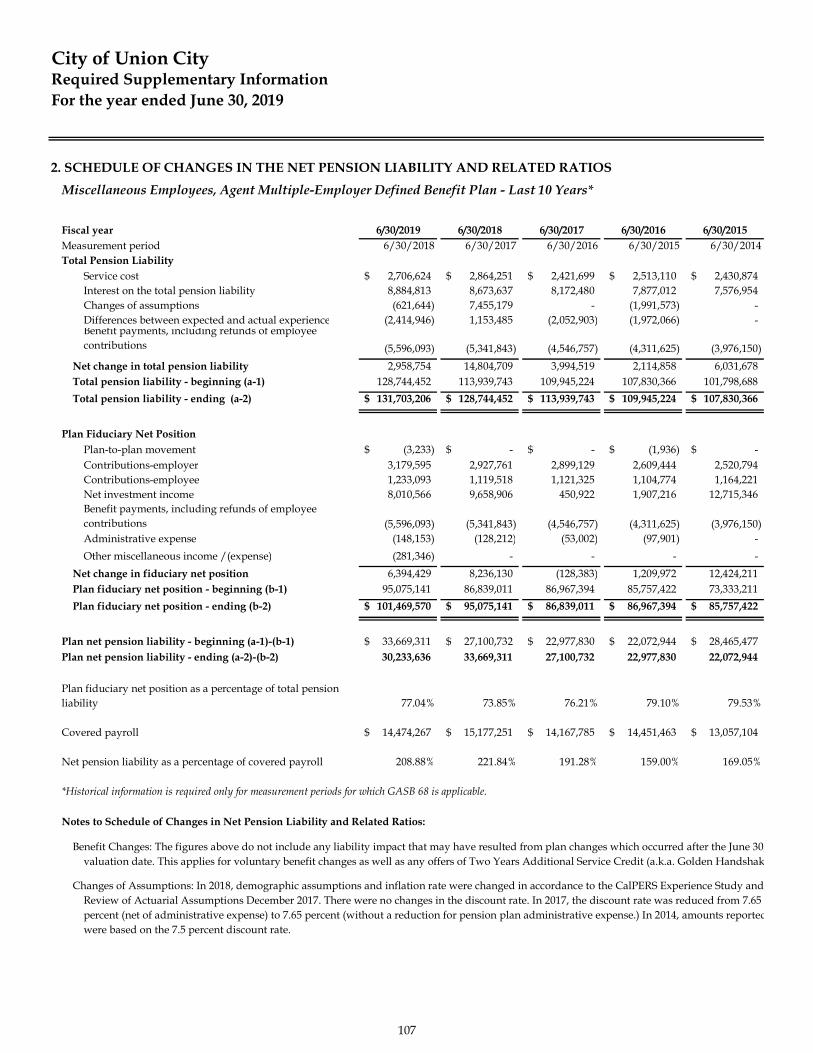
2. SCHEDULE OF CHANGES IN THE NET PENSION LIABILITY AND RELATED RATIOS
Fiscal year 6/30/2019 6/30/2018 6/30/2017 6/30/2016 6/30/2015Measurement period 6/30/2018 6/30/2017 6/30/2016 6/30/2015 6/30/2014Total Pension Liability
Service cost 2,706,624$ 2,864,251$ 2,421,699$ 2,513,110$ 2,430,874$ Interest on the total pension liability 8,884,813 8,673,637 8,172,480 7,877,012 7,576,954Changes of assumptions (621,644) 7,455,179 - (1,991,573) -Differences between expected and actual experience (2,414,946) 1,153,485 (2,052,903) (1,972,066) -Benefit payments, including refunds of employee contributions (5,596,093) (5,341,843) (4,546,757) (4,311,625) (3,976,150)
Net change in total pension liability 2,958,754 14,804,709 3,994,519 2,114,858 6,031,678Total pension liability - beginning (a-1) 128,744,452 113,939,743 109,945,224 107,830,366 101,798,688Total pension liability - ending (a-2) 131,703,206$ 128,744,452$ 113,939,743$ 109,945,224$ 107,830,366$
Plan Fiduciary Net PositionPlan-to-plan movement (3,233)$ -$ -$ (1,936)$ -$ Contributions-employer 3,179,595 2,927,761 2,899,129 2,609,444 2,520,794Contributions-employee 1,233,093 1,119,518 1,121,325 1,104,774 1,164,221Net investment income 8,010,566 9,658,906 450,922 1,907,216 12,715,346Benefit payments, including refunds of employee contributions (5,596,093) (5,341,843) (4,546,757) (4,311,625) (3,976,150)Administrative expense (148,153) (128,212) (53,002) (97,901) -Other miscellaneous income /(expense) (281,346) - - - -
Net change in fiduciary net position 6,394,429 8,236,130 (128,383) 1,209,972 12,424,211Plan fiduciary net position - beginning (b-1) 95,075,141 86,839,011 86,967,394 85,757,422 73,333,211Plan fiduciary net position - ending (b-2) 101,469,570$ 95,075,141$ 86,839,011$ 86,967,394$ 85,757,422$
Plan net pension liability - beginning (a-1)-(b-1) 33,669,311$ 27,100,732$ 22,977,830$ 22,072,944$ 28,465,477$ Plan net pension liability - ending (a-2)-(b-2) 30,233,636 33,669,311 27,100,732 22,977,830 22,072,944
77.04% 73.85% 76.21% 79.10% 79.53%
Covered payroll 14,474,267$ 15,177,251$ 14,167,785$ 14,451,463$ 13,057,104$
Net pension liability as a percentage of covered payroll 208.88% 221.84% 191.28% 159.00% 169.05%
*Historical information is required only for measurement periods for which GASB 68 is applicable.
Notes to Schedule of Changes in Net Pension Liability and Related Ratios:
Benefit Changes: The figures above do not include any liability impact that may have resulted from plan changes which occurred after the June 30,valuation date. This applies for voluntary benefit changes as well as any offers of Two Years Additional Service Credit (a.k.a. Golden Handshak
Changes of Assumptions: In 2018, demographic assumptions and inflation rate were changed in accordance to the CalPERS Experience Study and Review of Actuarial Assumptions December 2017. There were no changes in the discount rate. In 2017, the discount rate was reduced from 7.65 percent (net of administrative expense) to 7.65 percent (without a reduction for pension plan administrative expense.) In 2014, amounts reportedwere based on the 7.5 percent discount rate.
Plan fiduciary net position as a percentage of total pension liability
Miscellaneous Employees, Agent Multiple-Employer Defined Benefit Plan - Last 10 Years*
City of Union CityRequired Supplementary InformationFor the year ended June 30, 2019
107
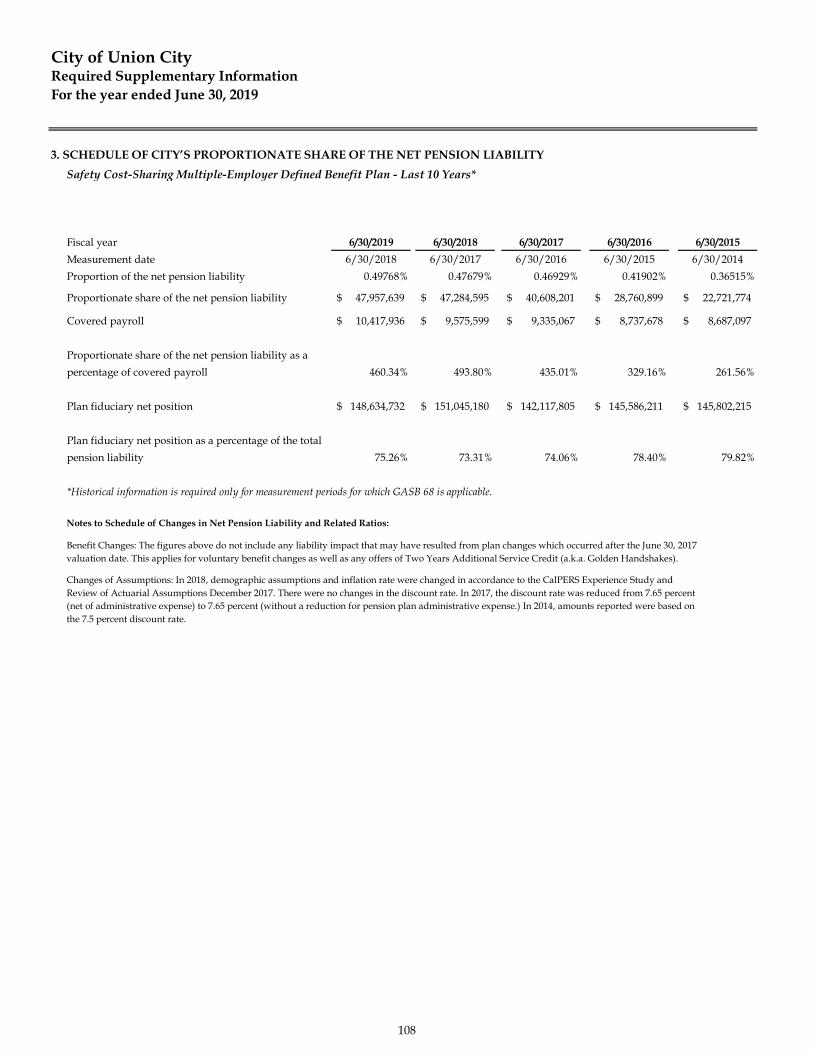
3. SCHEDULE OF CITY’S PROPORTIONATE SHARE OF THE NET PENSION LIABILITY
Fiscal year 6/30/2019 6/30/2018 6/30/2017 6/30/2016 6/30/2015Measurement date 6/30/2018 6/30/2017 6/30/2016 6/30/2015 6/30/2014Proportion of the net pension liability 0.49768% 0.47679% 0.46929% 0.41902% 0.36515%
Proportionate share of the net pension liability 47,957,639$ 47,284,595$ 40,608,201$ 28,760,899$ 22,721,774$
Covered payroll 10,417,936$ 9,575,599$ 9,335,067$ 8,737,678$ 8,687,097$
Proportionate share of the net pension liability as apercentage of covered payroll 460.34% 493.80% 435.01% 329.16% 261.56%
Plan fiduciary net position 148,634,732$ 151,045,180$ 142,117,805$ 145,586,211$ 145,802,215$
Plan fiduciary net position as a percentage of the total pension liability 75.26% 73.31% 74.06% 78.40% 79.82%
*Historical information is required only for measurement periods for which GASB 68 is applicable.
Notes to Schedule of Changes in Net Pension Liability and Related Ratios:
Benefit Changes: The figures above do not include any liability impact that may have resulted from plan changes which occurred after the June 30, 2017 valuation date. This applies for voluntary benefit changes as well as any offers of Two Years Additional Service Credit (a.k.a. Golden Handshakes).
Changes of Assumptions: In 2018, demographic assumptions and inflation rate were changed in accordance to the CalPERS Experience Study and Review of Actuarial Assumptions December 2017. There were no changes in the discount rate. In 2017, the discount rate was reduced from 7.65 percent(net of administrative expense) to 7.65 percent (without a reduction for pension plan administrative expense.) In 2014, amounts reported were based on the 7.5 percent discount rate.
Safety Cost-Sharing Multiple-Employer Defined Benefit Plan - Last 10 Years*
City of Union CityRequired Supplementary InformationFor the year ended June 30, 2019
108

4. SCHEDULE OF CONTRIBUTIONS - Last Ten Years*
A. Miscellaneous Employees, Agent Multiple-Employer Defined Benefit Plan
FY 2018-19 FY 2017-18 FY 2016-17 FY 2015-16 FY 2014-15Actuarially determined contribution 3,848,992$ 3,179,583$ 2,927,761$ 2,899,129$ 2,609,444$ Contributions in relation to the actuarially determined (3,848,992) (3,179,583) (2,927,761) (2,899,129) (2,609,444)Contribution deficiency (excess) -$ -$ -$ -$ -$
Covered payroll 14,611,544$ 14,474,267$ 15,177,251$ 14,167,782$ 14,451,463$
Contributions as a percentage of covered payroll 26.34% 21.97% 19.29% 20.46% 18.06%
B. Safety Employees, Cost-Sharing Multiple-Employer Defined Benefit Plan
FY 2018-19 FY 2017-18 FY 2016-17 FY 2015-16 FY 2014-15Contractually required contribution (actuarially 4,520,381$ 3,625,107$ 3,044,371$ 2,705,659$ 1,746,271$ Contributions is relation to the actuarially determined (4,520,381) (3,625,107) (3,044,371) (2,705,659) (1,746,271)Contribution deficiency (excess) -$ -$ -$ -$ -$
Covered payroll 10,681,452 10,417,936 9,575,599 9,335,067 8,737,678
Contributions as a percentage of covered payroll 42.32% 34.80% 31.79% 28.98% 19.99%
*Historical information is required only for measurement periods for which GASB 68 is applicable.
Notes to Schedule of Employer Contribution:
Actuarial Cost Method Entry Agen NormalAmortization Method/Period For detailes, See June 2015 Funding Valuation ReportAsset Valuation Method Market Value of AssetsInflation 2.75%Salary Increases Varies by Entry Age and ServicePayroll Growth 3.00%Investment Rate of Return 7.50% Net of Pension Plan Investment and Administrative Expenses, includes Inflatipon.Retirement Age The probabilities of Retirement are based on the 2014 CalPERS Experience Study for the Mortality The probabilities of mortality are based on the 2014 CalPERS Experience Study for the
period from 1997 to 2011. Pre-retirement and Post-retirement mortality rates include 20years of projected mortality improvement using Scale BB published by the Society of Actuary
City of Union CityRequired Supplementary InformationFor the year ended June 30, 2019
109
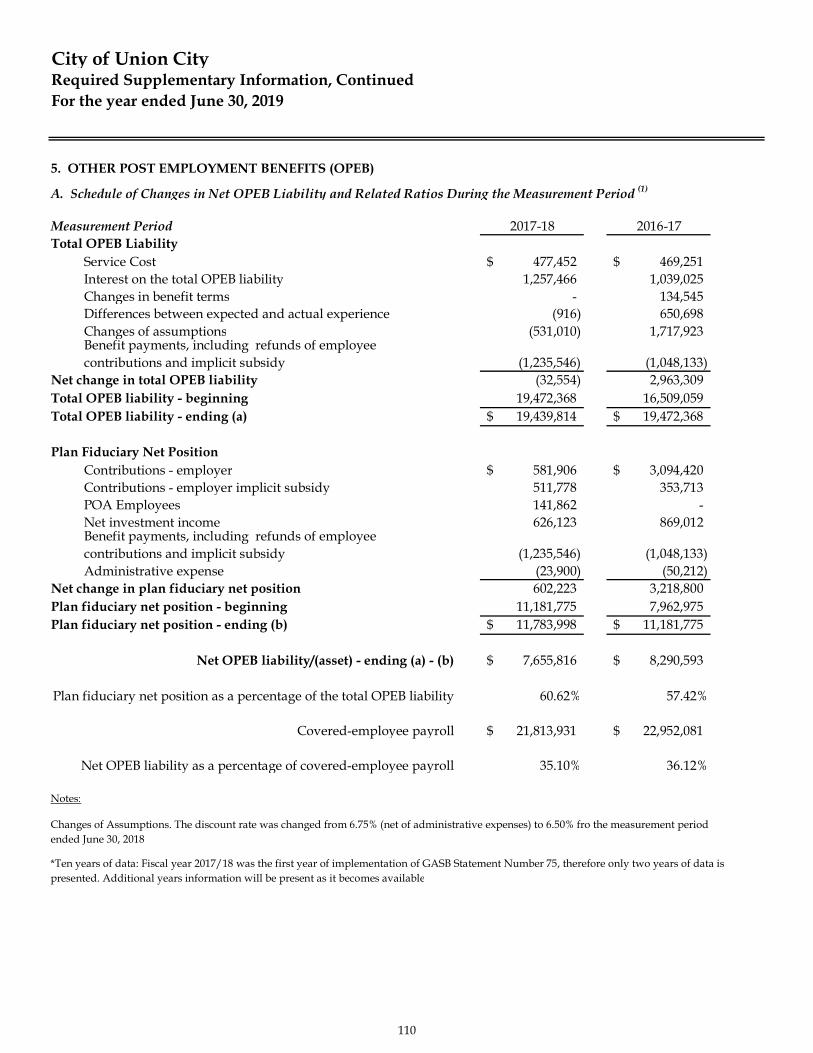
City of Union CityRequired Supplementary Information, ContinuedFor the year ended June 30, 2019
5. OTHER POST EMPLOYMENT BENEFITS (OPEB)
Measurement Period 2017-18 2016-17Total OPEB Liability
Service Cost 477,452$ 469,251$ Interest on the total OPEB liability 1,257,466 1,039,025Changes in benefit terms - 134,545Differences between expected and actual experience (916) 650,698Changes of assumptions (531,010) 1,717,923Benefit payments, including refunds of employee contributions and implicit subsidy (1,235,546) (1,048,133)
Net change in total OPEB liability (32,554) 2,963,309Total OPEB liability - beginning 19,472,368 16,509,059Total OPEB liability - ending (a) 19,439,814$ 19,472,368$
Plan Fiduciary Net PositionContributions - employer 581,906$ 3,094,420$ Contributions - employer implicit subsidy 511,778 353,713POA Employees 141,862 -Net investment income 626,123 869,012Benefit payments, including refunds of employee contributions and implicit subsidy (1,235,546) (1,048,133)Administrative expense (23,900) (50,212)
Net change in plan fiduciary net position 602,223 3,218,800Plan fiduciary net position - beginning 11,181,775 7,962,975Plan fiduciary net position - ending (b) 11,783,998$ 11,181,775$
Net OPEB liability/(asset) - ending (a) - (b) 7,655,816$ 8,290,593$
Plan fiduciary net position as a percentage of the total OPEB liability 60.62% 57.42%
Covered-employee payroll 21,813,931$ 22,952,081$
Net OPEB liability as a percentage of covered-employee payroll 35.10% 36.12%
Notes:
Changes of Assumptions. The discount rate was changed from 6.75% (net of administrative expenses) to 6.50% fro the measurement period ended June 30, 2018
*Ten years of data: Fiscal year 2017/18 was the first year of implementation of GASB Statement Number 75, therefore only two years of data is presented. Additional years information will be present as it becomes available
A. Schedule of Changes in Net OPEB Liability and Related Ratios During the Measurement Period (1)
110
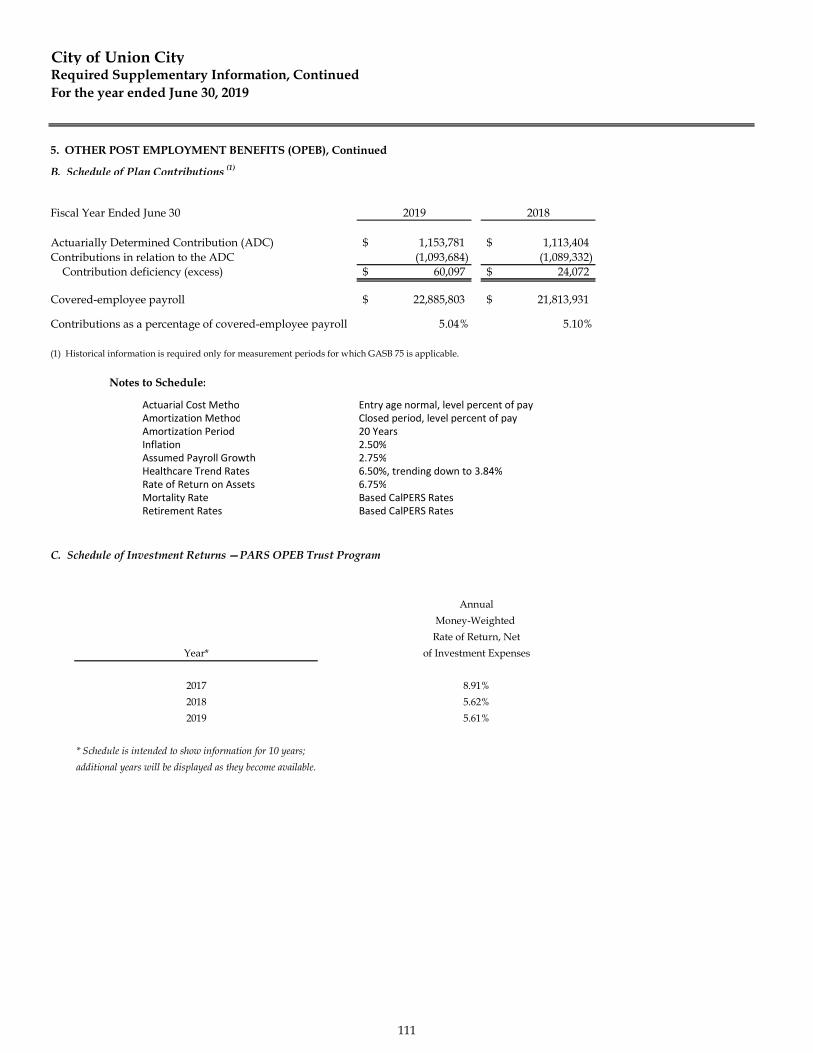
City of Union CityRequired Supplementary Information, ContinuedFor the year ended June 30, 2019
5. OTHER POST EMPLOYMENT BENEFITS (OPEB), Continued
Fiscal Year Ended June 30 2019 2018
Actuarially Determined Contribution (ADC) 1,153,781$ 1,113,404$ Contributions in relation to the ADC (1,093,684) (1,089,332)
Contribution deficiency (excess) 60,097$ 24,072$
Covered-employee payroll 22,885,803$ 21,813,931$
Contributions as a percentage of covered-employee payroll 5.04% 5.10%
(1) Historical information is required only for measurement periods for which GASB 75 is applicable.
Notes to Schedule:
Actuarial Cost Metho Entry age normal, level percent of payAmortization Method Closed period, level percent of payAmortization Period 20 YearsInflation 2.50%Assumed Payroll Growth 2.75%Healthcare Trend Rates 6.50%, trending down to 3.84%Rate of Return on Assets 6.75%Mortality Rate Based CalPERS RatesRetirement Rates Based CalPERS Rates
C. Schedule of Investment Returns —PARS OPEB Trust Program
Year*
201720182019
* Schedule is intended to show information for 10 years; additional years will be displayed as they become available.
5.61%
AnnualMoney-Weighted
Rate of Return, Netof Investment Expenses
8.91%5.62%
B. Schedule of Plan Contributions (1)
111

This page intentionally left blank.
112
SUPPLEMENTARY INFORMATION
113

NON-MAJOR GOVERNMENTAL FUNDS
SPECIAL REVENUE FUNDSSpecial revenue funds are used to account for revenues that are legally restricted to expenditures for particular purposes.Measure B/ACTIAUnder Measure B administered by the Alameda County Transportation Commission (ACTC), the City receivesproceeds of a voter-approved additional half-cent sales tax for use on transportation-related expenditures. This fundaccounts for the City's portion of Measure B sales tax used to finance streets and roads projects and bicycle andpedestrian path projects.
Special ParksThis fund accounts for the park dedication fees and bedroom taxes received for the development and improvement ofCity parks. Financing is also provided by state and local grant funds.State Gas Tax
To account for Highways Users Tax funds received. The State imposes excise taxes on transportation fuels. Taxes onfuel used for motor vehicles is transferred to the Highways Users Tax Account and is apportioned to cities underpopulation-based formulas contained in the State Streets and Highways code. These funds are used for streetmaintenance and construction.
Street Lights and LandscapingTo account for funds received from a special assessment on properties within the City. The Landscaping and LightingAct of 1972 allows local governmental agencies to form Landscape and Lighting Maintenance Districts for the purposeof financing the costs and expenses of landscaping and lighting public areas.
Housing and Community DevelopmentThis fund accounts for grants received from the U.S. Department of Housing and Urban Development's CommunityBlock Grant Program. The grant funds are used to provide housing rehabilitation loans to qualified homeowners and toprovide support for community service organizations.
HOMETo account for federal funds received through the County of Alameda for the development or rehabilitation ofaffordable housing.
DIPSA Development
To account for revenues received in the Decoto Industrial Park Study Area (DIPSA). The primary source of revenue isdeveloper impact fees. These fees are to be used for infrastructure improvements in this eastern section of the City.
Community Facility Districts (Maintenance)To account for property tax assessments in community facilities districts that are used to fund police services, fireprotection and suppression services and park maintenance in the community facility districts. The City has three suchdistricts: DIPSA, Summerhill/Melodia and Avalon Bay/Masonic Homes.
EMS Enhancement (Emergency Medical Services)To account for monies received from property tax assessment and a first responder program administered by theAlameda County Health Department to fund paramedic activities.
Traffic SignalizationTo account for monies received from developers for the installation of traffic signals.
Supplemental Law EnforcementTo account for monies received under State AB3229, Citizens' Option for Public Safety. The funds are passed through tothe City from the County of Alameda and are used for front-line law enforcement services.
114
NON-MAJOR GOVERNMENTAL FUNDS
SPECIAL REVENUE FUNDS, Continued:
Clean Water ProgramTo account for monies received from property tax assessments for the implementation of the federal Clean Water Actrequirements under the regulatory authority of the San Francisco Bay Regional Water Quality Control Board.
Recycling and Waste ManagementTo account for revenues received from a special property tax assessment to administer the City's recycling and wastemanagement activities. The City contracts with a private company for recycling services.Used Oil Block GrantTo account for funds received from the California Integrated Waste Management Board that are used to educate thepublic about the recycling of used oil and to provide used oil and used oil filter collection opportunities.
Housing In-LieuTo account for fees paid by developers of housing projects with six units or less, outside the Redevelopment ProjectArea. If the housing development is six units or less, the developer may opt to pay this in-lieu fee rather than provideaffordable housing units in their development.
Public Safety Parcel TaxTo account for a voter-approved assessment to support public safety services in the City. Measure UU, which extendedthis tax, authorizes a portion of this assessment, $500,000, to be used to fund youth violence prevention andintervention activities.Union Landing PBIDThis fund accounts for activities in the Union Landing shopping center. The property owners approved the formationof a property-based business improvement district and the associated special assessment levied on their properties.These funds are used to support a police sub-station at the shopping center and provide special police patrols.
Alameda County Waste Import MitigationTo account for grant funds received from Alameda County Waste Management Authority. These funds are to be spenton waste reduction efforts in accordance with the guidelines adopted by the Authority.
Solid Waste ManagementTo account for funds received from levies on properties for the collection of solid waste. Under the terms of thefranchise agreement, the major portion of this money is remitted to the solid waste collector as payment of their servicesand a portion of is remitted to the City's General Fund as their share of the franchise fee.
Asset Forfeiture StateTo account for asset confiscation funds received from the federal government.
Measure FTo account for funds received under Measure F. Approved by voters in November 2010, Measure F increases the motorvehicle registration fee by $10 on all vehicles registered in Alameda County. The funds received from this fee are to beused on transportation-related projects, such as local streets and roads and pedestrian and bicycle programs.
CUPA EnforcementTo account for administrative penalties collected under California Health and Safety Code Section 25404.1.1(i). Thepenalties received by the City as a Certified Unified Program Agency (CUPA) are to be used to fund the enforcementactivities of this section of the Health and Safety Code.
115
NON-MAJOR GOVERNMENTAL FUNDS
SPECIAL REVENUE FUNDS, Continued:
Measure DTo account for funds received for Measure D, the Alameda County Waste Reduction and Recycling Initiative. Thisinitiative levies a surcharge on solid waste landfilled in unincorporated Alameda County; a portion of this revenue isdisbursed to cities to be used for the continuation and expansion of municipal recycling programs.
Youth Violence Prevention & InterventionTo account for the $500,000 portion of the voter-approved Measure UU to be used to support prevention, intervention or suppression strategies to reduce gang and youth violence.
Affordable HousingTo account for the proceeds received from tax allocation bonds used to acquire or develop affordable housing units for qualified low- and moderate-income households throughout the City.
Public ArtTo account for funds received from developers that are to be used to acquire, place and maintain public art on public property throughout the City.
Measure BBTo account for funds received for Measure BB, a sales tax approved by Alameda County voters in November 2014. Measure BB extends the existing Measure B 1/4 cent transportation sales tax to April 2045. Funds received will be used for local streets maintenance and safety and bike and pedestrian paths and safety.
Cable TV PEG FundTo account for funds received from cable television providers, these funds are to be used for improvements related to public, education and governmental access channels. Per the Federal Communications Commission, the funds are to be used for capital improvements.
Rent Mediation/Eviction ProtectionTo account for funds collected from rental property owners in Union City. These funds are used for the administration of the eviction and harassment protection and the rent mediation ordinance.
Traffic CongestionTo account for monies received from the State of California to be used for the preservation, maintenance and rehabilitation of the local street and road system.
SB 1 Road Maintenance & Rehab To account for tax monies received from the State of California. These funds are to be used in addressing deferred maintenance on local street and road system.
DEBT SERVICE FUNDS
Debt service funds are used to account for the accumulation of resources for, and the payment of, general long-termdebt principal, interest and related costs.
Pension Obligation BondsTo account for principal and interest requirement on Pension Obligation Bonds to fund a portion of unfunded liabilityto the State's public employee retirement system.
Community Facilities District
This fund accounts for the debt service requirements on the Special Tax Bonds issued by the Community FacilitiesDistrict 97-1. The bonds were issued to finance the construction of public facilities and improvements in the Dyer StreetTriangle area, more commonly known as the Union Landing shopping area.
116

NON-MAJOR GOVERNMENTAL FUNDS
CAPITAL PROJECT FUNDS:
Capital project funds are used to account for the acquisition, construction and improvements to major capital facilities
Capital Facilities ImprovementsTo account for developer impact fees received. These funds are used to construct or improve various facilitiesthroughout the City.
Bridge Benefit District
To account for the construction and maintenance of bridges within the City, funded by developers and the propertyowners benefitted by the bridges.
Park FacilitiesTo account for funds collected from new non-subdivided residential construction (apartments) developers. Thesemonies will be used for park facilities and the costs of acquiring land for park improvements.
Measure WWTo account for grant funds received from the East Bay Regional Parks District Measure WW bond measure. A portion of the this bond measure provides funds to local cities for the acquisition and development of local parklands.
117
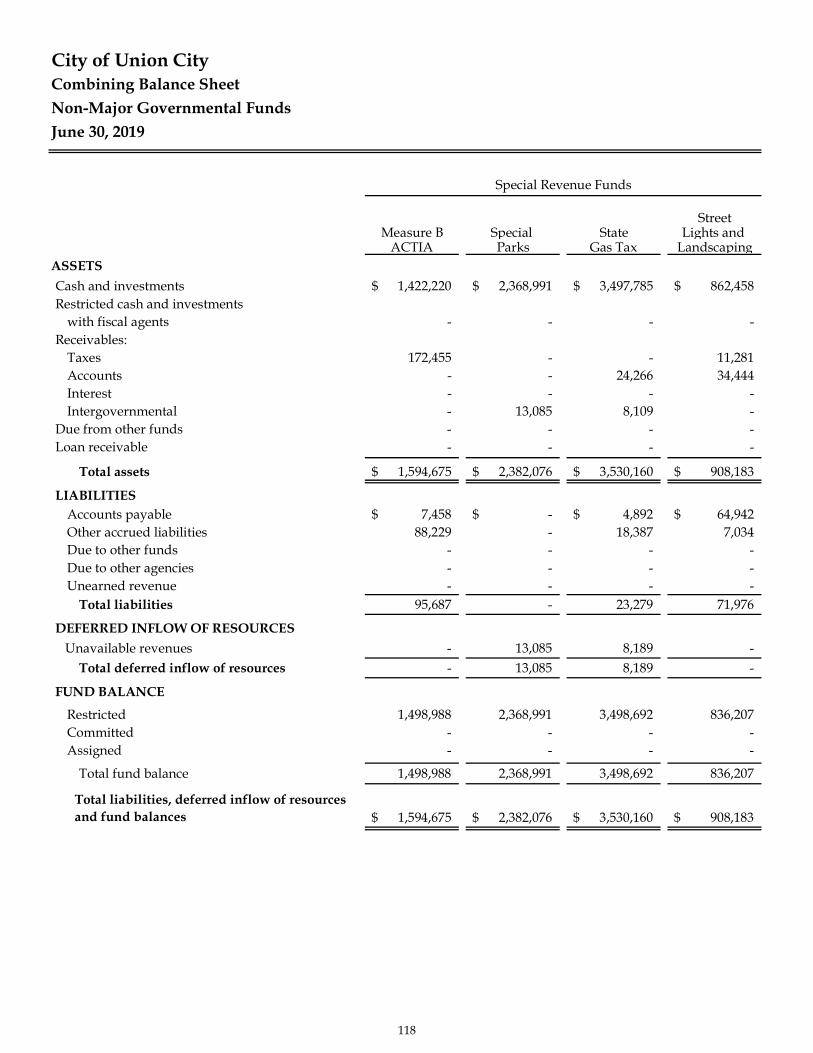
City of Union CityCombining Balance SheetNon-Major Governmental Funds June 30, 2019
StreetMeasure B Special State Lights and
ACTIA Parks Gas Tax LandscapingASSETSCash and investments 1,422,220$ 2,368,991$ 3,497,785$ 862,458$ Restricted cash and investments
with fiscal agents - - - -Receivables:
Taxes 172,455 - - 11,281Accounts - - 24,266 34,444Interest - - - -Intergovernmental - 13,085 8,109 -
Due from other funds - - - -Loan receivable - - - -
Total assets 1,594,675$ 2,382,076$ 3,530,160$ 908,183$
LIABILITIESAccounts payable 7,458$ -$ 4,892$ 64,942$ Other accrued liabilities 88,229 - 18,387 7,034Due to other funds - - - -Due to other agencies - - - -Unearned revenue - - - -
Total liabilities 95,687 - 23,279 71,976
DEFERRED INFLOW OF RESOURCES Unavailable revenues - 13,085 8,189 -
Total deferred inflow of resources - 13,085 8,189 -
FUND BALANCE
Restricted 1,498,988 2,368,991 3,498,692 836,207Committed - - - -Assigned - - - -
Total fund balance 1,498,988 2,368,991 3,498,692 836,207
Total liabilities, deferred inflow of resources and fund balances 1,594,675$ 2,382,076$ 3,530,160$ 908,183$
Special Revenue Funds
118

Housing and CFD Supplemental Community DIPSA Maintenance EMS Traffic Law
Development HOME Development Districts Enhancement Signalization Enforcement
90$ 92,964$ 942,850$ 500,013$ 152,893$ 644,641$ 238,070$
- - - - - - -
- - - 2,225 1,188 - -- - - - - - -
361,896 761,209 - - - - -83,324 10,998 - - - - -
- - - 21,100 - - -798,415 1,801,115 - - - - -
1,243,725$ 2,666,286$ 942,850$ 523,338$ 154,081$ 644,641$ 238,070$
33,045$ -$ 33,784$ 50,870$ 94,644$ 7,408$ -$ 55 10 111 2,151 - - -
148,500 - - 21,100 - - -- - - - - - -- - - - - - -
181,600 10 33,895 74,121 94,644 7,408 -
361,896 761,209 - - - - -361,896 761,209 - - - - -
700,229 1,905,067 - 449,217 59,437 - 238,070- - 908,955 - - 637,233 -- - - - - - -
700,229 1,905,067 908,955 449,217 59,437 637,233 238,070
1,243,725$ 2,666,286$ 942,850$ 523,338$ 154,081$ 644,641$ 238,070$
Special Revenue Funds
119
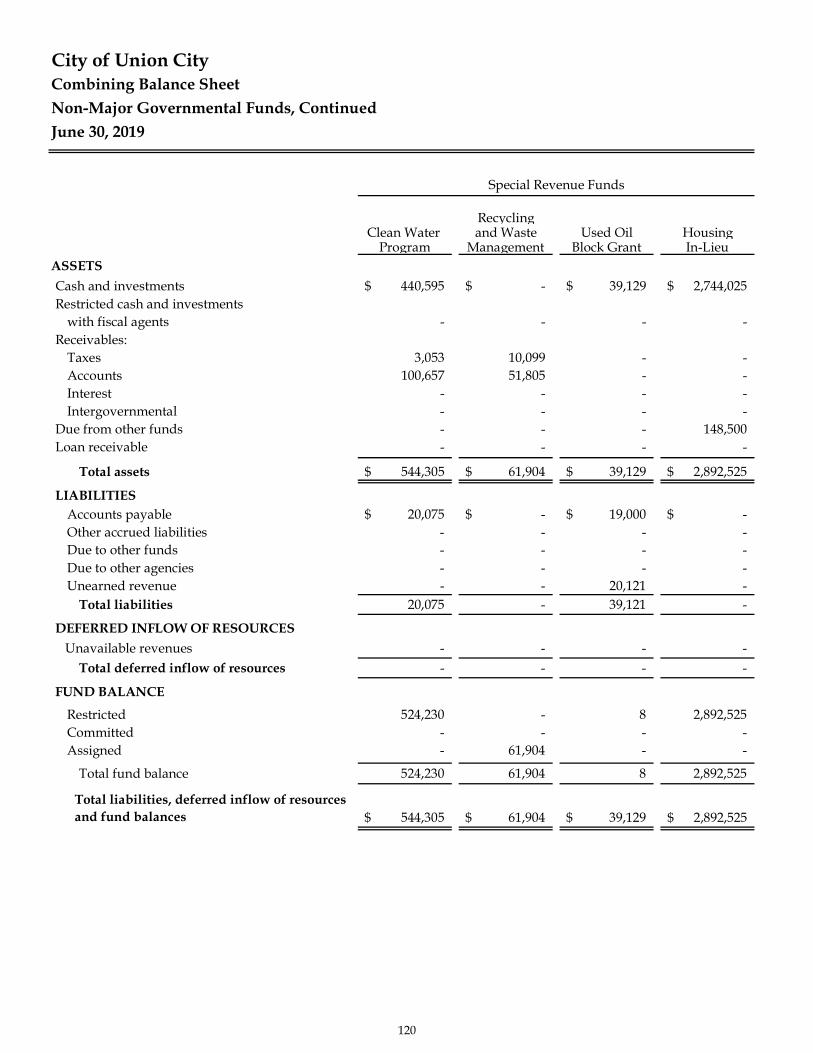
City of Union CityCombining Balance SheetNon-Major Governmental Funds, ContinuedJune 30, 2019
RecyclingClean Water and Waste Used Oil Housing
Program Management Block Grant In-LieuASSETSCash and investments 440,595$ -$ 39,129$ 2,744,025$ Restricted cash and investments
with fiscal agents - - - -Receivables:
Taxes 3,053 10,099 - -Accounts 100,657 51,805 - -Interest - - - -Intergovernmental - - - -
Due from other funds - - - 148,500Loan receivable - - - -
Total assets 544,305$ 61,904$ 39,129$ 2,892,525$
LIABILITIESAccounts payable 20,075$ -$ 19,000$ -$ Other accrued liabilities - - - -Due to other funds - - - -Due to other agencies - - - -Unearned revenue - - 20,121 -
Total liabilities 20,075 - 39,121 -
DEFERRED INFLOW OF RESOURCES Unavailable revenues - - - -
Total deferred inflow of resources - - - -
FUND BALANCE
Restricted 524,230 - 8 2,892,525Committed - - - -Assigned - 61,904 - -
Total fund balance 524,230 61,904 8 2,892,525
Total liabilities, deferred inflow of resources and fund balances 544,305$ 61,904$ 39,129$ 2,892,525$
Special Revenue Funds
120

Union Alameda County Solid AssetPublic Safety Landing Waste Import Waste Forfeiture CUPA
Parcel tax PBID Mitigation Management State Measure F Enforcement
402,278$ 374,357$ 46,798$ 1,855,440$ 4,713$ 540,430$ 52,709$
- - - - - - -
19,890 - - 24,042 - - -- - - 5,022 - - -- - - - - - -- - - - - 56,248 -- - - - - - -- - - - - - -
422,168$ 374,357$ 46,798$ 1,884,504$ 4,713$ 596,678$ 52,709$
313,453$ 35,418$ 6,909$ 1,155,636$ -$ 90$ -$ - 320 - - - 64,050 -- - - - - - -- - - - - - -- - - 93,750 - - -
313,453 35,738 6,909 1,249,386 - 64,140 -
- - - - - - -- - - - - - -
108,715 338,619 39,889 635,118 4,713 532,538 52,709- - - - - - -- - - - - - -
108,715 338,619 39,889 635,118 4,713 532,538 52,709
422,168$ 374,357$ 46,798$ 1,884,504$ 4,713$ 596,678$ 52,709$
Special Revenue Funds
121

City of Union CityCombining Balance SheetNon-Major Governmental Funds, ContinuedJune 30, 2019
Youth Measure DViolence Waste
Prevention & Reduction/ Affordable PublicIntervention Recycling Housing Art
ASSETSCash and investments 398,490$ 193,198$ 1,215,782$ 835,634$ Restricted cash and investments
with fiscal agents - - - -Receivables:
Taxes - - - -Accounts - - - -Interest - - - -Intergovernmental 83,769 61,408 - -
Due from other funds - - - -Loan receivable - - - -
Total assets 482,259$ 254,606$ 1,215,782$ 835,634$
LIABILITIESAccounts payable 1,370$ 164$ -$ -$ Other accrued liabilities - - - -Due to other funds - - - -Due to other agencies - 1,028 - -Unearned revenue 500 - - -
Total liabilities 1,870 1,192 - -
DEFERRED INFLOW OF RESOURCES Unavailable revenues 30,269 - - -
Total deferred inflow of resources 30,269 - - -
FUND BALANCE
Restricted 450,120 253,414 1,215,782 -Committed - - - 835,634Assigned - - - -
Total fund balance 450,120 253,414 1,215,782 835,634
Total liabilities, deferred inflow of resources and fund balances 482,259$ 254,606$ 1,215,782$ 835,634$
Special Revenue Funds
122
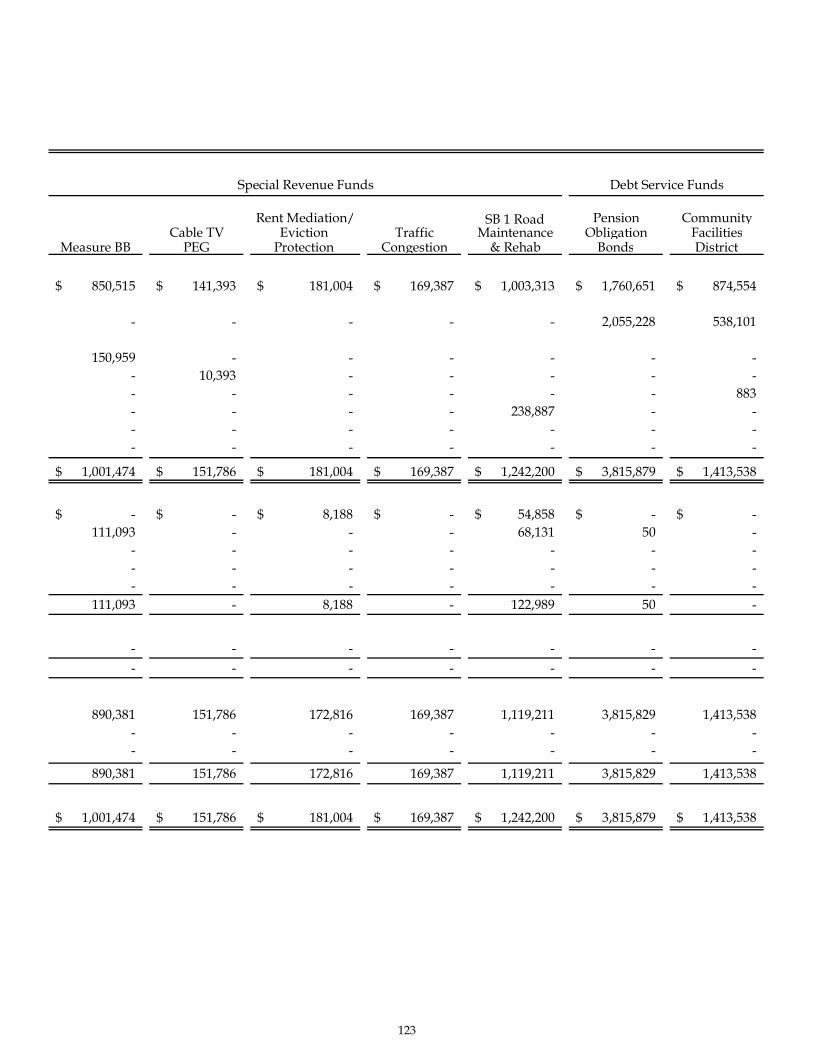
Rent Mediation/ SB 1 Road Pension CommunityCable TV Eviction Traffic Maintenance Obligation Facilities
Measure BB PEG Protection Congestion & Rehab Bonds District
850,515$ 141,393$ 181,004$ 169,387$ 1,003,313$ 1,760,651$ 874,554$
- - - - - 2,055,228 538,101
150,959 - - - - - -- 10,393 - - - - -- - - - - - 883- - - - 238,887 - -- - - - - - -- - - - - - -
1,001,474$ 151,786$ 181,004$ 169,387$ 1,242,200$ 3,815,879$ 1,413,538$
-$ -$ 8,188$ -$ 54,858$ -$ -$ 111,093 - - - 68,131 50 -
- - - - - - -- - - - - - -- - - - - - -
111,093 - 8,188 - 122,989 50 -
- - - - - - -- - - - - - -
890,381 151,786 172,816 169,387 1,119,211 3,815,829 1,413,538- - - - - - -- - - - - - -
890,381 151,786 172,816 169,387 1,119,211 3,815,829 1,413,538
1,001,474$ 151,786$ 181,004$ 169,387$ 1,242,200$ 3,815,879$ 1,413,538$
Debt Service FundsSpecial Revenue Funds
123
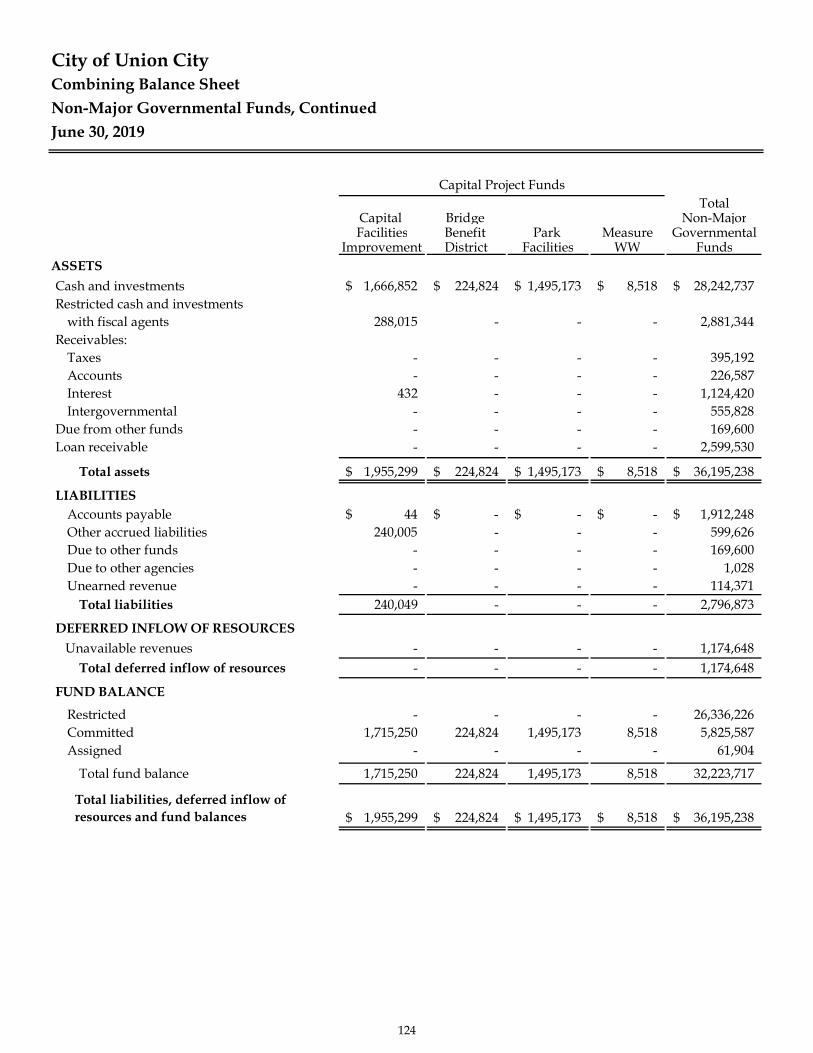
City of Union CityCombining Balance SheetNon-Major Governmental Funds, ContinuedJune 30, 2019
TotalCapital Bridge Non-MajorFacilities Benefit Park Measure Governmental
Improvement District Facilities WW FundsASSETSCash and investments 1,666,852$ 224,824$ 1,495,173$ 8,518$ 28,242,737$ Restricted cash and investments
with fiscal agents 288,015 - - - 2,881,344Receivables:
Taxes - - - - 395,192Accounts - - - - 226,587Interest 432 - - - 1,124,420Intergovernmental - - - - 555,828
Due from other funds - - - - 169,600Loan receivable - - - - 2,599,530
Total assets 1,955,299$ 224,824$ 1,495,173$ 8,518$ 36,195,238$
LIABILITIESAccounts payable 44$ -$ -$ -$ 1,912,248$ Other accrued liabilities 240,005 - - - 599,626Due to other funds - - - - 169,600Due to other agencies - - - - 1,028Unearned revenue - - - - 114,371
Total liabilities 240,049 - - - 2,796,873
DEFERRED INFLOW OF RESOURCES Unavailable revenues - - - - 1,174,648
Total deferred inflow of resources - - - - 1,174,648
FUND BALANCE
Restricted - - - - 26,336,226Committed 1,715,250 224,824 1,495,173 8,518 5,825,587Assigned - - - - 61,904
Total fund balance 1,715,250 224,824 1,495,173 8,518 32,223,717
Total liabilities, deferred inflow of resources and fund balances 1,955,299$ 224,824$ 1,495,173$ 8,518$ 36,195,238$
Capital Project Funds
124

This page intentionally left blank.
125

City of Union CityCombined Statement of Revenues, Expenditures and Changes in Fund BalancesNon-Major Governmental FundsFor the year ended June 30, 2019
ACTC Special State Street Lights
Measure B Parks Gas Tax and Landscaping
REVENUES:
Taxes and special assessments 1,048,482$ 8,855$ 1,404,665$ 2,617,724$ Intergovernmental - - - -Charges for services - - 86,814 2,139Investment income 42,364 63,747 93,483 42,108Other - - 62,076 37,366
Total revenues 1,090,846 72,602 1,647,038 2,699,337
EXPENDITURES:
Current:General government - - - 11,733Public safety - - - -Housing and community development - - - -Community and recreation services - - - - Economic and community development - - - -Public works 913,932 201,587 1,544,145 2,523,954
Capital outlay - - - -Debt service:
Principal repayment - - - 204,452Interest and fiscal charges - - - 117,203
Total expenditures 913,932 201,587 1,544,145 2,857,342
REVENUE OVER(UNDER) EXPENDITURES 176,914 (128,985) 102,893 (158,005)
OTHER FINANCINGSOURCES (USES):
Transfers in - - - 542,829Transfers out - - - -Capital lease financing - - - -
Total other financing sources (uses) - - - 542,829
Net change in fund balances 176,914 (128,985) 102,893 384,824
FUND BALANCES:
Beginning of year 1,322,074 2,497,976 3,395,799 451,383
End of year 1,498,988$ 2,368,991$ 3,498,692$ 836,207$
Special Revenue Funds
126
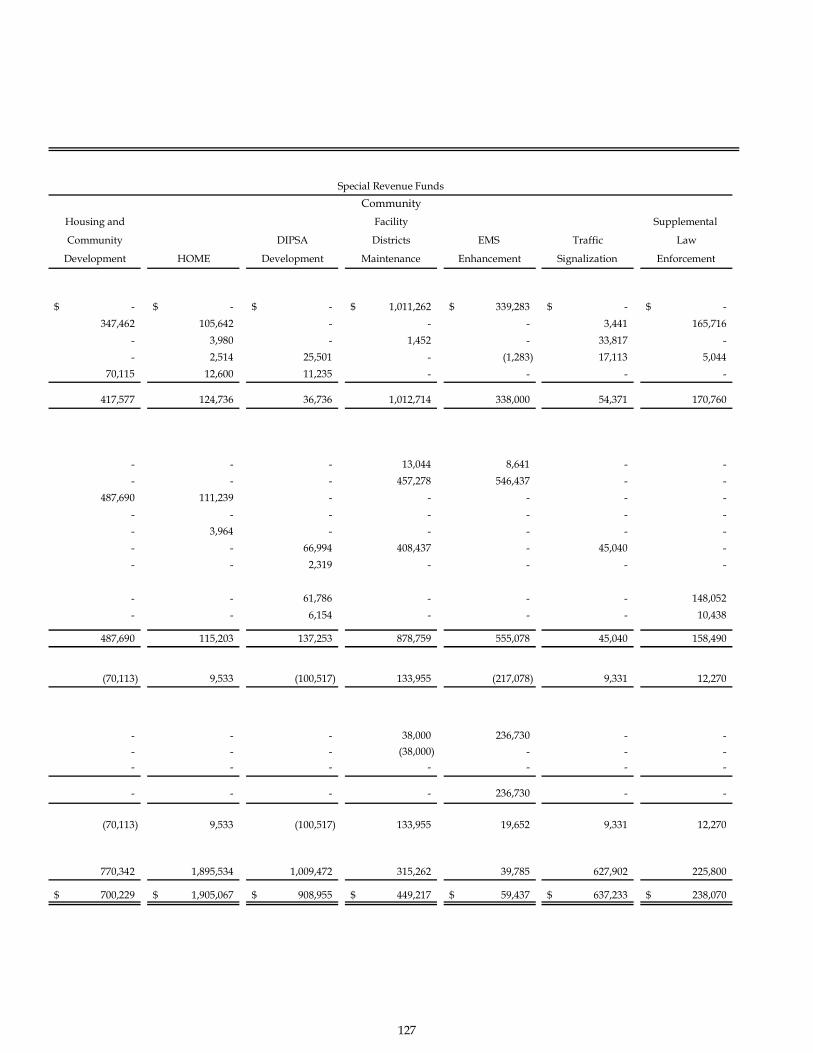
CommunityHousing and Facility Supplemental
Community DIPSA Districts EMS Traffic Law
Development HOME Development Maintenance Enhancement Signalization Enforcement
-$ -$ -$ 1,011,262$ 339,283$ -$ -$ 347,462 105,642 - - - 3,441 165,716
- 3,980 - 1,452 - 33,817 -- 2,514 25,501 - (1,283) 17,113 5,044
70,115 12,600 11,235 - - - -
417,577 124,736 36,736 1,012,714 338,000 54,371 170,760
- - - 13,044 8,641 - -- - - 457,278 546,437 - -
487,690 111,239 - - - - -- - - - - - -- 3,964 - - - - -- - 66,994 408,437 - 45,040 -- - 2,319 - - - -
- - 61,786 - - - 148,052- - 6,154 - - - 10,438
487,690 115,203 137,253 878,759 555,078 45,040 158,490
(70,113) 9,533 (100,517) 133,955 (217,078) 9,331 12,270
- - - 38,000 236,730 - -- - - (38,000) - - -- - - - - - -
- - - - 236,730 - -
(70,113) 9,533 (100,517) 133,955 19,652 9,331 12,270
770,342 1,895,534 1,009,472 315,262 39,785 627,902 225,800
700,229$ 1,905,067$ 908,955$ 449,217$ 59,437$ 637,233$ 238,070$
Special Revenue Funds
127

City of Union CityCombined Statement of Revenues, Expenditures and Changes in Fund BalancesNon-Major Governmental Funds, ContinuedFor the year ended June 30, 2019
Recycling
Clean Water and Waste Used Oil Housing
Program Management Block Grant In-Lieu
REVENUES:
Taxes and special assessments 2,012,838$ -$ -$ -$ Intergovernmental - - - 1,031,347Charges for services 4,193 260,610 - 13,891Investment income - - - -Other - - - -
Total revenues 2,017,031 260,610 - 1,045,238
EXPENDITURES:
Current:General government 99,922 5,761 - -Public safety - - - -Housing and community development - - - 148,186Community and recreation services - - - - Economic and community development 293,247 - - 26,258Public works 1,505,582 - 20,834 -
Capital outlay - - - -Debt service:
Principal repayment - - - -Interest and fiscal charges - - - -
Total expenditures 1,898,751 5,761 20,834 174,444
REVENUE OVER(UNDER) EXPENDITURES 118,280 254,849 (20,834) 870,794
OTHER FINANCINGSOURCES (USES):
Transfers in 227,711 - 1,100 -Transfers out - (259,196) - -Capital lease financing - - - -
Total other financing sources (uses) 227,711 (259,196) 1,100 -
Net change in fund balances 345,991 (4,347) (19,734) 870,794
FUND BALANCES:
Beginning of year 178,239 66,251 19,742 2,021,731
End of year 524,230$ 61,904$ 8$ 2,892,525$
Special Revenue Funds
128
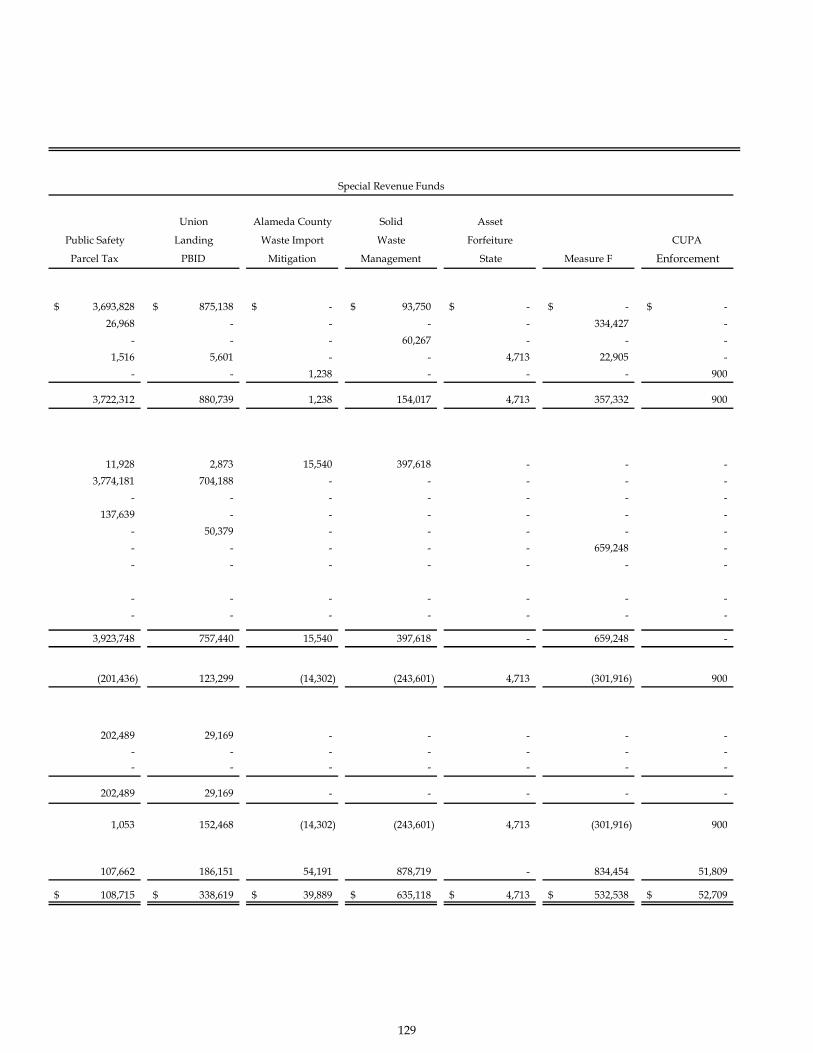
Union Alameda County Solid Asset
Public Safety Landing Waste Import Waste Forfeiture CUPA
Parcel Tax PBID Mitigation Management State Measure F Enforcement
3,693,828$ 875,138$ -$ 93,750$ -$ -$ -$ 26,968 - - - - 334,427 -
- - - 60,267 - - -1,516 5,601 - - 4,713 22,905 -
- - 1,238 - - - 900
3,722,312 880,739 1,238 154,017 4,713 357,332 900
11,928 2,873 15,540 397,618 - - -3,774,181 704,188 - - - - -
- - - - - - -137,639 - - - - - -
- 50,379 - - - - -- - - - - 659,248 -- - - - - - -
- - - - - - -- - - - - - -
3,923,748 757,440 15,540 397,618 - 659,248 -
(201,436) 123,299 (14,302) (243,601) 4,713 (301,916) 900
202,489 29,169 - - - - -- - - - - - -- - - - - - -
202,489 29,169 - - - - -
1,053 152,468 (14,302) (243,601) 4,713 (301,916) 900
107,662 186,151 54,191 878,719 - 834,454 51,809
108,715$ 338,619$ 39,889$ 635,118$ 4,713$ 532,538$ 52,709$
Special Revenue Funds
129
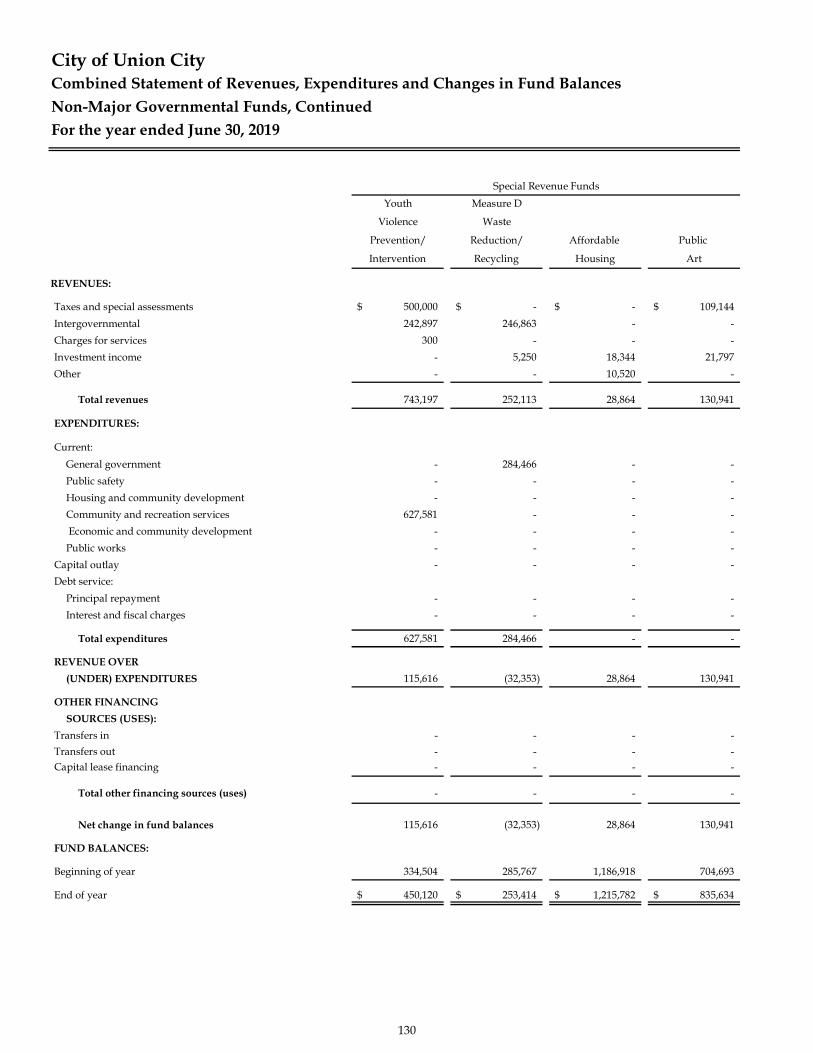
City of Union CityCombined Statement of Revenues, Expenditures and Changes in Fund BalancesNon-Major Governmental Funds, ContinuedFor the year ended June 30, 2019
Youth Measure D
Violence Waste
Prevention/ Reduction/ Affordable Public
Intervention Recycling Housing Art
REVENUES:
Taxes and special assessments 500,000$ -$ -$ 109,144$ Intergovernmental 242,897 246,863 - -Charges for services 300 - - -Investment income - 5,250 18,344 21,797Other - - 10,520 -
Total revenues 743,197 252,113 28,864 130,941
EXPENDITURES:
Current:General government - 284,466 - -Public safety - - - -Housing and community development - - - -Community and recreation services 627,581 - - - Economic and community development - - - -Public works - - - -
Capital outlay - - - -Debt service:
Principal repayment - - - -Interest and fiscal charges - - - -
Total expenditures 627,581 284,466 - -
REVENUE OVER(UNDER) EXPENDITURES 115,616 (32,353) 28,864 130,941
OTHER FINANCINGSOURCES (USES):
Transfers in - - - -Transfers out - - - -Capital lease financing - - - -
Total other financing sources (uses) - - - -
Net change in fund balances 115,616 (32,353) 28,864 130,941
FUND BALANCES:
Beginning of year 334,504 285,767 1,186,918 704,693
End of year 450,120$ 253,414$ 1,215,782$ 835,634$
Special Revenue Funds
130
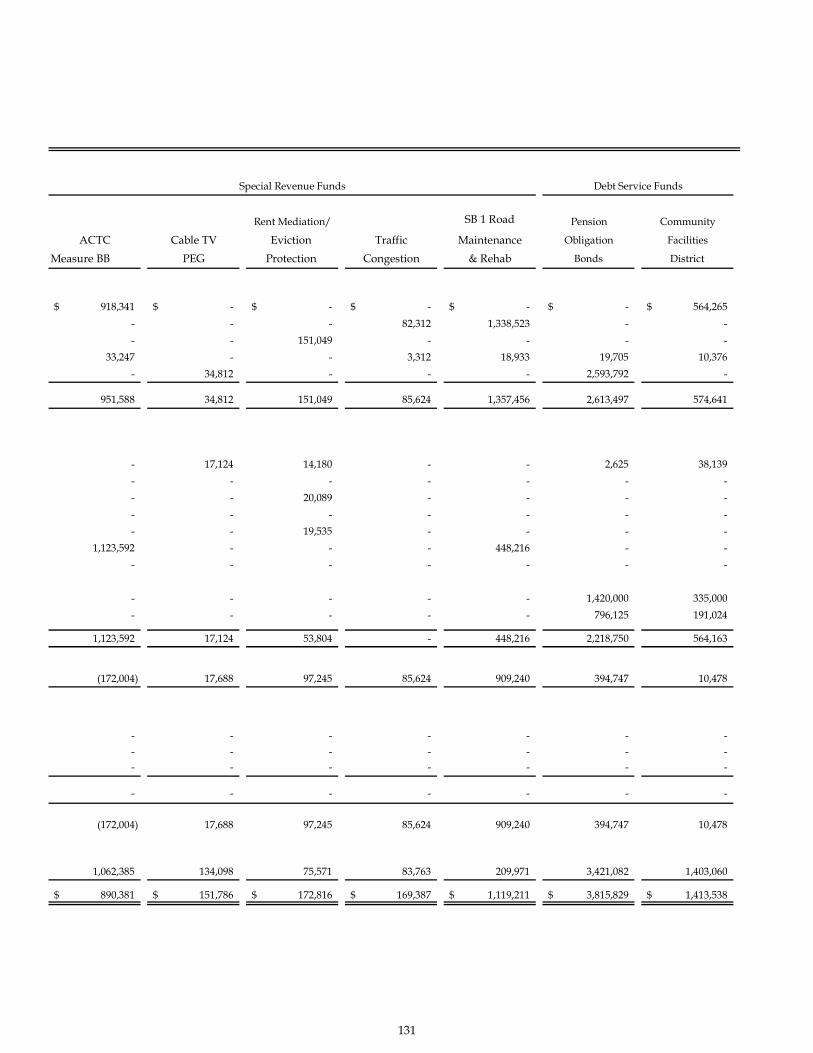
Rent Mediation/ SB 1 Road Pension Community
ACTC Cable TV Eviction Traffic Maintenance Obligation Facilities
Measure BB PEG Protection Congestion & Rehab Bonds District
918,341$ -$ -$ -$ -$ -$ 564,265$ - - - 82,312 1,338,523 - -- - 151,049 - - - -
33,247 - - 3,312 18,933 19,705 10,376- 34,812 - - - 2,593,792 -
951,588 34,812 151,049 85,624 1,357,456 2,613,497 574,641
- 17,124 14,180 - - 2,625 38,139- - - - - - -- - 20,089 - - - -- - - - - - -- - 19,535 - - - -
1,123,592 - - - 448,216 - -- - - - - - -
- - - - - 1,420,000 335,000- - - - - 796,125 191,024
1,123,592 17,124 53,804 - 448,216 2,218,750 564,163
(172,004) 17,688 97,245 85,624 909,240 394,747 10,478
- - - - - - -- - - - - - -- - - - - - -
- - - - - - -
(172,004) 17,688 97,245 85,624 909,240 394,747 10,478
1,062,385 134,098 75,571 83,763 209,971 3,421,082 1,403,060
890,381$ 151,786$ 172,816$ 169,387$ 1,119,211$ 3,815,829$ 1,413,538$
Debt Service FundsSpecial Revenue Funds
131
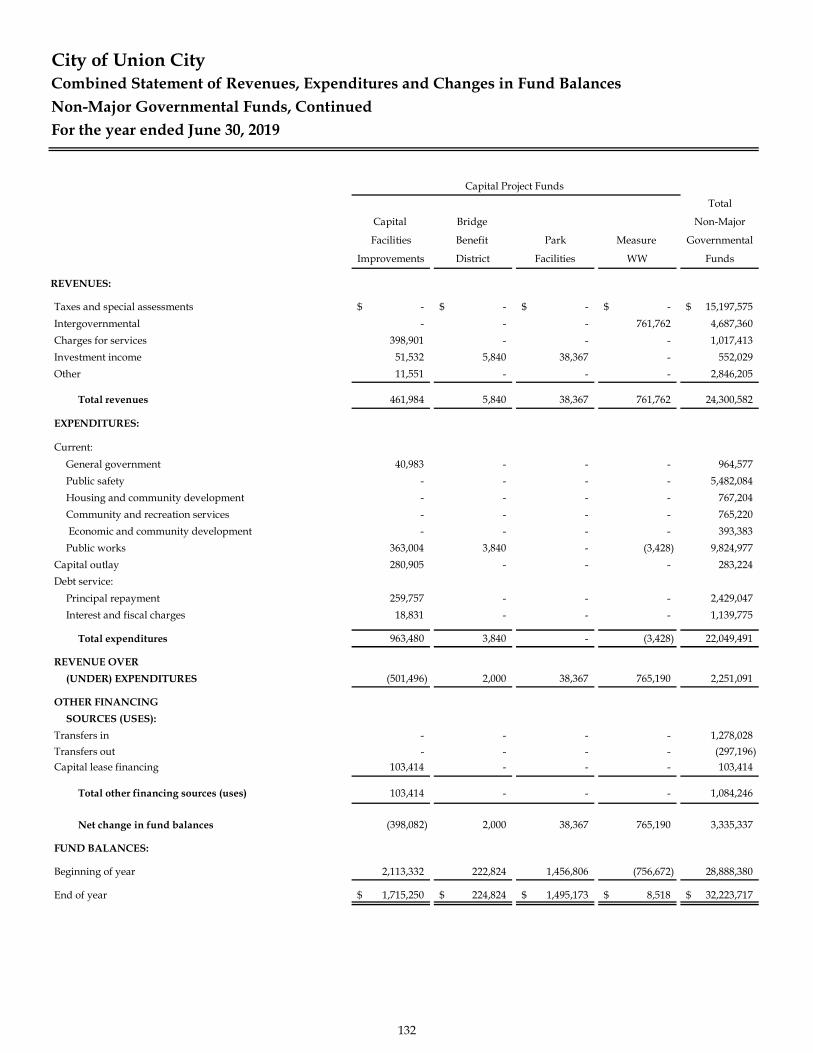
City of Union CityCombined Statement of Revenues, Expenditures and Changes in Fund BalancesNon-Major Governmental Funds, ContinuedFor the year ended June 30, 2019
Total
Capital Bridge Non-Major
Facilities Benefit Park Measure Governmental
Improvements District Facilities WW Funds
REVENUES:
Taxes and special assessments -$ -$ -$ -$ 15,197,575$ Intergovernmental - - - 761,762 4,687,360Charges for services 398,901 - - - 1,017,413Investment income 51,532 5,840 38,367 - 552,029Other 11,551 - - - 2,846,205
Total revenues 461,984 5,840 38,367 761,762 24,300,582
EXPENDITURES:
Current:General government 40,983 - - - 964,577Public safety - - - - 5,482,084Housing and community development - - - - 767,204Community and recreation services - - - - 765,220 Economic and community development - - - - 393,383Public works 363,004 3,840 - (3,428) 9,824,977
Capital outlay 280,905 - - - 283,224Debt service:
Principal repayment 259,757 - - - 2,429,047Interest and fiscal charges 18,831 - - - 1,139,775
Total expenditures 963,480 3,840 - (3,428) 22,049,491
REVENUE OVER(UNDER) EXPENDITURES (501,496) 2,000 38,367 765,190 2,251,091
OTHER FINANCINGSOURCES (USES):
Transfers in - - - - 1,278,028Transfers out - - - - (297,196)Capital lease financing 103,414 - - - 103,414
Total other financing sources (uses) 103,414 - - - 1,084,246
Net change in fund balances (398,082) 2,000 38,367 765,190 3,335,337
FUND BALANCES:
Beginning of year 2,113,332 222,824 1,456,806 (756,672) 28,888,380
End of year 1,715,250$ 224,824$ 1,495,173$ 8,518$ 32,223,717$
Capital Project Funds
132
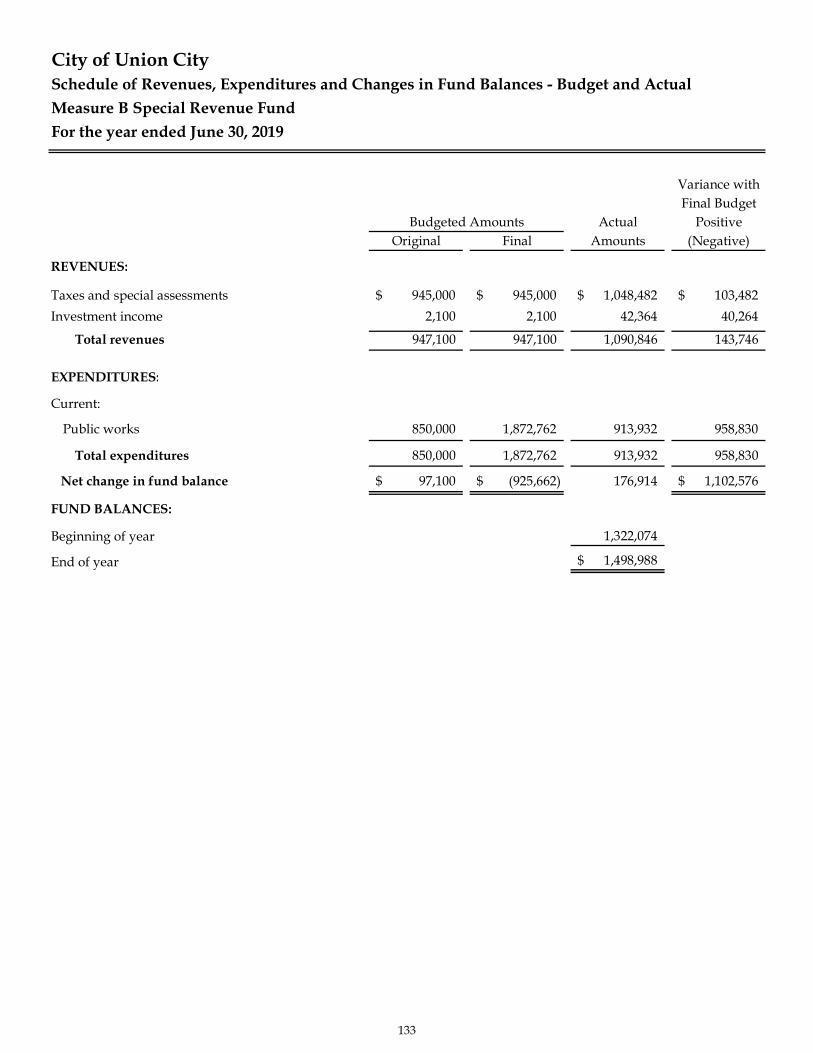
Schedule of Revenues, Expenditures and Changes in Fund Balances - Budget and ActualMeasure B Special Revenue FundFor the year ended June 30, 2019
Variance withFinal Budget
Actual PositiveOriginal Final Amounts (Negative)
REVENUES:
Taxes and special assessments 945,000$ 945,000$ 1,048,482$ 103,482$ Investment income 2,100 2,100 42,364 40,264
Total revenues 947,100 947,100 1,090,846 143,746
EXPENDITURES:
Current:
Public works 850,000 1,872,762 913,932 958,830
Total expenditures 850,000 1,872,762 913,932 958,830
Net change in fund balance 97,100$ (925,662)$ 176,914 1,102,576$
FUND BALANCES:
Beginning of year 1,322,074
End of year 1,498,988$
Budgeted Amounts
City of Union City
133
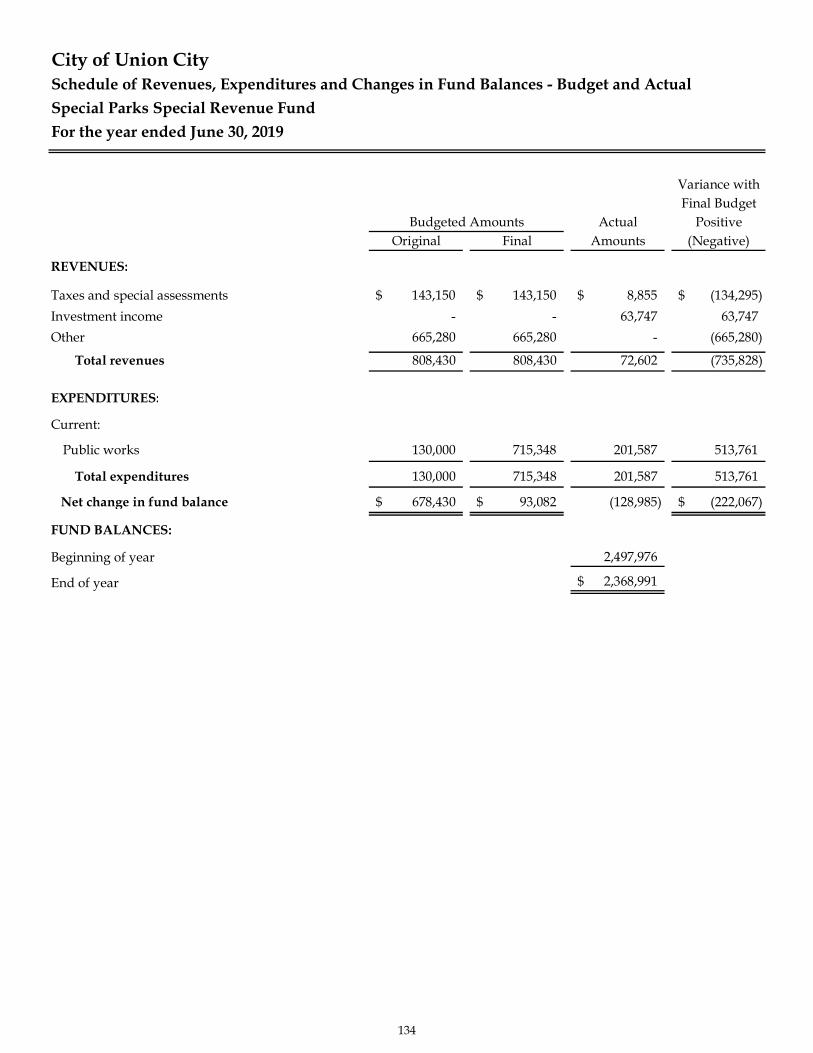
Schedule of Revenues, Expenditures and Changes in Fund Balances - Budget and ActualSpecial Parks Special Revenue FundFor the year ended June 30, 2019
Variance withFinal Budget
Actual PositiveOriginal Final Amounts (Negative)
REVENUES:
Taxes and special assessments 143,150$ 143,150$ 8,855$ (134,295)$ Investment income - - 63,747 63,747Other 665,280 665,280 - (665,280)
Total revenues 808,430 808,430 72,602 (735,828)
EXPENDITURES:
Current:
Public works 130,000 715,348 201,587 513,761
Total expenditures 130,000 715,348 201,587 513,761
Net change in fund balance 678,430$ 93,082$ (128,985) (222,067)$
FUND BALANCES:
Beginning of year 2,497,976
End of year 2,368,991$
City of Union City
Budgeted Amounts
134
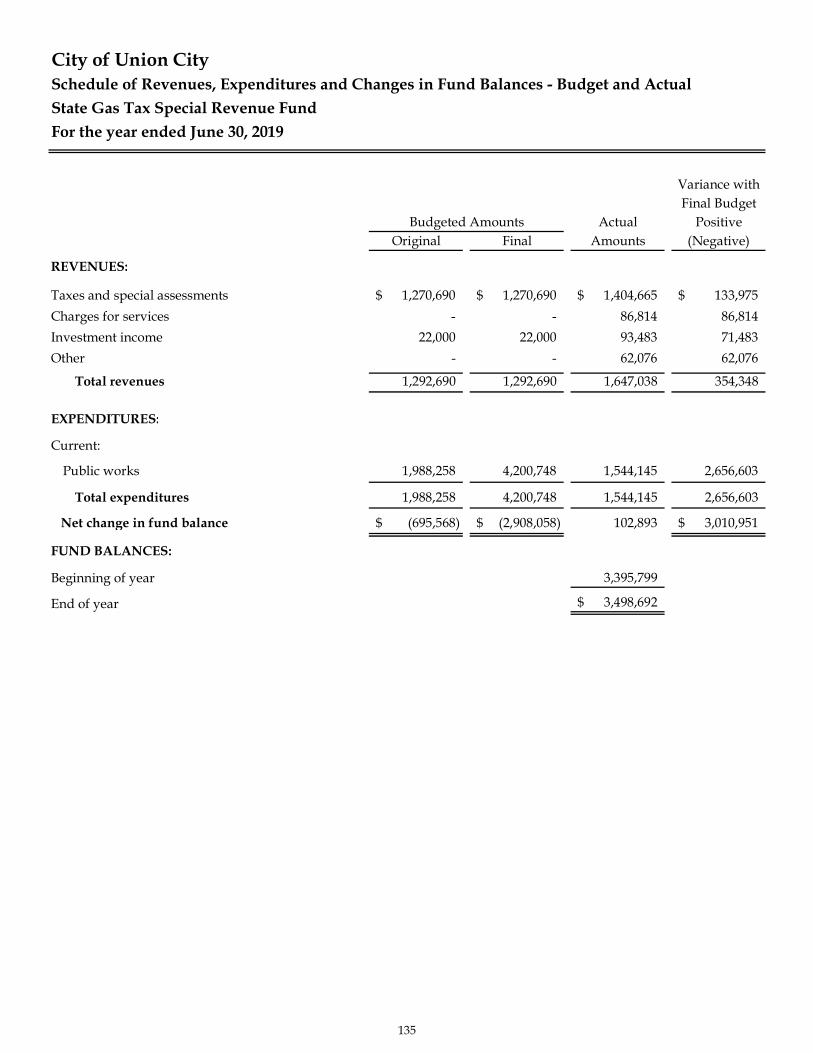
Schedule of Revenues, Expenditures and Changes in Fund Balances - Budget and ActualState Gas Tax Special Revenue FundFor the year ended June 30, 2019
Variance withFinal Budget
Actual PositiveOriginal Final Amounts (Negative)
REVENUES:
Taxes and special assessments 1,270,690$ 1,270,690$ 1,404,665$ 133,975$ Charges for services - - 86,814 86,814Investment income 22,000 22,000 93,483 71,483Other - - 62,076 62,076
Total revenues 1,292,690 1,292,690 1,647,038 354,348
EXPENDITURES:
Current:
Public works 1,988,258 4,200,748 1,544,145 2,656,603
Total expenditures 1,988,258 4,200,748 1,544,145 2,656,603
Net change in fund balance (695,568)$ (2,908,058)$ 102,893 3,010,951$
FUND BALANCES:
Beginning of year 3,395,799
End of year 3,498,692$
City of Union City
Budgeted Amounts
135
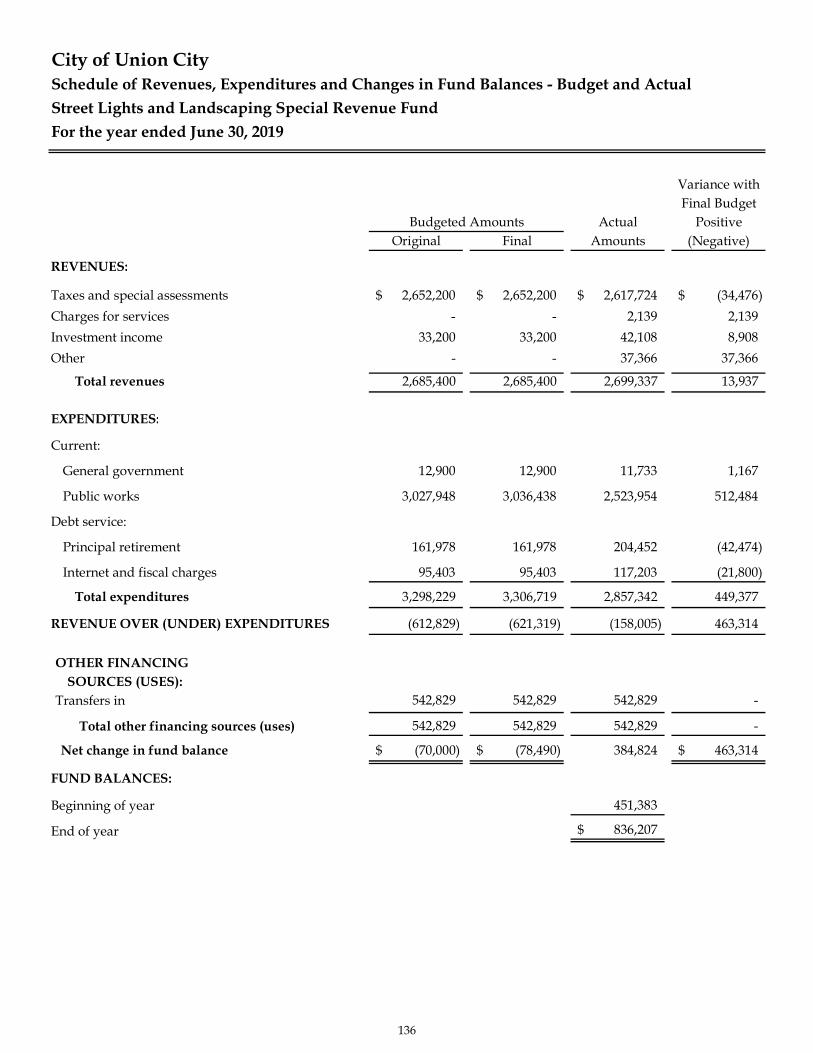
Schedule of Revenues, Expenditures and Changes in Fund Balances - Budget and ActualStreet Lights and Landscaping Special Revenue FundFor the year ended June 30, 2019
Variance withFinal Budget
Actual PositiveOriginal Final Amounts (Negative)
REVENUES:
Taxes and special assessments 2,652,200$ 2,652,200$ 2,617,724$ (34,476)$ Charges for services - - 2,139 2,139Investment income 33,200 33,200 42,108 8,908Other - - 37,366 37,366
Total revenues 2,685,400 2,685,400 2,699,337 13,937
EXPENDITURES:
Current:
General government 12,900 12,900 11,733 1,167
Public works 3,027,948 3,036,438 2,523,954 512,484
Debt service:
Principal retirement 161,978 161,978 204,452 (42,474)
Internet and fiscal charges 95,403 95,403 117,203 (21,800)
Total expenditures 3,298,229 3,306,719 2,857,342 449,377
REVENUE OVER (UNDER) EXPENDITURES (612,829) (621,319) (158,005) 463,314
OTHER FINANCINGSOURCES (USES):
Transfers in 542,829 542,829 542,829 -
Total other financing sources (uses) 542,829 542,829 542,829 -
Net change in fund balance (70,000)$ (78,490)$ 384,824 463,314$
FUND BALANCES:
Beginning of year 451,383
End of year 836,207$
City of Union City
Budgeted Amounts
136
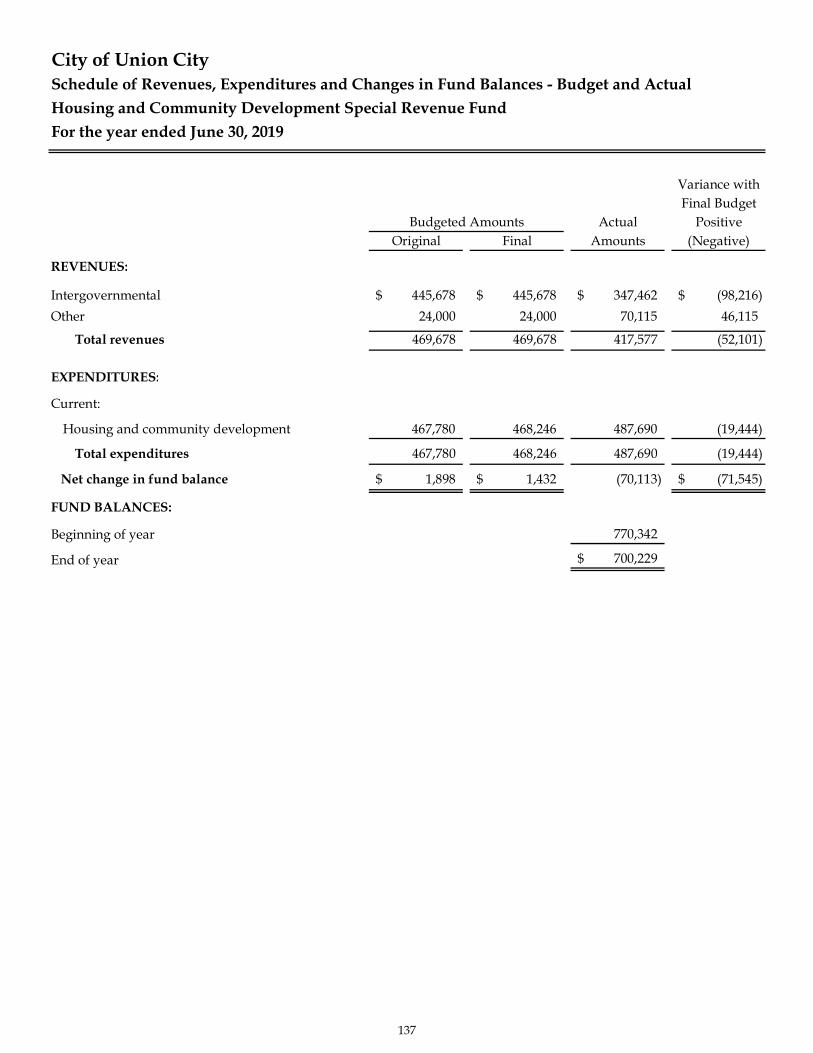
Schedule of Revenues, Expenditures and Changes in Fund Balances - Budget and ActualHousing and Community Development Special Revenue FundFor the year ended June 30, 2019
Variance withFinal Budget
Actual PositiveOriginal Final Amounts (Negative)
REVENUES:
Intergovernmental 445,678$ 445,678$ 347,462$ (98,216)$ Other 24,000 24,000 70,115 46,115
Total revenues 469,678 469,678 417,577 (52,101)
EXPENDITURES:
Current:
Housing and community development 467,780 468,246 487,690 (19,444)
Total expenditures 467,780 468,246 487,690 (19,444)
Net change in fund balance 1,898$ 1,432$ (70,113) (71,545)$
FUND BALANCES:
Beginning of year 770,342
End of year 700,229$
City of Union City
Budgeted Amounts
137
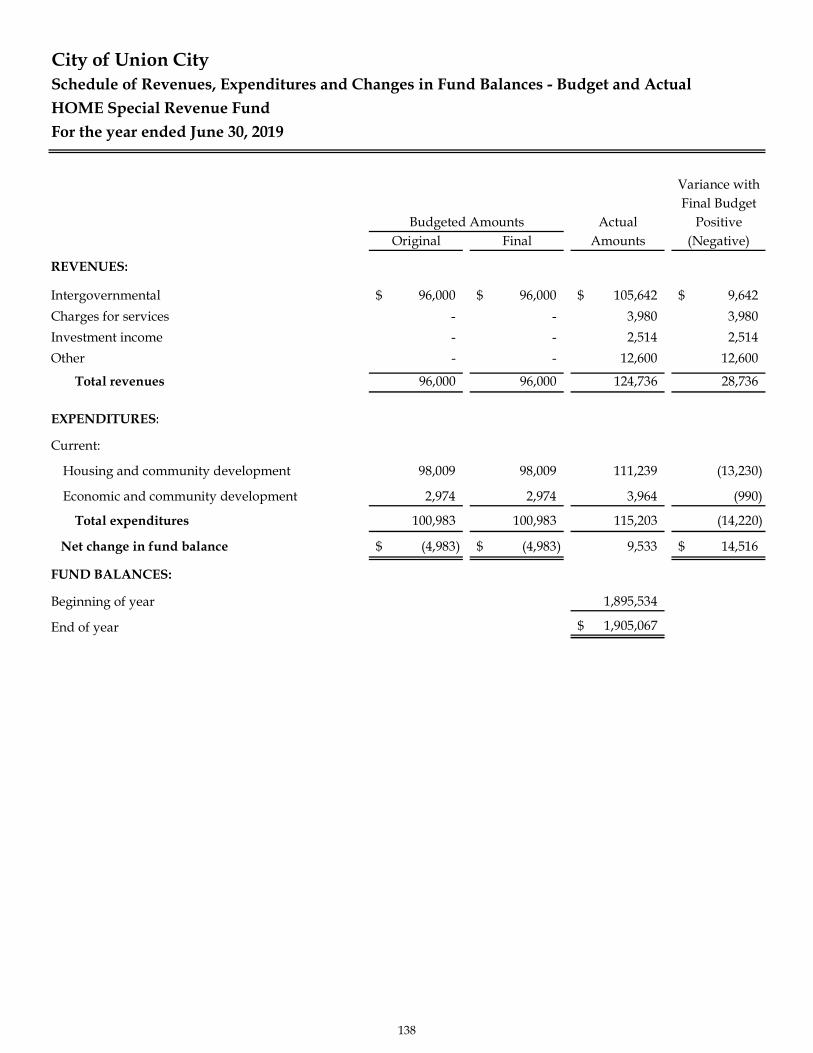
Schedule of Revenues, Expenditures and Changes in Fund Balances - Budget and ActualHOME Special Revenue FundFor the year ended June 30, 2019
Variance withFinal Budget
Actual PositiveOriginal Final Amounts (Negative)
REVENUES:
Intergovernmental 96,000$ 96,000$ 105,642$ 9,642$ Charges for services - - 3,980 3,980Investment income - - 2,514 2,514Other - - 12,600 12,600
Total revenues 96,000 96,000 124,736 28,736
EXPENDITURES:
Current:
Housing and community development 98,009 98,009 111,239 (13,230)
Economic and community development 2,974 2,974 3,964 (990)
Total expenditures 100,983 100,983 115,203 (14,220)
Net change in fund balance (4,983)$ (4,983)$ 9,533 14,516$
FUND BALANCES:
Beginning of year 1,895,534
End of year 1,905,067$
City of Union City
Budgeted Amounts
138
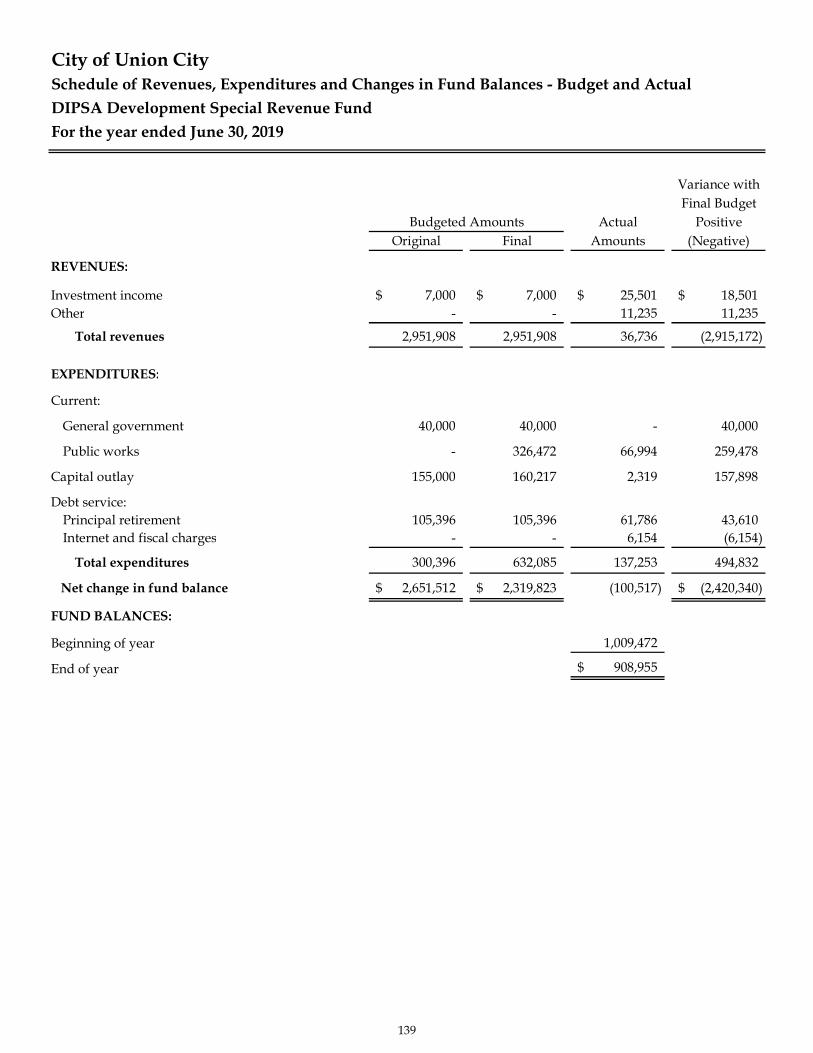
Schedule of Revenues, Expenditures and Changes in Fund Balances - Budget and ActualDIPSA Development Special Revenue FundFor the year ended June 30, 2019
Variance withFinal Budget
Actual PositiveOriginal Final Amounts (Negative)
REVENUES:
Investment income 7,000$ 7,000$ 25,501$ 18,501$ Other - - 11,235 11,235
Total revenues 2,951,908 2,951,908 36,736 (2,915,172)
EXPENDITURES:
Current:
General government 40,000 40,000 - 40,000
Public works - 326,472 66,994 259,478
Capital outlay 155,000 160,217 2,319 157,898
Debt service:Principal retirement 105,396 105,396 61,786 43,610Internet and fiscal charges - - 6,154 (6,154)
Total expenditures 300,396 632,085 137,253 494,832
Net change in fund balance 2,651,512$ 2,319,823$ (100,517) (2,420,340)$
FUND BALANCES:
Beginning of year 1,009,472
End of year 908,955$
City of Union City
Budgeted Amounts
139

Schedule of Revenues, Expenditures and Changes in Fund Balances - Budget and ActualCFD Maintenance Districts Special Revenue FundFor the year ended June 30, 2019
Variance withFinal Budget
Actual PositiveOriginal Final Amounts (Negative)
REVENUES:
Taxes and special assessments 901,675$ 901,675$ 1,011,262$ 109,587$ Charges for services - - 1,452 1,452
Total revenues 901,675 901,675 1,012,714 111,039
EXPENDITURES:
Current:
General government 12,400 12,400 13,044 (644)
Public safety 461,231 465,221 457,278 7,943
Public works 537,626 537,626 408,437 129,189
Total expenditures 1,011,257 1,015,247 878,759 136,488
REVENUE OVER (UNDER) EXPENDITURES (109,582) (113,572) 133,955 247,527
OTHER FINANCINGSOURCES (USES):
Transfers in - - 38,000 38,000Transfers out - - (38,000) (38,000)
Total other financing sources (uses) - - - -
Net change in fund balance (109,582)$ (113,572)$ 133,955 247,527$
FUND BALANCES:
Beginning of year 315,262
End of year 449,217$
City of Union City
Budgeted Amounts
140

Schedule of Revenues, Expenditures and Changes in Fund Balances - Budget and ActualEMS Enhancement Special Revenue FundFor the year ended June 30, 2019
Variance withFinal Budget
Actual PositiveOriginal Final Amounts (Negative)
REVENUES:
Taxes and special assessments 332,800$ 332,800$ 339,283$ 6,483$ Investment income - - (1,283) (1,283)
Total revenues 332,800 332,800 338,000 5,200
EXPENDITURES:
Current:
General government 21,630 21,630 8,642 12,988
Public safety 547,600 555,580 546,437 9,143
Debt service:
Internet and fiscal charges 300 300 - 300
Total expenditures 569,530 577,510 555,079 22,431
REVENUE OVER (UNDER) EXPENDITURES (236,730) (244,710) (217,079) 27,631
OTHER FINANCINGSOURCES (USES):
Transfers in 236,730 236,730 236,730 -
Total other financing sources (uses) 236,730 236,730 236,730 -
Net change in fund balance -$ (7,980)$ 19,651 27,631$
FUND BALANCES:
Beginning of year 39,786
End of year 59,437$
City of Union City
Budgeted Amounts
141
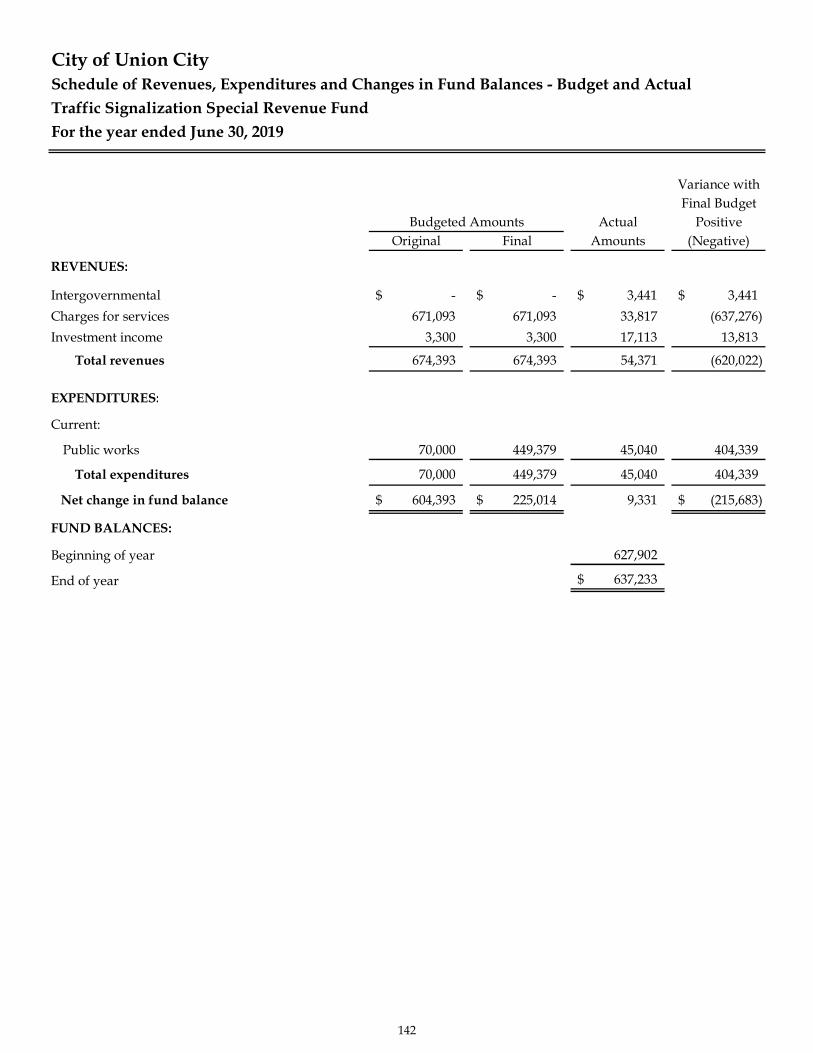
Schedule of Revenues, Expenditures and Changes in Fund Balances - Budget and ActualTraffic Signalization Special Revenue FundFor the year ended June 30, 2019
Variance withFinal Budget
Actual PositiveOriginal Final Amounts (Negative)
REVENUES:
Intergovernmental -$ -$ 3,441$ 3,441$ Charges for services 671,093 671,093 33,817 (637,276)Investment income 3,300 3,300 17,113 13,813
Total revenues 674,393 674,393 54,371 (620,022)
EXPENDITURES:
Current:
Public works 70,000 449,379 45,040 404,339
Total expenditures 70,000 449,379 45,040 404,339
Net change in fund balance 604,393$ 225,014$ 9,331 (215,683)$
FUND BALANCES:
Beginning of year 627,902
End of year 637,233$
City of Union City
Budgeted Amounts
142

Schedule of Revenues, Expenditures and Changes in Fund Balances - Budget and ActualSupplemental Law Enforcement Special Revenue FundFor the year ended June 30, 2019
Variance withFinal Budget
Actual PositiveOriginal Final Amounts (Negative)
REVENUES:
Intergovernmental 140,628$ 140,628$ 165,716$ 25,088$ Investment income - - 5,043 5,043
Total revenues 140,628 140,628 170,759 30,131
EXPENDITURES:
Current:
Debt service:
Principal retirement 158,490 158,490 148,052 10,438
Internet and fiscal charges - - 10,438 (10,438)
Total expenditures 158,490 158,490 158,490 -
Net change in fund balance (17,862)$ (17,862)$ 12,269 30,131$
FUND BALANCES:
Beginning of year 225,801
End of year 238,070$
City of Union City
Budgeted Amounts
143
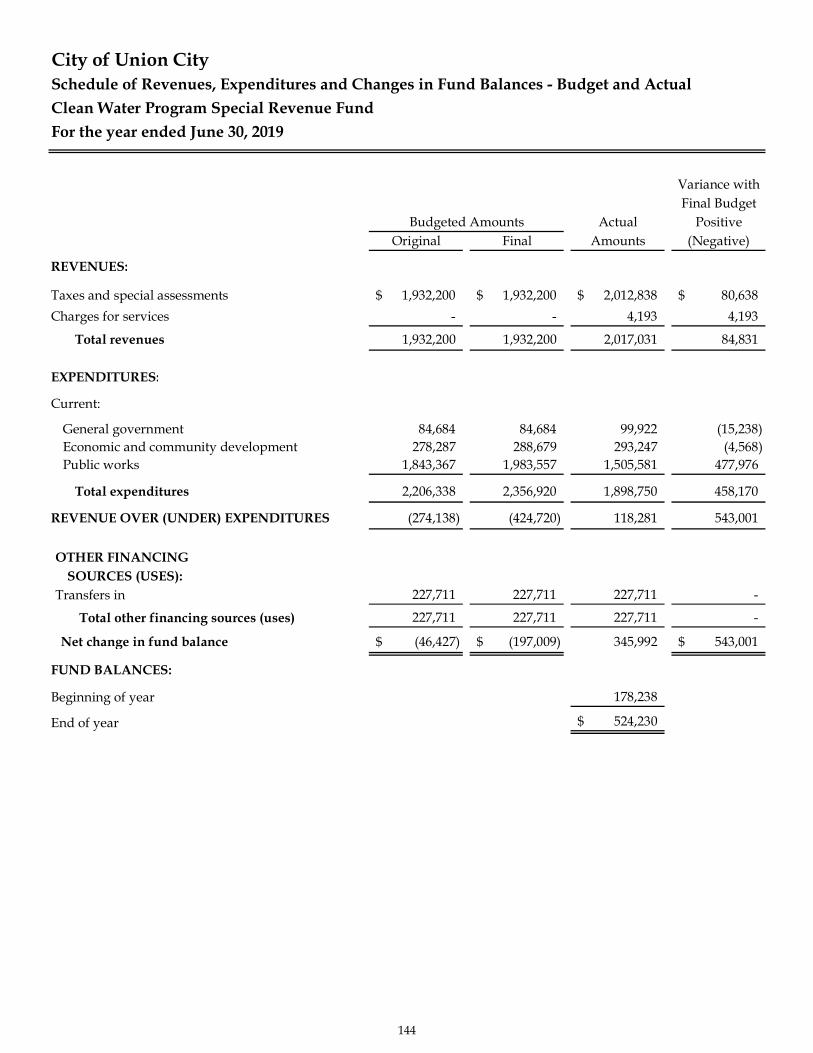
Schedule of Revenues, Expenditures and Changes in Fund Balances - Budget and ActualClean Water Program Special Revenue FundFor the year ended June 30, 2019
Variance withFinal Budget
Actual PositiveOriginal Final Amounts (Negative)
REVENUES:
Taxes and special assessments 1,932,200$ 1,932,200$ 2,012,838$ 80,638$ Charges for services - - 4,193 4,193
Total revenues 1,932,200 1,932,200 2,017,031 84,831
EXPENDITURES:
Current:
General government 84,684 84,684 99,922 (15,238)Economic and community development 278,287 288,679 293,247 (4,568)Public works 1,843,367 1,983,557 1,505,581 477,976
Total expenditures 2,206,338 2,356,920 1,898,750 458,170
REVENUE OVER (UNDER) EXPENDITURES (274,138) (424,720) 118,281 543,001
OTHER FINANCINGSOURCES (USES):
Transfers in 227,711 227,711 227,711 -
Total other financing sources (uses) 227,711 227,711 227,711 -
Net change in fund balance (46,427)$ (197,009)$ 345,992 543,001$
FUND BALANCES:
Beginning of year 178,238
End of year 524,230$
City of Union City
Budgeted Amounts
144

Schedule of Revenues, Expenditures and Changes in Fund Balances - Budget and ActualRecycling and Waste Management Special Revenue FundFor the year ended June 30, 2019
Variance withFinal Budget
Actual PositiveOriginal Final Amounts (Negative)
REVENUES:
Charges for services 244,000$ 244,000$ 260,610$ 16,610$
Total revenues 244,000 244,000 260,610 16,610
EXPENDITURES:
Current:
General government 4,000 4,000 5,761 (1,761)
Total expenditures 4,000 4,000 5,761 (1,761)
REVENUE OVER (UNDER) EXPENDITURES 240,000 240,000 254,849 14,849
OTHER FINANCINGSOURCES (USES):
Transfers out (240,000) (240,000) (259,196) (19,196)
Total other financing sources (uses) (240,000) (240,000) (259,196) (19,196)
Net change in fund balance -$ -$ (4,347) (4,347)$
FUND BALANCES:
Beginning of year 66,251
End of year 61,904$
City of Union City
Budgeted Amounts
145
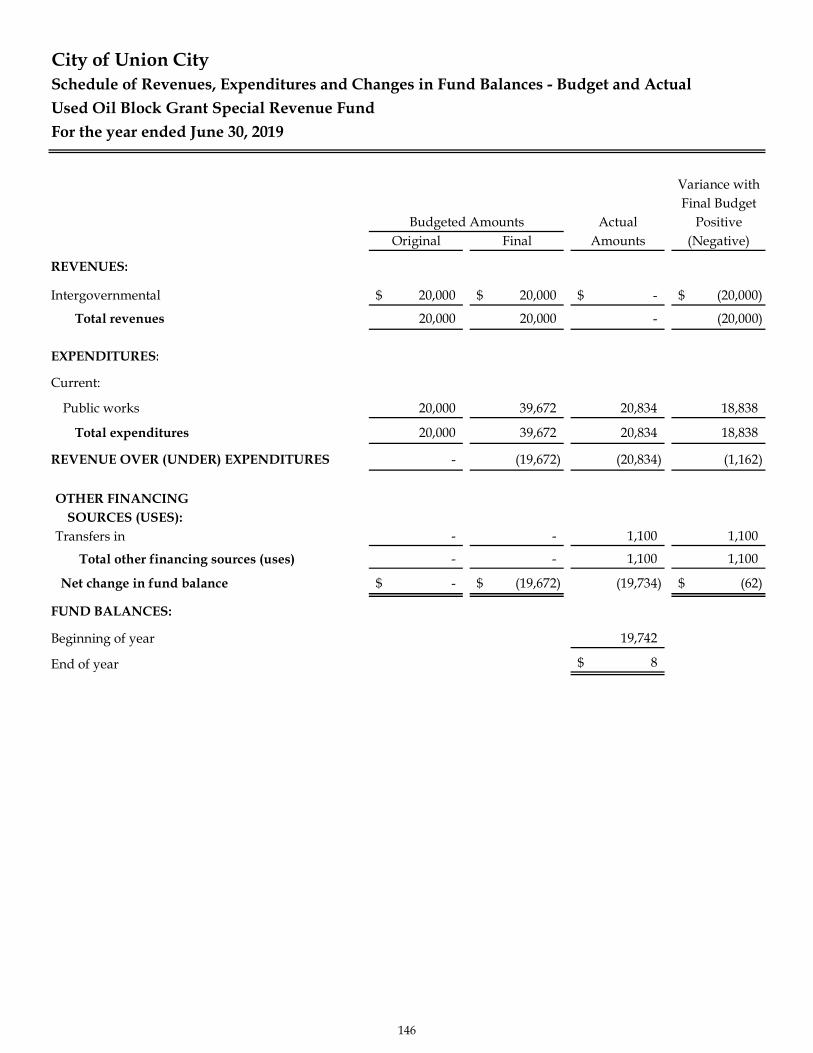
Schedule of Revenues, Expenditures and Changes in Fund Balances - Budget and ActualUsed Oil Block Grant Special Revenue FundFor the year ended June 30, 2019
Variance withFinal Budget
Actual PositiveOriginal Final Amounts (Negative)
REVENUES:
Intergovernmental 20,000$ 20,000$ -$ (20,000)$
Total revenues 20,000 20,000 - (20,000)
EXPENDITURES:
Current:
Public works 20,000 39,672 20,834 18,838
Total expenditures 20,000 39,672 20,834 18,838
REVENUE OVER (UNDER) EXPENDITURES - (19,672) (20,834) (1,162)
OTHER FINANCINGSOURCES (USES):
Transfers in - - 1,100 1,100
Total other financing sources (uses) - - 1,100 1,100
Net change in fund balance -$ (19,672)$ (19,734) (62)$
FUND BALANCES:
Beginning of year 19,742
End of year 8$
City of Union City
Budgeted Amounts
146
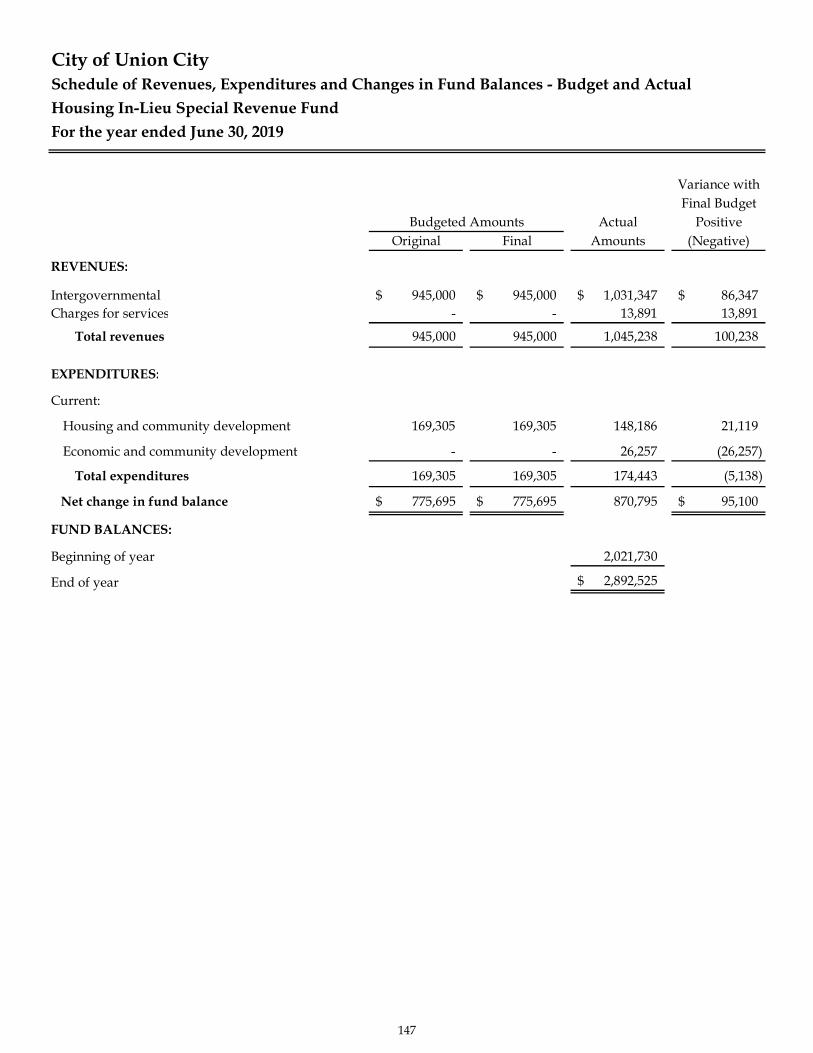
Schedule of Revenues, Expenditures and Changes in Fund Balances - Budget and ActualHousing In-Lieu Special Revenue FundFor the year ended June 30, 2019
Variance withFinal Budget
Actual PositiveOriginal Final Amounts (Negative)
REVENUES:
Intergovernmental 945,000$ 945,000$ 1,031,347$ 86,347$ Charges for services - - 13,891 13,891
Total revenues 945,000 945,000 1,045,238 100,238
EXPENDITURES:
Current:
Housing and community development 169,305 169,305 148,186 21,119
Economic and community development - - 26,257 (26,257)
Total expenditures 169,305 169,305 174,443 (5,138)
Net change in fund balance 775,695$ 775,695$ 870,795 95,100$
FUND BALANCES:
Beginning of year 2,021,730
End of year 2,892,525$
City of Union City
Budgeted Amounts
147

Schedule of Revenues, Expenditures and Changes in Fund Balances - Budget and ActualPublic Safety Parcel Tax Special Revenue FundFor the year ended June 30, 2019
Variance withFinal Budget
Actual PositiveOriginal Final Amounts (Negative)
REVENUES:
Taxes and special assessments 3,586,400$ 3,586,400$ 3,693,828$ 107,428$ Intergovernmental - - 26,968 26,968Investment income - - 1,516 1,516
Total revenues 3,586,400 3,586,400 3,722,312 135,912
EXPENDITURES:
Current:
General government 20,000 20,000 11,928 8,072
Public safety 3,712,527 3,738,463 3,774,181 (35,718)
Community and recreation services 188,187 188,187 137,640 50,547
Debt service:
Internet and fiscal charges 500 500 - 500
Total expenditures 3,921,214 3,947,150 3,923,749 23,401
REVENUE OVER (UNDER) EXPENDITURES (334,814) (360,750) (201,437) 159,313
OTHER FINANCINGSOURCES (USES):
Transfers in 202,489 202,489 202,489 -
Total other financing sources (uses) 202,489 202,489 202,489 -
Net change in fund balance (132,325)$ (158,261)$ 1,052 159,313$
FUND BALANCES:
Beginning of year 107,663
End of year 108,715$
City of Union City
Budgeted Amounts
148
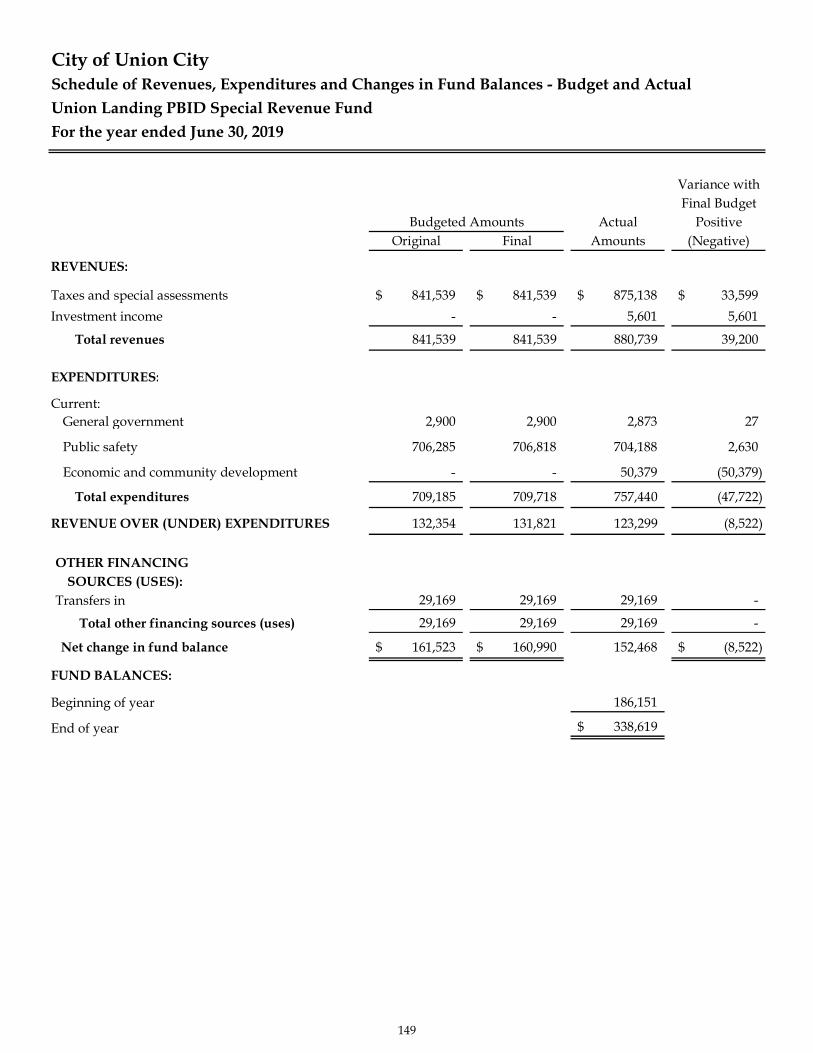
Schedule of Revenues, Expenditures and Changes in Fund Balances - Budget and ActualUnion Landing PBID Special Revenue FundFor the year ended June 30, 2019
Variance withFinal Budget
Actual PositiveOriginal Final Amounts (Negative)
REVENUES:
Taxes and special assessments 841,539$ 841,539$ 875,138$ 33,599$ Investment income - - 5,601 5,601
Total revenues 841,539 841,539 880,739 39,200
EXPENDITURES:
Current:General government 2,900 2,900 2,873 27
Public safety 706,285 706,818 704,188 2,630
Economic and community development - - 50,379 (50,379)
Total expenditures 709,185 709,718 757,440 (47,722)
REVENUE OVER (UNDER) EXPENDITURES 132,354 131,821 123,299 (8,522)
OTHER FINANCINGSOURCES (USES):
Transfers in 29,169 29,169 29,169 -
Total other financing sources (uses) 29,169 29,169 29,169 -
Net change in fund balance 161,523$ 160,990$ 152,468 (8,522)$
FUND BALANCES:
Beginning of year 186,151
End of year 338,619$
City of Union City
Budgeted Amounts
149

Schedule of Revenues, Expenditures and Changes in Fund Balances - Budget and ActualAlameda County Waste Import Mitigation Special Revenue FundFor the year ended June 30, 2019
Variance withFinal Budget
Actual PositiveOriginal Final Amounts (Negative)
REVENUES:
Other -$ -$ 1,238$ 1,238$
Total revenues - - 1,238 1,238
EXPENDITURES:
Current:
General government 21,028 24,204 15,540 8,664
Total expenditures 21,028 24,204 15,540 8,664
Net change in fund balance (21,028)$ (24,204)$ (14,302) 9,902$
FUND BALANCES:
Beginning of year 54,191
End of year 39,889$
City of Union City
Budgeted Amounts
150

Schedule of Revenues, Expenditures and Changes in Fund Balances - Budget and ActualSolid Waste Management Special Revenue FundFor the year ended June 30, 2019
Variance withFinal Budget
Actual PositiveOriginal Final Amounts (Negative)
REVENUES:
Taxes and special assessments -$ -$ 93,750$ 93,750$ Charges for services 83,000 83,000 60,267 (22,733)
Total revenues 83,000 83,000 154,017 71,017
EXPENDITURES:
Current:
General government 417,472 501,153 397,618 103,535
Total expenditures 417,472 501,153 397,618 103,535
Net change in fund balance (334,472)$ (418,153)$ (243,601) 174,552$
FUND BALANCES:
Beginning of year 878,719
End of year 635,118$
City of Union City
Budgeted Amounts
151
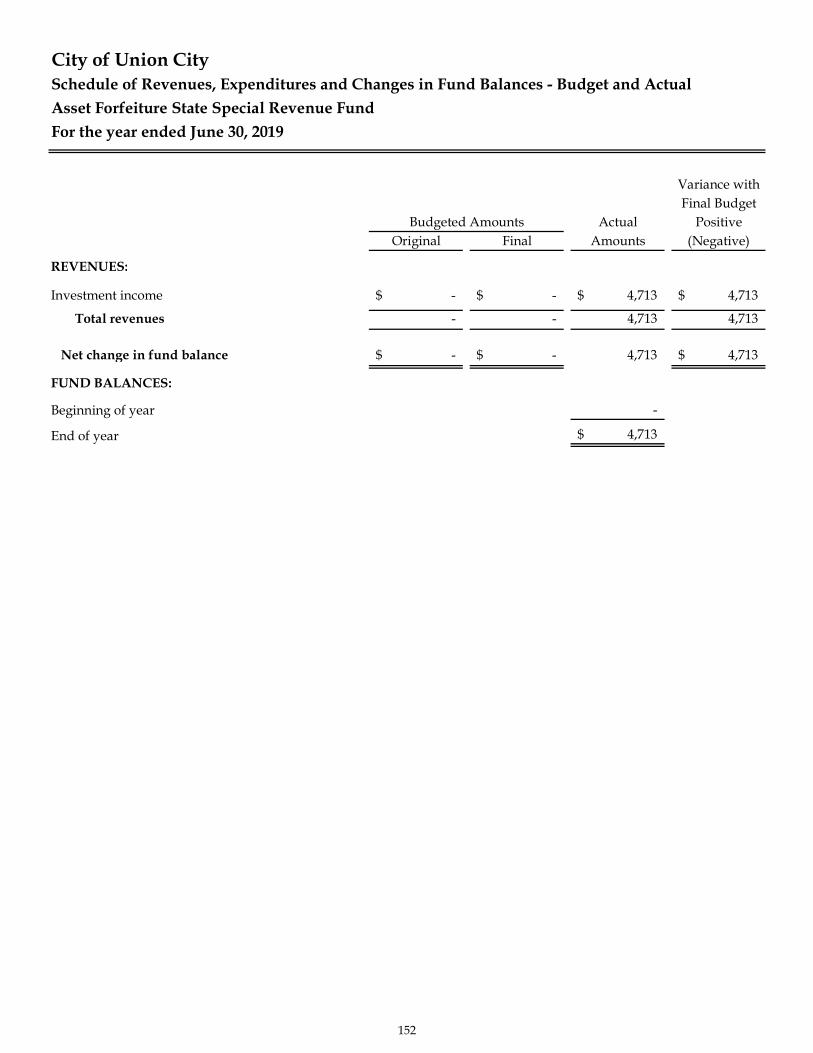
Schedule of Revenues, Expenditures and Changes in Fund Balances - Budget and ActualAsset Forfeiture State Special Revenue FundFor the year ended June 30, 2019
Variance withFinal Budget
Actual PositiveOriginal Final Amounts (Negative)
REVENUES:
Investment income -$ -$ 4,713$ 4,713$
Total revenues - - 4,713 4,713
Net change in fund balance -$ -$ 4,713 4,713$
FUND BALANCES:
Beginning of year -
End of year 4,713$
City of Union City
Budgeted Amounts
152

Schedule of Revenues, Expenditures and Changes in Fund Balances - Budget and ActualMeasure F Special Revenue FundFor the year ended June 30, 2019
Variance withFinal Budget
Actual PositiveOriginal Final Amounts (Negative)
REVENUES:
Intergovernmental 350,000$ 350,000$ 334,427$ (15,573)$ Investment income 3,000 3,000 22,905 19,905
Total revenues 353,000 353,000 357,332 4,332
EXPENDITURES:
Current:
Public works 380,000 1,067,361 659,248 408,113
Total expenditures 380,000 1,067,361 659,248 408,113
Net change in fund balance (27,000)$ (714,361)$ (301,916) 412,445$
FUND BALANCES:
Beginning of year 834,454
End of year 532,538$
City of Union City
Budgeted Amounts
153

Schedule of Revenues, Expenditures and Changes in Fund Balances - Budget and ActualCUPA Enforcement Special Revenue FundFor the year ended June 30, 2019
Variance withFinal Budget
Actual PositiveOriginal Final Amounts (Negative)
REVENUES:
Other 25,000$ 25,000$ 900$ (24,100)$
Total revenues 25,000 25,000 900 (24,100)
EXPENDITURES:
Current:
Economic and community development 48,183 48,183 - 48,183
Total expenditures 48,183 48,183 - 48,183
Net change in fund balance (23,183)$ (23,183)$ 900 24,083$
FUND BALANCES:
Beginning of year 51,809
End of year 52,709$
City of Union City
Budgeted Amounts
154
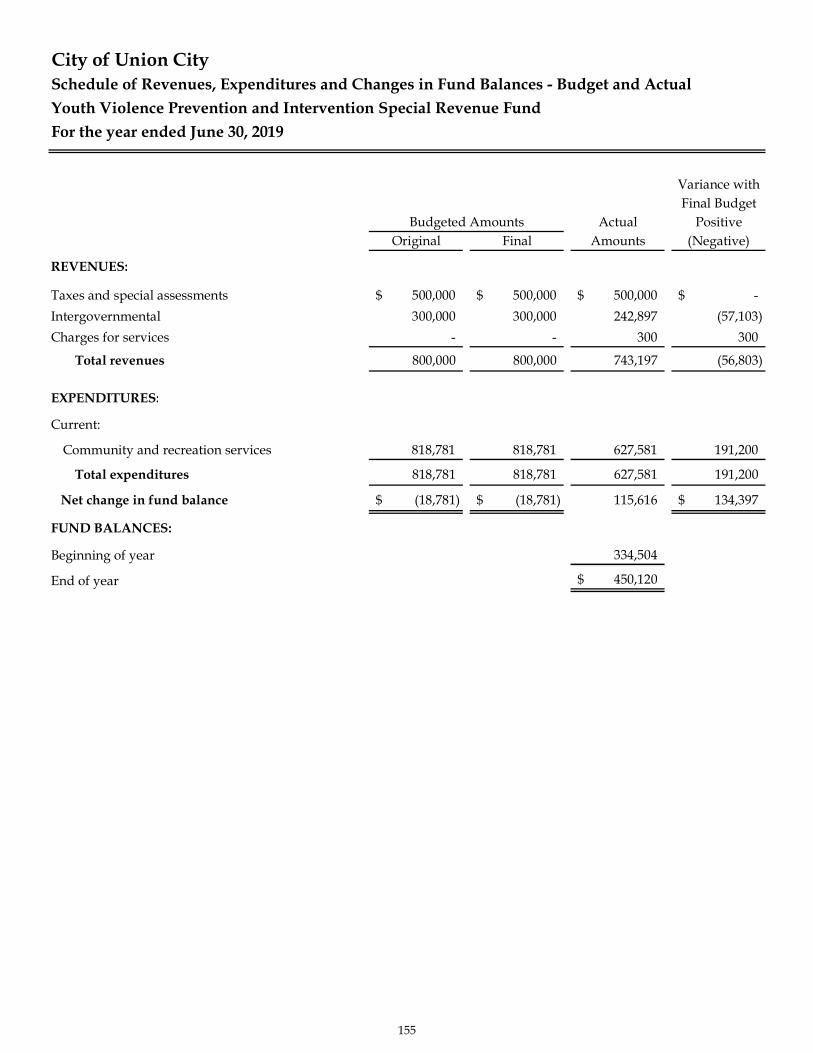
Schedule of Revenues, Expenditures and Changes in Fund Balances - Budget and ActualYouth Violence Prevention and Intervention Special Revenue FundFor the year ended June 30, 2019
Variance withFinal Budget
Actual PositiveOriginal Final Amounts (Negative)
REVENUES:
Taxes and special assessments 500,000$ 500,000$ 500,000$ -$ Intergovernmental 300,000 300,000 242,897 (57,103)Charges for services - - 300 300
Total revenues 800,000 800,000 743,197 (56,803)
EXPENDITURES:
Current:
Community and recreation services 818,781 818,781 627,581 191,200
Total expenditures 818,781 818,781 627,581 191,200
Net change in fund balance (18,781)$ (18,781)$ 115,616 134,397$
FUND BALANCES:
Beginning of year 334,504
End of year 450,120$
City of Union City
Budgeted Amounts
155
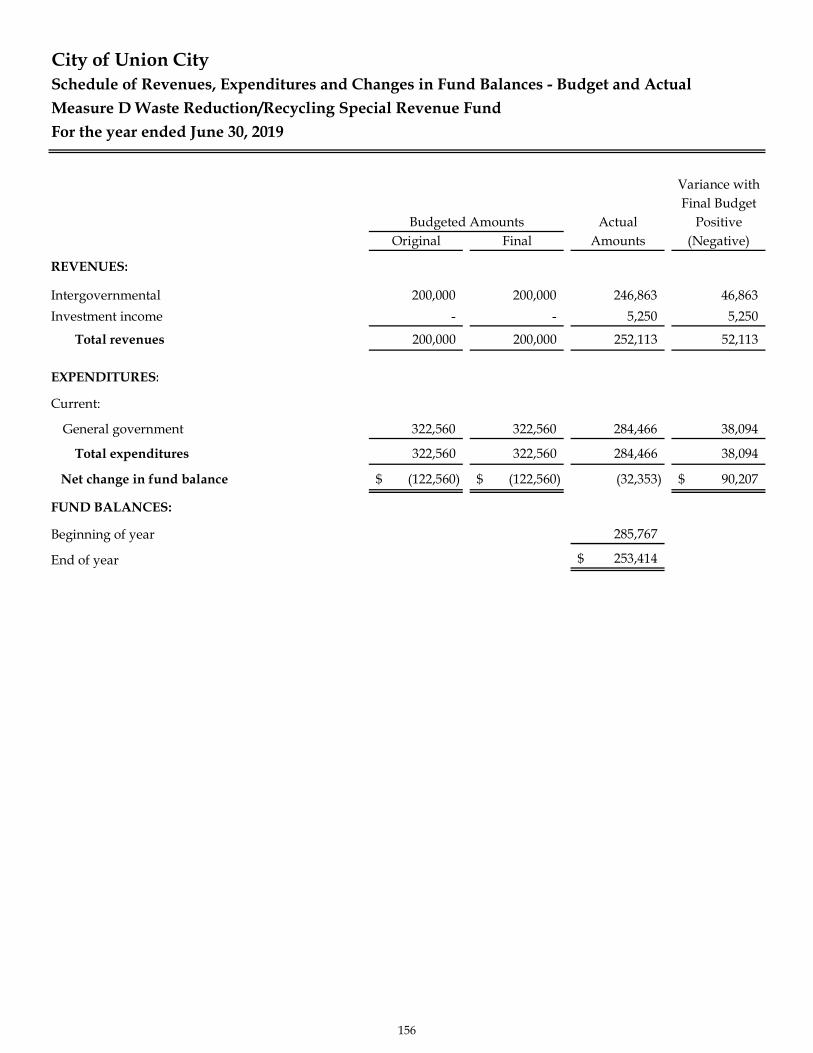
Schedule of Revenues, Expenditures and Changes in Fund Balances - Budget and ActualMeasure D Waste Reduction/Recycling Special Revenue FundFor the year ended June 30, 2019
Variance withFinal Budget
Actual PositiveOriginal Final Amounts (Negative)
REVENUES:
Intergovernmental 200,000 200,000 246,863 46,863Investment income - - 5,250 5,250
Total revenues 200,000 200,000 252,113 52,113
EXPENDITURES:
Current:
General government 322,560 322,560 284,466 38,094
Total expenditures 322,560 322,560 284,466 38,094
Net change in fund balance (122,560)$ (122,560)$ (32,353) 90,207$
FUND BALANCES:
Beginning of year 285,767
End of year 253,414$
City of Union City
Budgeted Amounts
156
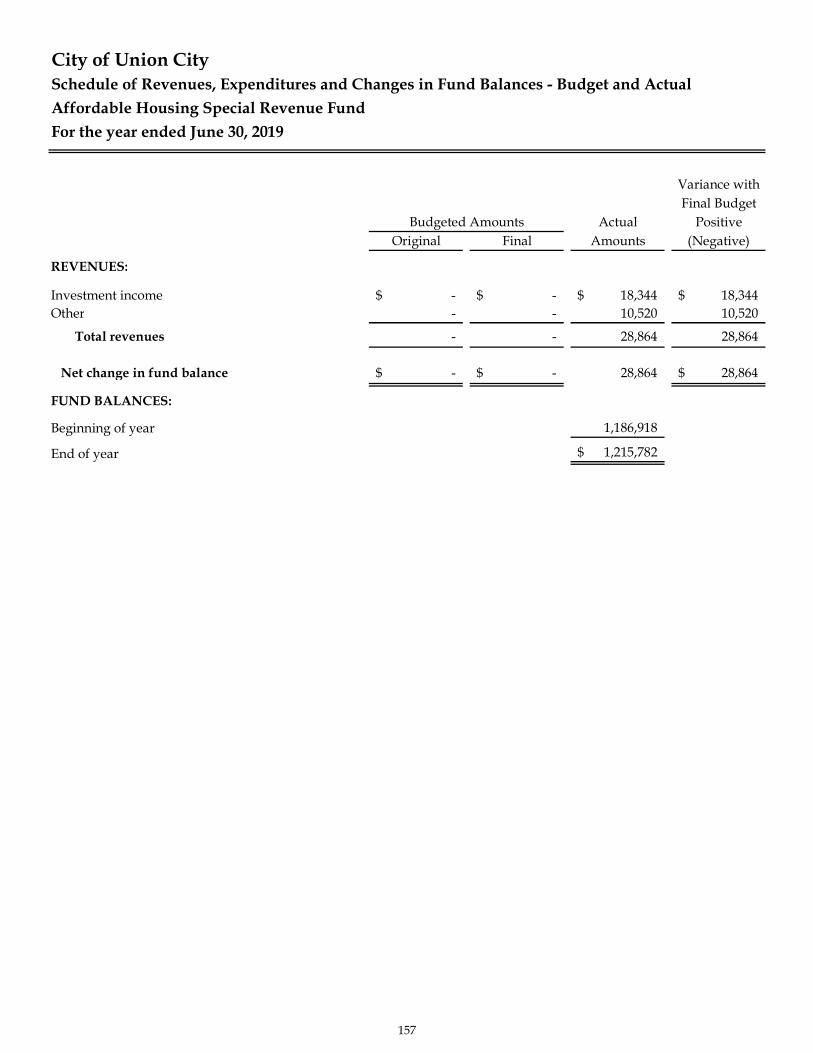
Schedule of Revenues, Expenditures and Changes in Fund Balances - Budget and ActualAffordable Housing Special Revenue FundFor the year ended June 30, 2019
Variance withFinal Budget
Actual PositiveOriginal Final Amounts (Negative)
REVENUES:
Investment income -$ -$ 18,344$ 18,344$ Other - - 10,520 10,520
Total revenues - - 28,864 28,864
Net change in fund balance -$ -$ 28,864 28,864$
FUND BALANCES:
Beginning of year 1,186,918
End of year 1,215,782$
City of Union City
Budgeted Amounts
157

Schedule of Revenues, Expenditures and Changes in Fund Balances - Budget and ActualPublic Art Special Revenue FundFor the year ended June 30, 2019
Variance withFinal Budget
Actual PositiveOriginal Final Amounts (Negative)
REVENUES:
Taxes and special assessments 998,000$ 998,000$ 109,144$ (888,856)$ Investment income - - 21,798 21,798
Total revenues 998,000 998,000 130,942 (867,058)
EXPENDITURES:
Current:
Housing and community development - 223,313 - 223,313
Total expenditures - 382,113 - 382,113
Net change in fund balance 998,000$ 615,887$ 130,942 (484,945)$
FUND BALANCES:
Beginning of year 704,692
End of year 835,634$
City of Union City
Budgeted Amounts
158
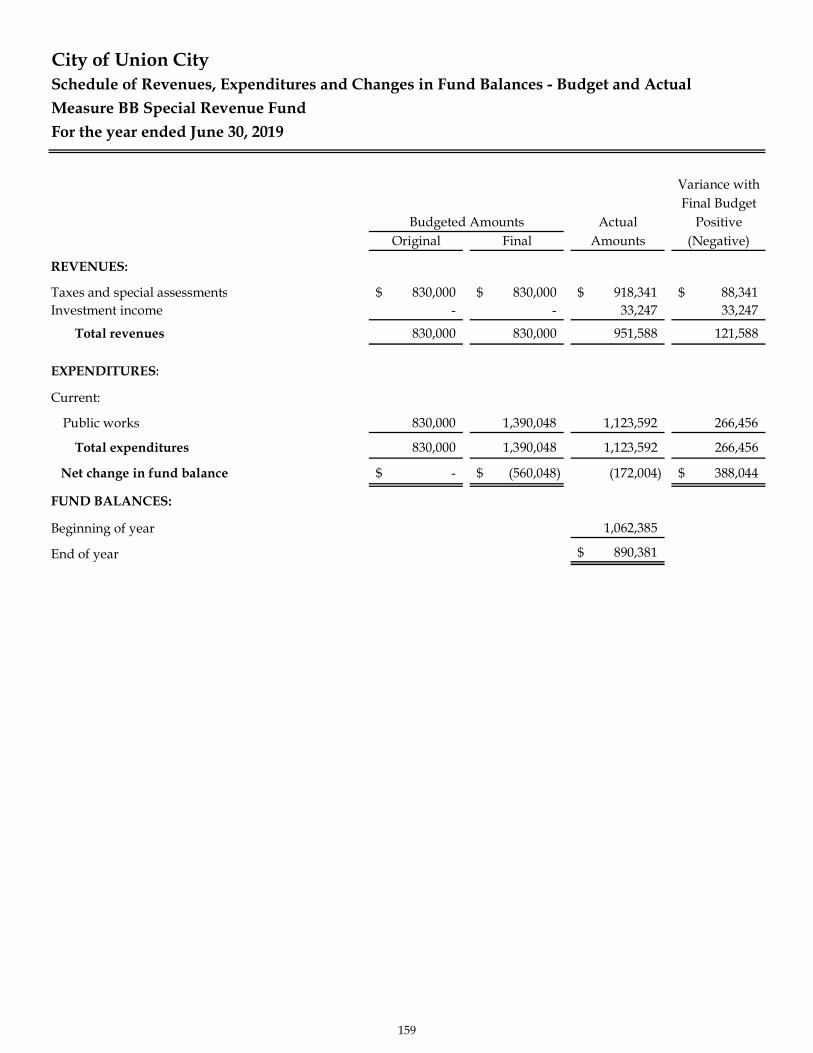
Schedule of Revenues, Expenditures and Changes in Fund Balances - Budget and ActualMeasure BB Special Revenue FundFor the year ended June 30, 2019
Variance withFinal Budget
Actual PositiveOriginal Final Amounts (Negative)
REVENUES:
Taxes and special assessments 830,000$ 830,000$ 918,341$ 88,341$ Investment income - - 33,247 33,247
Total revenues 830,000 830,000 951,588 121,588
EXPENDITURES:
Current:
Public works 830,000 1,390,048 1,123,592 266,456
Total expenditures 830,000 1,390,048 1,123,592 266,456
Net change in fund balance -$ (560,048)$ (172,004) 388,044$
FUND BALANCES:
Beginning of year 1,062,385
End of year 890,381$
City of Union City
Budgeted Amounts
159
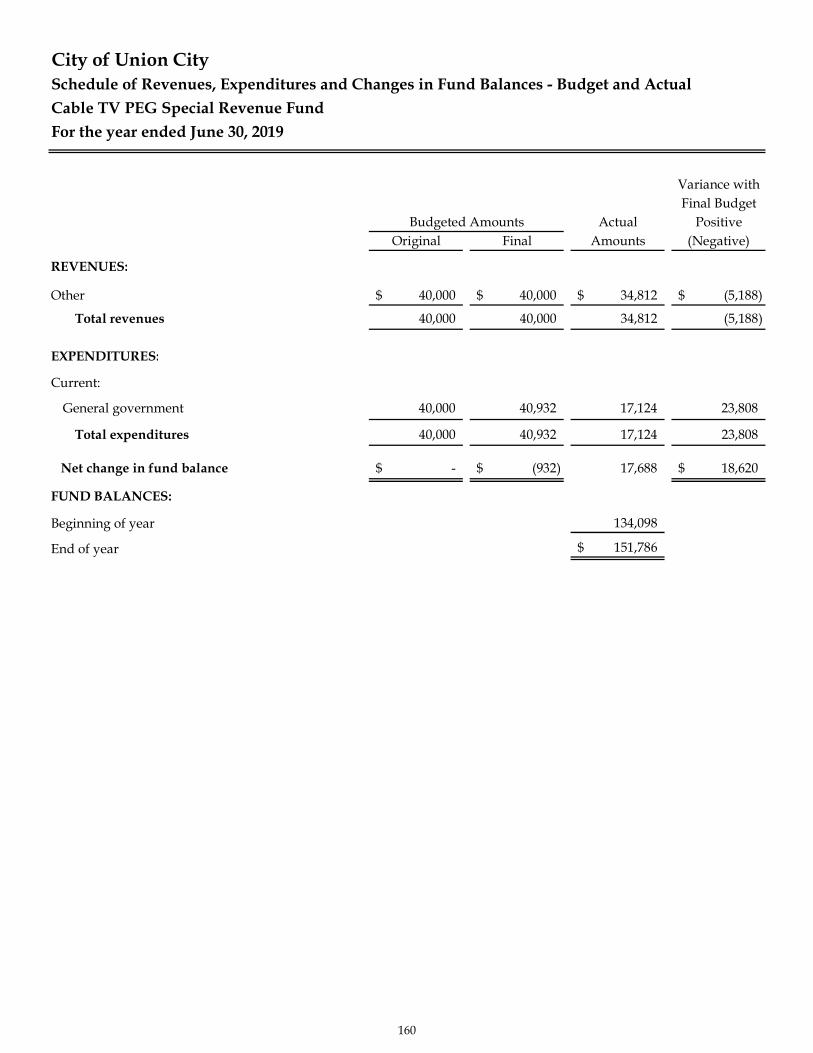
Schedule of Revenues, Expenditures and Changes in Fund Balances - Budget and ActualCable TV PEG Special Revenue FundFor the year ended June 30, 2019
Variance withFinal Budget
Actual PositiveOriginal Final Amounts (Negative)
REVENUES:
Other 40,000$ 40,000$ 34,812$ (5,188)$
Total revenues 40,000 40,000 34,812 (5,188)
EXPENDITURES:
Current:
General government 40,000 40,932 17,124 23,808
Total expenditures 40,000 40,932 17,124 23,808
Net change in fund balance -$ (932)$ 17,688 18,620$
FUND BALANCES:
Beginning of year 134,098
End of year 151,786$
City of Union City
Budgeted Amounts
160

Schedule of Revenues, Expenditures and Changes in Fund Balances - Budget and ActualRent Mediation/Eviction Protection Special Revenue FundFor the year ended June 30, 2019
Variance withFinal Budget
Actual PositiveOriginal Final Amounts (Negative)
REVENUES:
Charges for services -$ -$ 151,049$ 151,049$
Total revenues - - 151,049 151,049
EXPENDITURES:
Current:
General government 18,000 18,000 14,180 3,820
Housing and community development 61,140 61,140 20,089 41,051
Economic and community development 122,125 242,952 19,535 223,417
Total expenditures 201,265 322,092 53,804 268,288
Net change in fund balance (201,265)$ (322,092)$ 97,245 419,337$
FUND BALANCES:
Beginning of year 75,571
End of year 172,816$
City of Union City
Budgeted Amounts
161

Schedule of Revenues, Expenditures and Changes in Fund Balances - Budget and ActualTraffic Congestion FundFor the year ended June 30, 2019
Variance withFinal Budget
Actual PositiveOriginal Final Amounts (Negative)
REVENUES:
Intergovernmental -$ -$ 82,312$ 82,312$ Investment income - - 3,312 3,312
Total revenues - - 85,624 85,624
Net change in fund balance -$ -$ 85,624 85,624$
FUND BALANCES:
Beginning of year 83,763
End of year 169,387$
City of Union City
Budgeted Amounts
162

Schedule of Revenues, Expenditures and Changes in Fund Balances - Budget and ActualSB 1 Maintenance & Rehab FundFor the year ended June 30, 2019
Variance withFinal Budget
Actual PositiveOriginal Final Amounts (Negative)
REVENUES:
Intergovernmental -$ -$ 1,338,523$ 1,338,523$ Investment income - - 18,933 18,933
Total revenues - - 1,357,456 1,357,456
EXPENDITURES:
Current:
Public works - 1,016,558 448,216 568,342
Total expenditures - 1,016,558 448,216 568,342
Net change in fund balance -$ (1,016,558)$ 909,240 1,925,798$
FUND BALANCES:
Beginning of year 209,971
End of year 1,119,211$
City of Union City
Budgeted Amounts
163
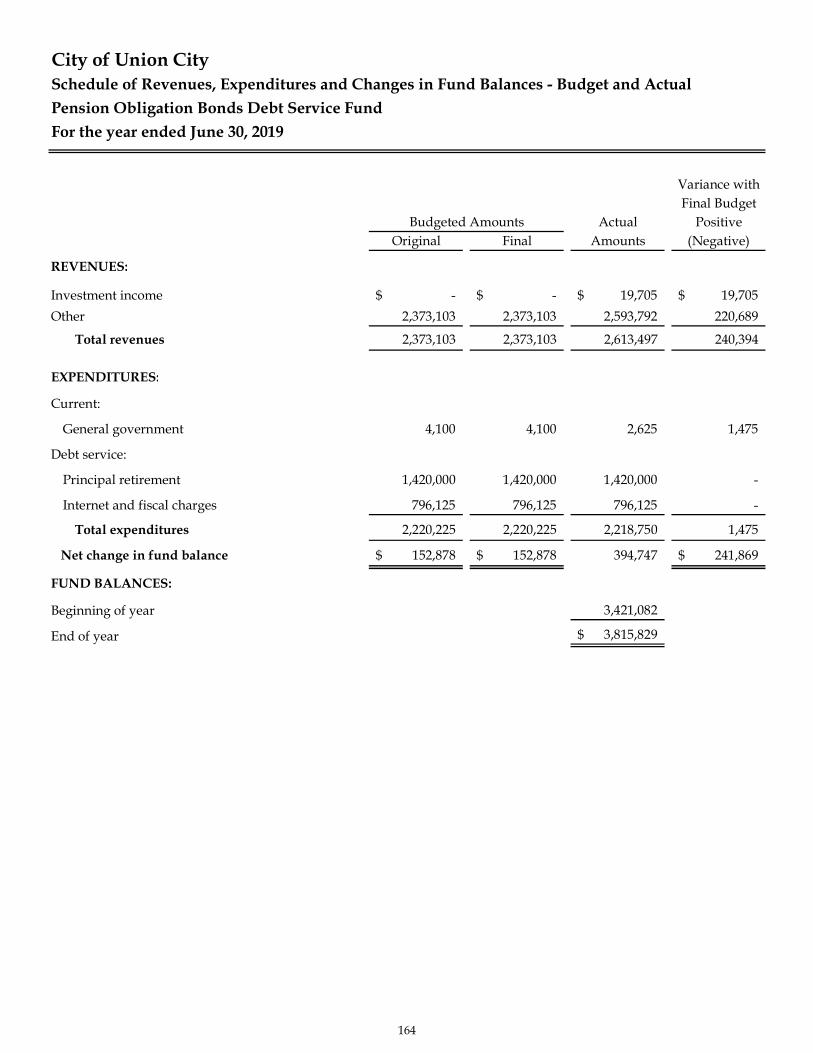
Schedule of Revenues, Expenditures and Changes in Fund Balances - Budget and ActualPension Obligation Bonds Debt Service FundFor the year ended June 30, 2019
Variance withFinal Budget
Actual PositiveOriginal Final Amounts (Negative)
REVENUES:
Investment income -$ -$ 19,705$ 19,705$ Other 2,373,103 2,373,103 2,593,792 220,689
Total revenues 2,373,103 2,373,103 2,613,497 240,394
EXPENDITURES:
Current:
General government 4,100 4,100 2,625 1,475
Debt service:
Principal retirement 1,420,000 1,420,000 1,420,000 -
Internet and fiscal charges 796,125 796,125 796,125 -
Total expenditures 2,220,225 2,220,225 2,218,750 1,475
Net change in fund balance 152,878$ 152,878$ 394,747 241,869$
FUND BALANCES:
Beginning of year 3,421,082
End of year 3,815,829$
City of Union City
Budgeted Amounts
164
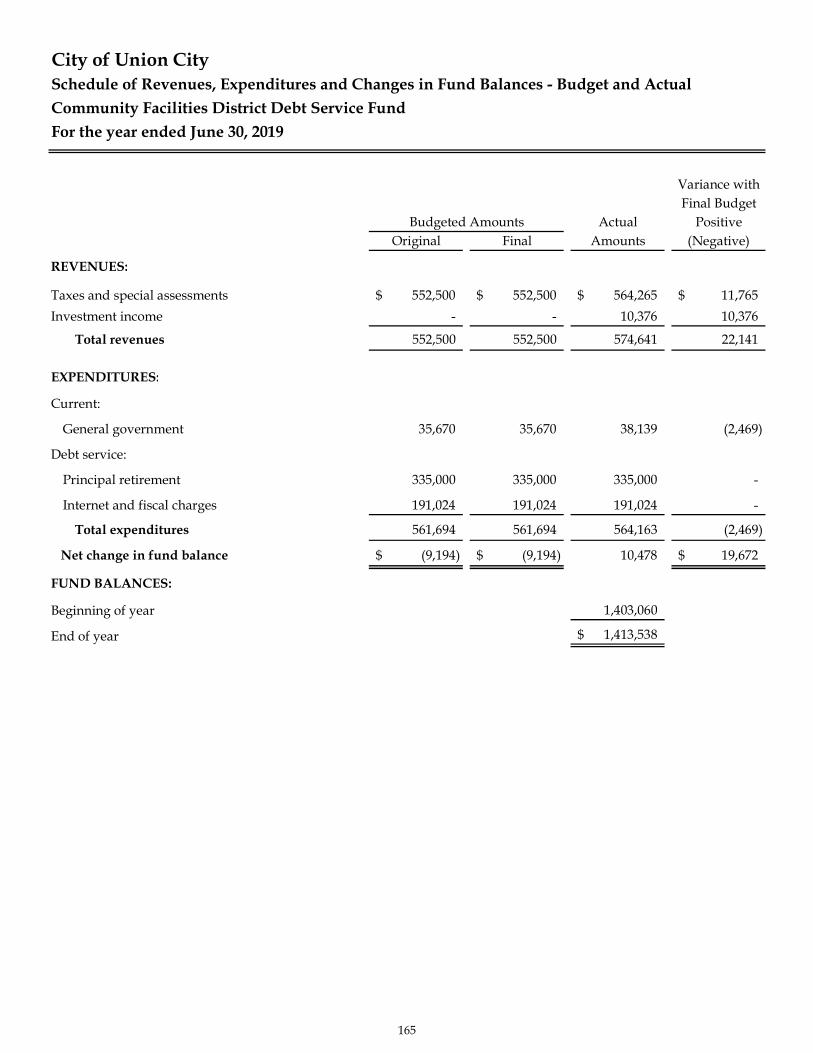
Schedule of Revenues, Expenditures and Changes in Fund Balances - Budget and ActualCommunity Facilities District Debt Service FundFor the year ended June 30, 2019
Variance withFinal Budget
Actual PositiveOriginal Final Amounts (Negative)
REVENUES:
Taxes and special assessments 552,500$ 552,500$ 564,265$ 11,765$ Investment income - - 10,376 10,376
Total revenues 552,500 552,500 574,641 22,141
EXPENDITURES:
Current:
General government 35,670 35,670 38,139 (2,469)
Debt service:
Principal retirement 335,000 335,000 335,000 -
Internet and fiscal charges 191,024 191,024 191,024 -
Total expenditures 561,694 561,694 564,163 (2,469)
Net change in fund balance (9,194)$ (9,194)$ 10,478 19,672$
FUND BALANCES:
Beginning of year 1,403,060
End of year 1,413,538$
City of Union City
Budgeted Amounts
165

This page intentionally left blank.
166
INTERNAL SERVICE FUNDS
Internal Service Funds are used to finance and account for special activities and services performed by adesignated department for other departments in the City on a cost reimbursement basis.
Workers' Compensation Self-InsuranceTo account for disbursement to an independent claims administrator for employees who qualify to receivebenefits under the law. The City has obtained insurance to cover claims exceeding $150,000.
General Liability Self-InsuranceEstablished to account for the processing of general liability premiums and claims by the Bay Cities JointPower Insurance Association. The City has insurance to cover claims exceeding $25,000.
City Garage Operations
To account for the rental of equipment to all City departments and for the accumulation of funds anddisbursements for equipment acquisitions. User charges include an amount necessary for the maintenanceand repair of equipment.
167
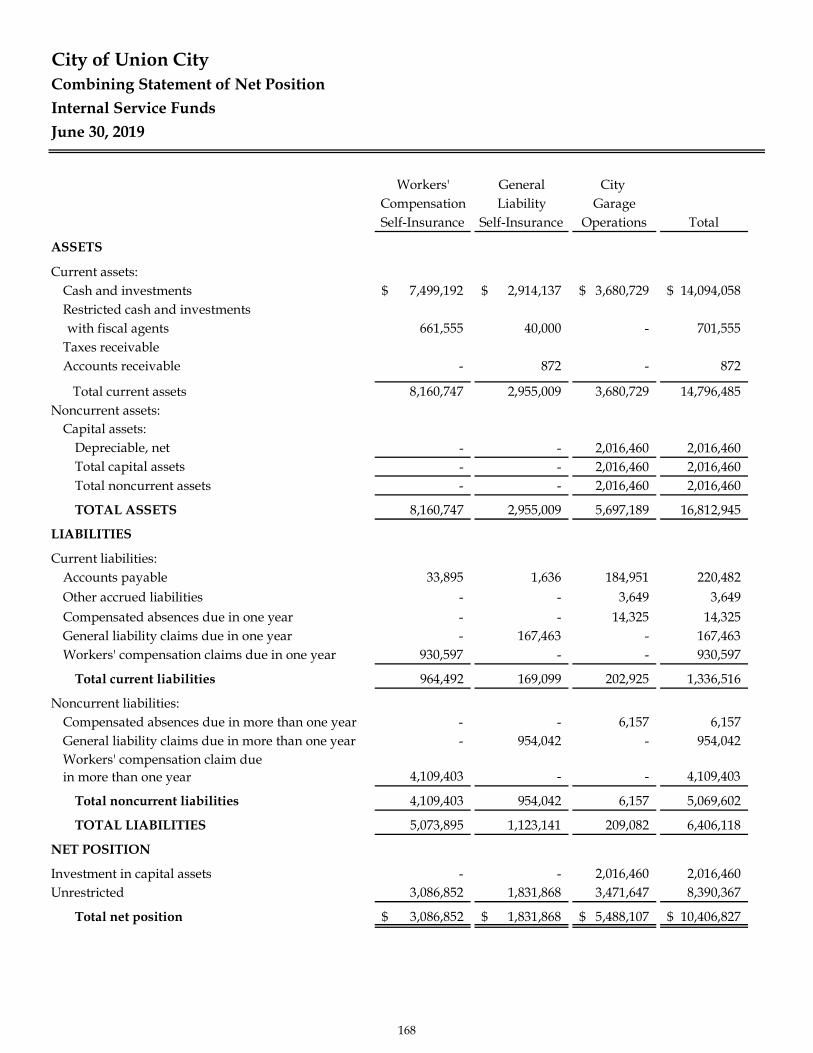
Combining Statement of Net PositionInternal Service FundsJune 30, 2019
Workers' General City Compensation Liability GarageSelf-Insurance Self-Insurance Operations Total
ASSETS
Current assets:Cash and investments 7,499,192$ 2,914,137$ 3,680,729$ 14,094,058$ Restricted cash and investmentswith fiscal agents 661,555 40,000 - 701,555
Taxes receivableAccounts receivable - 872 - 872
Total current assets 8,160,747 2,955,009 3,680,729 14,796,485Noncurrent assets:
Capital assets:Depreciable, net - - 2,016,460 2,016,460Total capital assets - - 2,016,460 2,016,460Total noncurrent assets - - 2,016,460 2,016,460
TOTAL ASSETS 8,160,747 2,955,009 5,697,189 16,812,945
LIABILITIES
Current liabilities:Accounts payable 33,895 1,636 184,951 220,482Other accrued liabilities - - 3,649 3,649Compensated absences due in one year - - 14,325 14,325General liability claims due in one year - 167,463 - 167,463Workers' compensation claims due in one year 930,597 - - 930,597
Total current liabilities 964,492 169,099 202,925 1,336,516
Noncurrent liabilities:Compensated absences due in more than one year - - 6,157 6,157General liability claims due in more than one year - 954,042 - 954,042Workers' compensation claim due in more than one year 4,109,403 - - 4,109,403
Total noncurrent liabilities 4,109,403 954,042 6,157 5,069,602
TOTAL LIABILITIES 5,073,895 1,123,141 209,082 6,406,118
NET POSITION
Investment in capital assets - - 2,016,460 2,016,460Unrestricted 3,086,852 1,831,868 3,471,647 8,390,367
Total net position 3,086,852$ 1,831,868$ 5,488,107$ 10,406,827$
City of Union City
168
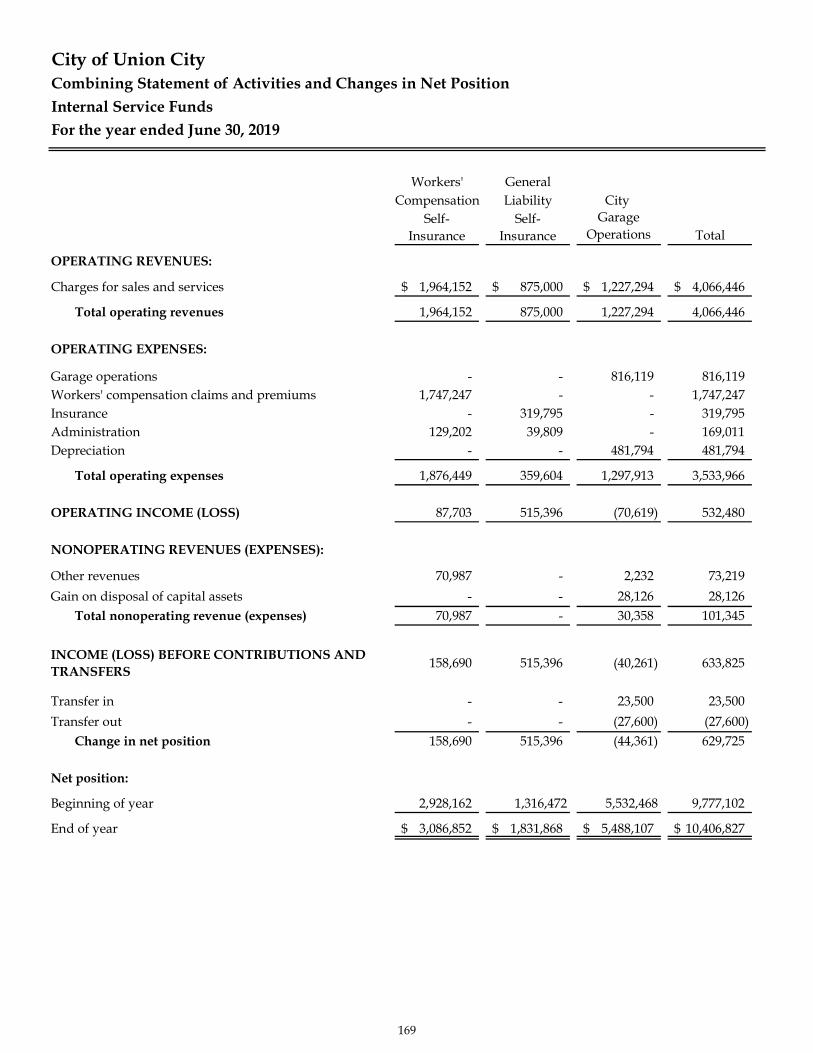
Combining Statement of Activities and Changes in Net PositionInternal Service FundsFor the year ended June 30, 2019
Workers' GeneralCompensation Liability City
Self-Insurance
Self-Insurance
Garage Operations Total
OPERATING REVENUES:
Charges for sales and services 1,964,152$ 875,000$ 1,227,294$ 4,066,446$
Total operating revenues 1,964,152 875,000 1,227,294 4,066,446
OPERATING EXPENSES:
Garage operations - - 816,119 816,119Workers' compensation claims and premiums 1,747,247 - - 1,747,247Insurance - 319,795 - 319,795Administration 129,202 39,809 - 169,011Depreciation - - 481,794 481,794
Total operating expenses 1,876,449 359,604 1,297,913 3,533,966
OPERATING INCOME (LOSS) 87,703 515,396 (70,619) 532,480
NONOPERATING REVENUES (EXPENSES):
Other revenues 70,987 - 2,232 73,219Gain on disposal of capital assets - - 28,126 28,126
Total nonoperating revenue (expenses) 70,987 - 30,358 101,345
INCOME (LOSS) BEFORE CONTRIBUTIONS AND TRANSFERS 158,690 515,396 (40,261) 633,825
Transfer in - - 23,500 23,500Transfer out - - (27,600) (27,600)
Change in net position 158,690 515,396 (44,361) 629,725
Net position:
Beginning of year 2,928,162 1,316,472 5,532,468 9,777,102
End of year 3,086,852$ 1,831,868$ 5,488,107$ 10,406,827$
City of Union City
169
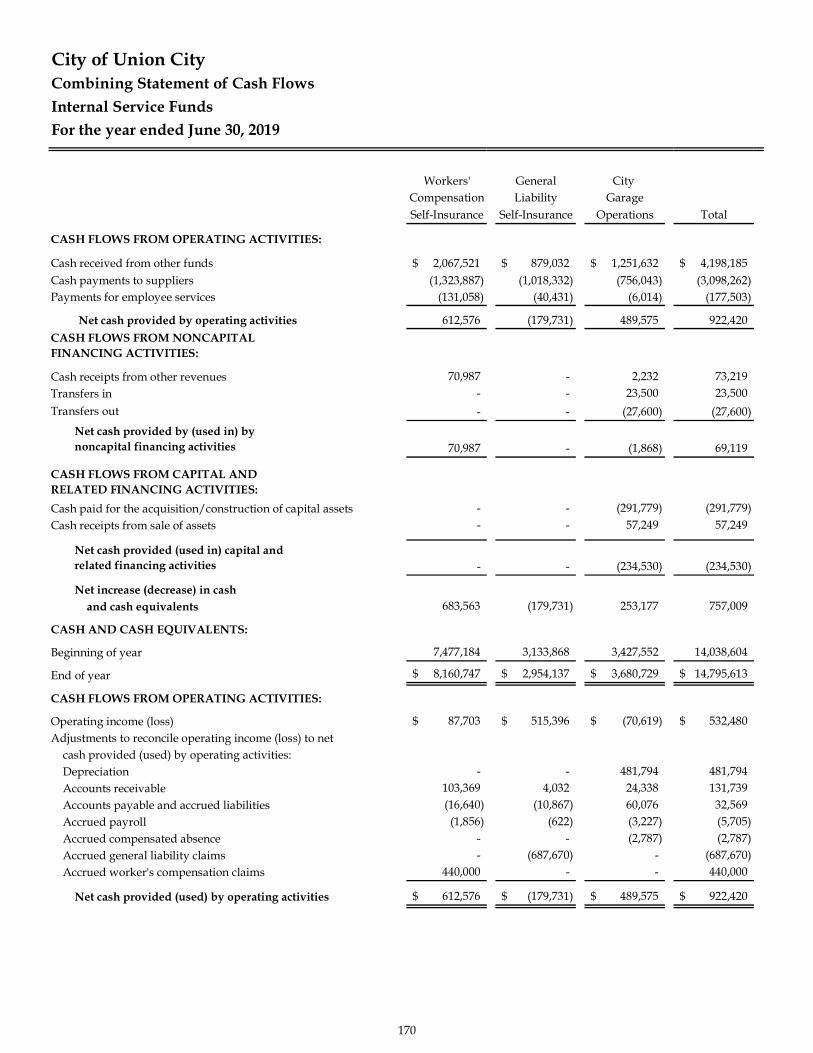
Combining Statement of Cash FlowsInternal Service FundsFor the year ended June 30, 2019
Workers' General City Compensation Liability GarageSelf-Insurance Self-Insurance Operations Total
CASH FLOWS FROM OPERATING ACTIVITIES:
Cash received from other funds 2,067,521$ 879,032$ 1,251,632$ 4,198,185$ Cash payments to suppliers (1,323,887) (1,018,332) (756,043) (3,098,262)Payments for employee services (131,058) (40,431) (6,014) (177,503)
Net cash provided by operating activities 612,576 (179,731) 489,575 922,420CASH FLOWS FROM NONCAPITALFINANCING ACTIVITIES:
Cash receipts from other revenues 70,987 - 2,232 73,219Transfers in - - 23,500 23,500Transfers out - - (27,600) (27,600)
Net cash provided by (used in) bynoncapital financing activities 70,987 - (1,868) 69,119
CASH FLOWS FROM CAPITAL ANDRELATED FINANCING ACTIVITIES:Cash paid for the acquisition/construction of capital assets - - (291,779) (291,779)Cash receipts from sale of assets - - 57,249 57,249
Net cash provided (used in) capital andrelated financing activities - - (234,530) (234,530)
Net increase (decrease) in cash and cash equivalents 683,563 (179,731) 253,177 757,009
CASH AND CASH EQUIVALENTS:
Beginning of year 7,477,184 3,133,868 3,427,552 14,038,604
End of year 8,160,747$ 2,954,137$ 3,680,729$ 14,795,613$
CASH FLOWS FROM OPERATING ACTIVITIES:
Operating income (loss) 87,703$ 515,396$ (70,619)$ 532,480$ Adjustments to reconcile operating income (loss) to net
cash provided (used) by operating activities:Depreciation - - 481,794 481,794Accounts receivable 103,369 4,032 24,338 131,739Accounts payable and accrued liabilities (16,640) (10,867) 60,076 32,569Accrued payroll (1,856) (622) (3,227) (5,705)Accrued compensated absence - - (2,787) (2,787)Accrued general liability claims - (687,670) - (687,670)Accrued worker's compensation claims 440,000 - - 440,000
Net cash provided (used) by operating activities 612,576$ (179,731)$ 489,575$ 922,420$
City of Union City
170
COMBINING FIDUCIARY FUND FINANCIAL STATEMENTS
Resources held ad administered by the City when acting in a fiduciary capacity for other organization orgovernments are accounted for in fiduciary funds. The activities of these funds are excluded from thegovernment-wide financial statements. The City's reports activity in the following funds:
Pension and Other Postemployment Benefits Funds
POA Retiree Medical Fund
To account for funds held by the City to fund the post-retirement healthcare benefits for eligible members ofthe Police Officers Association.
OPEB Trust FundTo account for funds held in the City's PARS (Public Agency Retirement Services) 115 Trust to fund the post-employment healthcare benefits for eligible City employees.
Pension Trust FundTo account for funds held in the City's PARS (Public Agency Retirement Services) Trust Fund for future funding of pension benefits.
171
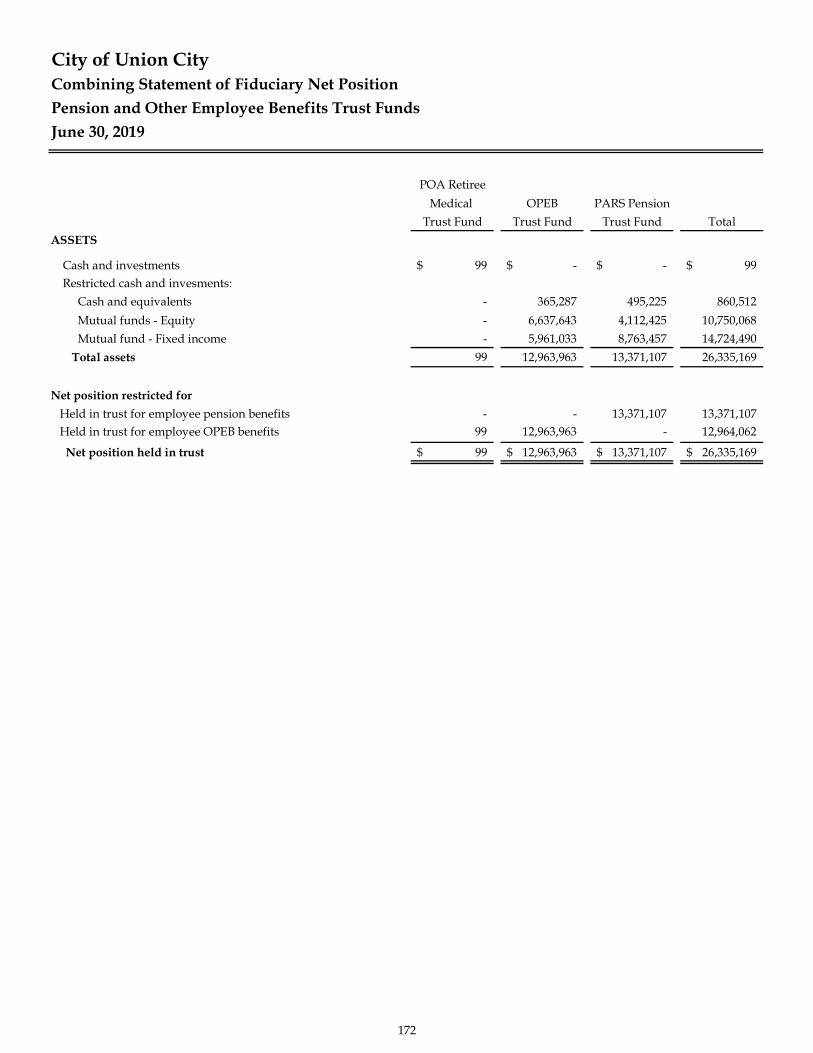
Combining Statement of Fiduciary Net PositionPension and Other Employee Benefits Trust FundsJune 30, 2019
POA RetireeMedical OPEB PARS Pension
Trust Fund Trust Fund Trust Fund TotalASSETS
Cash and investments 99$ -$ -$ 99$ Restricted cash and invesments:
Cash and equivalents - 365,287 495,225 860,512Mutual funds - Equity - 6,637,643 4,112,425 10,750,068Mutual fund - Fixed income - 5,961,033 8,763,457 14,724,490
Total assets 99 12,963,963 13,371,107 26,335,169
Net position restricted for Held in trust for employee pension benefits - - 13,371,107 13,371,107Held in trust for employee OPEB benefits 99 12,963,963 - 12,964,062
Net position held in trust 99$ 12,963,963$ 13,371,107$ 26,335,169$
City of Union City
172
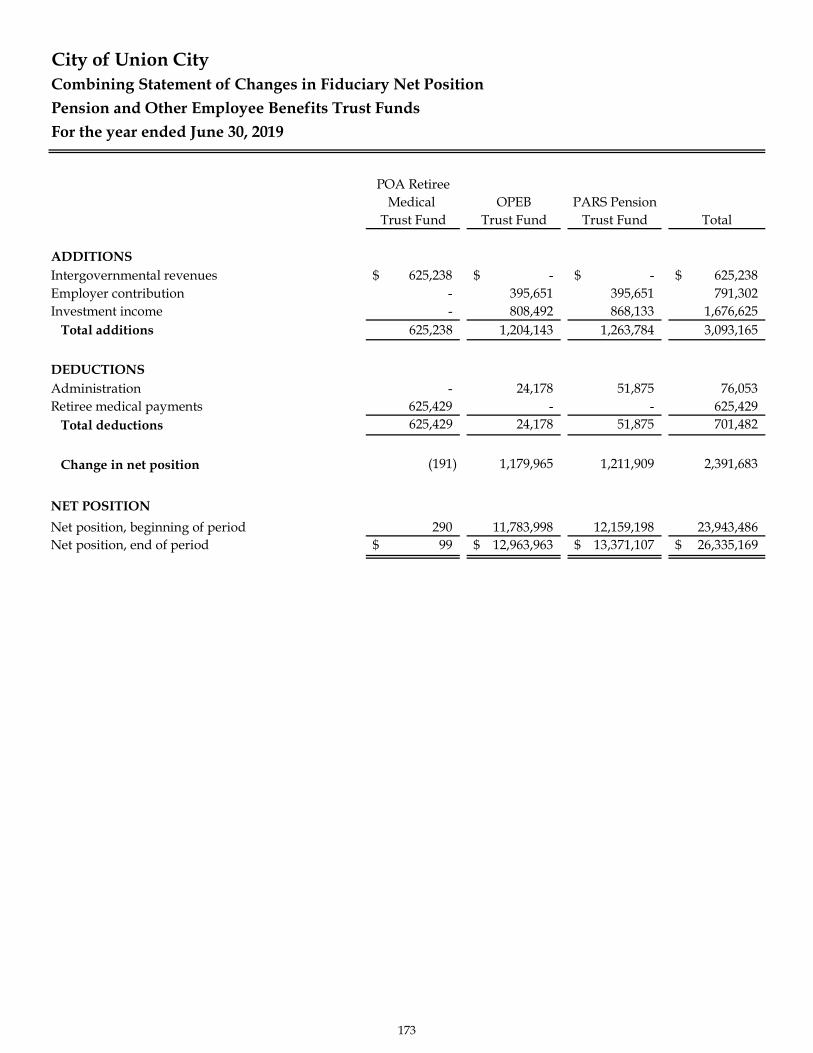
Combining Statement of Changes in Fiduciary Net PositionPension and Other Employee Benefits Trust FundsFor the year ended June 30, 2019
POA RetireeMedical OPEB PARS Pension
Trust Fund Trust Fund Trust Fund Total
ADDITIONSIntergovernmental revenues 625,238$ -$ -$ 625,238$ Employer contribution - 395,651 395,651 791,302Investment income - 808,492 868,133 1,676,625 Total additions 625,238 1,204,143 1,263,784 3,093,165
DEDUCTIONSAdministration - 24,178 51,875 76,053Retiree medical payments 625,429 - - 625,429 Total deductions 625,429 24,178 51,875 701,482
Change in net position (191) 1,179,965 1,211,909 2,391,683
NET POSITIONNet position, beginning of period 290 11,783,998 12,159,198 23,943,486Net position, end of period 99$ 12,963,963$ 13,371,107$ 26,335,169$
City of Union City
173

This page intentionally left blank.
174
General FundThe General Fund is used to account for all financial resources except those required to be accountedfor in another fund.Included in the General Fund , for reporting purposes, are funds that had been reported as specialrevenue funds prior to the implementation of GASB 54. The primary revenue source of these fundsare neither restricted nor committed.
Payroll Fund used to account and for payroll related expenditures of the City.
Trust/Agency Fund used to account for miscellanous collections/payments.
Post-Employment Medical Benefits Fund used to pay for expenses related to post-employmentbenefits other than pension plans.
Fire Equipment Acquisition Fund to account for monies received from developers of commercialproperties and certain residential structures to be used for the acquisition of fire equipment.
Leisure Revolving Fund to account for participant-paid activities offered through Leisure Servicesprograms.
Allied Waste Vehicle Impact Fund to account for activities that mitigate the impact of heavy trashcollection vehicles on City street.
Code Enforcement Fund to account for activities associated with the remediation of properties inviolation of the City's municipal code. Recovery of costs incurred are made by placing liens on theaffected properties.
Corporation Yard and Fuel Facility Maintenance Fund to account for funds received from outsideagencies for use of the City's Corporation Yard and fueling stations. The revenues collected are tobe used for the maintenance and improvement of these facilities.
175
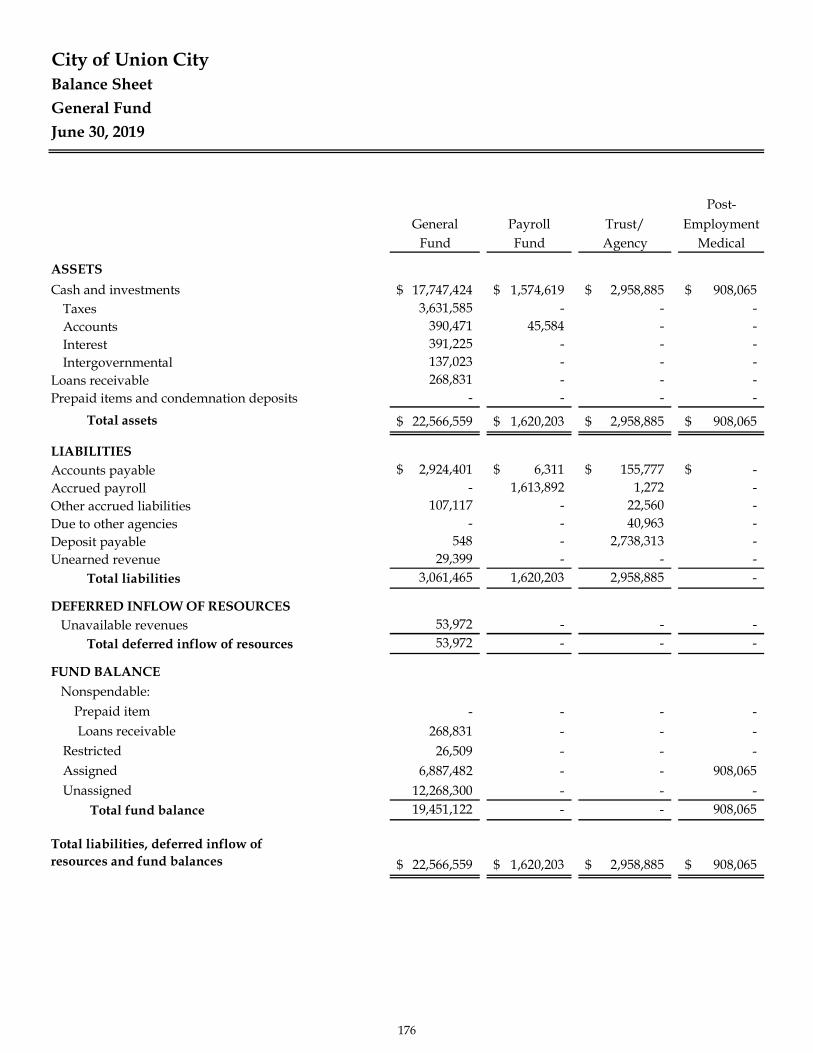
Balance SheetGeneral FundJune 30, 2019
Post-General Payroll Trust/ Employment
Fund Fund Agency Medical
ASSETSCash and investments 17,747,424$ 1,574,619$ 2,958,885$ 908,065$
Taxes 3,631,585 - - -Accounts 390,471 45,584 - -Interest 391,225 - - -Intergovernmental 137,023 - - -
Loans receivable 268,831 - - -Prepaid items and condemnation deposits - - - -
Total assets 22,566,559$ 1,620,203$ 2,958,885$ 908,065$
LIABILITIESAccounts payable 2,924,401$ 6,311$ 155,777$ -$ Accrued payroll - 1,613,892 1,272 -Other accrued liabilities 107,117 - 22,560 -Due to other agencies - - 40,963 -Deposit payable 548 - 2,738,313 -Unearned revenue 29,399 - - -
Total liabilities 3,061,465 1,620,203 2,958,885 -
DEFERRED INFLOW OF RESOURCES Unavailable revenues 53,972 - - -
Total deferred inflow of resources 53,972 - - -
FUND BALANCE Nonspendable: Prepaid item - - - - Loans receivable 268,831 - - -
Restricted 26,509 - - -Assigned 6,887,482 - - 908,065Unassigned 12,268,300 - - -
Total fund balance 19,451,122 - - 908,065
Total liabilities, deferred inflow ofresources and fund balances 22,566,559$ 1,620,203$ 2,958,885$ 908,065$
City of Union City
176

CorporationFire Allied Yard & Total
Equipment Leisure Waste Vehicle Code Fuel Facility GeneralAcquisition Revolving Impact Enforcement Maintenance Fund
121,028$ 1,313,990$ 327,852$ 17,077$ 796,014$ 25,764,954$ - - - - - 3,631,585- - 16,948 - 140,111 593,114- - - - - 391,225- - - - - 137,023- - - - - 268,831- 23,665 - - - 23,665
121,028$ 1,337,655$ 344,800$ 17,077$ 936,125$ 30,810,397$
-$ 25,349$ 193$ -$ 61,283$ 3,173,314$ - - - - - 1,615,164- 42,687 16,070 - 6,764 195,198- - - - - 40,963- 50,953 - - - 2,789,814- 702,436 - - - 731,835- 821,425 16,263 - 68,047 8,546,288
- - - - - 53,972- - - - - 53,972
- 23,665 - - - 23,665- - - - - 268,831- - - - - 26,509
121,028 492,565 328,537 17,077 800,078 9,554,832- - - - 68,000 12,336,300
121,028 516,230 328,537 17,077 868,078 22,210,137
121,028$ 1,337,655$ 344,800$ 17,077$ 936,125$ 30,810,397$
177
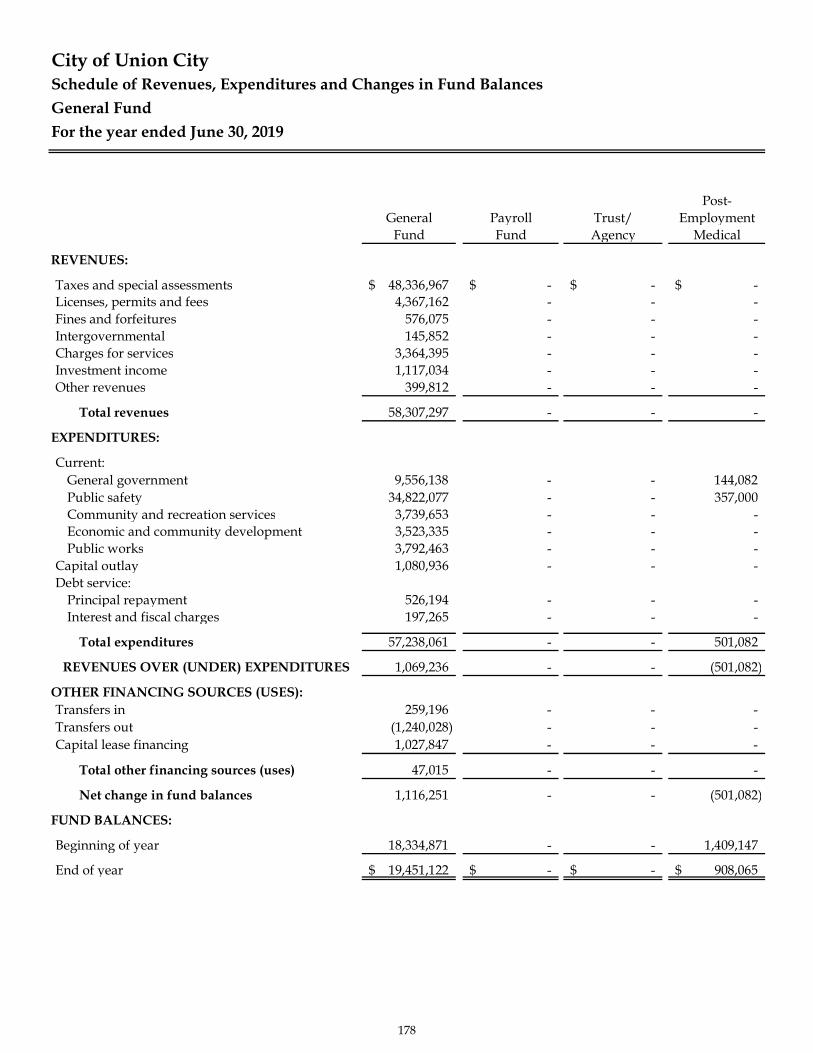
City of Union CitySchedule of Revenues, Expenditures and Changes in Fund BalancesGeneral FundFor the year ended June 30, 2019
Post-General Payroll Trust/ Employment
Fund Fund Agency Medical
REVENUES:
Taxes and special assessments 48,336,967$ -$ -$ -$ Licenses, permits and fees 4,367,162 - - -Fines and forfeitures 576,075 - - -Intergovernmental 145,852 - - -Charges for services 3,364,395 - - -Investment income 1,117,034 - - -Other revenues 399,812 - - -
Total revenues 58,307,297 - - -
EXPENDITURES:
Current:General government 9,556,138 - - 144,082Public safety 34,822,077 - - 357,000Community and recreation services 3,739,653 - - -Economic and community development 3,523,335 - - -Public works 3,792,463 - - -
Capital outlay 1,080,936 - - -Debt service:
Principal repayment 526,194 - - -Interest and fiscal charges 197,265 - - -
Total expenditures 57,238,061 - - 501,082
REVENUES OVER (UNDER) EXPENDITURES 1,069,236 - - (501,082)
OTHER FINANCING SOURCES (USES):Transfers in 259,196 - - -Transfers out (1,240,028) - - -Capital lease financing 1,027,847 - - -
Total other financing sources (uses) 47,015 - - -
Net change in fund balances 1,116,251 - - (501,082)
FUND BALANCES:
Beginning of year 18,334,871 - - 1,409,147
End of year 19,451,122$ -$ -$ 908,065$
178

CorporationFire Allied Yard & Total
Equipment Leisure Waste Vehicle Code Fuel Facility GeneralAcquisition Revolving Impact Enforcement Maintenance Fund
-$ -$ -$ -$ -$ 48,336,967$ - - - - - 4,367,162- - - - - 576,075- - - - - 145,852
30,287 2,408,478 - - 1,465,392 7,268,552- - - - - 1,117,034- 33,137 203,377 - 174,480 810,806
30,287 2,441,615 203,377 - 1,639,872 62,622,448
- - - - - 9,700,220- - - - - 35,179,077- 2,613,627 - - - 6,353,280- 22,190 - - - 3,545,525- - 189,583 - 1,494,441 5,476,487- 33,908 - - - 1,114,844
- - - - 53,826 580,020- - - - 27,627 224,892
- 2,669,725 189,583 - 1,575,894 62,174,345
30,287 (228,110) 13,794 - 63,978 448,103
- - - - 4,100 263,296- - - - - (1,240,028)- - - - - 1,027,847
- - - - 4,100 51,115
30,287 (228,110) 13,794 - 68,078 499,218
90,741 744,340 314,743 17,077 800,000 21,710,919
121,028$ 516,230$ 328,537$ 17,077$ 868,078$ 22,210,137$
179
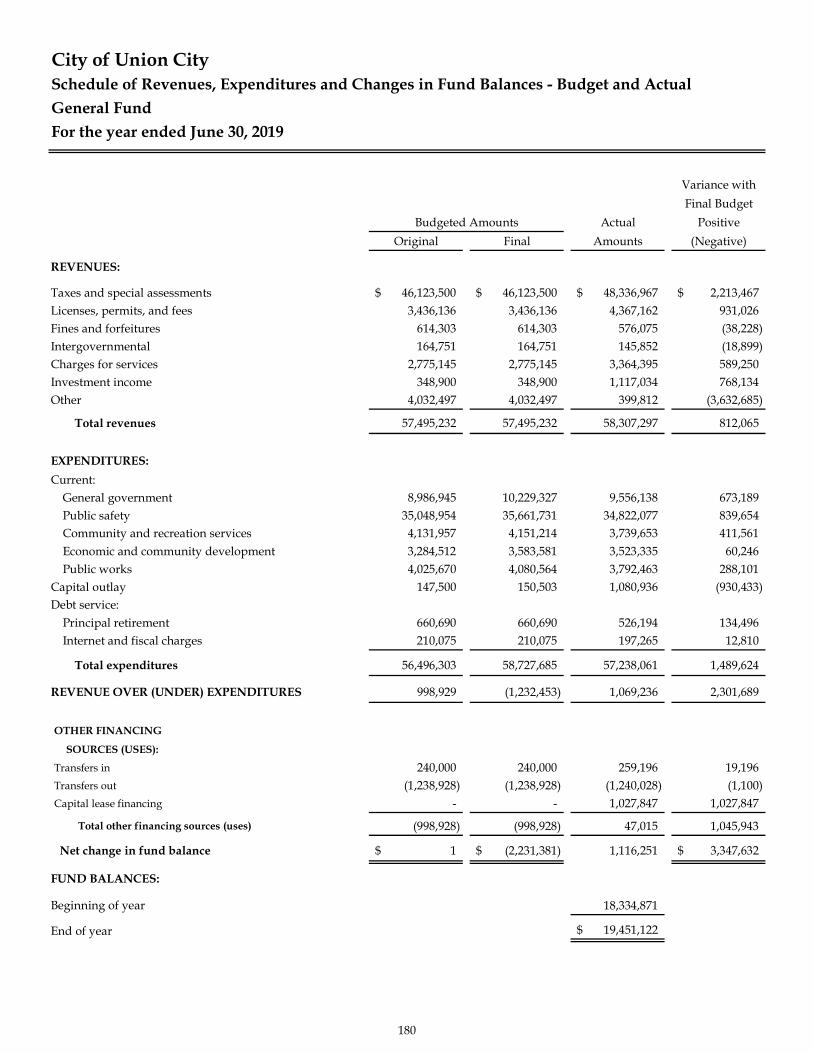
Schedule of Revenues, Expenditures and Changes in Fund Balances - Budget and ActualGeneral FundFor the year ended June 30, 2019
Variance withFinal Budget
Actual PositiveOriginal Final Amounts (Negative)
REVENUES:
Taxes and special assessments 46,123,500$ 46,123,500$ 48,336,967$ 2,213,467$ Licenses, permits, and fees 3,436,136 3,436,136 4,367,162 931,026Fines and forfeitures 614,303 614,303 576,075 (38,228)Intergovernmental 164,751 164,751 145,852 (18,899)Charges for services 2,775,145 2,775,145 3,364,395 589,250Investment income 348,900 348,900 1,117,034 768,134Other 4,032,497 4,032,497 399,812 (3,632,685)
Total revenues 57,495,232 57,495,232 58,307,297 812,065
EXPENDITURES:Current:
General government 8,986,945 10,229,327 9,556,138 673,189Public safety 35,048,954 35,661,731 34,822,077 839,654Community and recreation services 4,131,957 4,151,214 3,739,653 411,561Economic and community development 3,284,512 3,583,581 3,523,335 60,246Public works 4,025,670 4,080,564 3,792,463 288,101
Capital outlay 147,500 150,503 1,080,936 (930,433)Debt service:
Principal retirement 660,690 660,690 526,194 134,496Internet and fiscal charges 210,075 210,075 197,265 12,810
Total expenditures 56,496,303 58,727,685 57,238,061 1,489,624
REVENUE OVER (UNDER) EXPENDITURES 998,929 (1,232,453) 1,069,236 2,301,689
OTHER FINANCING
SOURCES (USES):
Transfers in 240,000 240,000 259,196 19,196Transfers out (1,238,928) (1,238,928) (1,240,028) (1,100)Capital lease financing - - 1,027,847 1,027,847
Total other financing sources (uses) (998,928) (998,928) 47,015 1,045,943
Net change in fund balance 1$ (2,231,381)$ 1,116,251 3,347,632$
FUND BALANCES:
Beginning of year 18,334,871
End of year 19,451,122$
City of Union City
Budgeted Amounts
180
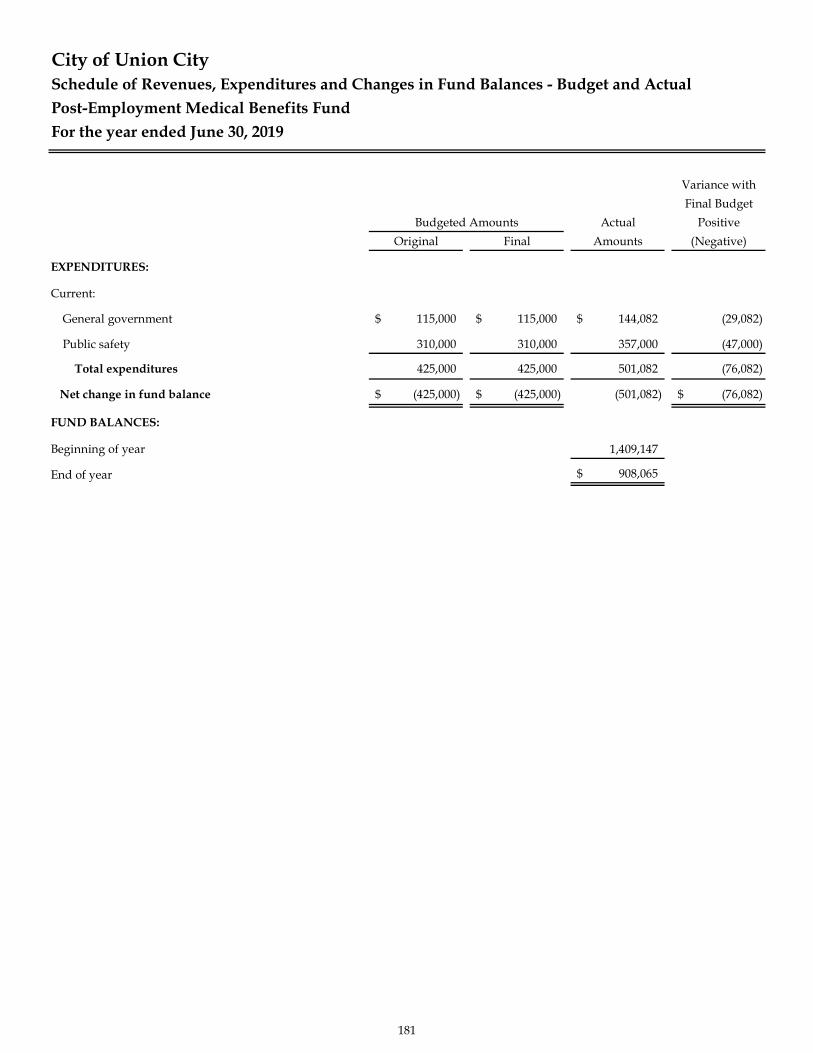
Schedule of Revenues, Expenditures and Changes in Fund Balances - Budget and ActualPost-Employment Medical Benefits FundFor the year ended June 30, 2019
Variance withFinal Budget
Actual PositiveOriginal Final Amounts (Negative)
EXPENDITURES:
Current:
General government 115,000$ 115,000$ 144,082$ (29,082)
Public safety 310,000 310,000 357,000 (47,000)
Total expenditures 425,000 425,000 501,082 (76,082)
Net change in fund balance (425,000)$ (425,000)$ (501,082) (76,082)$
FUND BALANCES:
Beginning of year 1,409,147
End of year 908,065$
City of Union City
Budgeted Amounts
181

Schedule of Revenues, Expenditures and Changes in Fund Balances - Budget and ActualFire Equipment Acquisition FundFor the year ended June 30, 2019
Variance withFinal Budget
Actual PositiveOriginal Final Amounts (Negative)
REVENUES:
Charges for services 332,104$ 332,104$ 30,287$ (301,817)$
Total revenues 332,104 332,104 30,287 (301,817)
EXPENDITURES:
Current:
Capital outlay 100,000 100,000 - 100,000
Total expenditures 100,000 100,000 - 100,000
Net change in fund balance 232,104$ 232,104$ 30,287 (201,817)$
FUND BALANCES:
Beginning of year 90,741
End of year 121,028$
City of Union City
Budgeted Amounts
182
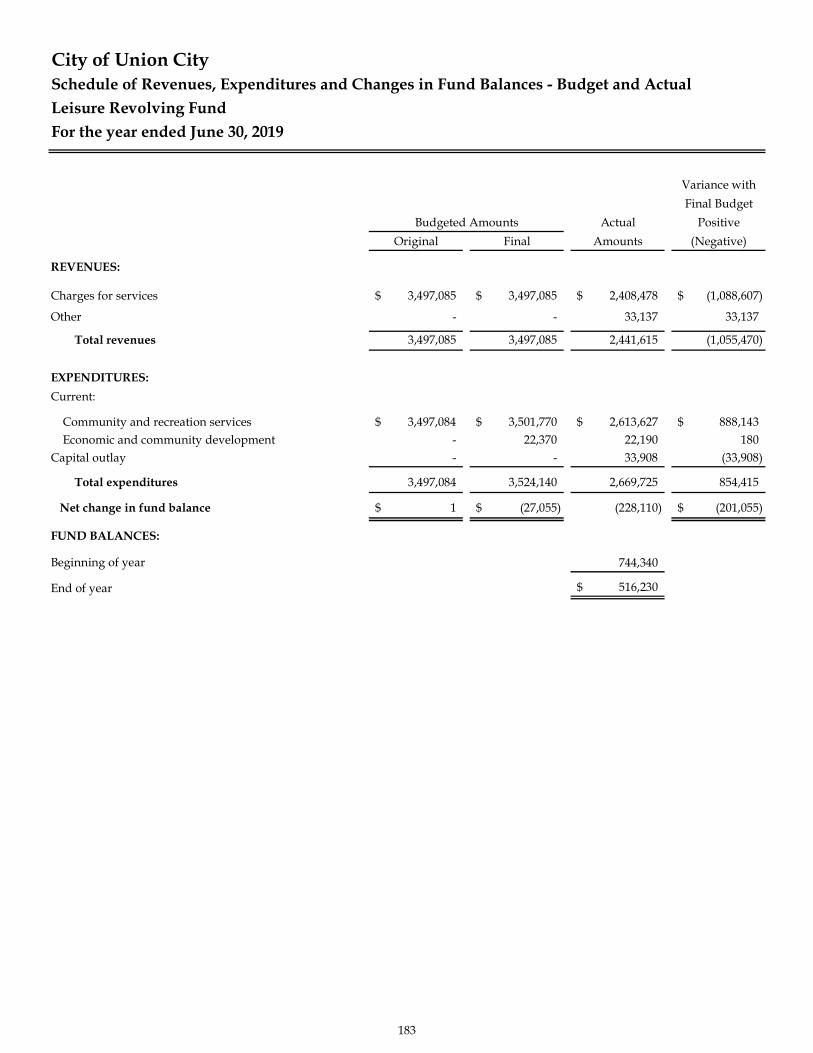
Schedule of Revenues, Expenditures and Changes in Fund Balances - Budget and ActualLeisure Revolving FundFor the year ended June 30, 2019
Variance withFinal Budget
Actual PositiveOriginal Final Amounts (Negative)
REVENUES:
Charges for services 3,497,085$ 3,497,085$ 2,408,478$ (1,088,607)$
Other - - 33,137 33,137
Total revenues 3,497,085 3,497,085 2,441,615 (1,055,470)
EXPENDITURES:Current:
Community and recreation services 3,497,084$ 3,501,770$ 2,613,627$ 888,143$ Economic and community development - 22,370 22,190 180
Capital outlay - - 33,908 (33,908)
Total expenditures 3,497,084 3,524,140 2,669,725 854,415
Net change in fund balance 1$ (27,055)$ (228,110) (201,055)$
FUND BALANCES:
Beginning of year 744,340
End of year 516,230$
City of Union City
Budgeted Amounts
183

Schedule of Revenues, Expenditures and Changes in Fund Balances - Budget and ActualAllied Waste Vehicle Impact FundFor the year ended June 30, 2019
Variance withFinal Budget
Actual PositiveOriginal Final Amounts (Negative)
REVENUES:
Other 200,000$ 200,000$ 203,377$ 3,377$
Total revenues 200,000 200,000 203,377 3,377
EXPENDITURES:
Current:
Public works 200,000 345,834 189,583 156,251
Total expenditures 200,000 345,834 189,583 156,251
Net change in fund balance -$ (145,834)$ 13,794 159,628$
FUND BALANCES:
Beginning of year 314,743
End of year 328,537$
City of Union City
Budgeted Amounts
184
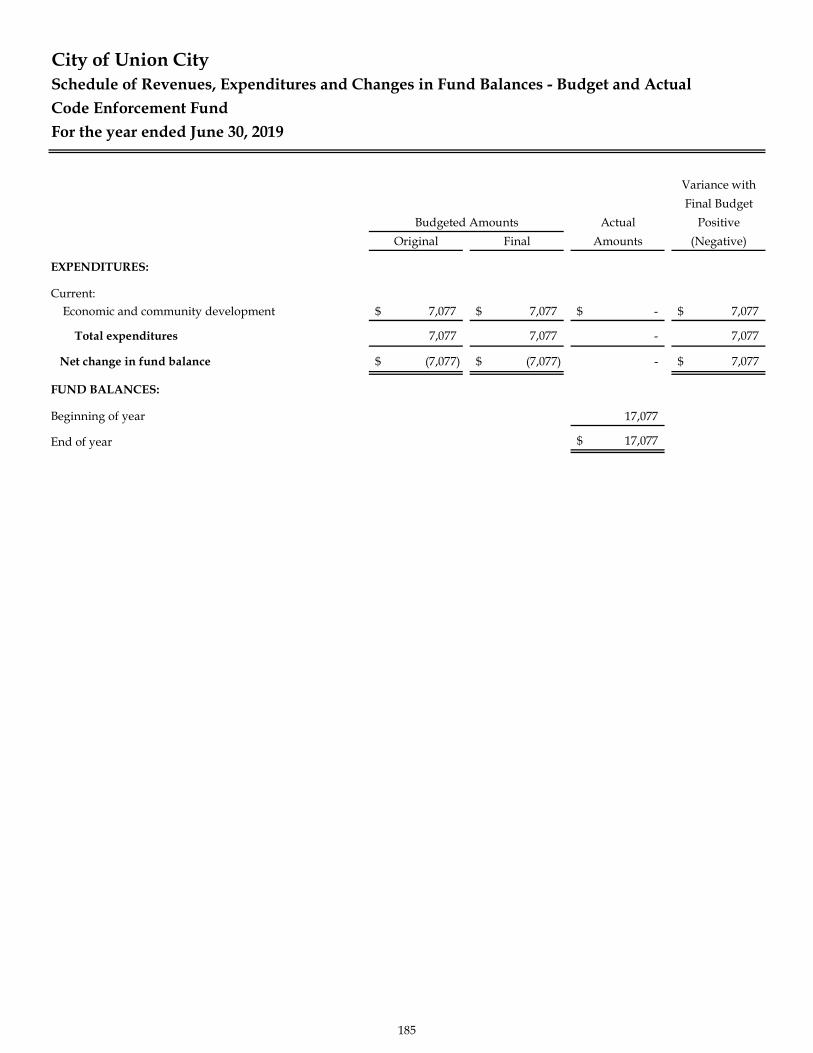
Schedule of Revenues, Expenditures and Changes in Fund Balances - Budget and ActualCode Enforcement FundFor the year ended June 30, 2019
Variance withFinal Budget
Actual PositiveOriginal Final Amounts (Negative)
EXPENDITURES:
Current:Economic and community development 7,077$ 7,077$ -$ 7,077$
Total expenditures 7,077 7,077 - 7,077
Net change in fund balance (7,077)$ (7,077)$ - 7,077$
FUND BALANCES:
Beginning of year 17,077
End of year 17,077$
City of Union City
Budgeted Amounts
185
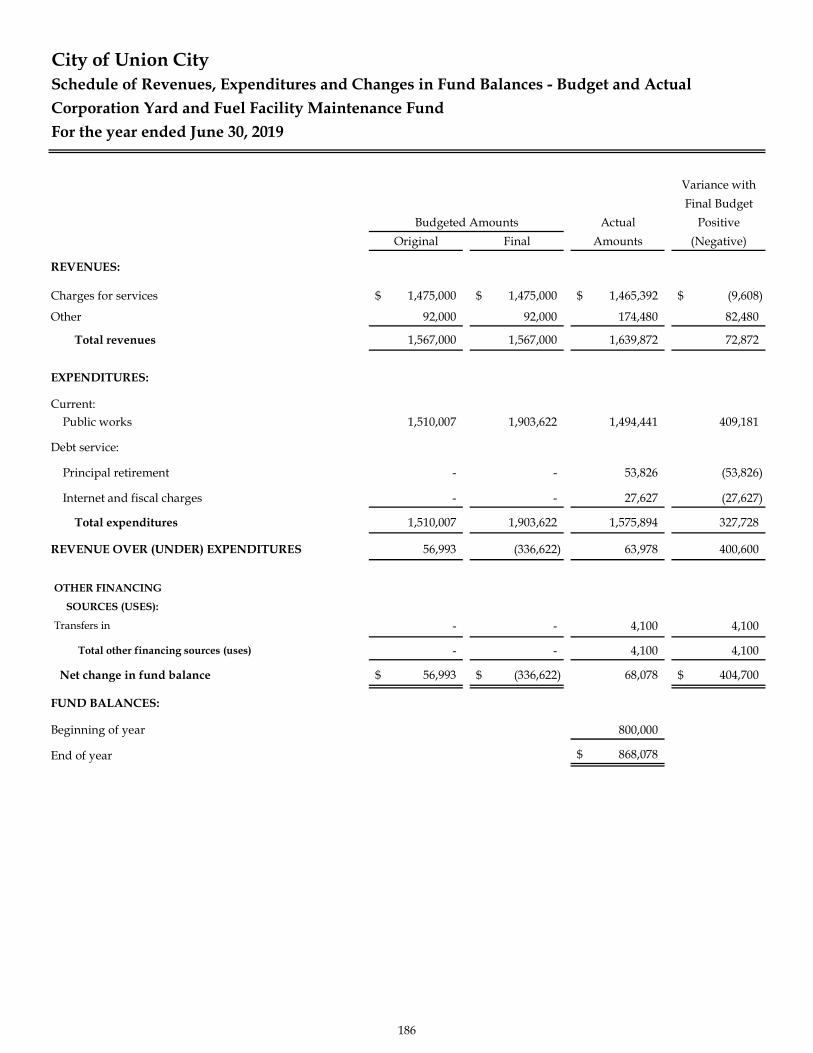
Schedule of Revenues, Expenditures and Changes in Fund Balances - Budget and ActualCorporation Yard and Fuel Facility Maintenance FundFor the year ended June 30, 2019
Variance withFinal Budget
Actual PositiveOriginal Final Amounts (Negative)
REVENUES:
Charges for services 1,475,000$ 1,475,000$ 1,465,392$ (9,608)$
Other 92,000 92,000 174,480 82,480
Total revenues 1,567,000 1,567,000 1,639,872 72,872
EXPENDITURES:
Current:Public works 1,510,007 1,903,622 1,494,441 409,181
Debt service:
Principal retirement - - 53,826 (53,826)
Internet and fiscal charges - - 27,627 (27,627)
Total expenditures 1,510,007 1,903,622 1,575,894 327,728
REVENUE OVER (UNDER) EXPENDITURES 56,993 (336,622) 63,978 400,600
OTHER FINANCING
SOURCES (USES):
Transfers in - - 4,100 4,100
Total other financing sources (uses) - - 4,100 4,100
Net change in fund balance 56,993$ (336,622)$ 68,078 404,700$
FUND BALANCES:
Beginning of year 800,000
End of year 868,078$
City of Union City
Budgeted Amounts
186
STATISTICAL SECTION INTRODUCTION
This part of the City of Union City’s Comprehensive Annual Financial Report presents detailed informationas a context for understanding what the information says about the City’s overall financial health.
Contents
Financial Trends InformationThis information is intended to assist users in understanding and assessing how a government’s financial position has changed over time.
Revenue Capacity InformationThis information is intended to assist users in understanding and assessing factors affecting a government’s ability to generate its own revenue.
Debt Capacity InformationThis information is intended to assist users in understanding and assessing a government’s debt burden and its ability to issue additional debt.
Demographic and Economic InformationThis information is intended to assist users in understanding socioeconomic environment with which a government operates and provide information that facilitates comparison of financial statement information over time and among governments.
Operating InformationThis information is intended to provide information about operations and resources to assist readers in using financial statement information to understand and asses a government’s economic condition.
187

This page intentionally left blank
188

FINANCIAL TRENDS INFORMATION
Net Position by Component - Last Ten Fiscal Years
Changes in NetPosition - Last Ten Fiscal Years
Fund Balances of Governmental Funds - Last Ten Fiscal Years
Changes in Fund Balances of Governmental Funds - Last Ten Fiscal Years
189

City of Union CityNet Position by ComponentLast Ten Fiscal Years(Accrual basis of accounting)
2010 2011 2012 2013Governmental activities:
Net investment in capital assets $ 173,070,543 $ 168,118,884 $ 123,243,322 $ 141,266,031 Restricted 41,030,521 114,232,984 27,468,879 18,692,747Unrestricted 28,935,575 (35,655,123) 92,502,582 81,112,248
243,036,639 246,696,745 243,214,783 241,071,026
Business-type activities:Net investment in capital assets 7,208,016 6,784,789 6,212,877 8,634,945Unrestricted 19,026 (497) (28,406) (21,962)
7,227,042 6,784,292 6,784,292 6,184,471
Primary government:Net investment in capital assets 180,278,559 174,903,673 129,456,199 149,900,976Restricted 41,030,521 114,232,984 27,468,879 18,692,747Unrestricted 28,954,601 (35,655,620) 92,474,176 81,090,286
250,263,681$ 253,481,037$ 249,399,254$ 249,684,009$
Source: Current and Prior Comprehensive Annual Financial Reports (CAFR). Statement of Net Position.
Footnotes: None
Total governmental activities net assets
Total business-type activities net assets
Total primary government net assets
190
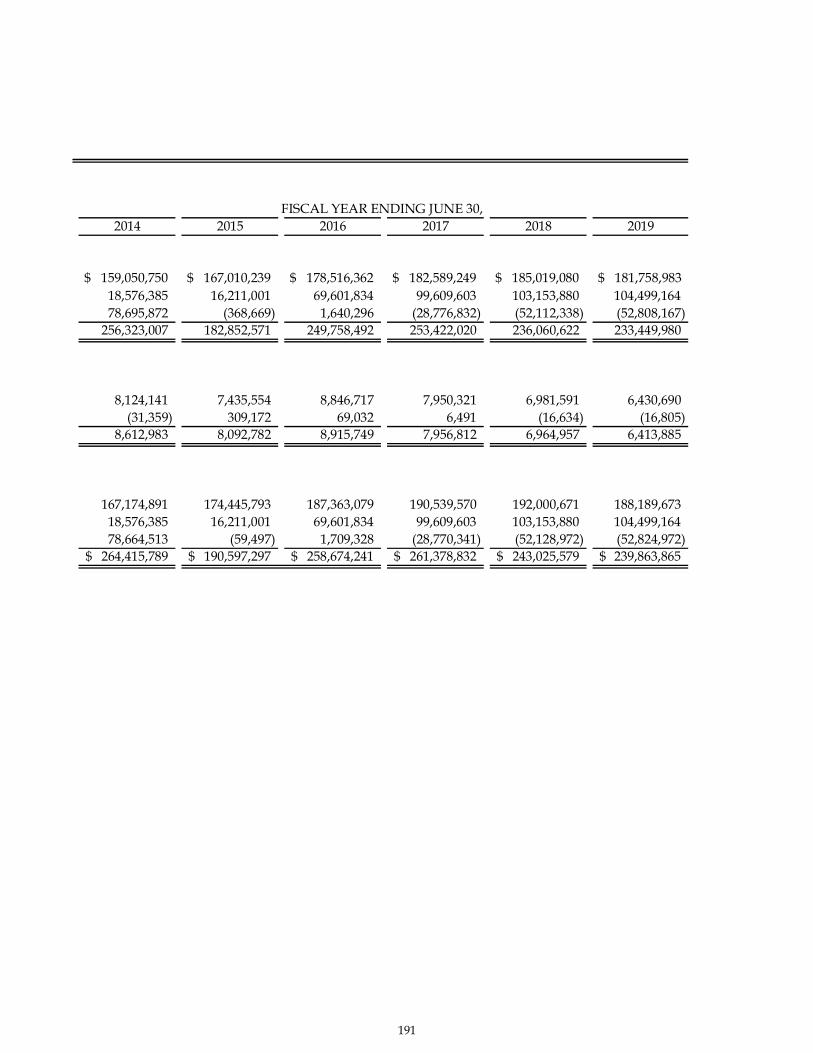
2014 2015 2016 2017 2018 2019
$ 159,050,750 $ 167,010,239 $ 178,516,362 $ 182,589,249 $ 185,019,080 $ 181,758,983 18,576,385 16,211,001 69,601,834 99,609,603 103,153,880 104,499,16478,695,872 (368,669) 1,640,296 (28,776,832) (52,112,338) (52,808,167)
256,323,007 182,852,571 249,758,492 253,422,020 236,060,622 233,449,980
8,124,141 7,435,554 8,846,717 7,950,321 6,981,591 6,430,690(31,359) 309,172 69,032 6,491 (16,634) (16,805)
8,612,983 8,092,782 8,915,749 7,956,812 6,964,957 6,413,885
167,174,891 174,445,793 187,363,079 190,539,570 192,000,671 188,189,67318,576,385 16,211,001 69,601,834 99,609,603 103,153,880 104,499,16478,664,513 (59,497) 1,709,328 (28,770,341) (52,128,972) (52,824,972)
264,415,789$ 190,597,297$ 258,674,241$ 261,378,832$ 243,025,579$ 239,863,865$
FISCAL YEAR ENDING JUNE 30,
191

City of Union CityChanges in Net PositionLast Ten Fiscal Years(Accrual basis of accounting)
2010 2011 2012 2013Expenses:
Governmental activities:General Government 41,130,109$ 27,290,623$ 23,031,426$ 18,634,095$ Public Safety 30,738,233 27,435,913 28,138,756 29,573,746Housing and comm. develop. 1,110,004 12,232,661 2,336,714 1,253,344Community and recreation services 3,637,786 3,631,125 4,017,804 4,693,940Economic and community development and Public works 8,743,102 9,577,047 9,438,357 13,388,319Interest, fiscal charges & bond issuance costs 7,950,940 8,685,925 3,698,863 1,755,956
Total governmental activities expense 93,310,174 88,853,294 70,661,920 69,299,400
Business-type activities:Transit 3,237,862 3,518,568 3,818,562 4,005,111ParaTransit 762,689 833,682 879,839 917,473Total business type activities 4,000,551 4,352,250 4,698,401 4,922,584
Total primary government expenses 97,310,725 93,205,544 75,360,321 74,221,984
Program revenues:Governmental activities:
Charges for services:General Government 3,779,943 3,817,940 3,259,657 3,152,186Public Safety 1,755,200 818,744 1,187,242 179,480Housing and comm. develop. - 12,235 16,166 24,778Community and recreation services 1,987,800 2,125,823 2,135,891 2,597,869Economic and community developmentand Public works 1,257,347 2,483,931 2,303,135 3,472,607
Operating grants & contributions 6,516,475 14,449,019 7,556,380 4,646,557Capital grants and contributions 17,005,436 9,040,879 6,677,530 8,004,057
Total governmental activities program revenues 32,302,201 32,748,571 23,136,001 22,077,534
Business-type activitiesCharges for services:
Transit 364,618 434,277 461,771 450,450ParaTransit 34,084 40,860 46,412 49,383
Operating grants & contributions - - - -Capital grants and contributions 3,068,870 273,890 91,857 3,208,587
Total business-type activities program revenues 3,467,572 749,027 600,040 3,708,420
Total primary government program revenues 35,769,773 33,497,598 23,736,041 25,785,954
Net revenues (expenses)Governmental activities (61,007,973) (56,104,723) (47,525,919) (47,221,866)Business-type activities (532,979) (3,603,223) (4,098,361) (1,214,164)
Total net revenues (expenses) (61,540,952) (59,707,946) (51,624,280) (48,436,030)
Note: None
Source: Current and Prior Comprehensive Annual Financial Reports (CAFR). Statement of Activities and Changes in Net Position.
Footnotes: None
192

2014 2015 2016* 2017 2018 2019
15,425,287$ 15,699,047$ 17,173,274$ 20,021,542$ 19,373,988$ 18,116,417$ 30,765,128 32,800,843 41,279,927 41,324,714 42,503,455 41,371,148
856,384 2,896,503 701,903 582,940 846,310 803,9424,456,105 4,407,560 6,353,792 6,165,082 9,930,800 7,549,018
14,192,714 16,965,941 2,897,135 18,507,064 25,735,839 21,739,065
1,646,887 1,718,981 1,667,571 1,834,393 1,631,538 1,597,62067,342,505 74,488,875 70,073,602 88,435,735 100,021,930 91,177,210
4,331,540 4,366,286 4,513,589 4,822,873 4,746,954 4,961,273954,968 995,619 1,017,218 1,035,460 1,079,109 1,002,823
5,286,508 5,361,905 5,530,807 5,858,333 5,826,063 5,964,09672,629,013 79,850,780 75,604,409 94,294,068 105,847,993 97,141,306
3,047,667 3,458,977 2,557,432 3,181,872 3,462,347 3,670,3961,071,414 1,355,829 930,181 773,647 1,047,572 841,394
12,600 41,106 1,294,087 243,221 585,812 739,0012,291,125 2,395,894 2,652,355 2,781,556 2,867,226 2,855,477
4,136,427 6,382,637 10,104,843 2,742,726 5,640,618 2,685,6326,453,749 6,430,654 7,142,190 13,174,073 10,876,671 12,375,503
11,217,997 10,502,540 8,327,895 3,045,724 4,364,423 1,516,723
28,230,979 30,567,637 33,008,983 25,942,819 28,844,669 24,684,126
409,950 363,323 335,339 388,075 290,819 277,88251,722 60,329 51,629 54,929 45,616 42,594
- - 4,315,658 4,505,002 4,498,008 5,083,247339,087 475,831 1,997,110 - - -
800,759 899,483 6,699,736 4,948,006 4,834,443 5,403,723
29,031,738 31,467,120 39,708,719 30,890,825 33,679,112 30,087,849
(39,111,526) (43,921,238) (37,064,619) (62,492,916) (71,177,261) (66,493,084)(4,485,749) (4,462,422) 1,168,929 (910,327) (991,620) (560,373)
(43,597,275) (48,383,660) (35,895,690) (63,403,243) (72,168,881) (67,053,457)Continued… Continued…
FISCAL YEAR ENDING JUNE 30,
193

City of Union CityChanges in Net Position, ContinuedLast Ten Fiscal Years(Accrual basis of accounting)
2010 2011 2012 2013General revenues & other changes in net position:
Governmental activities:Taxes:
Property taxes 45,875,362$ 45,976,940$ 35,331,998$ 27,635,637$ Transient occupancy taxes 447,634 591,459 767,451 1,066,772Sales taxes 5,559,164 7,140,193 9,627,336 10,557,705Franchise taxes 3,799,332 3,635,481 4,044,805 3,932,148Business license tax 1,395,765 812,843 1,265,965 1,686,022Real property transfer tax 201,784 196,778 197,206 204,820Other taxes 16,743 - 117,944 -
Unrestricted/Intergovernmental 218,451 377,812 21,162 40,401Gain (loss) on sale of assets 4,032 692,493 21,951 39,520Investment earnings (loss) 303,727 230,373 282,257 (322,236)Other revenues 1,057,804 525,787 1,823,335 585,083Extraordinary item - - - -Special item - - - -
Total governmental activities 58,879,798 60,180,159 53,501,410 45,425,872
Business-type activities:Unrestricted/Intergovernmental 3,077,618 3,158,604 3,494,770 3,637,386Gain (loss) on sale of assets - 16,710 - 751Investment income 8,366 2,434 3,770 4,539Other revenues 3,892 2,249 - -
Total business-type activities 3,089,876 3,179,997 3,498,540 3,642,676Total primary government 61,969,674 63,360,156 56,999,950 49,068,548
Changes in net position:Governmental activities (2,128,175) 4,075,436 6,279,544 6,314,347Business-type activities 2,556,897 (423,226) 2,284,376 (843,073)
Total primary government 428,722$ 3,652,210$ 8,563,920$ 5,471,274$
Note: None
Source: Current and Prior Comprehensive Annual Financial Reports (CAFR). Statement of Activities and Changes in Net Position.
Footnotes: None
194
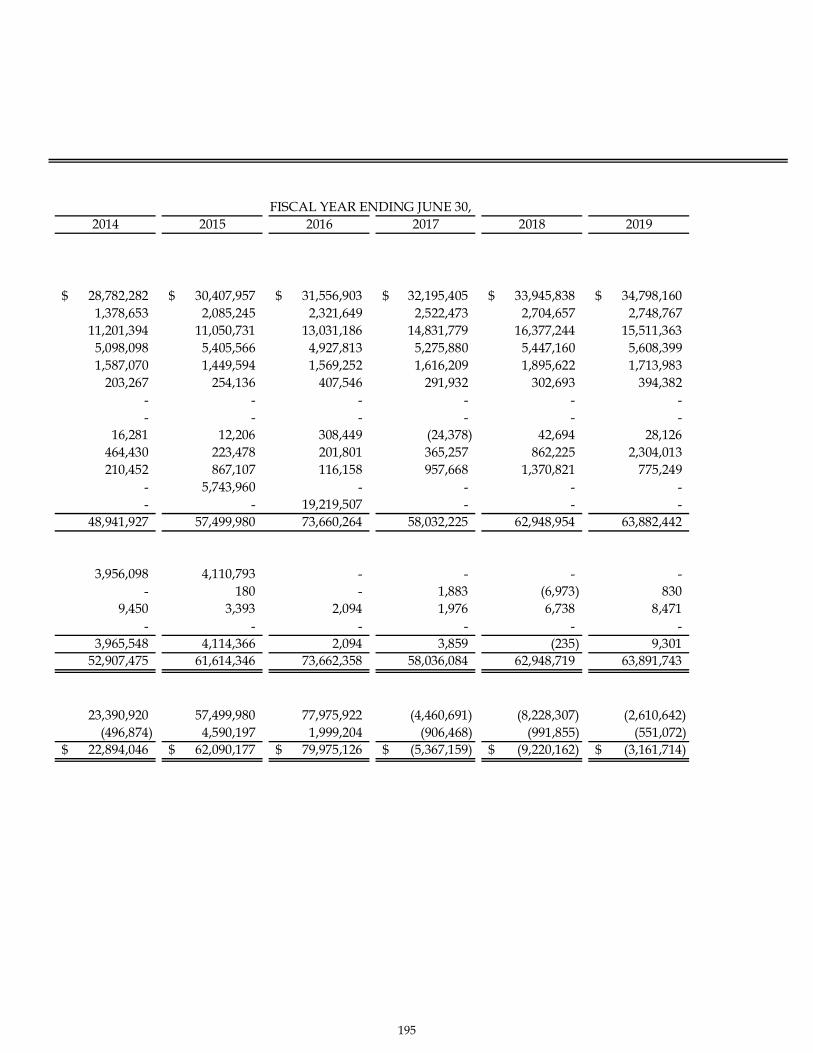
2014 2015 2016 2017 2018 2019
28,782,282$ 30,407,957$ 31,556,903$ 32,195,405$ 33,945,838$ 34,798,160$ 1,378,653 2,085,245 2,321,649 2,522,473 2,704,657 2,748,767
11,201,394 11,050,731 13,031,186 14,831,779 16,377,244 15,511,3635,098,098 5,405,566 4,927,813 5,275,880 5,447,160 5,608,3991,587,070 1,449,594 1,569,252 1,616,209 1,895,622 1,713,983
203,267 254,136 407,546 291,932 302,693 394,382- - - - - -- - - - - -
16,281 12,206 308,449 (24,378) 42,694 28,126464,430 223,478 201,801 365,257 862,225 2,304,013210,452 867,107 116,158 957,668 1,370,821 775,249
- 5,743,960 - - - -- - 19,219,507 - - -
48,941,927 57,499,980 73,660,264 58,032,225 62,948,954 63,882,442
3,956,098 4,110,793 - - - -- 180 - 1,883 (6,973) 830
9,450 3,393 2,094 1,976 6,738 8,471- - - - - -
3,965,548 4,114,366 2,094 3,859 (235) 9,30152,907,475 61,614,346 73,662,358 58,036,084 62,948,719 63,891,743
23,390,920 57,499,980 77,975,922 (4,460,691) (8,228,307) (2,610,642)(496,874) 4,590,197 1,999,204 (906,468) (991,855) (551,072)
22,894,046$ 62,090,177$ 79,975,126$ (5,367,159)$ (9,220,162)$ (3,161,714)$
FISCAL YEAR ENDING JUNE 30,
195

City of Union CityFund Balances of Governmental FundsLast Ten Fiscal Years(Modified accrual basis of accounting)
2010 2011 2012 2013General fund:
Reserved1 1,632,927$ -$ -$ -$ Unreserved 4,910,248 - - -Nonspendable - 371,061 580,287 500,596Restricted - - - 1,128Committed - 3,878,914 - -Assigned - 6,556,699 8,469,802 9,400,547Unassigned - 1,800,377 2,307,780 3,033,411
Total general fund 6,543,175 12,607,051 11,357,869 12,935,682
All other governmental fundsReserved1 63,694,630 - - -Unreserved, reported in:
Special revenue funds 21,359,076 - - -Capital projects funds 17,973,815 - - -
Nonspendable - 38,873,636 2,087,839 29,316Restricted - 77,658,639 25,029,575 18,691,619Committed - 1,864,609 988,790 6,632,902Assigned - - 261,431 -Unassigned - (9,998,220) (6,687,747) (3,777,338)
Total all other governmental funds 103,027,521 108,398,664 21,679,888 21,576,499
All FundsReserved 65,327,557 - - -Unreserved 44,243,139 - - -Nonspendable - 39,244,697 2,668,126 529,912Restricted - 77,658,639 25,029,575 18,692,747Committed - 5,743,523 988,790 6,632,902Assigned - 6,556,699 8,731,233 9,400,547Unassigned - (8,197,843) (4,379,967) (743,927)
Total All Funds 109,570,696$ 121,005,715$ 33,037,757$ 34,512,181$
Notes:1) Fund balance definitions have been changed by GASB 54. They will appear as non-spendable, restricted, committed, assigned, and unassigned going forward from FY 2010-11 and will not be restated for prior fiscal years.For more information, please visit http://gasb.org/
Source: Current and Prior Comprehensive Annual Financial Reports (CAFR). Balance Sheet - Governmental Funds
Footnotes: None
196
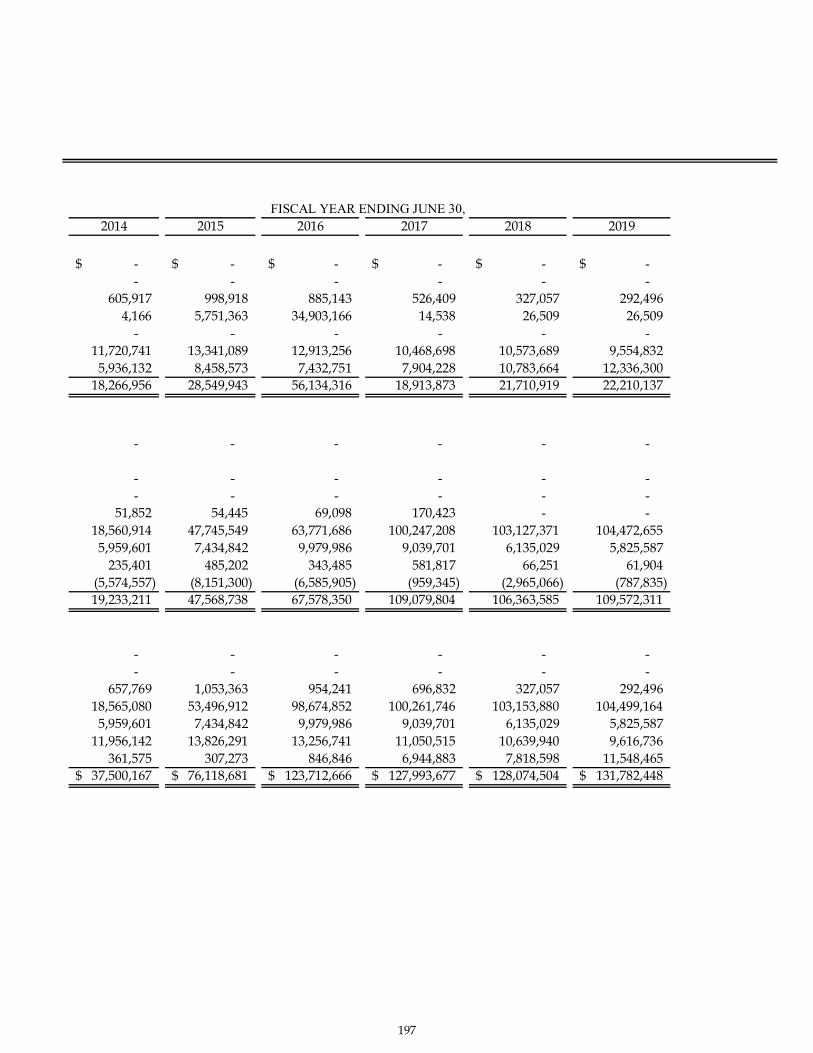
2014 2015 2016 2017 2018 2019
-$ -$ -$ -$ -$ -$ - - - - - -
605,917 998,918 885,143 526,409 327,057 292,4964,166 5,751,363 34,903,166 14,538 26,509 26,509
- - - - - -11,720,741 13,341,089 12,913,256 10,468,698 10,573,689 9,554,832
5,936,132 8,458,573 7,432,751 7,904,228 10,783,664 12,336,30018,266,956 28,549,943 56,134,316 18,913,873 21,710,919 22,210,137
- - - - - -
- - - - - -- - - - - -
51,852 54,445 69,098 170,423 - -18,560,914 47,745,549 63,771,686 100,247,208 103,127,371 104,472,655
5,959,601 7,434,842 9,979,986 9,039,701 6,135,029 5,825,587235,401 485,202 343,485 581,817 66,251 61,904
(5,574,557) (8,151,300) (6,585,905) (959,345) (2,965,066) (787,835)19,233,211 47,568,738 67,578,350 109,079,804 106,363,585 109,572,311
- - - - - -- - - - - -
657,769 1,053,363 954,241 696,832 327,057 292,49618,565,080 53,496,912 98,674,852 100,261,746 103,153,880 104,499,164
5,959,601 7,434,842 9,979,986 9,039,701 6,135,029 5,825,58711,956,142 13,826,291 13,256,741 11,050,515 10,639,940 9,616,736
361,575 307,273 846,846 6,944,883 7,818,598 11,548,46537,500,167$ 76,118,681$ 123,712,666$ 127,993,677$ 128,074,504$ 131,782,448$
FISCAL YEAR ENDING JUNE 30,
197

City of Union CityChanges in Fund Balances of Governmental FundsLast Ten Fiscal Years(Modified accrual basis of accounting)
2010 2011 2012 2013Revenues:
Taxes and assessments 59,014,409$ 60,905,667$ 54,762,947$ 47,705,636$ Licenses and permits 1,689,832 1,546,781 1,738,873 1,565,244Fines and forfeitures 831,574 789,153 539,690 431,061Intergovernmental 14,822,481 6,287,053 9,775,505 9,207,195Charges for services 6,310,133 5,117,202 5,699,380 6,234,399Investment income 1,864,445 462,390 322,219 (335,219)Other 3,460,452 2,666,759 3,381,607 2,522,026
Total revenues 87,993,326 77,775,005 76,220,221 67,330,342
ExpendituresCurrent:
General government 12,324,661 12,437,543 14,182,750 9,078,010Public safety 29,941,764 28,219,022 29,923,771 29,741,325Housing and comm. develop. 6,621,318 12,236,526 9,274,695 1,059,736Community and recreation services 3,370,847 3,409,615 3,766,994 4,181,992Economic and community development and Public works 4,568,806 4,243,421 9,352,786 11,550,476Agency pass through payments 22,832,218 8,227,869 3,873,049 -
Capital Outlay 25,750,249 22,063,345 19,090,375 7,440,779Debt service:
Principal repayment 2,392,067 2,393,950 2,026,921 1,059,053Interest and fiscal charges 7,988,055 7,666,990 6,250,681 1,744,547Cost of issuance 1,029,424 440,296 - -
Total expenditures 116,819,409 101,338,577 97,742,022 65,855,918
Excess (deficiency) of revenues over (under) expenditures (28,826,083) (23,563,572) (21,521,801) 1,474,424
Other financing sources (uses):Debt issuance 27,399,120 34,090,014 1,311,313 -Original issue premiums - - - -Capital lease financing - - - -Proceeds from sale of assets 5,000 906,580 21,951 39,520Payment to escrow account (32,620,000) - - -Transfers in 5,171,958 79,868,736 8,538,741 2,104,862Transfers out (5,171,958) (79,868,736) (8,471,084) (2,144,382)
Total other financing sources (uses) (5,215,880) 34,996,594 1,400,921 -
Extraordinary Item3 - - (65,975,363) -Special item4 - - - -Net change in fund balances (34,041,963)$ 11,433,022$ (86,096,243)$ 1,474,424$
Capital Expenditures1 21,982,386 16,365,530 15,629,154 4,471,909Noncapital expenditures 94,837,023 84,973,047 82,112,868 61,384,009Debt Service 10,380,122 10,060,940 8,277,602 2,803,600
Debt service as a % of noncapital expend.2 10.95% 11.84% 10.08% 4.57%
Note: (1) Per GASB-S44, this is the capital outlay reconciling item amount in the Reconciliation between the government-wide statement of
activities and the statement of revenues, expenditures, and changes in fund balance.(2) Revised ratios to reflect GASB-S44(3) 2012 item: Net assets transferred upon dissolution of the Redevelopment Agency
2015 item: Property resale- payment to the City in the Redevelopment Property Tax Trust Fund(4) 2016 Special Item is the net asset transfer from Redevelopment Property Tax Trust
Source: Current and Prior Comprehensive Annual Financial Reports (CAFR). Statement of Revenues, Expenditures and Changes in Fund Balance - Governmental Funds. Also, Reconciliation of the Governmental Funds Statement of Revenues, Expenditures and Changes in Fund Balances to the Government-Wide Statement of Activities and Changes in Net Position
Footnotes: None
198
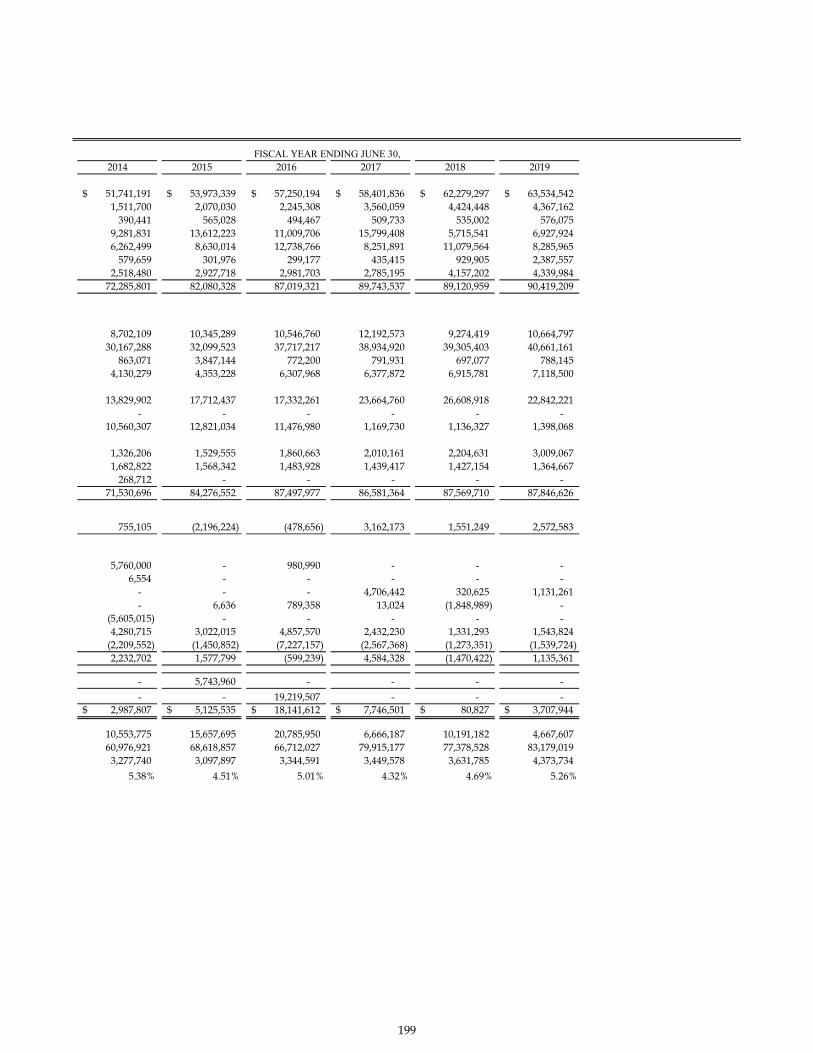
2014 2015 2016 2017 2018 2019
51,741,191$ 53,973,339$ 57,250,194$ 58,401,836$ 62,279,297$ 63,534,542$ 1,511,700 2,070,030 2,245,308 3,560,059 4,424,448 4,367,162
390,441 565,028 494,467 509,733 535,002 576,0759,281,831 13,612,223 11,009,706 15,799,408 5,715,541 6,927,9246,262,499 8,630,014 12,738,766 8,251,891 11,079,564 8,285,965
579,659 301,976 299,177 435,415 929,905 2,387,5572,518,480 2,927,718 2,981,703 2,785,195 4,157,202 4,339,984
72,285,801 82,080,328 87,019,321 89,743,537 89,120,959 90,419,209
8,702,109 10,345,289 10,546,760 12,192,573 9,274,419 10,664,79730,167,288 32,099,523 37,717,217 38,934,920 39,305,403 40,661,161
863,071 3,847,144 772,200 791,931 697,077 788,1454,130,279 4,353,228 6,307,968 6,377,872 6,915,781 7,118,500
13,829,902 17,712,437 17,332,261 23,664,760 26,608,918 22,842,221- - - - - -
10,560,307 12,821,034 11,476,980 1,169,730 1,136,327 1,398,068
1,326,206 1,529,555 1,860,663 2,010,161 2,204,631 3,009,0671,682,822 1,568,342 1,483,928 1,439,417 1,427,154 1,364,667
268,712 - - - - -71,530,696 84,276,552 87,497,977 86,581,364 87,569,710 87,846,626
755,105 (2,196,224) (478,656) 3,162,173 1,551,249 2,572,583
5,760,000 - 980,990 - - -6,554 - - - - -
- - - 4,706,442 320,625 1,131,261- 6,636 789,358 13,024 (1,848,989) -
(5,605,015) - - - - -4,280,715 3,022,015 4,857,570 2,432,230 1,331,293 1,543,824
(2,209,552) (1,450,852) (7,227,157) (2,567,368) (1,273,351) (1,539,724)2,232,702 1,577,799 (599,239) 4,584,328 (1,470,422) 1,135,361
- 5,743,960 - - - -- - 19,219,507 - - -
2,987,807$ 5,125,535$ 18,141,612$ 7,746,501$ 80,827$ 3,707,944$
10,553,775 15,657,695 20,785,950 6,666,187 10,191,182 4,667,60760,976,921 68,618,857 66,712,027 79,915,177 77,378,528 83,179,019
3,277,740 3,097,897 3,344,591 3,449,578 3,631,785 4,373,7345.38% 4.51% 5.01% 4.32% 4.69% 5.26%
FISCAL YEAR ENDING JUNE 30,
199

This page intentionally left blank
200

REVENUE CAPACITY INFORMATION
Assessed Value and Estimated Actual Value of Taxable Property - Last Ten Fiscal Years
Direct and Overlapping Property Tax Rates - Last Ten Fiscal Years
Principal Property Tax Payers - Current and Nine Years Ago
Property Tax Levies and Collections - Last Ten Fiscal Years
Special Assessment Collections - Last Ten Fiscal Years
Property Values and Construction - Last Ten Fiscal Years
201
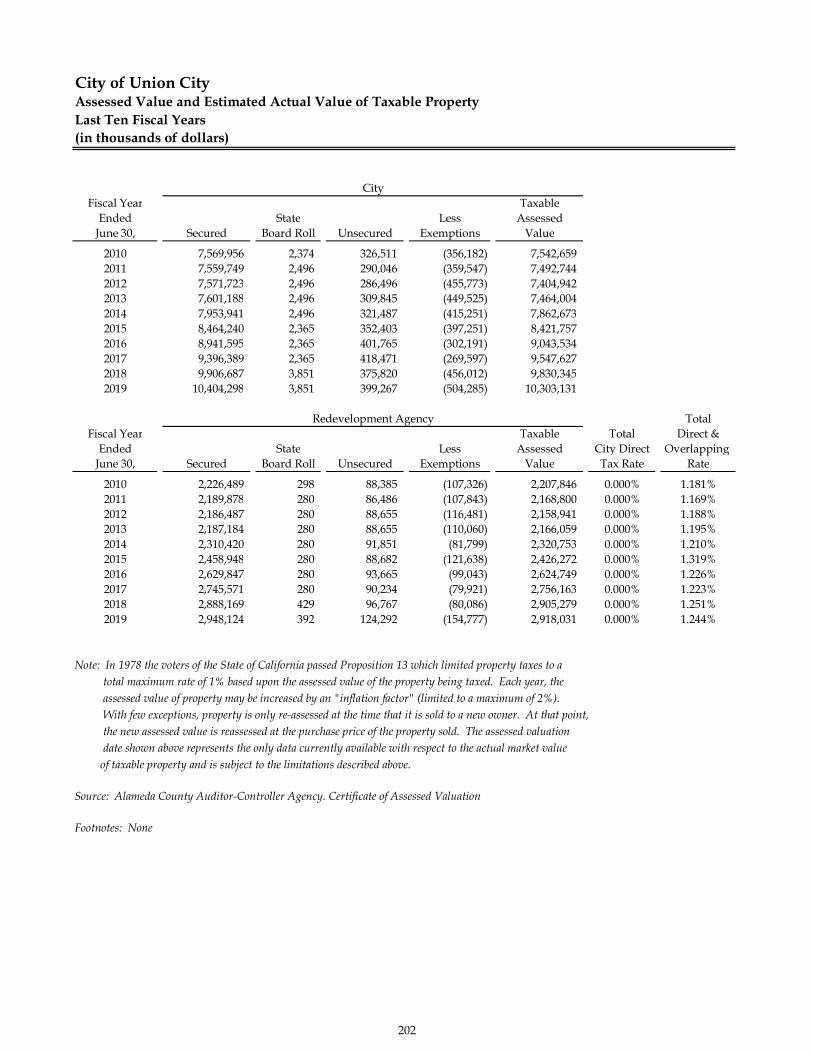
City of Union CityAssessed Value and Estimated Actual Value of Taxable PropertyLast Ten Fiscal Years(in thousands of dollars)
Fiscal Year TaxableEnded State Less Assessed
June 30, Secured Board Roll Unsecured Exemptions Value
2010 7,569,956 2,374 326,511 (356,182) 7,542,6592011 7,559,749 2,496 290,046 (359,547) 7,492,7442012 7,571,723 2,496 286,496 (455,773) 7,404,9422013 7,601,188 2,496 309,845 (449,525) 7,464,0042014 7,953,941 2,496 321,487 (415,251) 7,862,6732015 8,464,240 2,365 352,403 (397,251) 8,421,7572016 8,941,595 2,365 401,765 (302,191) 9,043,5342017 9,396,389 2,365 418,471 (269,597) 9,547,6272018 9,906,687 3,851 375,820 (456,012) 9,830,3452019 10,404,298 3,851 399,267 (504,285) 10,303,131
TotalFiscal Year Taxable Total Direct &
Ended State Less Assessed City Direct Overlapping June 30, Secured Board Roll Unsecured Exemptions Value Tax Rate Rate
2010 2,226,489 298 88,385 (107,326) 2,207,846 0.000% 1.181%2011 2,189,878 280 86,486 (107,843) 2,168,800 0.000% 1.169%2012 2,186,487 280 88,655 (116,481) 2,158,941 0.000% 1.188%2013 2,187,184 280 88,655 (110,060) 2,166,059 0.000% 1.195%2014 2,310,420 280 91,851 (81,799) 2,320,753 0.000% 1.210%2015 2,458,948 280 88,682 (121,638) 2,426,272 0.000% 1.319%2016 2,629,847 280 93,665 (99,043) 2,624,749 0.000% 1.226%2017 2,745,571 280 90,234 (79,921) 2,756,163 0.000% 1.223%2018 2,888,169 429 96,767 (80,086) 2,905,279 0.000% 1.251%2019 2,948,124 392 124,292 (154,777) 2,918,031 0.000% 1.244%
Note: In 1978 the voters of the State of California passed Proposition 13 which limited property taxes to a total maximum rate of 1% based upon the assessed value of the property being taxed. Each year, the assessed value of property may be increased by an "inflation factor" (limited to a maximum of 2%). With few exceptions, property is only re-assessed at the time that it is sold to a new owner. At that point, the new assessed value is reassessed at the purchase price of the property sold. The assessed valuation date shown above represents the only data currently available with respect to the actual market value of taxable property and is subject to the limitations described above.
Source: Alameda County Auditor-Controller Agency. Certificate of Assessed Valuation
Footnotes: None
Redevelopment Agency
City
202

City of Union CityDirect and Overlapping Property Tax RatesLast Ten Fiscal Year(Rate per $100 of assessed value)
2010 2011 2012 2013 2014 2015 2016 2017 2018 2019 Basic levy:
Basic rate 1.000 1.000 1.000 1.000 1.000 1.000 1.000 1.000 1.000 1.0000Total City Direct Rate 1.000 1.000 1.000 1.000 1.000 1.000 1.000 1.000 1.000 1.0000
Overlapping Rates:Alameda County Water District 0.007 0.007 0.008 0.007 0.007 0.009 0.008 0.008 0.008 0.0049Bay Area Rapid Transit Dist. 0.008 0.003 0.004 0.004 0.008 0.005 0.003 0.003 0.008 0.0070Chabot Los Positas College Bonds 0.020 0.021 0.021 0.022 0.021 0.022 0.020 0.025 - 0.0443East Bay Regional Park Dist. 0.018 0.008 0.007 0.005 0.008 0.009 0.007 0.003 0.002 0.0057Flood Zone 7 State Water 0.020 0.025 0.031 0.023 0.026 0.025 - - - -Hayward Unified Bonds 0.071 0.057 0.056 0.055 0.049 0.053 - - - -New Haven School Bonds 0.132 0.111 0.130 0.139 0.138 0.143 0.158 0.159 0.163 0.1578Ohlone College Bonds 0.019 0.019 0.040 0.038 0.040 0.038 - - 0.045Washington Twn Hospital 0.006 0.019 0.019 0.018 0.029 0.017 0.031 0.026 0.024 0.0242
Total Overlapping Rate 0.300 0.270 0.315 0.311 0.324 0.319 0.226 0.223 0.251 0.2439Total Direct & Overlapping Rate 1.300 1.270 1.315 1.311 1.324 1.319 1.226 1.223 1.251 1.2439
Note: In 1978, California voters passed Proposition 13 which sets the property tax rate at a 1.00% fixed amount. This 1.00% is shared by all taxing agencies for which the subject property resides within. In addition to the 1.00% fixed amount, property owners are charged taxes as a percentage of assessed property values for the payment of other agency bonds such as those held by the School Districts.
Source: Alameda County Auditor-Controller Agency
Footnotes: None
203

Percent of Percent ofTotal City Total City
Taxable Taxable Taxable TaxableAssessed Assessed Assessed Assessed
Taxpayer Value Value Value ValueDyer Triangle LLC 72,978$ 0.742% 64,334$ 0.853%Avalon Union city LP 84,089 0.855% - 0%RREEF America REIT II Corp R 87,258 0.888% 75,839 1.005%UC Block 3 Associates LP 78,842 0.802%Wesco IV LLC 76,229 0.775% - 0%Fairfield Greenhaven LLC 71,355 0.726% - 0%Terreno Park Union city LLC 66,021 0.672% - 0%Union LLC 61,395 0.625% - 0%Woodstock Bowers LLC etal 58,154 0.592% 48,105 0.638%Catellus Finance 1 LLC 53,189 0.541% 56,403 0.748%Millennium Housing of California - 0% 42,631 0.565%Masonic Homes of California - - 64,848 0.860%Kaiser Foundation Health Plan, Inc. - - 80,817 1.071%Harsch Investment Properties LLC - - 54,101 0.717%Hearst Communications Inc - - 50,691 0.672%
Teachers Insurance & Annuity Assoc America - - 40,229 0.533%
Totals 709,511$ 7.218% 577,998$ 7.663%
Total City Taxable Assessed Value 9,830,345$ 7,542,659$
Note: None
Source: Alameda County Assessor's Office.
Footnotes: None
FISCAL YEAR ENDING JUNE 30, 2019 2010
City of Union CityPrincipal Property Tax PayersCurrent Year and Nine Years Ago(In thousands of dollars)
204

City of Union CityProperty Tax Levies and CollectionsLast Ten Fiscal Years
Fiscal Taxes Levied Collected inYear Ended for the Subsequent
June 30, Fiscal Year Amount Percentage Year1 Amount Percentage
2010 9,750,505$ 9,338,126$ 95.76% 424,912$ 9,763,038$ 100.13%2011 9,661,544 9,577,503 96.51% 407,597 9,985,099 103.35%2012 9,563,883 9,261,053 96.68% 321,386 9,582,439 100.19%2013 9,630,062 9,439,805 97.59% 270,627 9,710,432 100.83%2014 10,183,426 9,723,359 98.11% 250,836 9,974,195 97.95%2015 10,848,029 10,405,466 95.92% 198,652 10,604,119 97.75%2016 11,668,283 11,440,502 98.05% 178,837 11,619,339 99.58%2017 12,303,790 12,109,625 98.42% 186,740 2 12,296,365 99.94%2018 12,735,624 12,518,611 98.30% 82,594 3 12,601,205 98.94%2019 13,221,162 13,051,150 98.71% 178,507 13,229,657 100.06%
Note: Includes both secured and unsecured property tax collections
Source: Alameda County Auditor-Controller Agency
Footnotes: 1) Delinquent tax levies are usually collected in the following fiscal year. However, this is not always true andproperty owners have up to 5 years to pay their delinquent taxes. The County is unable to provide the year these figuresbelong to at this time2) Original reported $93,015 as of 11/30/20173) As of 12/12/2018
Collected within theFiscal Year of Levy
Total Collectionto date
205
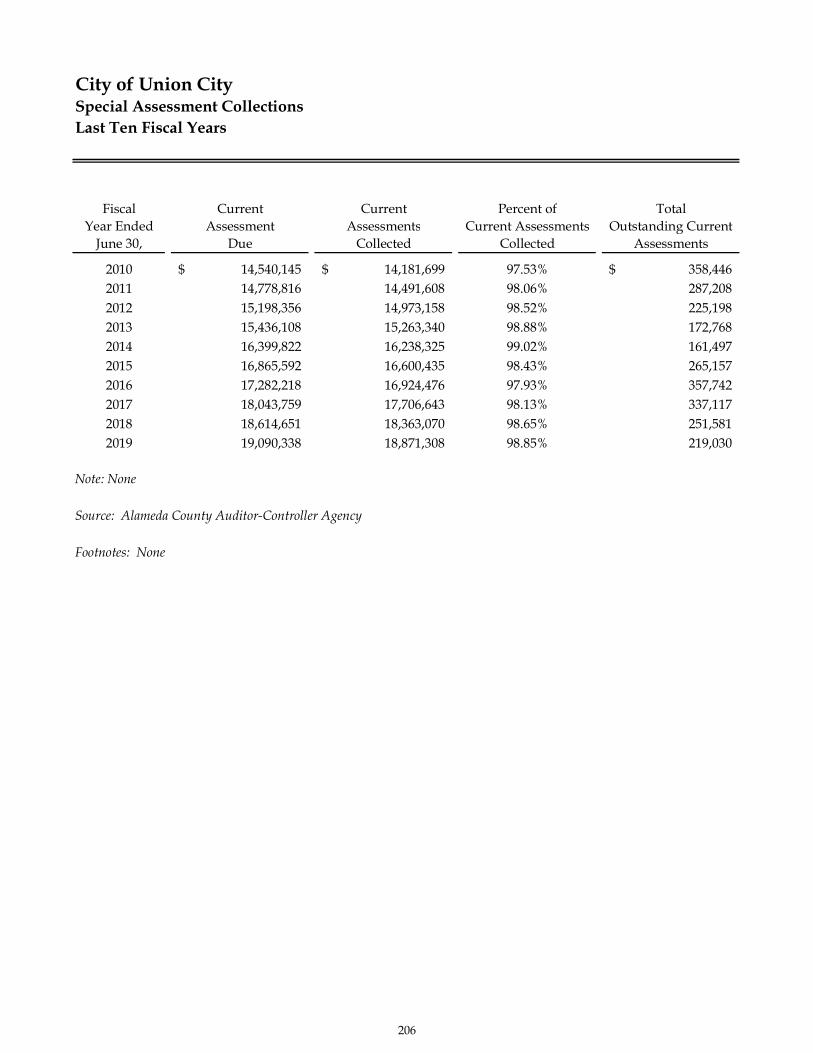
City of Union CitySpecial Assessment CollectionsLast Ten Fiscal Years
Fiscal Current Current Percent of TotalYear Ended Assessment Assessments Current Assessments Outstanding Current
June 30, Due Collected Collected Assessments
2010 14,540,145$ 14,181,699$ 97.53% 358,446$ 2011 14,778,816 14,491,608 98.06% 287,2082012 15,198,356 14,973,158 98.52% 225,1982013 15,436,108 15,263,340 98.88% 172,7682014 16,399,822 16,238,325 99.02% 161,4972015 16,865,592 16,600,435 98.43% 265,1572016 17,282,218 16,924,476 97.93% 357,7422017 18,043,759 17,706,643 98.13% 337,1172018 18,614,651 18,363,070 98.65% 251,5812019 19,090,338 18,871,308 98.85% 219,030
Note: None
Source: Alameda County Auditor-Controller Agency
Footnotes: None
206
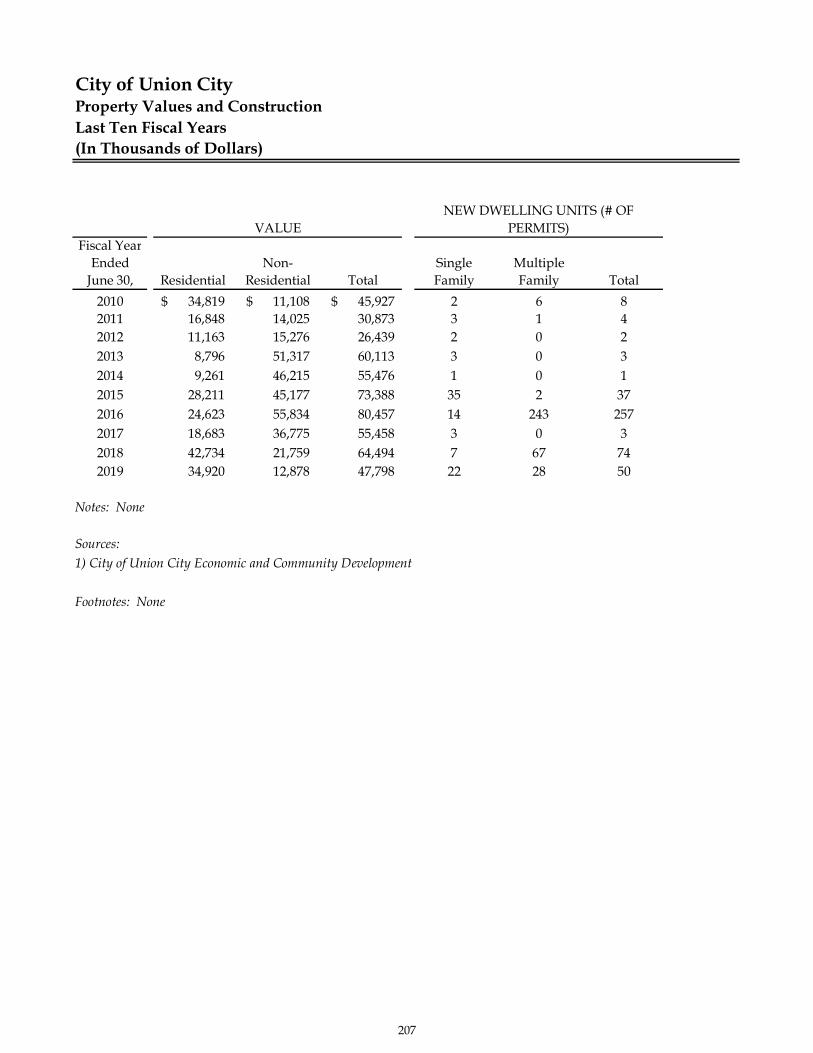
City of Union CityProperty Values and ConstructionLast Ten Fiscal Years(In Thousands of Dollars)
Fiscal YearEnded Non- Single Multiple
June 30, Residential Residential Total Family Family Total2010 34,819$ 11,108$ 45,927$ 2 6 82011 16,848 14,025 30,873 3 1 42012 11,163 15,276 26,439 2 0 22013 8,796 51,317 60,113 3 0 32014 9,261 46,215 55,476 1 0 12015 28,211 45,177 73,388 35 2 372016 24,623 55,834 80,457 14 243 2572017 18,683 36,775 55,458 3 0 32018 42,734 21,759 64,494 7 67 742019 34,920 12,878 47,798 22 28 50
Notes: None
Sources: 1) City of Union City Economic and Community Development
Footnotes: None
VALUENEW DWELLING UNITS (# OF
PERMITS)
207

This page intentionally left blank
208
DEBT CAPACITY INFORMATION
Ratios of Outstanding Debt by Type - Last Ten Fiscal Years
Ratios of General Bonded Debt Outstanding - Last Ten Years
Schedule of Direct and Overlapping Debt - As of June 30, 2019
Legal Debt Margin Information - Last Ten Fiscal Years
Pledged-Revenue Coverage - Last Ten Fiscal Years
209
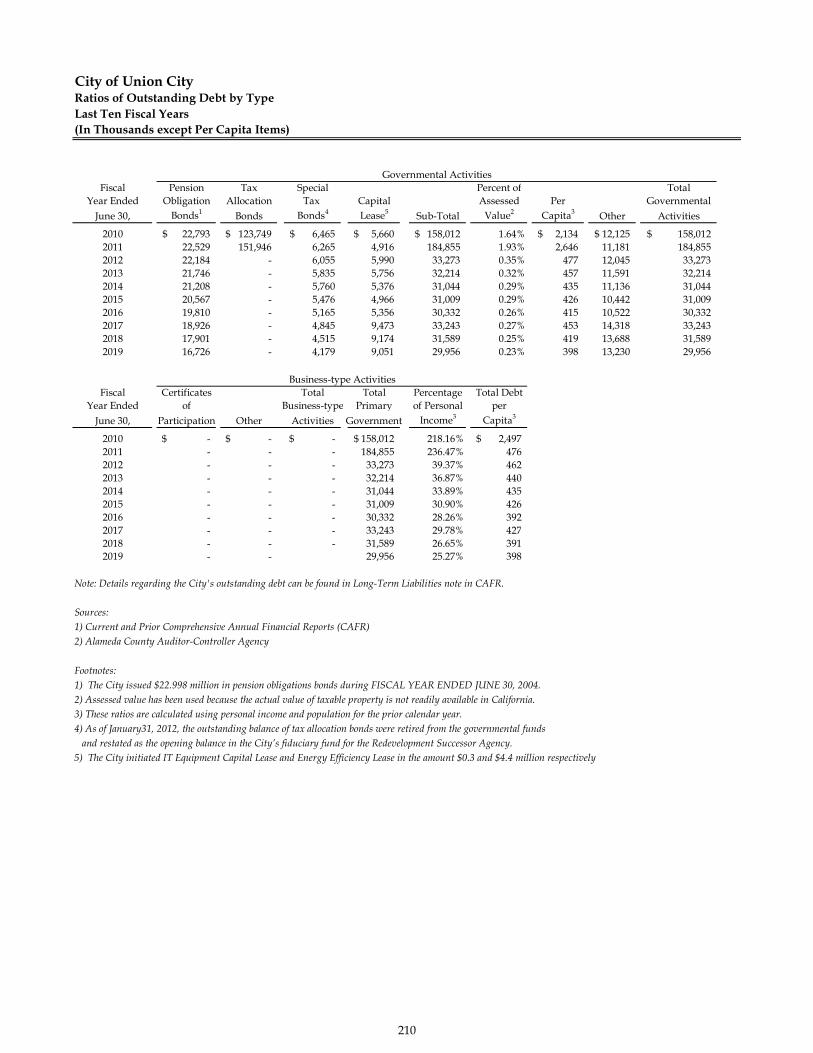
City of Union CityRatios of Outstanding Debt by TypeLast Ten Fiscal Years(In Thousands except Per Capita Items)
Fiscal Pension Tax Special Percent of TotalYear Ended Obligation Allocation Tax Capital Assessed Per Governmental
June 30, Bonds1 Bonds Bonds4 Lease5 Sub-Total Value2 Capita3 Other Activities
2010 22,793$ 123,749$ 6,465$ 5,660$ 158,012$ 1.64% 2,134$ 12,125$ 158,012$ 2011 22,529 151,946 6,265 4,916 184,855 1.93% 2,646 11,181 184,8552012 22,184 - 6,055 5,990 33,273 0.35% 477 12,045 33,2732013 21,746 - 5,835 5,756 32,214 0.32% 457 11,591 32,2142014 21,208 - 5,760 5,376 31,044 0.29% 435 11,136 31,0442015 20,567 - 5,476 4,966 31,009 0.29% 426 10,442 31,0092016 19,810 - 5,165 5,356 30,332 0.26% 415 10,522 30,3322017 18,926 - 4,845 9,473 33,243 0.27% 453 14,318 33,2432018 17,901 - 4,515 9,174 31,589 0.25% 419 13,688 31,5892019 16,726 - 4,179 9,051 29,956 0.23% 398 13,230 29,956
Fiscal Certificates Total Total Percentage Total DebtYear Ended of Business-type Primary of Personal per
June 30, Participation Other Activities Government Income3 Capita3
2010 -$ -$ -$ 158,012$ 218.16% 2,497$ 2011 - - - 184,855 236.47% 4762012 - - - 33,273 39.37% 4622013 - - - 32,214 36.87% 4402014 - - - 31,044 33.89% 4352015 - - - 31,009 30.90% 4262016 - - - 30,332 28.26% 3922017 - - - 33,243 29.78% 4272018 - - - 31,589 26.65% 3912019 - - 29,956 25.27% 398
Note: Details regarding the City's outstanding debt can be found in Long-Term Liabilities note in CAFR.
Sources: 1) Current and Prior Comprehensive Annual Financial Reports (CAFR)2) Alameda County Auditor-Controller Agency
Footnotes: 1) The City issued $22.998 million in pension obligations bonds during FISCAL YEAR ENDED JUNE 30, 2004.2) Assessed value has been used because the actual value of taxable property is not readily available in California.3) These ratios are calculated using personal income and population for the prior calendar year.4) As of January31, 2012, the outstanding balance of tax allocation bonds were retired from the governmental funds and restated as the opening balance in the City’s fiduciary fund for the Redevelopment Successor Agency.5) The City initiated IT Equipment Capital Lease and Energy Efficiency Lease in the amount $0.3 and $4.4 million respectively
Governmental Activities
Business-type Activities
210
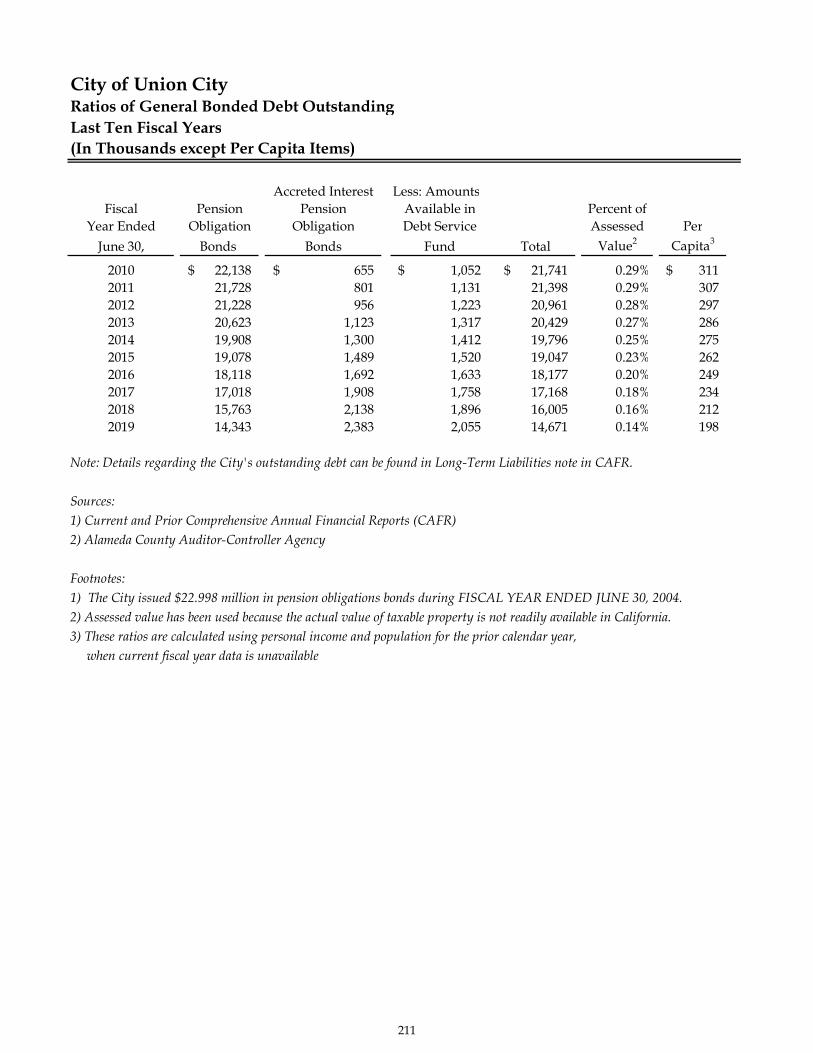
City of Union CityRatios of General Bonded Debt OutstandingLast Ten Fiscal Years(In Thousands except Per Capita Items)
Accreted Interest Less: AmountsFiscal Pension Pension Available in Percent of
Year Ended Obligation Obligation Debt Service Assessed PerJune 30, Bonds Bonds Fund Total Value2 Capita3
2010 22,138$ 655$ 1,052$ 21,741$ 0.29% 311$ 2011 21,728 801 1,131 21,398 0.29% 3072012 21,228 956 1,223 20,961 0.28% 2972013 20,623 1,123 1,317 20,429 0.27% 2862014 19,908 1,300 1,412 19,796 0.25% 2752015 19,078 1,489 1,520 19,047 0.23% 2622016 18,118 1,692 1,633 18,177 0.20% 2492017 17,018 1,908 1,758 17,168 0.18% 2342018 15,763 2,138 1,896 16,005 0.16% 2122019 14,343 2,383 2,055 14,671 0.14% 198
Note: Details regarding the City's outstanding debt can be found in Long-Term Liabilities note in CAFR.
Sources: 1) Current and Prior Comprehensive Annual Financial Reports (CAFR)2) Alameda County Auditor-Controller Agency
Footnotes: 1) The City issued $22.998 million in pension obligations bonds during FISCAL YEAR ENDED JUNE 30, 2004.2) Assessed value has been used because the actual value of taxable property is not readily available in California.3) These ratios are calculated using personal income and population for the prior calendar year, when current fiscal year data is unavailable
211
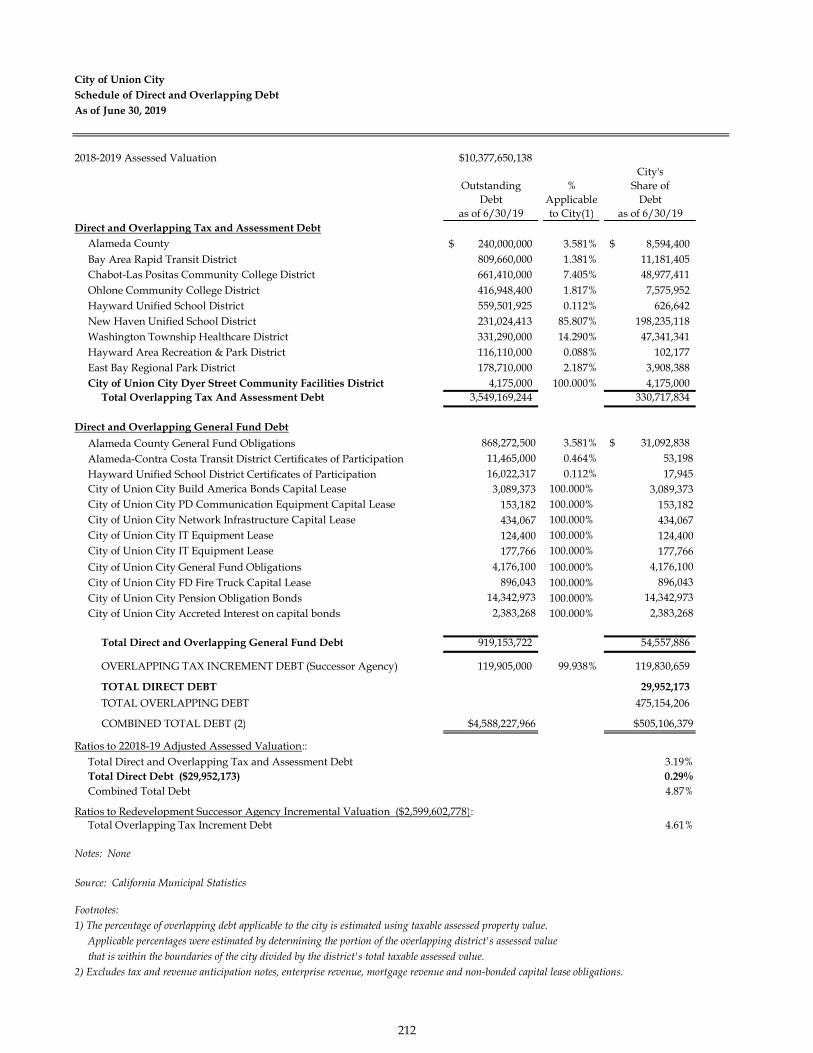
City of Union CitySchedule of Direct and Overlapping DebtAs of June 30, 2019
2018-2019 Assessed Valuation $10,377,650,138City's
Outstanding % Share ofDebt Applicable Debt
as of 6/30/19 to City(1) as of 6/30/19Direct and Overlapping Tax and Assessment Debt
Alameda County 240,000,000$ 3.581% 8,594,400$ Bay Area Rapid Transit District 809,660,000 1.381% 11,181,405Chabot-Las Positas Community College District 661,410,000 7.405% 48,977,411Ohlone Community College District 416,948,400 1.817% 7,575,952Hayward Unified School District 559,501,925 0.112% 626,642New Haven Unified School District 231,024,413 85.807% 198,235,118Washington Township Healthcare District 331,290,000 14.290% 47,341,341Hayward Area Recreation & Park District 116,110,000 0.088% 102,177East Bay Regional Park District 178,710,000 2.187% 3,908,388City of Union City Dyer Street Community Facilities District 4,175,000 100.000% 4,175,000
Total Overlapping Tax And Assessment Debt 3,549,169,244 330,717,834
Direct and Overlapping General Fund DebtAlameda County General Fund Obligations 868,272,500 3.581% 31,092,838$ Alameda-Contra Costa Transit District Certificates of Participation 11,465,000 0.464% 53,198Hayward Unified School District Certificates of Participation 16,022,317 0.112% 17,945City of Union City Build America Bonds Capital Lease 3,089,373 100.000% 3,089,373City of Union City PD Communication Equipment Capital Lease 153,182 100.000% 153,182City of Union City Network Infrastructure Capital Lease 434,067 100.000% 434,067City of Union City IT Equipment Lease 124,400 100.000% 124,400City of Union City IT Equipment Lease 177,766 100.000% 177,766City of Union City General Fund Obligations 4,176,100 100.000% 4,176,100City of Union City FD Fire Truck Capital Lease 896,043 100.000% 896,043City of Union City Pension Obligation Bonds 14,342,973 100.000% 14,342,973City of Union City Accreted Interest on capital bonds 2,383,268 100.000% 2,383,268
Total Direct and Overlapping General Fund Debt 919,153,722 54,557,886
OVERLAPPING TAX INCREMENT DEBT (Successor Agency) 119,905,000 99.938% 119,830,659
TOTAL DIRECT DEBT 29,952,173TOTAL OVERLAPPING DEBT 475,154,206
COMBINED TOTAL DEBT (2) $4,588,227,966 $505,106,379
Ratios to 22018-19 Adjusted Assessed Valuation::Total Direct and Overlapping Tax and Assessment Debt 3.19%Total Direct Debt ($29,952,173) 0.29%Combined Total Debt 4.87%
Ratios to Redevelopment Successor Agency Incremental Valuation ($2,599,602,778):Total Overlapping Tax Increment Debt 4.61%
Notes: None
Source: California Municipal Statistics
Footnotes:1) The percentage of overlapping debt applicable to the city is estimated using taxable assessed property value.
Applicable percentages were estimated by determining the portion of the overlapping district's assessed value that is within the boundaries of the city divided by the district's total taxable assessed value.
2) Excludes tax and revenue anticipation notes, enterprise revenue, mortgage revenue and non-bonded capital lease obligations.
212

City of Union CityLegal Debt Margin InformationLast Ten Fiscal Years(In thousands of dollars)
2010 2011 2012 2013 2014
Assessed valuation 7,820,380$ 7,774,658$ 7,783,635$ 7,837,213$ 8,202,478$
Conversion percentage 25% 25% 25% 25% 25%
Adjusted assessed valuation 1,955,095 1,943,665 1,945,909 1,959,303 2,050,619
Debt limit percentage 15% 15% 15% 15% 15%
Debt limit 293,264 291,550 291,886 293,896 307,593
Total net debt applicable to limit:General obligation bonds 22,793 22,529 22,184 21,746 21,208
Legal debt margin 270,471$ 269,021$ 269,702$ 272,150$ 286,385$
Total debt applicable to limitas a percentage of debt limit 7.8% 7.7% 7.6% 7.0% 6.5%
Note: The Government Code of the State of California provides for a legal debt limit of 15% of gross assessed valuation based upon 25% of market value. Effective with the 1981-82 fiscal year, each parcel is nowassessed at 100% of market value (as of the most recent change in ownership for that parcel).
The computations shown above reflect a conversion of assessed valuation data for each fiscal year from the gross valuation perspective to the 25% level
Source:City Finance DepartmentAlameda County Assessor's Office
Footnotes: None
FISCAL YEAR ENDING JUNE 30,
213

City of Union CityLegal Debt Margin Information, ContinuedLast Ten Fiscal Years(In thousands of dollars)
2015 2016* 2017* 2018 2019
Assessed valuation 8,819,008$ 9,345,725$ 9,817,225$ 10,286,357$ 10,807,415$
Conversion percentage 25% 25% 25% 25% 25%
Adjusted assessed valuation 2,204,752 2,336,431 2,454,306 2,571,589 2,701,854
Debt limit percentage 15% 15% 15% 15% 15%
Debt limit 330,713 350,465 368,146 385,738 405,278
Total net debt applicable to limit:General obligation bonds 20,567 19,810 18,926 17,901 16,726
Legal debt margin 310,146$ 330,655$ 349,220$ 367,838$ 388,552$
Total debt applicable to limitas a percentage of debt limit 6.2% 5.7% 5.1% 4.6% 4.1%
Note: The Government Code of the State of California provides for a legal debt limit of 15% of gross assessed valuation based upon 25% of market value. Effective with the 1981-82 fiscal year, each parcel is now assessed at 100% of market value (as of the most recent change in ownership for that parcel). The computations shown above reflect a conversion of assessed valuation data for each fiscal year from the gross valuation perspective to the 25% level
Source:City Finance DepartmentAlameda County Assessor's Office
Footnotes:(*) Assessed Valuation amoutns are corrected from Net to Gross Amounts
from 9,270,823 and 9,742,399 for 2016 and 2017 respectively
FISCAL YEAR ENDING JUNE 30,
214
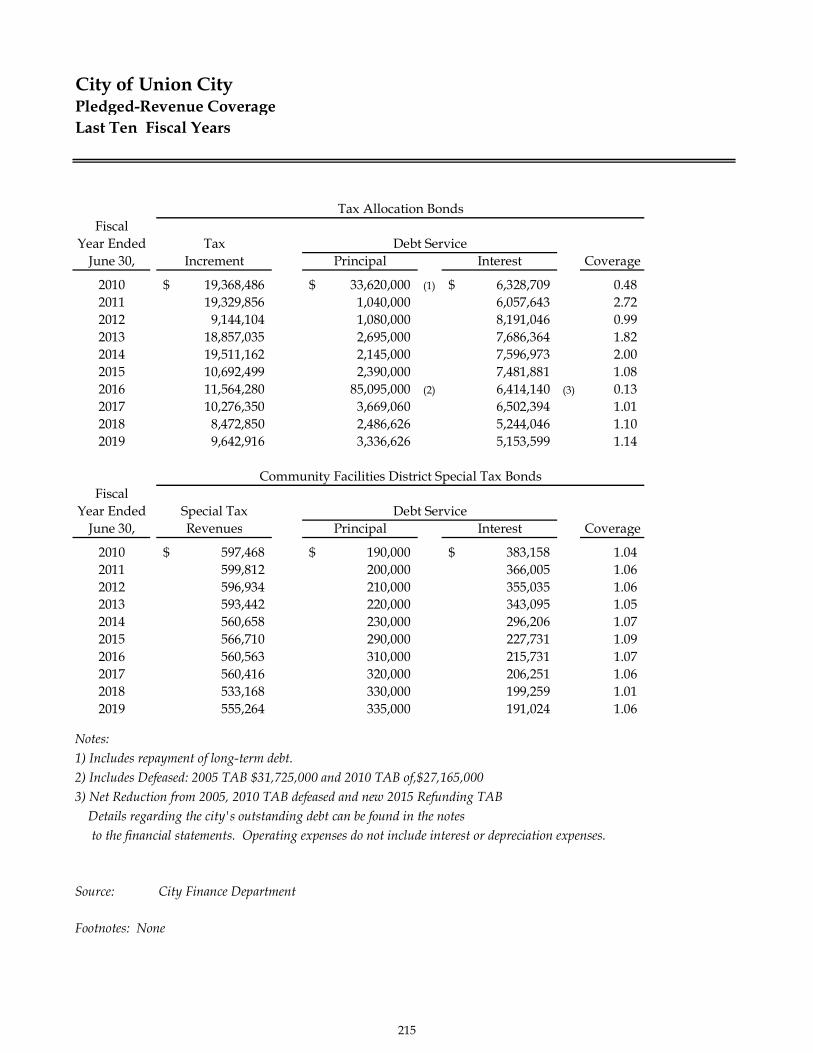
City of Union CityPledged-Revenue CoverageLast Ten Fiscal Years
FiscalYear Ended Tax
June 30, Increment Principal Interest Coverage
2010 19,368,486$ 33,620,000$ (1) 6,328,709$ 0.482011 19,329,856 1,040,000 6,057,643 2.722012 9,144,104 1,080,000 8,191,046 0.992013 18,857,035 2,695,000 7,686,364 1.822014 19,511,162 2,145,000 7,596,973 2.002015 10,692,499 2,390,000 7,481,881 1.082016 11,564,280 85,095,000 (2) 6,414,140 (3) 0.132017 10,276,350 3,669,060 6,502,394 1.012018 8,472,850 2,486,626 5,244,046 1.102019 9,642,916 3,336,626 5,153,599 1.14
FiscalYear Ended Special Tax
June 30, Revenues Principal Interest Coverage
2010 597,468$ 190,000$ 383,158$ 1.042011 599,812 200,000 366,005 1.062012 596,934 210,000 355,035 1.062013 593,442 220,000 343,095 1.052014 560,658 230,000 296,206 1.072015 566,710 290,000 227,731 1.092016 560,563 310,000 215,731 1.072017 560,416 320,000 206,251 1.062018 533,168 330,000 199,259 1.012019 555,264 335,000 191,024 1.06
Notes: 1) Includes repayment of long-term debt.2) Includes Defeased: 2005 TAB $31,725,000 and 2010 TAB of,$27,165,0003) Net Reduction from 2005, 2010 TAB defeased and new 2015 Refunding TAB Details regarding the city's outstanding debt can be found in the notes to the financial statements. Operating expenses do not include interest or depreciation expenses.
Source: City Finance Department
Footnotes: None
Debt Service
Tax Allocation Bonds
Community Facilities District Special Tax Bonds
Debt Service
215

This page intentionally left blank
216

DEMOGRAPHIC AND ECONOMIC INFORMATION
Bank Deposit Summary - Last Ten Fiscal Years
General Fund Expenditures by Function - Last Ten Fiscal Years
General Fund Revenues by Function - Last Ten Fiscal Years
Taxable Sales Transactions - Last Ten Calendar Years
Taxable Sales Transactions - by Type of Business
Adopted and Final Budget for 2017-18 and 2018-19 Adopted Budget for Unrestricted General Fund
Summary of Revenues, Expenditures, and Changes in Fund Balance General FundMunicipal Debt Continuing Disclosure S.E.C. Rule 15c2-12(b)(5)
Pooled Investment Portfolio - As of June 30, 2019Municipal Debt Continuing Disclosure S.E.C. Rule 15c2-12(b)(5)
Demographic and Economic Statistics - Last Ten Calendar Years
Principal Employers - Current and Nine Years Ago
Full-time and Part-time City Employees (Full-Time Equivalent FTE's) by Department - Last Ten Fiscal Years
217
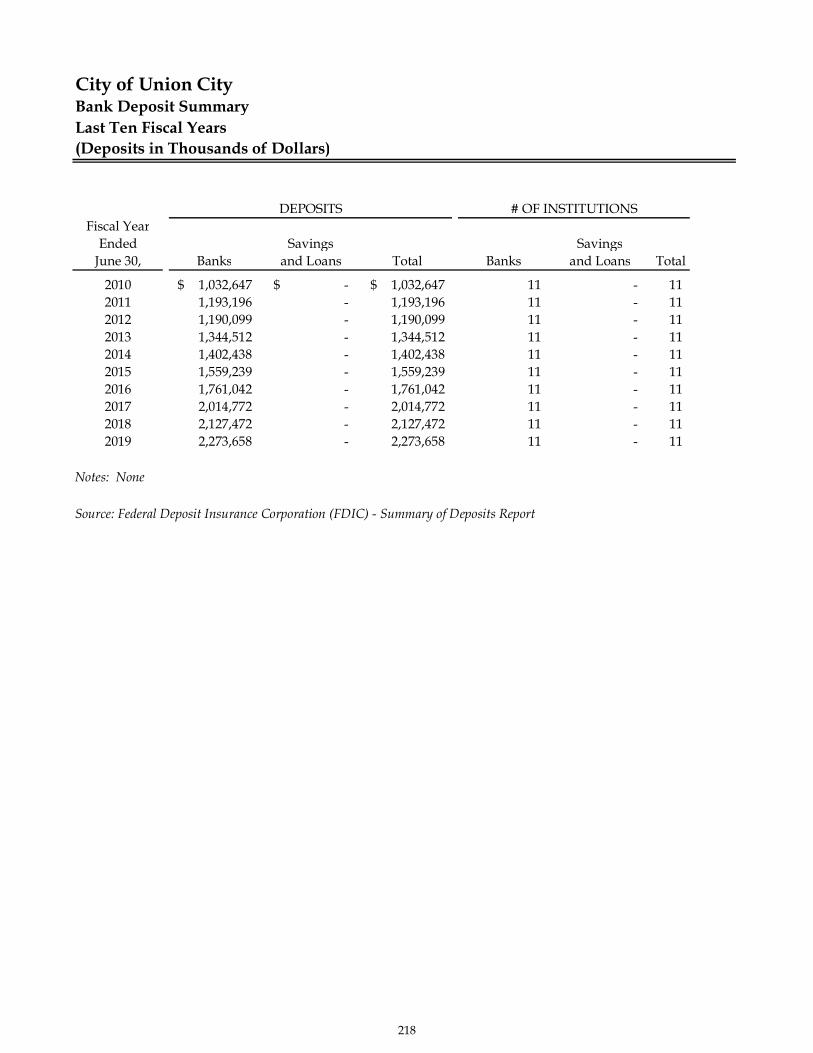
City of Union CityBank Deposit SummaryLast Ten Fiscal Years(Deposits in Thousands of Dollars)
Fiscal YearEnded Savings Savings
June 30, Banks and Loans Total Banks and Loans Total
2010 1,032,647$ -$ 1,032,647$ 11 - 112011 1,193,196 - 1,193,196 11 - 112012 1,190,099 - 1,190,099 11 - 112013 1,344,512 - 1,344,512 11 - 112014 1,402,438 - 1,402,438 11 - 112015 1,559,239 - 1,559,239 11 - 112016 1,761,042 - 1,761,042 11 - 112017 2,014,772 - 2,014,772 11 - 112018 2,127,472 - 2,127,472 11 - 112019 2,273,658 - 2,273,658 11 - 11
Notes: None
Source: Federal Deposit Insurance Corporation (FDIC) - Summary of Deposits Report
DEPOSITS # OF INSTITUTIONS
218
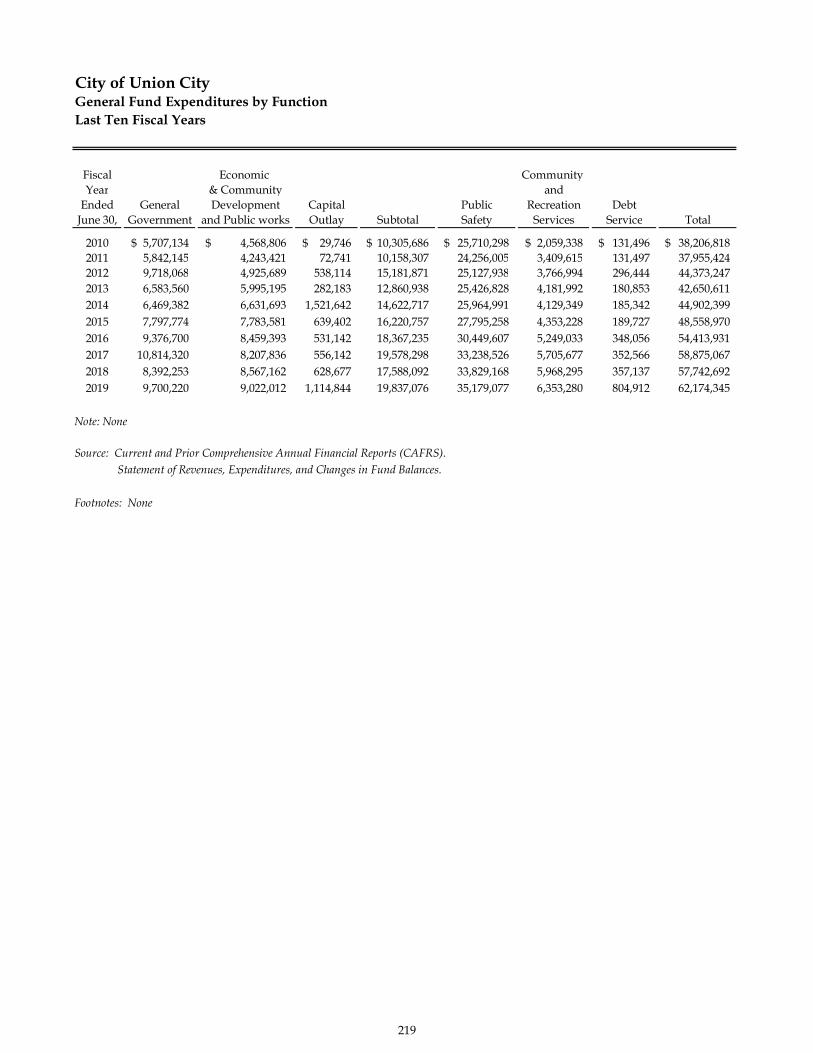
City of Union CityGeneral Fund Expenditures by FunctionLast Ten Fiscal Years
Fiscal Economic Community Year & Community and
Ended General Development Capital Public Recreation DebtJune 30, Government and Public works Outlay Subtotal Safety Services Service Total
2010 5,707,134$ 4,568,806$ 29,746$ 10,305,686$ 25,710,298$ 2,059,338$ 131,496$ 38,206,818$ 2011 5,842,145 4,243,421 72,741 10,158,307 24,256,005 3,409,615 131,497 37,955,4242012 9,718,068 4,925,689 538,114 15,181,871 25,127,938 3,766,994 296,444 44,373,2472013 6,583,560 5,995,195 282,183 12,860,938 25,426,828 4,181,992 180,853 42,650,6112014 6,469,382 6,631,693 1,521,642 14,622,717 25,964,991 4,129,349 185,342 44,902,3992015 7,797,774 7,783,581 639,402 16,220,757 27,795,258 4,353,228 189,727 48,558,9702016 9,376,700 8,459,393 531,142 18,367,235 30,449,607 5,249,033 348,056 54,413,9312017 10,814,320 8,207,836 556,142 19,578,298 33,238,526 5,705,677 352,566 58,875,0672018 8,392,253 8,567,162 628,677 17,588,092 33,829,168 5,968,295 357,137 57,742,6922019 9,700,220 9,022,012 1,114,844 19,837,076 35,179,077 6,353,280 804,912 62,174,345
Note: None
Source: Current and Prior Comprehensive Annual Financial Reports (CAFRS). Statement of Revenues, Expenditures, and Changes in Fund Balances.
Footnotes: None
219
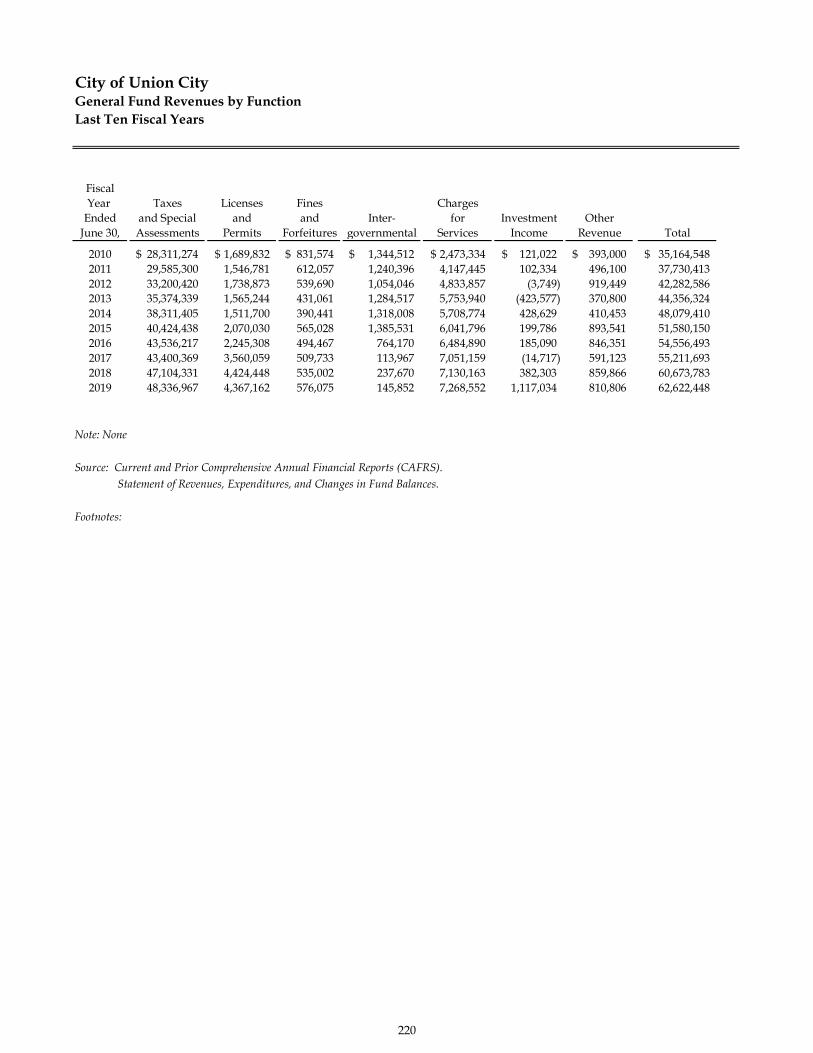
City of Union CityGeneral Fund Revenues by FunctionLast Ten Fiscal Years
FiscalYear Taxes Licenses Fines Charges
Ended and Special and and Inter- for Investment OtherJune 30, Assessments Permits Forfeitures governmental Services Income Revenue Total
2010 28,311,274$ 1,689,832$ 831,574$ 1,344,512$ 2,473,334$ 121,022$ 393,000$ 35,164,548$ 2011 29,585,300 1,546,781 612,057 1,240,396 4,147,445 102,334 496,100 37,730,4132012 33,200,420 1,738,873 539,690 1,054,046 4,833,857 (3,749) 919,449 42,282,5862013 35,374,339 1,565,244 431,061 1,284,517 5,753,940 (423,577) 370,800 44,356,3242014 38,311,405 1,511,700 390,441 1,318,008 5,708,774 428,629 410,453 48,079,4102015 40,424,438 2,070,030 565,028 1,385,531 6,041,796 199,786 893,541 51,580,1502016 43,536,217 2,245,308 494,467 764,170 6,484,890 185,090 846,351 54,556,4932017 43,400,369 3,560,059 509,733 113,967 7,051,159 (14,717) 591,123 55,211,6932018 47,104,331 4,424,448 535,002 237,670 7,130,163 382,303 859,866 60,673,7832019 48,336,967 4,367,162 576,075 145,852 7,268,552 1,117,034 810,806 62,622,448
Note: None
Source: Current and Prior Comprehensive Annual Financial Reports (CAFRS). Statement of Revenues, Expenditures, and Changes in Fund Balances.
Footnotes:
220

City of Union CityTaxable Sales TransactionsLast Ten Calendar Years(Sales Transactions in Thousands of Dollars)
2009 2010 2011 2012 2013
Motor Vehicle and Parts Dealers 10,649$ 10,600$ 10,943$ 11,445$ 11,424$ Home Furnishings and Appliance Stores1 Unavail. Unavail. 50,076 52,769 54,411Bldg. Matrl. and Garden Equip. and Supplies 52,933 57,992 115,638 105,020 112,758Food and Beverage Stores 30,418 30,950 32,182 32,971 33,215Gasoline Stations 43,307 46,155 56,258 61,369 61,369Clothing and Clothing Accessories Stores 4,219 4,383 4,547 4,704 3,958General Merchandise Stores1 Unavail. Unavail. Unavail. Unavail. Unavail.Food Services and Drinking Places 77,096 79,520 82,421 89,412 94,451Other Retail Group1 183,522 180,932 127,529 123,293 122,090All Other Outlets 285,514 321,275 274,158 278,383 300,614
Totals 687,658$ 731,807$ 753,752$ 759,366$ 794,290$
Number of sales tax permits 1,112 1,144 1,127 1,139 1,137
2014 2015 2016 2017 2018 2
Motor Vehicle and Parts Dealers 11,945$ 12,298$ 12,423$ 12,403 11,657$ Home Furnishings and Appliance Stores1 57,986 60,962 62,983 66,232 67,420Bldg. Matrl. and Garden Equip. and Supplies 131,198 126,312 128,869 139,869 87,143Food and Beverage Stores 34,205 37,007 37,131 37,624 36,762Gasoline Stations 59,987 51,127 45,252 50,806 61,962Clothing and Clothing Accessories Stores 4,027 4,113 3,689 2,460 1,979General merchandise stores1 Unavail. 70,783 70,207 71,034 71,925Food Services and Drinking Places 103,186 111,779 114,962 119,479 128,516Other Retail Group1 122,862 51,132 50,159 51,060 45,990All Other Outlets 301,006 310,454 328,927 361,844 418,429
Totals 826,402$ 835,968$ 854,603$ 912,811$ 931,783$
Number of sales tax permits 1,108 1,216 1,235 1,234 1,283
Source: California State Board of Equalization, Annual Reports - Taxable Sales in California (Sales & Use Tax)
Footnotes: 1) Sales omitted because their publication would result in the disclosure of confidential information. These are included with "Other retail stores" when possible per California State Board of Equalization.2) Data for Calendar Year 2019 not available when CAFR was produced.
CALENDAR YEAR
Type of BusinessCALENDAR YEAR
221
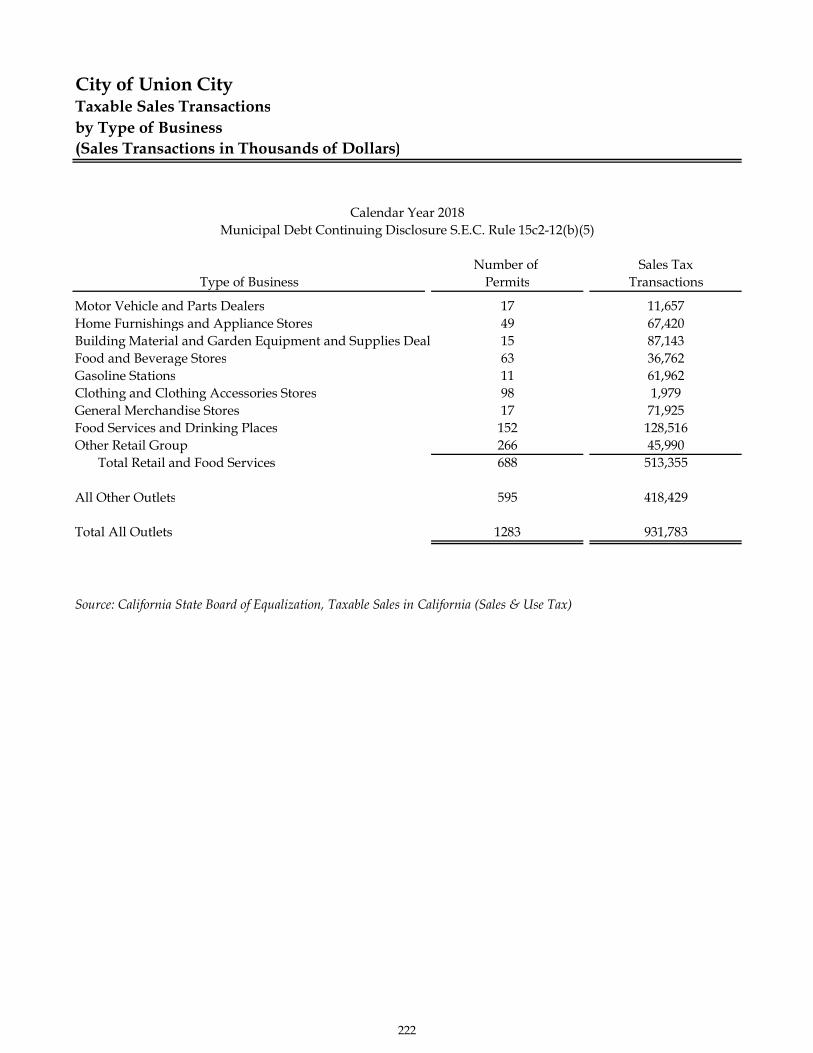
City of Union CityTaxable Sales Transactionsby Type of Business(Sales Transactions in Thousands of Dollars)
Number of Sales TaxPermits Transactions
Motor Vehicle and Parts Dealers 17 11,657Home Furnishings and Appliance Stores 49 67,420Building Material and Garden Equipment and Supplies Deal 15 87,143Food and Beverage Stores 63 36,762Gasoline Stations 11 61,962Clothing and Clothing Accessories Stores 98 1,979General Merchandise Stores 17 71,925Food Services and Drinking Places 152 128,516Other Retail Group 266 45,990
Total Retail and Food Services 688 513,355
All Other Outlets 595 418,429
Total All Outlets 1283 931,783
Source: California State Board of Equalization, Taxable Sales in California (Sales & Use Tax)
Calendar Year 2018Municipal Debt Continuing Disclosure S.E.C. Rule 15c2-12(b)(5)
Type of Business
222
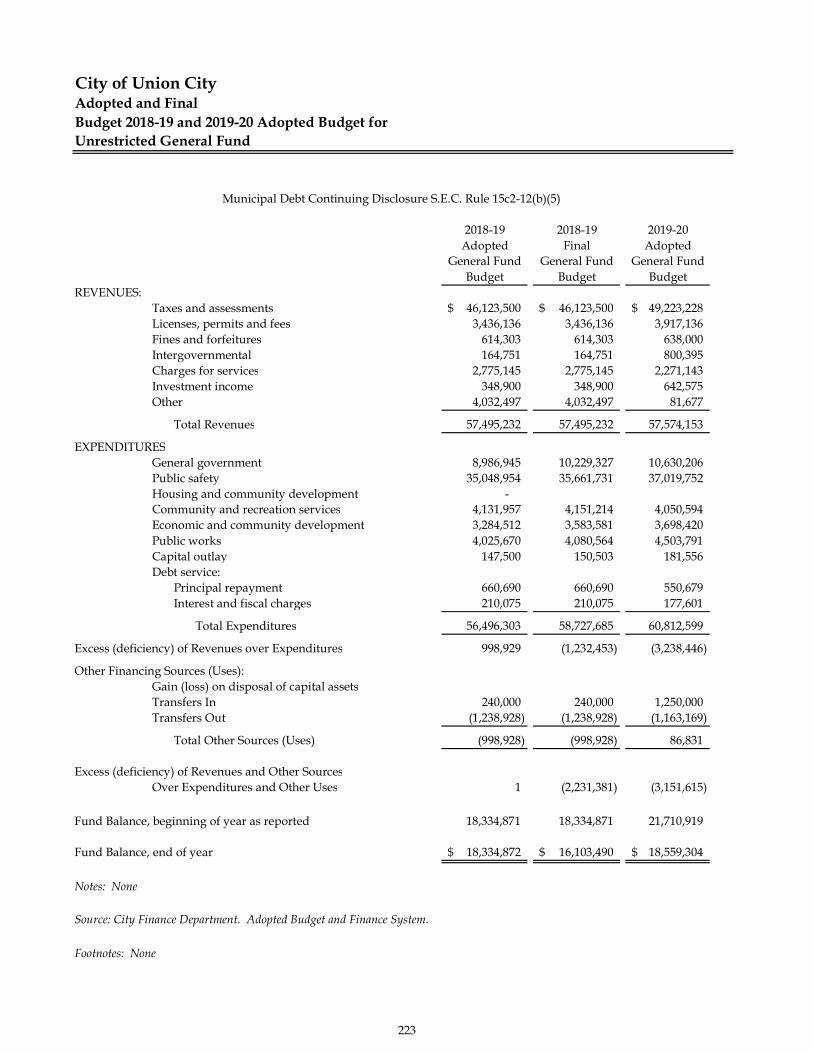
City of Union CityAdopted and FinalBudget 2018-19 and 2019-20 Adopted Budget forUnrestricted General Fund
2018-19 2018-19 2019-20Adopted Final Adopted
General Fund General Fund General FundBudget Budget Budget
REVENUES:Taxes and assessments 46,123,500$ 46,123,500$ 49,223,228$ Licenses, permits and fees 3,436,136 3,436,136 3,917,136Fines and forfeitures 614,303 614,303 638,000Intergovernmental 164,751 164,751 800,395Charges for services 2,775,145 2,775,145 2,271,143Investment income 348,900 348,900 642,575Other 4,032,497 4,032,497 81,677
Total Revenues 57,495,232 57,495,232 57,574,153
EXPENDITURESGeneral government 8,986,945 10,229,327 10,630,206Public safety 35,048,954 35,661,731 37,019,752Housing and community development -Community and recreation services 4,131,957 4,151,214 4,050,594Economic and community development 3,284,512 3,583,581 3,698,420Public works 4,025,670 4,080,564 4,503,791Capital outlay 147,500 150,503 181,556Debt service:
Principal repayment 660,690 660,690 550,679Interest and fiscal charges 210,075 210,075 177,601
Total Expenditures 56,496,303 58,727,685 60,812,599
Excess (deficiency) of Revenues over Expenditures 998,929 (1,232,453) (3,238,446)
Other Financing Sources (Uses):Gain (loss) on disposal of capital assetsTransfers In 240,000 240,000 1,250,000Transfers Out (1,238,928) (1,238,928) (1,163,169)
Total Other Sources (Uses) (998,928) (998,928) 86,831
Excess (deficiency) of Revenues and Other SourcesOver Expenditures and Other Uses 1 (2,231,381) (3,151,615)
Fund Balance, beginning of year as reported 18,334,871 18,334,871 21,710,919
Fund Balance, end of year 18,334,872$ 16,103,490$ 18,559,304$
Notes: None
Source: City Finance Department. Adopted Budget and Finance System.
Footnotes: None
Municipal Debt Continuing Disclosure S.E.C. Rule 15c2-12(b)(5)
223

City of Union CitySummary of Revenues, Expenditures, and Changes in Fund BalanceGeneral Fund- Last Five YearsMunicipal Debt Continuing Disclosure S.E.C. Rule 15c2-12(b)(5)
2015 2016 2017 2018 2019REVENUES:
Taxes and assessments 40,424,438$ 43,536,217$ 43,400,369$ 47,104,331$ 48,336,967$ Licenses and permits 2,070,030 2,245,308 3,560,059 4,424,448 4,367,162Fines and forfeitures 565,028 494,467 509,733 535,002 576,075Intergovernmental 1,385,531 764,170 113,967 237,670 145,852Charges for services 6,041,796 6,484,890 7,051,159 7,130,163 7,268,552Investment income 199,786 185,090 (14,717) 382,303 1,117,034Other 893,541 846,351 591,123 859,866 810,806
Total Revenues 51,580,150 54,556,493 55,211,693 60,673,783 62,622,448
EXPENDITURESGeneral government 7,797,774 9,376,700 10,814,320 8,392,253 9,700,220Public safety 27,795,258 30,449,607 33,238,526 33,829,168 35,179,077Community and recreation services 4,353,228 5,249,033 5,705,677 5,968,295 6,353,280Economic and community development 3,370,951 3,271,567 3,032,194 3,046,020 3,545,525Public works 4,412,630 5,187,826 5,175,642 5,521,142 5,476,487Capital outlay 639,402 531,142 556,142 628,677 1,114,844Debt service:
Principal repayment 89,139 249,985 236,531 251,268 580,020Interest and fiscal charges 100,588 98,071 116,035 105,869 224,892
Total Expenditures 48,558,970 54,413,931 58,875,067 57,742,692 62,174,345
Excess (deficiency) of Revenues over Expend. 3,021,180 142,562 (3,663,374) 2,931,091 448,103
Other Financing Sources (Uses):Issuance of capital leases - 980,990 - - -Gain (loss) on disposal of capital assets 6,636 7,520 - - -Transfers In 2,722,963 3,683,145 451,837 535,973 263,296Transfers Out (1,211,752) (6,376,846) (1,829,663) (670,808) (1,240,028)Proceeds from sale of assets - - 13,024 790 -Capital lease financing - - - - 1,027,847
Total Other Financing Sources (Uses) 1,517,847 (1,705,191) (1,364,802) (134,045) 51,115
Net Change in Fund Balances 4,539,027 (1,562,629) (5,028,176) 2,797,046 499,218
EXTRAORDINARY ITEMAsset transfer fr Redevelopment Property Tax Trust Fu 5,743,960 - - - -
SPECIAL ITEMAsset transfer fr Redevelopment Property Tax Trust Fu - 19,219,507 - - -
Fund Balance, beginning of year as previously reported 18,266,956 57,696,945 56,134,316 18,913,873 21,710,919Prior period adjustment - - (32,192,268) - -Fund Balance, beginning of year as restated 18,266,956 57,696,945 23,942,048 18,913,873 21,710,919
Fund Balance, end of year 28,549,943$ 56,134,316$ 18,913,872$ 21,710,919$ 22,210,137$
Notes: None
Source: Current and Prior Comprehensive Annual Financial Reports (CAFRS). Statement of Revenues, Expenditures, and Changes in Fund Balances.
Footnotes: 1) Beginning in FY 2014, expenditures for Planning and Public Works were segregated into Community and Economic Development and Public Works
224

City of Union CityPooled Investment PortfolioAs of June 30, 2019Municipal Debt Continuing Disclosure S.E.C. Rule 15c2-12(b)(5)
Percent Yield/360 DayAt Fair Value At Par/Cost of Portfolio Year Equivalent
LOCAL AGENCY INVESTMENT FUND (LAIF)LAIF-GENERAL 37,526,663$ 37,462,535$ 65.48% 0.006
SECURITIES OF THE U.S GOVERNMENTFEDERAL NTL MTG ASSN MED TERM 1,987,720 2,000,000 3.50% 0.0120FEDERAL HOME LN BKS FIXED RATE 1,994,700 2,000,000 3.50% 0.0135FEDERAL HOME LN BKS FIXED RATE 1,988,160 2,000,000 3.50% 0.0138FEDERAL HOME LN BKS FIXED RATE 994,350 1,000,000 1.75% 0.0155FEDERAL HOME LN BKS STEP UP 2,753,273 2,750,000 4.81% 0.0224FEDERAL HOME LOAN MORTGAGE 999,110 1,000,000 1.75% 0.0200FEDERAL HOME LOAN MORTGAGE 1,004,010 1,000,000 1.75% 0.0286FEDERAL HOME LOAN MORTGAGE 1,001,520 1,000,000 1.75% 0.0299FEDERAL HOME LOAN MORTGAGE 1,003,710 1,000,000 1.75% 0.0269FEDERAL HOME LOAN MORTGAGE 1,001,140 1,000,000 1.75% 0.0274FEDERAL HOME LOAN MORTGAGE 1,996,080 2,000,000 3.50% 0.0125FEDERAL HOME LOAN MORTGAGE 999,500 1,000,000 1.75% 0.0200FEDERAL HOME LOAN MORTGAGE 1,999,920 2,000,000 3.50% 0.0175Total US Government 19,723,193 19,750,000 34.52%
TOTALS 57,249,856$ 57,212,535$ 100.00%
Note: The investment listing above excludes investments in mutual funds and local obligation bonds held by fiscal agents.
Sources: City of Union City Finance Department
Footnotes: None
Investment
225
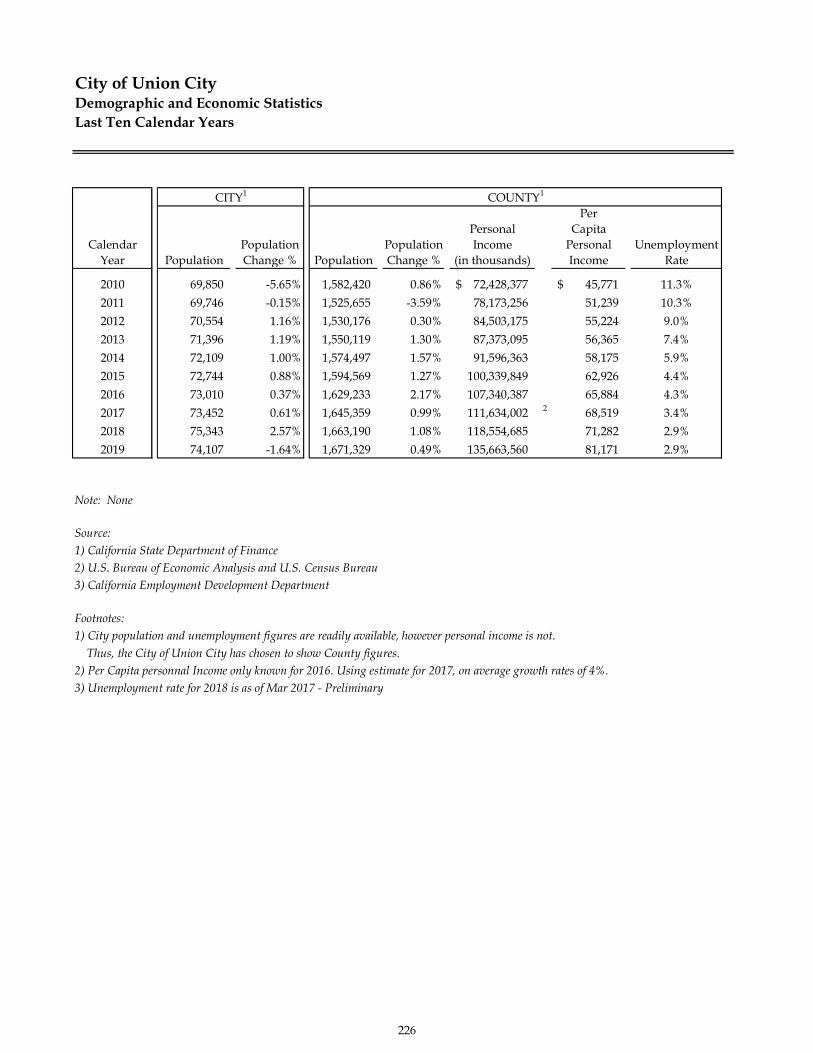
City of Union CityDemographic and Economic StatisticsLast Ten Calendar Years
PerPersonal Capita
Calendar Population Population Income Personal UnemploymentYear Population Change % Population Change % (in thousands) Income Rate
2010 69,850 -5.65% 1,582,420 0.86% 72,428,377$ 45,771$ 11.3%2011 69,746 -0.15% 1,525,655 -3.59% 78,173,256 51,239 10.3%2012 70,554 1.16% 1,530,176 0.30% 84,503,175 55,224 9.0%2013 71,396 1.19% 1,550,119 1.30% 87,373,095 56,365 7.4%2014 72,109 1.00% 1,574,497 1.57% 91,596,363 58,175 5.9%2015 72,744 0.88% 1,594,569 1.27% 100,339,849 62,926 4.4%2016 73,010 0.37% 1,629,233 2.17% 107,340,387 65,884 4.3%2017 73,452 0.61% 1,645,359 0.99% 111,634,002 2 68,519 3.4%2018 75,343 2.57% 1,663,190 1.08% 118,554,685 71,282 2.9%2019 74,107 -1.64% 1,671,329 0.49% 135,663,560 81,171 2.9%
Note: None
Source: 1) California State Department of Finance2) U.S. Bureau of Economic Analysis and U.S. Census Bureau3) California Employment Development Department
Footnotes: 1) City population and unemployment figures are readily available, however personal income is not. Thus, the City of Union City has chosen to show County figures.2) Per Capita personnal Income only known for 2016. Using estimate for 2017, on average growth rates of 4%.3) Unemployment rate for 2018 is as of Mar 2017 - Preliminary
COUNTY1CITY1
226

City of Union CityPrincipal EmployersCurrent Year and Nine Years Ago
Number of Percent of TotalEmployer Employees EmploymentAverage Annual Employment1
37,000 100%1 New Haven Unified School District 1,196 3.23%2 Southern Glazer's Wine-spirits 600 1.62%3 Walmart 534 1.44%4 Masonic Home For Adults 498 1.35%5 Abaxis Inc 400 1.08%6 Mizuho Orthopedic Systems Inc 400 1.08%7 Sterling Foods 400 1.08%8 City of Union City 313 0.85%9 Emerald Packaging 245 0.66%
10 American Licorice 239 0.65%
Number of Percent of TotalRank Employer Employees Employment
Average Annual Employment1 30,300 100%1 Axygen Biosciene Inc 1,200 3.96%2 New Haven Unified School District 1,139 3.76%3 Wal-Mart 500 1.65%4 Young's Market Co LLC 400 1.32%5 City of Union City 353 1.17%6 American Licorice 350 1.16%7 Southern Wine and Spirts 350 1.16%8 Hearst Corp 300 0.99%9 Rapid Displays 300 0.99%
10 Hearst Communications Inc 300 0.99%
Note: None1) Employement data is shown on a Calender Year Basis.
Sources: 1) Union City Chamber of Commerce2) New Haven Unified School District3) City of Union City Personnel Department4) State of California Employment Development Department5) Union City Business' Finance/ HR Department, who provided employment information
Footnotes: None
2019
2010
227
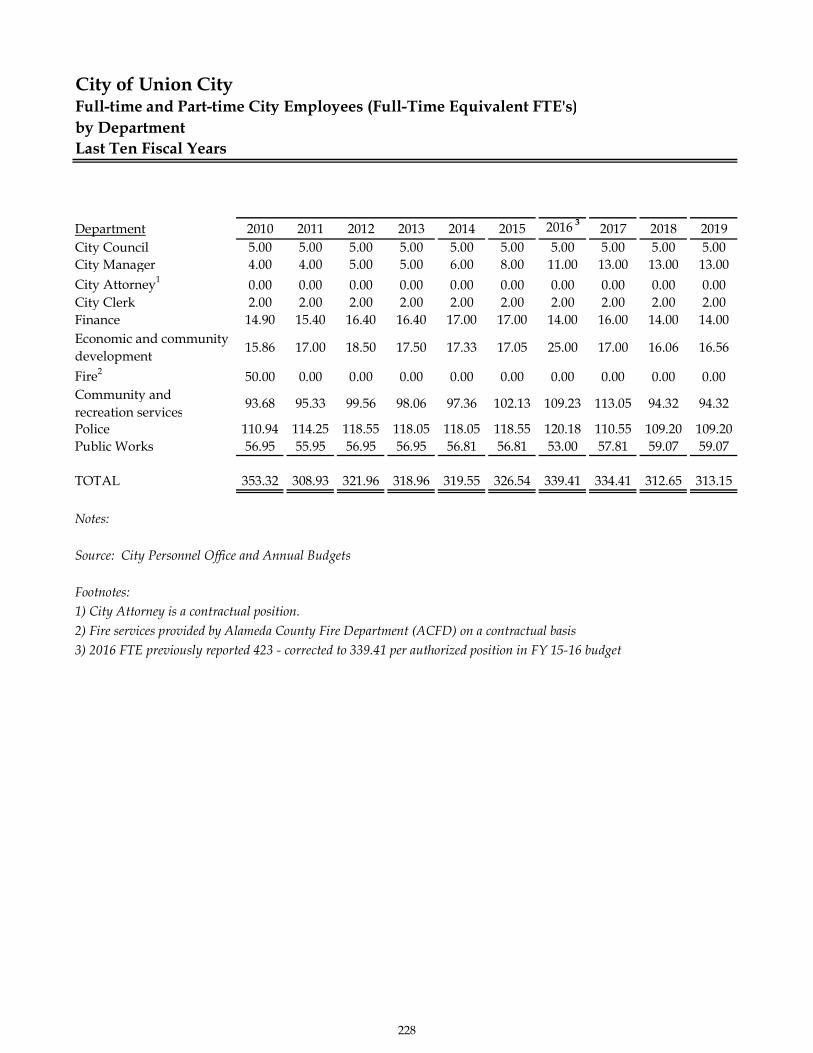
City of Union CityFull-time and Part-time City Employees (Full-Time Equivalent FTE's)by DepartmentLast Ten Fiscal Years
Department 2010 2011 2012 2013 2014 2015 2016 3 2017 2018 2019City Council 5.00 5.00 5.00 5.00 5.00 5.00 5.00 5.00 5.00 5.00City Manager 4.00 4.00 5.00 5.00 6.00 8.00 11.00 13.00 13.00 13.00City Attorney1 0.00 0.00 0.00 0.00 0.00 0.00 0.00 0.00 0.00 0.00City Clerk 2.00 2.00 2.00 2.00 2.00 2.00 2.00 2.00 2.00 2.00Finance 14.90 15.40 16.40 16.40 17.00 17.00 14.00 16.00 14.00 14.00Economic and community development 15.86 17.00 18.50 17.50 17.33 17.05 25.00 17.00 16.06 16.56
Fire2 50.00 0.00 0.00 0.00 0.00 0.00 0.00 0.00 0.00 0.00Community and recreation services 93.68 95.33 99.56 98.06 97.36 102.13 109.23 113.05 94.32 94.32
Police 110.94 114.25 118.55 118.05 118.05 118.55 120.18 110.55 109.20 109.20Public Works 56.95 55.95 56.95 56.95 56.81 56.81 53.00 57.81 59.07 59.07
TOTAL 353.32 308.93 321.96 318.96 319.55 326.54 339.41 334.41 312.65 313.15
Notes:
Source: City Personnel Office and Annual Budgets
Footnotes:1) City Attorney is a contractual position.2) Fire services provided by Alameda County Fire Department (ACFD) on a contractual basis3) 2016 FTE previously reported 423 - corrected to 339.41 per authorized position in FY 15-16 budget
228

OPERATING INFORMATION
Operating Indicators by Function – Last Ten Fiscal Years
Capital Asset Statistics by Function – Last Ten Fiscal Years
Miscellaneous Statistics - Last Ten Fiscal Years
229
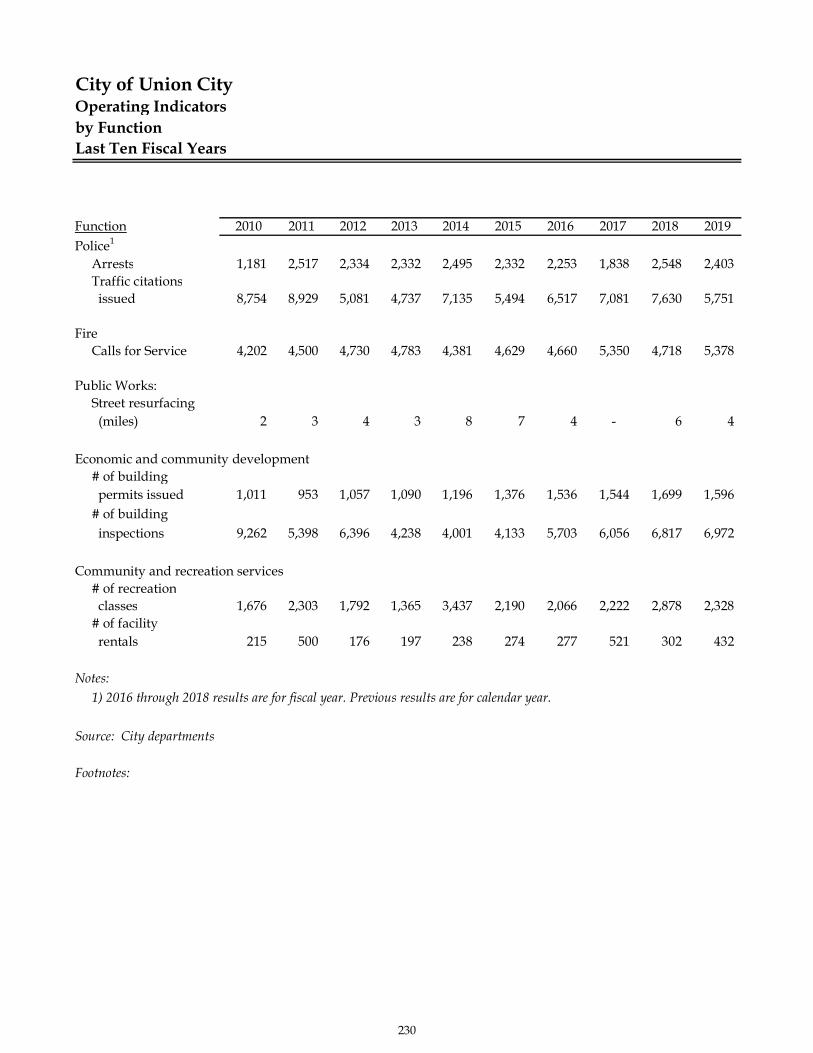
City of Union CityOperating Indicatorsby FunctionLast Ten Fiscal Years
Function 2010 2011 2012 2013 2014 2015 2016 2017 2018 2019Police1
Arrests 1,181 2,517 2,334 2,332 2,495 2,332 2,253 1,838 2,548 2,403Traffic citations issued 8,754 8,929 5,081 4,737 7,135 5,494 6,517 7,081 7,630 5,751
FireCalls for Service 4,202 4,500 4,730 4,783 4,381 4,629 4,660 5,350 4,718 5,378
Public Works:Street resurfacing (miles) 2 3 4 3 8 7 4 - 6 4
Economic and community development# of building permits issued 1,011 953 1,057 1,090 1,196 1,376 1,536 1,544 1,699 1,596# of building inspections 9,262 5,398 6,396 4,238 4,001 4,133 5,703 6,056 6,817 6,972
Community and recreation services# of recreation classes 1,676 2,303 1,792 1,365 3,437 2,190 2,066 2,222 2,878 2,328# of facility rentals 215 500 176 197 238 274 277 521 302 432
Notes: 1) 2016 through 2018 results are for fiscal year. Previous results are for calendar year.
Source: City departments
Footnotes:
230
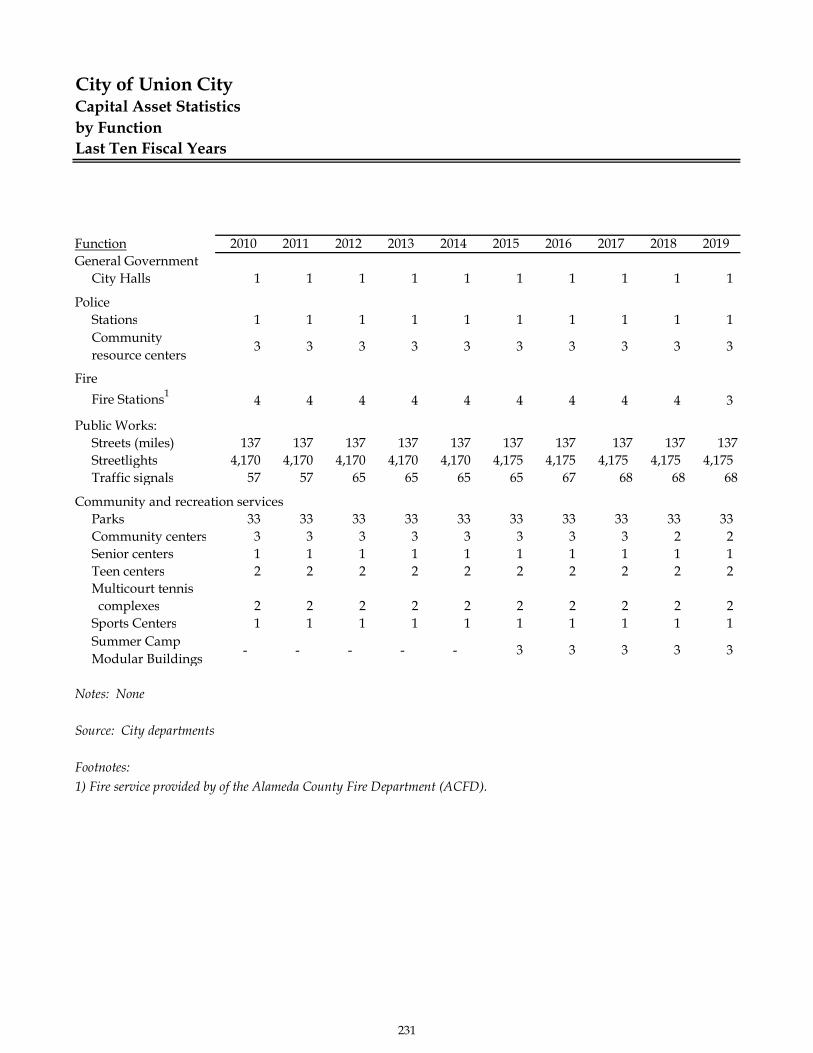
City of Union CityCapital Asset Statisticsby FunctionLast Ten Fiscal Years
Function 2010 2011 2012 2013 2014 2015 2016 2017 2018 2019General Government
City Halls 1 1 1 1 1 1 1 1 1 1
PoliceStations 1 1 1 1 1 1 1 1 1 1Community resource centers 3 3 3 3 3 3 3 3 3 3
FireFire Stations1 4 4 4 4 4 4 4 4 4 3
Public Works:Streets (miles) 137 137 137 137 137 137 137 137 137 137Streetlights 4,170 4,170 4,170 4,170 4,170 4,175 4,175 4,175 4,175 4,175Traffic signals 57 57 65 65 65 65 67 68 68 68
Community and recreation servicesParks 33 33 33 33 33 33 33 33 33 33Community centers 3 3 3 3 3 3 3 3 2 2Senior centers 1 1 1 1 1 1 1 1 1 1Teen centers 2 2 2 2 2 2 2 2 2 2Multicourt tennis complexes 2 2 2 2 2 2 2 2 2 2Sports Centers 1 1 1 1 1 1 1 1 1 1Summer Camp Modular Buildings - - - - - 3 3 3 3 3
Notes: None
Source: City departments
Footnotes: 1) Fire service provided by of the Alameda County Fire Department (ACFD).
231
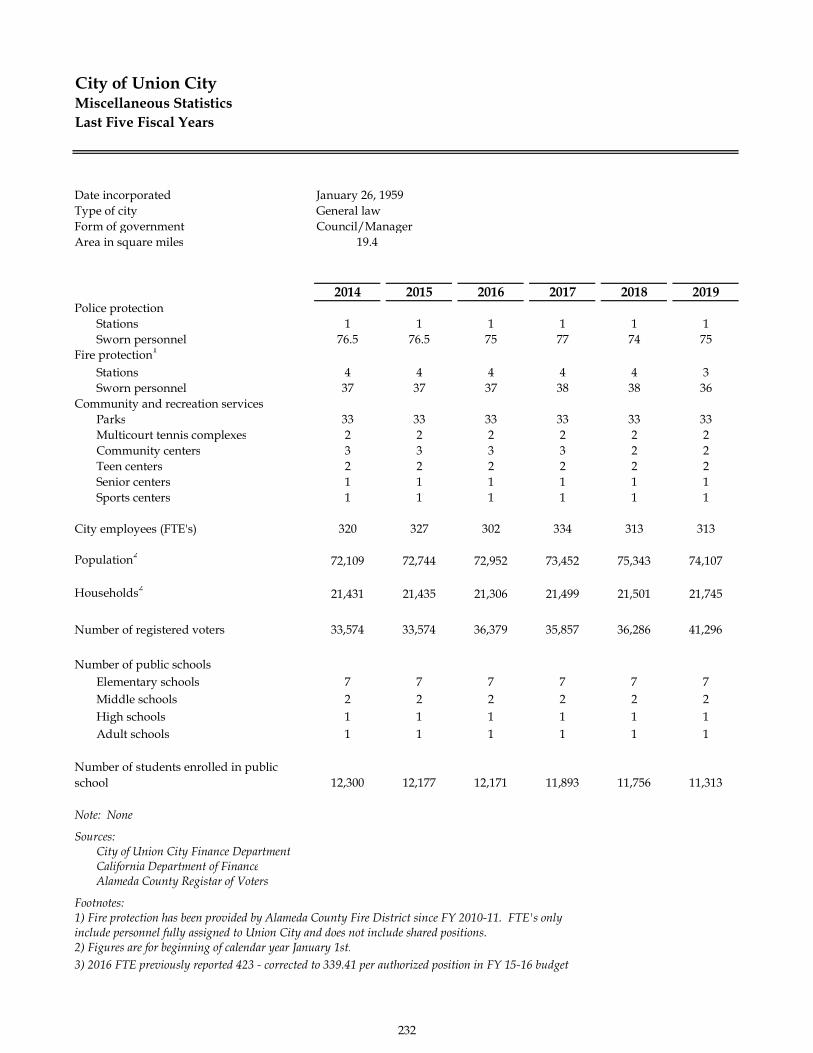
City of Union CityMiscellaneous StatisticsLast Five Fiscal Years
Date incorporated January 26, 1959Type of city General lawForm of government Council/ManagerArea in square miles 19.4
2014 2015 2016 2017 2018 2019Police protection
Stations 1 1 1 1 1 1Sworn personnel 76.5 76.5 75 77 74 75
Fire protection1
Stations 4 4 4 4 4 3Sworn personnel 37 37 37 38 38 36
Community and recreation servicesParks 33 33 33 33 33 33Multicourt tennis complexes 2 2 2 2 2 2Community centers 3 3 3 3 2 2Teen centers 2 2 2 2 2 2Senior centers 1 1 1 1 1 1Sports centers 1 1 1 1 1 1
City employees (FTE's) 320 327 302 334 313 313
Population2 72,109 72,744 72,952 73,452 75,343 74,107
Households2 21,431 21,435 21,306 21,499 21,501 21,745
Number of registered voters 33,574 33,574 36,379 35,857 36,286 41,296
Number of public schoolsElementary schools 7 7 7 7 7 7Middle schools 2 2 2 2 2 2High schools 1 1 1 1 1 1Adult schools 1 1 1 1 1 1
12,300 12,177 12,171 11,893 11,756 11,313
Note: None
Sources: City of Union City Finance DepartmentCalifornia Department of FinanceAlameda County Registar of Voters
Footnotes: 1) Fire protection has been provided by Alameda County Fire District since FY 2010-11. FTE's onlyinclude personnel fully assigned to Union City and does not include shared positions.2) Figures are for beginning of calendar year January 1st.3) 2016 FTE previously reported 423 - corrected to 339.41 per authorized position in FY 15-16 budget
Number of students enrolled in public school
232