city's cash annual report and financial statements · annual report and financial statements...
TRANSCRIPT

CITY’S CASH
ANNUAL REPORT AND FINANCIAL STATEMENTS
FOR THE YEAR ENDED
31 MARCH 2016
CONTENTS
Page
Annual Report 1
Adoption of the Annual Report and Financial Statements 11
Independent Auditor’s Report 12
Report of the Audit Review Panel 14
Consolidated Statement of Comprehensive Income 15
Consolidated Statement of Financial Position 16
Consolidated Statement of Changes in Equity 17
Consolidated Statement of Cash Flows 18
Statement of Significant Accounting Policies 19
Notes to the Consolidated Financial Statements 27

Annual Report
1. Introduction
City’s Cash is a fund of the City of London Corporation that can be traced back to the 15th
century and has built up from a combination of properties, land, bequests and transfers under
statute since that time. Investments in properties, stocks and shares are managed to provide a total
return that:
allows the City Corporation to use the income for the provision of services (detailed in section
4) that are of importance to Greater London and the whole UK as well as to the City; and
maintains the asset base so that income will also be available to fund services for the benefit
of future generations.
The financial statements have been prepared in accordance with Financial Reporting Standard 102
as issued by the Financial Reporting Council. The City of London Corporation publishes the
City’s Cash Annual Report and Financial Statements and a ‘City’s Cash Overview’ every year to
provide further transparency on its activities.
2. Administrative Details
Registered Address Guildhall, London, EC2P 2EJ
Chief Executive The Town Clerk of the City of London
Treasurer The Chamberlain of London
Solicitor The Comptroller and City Solicitor
Bank Lloyds Bank plc
Discretionary Fund Artemis Investment Management Ltd;
Managers Carnegie Financial Services SA;
GMO (UK) Ltd;
M&G Investment Management Ltd;
Natixis International Funds (Harris Associates);
Pyrford International Plc;
Ruffer LLP;
Southeastern Asset Management Inc.;
Standard Life Investments Ltd;
Veritas Asset Management LLP; and
Wellington Management International.
Chartered Accountants and Moore Stephens LLP.
Statutory Auditor
3. Other City of London Corporation Funds
This annual report and the financial statements only cover City’s Cash: this is one of three funds
from which the City Corporation pays for its services. The others are City Fund and Bridge House
Estates.
City Fund covers the City’s activities as a local authority, police authority, and port health
authority. The financial statements are published separately.
1

Bridge House Estates is a registered charity. It was originally set up from bridge taxes, rents and
private bequests to deal with the upkeep of London Bridge. The charity now funds the
maintenance of Tower, London, Southwark, Millennium and Blackfriars Bridges. As the funds
have been managed effectively over the centuries, BHE now also helps charitable causes across
London through the City Bridge Trust with grants between £15m and £20m every year. The
annual report and financial statements for this fund are also published separately including a list
of grants awarded.
4. Activities of City’s Cash
Returns from investments allow the City Corporation to provide services that:
are of national benefit through its core objective to promote UK-based financial services, and
related professional services, at home and abroad; and
are of importance to Greater London and its environs as well as to the City itself, for
example, work in surrounding boroughs supporting education, training and employment
opportunities; numerous green spaces, wholesale markets providing fish (Billingsgate) and
meat (Smithfield), schools (City of London School, City of London School for Girls, City of
London Freemen’s School, Academies across London and the Guildhall School of Music &
Drama).
Education
Gross Expenditure £71.4m, Gross Income £58.0m, Net Expenditure £13.4m
The City Corporation maintains three fee paying schools – City of London School, City of
London School for Girls (both in the Square Mile), and the City of London Freemen’s School (in
Surrey). They regularly feature among the UK’s top performing schools. In each of these
institutions, the City of London Corporation provides scholarships and academic bursaries,
including match funding for monies raised externally by the schools, to support able students from
disadvantaged backgrounds. Over 300 students currently receive support.
The Guildhall School of Music & Drama is owned, funded and managed by the City Corporation.
It is an internationally-renowned conservatoire; based in the Barbican, it has over 800 students in
higher education, drawn from nearly 60 countries around the world, and is regulated by the
Higher Education Funding Council for England in-line with other higher education institutions.
The City of London Corporation’s Education Board is responsible for reviewing the Education
Strategy and making recommendations to committees and the Court of Common Council (the
City Corporation’s main decision-making body) as appropriate on the delivery of the City
Corporation’s vision and strategic objectives in this area. The Board has responsibility for
distributing funds allocated to it for educational purposes. In addition it is responsible for the City
Corporation’s role as an Academy school sponsor.
Markets
Gross Expenditure £10.4m, Gross Income £10.5m, Net Income £0.1m
The City Corporation runs three wholesale food markets two of which, Billingsgate and
Smithfield, are funded by City’s Cash. New Spitalfields Market is accounted for in the City Fund.
Market tenants pay rent and service charges, which are calculated on a commercial basis. These
charges cover the costs of operation, administration and those repairs which are attributable to the
tenants. Billingsgate allows buyers to choose from the largest selection of fish in the UK, with an
2

annual turnover of some 25,000 tonnes. Meat has been bought and sold at Smithfield for over 800
years; its magnificent Grade II* listed surroundings see around 120,000 tonnes of meat pass
through each year.
Open Spaces
Gross Expenditure £21.5m, Gross Income £4.2m, Net Expenditure £17.3m
The City Corporation looks after 11,000 acres of open spaces across London and beyond,
including Hampstead Heath and Epping Forest. Some of the sites have been owned and managed
since as far back as 1870, protecting them from development and preserving them as a natural
resource. They include important wildlife habitats, Sites of Special Scientific Interest, National
Nature Reserves and outdoor space for sport, recreation and enjoyment for the public. Annual
visits to the open spaces are estimated at over 23 million.
In accordance with statutory requirements a capital project to mitigate the risks of serious flooding
from Hampstead Heath Ponds began in April 2015. The works are due to complete in October
2016 at a cost of around £21m.
City Representation
Gross Expenditure £12.3m, Gross Income £0.8m, Net Expenditure £11.5m
This expenditure supports the City Corporation’s core objective to promote UK-based financial
services, and related professional services, at home and abroad. The Lord Mayor’s overseas visits
programme, amounting to around 90 days abroad each year, fosters trade and develops
relationships at the highest levels of government and industry. The Chairman of the Policy and
Resources Committee also visits a number of major global financial centres each year. High
profile government and industry delegations are welcomed to Mansion House and Guildhall, often
on behalf of the UK government. Events hosted range from small receptions to major national
occasions, such as State or Guest of Government visits. The City’s diplomatic relationships are
also strengthened through the London Diplomatic Corps.
Mansion House is the official residence of the Lord Mayor as the head of the City Corporation
and the base for Mayoral activities. City’s Cash funds official receptions, banquets, meetings and
general hospitality carried out by the City Corporation (as well as the overall running costs of
Mansion House and the team based there).
Other important responsibilities include: support for the City Corporation’s many and varied civic
activities; maintaining the Mayoralty’s close ties with livery companies and supporting corporate
social responsibility and charitable organisations. The Sheriffs support Lord Mayors during their
year of office and Her Majesty’s Judges sitting at the Central Criminal Court.
The Remembrancer is one of the City Corporation's four Law Officers and the Office is
responsible for the maintenance and protection of the City’s constitution. He is the City's
Parliamentary Agent and the Parliamentary Agent for the Honourable the Irish Society, and the
City Corporation’s Chief of Protocol. The Office acts as a channel of communication between
Parliament and the City. In the contemporary context, this means day to day examination of
Parliamentary business including examination of and briefing on proposed legislation and
amendments to it, regular liaison with the Select Committees of both Houses and contact with
officials in Government departments dealing with Parliamentary Bills. Liaison is also maintained
with the City Office in Brussels and other Member States’ permanent representations in relation to
draft EU legislation.
3

4
The Remembrancer’s Office also organises much of the hospitality referred to above including
responsibility for the Lord Mayor’s Banquet and elements of the Lord Mayor’s Day at Guildhall
and the Royal Courts of Justice.
Income is generated from lettings at the Mansion House and charges by the Remembrancer to
other City Corporation funds for parliamentary work.
Economic Development
Gross Expenditure £3.8m, Gross Income £0.4m, Net Expenditure £3.4m
Economic development work is dedicated to supporting and promoting the City’s
competitiveness. One of its main aims is to increase the capacity of the wider London community
and especially our neighbouring boroughs. This work ranges from encouraging corporate
responsibility in City firms to assisting in regeneration work, education, training, skills
development and promoting entrepreneurship. The City Corporation also works to establish the
best market conditions in which enterprise and innovation can flourish. The City Corporation’s
Office in Brussels helps to shape legislation that affects UK business and the City’s message is put
across to decision makers in Westminster and Whitehall. The City Corporation leads business
delegations on overseas visits and high level inward visits are hosted by the Lord Mayor and
Chairman of the Policy and Resources Committee.
Management and Administration
Gross Expenditure £7.7m, Gross Income £nil, Net Expenditure £7.7m
These costs primarily relate to support provided to Members by both central and service
departments including an apportionment of Guildhall Complex premises expenses; City’s Cash
external audit fees; treasury management; and depreciation charges in respect of the City’s Cash
share of capital projects relating to the Guildhall Complex, information systems and other
corporate priorities.
Grants and Other Activities
Gross Expenditure £6.6m, Gross Income £0.9m, Net Expenditure £5.7m
A number of grants are made from City’s Cash each year, usually where organisations have a
strong City connection or are involved in a special nationwide activity, including charity and
educational activities. The grants can encourage companies to become more involved in their
community; assist, support and advise policy makers on health issues affecting the capital; and
support organisations that promote our work at home and abroad. In addition grants are made to
emergency organisations to assist with the relief of national and international disasters.
The City Corporation owns and maintains the Monument. This 202ft high building attracts over
230,000 visitors a year, braving its 311 steps to enjoy breath-taking views of the City and beyond.
It was built in 1671-7 and was designed by Sir Christopher Wren and Robert Hooke to
commemorate the Great Fire of London in 1666.
5. Governance Arrangements
City’s Cash is managed by committees of the City of London Corporation, with Membership of the
committees drawn from the Court of Aldermen and the Court of Common Council. Members of the
Court of Aldermen and Court of Common Council are elected by registered voters (both residents
and workers) within the City of London. In determining appointments to committees, the Court of

5
Aldermen and Court of Common Council will take into consideration any particular expertise and
knowledge of the Aldermen and Members.
The decision making processes and financial stewardship of the City of London Corporation are set
out in Standing Orders and Financial Regulations respectively. The Standing Orders are available on
the City Corporation’s website at www.cityoflondon.gov.uk.
The City of London has established a robust programme of risk management as a key element of
its strategy to preserve its assets, enhance efficiency for service users and members of the public
and protect its employees.
The Audit and Risk Management Committee monitors and oversees the City’s Risk Management
Strategy which aligns the key principles of ISO31000: Risk Management Principles and
Guidelines, and BS 31100: Risk Management Code of Practice, and defines clearly the roles and
responsibilities of officers, senior management and Members. The Strategy emphasises risk
management as a key element within the City Corporation’s systems of corporate governance and
establishes a clear system for the evaluation of risk and escalation of emerging issues to the
appropriate scrutiny level.
The Corporate Risk Register codifies key strategic risks and assigns responsibility for taking
action to mitigate each risk to a named Chief Officer.
The Chief Officer Risk Management Group has a remit to ensure that risk management policies
are applied, that there is an on-going review of risk management activity and that appropriate
advice and support is provided to Members and officers.
An Audit Review Panel of senior representatives from medium to large audit firms reviews the
processes adopted by the incumbent auditor and provides independent confirmation that the audit
has been conducted in accordance with International Standards on Auditing (UK and Ireland).
6. Financial Review
As set out in the following table, the Consolidated Statement of Comprehensive Income records a
surplus for the year of £184.9m (2014/15: surplus of £247.3m restated) on expenditure of £160.2m
(2014/15: £154.4m restated). This surplus is after benefitting from a gain in fair value of property
investments of £222.5m and a £7.5m profit on the sale of fixed assets, partly offset by a loss in fair
value of non-property investments of £8.4m. Without these items the underlying position would
have been a deficit of £28.4m (2014/15: underlying deficit of £24.4m restated).

6
Income and Expenditure for the year ended 31 March 2016:
2016 2016 2016 2015 2015 2015
Income Expend Net Income Expend Net
- iture income - iture income
/ (cost) / (cost)
Restated Restated Restated
£m £m £m £m £m £m
Service / activity
Property Investment Estate 55.3 14.3 41.0 54.8 15.4 39.4
Non-Property Investments 1.7 5.1 (3.4) 2.0 3.6 (1.6)
Education 58.0 71.4 (13.4) 55.7 70.0 (14.3)
Markets 10.5 10.4 0.1 10.9 11.8 (0.9)
Open Spaces 4.2 21.5 (17.3) 4.5 21.2 (16.7)
City Representation 0.8 12.3 (11.5) 0.7 12.2 (11.5)
Economic Development 0.4 3.8 (3.4) 0.4 3.3 (2.9)
Management & Administration - 7.7 (7.7) - 8.0 (8.0)
Grants and other activities 0.9 6.6 (5.7) 1.0 6.3 (5.3)
Net Pension Scheme Costs - 7.1 (7.1) - 2.6 (2.6)
Operating surplus/(deficit)
before gain/(loss) in fair 131.8 160.2 (28.4) 130.0 154.4 (24.4)
value of investments *
Gain/(loss) in fair value of:
- property investments 222.5 186.7
- non-property investments (8.4) 70.6
Operating surplus * 185.7 232.9
Profit on Sale of Fixed Assets 7.5 14.3
Net financing income / (costs)
attributable to the pension scheme (8.3) 0.1
Deficit before taxation 184.9 247.3
Taxation - -
Surplus / (deficit) for the year 184.9 247.3
* volatility in operating surplus for the financial year – FRS102 requires the gain or loss in fair
value of property and non-property investments to be included in the Consolidated Statement of
Comprehensive Income (page 15). This means that even relatively small movements in the
markets from one year to the next produce large volatility in the operating surplus or deficit in the
Consolidated Statement of Comprehensive Income. However, both the Consolidated Statement
of Comprehensive Income and the above table show the operating position before the gain or loss
in fair value of property and non-property investments, which reduces the movement (volatility)

7
between the years from £47.2m (operating surplus of £185.7m in 2015/16 compared to the
operating surplus of £232.9m in 2014/15 restated) to £4.0m (£28.4m deficit in 2015/16 less the
deficit of £24.4m in 2014/15) and is more reflective of the underlying position on operations.
The unfavourable movement in the operating position of £47.2m, from a surplus of £232.9m in
2014/15 (restated) to a surplus of £185.7m in 2015/16, is largely due to:
the gain in fair value from non-property investments reducing by £79.0m, from a gain of
£70.6m in 2014/15 moving to a loss of £8.4m in 2015/16;
an increase of £4.5m in net pension scheme costs mainly due to a rise in current service costs
of £3.8m, from £12.1m in 2014/15 to £15.9m in 2015/16, which are calculated using an
estimate of the average total pensionable pay during the year. In addition, there was an
increase in losses on settlements and curtailments of £0.8m, from £0.1m in 2014/15 to £0.9m
in 2015/16. This was due to the number of former employees being entitled to unreduced early
retirement benefits increasing from 8 in 2014/15 to 16 in 2015/16 and the associated
capitalised costs of the additional benefits;
Partly offset by:
the gain in fair value from property investments increasing by £35.8m, from a gain of £186.7m
in 2014/15 to a gain of £222.5m in 2015/16;
net expenditure on education decreasing by £0.9m mainly due to fee increases at the City’s
three fee paying schools; and
net expenditure on markets decreasing by £1.0m due to savings at Smithfield Market,
including lower energy charges as a result of the fall in the price of oil, a planned reduction in
repairs and maintenance, insurance cost savings from a review of buildings requiring cover,
employee cost savings as part of planned service levels and increases in income from rents,
filming and parking.
Overall, City’s Cash reserves have increased by £208.4m from £2,120.6m (restated) to £2,329.0m
(2014/15: increase in reserves of £196.0m). The increase comprises the surplus for the year of
£184.9m (2014/15: £247.3m - restated), recognised but unrealised losses on listed investments
with fund managers of £1.8m (2014/15: gains of £1.9m), and an actuarial gain on the defined
benefit pension scheme of £25.3m (2014/15: loss of £53.2m).
City of London Pension Scheme
The estimated share of the net liability in the City of London Pension Scheme is included in the City’s
Cash accounts. The City’s Cash share of the deficit is 48% which equates to £231.7m at 31 March
2016 (£240.3m at 31 March 2015).
City’s Cash does not have an exclusive relationship with the City of London Pension Fund and the
proportion of the Pension Fund relating to City of London employee members engaged on City’s
Cash activities is not separately identifiable.
However, although the Pension Fund net deficit cannot be attributed precisely between the City of
London’s three main funds, an apportionment of that deficit and inclusion in the respective balance
sheets presents a fairer view of the funds’ financial positions than if the deficit were to continue to be

8
excluded. Accordingly an apportionment has been made which is based on employer’s annual
contributions to the fund.
Further details of the City of London Pension Scheme can be found in note 17 to the financial
statements.
Teachers’ Pension Scheme
In addition to City of London Corporation employees being able to participate in the City of London
Pension Scheme, teachers at the City of London Corporation’s four private schools are eligible to
participate in the Teachers’ Pension Scheme (TPS). The share of the net liability in the TPS
attributable to the City’s private schools is £12.5m (2015: £13.8m) and is included in the
Consolidated Statement of Financial Position.
Going Concern
The City of London Corporation considers City’s Cash to be a going concern as set out in note b)
of the Statement of Significant Accounting Policies.
Financial Commitment
The City of London Corporation has agreed a £50.0m contribution to Crossrail from City’s Cash
upon completion of the project. Subject to completion of the works, the contribution will be made
in equal instalments during 2018/19 and 2019/20.
In addition, there is a contractual commitment of £4.0m relating to the flood mitigation works to
the Hampstead Heath ponds which are being undertaken in accordance with statutory
requirements.
Events after the reporting date
There are risks to City’s Cash from the vote to leave the EU. In particular, the future levels of
demand for office accommodation in the City and surrounding areas and the consequential
impacts on rent incomes. A close watching brief will be kept on this and other implications as
events unfold during the coming months with financial forecasts being refreshed if and when the
picture becomes clearer.
7. Explanation of the Financial Statements
City’s Cash financial statements for the year ended 31 March 2016 have been prepared in
accordance with Financial Reporting Standard 102 (FRS102) as issued by the Financial Reporting
Council for accounting periods on or after 1 January 2015. Prior to the adoption of FRS102 City’s
Cash financial statements were prepared in accordance with United Kingdom Generally Accepted
Accounting Practice (UK GAAP), referred to below as ‘previous UK GAAP’. City’s Cash last
financial statements prepared in accordance with previous UK GAAP were for the year ended 31
March 2015.
Note 1 to the consolidated financial statements on page 27 describes the differences between the
funds and surplus presented under the previous UK GAAP and the newly presented amounts
under FRS102 for the reporting period ended at 31 March 2015 (ie comparative information), as
well as the funds presented in the opening statement of financial position (ie at 1 April 2014). It
also describes the changes in accounting policies made on first-time adoption of FRS102.

9
The City’s Cash financial statements consist of the following:
Consolidated Statement of Comprehensive Income showing all resources available and all
expenditure incurred,
Consolidated Statement of Financial Position setting out the assets, liabilities and funds of
City’s Cash,
Consolidated Statement of Changes in Equity which includes the profit or loss for the
period together with other recognised gains and losses and reconciles to the total movement
in reserves,
Consolidated Statement of Cash Flows showing the movement of cash for the year, and
Notes to the financial statements explaining the accounting policies adopted and
explanations of figures contained in the financial statements.
The following separate entities have been consolidated with City’s Cash accounts:
Registered charities which are managed and funded by the City Corporation:
- Ashtead Common,
- Burnham Beeches,
- Epping Forest,
- Hampstead Heath
- Hampstead Heath Trust,
- Highgate Wood and Queen’s Park Kilburn,
- West Ham Park,
- West Wickham Common, Spring Park Wood and Coulsdon and other Commons, and
- Sir Thomas Gresham Charity.
City Re Limited - a wholly owned subsidiary company whose principal activity is to
provide re-insurance protection. The company was incorporated in Guernsey, registration
number 52816, and the Directors’ Report and Financial Statements are available at
www.cityoflondon.gov.uk. The company allows the City to share in underwriting profits
with a known capped downside financial risk of £250,000 per claim.
8. Disclosure of Information to Moore Stephens
At the date of approval of this report, the City of London Corporation confirms that:
so far as it is aware, there is no relevant audit information of which Moore Stephens is
unaware; and
it has taken all the steps that it ought to have taken in order to make itself aware of any
relevant audit information and to establish that Moore Stephens are aware of that
information.
9. Responsibilities of the City of London Corporation for the Annual Report and Financial
Statements
The City of London Corporation is responsible for preparing the Annual Report and Financial
Statements for each financial year in accordance with applicable law and regulations. The City of
London Corporation has elected to prepare the financial statements in accordance with the
Financial Reporting Standard applicable in the UK and Republic of Ireland (FRS 102). The
financial statements would not be approved by the City of London Corporation unless it is
satisfied that they give a true and fair view of the state of affairs of the organisation and of the

10
surplus or deficit of the organisation for that period. In preparing these financial statements, the
City of London Corporation has:
selected suitable accounting policies and then applied them consistently;
made judgements and accounting estimates that are reasonable and prudent;
stated whether applicable UK Accounting Standards have been followed, subject to any
material departures disclosed and explained in the financial statements; and
prepared the financial statements on the going concern basis.
The City of London Corporation is responsible for keeping adequate accounting records that are
sufficient to show and explain the company’s transactions and disclose with reasonable accuracy at
any time the financial position of the organisation and enable it to ensure that the financial
statements comply with applicable law and regulations. It is also responsible for safeguarding the
assets of the organisation and hence for taking reasonable steps for the prevention and detection of
fraud and other irregularities.
The City of London Corporation is responsible for the maintenance and integrity of the corporate
and financial information included in its website.
11
Adoption of the Annual Report and Financial Statements
At a meeting of the Finance Committee held at Guildhall on 15 November 2016, the financial
statements of City’s Cash were approved on behalf of the Court of Common Council.
Jeremy Paul Mayhew MA MBA Roger A. H. Chadwick
Chairman of Finance Committee Deputy Chairman of Finance Committee
Guildhall, London.
15 November 2016

12
Independent Auditor’s Report to the City of London Corporation
We have audited the financial statements of the portion of the City of London Corporation called
City's Cash for the year ended 31 March 2016 which are set out on pages 15 to 63. The financial
reporting framework that has been applied in their preparation is United Kingdom Accounting
Standards (United Kingdom Generally Accepted Accounting Practice).
This report is made solely to the City of London Corporation in accordance with our terms of
engagement. Our audit work has been undertaken so that we might state to the City of London
Corporation those matters we are required to state to it in an auditor’s report and for no other purpose.
To the fullest extent permitted by law, we do not accept or assume responsibility to anyone other than
City’s Cash and the City of London Corporation as a body for our audit work, for this report, or for
the opinions we have formed.
Respective responsibilities of the City of London Corporation and auditor
As explained more fully in the Statement of Responsibilities of the City of London Corporation set
out on pages 9 to 10, the City of London Corporation is responsible for the preparation of the financial
statements and for being satisfied that they give a true and fair view. Our responsibility is to audit and
express an opinion on the financial statements in accordance with International Standards on Auditing
(UK and Ireland). Those standards require us to comply with the Auditing Practices Board’s (APB’s)
Ethical Standards for Auditors.
Scope of the audit of the financial statements
A description of the scope of an audit of financial statements is provided on the Financial Reporting
Council’s web-site at www.frc.org.uk/auditscopeukprivate.

13
Opinion on financial statements
In our opinion the financial statements:
give a true and fair view of the state of the group’s and City’s Cash’s affairs as at 31 March
2016 and of the group’s deficit for the year then ended; and
have been properly prepared in accordance with United Kingdom Generally Accepted Accounting
Practice.
Date:
Moore Stephens LLP
Chartered Accountants and Registered Auditor
150 Aldersgate Street
London
EC1A 4AB

14
Report of the Audit Review Panel to the Right Honourable the Lord Mayor, Aldermen and Livery of the several Companies of the City of London in Common Hall assembled
We, whose names are hereunto subscribed, the Audit Review Panel of the Chamberlain’s and
Bridgemasters’ Accounts, elected by the Livery of London in Common Hall assembled on 24
June 2014, 25 June 2015 and 24 June 2016 pursuant to Act 11, George 1, Cap 18, an Act for
regulating elections within the City of London, etc., do report as follows:
We have reviewed the processes adopted by Moore Stephens LLP for the audit of City’s Cash for
the period from 1 April 2015 to 31 March 2016.
In our view the audit of the financial statements has been conducted in accordance with auditing
procedures as stated on pages 12 and 13.
This report is made solely to the above named addressees. Our work has been undertaken to
enable us to make this report and for no other purpose.
S. Barnsdall
A. Francis
M. McDonagh
P. Watts
The Moore Stephens LLP Public Sector Partner, Nicholas Bennett, is also a member of the Audit
Review Panel. However, as the role of the Panel is to provide independent confirmation that the
processes adopted by Moore Stephens LLP have been conducted in accordance with auditing
procedures, it is not appropriate for Nicholas Bennett to sign the report.

15
Consolidated Statement of Comprehensive Income
For the year ended 31 March 2016
Notes 2016 2015
Restated
£m £m
Income
Education 58.0 55.7
Investment Income - property and managed funds 2 57.0 56.8
Markets 10.5 10.9
Open Spaces 4.2 4.5
City Representation 0.8 0.7
Economic Development 0.4 0.4
Other activities 0.9 1.0
Total Income 131.8 130.0
Expenditure
Education 71.4 70.0
Open Spaces 21.5 21.2
3 19.4 19.0
City Representation 12.3 12.2
Markets 10.4 11.8
Management and Administration 7.7 8.0
Grants and other activities 6.6 6.3
Net pension scheme costs 17c 7.1 2.6
Economic Development 3.8 3.3
Total Expenditure 3, 4 and 5 160.2 154.4
Operating surplus / (deficit) before
gain / (loss) in fair value of investments (28.4) (24.4)
Gain in fair value of property investments 222.5 186.7
Gain/(loss) in fair value of non-property investments 9 (8.4) 70.6
Operating surplus 185.7 232.9
Profit on Sale of Fixed Assets 7.5 14.3
17c (8.3) 0.1
Surplus before taxation 184.9 247.3
Taxation 6 - -
Surplus for the financial year 184.9 247.3
Investments - Management Costs and Property Operating Expenditure
Net financing income / (costs) attributable to pension schemes
All amounts relate to continuing operations.
The notes on pages 19 to 63 form part of these financial statements.

16
Consolidated Statement of Financial Position
At 31 March 2016
Notes 2016 2015
Restated
£m £m
Fixed Assets
Investment properties 7 1,601.8 1,313.0
Tangible assets 7 179.8 175.9
Heritage assets 8 182.1 182.2
Non-property investments 9 596.7 627.1
Intangible assets 10 1.0 1.1
Total Fixed Assets 2,561.4 2,299.3
Current Assets
Stocks - finished goods 12 0.4 0.3
Debtors 13 31.8 27.4
Non-property investments 9 67.1 105.3
Cash at bank and in hand 11.1 22.1
Total Current Assets 110.4 155.1
Creditors: amounts falling due within one year 14 56.7 58.2
Deferred income 15 40.1 20.0
Net Current Assets 13.6 76.9
Total Assets less Current Liabilities 2,575.0 2,376.2
Provisions for liabilities 16 1.8 1.5
Net Assets excluding pension liability 2,573.2 2,374.7
Defined benefit pension scheme liability 17 244.2 254.1
Net Assets 2,329.0 2,120.6
Capital and Reserves
Operational Capital Reserve 180.8 177.0
Heritage Assets Reserve 182.1 182.2
Income Generating Fund 2,198.5 1,940.1
Working Capital Fund 11.8 75.4
Pension Reserve 17 (244.2) (254.1)
Total Capital Employed 18 2,329.0 2,120.6
Authorised for issue 15 November 2016
Dr Peter Kane, Chamberlain of London

17
Consolidated Statement of Changes in Equity
For the year ended 31 March 2016
Notes 2016 2015
Restated
£m £m
Comprehensive income
Surplus for the financial year 184.9 247.3
Other comprehensive income
Loss / (gain) on revaluation of listed investments 9 (1.8) 1.9
Actuarial gain / (loss) on defined benefit pension schemes 17 25.3 (53.2)
Total other comprehensive income 23.5 (51.3)
Total comprehensive income 208.4 196.0
18
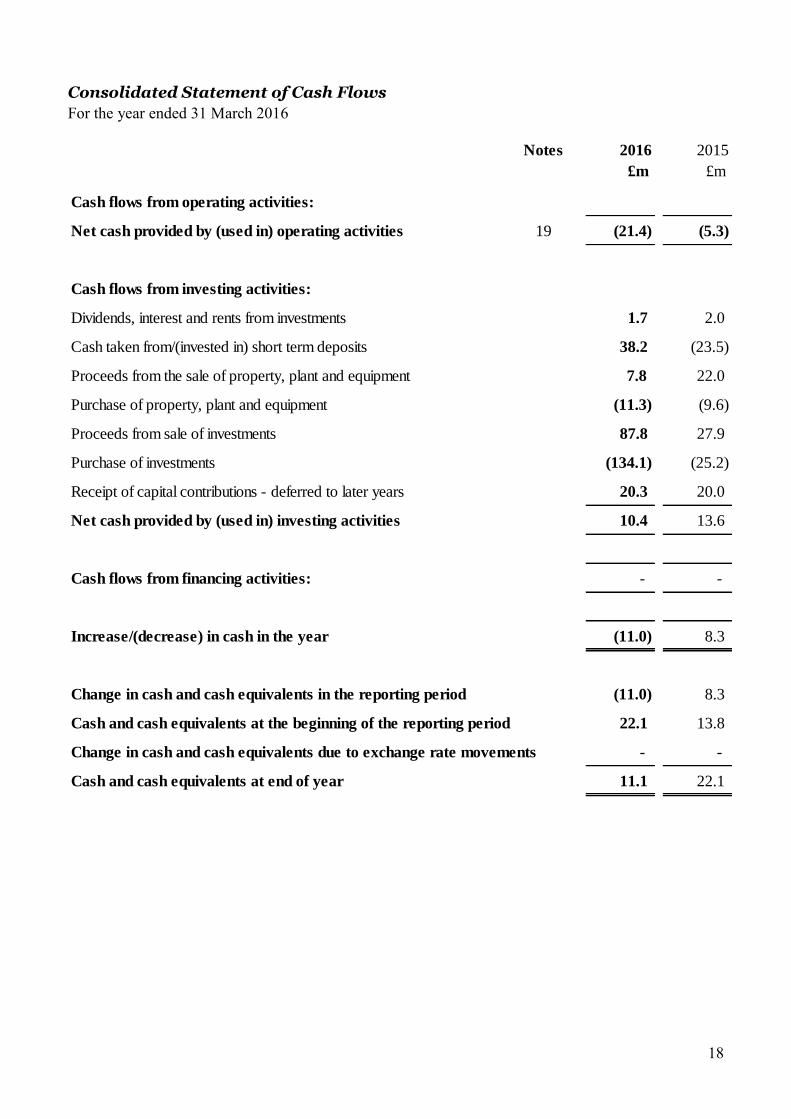
Consolidated Statement of Cash Flows
For the year ended 31 March 2016
Notes 2016 2015
£m £m
Cash flows from operating activities:
Net cash provided by (used in) operating activities 19 (21.4) (5.3)
Cash flows from investing activities:
Dividends, interest and rents from investments 1.7 2.0
Cash taken from/(invested in) short term deposits 38.2 (23.5)
Proceeds from the sale of property, plant and equipment 7.8 22.0
Purchase of property, plant and equipment (11.3) (9.6)
Proceeds from sale of investments 87.8 27.9
Purchase of investments (134.1) (25.2)
Receipt of capital contributions - deferred to later years 20.3 20.0
Net cash provided by (used in) investing activities 10.4 13.6
Cash flows from financing activities: - -
Increase/(decrease) in cash in the year (11.0) 8.3
Change in cash and cash equivalents in the reporting period (11.0) 8.3
Cash and cash equivalents at the beginning of the reporting period 22.1 13.8
Change in cash and cash equivalents due to exchange rate movements - -
Cash and cash equivalents at end of year 11.1 22.1

19
Statement of Significant Accounting Policies
The principal accounting policies applied in the preparation of these financial statements are
summarised below. They have all been applied consistently throughout the year and to the
comparative figures in dealing with items which are considered material in relation to the City’s Cash
financial statements.
a) Basis of preparation
The City of London Corporation has chosen to prepare the City’s Cash consolidated financial
statements in accordance with Financial Reporting Standard 102 (FRS102) as issued by the
Financial Reporting Council for accounting periods on or after 1 January 2015.
Prior to the adoption of FRS102 the consolidated financial statements were prepared in
accordance with United Kingdom Generally Accepted Accounting Practice (UK GAAP), as
issued by the Financial Reporting Council, and referred to as ‘previous UK GAAP’. City’s Cash
last financial statements prepared in accordance with previous UK GAAP were for the year ended
31 March 2015. The date of transition to FRS102 is 1 April 2014 and the financial effects of the
transition to FRS102 are set out in note 1 on page 27.
b) Going Concern
In the opinion of the Corporation, City’s Cash is a going concern for the foreseeable future as it
annually receives considerable income from its property and non-property investments. This
income is considered in the context of a rolling medium term financial forecast to ensure that
services are affordable and sustainable. Cash and liquid investments are monitored and
maintained at a level to ensure that sufficient resources are available to finance any in-year
deficits.
c) Consolidation
The City’s Cash financial statements consolidate the financial results of the services provided
directly, including ceremonial, schools and markets; City Re Ltd. a wholly-owned subsidiary
whose principal activity is to provide re-insurance protection; trust funds in respect of seven open
spaces; and the Sir Thomas Gresham Charity. In the case of charities and trusts, the overriding
rationale for consolidation of the trusts is that the City of London Corporation is the Trustee and
thereby effectively exercises control over the trusts’ activities.
d) Income and expenditure
The accounts of City’s Cash are maintained on an accruals basis. Consequently, activity is
accounted for in the year that it takes place, not simply when cash payments are made or received.
In particular;
Revenue from the sale of goods is recognised when the significant risks and rewards of
ownership are transferred to the purchaser and it is probable that economic benefits or service
potential associated with the transaction will flow to City’s Cash.
Revenue from the provision of services is recognised when the percentage of completion of the
transaction can be measured reliably and it is probable that economic benefits or service potential
associated with the transaction will flow to City’s Cash.
Supplies are recorded as expenditure when they are consumed – where there is a gap between the
date supplies are received and their consumption, they are carried as stocks on the Balance Sheet.
Expenses in relation to services received (including services provided by employees) are
recorded as expenditure when the services are received rather than when payments are made.
20
Interest receivable on investments is accounted for as income on the basis of the effective interest
rate for the relevant financial instrument rather than the cash flows fixed or determined by the
contract.
Where revenue and expenditure have been recognised but cash has not been received or paid, a
debtor or creditor for the relevant amount is recorded in the Balance Sheet. Where debts may not
be settled, the balance of debtors is written down and a charge made to revenue for the income
that might not be collected.
Financial assets are derecognised when the contractual rights to the cash flows from the assets
expire, or when City’s Cash has transferred substantially all the risks of and rewards of
ownership. Financial liabilities are derecognised only once the liability has been extinguished
through discharge, cancellation or expiry.
e) Deferred income
Lease premiums relating to operating leases are treated as deferred income and released to
revenue over the life of the lease.
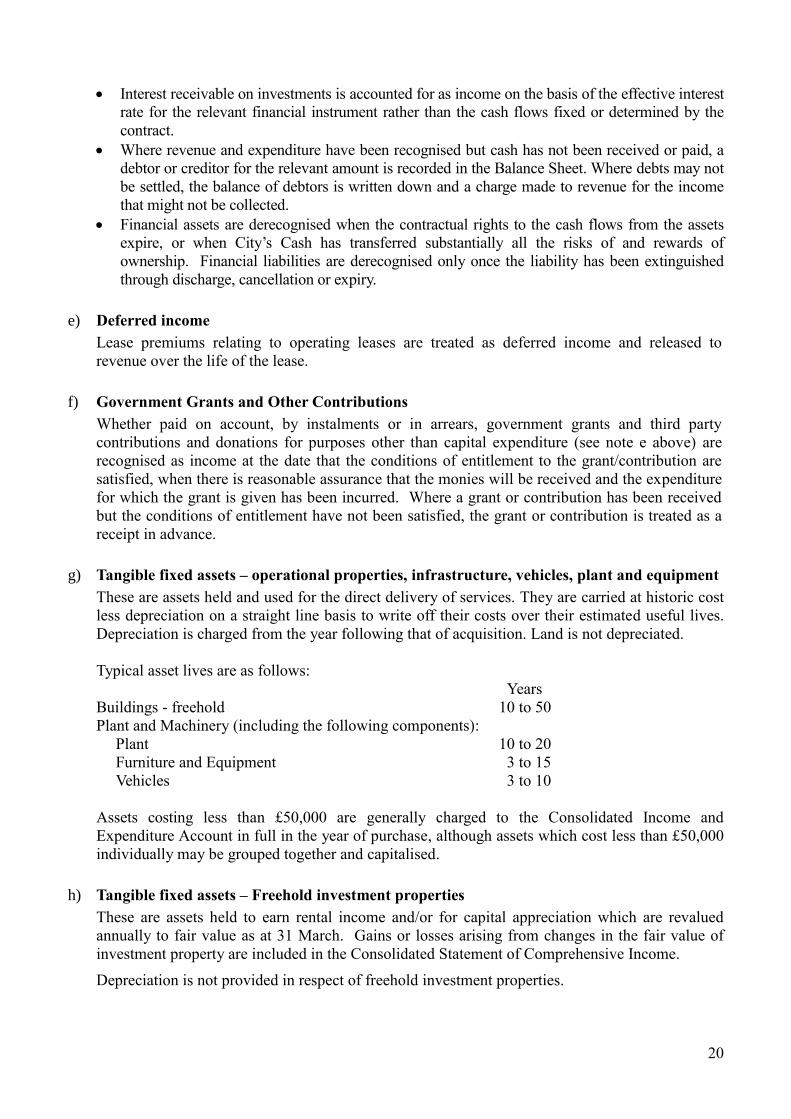
f) Government Grants and Other Contributions
Whether paid on account, by instalments or in arrears, government grants and third party
contributions and donations for purposes other than capital expenditure (see note e above) are
recognised as income at the date that the conditions of entitlement to the grant/contribution are
satisfied, when there is reasonable assurance that the monies will be received and the expenditure
for which the grant is given has been incurred. Where a grant or contribution has been received
but the conditions of entitlement have not been satisfied, the grant or contribution is treated as a
receipt in advance.
g) Tangible fixed assets – operational properties, infrastructure, vehicles, plant and equipment
These are assets held and used for the direct delivery of services. They are carried at historic cost
less depreciation on a straight line basis to write off their costs over their estimated useful lives.
Depreciation is charged from the year following that of acquisition. Land is not depreciated.
Typical asset lives are as follows:
Years
Buildings - freehold 10 to 50
Plant and Machinery (including the following components):
Plant 10 to 20
Furniture and Equipment 3 to 15
Vehicles 3 to 10
Assets costing less than £50,000 are generally charged to the Consolidated Income and
Expenditure Account in full in the year of purchase, although assets which cost less than £50,000
individually may be grouped together and capitalised.
h) Tangible fixed assets – Freehold investment properties
These are assets held to earn rental income and/or for capital appreciation which are revalued
annually to fair value as at 31 March. Gains or losses arising from changes in the fair value of
investment property are included in the Consolidated Statement of Comprehensive Income.
Depreciation is not provided in respect of freehold investment properties.
21
i) Assets under construction
Payments made to contractors for works completed to date are included within fixed assets
pending the asset being recognised as operational. No depreciation is charged on such assets.
j) Impairments
An impairment loss arises if the carrying amount of an asset exceeds its recoverable amount.
This could be caused by such factors as a significant decline in an asset’s value during the period
(i.e. more than expected as a result of the passage of time, normal use or general revaluation),
evidence of obsolescence or physical damage of an asset, a commitment to undertake a significant
reorganisation, or a significant adverse change in the statutory or other regulatory environment.
An annual assessment takes place as to whether there is any indication that property assets may be
impaired.
An impairment loss on investment property is treated as a revaluation movement which is
included in the Consolidated Statement of Comprehensive Income.
An impairment loss on operational assets or heritage assets would be recognised in the
Consolidated Statement of Comprehensive Income. The reversal of an impairment loss on
operational or heritage property, previously recognised in the Consolidated Statement of
Comprehensive Income, will not exceed the carrying amount that would have been determined
had no impairment loss been recognised for the asset in prior years.
k) De-recognition
The carrying amount of an item of property, plant and equipment is derecognised:
on disposal, or
when no future economic benefits or service potential are expected from its use or
disposal.
The gain or loss arising from de-recognition of an asset is the difference between the net disposal
proceeds, if any, and the carrying amount of the asset. The gain or loss arising from de-
recognition of an asset is included in the Consolidated Statement of Comprehensive Income.
l) Heritage Assets
City’s Cash heritage assets largely comprise art and sculpture treasures valued, in accordance with
FRS102, at cost, or where cost cannot be readily identified, on the basis of available information,
as a proxy for cost.
As heritage assets have indeterminate lives and potentially high residual values, no depreciation is
charged. All expenditure on subsequent preservation, conservation, accessibility, etc. is charged
directly to the Consolidated Statement of Comprehensive Income.
m) Financial Assets and Liabilities
Financial instruments are classified as either ‘basic’ or ‘other’ in accordance with Chapter 11 of
FRS102. All financial instruments held by City’s Cash are basic financial instruments.
n) Non-property Investment Assets
Non-property investment assets are held in accordance with the investment policy set by the City
of London Corporation. FTSE 100 Company investments are valued at the Stock Exchange
Trading System (SETS) price at 31 March. Other quoted investments are valued at the middle

22
market price at the close of business on 31 March. Unquoted investments are included at a
valuation advised by the Fund Managers.
Non-property investment assets have been accounted for at ‘fair value through profit and loss’.
Income generated by non-property investment assets remains within the fund to be reinvested,
with City’s Cash drawing down income (realising gains or losses) as required. As a consequence,
the operating surplus or loss within the Consolidated Statement of Comprehensive Income
includes the gain or loss in fair value on all non-property investments.
o) Intangible Assets
Intangible assets comprise computer systems and software licences which are capitalised at cost
and reflected within the financial statements at amortised historic cost.
Amortisation is calculated by allocation of the balance sheet value of the asset, less any residual
value, to the periods expected to benefit from its use on a straight line basis over 3 to 7 years.
Amortisation charges are charged to service revenue accounts.
p) Leases
Leases are classified as finance leases when substantially all the risks and rewards of ownership
are transferred to the lessee. City’s Cash did not have any finance leases as at 31 March 2016.
All other leases are classified as operating leases.
Operating leases
City’s Cash as lessee
Rentals payable are charged to revenue on a straight-line basis even if the payments are not made
on such a basis unless another systematic and rational basis is more representative of the benefits
received.
City’s Cash as lessor
Assets subject to operating leases are included in the Consolidated Statement of Financial
Position according to the nature of the assets. Rental income from operating leases, excluding
charges for services such as insurance and maintenance, are recognised on a straight-line basis
over the period of the lease, even if the payments are not received on this basis (e.g. due to lease
incentives, premiums, etc), unless another systematic and rational basis is more representative of
the time pattern in which the benefits derived from the leased asset are diminished.
Lease Incentives
Benefits received and receivable as an incentive to sign a lease are spread on a straight-line basis
over the lease term in accordance with FRS102.
q) Contingent Assets
A contingent asset is a possible asset that arises from past events and whose existence will be
confirmed by the occurrence or non-occurrence of one or more uncertain future events not wholly
within the control of the City. Contingent assets are assessed continually to ensure that
developments are appropriately reflected in the financial statements. If it has become virtually
certain that an inflow of economic benefits or service potential will arise and the asset’s value can
be measured reliably, the debtor (or cash where consideration has been received) and the related
revenue are recognised in the financial statements of the period in which the change in

23
circumstances occurs. Where an inflow of economic benefits or service potential is probable
(rather than virtually certain) and can be reliably measured, contingent assets are disclosed as
notes to the accounts.
r) Contingent Liabilities
A contingent liability is a possible obligation that arises from past events and whose existence
will be confirmed only by the occurrence or non-occurrence of one or more uncertain future
events not wholly within the control of the City. Contingent liabilities are assessed continually to
determine whether an outflow of resources embodying economic benefits or service potential has
become probable. If it becomes probable that an outflow of future economic benefits or service
potential will be required for an item previously dealt with as a note to the accounts, a provision is
recognised in the financial statements for the period in which the change in probability occurs
(except in circumstances where no reliable estimate can be made). Where a contingent liability
exists, but a reliable estimate cannot be made, a note is disclosed in the accounts unless the
possibility of an outflow of resources embodying economic benefits or service potential is remote.
s) Provisions
Provisions are made where an event has taken place that gives the City a legal or constructive
obligation that probably requires settlement by a transfer of economic benefits or service potential,
and a reliable estimate can be made of the amount of the obligation. For instance, the City may be
involved in a court case that could eventually result in the making of a settlement or the payment
of compensation. Provisions are charged as an expense to the Consolidated Statement of
Comprehensive Income in the year that the City becomes aware of the obligation, and are
measured at the best estimate at the balance sheet date of the expenditure required to settle the
obligation, taking into account relevant risks and uncertainties. When payments are eventually
made, they are charged to the provision carried in the Consolidated Statement of Financial
Position. Estimated settlements are reviewed at the end of each financial year – where it becomes
less than probable that a transfer of economic benefits will now be required (or a lower settlement
than anticipated is made), the provision is reversed. Where some or all of the payment required to
settle a provision is expected to be recovered from another party (e.g. from an insurance claim),
this is only recognised as income for the relevant service if it is virtually certain that
reimbursement will be received if the City settles the obligation.
t) Cash
Cash comprises funds repayable to the City without penalty on notice within 24 hours, less
cheques and BACS payments issued but not presented.
u) Stocks of Finished Goods
Stocks of finished goods are valued at the lower of cost or net realisable value.
v) Pension Costs
Non-Teaching Staff
The City of London Corporation operates a funded defined benefit pension scheme for its staff
employed on activities relating to its three funds (i.e. City Fund, City’s Cash and Bridge House
Estates). The scheme is based on final salary and length of service on retirement. Changes to the
Scheme came into effect from 1 April 2014 and any benefits accrued from this date will be based on
career average revalued salary, with various protections in place for those members in the Scheme
before the changes took effect.

24
The Pension Fund is the responsibility of the City of London as a whole, which is one employer,
and not the responsibility of any of its three funds. City’s Cash does not have an exclusive
relationship with the City of London Pension Fund. Although the proportion of the Pension Fund
that relates to City of London employee members engaged on City’s Cash is not separately
identifiable, a share of the total Pension Fund has been allocated to City’s Cash based on employer’s
pension contributions paid into the Fund by City’s Cash as a proportion of total employer’s
contributions paid.
For the defined benefit scheme the amounts charged in resources expended are the current service
costs and gains and losses on settlements and curtailments. They are included as part of staff costs.
Past service costs are recognised immediately in the Consolidated Statement of Comprehensive
Income if the benefits have vested. If the benefits have not vested immediately, the costs are
recognised over the period until vesting occurs. The interest cost and expected return on the assets
are shown as a net amount of other finance costs or credits adjacent to interest. Actuarial gains and
losses are recognised immediately in other recognised gains and losses.
The assets of the scheme are held separately from those in City’s Cash, and are invested by
independent fund managers appointed by the Corporation of London. Pension scheme assets are
measured at fair value and liabilities are measured on an actuarial basis by a qualified actuary using
the projected unit method and discounted at a rate equivalent to the current rate of return on a high
quality corporate bond of equivalent currency and term to the scheme liabilities. The resulting
defined benefit asset or liability is presented separately after net assets on the face of the
Consolidated Statement of Financial Position.
Barnett Waddingham, an independent actuary, carried out the latest triennial actuarial assessment of
the scheme as at 31 March 2016, on an FRS102 basis using the projected unit method. The next
actuarial valuation of the Fund will be carried out as at 31 March 2019 and will set contributions for
the period from 1 April 2019 to 31 March 2022.
Pension Costs – Teachers
The payment of pensions to former teachers is the responsibility of the Teachers’ Pension Scheme
(the Scheme). Consequently, teachers’ pension fund contributions, together with the employer’s
contributions, are paid by the City of London to the Scheme. The Scheme is a multi-employer
defined benefit statutory scheme administered in accordance with the Teachers’ Pension Scheme
Regulations 2014.
The Scheme is funded on a notionally funded basis – no actual assets back the liabilities but a
notional Fund is constructed for the purposes of setting employer contributions. Contributions
are set every four years as a result of the actuarial valuation of the Scheme by the Government
Actuary’s Department on behalf of the Secretary of State.
Under FRS102, the employer participating in the Teachers’ Pension Scheme must recognise the
expected present value of all future deficit contributions on their Consolidated Statement of
Financial Position. As it is not possible to identify the assets and liabilities at individual employer
level, the expected present value of the deficit contributions has been calculated by Barnett
Waddingham, an independent actuary, based upon pensionable pay at 31 March 2016, the Scheme’s
deficit contribution rate at 31 March 2016 and an actuarial factor based on the deficit recovery
period and the adopted assumptions.
25
w) Statutory Deductions from Pay
The City of London Corporation accounts centrally for salary and wage deductions.
Consequently, the City’s Cash accounts treat all sums due to the HMRC as having been paid.
x) Foreign Currencies
Transactions in foreign currencies are recorded using the rate of exchange ruling at the date of the
transaction. Monetary assets and liabilities denominated in foreign currencies are translated using
the rate of exchange ruling at the Consolidated Statement of Financial Position date and the gains
or losses on translation are written on / off to revenue account.
y) Tax
The City of London Corporation is a single legal entity and legislation treats it as a local authority
for tax purposes. VAT is recovered from HMRC on supplies received, and paid to HMRC on
supplies made. All transactions are therefore included without VAT. The City of London
Corporation is exempt from income and corporation tax.
City Re Limited, a wholly-owned subsidiary of the City of London Corporation in its City’s Cash
capacity, conforms to the tax requirements for Guernsey companies.
z) Overheads
The costs of support service overheads, with the exception of expenditure on corporate and
democratic activities, are generally apportioned between all services on the basis of employee
time spent or other resources consumed on behalf of user services. Similarly, with the exception
of vacant properties, the costs of support service buildings are apportioned on the basis of the
office area utilised by each service.
aa) Reserves
A number of reserves are held as endowment funds or restricted funds received by the City
Corporation for specified purposes as set out in note 18.
bb) Critical Judgements in Applying Accounting Policies
In applying accounting policies the City Corporation has to make certain judgements about complex
transactions or those involving uncertainty about future events. Apart from those disclosed in this
Statement of Significant Accounting Policies and those involving estimations (see note cc), there are
no critical judgements that management has made in the process of applying the City’s accounting
policies that will have a material effect on the amounts recognised in the financial statements.
cc) Assumptions Made About the Future and Other Major Sources of Estimation Uncertainty
The Statement of Accounts contains estimated figures that are based on assumptions made by the
City about the future or that are otherwise uncertain. The estimates and associated assumptions are
continually reviewed and are based on historical experience and other factors including expectations
of future events that are considered to be reasonable under the circumstances. However, because
balances cannot be determined with certainty, actual results could be materially different from those
estimates. Changes in accounting estimates may be necessary if there are changes in circumstances
on which the estimate was based, or as a result of new information or more experience. The
estimates and assumptions that have the most significant risk of causing a material adjustment to
the carrying amounts of assets and liabilities within the next financial year are set out below:

26
(i) Pension Benefits
Estimation of the net liability to pay pensions depends on a number of complex adjustments
relating to the discount rate used, the rate at which salaries are projected to increase, changes in
retirement ages, mortality rates and expected returns on pension fund assets. A firm of consulting
actuaries is engaged to provide the City with expert advice about the assumptions to be applied.
The effect of changes in individual assumptions on the net pension’s liability can be measured,
but are complex and interact in a complex manner. For example the actuary determines the
appropriate discount rate at the end of each year after taking account of the yield from a high
quality bond of appropriate duration, a 0.1% decrease in the discount rate assumption would
result in an increase in the pension liabilities of £10.3m. Other key assumptions for pension
obligations are based in part on current market conditions and demographic data. Additional
information on pension schemes is given in note 17 on pages 48 to 55.
(ii) Property Valuations The carrying values of investment properties and heritage assets are primarily dependent on
judgements of such variables as the state of the markets, location, condition of the
properties/assets, indices etc. Valuation is an inexact science with assessments provided by
different surveyors/experts rarely agreeing and with prices subsequently realised diverging from
valuations. A reduction in estimated valuations would result in reductions to the Revaluation
Reserve and/or a loss recorded as appropriate in the Comprehensive Income and Expenditure
Statement. For example a 1% reduction in the value of investment properties and heritage assets
would result in a reduction to reserves of £16.0m and £1.8m respectively. Conversely, a 1%
increase in value would have the opposite effect.
However, the risk of material adjustments is mitigated by using the experience and knowledge of
professional chartered surveyors/experts, both in-house staff and external firms. In addition, tests
are undertaken to ensure that variations between the valuations of different surveyors, and
between valuations and actual prices, are within reasonable tolerances.

27
Notes to the Consolidated Financial Statements
1. Transition to FRS102
City’s Cash financial statements for the year ended 31 March 2016 have been prepared in
accordance with Financial Reporting Standard 102 (FRS102) as issued by the Financial
Reporting Council for accounting periods on or after 1 January 2015. Prior to the adoption of
FRS102 City’s Cash financial statements were prepared in accordance with United Kingdom
Generally Accepted Accounting Practice (UK GAAP), referred to below as ‘previous UK
GAAP’. City’s Cash last financial statements prepared in accordance with previous UK
GAAP were for the year ended 31 March 2015. The date of transition to FRS102 is 1 April
2014.
The transition to FRS102 has resulted in a number of changes in accounting policies compared
to those used when applying previous UK GAAP.
The following explanatory notes to the financial statements describe the differences between
the funds and income and expenditure presented under the previous UK GAAP and the newly
presented amounts under FRS102 for the reporting period ended at 31 March 2015 (ie
comparative information), as well as the funds presented in the opening statement of financial
position (ie at 1 April 2014). It also describes the changes in accounting made on first-time
adoption of FRS102.
In the table below funds determined in accordance with FRS102 are reconciled to funds
determined in accordance with previous UK GAAP at both 1 April 2014 (the date of transition
to FRS102) and 31 March 2015.
28
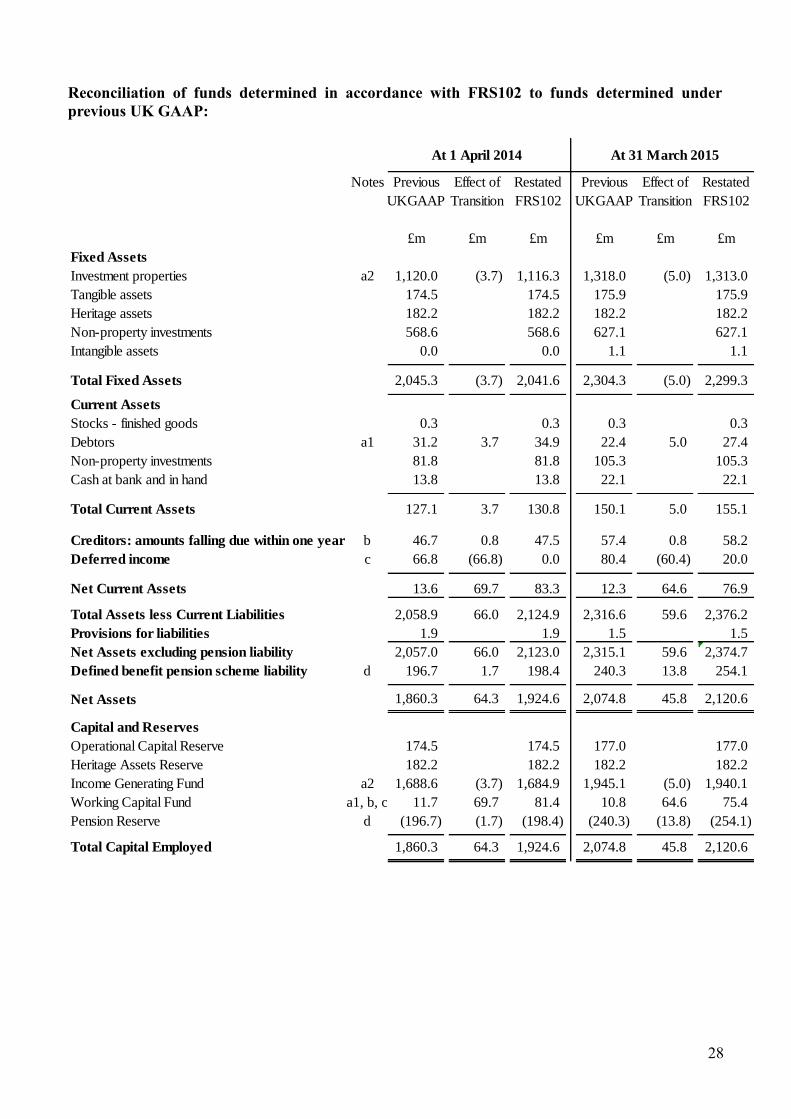
Reconciliation of funds determined in accordance with FRS102 to funds determined under
previous UK GAAP:
Notes Previous Effect of Restated Previous Effect of Restated
UKGAAP Transition FRS102 UKGAAP Transition FRS102
£m £m £m £m £m £m
Fixed Assets
Investment properties a2 1,120.0 (3.7) 1,116.3 1,318.0 (5.0) 1,313.0
Tangible assets 174.5 174.5 175.9 175.9
Heritage assets 182.2 182.2 182.2 182.2
Non-property investments 568.6 568.6 627.1 627.1
Intangible assets 0.0 0.0 1.1 1.1
Total Fixed Assets 2,045.3 (3.7) 2,041.6 2,304.3 (5.0) 2,299.3
Current Assets
Stocks - finished goods 0.3 0.3 0.3 0.3
Debtors a1 31.2 3.7 34.9 22.4 5.0 27.4
Non-property investments 81.8 81.8 105.3 105.3
Cash at bank and in hand 13.8 13.8 22.1 22.1
Total Current Assets 127.1 3.7 130.8 150.1 5.0 155.1
Creditors: amounts falling due within one year b 46.7 0.8 47.5 57.4 0.8 58.2
Deferred income c 66.8 (66.8) 0.0 80.4 (60.4) 20.0
Net Current Assets 13.6 69.7 83.3 12.3 64.6 76.9
Total Assets less Current Liabilities 2,058.9 66.0 2,124.9 2,316.6 59.6 2,376.2
Provisions for liabilities 1.9 1.9 1.5 1.5
Net Assets excluding pension liability 2,057.0 66.0 2,123.0 2,315.1 59.6 2,374.7
Defined benefit pension scheme liability d 196.7 1.7 198.4 240.3 13.8 254.1
Net Assets 1,860.3 64.3 1,924.6 2,074.8 45.8 2,120.6
Capital and Reserves
Operational Capital Reserve 174.5 174.5 177.0 177.0
Heritage Assets Reserve 182.2 182.2 182.2 182.2
Income Generating Fund a2 1,688.6 (3.7) 1,684.9 1,945.1 (5.0) 1,940.1
Working Capital Fund a1, b, c 11.7 69.7 81.4 10.8 64.6 75.4
Pension Reserve d (196.7) (1.7) (198.4) (240.3) (13.8) (254.1)
Total Capital Employed 1,860.3 64.3 1,924.6 2,074.8 45.8 2,120.6
At 1 April 2014 At 31 March 2015

29
Reconciliation of net movement in funds for the year ended 31 March 2015:
Notes Previous Gain on Lease Deferred Teachers' Restated
UKGAAP revaluation incentives income Pension FRS102
of investment Scheme
properties
£m £m £m £m £m £m
Income
Education 55.7 55.7
Investment Income - property and managed funds a1 55.5 1.3 56.8
Markets 10.9 10.9
Open Spaces 4.5 4.5
City Representation 0.7 0.7
Economic Development 0.4 0.4
Other activities 1.0 1.0
Total Income 128.7 0.0 1.3 0.0 0.0 130.0
Expenditure
Education 70.0 70.0
Open Spaces 21.2 21.2
Investments 19.0 19.0
City Representation 12.2 12.2
Markets 11.8 11.8
Management and Administration 8.0 8.0
Grants and other activities 6.3 6.3
Net pension scheme costs 2.6 2.6
Economic Development 3.3 3.3
Total Expenditure 154.4 0.0 0.0 0.0 0.0 154.4
Operating surplus / (deficit) before (25.7) 0.0 1.3 0.0 0.0 (24.4)
gain / (loss) in fair value of investments
Gain in fair value of property investments e, a2, c 194.4 (1.3) (6.4) 186.7
Gain in fair value of non-property investments 70.6 70.6
Operating surplus 44.9 194.4 0.0 (6.4) 0.0 232.9
Profit on Sale of Fixed Assets 14.3 14.3
Net financing costs attributable to the pension scheme 0.1 0.1
Surplus / (deficit) before taxation 59.3 194.4 0.0 (6.4) 0.0 247.3
Taxation 0.0
Surplus / (deficit) for the financial year 59.3 194.4 0.0 (6.4) 0.0 247.3
Other recognised gains / (losses)
Gain on revaluation of investment properties e 194.4 (194.4) 0.0
Loss / (gain) on revaluation of listed investments 1.9 1.9
Actuarial loss on defined benefit pension schemes d (41.1) (12.1) (53.2)
214.5 0.0 0.0 (6.4) (12.1) 196.0

30
Notes:
a1) Lease incentives – previous UK GAAP required lease incentives, which reduce rental
income in the initial years of the lease, to be allocated over the shorter of the lease term
and the period ending on the date from which it is expected the prevailing market rental
will be payable. FRS102 now requires lease incentives to be allocated over the term of
the lease. This change means that rental income is now ‘smoothed’ over a generally
longer period which, at the transition date of 1 April 2014, led to an increase of £3.7m
in the level of accrued rental income. The movement for the year ended 31 March
2015, was a further increase in accrued income of £1.3m.
a2) Lease incentives - as the valuation of investment properties is partly based on future
rental income (see change noted at a1 above), a corresponding reduction was made to
the value of investment properties reflecting that a lower level of income will be
recognised in later years.
b) Holiday pay accruals – previous UK GAAP had no specific requirement to make
accruals for employee entitlement to paid holiday leave not yet taken as at the year end.
FRS102 explicitly requires accruals to be made for holiday pay as the employees earn
the right to the paid leave. The initial provision recognised at the date of transition, 1
April 2014, was for the holiday entitlement arising in the year which was due but not
taken (£0.8m). The movement in the provision for the year ended 31 March 2015 was
also recognised as an effect of transition (nil movement).
c) Deferred income – under previous UK GAAP grants and contributions relating to fixed
assets were treated as deferred income and released to the, then titled, Consolidated
Income and Expenditure Account over the expected useful lives of the assets
concerned. FRS102 requires such income to now be recognised in the year of receipt
where specific conditionality has not been applied by the grantor. Previously deferred
income recognised at the transition date of 1 April 2014 was £66.8m, with a further
adjustment of £6.4m in the year ended 31 March 2015.
d) Teachers Pension Scheme – a number of employees working at the schools supported
by City’s Cash participate in the Teachers’ Pension Scheme. Although the Scheme is a
defined benefit plan, previous UK GAAP allowed the Scheme to be treated as a defined
contribution scheme with the pension cost being the amount of contribution actually
paid. However, FRS102 requires the employer to also account for the deficit
contributions and set up a reserve to meet future deficit contributions (accounting
policy note v on pages 23 and 24 provides further details on the Scheme). The
Teachers Pension Scheme deficit recognised at the transition date of 1 April was £1.7m,
which increased by £12.1m to £13.8m as at 31 March 2015.
e) Gain on revaluation of investment properties – in accordance with FRS102, the gain on
revaluation of investment properties (2014/15: £194.4m) is now a component of
reported income. The gain, therefore, now impacts on the Operating surplus / (deficit)
for the year, whereas under previous UK GAAP it did not and was recorded as a change
in equity on the Statement of Total Recognised Gains and Losses, now called the
Consolidated Statement of Changes in Equity under FRS102.
31
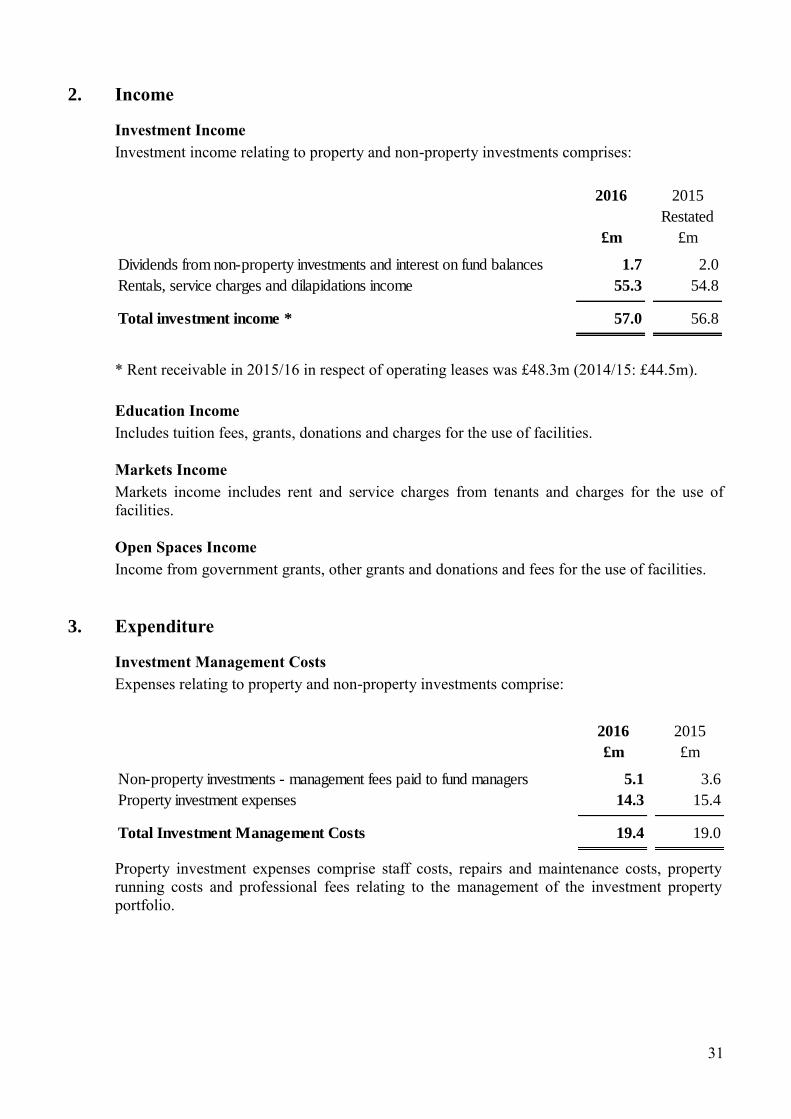
2. Income
Investment Income
Investment income relating to property and non-property investments comprises:
2016 2015
Restated
£m £m
Dividends from non-property investments and interest on fund balances 1.7 2.0
Rentals, service charges and dilapidations income 55.3 54.8
Total investment income * 57.0 56.8
* Rent receivable in 2015/16 in respect of operating leases was £48.3m (2014/15: £44.5m).
Education Income
Includes tuition fees, grants, donations and charges for the use of facilities.
Markets Income
Markets income includes rent and service charges from tenants and charges for the use of
facilities.
Open Spaces Income
Income from government grants, other grants and donations and fees for the use of facilities.
3. Expenditure
Investment Management Costs
Expenses relating to property and non-property investments comprise:
2016 2015
£m £m
Non-property investments - management fees paid to fund managers 5.1 3.6
Property investment expenses 14.3 15.4
Total Investment Management Costs 19.4 19.0
Property investment expenses comprise staff costs, repairs and maintenance costs, property
running costs and professional fees relating to the management of the investment property
portfolio.
32
Depreciation
The operating deficit is stated after charging depreciation amounting to £7.5m (2014/15:
£7.1m).
Operating Lease Rentals
During the year of account City’s Cash spent £0.6m on operating lease rentals in respect of
premises (2014/15: £0.6m).
Auditor’s remuneration
Remuneration to the external auditor (Moore Stephens LLP) for audit services relating to the
year of account amounted to £88,200 (2014/15: £91,478). No other fees were payable to
Moore Stephens LLP for non-audit services during the year (2014/15: nil).
Members expenses
Members do not receive any remuneration from the City of London Corporation for
undertaking their duties. However, Members may claim travelling expenses in respect of
activities outside the City and receive allowances in accordance with a scale when attending a
conference or activity on behalf of the City of London Corporation. These costs totalling
£9,348 (2014/15: £8,400) across all of the City’s activities, were met in full by City’s Cash.

33
4. Staff numbers and costs
Officers employed by the City of London Corporation work on a number of the City of
London Corporation's activities. The table below sets out the number of full-time equivalent
staff charged directly to City’s Cash and their remuneration costs.
The number of employees was: 2016 2015
FTE FTE
Investment properties 17.7 17.0
Education 624.9 608.9
Markets 89.9 101.3
Open spaces 293.3 299.6
City representation 65.1 65.5
Grants and other activities 9.2 9.9
Support Services 208.5 239.9
Total 1,308.6 1,342.1
Their remuneration comprised: Gross National Pension 2016 2015
Pay Insurance Contribution Restated
£m £m £m £m £m
Investment Management 0.5 - 0.1 0.6 0.5
Education 32.8 2.7 4.7 40.2 38.7
Markets 3.0 0.2 0.5 3.7 4.0
Open spaces 8.8 0.6 1.4 10.8 10.9
City representation 2.8 0.3 0.4 3.5 3.4
Grants and other activities 0.5 0.1 0.0 0.6 0.6
Support Services 8.7 0.7 1.3 10.7 12.5
Total 57.1 4.6 8.4 70.1 70.6
34
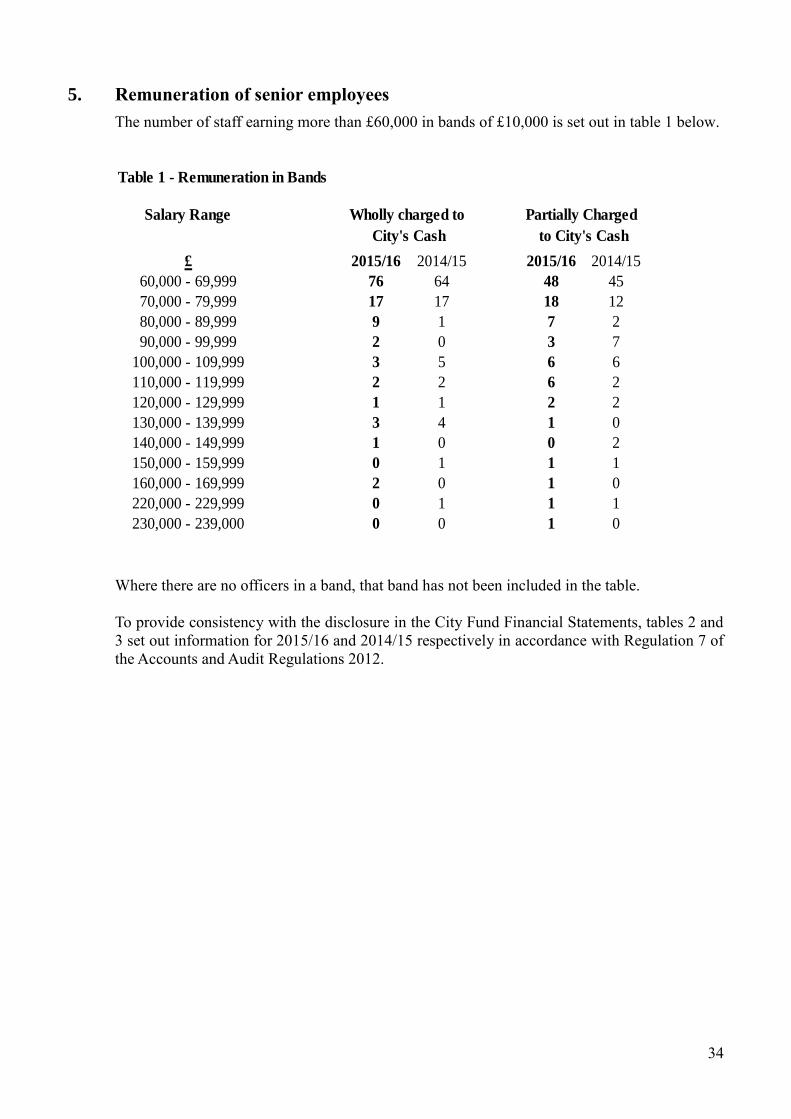
5. Remuneration of senior employees
The number of staff earning more than £60,000 in bands of £10,000 is set out in table 1 below.
Table 1 - Remuneration in Bands
Salary Range
£ 2015/16 2014/15 2015/16 2014/15
60,000 - 69,999 76 64 48 45
70,000 - 79,999 17 17 18 12
80,000 - 89,999 9 1 7 2
90,000 - 99,999 2 0 3 7
100,000 - 109,999 3 5 6 6
110,000 - 119,999 2 2 6 2
120,000 - 129,999 1 1 2 2
130,000 - 139,999 3 4 1 0
140,000 - 149,999 1 0 0 2
150,000 - 159,999 0 1 1 1
160,000 - 169,999 2 0 1 0
220,000 - 229,999 0 1 1 1
230,000 - 239,000 0 0 1 0
Wholly charged to
City's Cash
Partially Charged
to City's Cash
Where there are no officers in a band, that band has not been included in the table.
To provide consistency with the disclosure in the City Fund Financial Statements, tables 2 and
3 set out information for 2015/16 and 2014/15 respectively in accordance with Regulation 7 of
the Accounts and Audit Regulations 2012.

35
Table 2 - 2015/16 remuneration for those senior employees required to be disclosed individually
Post Title Name Notes Pro
po
rtio
n c
ha
rged
to
Cit
y's
Ca
sh a
ctiv
itie
s w
her
e le
ss t
ha
n
100
%
Sa
lary
(in
clu
din
g f
ees
an
d
allo
wa
nce
s)
Bo
nu
s
Ex
pen
ses
Ben
efit
s in
kin
d
To
tal R
emu
ner
ati
on
ex
clu
din
g
pen
sio
n c
on
trib
uti
on
s 2015
/16
Pen
sio
n C
on
trib
uti
on
s
To
tal R
emu
ner
ati
on
in
clu
din
g
Pen
sio
n C
on
trib
uti
on
s 2015
/16
% £000 £000 £000 £000 £000 £000 £000
Salary is £150,000 or more a year
Town Clerk and Chief Executive J. Barradell i 40 94 0 0 0 94 16 110
Chamberlain P. Kane i 35 57 0 0 0 57 10 67
Salary is between £50,000 and £150,000
Deputy Town Clerk - i 40 51 1 0 0 52 9 61
Director of Culture, Heritage & Libraries - i 5 5 0 0 0 5 1 6
Comptroller & City Solicitor - i 25 37 1 0 0 38 7 45
City Surveyor (w.e.f 5 October 2015 works 3 days per week) - i 45 49 2 0 0 51 0 51
Head City of London School - 148 0 0 40 188 27 215
Headmaster City of London Freemen's School - retired 31/08/2015 - 54 0 0 0 54 9 63
Headmaster City of London Freemen's School - started 01/09/2015 - 70 0 0 0 70 13 83
Headmistress City of London School for Girls - 109 0 0 47 156 20 176
Remembrancer - 131 0 0 0 131 23 154
Principal of the Guildhall School of Music & Drama - 129 2 0 11 142 0 142
Private Secretary & Chief of Staff to the Lord Mayor - 111 3 0 0 114 0 114
Director of Markets & Consumer Protection - i 45 49 0 0 0 49 9 58
Director of Open Spaces - i 70 67 2 1 3 73 13 86
1,161 11 1 101 1,274 157 1,431

36
Table 3 - 2014/15 remuneration for those senior employees required to be disclosed individually
Post Title Name Notes Pro
po
rtio
n c
ha
rged
to
Cit
y's
Ca
sh a
ctiv
itie
s w
her
e le
ss t
ha
n
100
%
Sa
lary
(in
clu
din
g f
ees
an
d
allo
wa
nce
s)
Bo
nu
s
Ex
pen
ses
Ben
efit
s in
kin
d
To
tal R
emu
ner
ati
on
ex
clu
din
g
pen
sio
n c
on
trib
uti
on
s 2014
/15
Pen
sio
n C
on
trib
uti
on
s
To
tal R
emu
ner
ati
on
in
clu
din
g
Pen
sio
n C
on
trib
uti
on
s 2014
/15
% £000 £000 £000 £000 £000 £000 £000
Salary is £150,000 or more a year
Town Clerk and Chief Executive J. Barradell i 40 89 0 0 0 89 16 105
Chamberlain - retired 5 May 2014 C. Bilsland i 35 6 0 0 0 6 0 6
Chamberlain - started 31 March 2014 P. Kane i 35 55 0 0 0 55 10 65
Salary is between £50,000 and £150,000
Deputy Town Clerk - i 40 50 1 0 0 51 9 60
Director of Culture, Heritage & Libraries - i 5 5 0 0 0 5 1 6
Comptroller & City Solicitor - i 25 35 0 0 0 35 6 41
City Surveyor - i 45 63 2 0 0 65 0 65
Head City of London School - 136 0 0 70 206 22 228
Headmaster City of London Freemen's School - 129 0 0 0 129 21 150
Headmistress City of London School for Girls
- left 30 April 2014 - 11 0 0 0 11 0 11
Headmistress City of London School for Girls
- started 23 April 2014 - 103 0 0 52 155 17 172
Remembrancer - 131 0 0 0 131 23 154
Principal of the Guildhall School of Music & Drama - 130 2 0 38 170 0 170
Private Secretary & Chief of Staff to the Lord Mayor - 109 3 0 0 112 0 112
Director of Markets & Consumer Protection - i 45 46 5 0 0 51 9 60
Director of Open Spaces - i 70 66 2 0 15 83 13 96
1,164 15 0 175 1,354 147 1,501

37
Notes to remuneration for senior employees disclosures:
i. These officers provide services for the City of London Corporation’s local authority
and non-local authority activities. The remuneration included in tables 2 and 3 above
relates to the proportion charged to City’s Cash activities. The annualised salary for
each of these officers is shown in table 4 below.
ii. No payments were made in 2015/16 or 2014/15 for compensation for loss of office.
Table 4 - Annualised Salaries
Post Title Annualised Annualised
Salary Salary
2015/16 2014/15
£000 £000
Town Clerk and Chief Executive 242 222
Chamberlain 165 175
Comptroller & City Solicitor 148 142
City Surveyor * 144 140
Deputy Town Clerk 129 125
Director of Culture, Heritage & Libraries 109 106
Director of Markets & Consumer Protection 111 104
Director of Open Spaces 97 93
* The City Surveyor works 3 days per week - the table shows the whole time equivalent salary.
6. Tax Status
The City of London Corporation is a single legal entity and legislation treats it as a local
authority for tax purposes. City Re Limited, a wholly-owned subsidiary of the City of
London Corporation in its City’s Cash capacity, conforms to the tax requirements for
Guernsey companies.

38
7. Investment Properties and other tangible fixed assets
Consolidated
Plant Assets
Investment Freehold and Under
Properties (c) (a) Machinery Construction Total
£m £m £m £m £m
Cost / Valuation
At 1 April 2015 (restated) 1,313.0 177.6 35.4 4.3 1,530.3
Additions 66.5 0.4 1.2 9.4 77.5
Revaluations 222.5 - - - - - 222.5
Disposals (b) (0.2) - - (0.2) - - (0.4)
Transfers - - - - -
At 31 March 2016 1,601.8 178.0 36.4 13.7 1,829.9
Depreciation
At 1 April 2015 - (23.9) (17.5) - (41.4)
Charge for the year - (5.1) (2.0) - (7.1)
Disposals - - 0.2 - 0.2
At 31 March 2016 - (29.0) (19.3) - (48.3)
Net book value
At 31 March 2015 1,313.0 153.7 17.9 4.3 1,488.9
At 31 March 2016 1,601.8 149.0 17.1 13.7 1,781.6
Leased assets included above:
Net book value
At 31 March 2015 2.1 - - - 2.1
At 31 March 2016 3.5 - - - 3.5
Land and Buildings
Notes:
a) Freehold land and buildings includes items acquired since April 2000 on the basis of
depreciated historic cost. Consequently some of the significant City’s Cash assets (e.g.
Mansion House, Guildhall Complex, Schools and Markets) are included at nil cost as they
were generally acquired well before April 2000 and their original acquisition costs are no
longer available. Subsequent expenditure on these assets is capitalised in line with accounting
policies.
b) (i) The disposal figure for investment properties of £0.2m represents the net carrying value.
The profits on sales totalling £7.6m have been credited to the Consolidated Statement of
Comprehensive Income.

39
(ii) Freehold land and buildings are held at depreciated historic cost. During the year a
number of assets which were included at nil costs and fully depreciated and with no residual
value were disposed of for £0.2m (2014/15: £3.9m). The disposal proceeds have been
credited to the Consolidated Statement of Comprehensive Income as a profit on the sale of
fixed assets.
c) The City Surveyor of the City of London Corporation, who is a fellow of the Royal Institution
of Chartered Surveyors, values investment properties annually as at 31 March at market values
determined in accordance with the “RICS Valuation –Professional Standards January 2014
edition” issued by the Royal Institution of Chartered Surveyors. Valuations are also provided
by two external firms of chartered surveyors – Cushman and Wakefield and Jones Lang
Lasalle Limited, with the externally valued properties representing some 36% of the Estates’
value as at 31 March 2016 (34% as at 31 March 2015). As detailed in accounting policies note
g, all other tangible fixed assets are valued at historic cost less depreciation on a straight-line
basis to write off their costs over their estimated useful lives and less any provision for
impairment.
d) City’s Cash did not incur any finance costs during the year ended 31 March 2016 (2014/15:
nil) and no finance costs have been capitalised.
8. Heritage assets
Heritage assets are those with historical, artistic, scientific, technological, geophysical or
environmental qualities which are maintained principally for their contribution to knowledge
and culture. They are mainly held in trust for future generations.
Arising from its status and history, within its City’s Cash fund, the City holds numerous
heritage assets primarily open spaces, art and sculpture, prints, drawings and statues.
The City Corporation looks after almost 11,000 acres of open spaces across London and
beyond, including Hampstead Heath and Epping Forest. Some of the sites have been owned
and managed since as far back as 1870, protecting them from development and preserving
them as a natural resource. They include important wildlife habitats, Sites of Special Scientific
Interest, National Nature Reserves and outdoor space for sport, recreation and enjoyment for
the public.
The art and sculpture collection is maintained as “a Collection of Art Treasures worthy of the
capital” and includes a range of paintings documenting London’s history. In addition, the City
owns two heritage property assets, the Monument and Temple Bar, and two copies of the
Magna Carta.
For some of the heritage assets the cost of obtaining reliable valuations in order to recognise
them on the Balance Sheet outweighs the benefit of such recognition to the users of the
financial statements. Furthermore, many of the assets are irreplaceable and/or there is often no
active market for their sale, for example, valuations are not readily available for the original
acquisition of open spaces land and their associated buildings, Monument, Temple Bar or the
copies of the Magna Carta.
Nevertheless, the City’s art and sculpture treasures, which represent the vast majority of the
heritage assets, and recently acquired open space land are recognised for inclusion on the
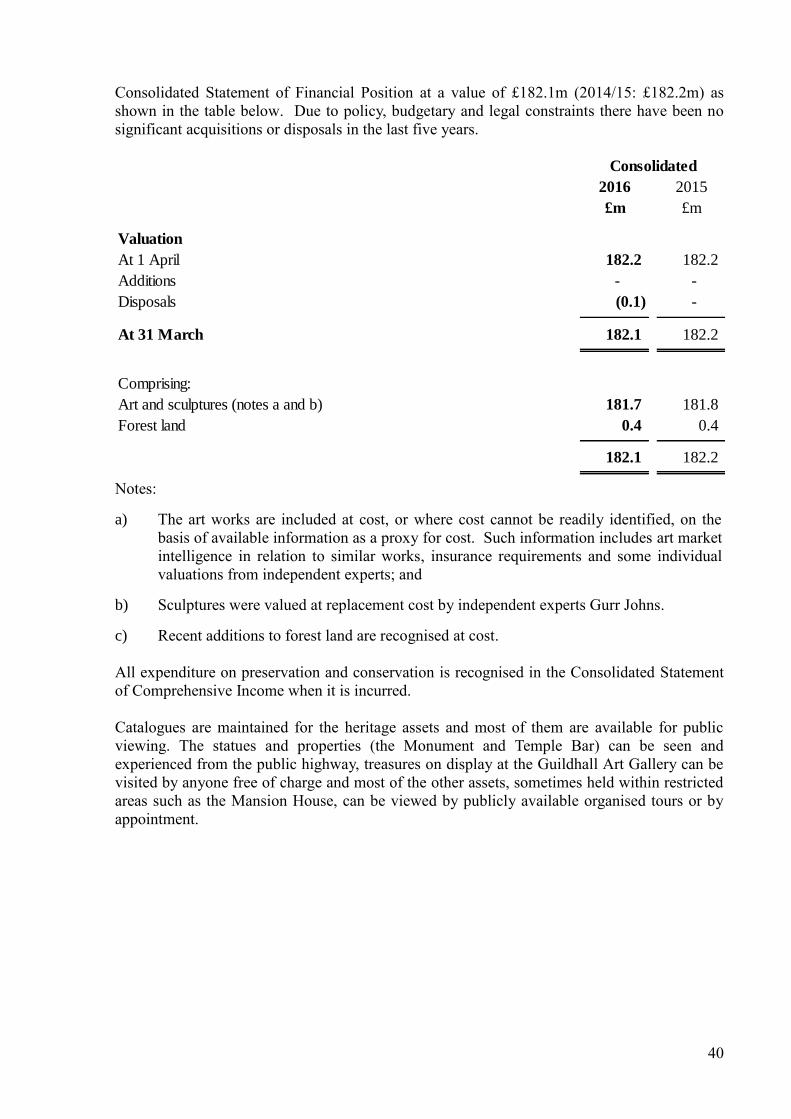
40
Consolidated Statement of Financial Position at a value of £182.1m (2014/15: £182.2m) as
shown in the table below. Due to policy, budgetary and legal constraints there have been no
significant acquisitions or disposals in the last five years.
2016 2015
£m £m
Valuation
At 1 April 182.2 182.2
Additions - -
Disposals (0.1) -
At 31 March 182.1 182.2
Comprising:
Art and sculptures (notes a and b) 181.7 181.8
Forest land 0.4 0.4
182.1 182.2
Consolidated
Notes:
a) The art works are included at cost, or where cost cannot be readily identified, on the
basis of available information as a proxy for cost. Such information includes art market
intelligence in relation to similar works, insurance requirements and some individual
valuations from independent experts; and
b) Sculptures were valued at replacement cost by independent experts Gurr Johns.
c) Recent additions to forest land are recognised at cost.
All expenditure on preservation and conservation is recognised in the Consolidated Statement
of Comprehensive Income when it is incurred.
Catalogues are maintained for the heritage assets and most of them are available for public
viewing. The statues and properties (the Monument and Temple Bar) can be seen and
experienced from the public highway, treasures on display at the Guildhall Art Gallery can be
visited by anyone free of charge and most of the other assets, sometimes held within restricted
areas such as the Mansion House, can be viewed by publicly available organised tours or by
appointment.

41
9. Non-property investment assets
Analysis of movement in non-property investment assets:
2016 2015
£m £m
Non-property investments held by fund managers:
Total investments at 1 April 633.8 580.9
Add: additions to investments at cost 63.7 9.0
Less disposals at market value (62.7) (7.9)
Add net gain on revaluation (1.8) 1.9
Less realised investments (25.1) (20.7)
Gain / (loss) in fair value (8.4) 70.6
Investments at 31 March 599.5 633.8
Non-property investments held by the City of London:
Total investments at 1 April 98.6 69.5
(34.3) 30.8
Change in long term deposits - (1.7)
Investments at 31 March 64.3 98.6
Total investments as at 31 March are analysed between long-term
and short-term investments as follows:
Long term 596.7 627.1
Short term 67.1 105.3
663.8 732.4
Change in short-term deposits and money market
Consolidated
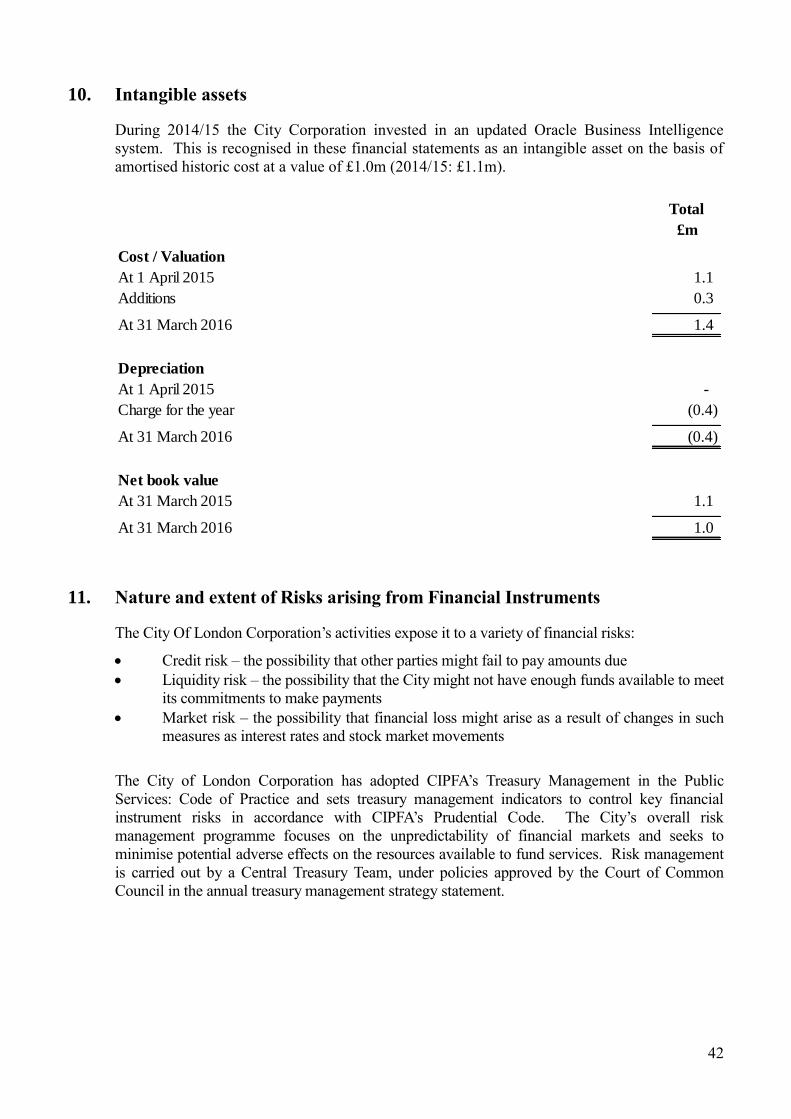
42
10. Intangible assets
During 2014/15 the City Corporation invested in an updated Oracle Business Intelligence
system. This is recognised in these financial statements as an intangible asset on the basis of
amortised historic cost at a value of £1.0m (2014/15: £1.1m).
Total
£m
Cost / Valuation
At 1 April 2015 1.1
Additions 0.3
At 31 March 2016 1.4
Depreciation
At 1 April 2015 -
Charge for the year (0.4)
At 31 March 2016 (0.4)
Net book value
At 31 March 2015 1.1
At 31 March 2016 1.0
11. Nature and extent of Risks arising from Financial Instruments
The City Of London Corporation’s activities expose it to a variety of financial risks:
Credit risk – the possibility that other parties might fail to pay amounts due
Liquidity risk – the possibility that the City might not have enough funds available to meet
its commitments to make payments
Market risk – the possibility that financial loss might arise as a result of changes in such
measures as interest rates and stock market movements
The City of London Corporation has adopted CIPFA’s Treasury Management in the Public
Services: Code of Practice and sets treasury management indicators to control key financial
instrument risks in accordance with CIPFA’s Prudential Code. The City’s overall risk
management programme focuses on the unpredictability of financial markets and seeks to
minimise potential adverse effects on the resources available to fund services. Risk management
is carried out by a Central Treasury Team, under policies approved by the Court of Common
Council in the annual treasury management strategy statement.

43
Credit Risk
Credit risk arises from deposits with banks and financial institutions, as well as credit exposures
to the City’s customers. Deposits are not made with banks and financial institutions unless they
are rated independently with a minimum “score” of Long term A and Short term F1 or are
building societies with assets over £9bn (or which have a minimum credit rating “score” similar
to that set for the banks) . The City Corporation also invests in Money Market Funds, which are
subject to a minimum credit rating of AAA/mmf. The lending list is reviewed on a regular basis
using advice from credit rating agencies and in-house judgements based partially on credit default
swap rates.
The creditworthiness of the counterparties on the City Corporation’s lending list is carefully
monitored. Security of the investments was paramount but with liquidity and yield also being
considerations. By the end of the year, the City effectively had ten potential borrowers in the form
of banks and building societies and it has been necessary to maintain relatively high levels of
individual maximum lending limits to accommodate lending requirements. The lending limits
attributable to HSBC, Barclays, Royal Bank of Scotland and Santander UK was maintained at
maximum lending limits of £100m each, and Lloyds Bank was fixed at £150m (this organisation
being the City’s banker). The lending limit for the Nationwide Building Society was maintained
at £120m. The maximum duration for such loans was fixed at three years. The lending limit for
the Yorkshire, Coventry, Skipton and Leeds Building Societies was maintained at £20m each and
the duration for such loans was fixed at 1 year. The list also contains three foreign banks with
individual limits of £25m, being National Australia Bank, Australia and New Zealand Banking
Group and Svenska Handelsbanken. The lending list also includes seven top rated Money Market
Funds; Aberdeen Sterling Liquidity Fund, CCLA, Deutsche Liquidity Fund, Federated Liquidity
Fund, Standard Life Liquidity Funds (formerly Ignis Liquidity Funds), Invesco, and Payden
Sterling Reserve Fund. These funds effectively offer very short term liquidity for deposits.
The City’s maximum exposure to credit risk in relation to its investments in banks and money
market funds cannot be assessed generally, as the risk of any institution failing to make interest
payments or failing to repay the principal sum would be mainly specific to each individual
institution. No credit limits were exceeded during the reporting period and the City does not
expect any losses from non-performance by any counterparty in relation to outstanding deposits.
Bad debt provision As at 31
March
2016
As at 31
March
2015
£m £m
Less than three months 3.1 1.8
Three to six months 0.1 0.2
Six months to one year 0.0 0.4
More than one year 0.1 0.1
Total 3.3 2.5
44
Liquidity risk
Liquidity risk is the risk that City’s Cash is unable to meet its payment obligations as they fall
due. There is no significant risk that City’s Cash will be unable to raise finance to meet its
commitments under financial instruments. At present, City’s Cash has no borrowing exposure
and has no plans to borrow to finance future capital expenditure. City’s Cash will finance
operations and growth by realising investments as appropriate to ensure the constant availability
of an appropriate amount of reasonably priced funding to meet both current and future forecast
requirements. All trade creditors are due to be paid in less than one year.
Market risk
Interest rate risk
Movements in interest rates would have an impact on City’s Cash. For instance, a rise in interest
rates would have the following effects:
investments at variable rates – the interest income credited to the Statement of Financial
Activities will rise; and
investments at fixed rates – the fair value of the assets will fall
The continuing low interest rates for 2015/16 had an adverse impact on the interest earnings of
City’s Cash, which is anticipated to continue in 2016/17. The Treasury Management Team has an
active strategy for assessing interest rate exposure that feeds into the setting of the annual budget
and which is used to update the budget quarterly during the year.
If interest rates had been 1% higher, with all other variables held constant, the financial effect at
31 March 2016 would have been an increase in interest receivable of £1.1m for City’s Cash.
Price Risk
Price risk is the risk of a decline in the value of a security or a portfolio. City’s Cash minimises
price risk through a strategy of diversification by holding a geographical spread of investments in
the UK and overseas markets.
By taking the data available from the past three financial years, and making considered
predictions of expected returns, in consultation with State Street Analytics, which is the firm the
City of London uses for performance measurement, the following upwards/downwards
movements in market price risk are reasonably possible for the 2016/17 reporting period.

45
Potential Market Movements
Asset type
Change
%
Pooled fixed interest 3.60
UK equities 9.51
Global equities 10.14
Global multi - asset 3.74
Index - linked 9.19
Cash 0.00
Short-term UK deposits 0.00
Total non-property investments 7.83
The potential percentage allowance for changes in asset values are within a one-standard
deviation tolerance. Taking these changes, the potential increase/decrease in the market prices of
the fund’s assets have been derived, and provide a range of possible net asset values which would
be available to meet the fund’s liabilities.
Asset type Value Change
Value on
increase
Value on
decrease
£m % £m £m
Pooled fixed interest 33.9 3.60 35.1 32.7
UK equities 150.3 9.51 164.6 136.0
Global equities 304.5 10.14 335.4 273.6
Global multi - asset 79.3 3.74 82.3 76.3
Index - linked 28.7 9.19 31.3 26.1
Cash 2.8 0.00 2.8 2.8
Short-term UK deposits 64.3 0.00 64.3 64.3
Total non-property investments 663.8 7.83 715.8 611.8
The percentage change for equities includes a grouping of listed and private equities and the
equity funds categorised elsewhere as pooled unit trusts. The percentage change for bonds
includes a grouping of government and corporate fixed interest securities. Separate consideration
of the individual asset types is not available.
Foreign Currency Risk
Foreign currency risk (also known as foreign exchange risk or exchange rate risk) is a financial
risk that exists when a financial transaction or asset/liability is denominated in a currency other
than that of the base currency of a company or investor. The risk is that a movement in the
exchange rate may cause a foreign currency investment's value to either decrease or increase
when the investment is sold and converted back into the original currency.

46
The following table has been prepared in consultation with State Street Analytics to show the
illustrative effect on City’s Cash’ asset values that would result from movements in exchange
rates.
Currency Value Change
Value on
increase
Value on
decrease
£m % £m £m
North America investments 209.8 7.43 225.4 194.2
Europe (ex UK) investments 94.9 6.46 101.0 88.8
Asia Pacific investments 43.5 8.06 47.0 40.0
Emerging investments 13.1 6.79 14.0 12.2
Overseas total 361.3 387.4 335.2
UK investments and cash 238.2 238.2 238.2
Long-term UK deposits 0.0 0.0 0.0
Short-term UK deposits 64.3 64.3 64.3
Total non-property investments 663.8 689.9 637.7
12. Stocks of Finished Goods
A variety of purchased items are held in stock amounting to £0.4m (2014/15: £0.3m) to ensure
responsive delivery of services, mainly relating to those provided at the City’s open spaces,
schools and ceremonial functions.

47
13. Debtors
2016 2015
Restated
£m £m
Amounts falling due within one year:
Sundry debtors 13.5 6.2
Rental debtors 9.8 12.5
School Fees 1.6 2.1
Prepayments and accrued income 4.1 3.9
VAT 1.8 1.2
Accrued interest 0.8 1.2
31.6 27.1
Amounts falling due after more than one year:
Sundry debtors 0.2 0.3
0.2 0.3
31.8 27.4
Consolidated
14. Creditors – amounts falling due within one year
2016 2015
Restated
£m £m
Sundry creditors 32.7 32.0
Rental income received in advance 13.8 12.8
Other receipts received in advance 7.8 9.2
Her Majesty's Revenue and Customs - VAT 2.4 4.2
56.7 58.2
Consolidated

48
15. Deferred income
2016 2015
Restated
£m £m
Lease premium income
- due within one year 0.1 0.1
- more than one year 40.0 19.9
Total lease premium income (note i) 40.1 20.0
Consolidated
Note:
i) A premium of £20m relating to an operating lease was received in 2014/15 and
a further premium of £20.3m also relating to an operating lease was received in
2015/16. Both premiums have been deferred in accordance with accounting
policies note e), and both are to be released over a 150 year lease term.
Deferred income released to revenue in 2015/16 was £0.2m (2014/15: nil).
16. Provisions
City Re Limited has set aside £1.8m (2014/15: £1.5m) for the settlement of known insurance
claims at the balance sheet date. The estimate is based on a case by case assessment of each claim
and takes into account previous claims experience.
17. Pensions
City of London Corporation defined benefit pension scheme
The City of London Corporation operates a funded defined benefit pension scheme, The City of
London Pension Fund, for its staff employed on activities relating to its three funds (i.e. City
Fund, City’s Cash and Bridge House Estates).
The assets of the scheme are held in a specific trust separately from those of the Corporation and
contributions are paid to the scheme as agreed with the scheme’s Trustees. As the proportion of
the Pension Fund that relates to City’s Cash is not separately identifiable, the share of pension
contributions paid to the scheme by the Trust is calculated pro-rata to employer’s contributions
paid by each of the City of London Corporation contributors to the scheme.
Teachers’ Pension Scheme
In addition to City of London Corporation employees being able to participate in the City of
London Pension Fund, teachers at the City of London Corporation’s four private schools are
eligible to participate in the Teachers’ Pension Scheme (TPS). Although the Scheme is a
defined benefit plan, previous UK GAAP allowed the Scheme to be treated as a defined
contribution scheme with the pension cost being the amount of contribution actually paid.
However, FRS102 requires the employer to also account for the deficit contributions and set
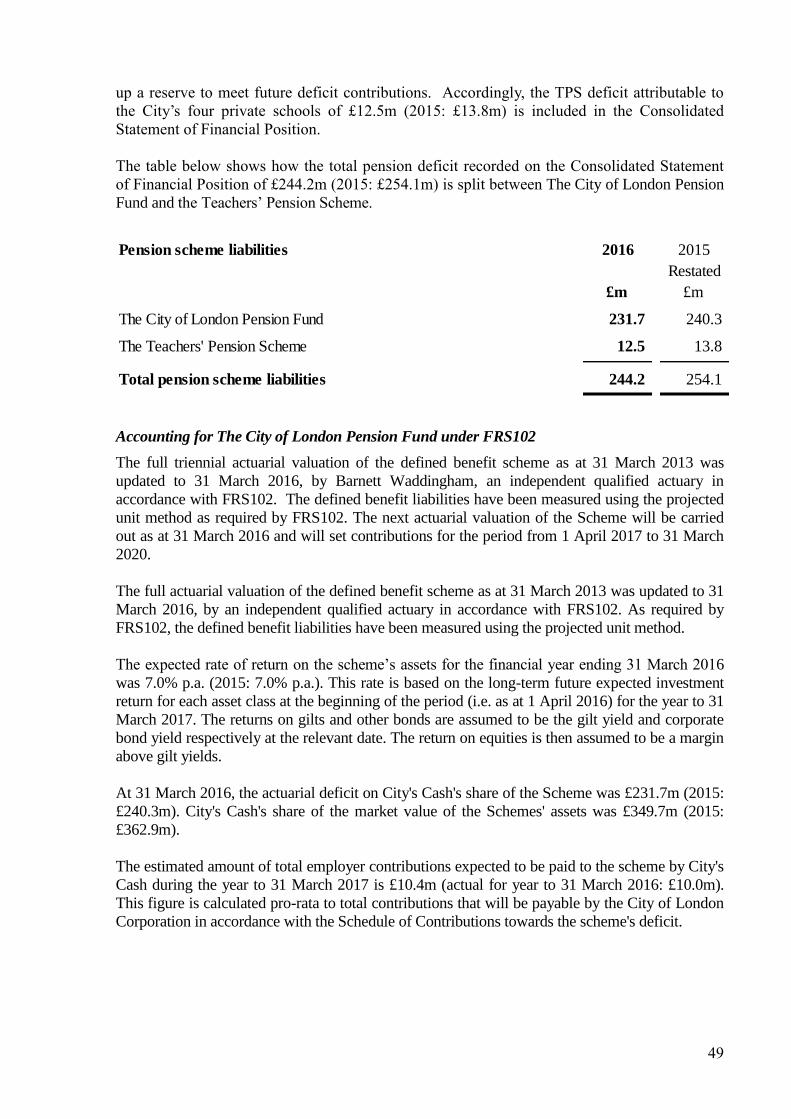
49
up a reserve to meet future deficit contributions. Accordingly, the TPS deficit attributable to
the City’s four private schools of £12.5m (2015: £13.8m) is included in the Consolidated
Statement of Financial Position.
The table below shows how the total pension deficit recorded on the Consolidated Statement
of Financial Position of £244.2m (2015: £254.1m) is split between The City of London Pension
Fund and the Teachers’ Pension Scheme.
Pension scheme liabilities 2016 2015
Restated
£m £m
The City of London Pension Fund 231.7 240.3
The Teachers' Pension Scheme 12.5 13.8
Total pension scheme liabilities 244.2 254.1
Accounting for The City of London Pension Fund under FRS102
The full triennial actuarial valuation of the defined benefit scheme as at 31 March 2013 was
updated to 31 March 2016, by Barnett Waddingham, an independent qualified actuary in
accordance with FRS102. The defined benefit liabilities have been measured using the projected
unit method as required by FRS102. The next actuarial valuation of the Scheme will be carried
out as at 31 March 2016 and will set contributions for the period from 1 April 2017 to 31 March
2020.
The full actuarial valuation of the defined benefit scheme as at 31 March 2013 was updated to 31
March 2016, by an independent qualified actuary in accordance with FRS102. As required by
FRS102, the defined benefit liabilities have been measured using the projected unit method.
The expected rate of return on the scheme’s assets for the financial year ending 31 March 2016
was 7.0% p.a. (2015: 7.0% p.a.). This rate is based on the long-term future expected investment
return for each asset class at the beginning of the period (i.e. as at 1 April 2016) for the year to 31
March 2017. The returns on gilts and other bonds are assumed to be the gilt yield and corporate
bond yield respectively at the relevant date. The return on equities is then assumed to be a margin
above gilt yields.
At 31 March 2016, the actuarial deficit on City's Cash's share of the Scheme was £231.7m (2015:
£240.3m). City's Cash's share of the market value of the Schemes' assets was £349.7m (2015:
£362.9m).
The estimated amount of total employer contributions expected to be paid to the scheme by City's
Cash during the year to 31 March 2017 is £10.4m (actual for year to 31 March 2016: £10.0m).
This figure is calculated pro-rata to total contributions that will be payable by the City of London
Corporation in accordance with the Schedule of Contributions towards the scheme's deficit.
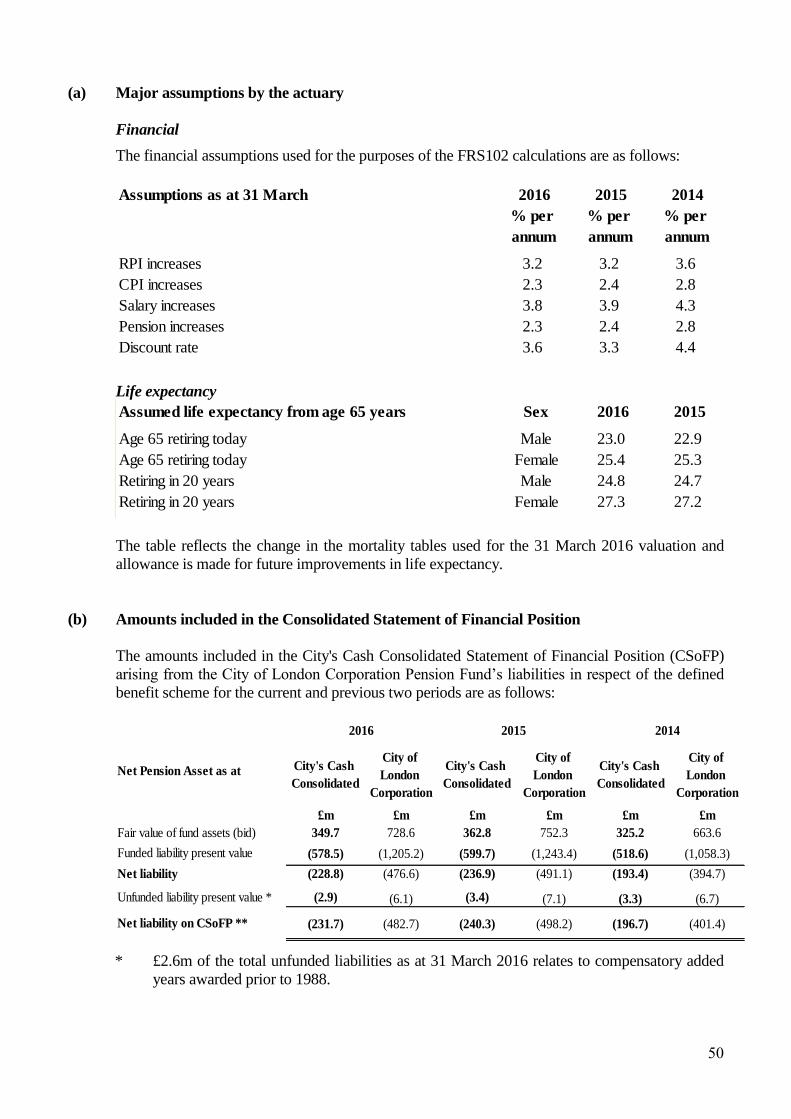
50
(a) Major assumptions by the actuary
Financial
The financial assumptions used for the purposes of the FRS102 calculations are as follows:
Assumptions as at 31 March 2016 2015 2014
% per
annum
% per
annum
% per
annum
RPI increases 3.2 3.2 3.6
CPI increases 2.3 2.4 2.8
Salary increases 3.8 3.9 4.3
Pension increases 2.3 2.4 2.8
Discount rate 3.6 3.3 4.4
Life expectancy
Assumed life expectancy from age 65 years Sex 2016 2015
Age 65 retiring today Male 23.0 22.9
Age 65 retiring today Female 25.4 25.3
Retiring in 20 years Male 24.8 24.7
Retiring in 20 years Female 27.3 27.2
The table reflects the change in the mortality tables used for the 31 March 2016 valuation and
allowance is made for future improvements in life expectancy.
(b) Amounts included in the Consolidated Statement of Financial Position
The amounts included in the City's Cash Consolidated Statement of Financial Position (CSoFP)
arising from the City of London Corporation Pension Fund’s liabilities in respect of the defined
benefit scheme for the current and previous two periods are as follows:
City's Cash
Consolidated
City of
London
Corporation
City's Cash
Consolidated
City of
London
Corporation
City's Cash
Consolidated
City of
London
Corporation
£m £m £m £m £m £m
349.7 728.6 362.8 752.3 325.2 663.6
(578.5) (1,205.2) (599.7) (1,243.4) (518.6) (1,058.3)
Net liability (228.8) (476.6) (236.9) (491.1) (193.4) (394.7)
(2.9) (6.1) (3.4) (7.1) (3.3) (6.7)
(231.7) (482.7) (240.3) (498.2) (196.7) (401.4)Net liability on CSoFP **
Net Pension Asset as at
2016 2015 2014
Fair value of fund assets (bid)
Funded liability present value
Unfunded liability present value *
* £2.6m of the total unfunded liabilities as at 31 March 2016 relates to compensatory added
years awarded prior to 1988.

51
** the total net pension fund liability shown on the Consolidated Statement of Financial
Position is £244.2m (2014/15: £254.1m), which comprises the liability relating to the City
of London Pension Fund of £231.7m (as shown in the table above) and a liability of £12.5m
(2014/15: £13.8m) relating to the Teachers’ Pension Scheme.
The net pension fund liability of £231.7m in the Consolidated Statement of Financial Position
(2015: £240.3m) represents 48% of the total net balance sheet liability in the City of London
Corporation Pension Fund Financial Statements.
(c) Amounts recognised in the consolidated statement of comprehensive income
2016 2015
£m £m
Current service cost (15.9) (12.1)
Administration cost (0.3) -
Gains / (losses) on settlements and curtailments (0.9) (0.1)
Employer contributions 9.7 9.3
Unfunded pension payments 0.3 0.3
Net pension scheme costs (7.1) (2.6)
Return on pension scheme assets 11.6 22.4
Interest on pension scheme liabilities (19.6) (22.3)
Net finance income / (expenses) * (8.0) 0.1
Net charge to Consolidated Statement of Comprehensive Income (15.1) (2.5)
* the total value shown in the Consolidated Statement of Comprehensive Income for net
financing expenses attributable to pension schemes amounts is £8.3m (2014/15: net income
of £0.1m), which comprises expenses relating to the City of London Pension Fund of £8.0m
(as shown in the table above) and expenses of £0.3m relating to the Teachers’ Pension
Scheme.

52
(d) Amounts included in the Consolidated Statement of Changes in Equity
2016 2015
£m £m
Actual return less expected return on pension scheme assets (11.3) 25.0
Experience gains and (losses) 0.2 (0.1)
Changes in assumptions underlying the present value of liabilities 34.8 (66.0)
Actuarial gains/(losses) in pension scheme 23.7 (41.1)
Increase/(decrease) in irrecoverable surplus - -
23.7 (41.1)Actuarial gains/(losses) recognised in the Consolidated Statement
of Changes in Equity *
* the total value shown in the Consolidated Statement of Changes in Equity for actuarial
gains is £25.3m (2014/15: loss of £53.2m), which comprises the actuarial gain relating to
the City of London Pension Fund of £23.7m (as shown in the table above) and an actuarial
gain of £1.6m relating to the Teachers’ Pension Scheme.
(e) Asset allocation
The allocation of the scheme's assets at 31 March is as follows:
Employer asset share - bid value
£m
% per
annum £m
% per
annum
Equities 218.9 63 305.9 85
Gilts n/a n/a 48.2 13
Other bonds n/a n/a n/a n/a
Cash (0.1) 0 8.7 2
Infrastructure 14.1 4 n/a n/a
Absolute Return Portfolio 116.8 33 n/a n/a
Total assets 349.7 100 362.8 100
2016 2015

53
(f) Movement in the present value of scheme liabilities
Changes in the present value of the scheme liabilities over the year are as follows:
Reconciliation of opening and closing balances of the 2016 2015
present value of the defined benefit liability £m £m
Opening defined benefit liability (603.1) (521.9)
Current service cost (15.9) (12.1)
Past service cost - -
Interest cost (19.6) (22.3)
Actuarial gain / (losses) 45.3 (61.0)
Gains / (losses) on curtailments (0.9) (0.1)
Liabilities (assumed)/extinguished on settlements (0.3) 0.3
Estimated benefits paid net of transfers in 17.1 17.7
Contributions by scheme participants (4.3) (4.0)
Unfunded pension payments 0.3 0.3
Closing defined benefit liability (581.4) (603.1)
(g) Movement in the scheme net liability
The net movement in the scheme liabilities over the year are as follows:
2016 2015
£m £m
Surplus (deficit) at the beginning of the year (240.3) (196.7)
Current service cost (15.9) (12.1)
Past service cost - -
Net interest (8.0)
Settlements and curtailments (0.9) (0.1)
Other finance income (expense) (0.3) 0.1
Employers contributions 9.7 9.3
Unfunded pension payments 0.3 0.3
Actuarial gains / (losses) 23.7 (41.1)
Surplus (deficit) at the end of the year (231.7) (240.3)

54
(h) Movement in the present value of scheme assets
Changes in the fair value of the scheme assets over the year are as follows:
Reconciliation of opening and closing balances of the fair 2016 2015
value of scheme assets £m £m
Opening fair value of scheme assets 362.8 325.2
Interest on assets 11.6 22.4
Return on assets less interest (21.6) 0.0
Actuarial gains / (losses) 0.0 19.9
Administration expenses (0.2) 0.0
Contributions by employer including unfunded 10.0 9.5
Contributions by scheme participants 4.3 4.0
Estimated benefits paid net of transfers in and including unfunded (17.4) (18.0)
Settlement prices received / (paid) 0.2 (0.2)
Closing value of scheme assets at end of period 349.7 362.8
(i) Historical information – Amounts for the current and previous periods
The following amounts for 2012-2016 have been recognised under the “Actuarial gains and
losses on defined benefit pension scheme” heading within the Consolidated Statement of Changes
in Equity:
2016 2015 2014 2013 2012
£m £m £m £m £m
Present value of defined benefit liability (581.4) (603.1) (521.9) (484.5) (443.7)
Fair value of scheme assets 349.7 362.8 325.2 317.0 272.0
Deficit in the scheme (231.7) (240.3) (196.7) (167.5) (171.7)
Experience adjustments on scheme liabilities 0.2 (0.1) 5.2 - (0.1)
Percentage of scheme liabilities 0.0% 0.0% 1.0% 0.0% 0.0%
Experience adjustments on scheme assets (21.6) 19.9 (5.8) 30.3 (24.7)
Percentage of scheme assets (5.7%) 4.6% (1.8%) 9.6% (9.1%)
Cumulative actuarial gains and losses (53.4) (77.1) (36.0) (11.5) (20.8)
The cumulative gains and losses in the table above start from 1 April 2005.
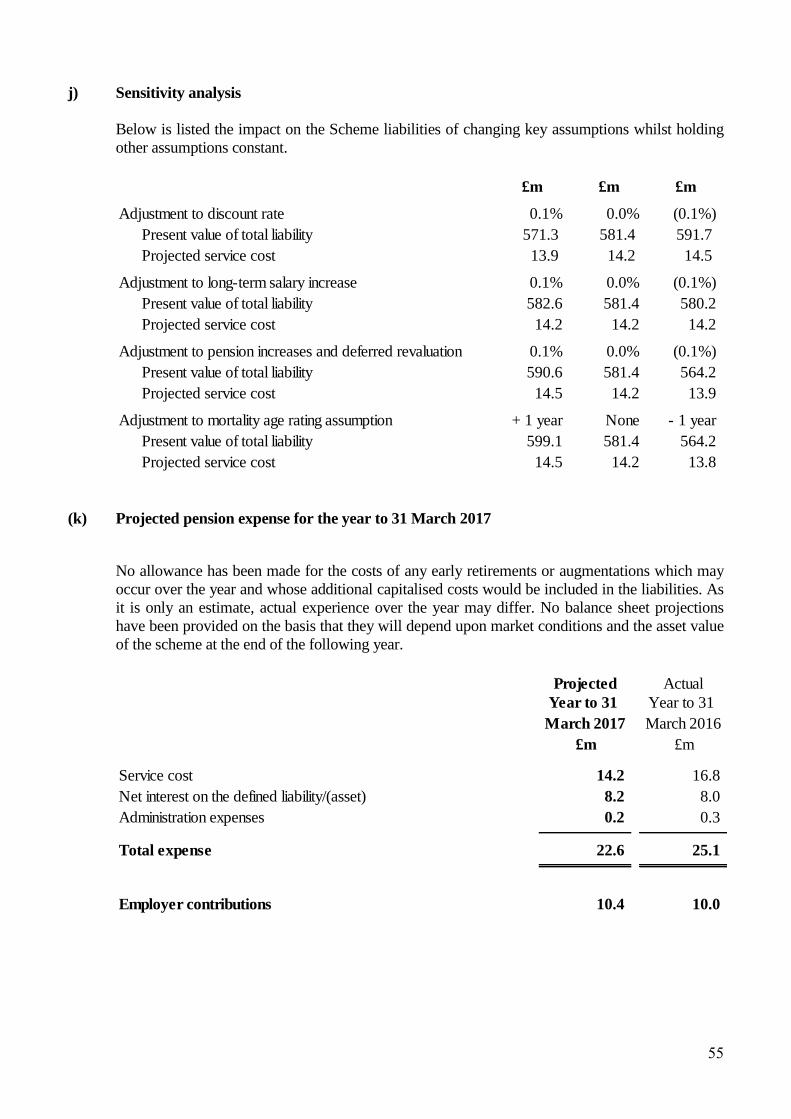
55
j) Sensitivity analysis
Below is listed the impact on the Scheme liabilities of changing key assumptions whilst holding
other assumptions constant.
£m £m £m
Adjustment to discount rate 0.1% 0.0% (0.1%)
Present value of total liability 571.3 581.4 591.7
Projected service cost 13.9 14.2 14.5
Adjustment to long-term salary increase 0.1% 0.0% (0.1%)
Present value of total liability 582.6 581.4 580.2
Projected service cost 14.2 14.2 14.2
Adjustment to pension increases and deferred revaluation 0.1% 0.0% (0.1%)
Present value of total liability 590.6 581.4 564.2
Projected service cost 14.5 14.2 13.9
Adjustment to mortality age rating assumption + 1 year None - 1 year
Present value of total liability 599.1 581.4 564.2
Projected service cost 14.5 14.2 13.8
(k) Projected pension expense for the year to 31 March 2017
No allowance has been made for the costs of any early retirements or augmentations which may
occur over the year and whose additional capitalised costs would be included in the liabilities. As
it is only an estimate, actual experience over the year may differ. No balance sheet projections
have been provided on the basis that they will depend upon market conditions and the asset value
of the scheme at the end of the following year.
Projected Actual
Year to 31
March 2017
Year to 31
March 2016
£m £m
Service cost 14.2 16.8
Net interest on the defined liability/(asset) 8.2 8.0
Administration expenses 0.2 0.3
Total expense 22.6 25.1
Employer contributions 10.4 10.0

56
18. Capital and Reserves
Consolidated
Balance
restated
at 1 April Additions Disposals Depreciation
Unrealised
Gains
/(Losses) Transfers
Balance
at 31
March
£m £m £m £m £m £m £m
Operational Capital 177.0 11.3 - (7.5) - - 180.8 -
Heritage Assets Reserve 182.2 - (0.1) - - - 182.1
Income Generating Fund
- Investment Properties 38.3 66.5 (0.2) - - - 104.6
- Non-Property Investments 627.1 67.6 (87.8) - (10.2) 596.7
- Revaluation Reserve -
Investment Properties 1,274.7 - - - 222.5 - 1,497.2
Income Generating Fund 1,940.1 134.1 (88.1) - 212.3 - 2,198.5 -
Pension Reserve (254.1) - (15.4) - 25.3 - (244.2)
Working Capital Fund 75.4 - (63.6) - - - 11.8
Total Capital and Reserves 2,120.6 145.4 (167.1) (7.5) 237.6 - 2,329.0
Notes to capital and reserves:
a) Operational Capital – reflects the balance sheet amount for operational assets.
b) Heritage Asset Reserve – reflects the balance sheet amount for heritage assets.
c) Income Generating Fund – comprises the asset values of investment properties and non-
property investment assets, which generate the income to fund City’s Cash activities and
services.
d) Working capital Fund – reflects the balance sheet amount for net assets.

57
19. Reconciliation of operating surplus / (deficit) to net cash flow provided by /
(used in) operating activities
2015/16 2014/15
£m £m
Net income/(expenditure) for the reporting period 185.7 232.9
Adjustments for:
Depreciation charges 7.5 7.1
Net pension scheme costs 7.1 2.6
(Gains)/losses on non-property investments 8.4 (70.6)
(Gains)/losses on property investments (222.5) (193.1)
Dividends, interest and rents from investments (1.7) (2.0)
(Increase)/decrease in stock (0.1) -
(Increase)/decrease in debtors (4.4) 7.5
Increase/(decrease) in creditors falling due within one year (1.5) 10.7
Release of deferred income (0.2) -
Increase/(decrease) in provision 0.3 (0.4)
Net cash provided by / (used in) operating activities (21.4) (5.3)

58
20. Financial commitments
Material (in excess of £3m) contractual capital commitments are as follows:
2016 2015
£m £m
Contracted for but not provided for
- finance leases entered into - -
- other (note i) 4.0 -
4.0 -
Consolidated
Notes:
i. The contractual commitment of £4m relates to flood mitigation works to the
Hampstead Heath Ponds which are being undertaken in accordance with statutory
requirements.
ii. City’s Cash has no material commitments under operating leases.
iii. The City of London Corporation has agreed a £50m contribution to Crossrail from
City’s Cash subject to completion of the works. It is anticipated that the contribution
will be made in equal instalments during 2018/19 and 2019/20. The agreement with
Crossrail is considered to be an executory contract and therefore outside the scope of
FRS102.
21. Related party transactions
All Members of the Committees governing City’s Cash are appointed by the City of London
Corporation to act on its behalf. The City of London Corporation also employs all staff. The costs
of those staff employed directly on City’s Cash activities are allocated to those activities
accordingly.
The City of London Corporation provides support services for the activities undertaken by
each of its funds. These support services include management, surveying, financial, banking,
legal and administrative services. Where possible support service costs are allocated directly
to the funds concerned. For those costs that cannot be directly allocated, apportionments are
made between the City Corporation’s funds on the basis of time spent. Premises costs are
apportioned on the basis of areas occupied by services.
With regard to banking services, the City of London Corporation allocates all transactions to
City’s Cash at cost and credits or charges interest at a commercial rate.
The City of London Corporation also provides the above services to a number of charities. The
cost of these services is borne by City’s Cash in relation to most of these charities. A list of
59
charities managed by the City of London Corporation is available on request from the
Chamberlain.
City’s Cash initially bears the full costs of corporate capital projects with the City’s other
funds, City Fund and Bridge House Estates, reimbursing their shares of expenditure in the
years in which costs are accrued.
Transactions are undertaken by City’s Cash on a normal commercial basis in compliance with the
City’s procedures irrespective of any possible interests.
As a matter of policy and procedure, the City of London Corporation ensures that Members and
officers do not exercise control over decisions in which they have an interest.
Standing Orders
The City of London has adopted the following Standing Order in relation to declarations of
personal and beneficial interests:
“If a matter for decision is under consideration by the Court, or any Committee thereof, in which
a Member has a personal interest, he must declare the existence and nature of his interest in
accordance with the Code of Conduct.”
Disclosure
Members are required to disclose their interests and these can be viewed online at
www.cityoflondon.gov.uk.
Members and Chief Officers have been requested to disclose related party transactions of £10,000
or more, including instances where their close family has made transactions with the City of
London.
During 2015/16 the following transactions (rounded to the nearest thousand) were disclosed:
a Member was a Director of Centre for London Ltd which received £20,000 sponsorship
from City’s Cash;
a Member was a Board Member of London and Partners Ltd. City’s Cash paid £25,000
for participation in exhibitions and partnership fees;
a Member sat on the Innovate Finance Advisory Council which received £250,000 from
City’s Cash, being the second year payment towards the establishment of the
organisation;
the City Corporation nominated six Members to the various committees of London
Councils and another Member declared that he had an independent place on a number of
Committees. £1,016,000 was received by City’s Cash for the provision of premises and
services;
the City Corporation nominated five Members to the Board of Governors of the City of
London Academies Trust. Payments totalling £654,000 were made to the Trust relating
to grants and funding for the creation of the multi academy trust;

60
the City Corporation nominated four Members to the Board of Governors of the City of
London Academy Hackney. Grants totalling £182,000 were paid to the Academy;
the City Corporation nominated three Members to the Board of Governors of the City of
London Academy Islington. Grants totalling £185,000 were paid to the Academy;
the City Corporation nominated three Members to the Guild Church Council of St.
Lawrence Jewry and three other Members declared places on the Council. The church
received a grant of £83,000 from the City Corporation;
the City Corporation nominated three Members to the City of London Reserve Forces
and Cadets Association which was paid a grant of £42,000;
a Member was a shareholder and managing director of a company leasing market
premises for which £85,000 was received in rent and service charges;
another Member was also a director of a company leasing market premises for which
£298,000 was received in rent and service charges;
two Members declared interests in PWC LLP which was paid £57,000 for consultancy
services;
The City Corporation nominated six Members to the Gresham College Council which
received grants of £383,000 from City’s Cash and paid £13,000 to City’s Cash for hire of
facilities;
six Members and one Chief Officer were directors of the ‘Lord Mayor’s Show Ltd’
which purchased services from City’s Cash at a cost of £27,000;
five Members were Governors or Almoners of Christ’s Hospital which is paid £48,000
annually for a ‘presentation’ place to secure the right to present one child per year to
enter the school;
ten Members were Governors of King Edwards School Witley which was paid £416,000
for six full fee bursaries and funding to match money raised from other donors;
two Members were on the Board of the Housing and Finance Institute for which City’s
Cash provided £40,000 as a founding member;
four Members were Trustees of Crossrail Art Foundation which received £485,000 from
City’s Cash as match funding of the Crossrail Arts Strategy;
two Members were on the Court of the City University which was paid £14,000 from
City’s Cash for validation, programme and staff development services;
a Member was a Trustee of Thames Festival Trust which received £27,000 to support the
Rivers of the World project;
fifteen Members were part of the governance structure for the Irish Society which
received £41,000 in grant funding;

61
a Member declared that his accountants were RSM UK Group LLP who were paid
£183,000 from City’s Cash for auditing and consultancy services;
a Member declared that the City’s Cash auditors, Moore Stephens, also audit the livery
company of which he is a Court member. Moore Stephens received £92,000 for the
audit of City’s Cash;
the wife of a Member paid £49,000 to purchase a lease extension for a residential
property;
five Members and one Chief Officer were Trustees of City Arts Trust Ltd which paid
£21,000 to City’s Cash for premises costs and event fees;
a Member sat on the New Entrepreneurs Foundation Council which received £20,000
sponsorship from City’s Cash;
four City Corporation Members were members of the City and Guilds of London
Institute which paid £142,000 to City’s Cash for office accommodation;
a Chief Officer was Chairman of the London Parks and Green Spaces Forum (Parks
London) which received £10,000 from City’s Cash;
a Member declared that he had an investment portfolio managed by Ruffer LLP which
also managed an investment portfolio for City’s Cash. Management fees paid to Ruffer
were £385,000;
a Member was Director of TheCityUK which received grants totalling £600,000 and paid
£28,000 to City’s Cash for premises costs;
six Members were appointed as Governors of the Museum of London. City’s Cash paid
£305,000 to the Museum for the funding a number of initiatives and received £398,000
from the Museum for the provision of services.
A Member was a Managing Director of Bank of New York Mellon which was custodian
of City’s Cash non-property investments. The bank was paid £15,000 from City’s Cash
for such services.
Mr. S. LePrevost served as a director of City Re Limited and of the insurance manager,
JLT Insurance Management (Guernsey) Limited during the period. Management fees
paid in respect of the financial year totalled £52,038; and
profit commission calculated at 1.5% of City Re Limited’s profit before tax in the
financial period is payable to the company manager JLT Insurance Management
(Guernsey) Limited. An amount of £2,147 is payable as at 31 March 2016.
During 2014/15 the following transactions (rounded to the nearest thousand) were disclosed:
a Member was a Director of Centre for London Ltd which received sponsorship and
grants from the City Corporation totalling £35,000;

62
a Member was a Board Member of London and Partners Ltd. The City Corporation
became a platinum partner at a cost of £25,000;
a Member sat on the Innovate Finance Advisory Council which received grants totalling
£500,000 from the City Corporation and paid £40,000 to the City Corporation for
services;
the City Corporation nominated 10 Members to the various committees of London
Councils and another Member declared that he had an independent place on the Leaders
Committee. £921,000 was received for premises and services, and £26,000 paid for
services provided by the organisation;
the City Corporation nominated four Members to the Board of Governors of the City of
London Academy Southwark. A grant of £150,000 was paid to the Academy;
the City Corporation nominated four Members to the Board of Governors of the City of
London Academy Hackney. A grant of £150,000 was paid to the Academy;
the City Corporation nominated three Members to the Board of Governors of the City of
London Academy Islington. A grant of £150,000 was paid to the Academy;
the City Corporation nominated three Members to the Guild Church Council of St.
Lawrence Jewry and two other Members declared places on the Council. The church
received a grant of £82,000 from the City Corporation;
the City Corporation nominated three Members to the City of London Reserve Forces
and Cadets Association which was paid a grant of £42,000;
a Member was a Director and Chairman of the Board of Global Law Summit which was
paid a £60,000 grant towards an international event;
a Member was a tenant of commercial premises for which £21,000 was received in rent
and service charges;
a Member was a Life Member of the Sheriffs and Recorders Fund which received a grant
of £20,000;
a Member was a director of a company leasing market premises for which £66,000 was
received in rent and service charges;
another Member was also a director of a company leasing market premises for which
£207,000 was received in rent and service charges;
two Members declared interests in PWC LLP which was paid £21,000 for consultancy
services;
a Member was a director of ‘London Works’ which was paid a grant of £25,000;
the City Corporation nominated six Members to the Gresham College Council which
was paid £406,000 in grants;
63
one Member declared that a member of their family worked for Knight Frank which was
paid £82,000 for services;
four Members and one Chief Officer were directors of the ‘Lord Mayor’s Show Ltd’
which purchased services from City’s Cash at a cost of £16,000;
sixteen Members were Governors or Almoners of Christ’s Hospital which is paid
£48,000 annually for a ‘presentation’ place to secure the right to present one child per
year to enter the school;
a Member was a Director of Museum of London Archaeology which provided services
to the City Corporation at a cost of £13,000;
thirteen Members were Governors of King Edwards School Witley which was paid
£395,000 for six full fee bursaries and funding to match money raised from other donors;
Mr. S. Le Provost served as a director of City Re Limited and of the insurance manager,
JLT Insurance Management (Guernsey) Limited during the period. Management fees
paid in respect of the financial year totalled £51,536; and
profit commission calculated at 1.5% of City Re Limited’s profit before tax in the
financial period was payable to the company manager JLT Insurance Management
(Guernsey) Limited. An amount of £12,640 is payable as at 31 March 2015.
Related Party Transaction with City Fund (the City Fund covers the City of London
Corporation’s activities as a local authority, police authority and port health authority).
During 2014/15 City’s Cash received £1.8m from City Fund for the freehold sale of land at
Creechurch Place, EC3. This land formed part of a larger site for which the City Fund received
a premium to the value of £30.8m for the granting of a long lease. To ensure the integrity of
each of the funds, the City’s Cash land was valued in accordance with the RICS Valuation
Professional Standards (the ‘Red Book’).
22. Subsequent events
There are risks to City’s Cash from the vote to leave the EU. In particular, the future levels of
demand for office accommodation in the City and surrounding areas and the consequential
impacts on rent incomes. A close watching brief will be kept on this and other implications as
events unfold during the coming months with financial forecasts being refreshed if and when
the picture becomes clearer.
23. Approval of the financial statements
The City’s Cash Accounts were authorised for issue by the Chamberlain on 15 November
2016. Events after the balance sheet date and up to 15 November 2016 have been considered
in respect of a material on the financial statements. Events taking place after this date are not
reflected in the financial statements or notes.