cl i composite learning index - copian
TRANSCRIPT
CLI Composite Learning IndexA product of the CANADIAN COUNCIL ON LEARNING
Five Years of Measuring Canada’s Progress in Lifelong Learning
The 2010 Composite Learning Index
This publication is available on the Canadian Council on Learning’s website at www.cli-ica.ca.
© 2010 Canadian Council on Learning
All rights reserved. This publication can be reproduced in whole or in part with the written permission of the Canadian Council on Learning. For permission, please contact: [email protected]. These materials are to be used solely for non-commercial purposes.
Cite this publication in the following format: Canadian Council on Learning, The 2010 Composite Learning Index: Five Years of Measuring Canada’s Progress in Lifelong Learning (Ottawa: 2010). pp. 1–16.
ISBN 978-1-926612-38-6
Published in May 2010.
Ottawa, Ontario
Aussi disponible en français sous le titre L’Indice composite de l’apprentissage 2010 : Mesure des progrès du Canada en apprentissage tout au long de la vie depuis cinq ans.
Five Years of Measuring Canada’s Progress in Lifelong Learning
The 2010 Composite Learning Index
CLI resuLts for 4,500 CommunItIes avaILabLe at www.CLI-ICa.Ca | 1
Learning to Know, to Do, to Live Together, to Be
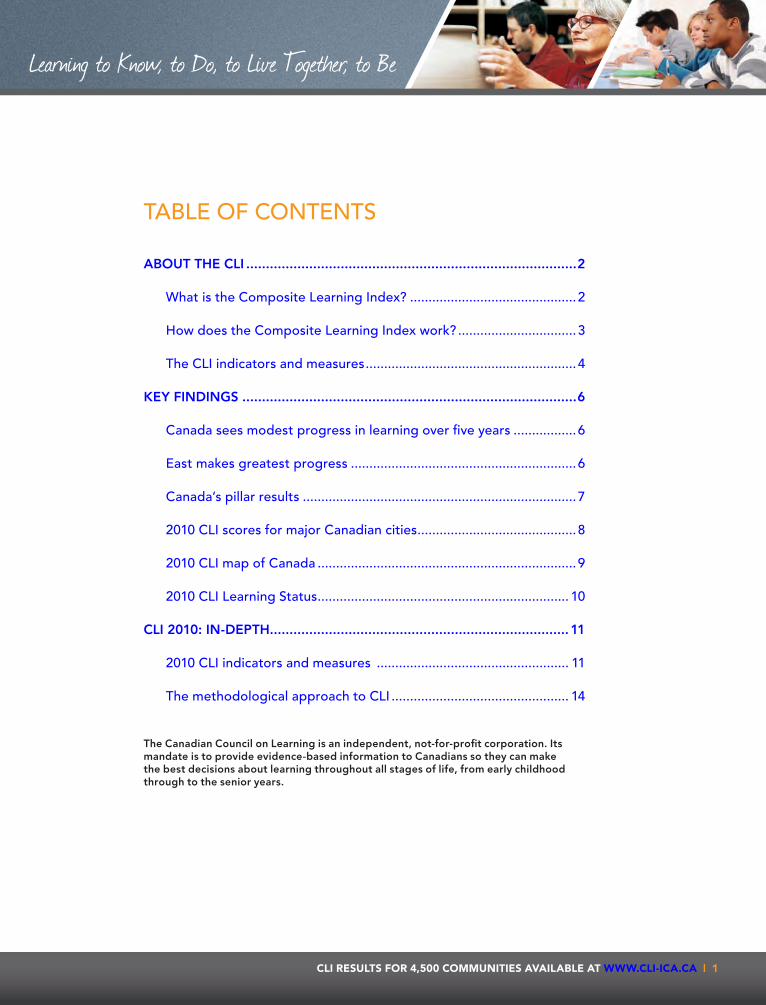
About the CLI ....................................................................................2
What is the Composite Learning Index? .............................................2
How does the Composite Learning Index work? ................................3
The CLI indicators and measures .........................................................4
Key FIndIngs .....................................................................................6
Canada sees modest progress in learning over five years .................6
East makes greatest progress .............................................................6
Canada’s pillar results ..........................................................................7
2010 CLI scores for major Canadian cities ...........................................8
2010 CLI map of Canada ......................................................................9
2010 CLI Learning Status .................................................................... 10
CLI 2010: In-depth............................................................................11
2010 CLI indicators and measures .................................................... 11
The methodological approach to CLI ................................................ 14
TabLE of ConTEnTS
the Canadian Council on Learning is an independent, not-for-profit corporation. Its mandate is to provide evidence-based information to Canadians so they can make the best decisions about learning throughout all stages of life, from early childhood through to the senior years.

2 | CLI resuLts for 4,500 CommunItIes avaILabLe at www.CLI-ICa.Ca
The 2010 Composite Learning Index
about tHe CLIwHat Is tHe ComPosIte LearnInG InDeX?A product of the Canadian Council on Learning (CCL), the Composite Learning Index (CLI) is Canada’s annual measure of progress in lifelong learning. It is based on a combination of statistical indicators that reflect the many ways Canadians learn, whether in school, in the home, at work or within the community.
The only index of its kind in the world, the CLI is an unprecedented measurement tool that expresses how learning in all aspects of life is critical to the success of individuals, communities and the country as a whole. On an individual level, Canadians stand to benefit from lifelong learning through higher wages, better job prospects, improved health and more fulfilling lives. Accordingly, Canada stands to gain through a more resilient economy and stronger bonds within and between communities.
Although most Canadians are aware of the potential benefits of lifelong learning, until CCL launched the CLI in 2006 there was no way of measuring how Canadians were performing across the full spectrum of learning.
To reflect this broad perspective, the CLI uses a wide range of learning indicators to generate numeric scores for more than 4,500 communities across Canada. A high CLI score means that a particular city, town or rural community possesses the kinds of learning conditions that foster social and economic well-being. A low CLI score means that a community is under-performing in certain aspects that are key to lifelong learning.
It is important to note that these scores are not meant to single out “winners” and “losers,” but rather to help Canadians understand the state of lifelong learning in their communities and to encourage them to think of concrete ways that they can improve on these conditions.
With new results published on CCL’s website every spring, the CLI is an objective and reliable measurement tool that can help communities make the best possible decisions about learning—decisions that will strengthen social ties, bolster the economy and hopefully improve people’s lives.
ExplorE thE EffEcts of lifElong lEarningThe structure of the Composite Learning Index echoes the inter- connectedness and complexity of lifelong learning in the community.To help understand this relationship, CCL developed the CLI Simulator, an online tool that allows individuals to adjust and compare a selection of indicators and witness the effects those decisions can have on a community.Try the CLI Simulator at www.cli-ica.ca.
support from JacquEs DElors
“I am convinced that your Composite Learning Index will make it possible to chart progress in learning, allowing your country to identify improvements that are required to maintain its leadership in this area. I hope that other countries will take this route.”
—Jacques Delors, Former president of the European Commission
CLI resuLts for 4,500 CommunItIes avaILabLe at www.CLI-ICa.Ca | 3
Learning to Know, to Do, to Live Together, to Be
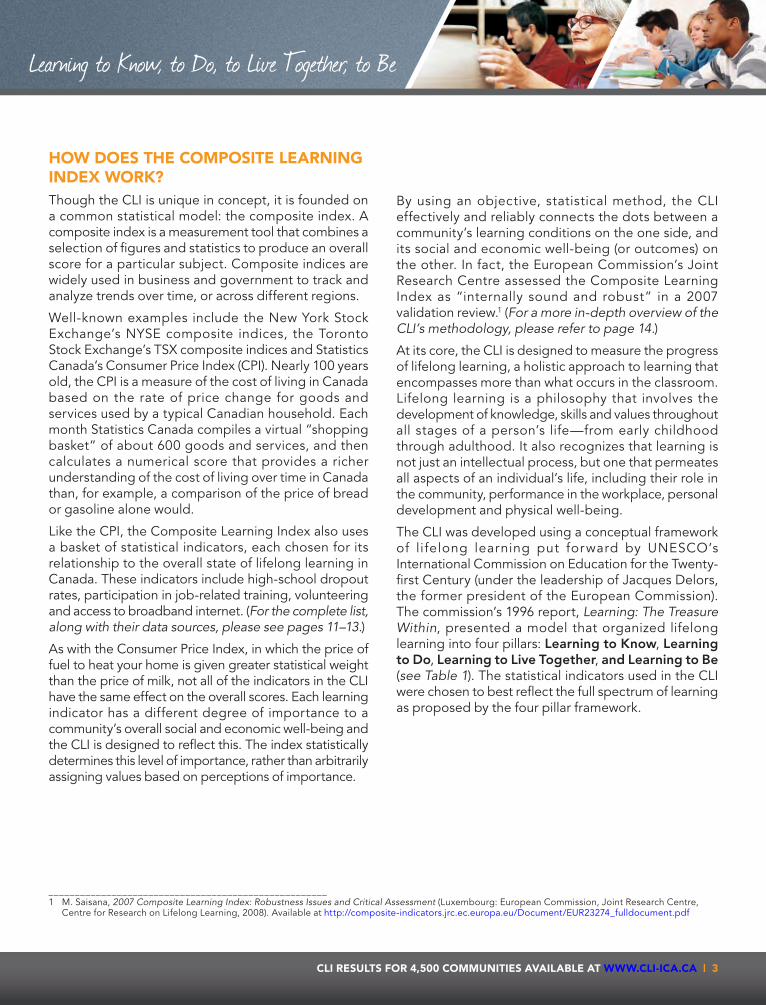
How Does tHe ComPosIte LearnInG InDeX worK?Though the CLI is unique in concept, it is founded on a common statistical model: the composite index. A composite index is a measurement tool that combines a selection of figures and statistics to produce an overall score for a particular subject. Composite indices are widely used in business and government to track and analyze trends over time, or across different regions.
Well-known examples include the New York Stock Exchange’s NYSE composite indices, the Toronto Stock Exchange’s TSX composite indices and Statistics Canada’s Consumer Price Index (CPI). Nearly 100 years old, the CPI is a measure of the cost of living in Canada based on the rate of price change for goods and services used by a typical Canadian household. Each month Statistics Canada compiles a virtual “shopping basket” of about 600 goods and services, and then calculates a numerical score that provides a richer understanding of the cost of living over time in Canada than, for example, a comparison of the price of bread or gasoline alone would.
Like the CPI, the Composite Learning Index also uses a basket of statistical indicators, each chosen for its relationship to the overall state of lifelong learning in Canada. These indicators include high-school dropout rates, participation in job-related training, volunteering and access to broadband internet. (For the complete list, along with their data sources, please see pages 11–13.)
As with the Consumer Price Index, in which the price of fuel to heat your home is given greater statistical weight than the price of milk, not all of the indicators in the CLI have the same effect on the overall scores. Each learning indicator has a different degree of importance to a community’s overall social and economic well-being and the CLI is designed to reflect this. The index statistically determines this level of importance, rather than arbitrarily assigning values based on perceptions of importance.
By using an objective, statistical method, the CLI effectively and reliably connects the dots between a community’s learning conditions on the one side, and its social and economic well-being (or outcomes) on the other. In fact, the European Commission’s Joint Research Centre assessed the Composite Learning Index as “internally sound and robust” in a 2007 validation review.1 (For a more in-depth overview of the CLI’s methodology, please refer to page 14.)
At its core, the CLI is designed to measure the progress of lifelong learning, a holistic approach to learning that encompasses more than what occurs in the classroom. Lifelong learning is a philosophy that involves the development of knowledge, skills and values throughout all stages of a person’s life—from early childhood through adulthood. It also recognizes that learning is not just an intellectual process, but one that permeates all aspects of an individual’s life, including their role in the community, performance in the workplace, personal development and physical well-being.
The CLI was developed using a conceptual framework of lifelong learning put forward by UNESCO’s International Commission on Education for the Twenty-first Century (under the leadership of Jacques Delors, the former president of the European Commission). The commission’s 1996 report, Learning: The Treasure Within, presented a model that organized lifelong learning into four pillars: Learning to Know, Learning to do, Learning to Live together, and Learning to be (see Table 1). The statistical indicators used in the CLI were chosen to best reflect the full spectrum of learning as proposed by the four pillar framework.
_____________________________________________________1 M. Saisana, 2007 Composite Learning Index: Robustness Issues and Critical Assessment (Luxembourg: European Commission, Joint Research Centre,
Centre for Research on Lifelong Learning, 2008). Available at http://composite-indicators.jrc.ec.europa.eu/Document/EUR23274_fulldocument.pdf
4 | CLI resuLts for 4,500 CommunItIes avaILabLe at www.CLI-ICa.Ca
The 2010 Composite Learning Index
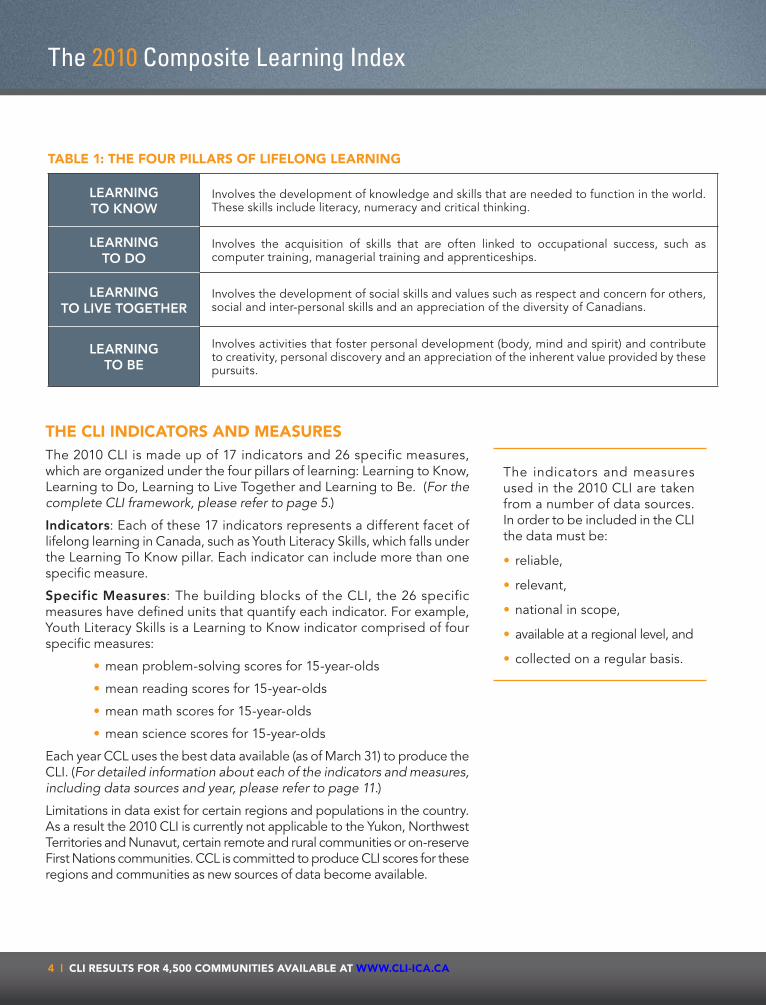
tabLe 1: tHe four PILLars of LIfeLonG LearnInG
LeARnIng to KnoW
Involves the development of knowledge and skills that are needed to function in the world. These skills include literacy, numeracy and critical thinking.
LeARnIng to do
Involves the acquisition of skills that are often linked to occupational success, such as computer training, managerial training and apprenticeships.
LeARnIng to LIVe togetheR
Involves the development of social skills and values such as respect and concern for others, social and inter-personal skills and an appreciation of the diversity of Canadians.
LeARnIng to be
Involves activities that foster personal development (body, mind and spirit) and contribute to creativity, personal discovery and an appreciation of the inherent value provided by these pursuits.
The indicators and measures used in the 2010 CLI are taken from a number of data sources. In order to be included in the CLI the data must be:
reliable,•
relevant, •
national in scope, •
available at a regional level, and•
collected on a regular basis.•
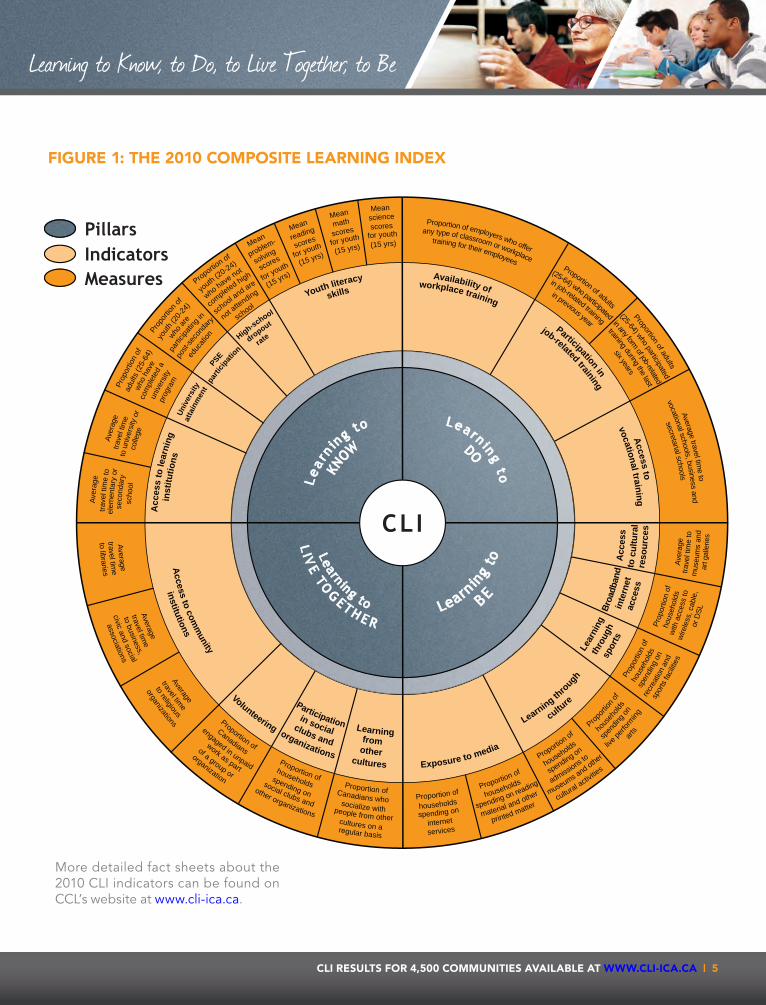
tHe CLI InDICators anD measuresThe 2010 CLI is made up of 17 indicators and 26 specific measures, which are organized under the four pillars of learning: Learning to Know, Learning to Do, Learning to Live Together and Learning to Be. (For the complete CLI framework, please refer to page 5.)
Indicators: Each of these 17 indicators represents a different facet of lifelong learning in Canada, such as Youth Literacy Skills, which falls under the Learning To Know pillar. Each indicator can include more than one specific measure.
specific Measures: The building blocks of the CLI, the 26 specific measures have defined units that quantify each indicator. For example, Youth Literacy Skills is a Learning to Know indicator comprised of four specific measures:
mean problem-solving scores for 15-year-olds•
mean reading scores for 15-year-olds•
mean math scores for 15-year-olds •
mean science scores for 15-year-olds•
Each year CCL uses the best data available (as of March 31) to produce the CLI. (For detailed information about each of the indicators and measures, including data sources and year, please refer to page 11.)
Limitations in data exist for certain regions and populations in the country. As a result the 2010 CLI is currently not applicable to the Yukon, Northwest Territories and Nunavut, certain remote and rural communities or on-reserve First Nations communities. CCL is committed to produce CLI scores for these regions and communities as new sources of data become available.
CLI resuLts for 4,500 CommunItIes avaILabLe at www.CLI-ICa.Ca | 5
Learning to Know, to Do, to Live Together, to Be
Aver
age
Ave
rage
Pro
porti
on o
f
P
ropo
rtion o
f
Proportio
n of
Mean M
ean Mean Mean
trav
el ti
me
to
tr
avel
tim
e
adu
lts (2
5-64
)
you
th (2
0-24)
yo
uth (20-24)
problem-
reading math science
el
emen
tary
or
to
uni
vers
ity o
r
who
have
who
are
who have not
solving
scores scores scores
A
cces
s to
lear
ning
Uni
vers
ity
PSE
H
igh-school
Youth literacy
ins
titut
ions
atta
inm
ent
par
ticipa
tion
dropout
skills
rate
s
econ
dary
colle
ge
com
plet
ed a
par
ticipa
ting i
n co
mpleted high scores for youth for youth for youth
scho
ol
uni
vers
ity
pos
t-sec
onda
ry sch
ool and are for youth (15 yrs) (15 yrs) (15 yrs)
pro
gram
not a
ttending
(15 yrs)
school
educ
ation
to libraries associations
organization
regular basis
travel time
civic and social organizations of a group or other organizations cultures on a
Average to business,
to religious work as part social clubs and people from other
institutions Volunteering organizations cultures
Access to com
munity
clubs and other
in social from
Participation Learning
travel time
travel time engaged in unpaid spending on socialize with
Average Average Canadians households Canadians who
Proportion of Proportion of Proportion of
services printed matter
museums a
nd other
arts
sp
orts
facil
ities
or D
SL
ar
t gal
lerie
s
internet material and other
admissi
ons to
live
perfo
rming
recr
eatio
n an
d
w
irele
ss, c
able
,
m
useu
ms
and
spending on spending on reading spending on
s
pe
nding
on
spe
nding
on
with
acc
ess
to
tr
avel
tim
e to
Exposure to media
c
ulture
sp
orts
acce
ss
res
ourc
es
Learning thro
ugh
t
hrou
gh
in
tern
et
to c
ultu
ral
Lea
rnin
g B
road
band
A
cces
s
households households
households
ho
useh
olds
ho
useh
olds
ho
useh
olds
Av
erag
e
Proportion of Proportion of
Proportion of
Prop
ortion
of
Prop
ortio
n of
P
ropo
rtion
of
cultural activitie
s
in any form of job-related
training during the last
six yearsProportion of adults
(25-64) who participated
Proportion of adults
(25-64) who participated
in job-related training
in previous year
Proportion of employers who offer
Average travel tim
e to
any type of classroom or workplace
vocational schools, business and
Availability of Participation in
Access to
workplace training job-related training vocational training
training for their employees
secretarial schools
fIGure 1: tHe 2010 ComPosIte LearnInG InDeX
More detailed fact sheets about the 2010 CLI indicators can be found on CCL’s website at www.cli-ica.ca.
6 | CLI resuLts for 4,500 CommunItIes avaILabLe at www.CLI-ICa.Ca
The 2010 Composite Learning Index
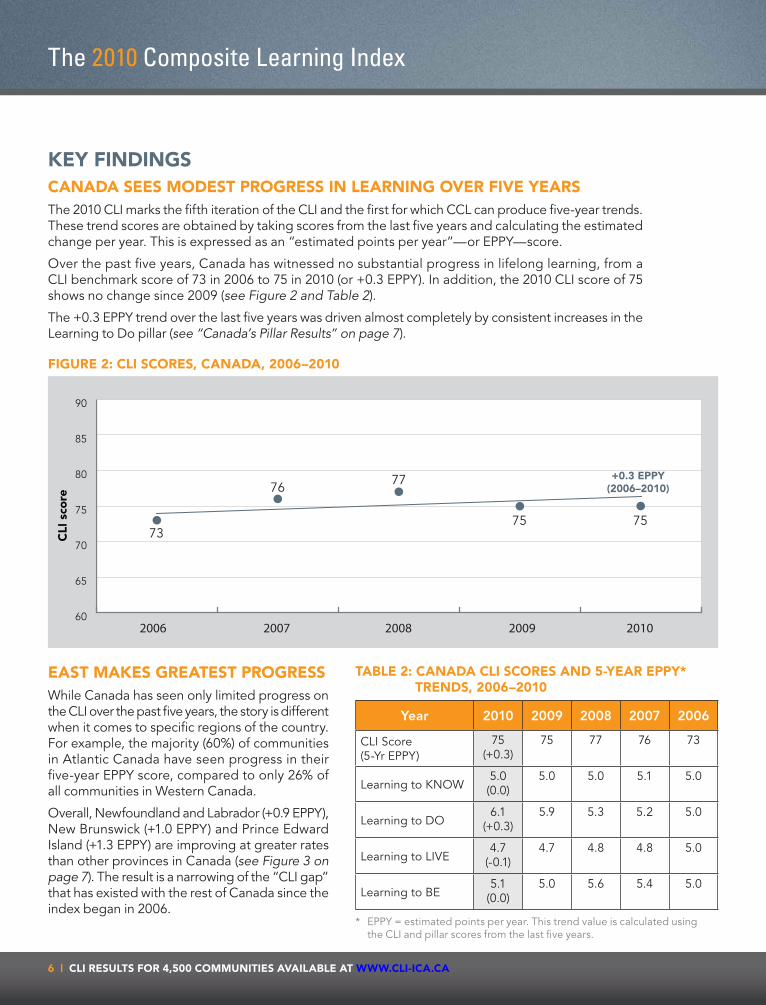
fIGure 2: CLI sCores, CanaDa, 2006–2010
KeY fInDInGs CanaDa sees moDest ProGress In LearnInG over fIve YearsThe 2010 CLI marks the fifth iteration of the CLI and the first for which CCL can produce five-year trends. These trend scores are obtained by taking scores from the last five years and calculating the estimated change per year. This is expressed as an “estimated points per year”—or EPPY—score.
Over the past five years, Canada has witnessed no substantial progress in lifelong learning, from a CLI benchmark score of 73 in 2006 to 75 in 2010 (or +0.3 EPPY). In addition, the 2010 CLI score of 75 shows no change since 2009 (see Figure 2 and Table 2).
The +0.3 EPPY trend over the last five years was driven almost completely by consistent increases in the Learning to Do pillar (see “Canada’s Pillar Results” on page 7).
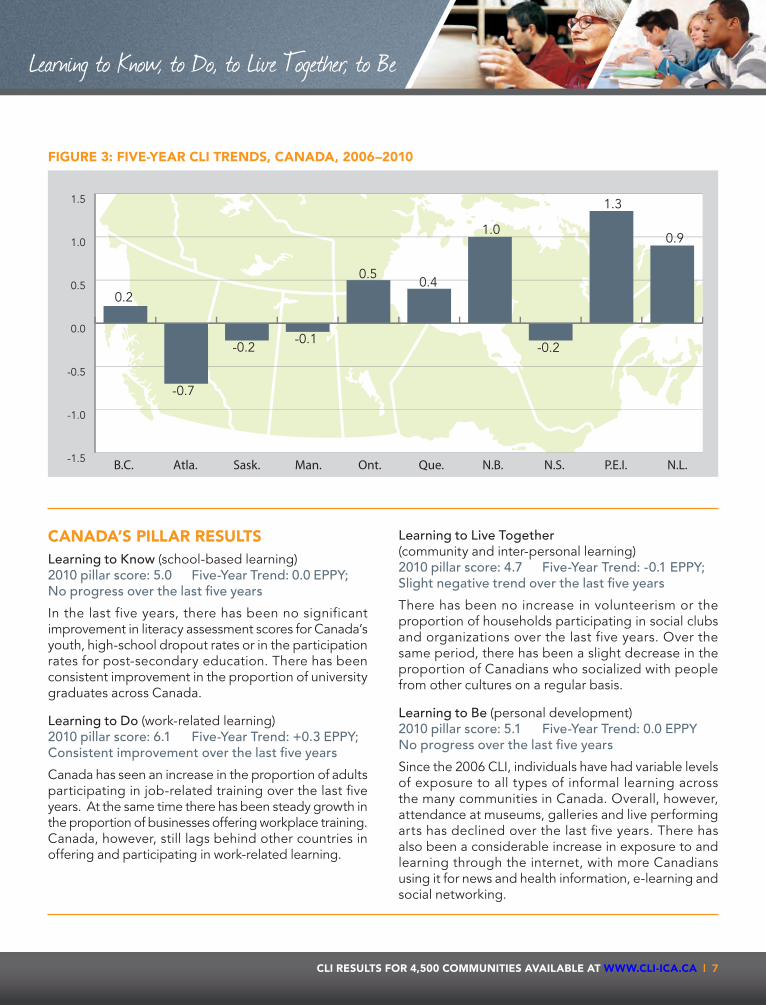
east maKes Greatest ProGress While Canada has seen only limited progress on the CLI over the past five years, the story is different when it comes to specific regions of the country. For example, the majority (60%) of communities in Atlantic Canada have seen progress in their five-year EPPY score, compared to only 26% of all communities in Western Canada.
Overall, Newfoundland and Labrador (+0.9 EPPY), New Brunswick (+1.0 EPPY) and Prince Edward Island (+1.3 EPPY) are improving at greater rates than other provinces in Canada (see Figure 3 on page 7). The result is a narrowing of the “CLI gap” that has existed with the rest of Canada since the index began in 2006.
tabLe 2: CanaDa CLI sCores anD 5-Year ePPY* trenDs, 2006–2010
year 2010 2009 2008 2007 2006
CLI Score (5-Yr EPPY)
75 (+0.3)
75 77 76 73
Learning to KNOW5.0 (0.0)
5.0 5.0 5.1 5.0
Learning to DO6.1
(+0.3)5.9 5.3 5.2 5.0
Learning to LIVE4.7
(-0.1)4.7 4.8 4.8 5.0
Learning to BE5.1
(0.0)5.0 5.6 5.4 5.0
* EPPY = estimated points per year. This trend value is calculated using the CLI and pillar scores from the last five years.
2006 2007 2008 2009 2010
73
76 77
75 75
+0.3 EPPY(2006–2010)
CLI
sco
re
60
65
70
75
80
85
90
CLI resuLts for 4,500 CommunItIes avaILabLe at www.CLI-ICa.Ca | 7
Learning to Know, to Do, to Live Together, to Be
fIGure 3: fIve-Year CLI trenDs, CanaDa, 2006–2010
B.C. Atla. Sask. Man. Ont. N.L.P.E.I.N.S.N.B.Que.
0.2
-0.7
-0.2-0.1
0.5
1.3
-0.2
1.0
-1.5
-1.0
-0.5
0.0
0.5
1.0
1.5
0.9
0.4
CanaDa’s PILLar resuLtsLearning to Know (school-based learning)2010 pillar score: 5.0 five-Year Trend: 0.0 EPPY; no progress over the last five years
In the last five years, there has been no significant improvement in literacy assessment scores for Canada’s youth, high-school dropout rates or in the participation rates for post-secondary education. There has been consistent improvement in the proportion of university graduates across Canada.
Learning to Do (work-related learning) 2010 pillar score: 6.1 five-Year Trend: +0.3 EPPY; Consistent improvement over the last five years
Canada has seen an increase in the proportion of adults participating in job-related training over the last five years. At the same time there has been steady growth in the proportion of businesses offering workplace training. Canada, however, still lags behind other countries in offering and participating in work-related learning.
Learning to Live Together (community and inter-personal learning) 2010 pillar score: 4.7 five-Year Trend: -0.1 EPPY; Slight negative trend over the last five years
There has been no increase in volunteerism or the proportion of households participating in social clubs and organizations over the last five years. Over the same period, there has been a slight decrease in the proportion of Canadians who socialized with people from other cultures on a regular basis.
Learning to be (personal development) 2010 pillar score: 5.1 five-Year Trend: 0.0 EPPYno progress over the last five years
Since the 2006 CLI, individuals have had variable levels of exposure to all types of informal learning across the many communities in Canada. Overall, however, attendance at museums, galleries and live performing arts has declined over the last five years. There has also been a considerable increase in exposure to and learning through the internet, with more Canadians using it for news and health information, e-learning and social networking.
8 | CLI resuLts for 4,500 CommunItIes avaILabLe at www.CLI-ICa.Ca
The 2010 Composite Learning Index
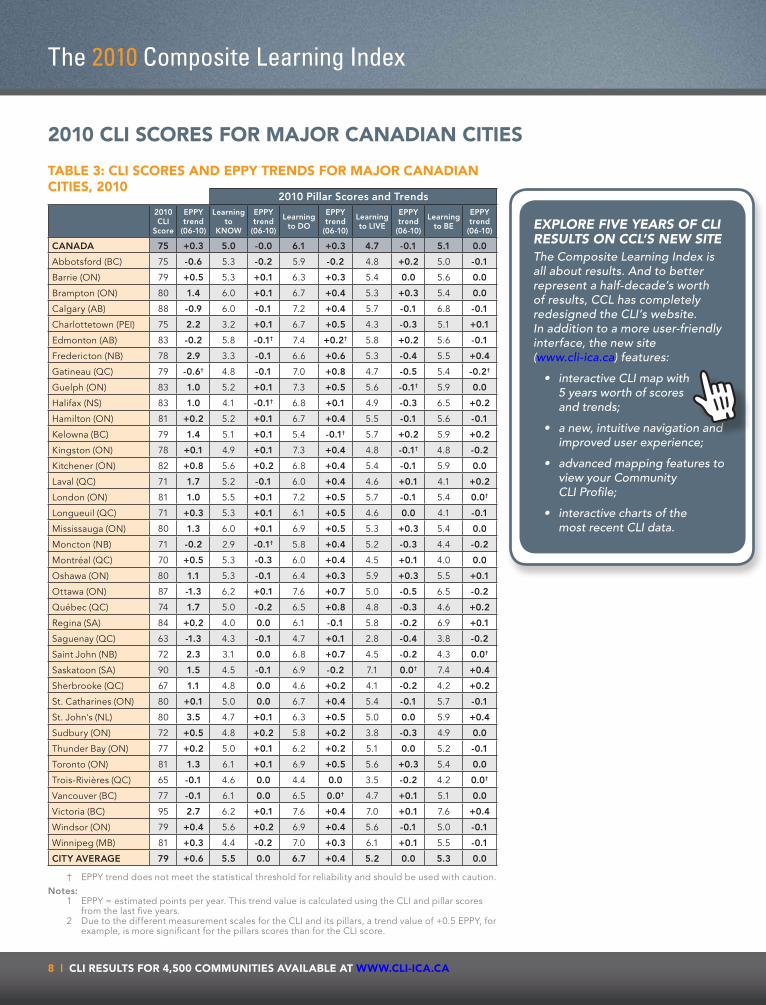
2010 CLI sCores for maJor CanaDIan CItIes
tabLe 3: CLI sCores anD ePPY trenDs for maJor CanaDIan CItIes, 2010
2010 Pillar Scores and Trends 2010
CLI Score
EPPY trend
(06-10)
Learning to
KNOW
EPPY trend
(06-10)
Learning to DO
EPPY trend
(06-10)
Learning to LIVE
EPPY trend
(06-10)
Learning to BE
EPPY trend
(06-10)
CANADA 75 +0.3 5.0 -0.0 6.1 +0.3 4.7 -0.1 5.1 0.0
Abbotsford (BC) 75 -0.6 5.3 -0.2 5.9 -0.2 4.8 +0.2 5.0 -0.1
Barrie (ON) 79 +0.5 5.3 +0.1 6.3 +0.3 5.4 0.0 5.6 0.0
Brampton (ON) 80 1.4 6.0 +0.1 6.7 +0.4 5.3 +0.3 5.4 0.0
Calgary (AB) 88 -0.9 6.0 -0.1 7.2 +0.4 5.7 -0.1 6.8 -0.1
Charlottetown (PEI) 75 2.2 3.2 +0.1 6.7 +0.5 4.3 -0.3 5.1 +0.1
Edmonton (AB) 83 -0.2 5.8 -0.1† 7.4 +0.2† 5.8 +0.2 5.6 -0.1
Fredericton (NB) 78 2.9 3.3 -0.1 6.6 +0.6 5.3 -0.4 5.5 +0.4
Gatineau (QC) 79 -0.6† 4.8 -0.1 7.0 +0.8 4.7 -0.5 5.4 -0.2†
Guelph (ON) 83 1.0 5.2 +0.1 7.3 +0.5 5.6 -0.1† 5.9 0.0
Halifax (NS) 83 1.0 4.1 -0.1† 6.8 +0.1 4.9 -0.3 6.5 +0.2
Hamilton (ON) 81 +0.2 5.2 +0.1 6.7 +0.4 5.5 -0.1 5.6 -0.1
Kelowna (BC) 79 1.4 5.1 +0.1 5.4 -0.1† 5.7 +0.2 5.9 +0.2
Kingston (ON) 78 +0.1 4.9 +0.1 7.3 +0.4 4.8 -0.1† 4.8 -0.2
Kitchener (ON) 82 +0.8 5.6 +0.2 6.8 +0.4 5.4 -0.1 5.9 0.0
Laval (QC) 71 1.7 5.2 -0.1 6.0 +0.4 4.6 +0.1 4.1 +0.2
London (ON) 81 1.0 5.5 +0.1 7.2 +0.5 5.7 -0.1 5.4 0.0†
Longueuil (QC) 71 +0.3 5.3 +0.1 6.1 +0.5 4.6 0.0 4.1 -0.1
Mississauga (ON) 80 1.3 6.0 +0.1 6.9 +0.5 5.3 +0.3 5.4 0.0
Moncton (NB) 71 -0.2 2.9 -0.1† 5.8 +0.4 5.2 -0.3 4.4 -0.2
Montréal (QC) 70 +0.5 5.3 -0.3 6.0 +0.4 4.5 +0.1 4.0 0.0
Oshawa (ON) 80 1.1 5.3 -0.1 6.4 +0.3 5.9 +0.3 5.5 +0.1
Ottawa (ON) 87 -1.3 6.2 +0.1 7.6 +0.7 5.0 -0.5 6.5 -0.2
Québec (QC) 74 1.7 5.0 -0.2 6.5 +0.8 4.8 -0.3 4.6 +0.2
Regina (SA) 84 +0.2 4.0 0.0 6.1 -0.1 5.8 -0.2 6.9 +0.1
Saguenay (QC) 63 -1.3 4.3 -0.1 4.7 +0.1 2.8 -0.4 3.8 -0.2
Saint John (NB) 72 2.3 3.1 0.0 6.8 +0.7 4.5 -0.2 4.3 0.0†
Saskatoon (SA) 90 1.5 4.5 -0.1 6.9 -0.2 7.1 0.0† 7.4 +0.4
Sherbrooke (QC) 67 1.1 4.8 0.0 4.6 +0.2 4.1 -0.2 4.2 +0.2
St. Catharines (ON) 80 +0.1 5.0 0.0 6.7 +0.4 5.4 -0.1 5.7 -0.1
St. John's (NL) 80 3.5 4.7 +0.1 6.3 +0.5 5.0 0.0 5.9 +0.4
Sudbury (ON) 72 +0.5 4.8 +0.2 5.8 +0.2 3.8 -0.3 4.9 0.0
Thunder Bay (ON) 77 +0.2 5.0 +0.1 6.2 +0.2 5.1 0.0 5.2 -0.1
Toronto (ON) 81 1.3 6.1 +0.1 6.9 +0.5 5.6 +0.3 5.4 0.0
Trois-Rivières (QC) 65 -0.1 4.6 0.0 4.4 0.0 3.5 -0.2 4.2 0.0†
Vancouver (BC) 77 -0.1 6.1 0.0 6.5 0.0† 4.7 +0.1 5.1 0.0
Victoria (BC) 95 2.7 6.2 +0.1 7.6 +0.4 7.0 +0.1 7.6 +0.4
Windsor (ON) 79 +0.4 5.6 +0.2 6.9 +0.4 5.6 -0.1 5.0 -0.1
Winnipeg (MB) 81 +0.3 4.4 -0.2 7.0 +0.3 6.1 +0.1 5.5 -0.1
CITY AVERAGE 79 +0.6 5.5 0.0 6.7 +0.4 5.2 0.0 5.3 0.0
† EPPY trend does not meet the statistical threshold for reliability and should be used with caution.Notes: 1 EPPY = estimated points per year. This trend value is calculated using the CLI and pillar scores
from the last five years. 2 Due to the different measurement scales for the CLI and its pillars, a trend value of +0.5 EPPY, for
example, is more significant for the pillars scores than for the CLI score.
EXPLORE FIVE YEARS OF CLI RESULTS ON CCL’S NEW SITEThe Composite Learning Index is all about results. And to better represent a half-decade’s worth of results, CCL has completely redesigned the CLI’s website. In addition to a more user-friendly interface, the new site (www.cli-ica.ca) features:
• interactiveCLImapwith 5 years worth of scores and trends;
• anew,intuitivenavigationandimproveduserexperience;
• advancedmappingfeaturestoviewyourCommunity CLI Profile;
• interactivechartsofthe most recent CLI data.
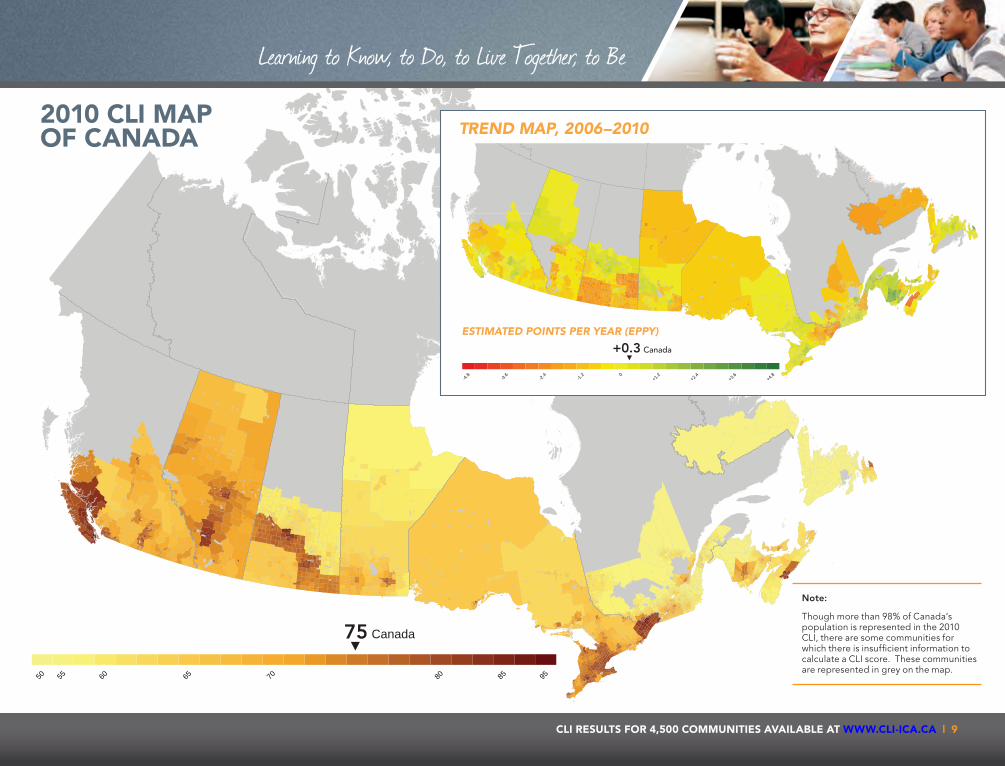
50 55 60 65 70 80 85 95
75 Canada
Learning to Know, to Do, to Live Together, to Be
ESTIMATED POINTS PER YEAR (EPPY)
TREND MAP, 2006–2010
-4.8 -3.6 -2.4 -1.2 0+1.2 +2.4 +3.6 +4.8
+0.3 Canada
2010 CLI MAP of CANADA
Note:
Though more than 98% of Canada’s population is represented in the 2010 CLI, there are some communities for which there is insufficient information to calculate a CLI score. These communities are represented in grey on the map.
CLI resuLts for 4,500 CoMMuNItIes AvAILAbLe At www.CLI-ICA.CA | 9
10 | CLI resuLts for 4,500 CommunItIes avaILabLe at www.CLI-ICa.Ca
The 2010 Composite Learning Index
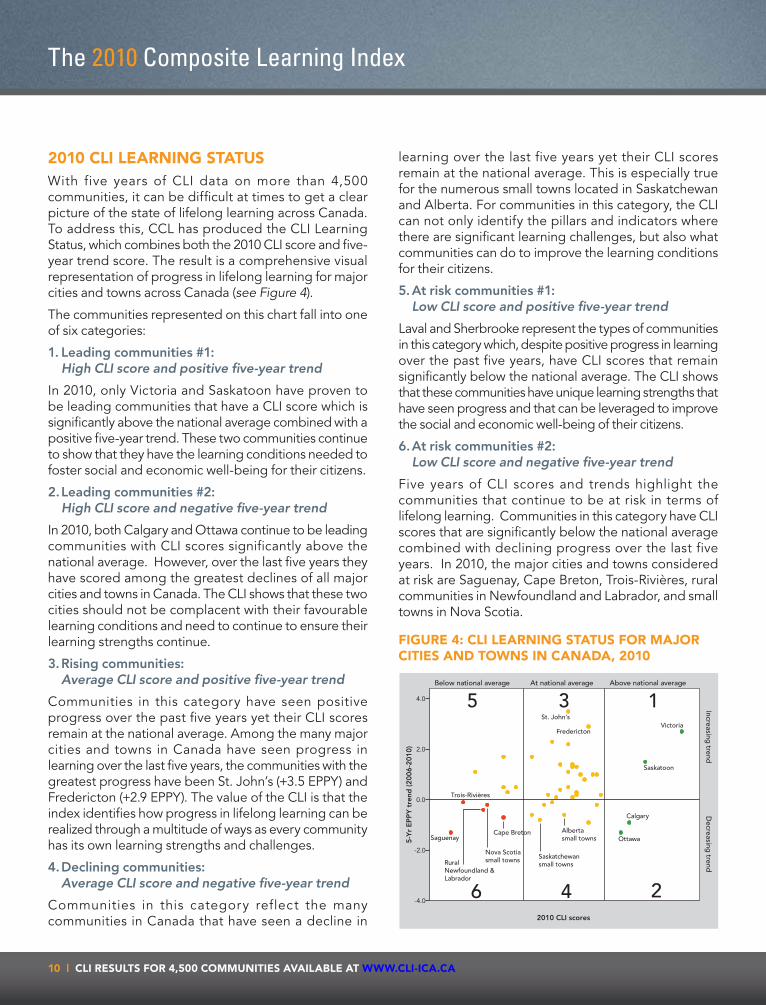
learning over the last five years yet their CLI scores remain at the national average. This is especially true for the numerous small towns located in Saskatchewan and Alberta. For communities in this category, the CLI can not only identify the pillars and indicators where there are significant learning challenges, but also what communities can do to improve the learning conditions for their citizens.
5. At risk communities #1: Low CLI score and positive five-year trend
Laval and Sherbrooke represent the types of communities in this category which, despite positive progress in learning over the past five years, have CLI scores that remain significantly below the national average. The CLI shows that these communities have unique learning strengths that have seen progress and that can be leveraged to improve the social and economic well-being of their citizens.
6. At risk communities #2: Low CLI score and negative five-year trend
Five years of CLI scores and trends highlight the communities that continue to be at risk in terms of lifelong learning. Communities in this category have CLI scores that are significantly below the national average combined with declining progress over the last five years. In 2010, the major cities and towns considered at risk are Saguenay, Cape Breton, Trois-Rivières, rural communities in Newfoundland and Labrador, and small towns in Nova Scotia.
2010 CLI LearnInG statusWith five years of CLI data on more than 4,500 communities, it can be difficult at times to get a clear picture of the state of lifelong learning across Canada. To address this, CCL has produced the CLI Learning Status, which combines both the 2010 CLI score and five-year trend score. The result is a comprehensive visual representation of progress in lifelong learning for major cities and towns across Canada (see Figure 4).
The communities represented on this chart fall into one of six categories:
1. Leading communities #1: High CLI score and positive five-year trend
In 2010, only Victoria and Saskatoon have proven to be leading communities that have a CLI score which is significantly above the national average combined with a positive five-year trend. These two communities continue to show that they have the learning conditions needed to foster social and economic well-being for their citizens.
2. Leading communities #2: High CLI score and negative five-year trend
In 2010, both Calgary and Ottawa continue to be leading communities with CLI scores significantly above the national average. However, over the last five years they have scored among the greatest declines of all major cities and towns in Canada. The CLI shows that these two cities should not be complacent with their favourable learning conditions and need to continue to ensure their learning strengths continue.
3. Rising communities: Average CLI score and positive five-year trend
Communities in this category have seen positive progress over the past five years yet their CLI scores remain at the national average. Among the many major cities and towns in Canada have seen progress in learning over the last five years, the communities with the greatest progress have been St. John’s (+3.5 EPPY) and Fredericton (+2.9 EPPY). The value of the CLI is that the index identifies how progress in lifelong learning can be realized through a multitude of ways as every community has its own learning strengths and challenges.
4. Declining communities: Average CLI score and negative five-year trend
Communities in this category reflect the many communities in Canada that have seen a decline in
fIGure 4: CLI LearnInG status for major CItIes and towns In Canada, 2010
2010 CLI scores
5-Y
r E
PP
Y t
rend
(2
00
6-2
01
0)
4.0
2.0
0.0
-2.0
-4.0
Below national average Above national averageAt national average
Victoria
Saskatoon
Calgary
Ottawa
St. John’s
Fredericton
Cape Breton
Trois-Rivières
Nova Scotiasmall townsRural
Newfoundland & Labrador
Saguenay
Increasing trend
Decreasing
trend
Saskatchewansmall towns
Alberta small towns
1
2
3
46
5
CLI resuLts for 4,500 CommunItIes avaILabLe at www.CLI-ICa.Ca | 11
Learning to Know, to Do, to Live Together, to Be
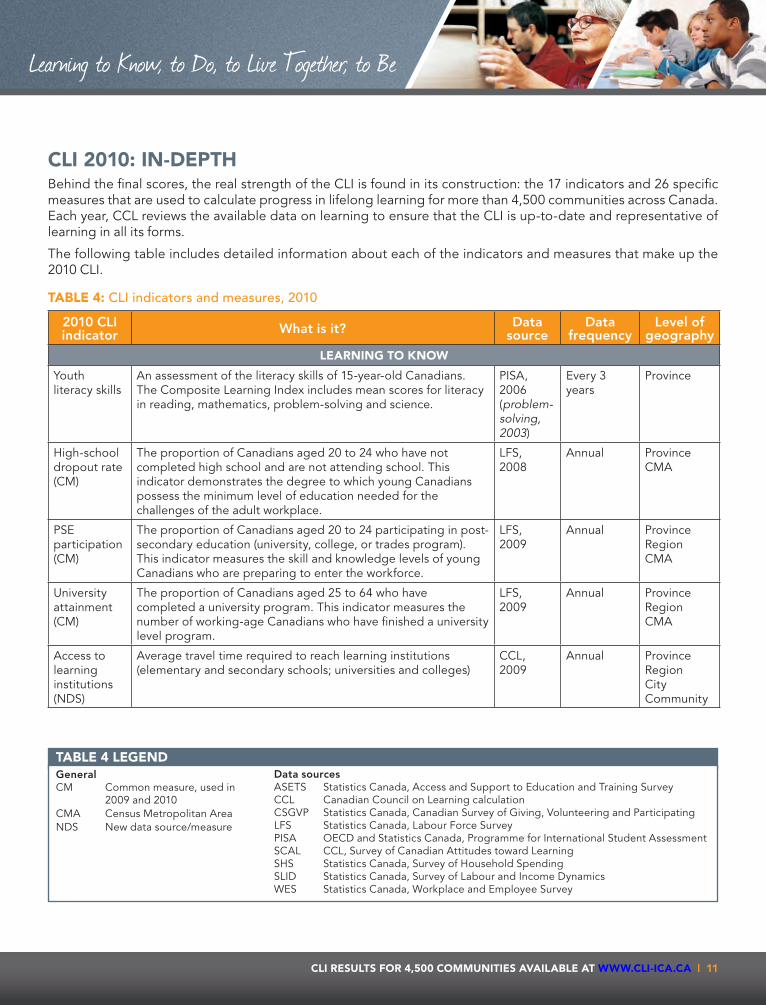
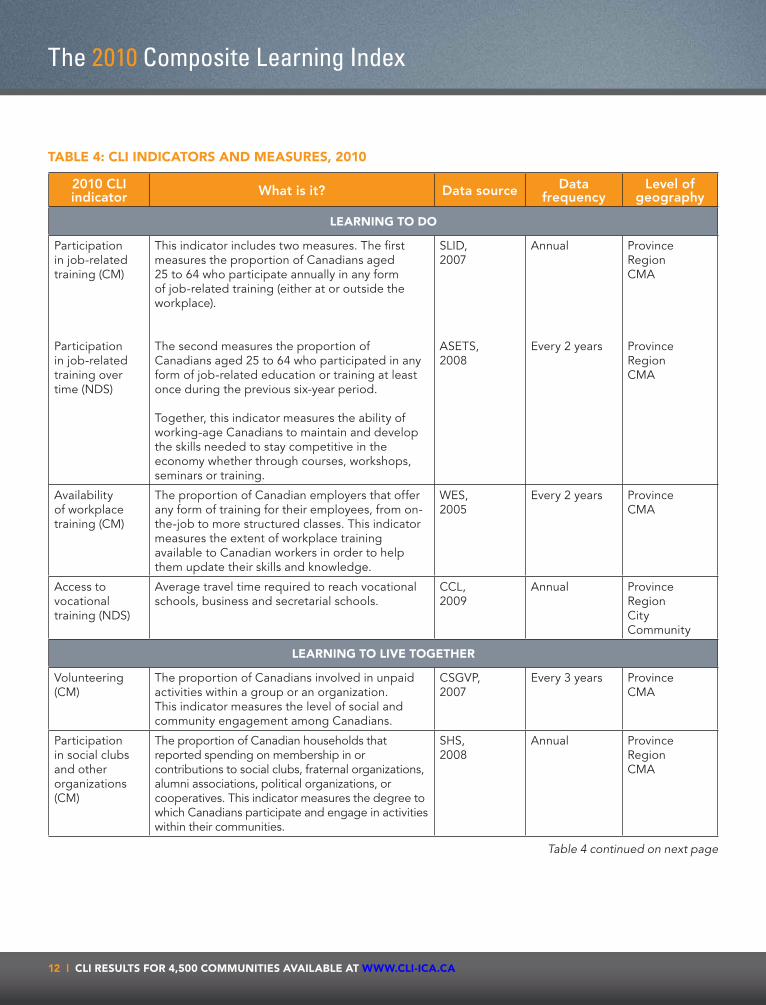
CLI 2010: In-DePtH Behind the final scores, the real strength of the CLI is found in its construction: the 17 indicators and 26 specific measures that are used to calculate progress in lifelong learning for more than 4,500 communities across Canada. Each year, CCL reviews the available data on learning to ensure that the CLI is up-to-date and representative of learning in all its forms.
The following table includes detailed information about each of the indicators and measures that make up the 2010 CLI.
tabLe 4: CLI indicators and measures, 2010
2010 CLI indicator What is it? data
source data
frequencyLevel of
geography
LearnInG to Know
Youth literacy skills
An assessment of the literacy skills of 15-year-old Canadians. The Composite Learning Index includes mean scores for literacy in reading, mathematics, problem-solving and science.
PISA, 2006 (problem-solving, 2003)
Every 3 years
Province
High-school dropout rate (CM)
The proportion of Canadians aged 20 to 24 who have not completed high school and are not attending school. This indicator demonstrates the degree to which young Canadians possess the minimum level of education needed for the challenges of the adult workplace.
LFS, 2008
Annual Province CMA
PSE participation (CM)
The proportion of Canadians aged 20 to 24 participating in post-secondary education (university, college, or trades program). This indicator measures the skill and knowledge levels of young Canadians who are preparing to enter the workforce.
LFS, 2009
Annual Province Region CMA
University attainment (CM)
The proportion of Canadians aged 25 to 64 who have completed a university program. This indicator measures the number of working-age Canadians who have finished a university level program.
LFS, 2009
Annual Province Region CMA
Access to learning institutions (NDS)
Average travel time required to reach learning institutions (elementary and secondary schools; universities and colleges)
CCL, 2009
Annual Province Region City Community
tabLe 4 LeGenDgeneralCM Common measure, used in 2009 and 2010CMA Census Metropolitan AreaNDS New data source/measure
data sourcesASETS Statistics Canada, Access and Support to Education and Training SurveyCCL Canadian Council on Learning calculationCSGVP Statistics Canada, Canadian Survey of Giving, Volunteering and Participating LFS Statistics Canada, Labour Force SurveyPISA OECD and Statistics Canada, Programme for International Student Assessment SCAL CCL, Survey of Canadian Attitudes toward Learning SHS Statistics Canada, Survey of Household Spending SLID Statistics Canada, Survey of Labour and Income Dynamics WES Statistics Canada, Workplace and Employee Survey
12 | CLI resuLts for 4,500 CommunItIes avaILabLe at www.CLI-ICa.Ca
The 2010 Composite Learning Index
tabLe 4: CLI InDICators anD measures, 2010
2010 CLI indicator What is it? data source data
frequencyLevel of
geography
LearnInG to Do
Participation in job-related training (CM)
Participation in job-related training over time (NDS)
This indicator includes two measures. The first measures the proportion of Canadians aged 25 to 64 who participate annually in any form of job-related training (either at or outside the workplace).
The second measures the proportion of Canadians aged 25 to 64 who participated in any form of job-related education or training at least once during the previous six-year period.
Together, this indicator measures the ability of working-age Canadians to maintain and develop the skills needed to stay competitive in the economy whether through courses, workshops, seminars or training.
SLID,2007
ASETS, 2008
Annual
Every 2 years
ProvinceRegionCMA
ProvinceRegionCMA
Availability of workplace training (CM)
The proportion of Canadian employers that offer any form of training for their employees, from on-the-job to more structured classes. This indicator measures the extent of workplace training available to Canadian workers in order to help them update their skills and knowledge.
WES, 2005
Every 2 years Province CMA
Access to vocational training (NDS)
Average travel time required to reach vocational schools, business and secretarial schools.
CCL, 2009
Annual Province Region City Community
LearnInG to LIve toGetHer
Volunteering (CM)
The proportion of Canadians involved in unpaid activities within a group or an organization. This indicator measures the level of social and community engagement among Canadians.
CSGVP, 2007
Every 3 years Province CMA
Participation in social clubs and other organizations (CM)
The proportion of Canadian households that reported spending on membership in or contributions to social clubs, fraternal organizations, alumni associations, political organizations, or cooperatives. This indicator measures the degree to which Canadians participate and engage in activities within their communities.
SHS, 2008
Annual Province Region CMA
Table 4 continued on next page
CLI resuLts for 4,500 CommunItIes avaILabLe at www.CLI-ICa.Ca | 13
Learning to Know, to Do, to Live Together, to Be
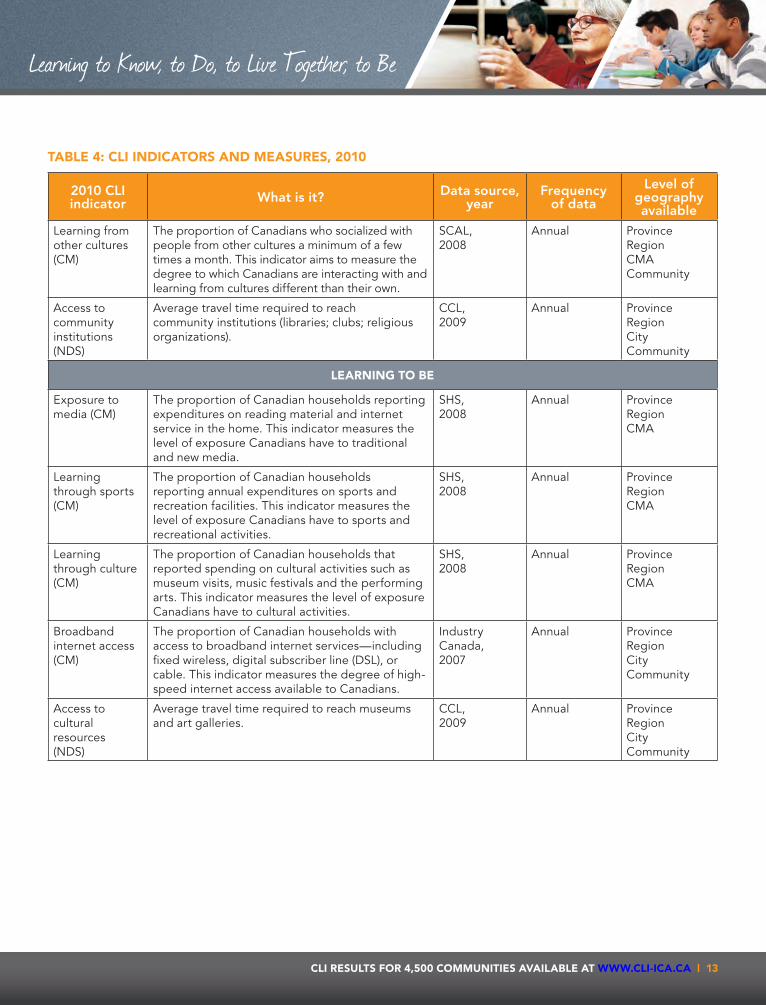
tabLe 4: CLI InDICators anD measures, 2010
2010 CLI indicator What is it? data source,
yearFrequency
of data
Level of geography available
Learning from other cultures (CM)
The proportion of Canadians who socialized with people from other cultures a minimum of a few times a month. This indicator aims to measure the degree to which Canadians are interacting with and learning from cultures different than their own.
SCAL, 2008
Annual Province Region CMA Community
Access to community institutions (NDS)
Average travel time required to reach community institutions (libraries; clubs; religious organizations).
CCL,2009
Annual ProvinceRegionCityCommunity
LearnInG to be
Exposure to media (CM)
The proportion of Canadian households reporting expenditures on reading material and internet service in the home. This indicator measures the level of exposure Canadians have to traditional and new media.
SHS, 2008
Annual Province Region CMA
Learning through sports (CM)
The proportion of Canadian households reporting annual expenditures on sports and recreation facilities. This indicator measures the level of exposure Canadians have to sports and recreational activities.
SHS, 2008
Annual Province Region CMA
Learning through culture (CM)
The proportion of Canadian households that reported spending on cultural activities such as museum visits, music festivals and the performing arts. This indicator measures the level of exposure Canadians have to cultural activities.
SHS, 2008
Annual Province Region CMA
Broadband internet access (CM)
The proportion of Canadian households with access to broadband internet services—including fixed wireless, digital subscriber line (DSL), or cable. This indicator measures the degree of high-speed internet access available to Canadians.
Industry Canada, 2007
Annual Province Region City Community
Access to cultural resources (NDS)
Average travel time required to reach museums and art galleries.
CCL, 2009
Annual Province Region City Community
14 | CLI resuLts for 4,500 CommunItIes avaILabLe at www.CLI-ICa.Ca
The 2010 Composite Learning Index
tHe metHoDoLoGICaL aPProaCH to CLI Measuring a complex system like lifelong learning in a single index brings with it plenty of empirical challenges—including data quality, indicator selection and the weighting of indicators. The development of the Composite Learning Index had to overcome the historical difficulty in measuring something that is not directly observable—the effects of lifelong learning over time and for individual communities across Canada.
The CLI consists of more than just combining existing measures of lifelong learning into a calculated score. The underlying structure of the CLI model is enhanced by statistically connecting lifelong learning to societal well-being. The results present a more realistic picture of the state of lifelong learning in Canada than any of the individual measures can do in isolation.
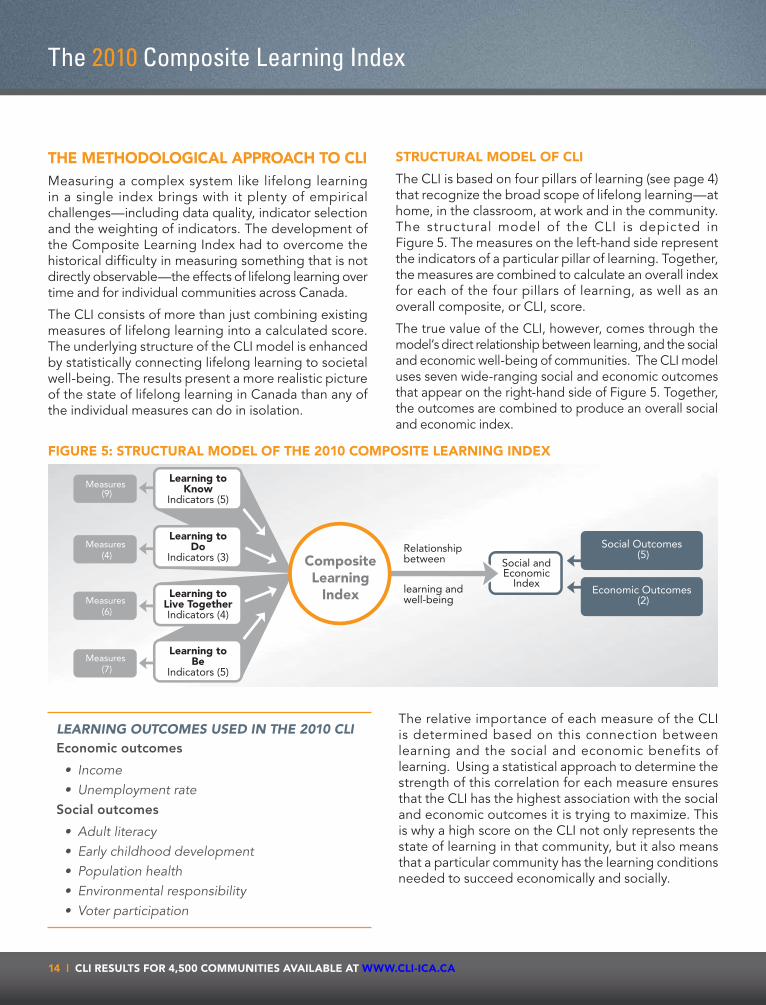
struCturaL moDeL of CLI
The CLI is based on four pillars of learning (see page 4) that recognize the broad scope of lifelong learning—at home, in the classroom, at work and in the community. The structural model of the CLI is depicted in Figure 5. The measures on the left-hand side represent the indicators of a particular pillar of learning. Together, the measures are combined to calculate an overall index for each of the four pillars of learning, as well as an overall composite, or CLI, score.
The true value of the CLI, however, comes through the model’s direct relationship between learning, and the social and economic well-being of communities. The CLI model uses seven wide-ranging social and economic outcomes that appear on the right-hand side of Figure 5. Together, the outcomes are combined to produce an overall social and economic index.
fIGure 5: struCturaL moDeL of tHe 2010 ComPosIte LearnInG InDeX
Measures (9)
Measures (4)
Measures (6)
Measures (7)
Social andEconomic
Indexlearning and well-being
Social Outcomes (5)
Economic Outcomes (2)
Learning toKnow
Indicators (5)
Learning toDo
Indicators (3)
Learning toLive TogetherIndicators (4)
Learning toBe
Indicators (5)
CompositeLearning
Index
Relationship between
lEarning outcomEs usED in thE 2010 clieconomic outcomes
• Income• Unemploymentrate
social outcomes
• Adultliteracy• Earlychildhooddevelopment• Populationhealth• Environmentalresponsibility• Voterparticipation
The relative importance of each measure of the CLI is determined based on this connection between learning and the social and economic benefits of learning. Using a statistical approach to determine the strength of this correlation for each measure ensures that the CLI has the highest association with the social and economic outcomes it is trying to maximize. This is why a high score on the CLI not only represents the state of learning in that community, but it also means that a particular community has the learning conditions needed to succeed economically and socially.

CLI resuLts for 4,500 CommunItIes avaILabLe at www.CLI-ICa.Ca | 15
Learning to Know, to Do, to Live Together, to Be
Overall, the correlation between the 2010 CLI and the index of social and economic well-being is 0.78 (see Figure 6).
fIGure 6: CorreLatIon between tHe CLI anD tHe soCIaL anD eConomIC weLL-beInG InDeX, 2010
2010 CLI100806040
Soci
al a
nd e
cono
mic
al in
dex
2.0
0.0
-2.0
-4.0Low
High
R2 = 0.78
Data ImPutatIon
One of the biggest challenges in producing a composite index that describes conditions for communities is finding data that provide reliable and accurate estimates at the community level. For measures that do not include data at this level, the approach used by CCL is to impute data based on the best estimate possible.
Surveys reported by Statistics Canada often reflect the best available sources of data, but often only provide estimates for larger geographic regions, such as metropolitan areas, economic regions and provinces. In order to impute data at the community level for measures, such as the participation in job-related training, data at the lowest level of available of geography (in this case regional data) are used to produce the CLI score. It is likely that the regional results will reflect similar trends for its underlying communities, providing a credible inference for each community.
ValiDating thE robustnEss of thE cli The selection of an appropriate methodological approach is vital to any index. There are three common approaches that are most often used when assigning weights to the individual measures of any composite index:
1. Equal weights—provides each measure with the same degree of importance to learning.
2. Expert panel-based weights—allows a panel of experts to determine the importance of each measure.
3. Statistical-based weighting—allows the statistical relationships between two phenomena to determine the importance of each measure.
The CLI approach is entirely based on statistical analysis—the only objective way of determining the weights for each measure. The evaluation of the robustness of the CLI by the European Commission’s Joint Research Centre (JRC) in 2008 included an analysis of the multiple possible approaches to constructing the CLI and found that the existing approach allowed for the strongest possible relationship between learning and community well-being.
Read the JRC’s validation report at ec.europa.eu. http://ec.europa.eu/dgs/jrc/index.cfm?id=1410&obj_id=4860&dt_code=NWS&lang=en
16 | CLI resuLts for 4,500 CommunItIes avaILabLe at www.CLI-ICa.Ca
The 2010 Composite Learning Index
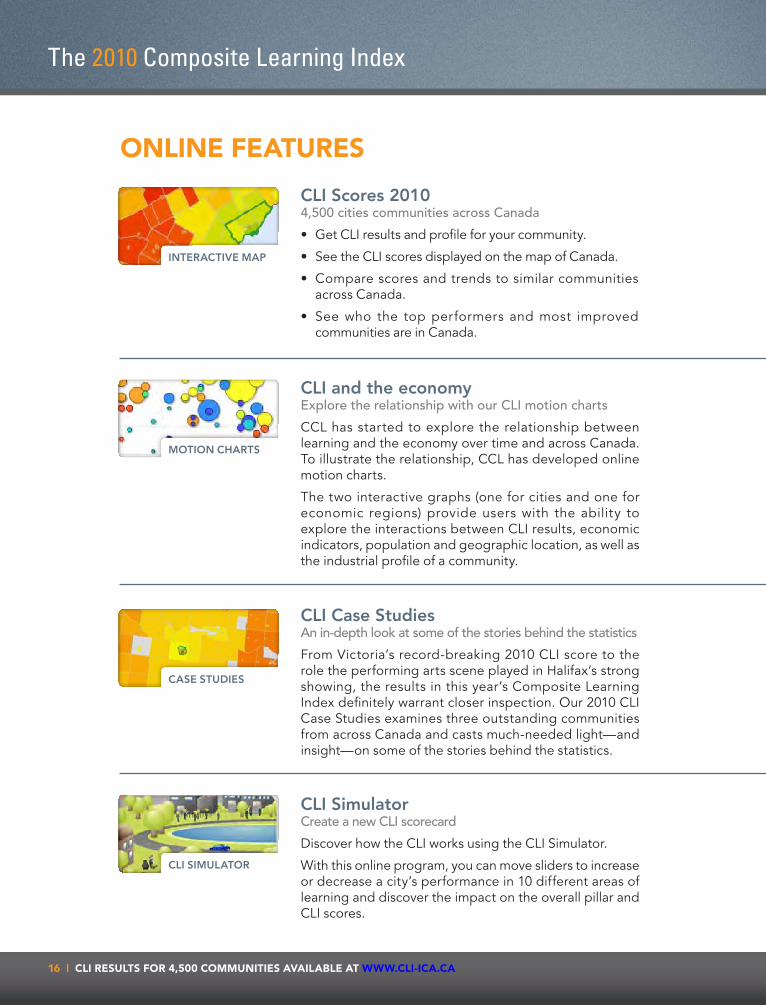
CLI scores 20104,500 cities communities across Canada
• GetCLIresultsandprofileforyourcommunity.
• SeetheCLIscoresdisplayedonthemapofCanada.
• Comparescoresandtrendstosimilarcommunities across Canada.
• Seewho the topperformersandmost improvedcommunities are in Canada.
InteRACtIVe MAp
CLI and the economyExplore the relationship with our CLI motion charts
CCL has started to explore the relationship between learning and the economy over time and across Canada. To illustrate the relationship, CCL has developed online motion charts.
The two interactive graphs (one for cities and one for economic regions) provide users with the ability to explore the interactions between CLI results, economic indicators, population and geographic location, as well as the industrial profile of a community.
CLI Case studiesan in-depth look at some of the stories behind the statistics
From Victoria’s record-breaking 2010 CLI score to the role the performing arts scene played in Halifax’s strong showing, the results in this year’s Composite Learning Index definitely warrant closer inspection. Our 2010 CLI Case Studies examines three outstanding communities from across Canada and casts much-needed light—and insight—on some of the stories behind the statistics.
CLI simulatorCreate a new CLI scorecard
Discover how the CLI works using the CLI Simulator.
With this online program, you can move sliders to increase or decrease a city’s performance in 10 different areas of learning and discover the impact on the overall pillar and CLI scores.
onLIne features
MotIon ChARts
CAse studIes
CLI sIMuLAtoR


This handbook is intended to provide an overview of the 2010 Composite Learning Index. Further information about the 2010 CLI, including an interactive map of all the results for 4,500 communities, is available on CCL’s website at www.cli-ica.ca.
If you have any questions or comments about the Composite Learning Index, please e-mail them to [email protected].
If you have any questions about the Canadian Council on Learning and our work, please e-mail us at [email protected].
FURTHER INFORMATION