clarity fuel cell - hondaworld.honda.com/content/dam/site/world/investors/cq_img/library/... ·...
TRANSCRIPT

Honda Corporate Update 2016 Spring
Clarity Fuel Cell

1. FY16 Results
FY16 Operating profit / Results (Operating profit: 503.3 billion yen(ROS 3.4%)・Excluding the impact of airbag inflators, profitability improved versus last FY・FMC of core models in N.A. as well as cost reduction efforts have certainly
improved business fundamentals
Airbag Inflators・ A modification of expense estimates resulted in additional product quality
expense provisions (4Q:approx. 267 billion yen, FY16 Total:approx. 436 billion yen)・Financial provisions have now been made for all non-desiccant inflators
(cumulative total of approx. 51 million units)
2.FY17 Budget・ Analysis of factors underlying Operating profit of 600 billion yen (ROS 4.4%)
3.Mid-term business plan
(+)Reverse accounting effect for quality related expenses(+)Profit contribution due to improvement in model profitability(-)FOREX effects(-)SG&A(including preparatory expenses)
Additional impact due to accounting measures (-)Reverse accounting effect of one-off items from last FY(-)Increase in R&D expenses due to IFRS
Main discussion points

Honda Business Status
FY16 Financial Highlights
Automobile Business Operations
Motorcycle Business Operations
Honda Corporate Update
Business Strategy
3

Profit Structure Profile over Past Decade and FY17 Forecast
183 203 199
177 192 182
461280
153
7.4%7.7% 7.9%
1.9%
4.2%
6.4%
2.9%
5.5%
6.6%
5.0%
3.4%
4.4%
-1%
1%
3%
5%
7%
-200
0
200
400
600
800
1,000
1,200
1,400
1,600
1,800
FY3/06 FY3/07 FY3/08 FY3/09 FY3/10 FY3/11 FY3/12 FY3/13 FY3/14 FY3/15 FY3/16 FY3/17P
Automobile
Motorcycle
Finance
O/P Margin
4.4%
4
・Earthquake
・Thai flood
FY3/12
Yen (billions)
231
569
363
189
953851868
*Includes gain on return of the substitutional portion of the Employees’ Pension Funds to the Japanese government (138 bil ) .
*
544600
823670
8.8% *
IFRSUS GAAP
503

Fiscal Year 2017 Projection (FY16 results vs. FY17 forecast)
FY16Results
FY17Forecast Difference FY16
ResultsFY17
Forecast Difference
Japan 180 150 - 30 614 600 - 14North
America 308 310 + 2 1,929 1,990 + 61Europe 204 180 - 24 172 190 + 18
Asia 8,650 9,780 + 1,130 670 730 + 60Other
Region 1,230 1,125 - 105 251 235 - 16Total 10,572 11,545 + 973 3,636 3,745 + 109
10,57211,545
3,636 3,745
+ 973( + 9.2 %)
+ 109( + 3.0 %)
(Automobiles)(Motorcycles)
Consolidated Unit Sales
Motorcycle : Mainly increased in Asia
Automobile : Mainly increased in North America and Asia
503.3600.0
+ 96.6
Vol/Mix Cost reduction
SG&A
+ 291.0
FY16Results
FY17Forecast
Main Assumptions of Forecast Forex -303.0
JPY/USD - 182.0USD/Others -14.0 (BRL,CAD,MXN)Main Asian currencies -53.5 (INR, THB, VND, CNY, IND)Others - 53.5
SG&A + 291.0
Vol/Mix + 49.6
Cost Reduction +113.0
Operating Profit Yen (billions)Unit (thousands)
ROS3.4%
ROS4.4%
+49.6R&D
Forex
5
-303.0+113.0
-54.0

Honda Business Status
FY16 Financial Highlights
Automobile Business Operations
Motorcycle Business Operations
Honda Corporate Update
Business Strategy
6

Honda FY2011 Rating ReviewAutomobile Business - CivicCore Strategies for Growth in Automobile Operations
Improve quality of business forsustainable & profitable growthImprove quality of business forsustainable & profitable growth
7
Develop Innovative ProductsUnique to Honda
Strengthen global and regional models
Flexible global production infrastructure
Strong attention to “product concept” and further evolution of design and driving experience
Electrification Technologies
Advance the Six-region Global Operation Structure

Strengthen Global and Regional models
16% 14%
8
Regional models
Global models
Global models
68%
Mini and compact models in Japan
Light Trucks in U.S.
Brio series in Asia
China specific models
4.6CY2015
mil
:core models developed for worldwide distribution
Global Compact Series Civic
Avancier (China) BR-V (Asia)
Ridgeline
CR-V Accord
: models developed and produced locally tomeet specific needs of that region or market

Honda’s Global Compact Series is Being Rolled Out to Global Markets
(City / Grace)
(Fit / Jazz)
(Vezel / HR-V / XR-V)
with best-in class Fun to Drive, Fuel Economy, Packaging and Safety
0
20
40
60
80
100
120
140
160
180
2013
Jan
Feb
Mar Ap
rM
ay Jun Jul
Aug
Sep
Oct
Nov De
c20
14 Ja
nFe
bM
ar Apr
May Jun Jul
Aug
Sep
Oct
Nov De
c20
15 Ja
nFe
bM
ar Apr
May Jun Jul
Aug
Sep
Oct
Nov De
c20
16 Ja
nFe
bM
ar
Vezel/HR-V/XR-VMore than 600K units
(FY3/2016)
Vezel/HR-V/XR-VMore than 600K units
(FY3/2016)
Global Compact Series1.3 mil units in 2015 (+41% vs LY)
385K units in Jan-Mar 2016 (+21% vs LY)
(thousands)
City / Grace
Fit / Jazz
Vezel / HR-V / XR-V
Global models: Global Compact Series
9

Global models: CIVIC
10
5D hatch prototypeGlobal launch scheduleOne platform for all Civic models
5D hatch to be produced exclusively in the U.K.
Launch of downsized turbo engine in global market
New Civic launch in Nov 15
Civic 5D Hatch Prototype
Car of the Year Award
Strong start in the US
10

4.6CY2015
mil
CR-V Accord15% 12%
Civic12%
Fit / City / Vezel28%
CR-V and Accord continue to be widely popular representing approx. 27% of CY2015 global Honda unit sales
Global Models: CR-V and Accord
11
New CR-V and Accord to be launched with new platform and downsized turbo engine

(June 2015)
Ridgeline
2016 ~2015
2016 Pilot
All Honda Light Trucks to undergo full-model change in short period
New Odyssey
(May 2015)
HR-V
Regional models
Global models
Regional Models in North America
12
2016 Civic (November 2015)
New CR-V New Accord
(1H 2016P)Ridgeline
2D Coupe (March 2016)
5D Hatchback (Autumn 2016)

Ohio ELPOhio ELPCanadaCanada
AlabamaAlabama
MDX dual-source production will
start in 2017
Civic CR-V RDX
OdysseyRidgeline
Leverage Japan production base to enhance Fit supply
Fit
MDX Pilot
IndianaIndianaStart CR-V production
in 2017Civic
CR-V
-
5
10
15
20
Jan14
Mar May Jul Sep Nov Jan15
Mar May Jul Sep Nov Jan16
Mar
FitHR-V
Increase HR-V production in Mexico
Celaya Monthly Production Profile (thousand units)Mexico El SaltoMexico El Salto Mexico CelayaMexico Celaya
Production of HR-V in El Salto plant to start in 2017(Annual capacity : 63k)
Ohio MAPOhio MAP
AccordTLX
ILX
Production in North America
HR-VFit
13

Regional Models in China
14
By utilizing common platforms and strengthening local procurement and R&D functions, successive launch of cost competitive models being realized
SDN(4D/5D) SUV MUV
D
Guangqi
Dong Feng
C
Guangqi
Dong Feng
B
Guangqi
Dong Feng
Accord(2013 FMC)
Jade (2013)
Crider (2013)
Odyssey
Spirior(Dec 2014)
Concept B(in 2016)*
Segment
*the joint venture company to sell concept B is TBA
(Aug 2014)
Fit (May 2014)
City (Aug 2015)
Concept D
Vezel 1.5L (Mar 2015)
XR-V 1.5L (Jul 2015)
Vezel 1.8L (Oct 2014)
XR-V 1.8L (Dec 2014)
CR-V MMC (Apr 2015)
Elysion(Jan 2016)
Greiz (Nov 2015)
All-new SUV
New Civic(April 2016)
Avancier(2016)

Regional Models in Asia
15
India
Thailand
Indonesia
20152014201320122011
Brio Series
Global Compact Series
Fit / JazzCity HR-V
Brio Amaze Mobilio
(thousand units)
0%
5%
10%
15%
20%
0
50
100
150
200
250
CY12 13 14 15
Volume
Honda Share
0%
5%
10%
15%
20%
0
20
40
60
80
100
120
CY12 13 14 15
Volume
Honda share
0%
5%
10%
15%
20%
0
50
100
150
200
CY12 13 14 15
Volume
Honda Share
0%
5%
10%
15%
0
50
100
150
200
250
300
CY12 13 14 15
Volume
Honda Share
*First car incentive
Malaysia
BR-V
Indonesia & Thailand (Jan 16)India (May 16)

Honda FY2011 Rating ReviewHonda FY2011 Rating ReviewAutomobile Business - CivicGlobal Production Capacity
1,066 1,066 1,066
1,923 1,923 1,923
200 200 200
960 1,080 1,140
840+501,080+50 1,080+50
150 151 151
Mar '15 Mar '16 Mar '17 (P)
5,189
(thousand units)
as of
Japan
NorthAmerica
Europe
Asia
China
Other
5,550+361
China +240Guangqi +120 Dongfeng +120
Thailand +120Nigeria +1
FY2016(Export only)(Export only)
16
5,610+60
India +60
FY2017(P)

China
Europe
Capacity increase to 5.7 milEstablish stable production structure leveraging regional capacity + mutual parts/model sharing
North America
South AmericaAsia
Japan (Units)
1.06 mil
<Export> Global Models
& Hybrid models 1.92 mil200,000
Primarily Civic 5D and CR-V production
150,000
1.13 mil
<Export> Acura & L/T models
Fit & CR-V
1.08 mil
<Export> • Strengthen mutual parts/model
sharing within Asia• Export to Africa
<Export> Leverage local cost benefit for
next markets (Africa)
Middle East and Africa
JazzHybrid models
CR-V
Accord & L/T models
Acura
10-20%for Other regions
80-90% for Local markets
Total Capacity
approx. 5.55 mil units(end of FY2016)
Accord
Utilization Image
Fit
Civic 5D from UK (plan)
Flexible global production infrastructure
17
1,000
CR-V , HR-V(plan)

Capacity Utilization by Region
101% 88% 81%94%FY14 FY15
96% 77% 70%96%
95% 95%50% 61%
100%FY16 1H
61%FY14 FY15 FY16 1H
FY14 FY15 FY16 1H FY14 FY15
113% 73%FY16 1H
65%FY16 1H
109%FY16 1HFY14 FY15FY14 FY15
(Excluding export factory)
18
100% 82%FY16 2H
109%FY16 2H
74%FY16 2H
63%FY16 2H
99%FY16 2H
North America Japan
China Asia
Europe South America
FY16 2H
※Civic 5D production will start in summer 2016
※Targeting 950K units annual production in Japan

Engines
19Targeting best Fuel Efficiency and Fun to Drive in all categories
Turbo engines
Transmissions Hybrid Powertrains
Earth Dreams Technology
19

2010 2020 2030
DI engineCVT / DCT
Turbo engine
Enable people to experience the joy and freedom of mobility and contribute to the creation of a sustainable society where people can enjoy more harmonious lifestyles
Honda’s Environmental and Safety Vision
2000
(CO
2(g/
km)
0 (2002) (2008)
New PHEV
(2016)
Global expansion
Global expansion
Technologies to increaseelectrical efficiency
Technologies to increasethermal efficiency
ZEROemissions technologyNew BEV
New FCV
(2020)
One-motorHybrid system
Two-motorHybrid system
Three-motorHybrid system
(2013)
Looking towards zero emissions withthe development of ZEV and PHEV
CLARITY FUEL CELLFCX CLARITYFCX
ACCORD PHEV
Roadmap for Environmental Technologies
20

Roadmap for Environmental Technologies
Clarity3兄弟戦略
The Clarity Fuel Cell, only five-passenger fuel cell sedan in the industry, launched in Japan in March 2016 and will be launched in the U.S. and Europe within 2016
The Clarity Electric and the Clarity Plug-in Hybrid will be launched in the U.S. in 2017
All of the Clarity models will leverage the platform that has made the Clarity Fuel Cell’s
low, wide and aerodynamic proportions and spacious five-passenger cabin possible
Honda Clarity series to Leverage Common Platform
21

Toward Zero Collisions
Aiming for practical application of autonomous driving on highways around 2020
Roadmap for Safety Technologies
22

North America Automobile Operations
Unit(thousands)
0
500
1,000
1,500
2,000
CY07 08 09 10 11 12 13 14 15
AcuraHonda Passenger CarsHonda Light Trucks
Source: Honda
Industry Demand Honda Unit SalesUnit
(thousands)
1,5511,428
1,150
New Model Launches/ FMC
1,259
1,147
1,4221,525
1,541
Source: Honda
Acura NSX (2016)
1,586
Honda Topics Improve cost competitiveness of core models
- Increase commonality of platforms and parts- Leverage global suppliers- Utilize Mexican local suppliers to drive down overall North
American costs Increase production capacity of Light Trucks
- Start dual production of MDX in Ohio and Alabama plants from 2017
Introduce Environmentally Friendly Vehicles- Accord Hybrid, FCX Clarity, PHEV, BEV and more
Accord Hybrid (Spring 2016)
Civic Coupe (Mar 2016)
Ridgeline (Spring 2016)
Civic 5D(2H 2016)
Clarity Fuel Cell (2016)
0
10,000
20,000
CY07 08 09 10 11 12 13 14 15
Passenger Cars
Light Trucks
10,42911,588
12,778
14,491 15.60016.522
17.470
23

24
0
2,000
4,000
6,000
FY09 FY10 FY11 FY12 FY13 FY14 FY15 FY16
Regular size vehicle Mini vehicle
Industry Demand Honda Unit Sales
0
250
500
750
1,000
1,250
FY09 FY10 FY11 FY12 FY13 FY14 FY15 FY16
Registered vehicle
Mini vehicle
Source: HondaSource: JAMA, Honda
New Model Launches/ FMC
Enhancement of product line-up- Strengthen minivan and hybrid line-up by introducing Odyssey Hybrid, Accord Hybrid and new Freed
Honda Topics
Improve capacity utilization- Fit (Jazz) export for North America and Europe started in 2015- Accord Hybrid exports began in 2016
Accord Hybrid (May 2016)
Clarity Fuel Cell(Mar 2016)
Odyssey Hybrid(Feb 2016)
New Freed
(2016)
Japan Automobile Operations

25
Europe Automobile Operations
New Model Launches/ FMC
New models with Earth Dream Technology powertrains
Restructuring of operations to improve efficiency
Industry Demand(EU+EFTA)
(excluding commercial vehicles)
Honda Unit Sales
(EU+EFTA)
0
5,000
10,000
15,000
CY08 09 10 11 12 13 14 15
Unit(thousands)
0
50
100
150
200
250
300
350
400
08 09 10 11 12 13 14 15
Unit(thousands)
Source: ACEA / Honda Source: ACEA / HondaCY
JAZZ (August 2015) HR-V (September2015)Civic Type R (July 2015)- U.K factory to concentrate on producing 5D Civic hatchback to improve plant efficiency
- New CR-V, new JAZZ, brand new HR-V and Civic Type R with VTEC turbo engine were launched in 2015
Honda Topics

China Automobile Operations
New Model Launches/ FMC
Introduce more new models to establish presence in all segments
- New Civic and all-new SUV, Avancier, to be launched in 2016
- All-new compact SUV, CDX, will debut in 2016 as Acura model
- Start of local hybrid engine production - 2016 Accord Hybrid
0
200
400
600
800
1,000
CY08 09 10 11 12 13 14 15
0
2,000
4,000
6,000
8,000
10,000
12,000
14,000
16,000
18,000
20,000
22,000
24,000
CY08 09 10 11 12 13 14 15
Source: HondaSource: CAAM / Honda
Honda Unit Sales in ChinaChina Industry Demand(excluding commercial vehicles)
Accord
Odyssey
CR-V
Civic
City
Fit
※2008-2014 Wholesale ※Wholesale
Spirior
S1Ciimo
Crider
JADEElysion
Crosstour
Strengthen cost structure- Increase local procurement to achieve further cost reductions
Vezel
XR-V
2015 Retail
Honda Topics
Elysion (Jan 2016)
26
Acura CDX (Jul 2016)
Avancier(2016)Civic (April 2016)
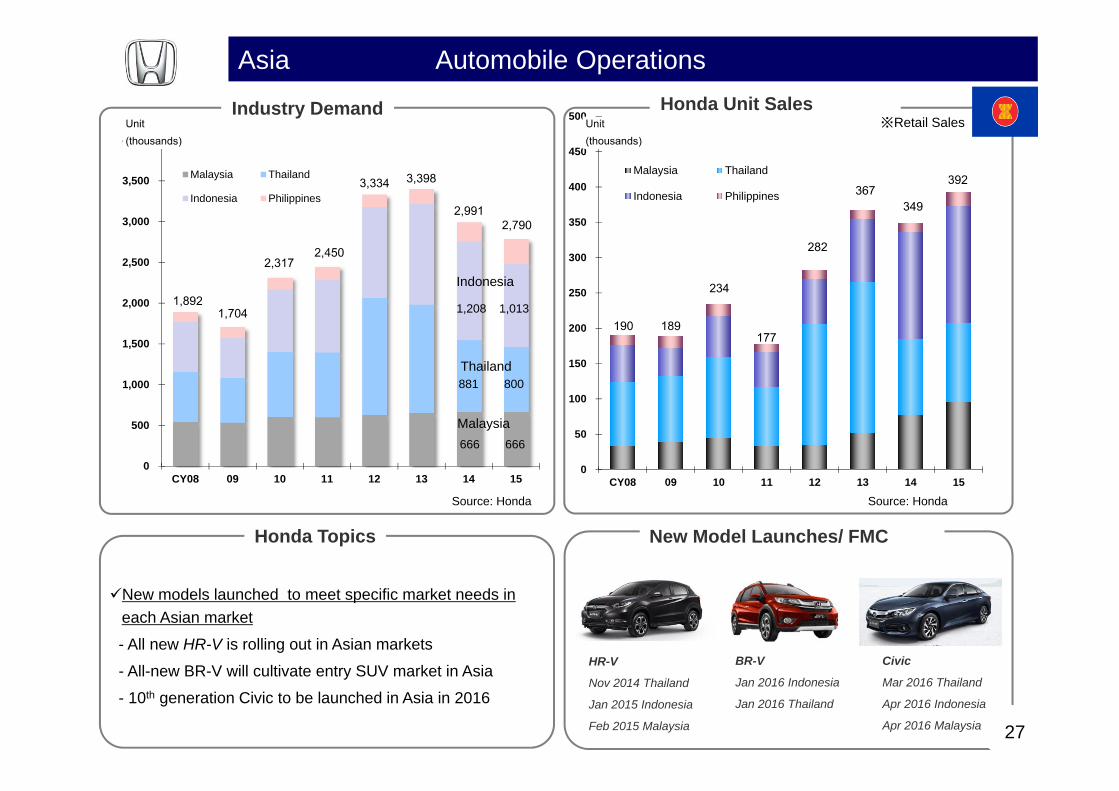
Asia Automobile Operations
0
50
100
150
200
250
300
350
400
450
500
CY08 09 10 11 12 13 14 15
Malaysia Thailand
Indonesia Philippines
0
500
1,000
1,500
2,000
2,500
3,000
3,500
4,000
CY08 09 10 11 12 13 14 15
Malaysia Thailand
Indonesia Philippines
Source: Honda
Honda Unit SalesIndustry Demand
Source: Honda
※Retail Sales
New Model Launches/ FMC
New models launched to meet specific market needs in each Asian market
- All new HR-V is rolling out in Asian markets
- All-new BR-V will cultivate entry SUV market in Asia
- 10th generation Civic to be launched in Asia in 2016
HR-V
Nov 2014 Thailand
Jan 2015 Indonesia
Feb 2015 Malaysia
881 800
666 666
1,208 1,013
Indonesia
Thailand
Malaysia
Honda Topics
27
BR-V
Jan 2016 Indonesia
Jan 2016 Thailand
Civic
Mar 2016 Thailand
Apr 2016 Indonesia
Apr 2016 Malaysia

India Automobile Operations
New Model Launches/ FMC
0
50
100
150
200
250
300
CY09 10 11 12 13 14 15
Honda Unit Sales in India
City
Accord
Civic
Source: Honda
※Retail Sales
JAZZ
Source: SIAM / Honda
India Industry Demand
BRIO
Amaze
Expand dealer network
Launch of new models equipped with diesel engines
- BR-V will be debuted in May 2016
Profitability of automobile operations in Indian market hasimproved due to introduction of new models
Mobilio
1,770
2,320 2,4402,753 2,553 2,571
2,771
450
650760
813
687 606651
0
1,000
2,000
3,000
4,000
5,000
CY09 10 11 12 13 14 15
Commercial
Passenger+Uvs
New Jazz PE/DE(July 2015)
Honda Topics
BR-V (May 2016)
28

29
Other Regions Automobile Operations
118 126 126
93
135 139 138153
0
20
40
60
80
100
120
140
160
180
200
CY08 09 10 11 12 13 14 15
2,671
3,008
3,329 3,426
3,634 3,580
3,333
2,481
0
1,000
2,000
3,000
4,000
CY08 09 10 11 12 13 14 15
Source: HondaSource: ANFAVEA
Honda Unit SalesIndustry Demand
(excluding trucks)※Retail Sales※Registration
Launch of Global Compact Series All-new HR-V launched in Mar 2015New Civic will be launched in 2016
New Model Launches/ FMC
Enhance local R&D facilities and expand local parts procurement
HR-V(Mar 2015)
Honda Topics
Civic(2016)

Honda Business Status
FY16 Financial Highlights
Automobile Business Operations
Motorcycle Business Operations
Honda Corporate Update
Business Strategy
30

31
0
4,000
8,000
12,000
16,000
2004 2005 2006 2007 2008 2009 2010 2011 2012 2013 2014 2015
69 114 101 151 100 59 139 143 110 177 192 182
6.3%9.3% 7.3%
9.7%7.1% 5.2%
10.8% 10.6%8.2%
10.5% 10.4% 10.1%
0
50
100
150
200
250
300
FY05 FY06 FY07 FY08 FY09 FY10 FY11 FY12 FY13 FY14 FY15 FY16
Honda M/C Business = High Profitability + Stability + Growth Potential
Honda Global Unit Sales
*excluding sales by Hero Honda
*Operating profit and margin from FY05 to FY13 are based on US GAAP while FY14 and FY15 are based on IFRS
Operating Profit and Margin(billion yen)
(thousand units)
Overview of Motorcycle Business

Indonesia
Malaysia
Thailand
VietnamIndia
PakistanChina
Japan
Bangladesh
Brazil
Argentine
PeruNigeria
Kenya
ItalyU.S.A
(ATV, S×S)Mexico
Philippines
27%
India16.1 mil
70%
Vietnam2.8 mil
69%
Indonesia6.5 mil
78%
Brazil1.3 mil
79%
Thailand1.7 mil
44%
50%
Pakistan1.5 mil
Cambodia0.3mil 90%
21%U.S.A (MS+ATV)
0.7 mil
47%0.4 mil
17%Europe0.8 mil
Motorcycle productionat 34 plants in 21 countries
Motorcycle productionat 34 plants in 21 countries
Motorcycle Market Size and Honda Share
Philippines0.8mil
(CY2015)
Annual Production Capacity in India
4.6mil in 2015 5.8mil in 2016
Annual Capacity in Pakistan
0.6mil in 2014 1.2mil in 3 years
32
*Market share excluding 50cc
Motorcycle Market Size and Honda Share (CY2015)
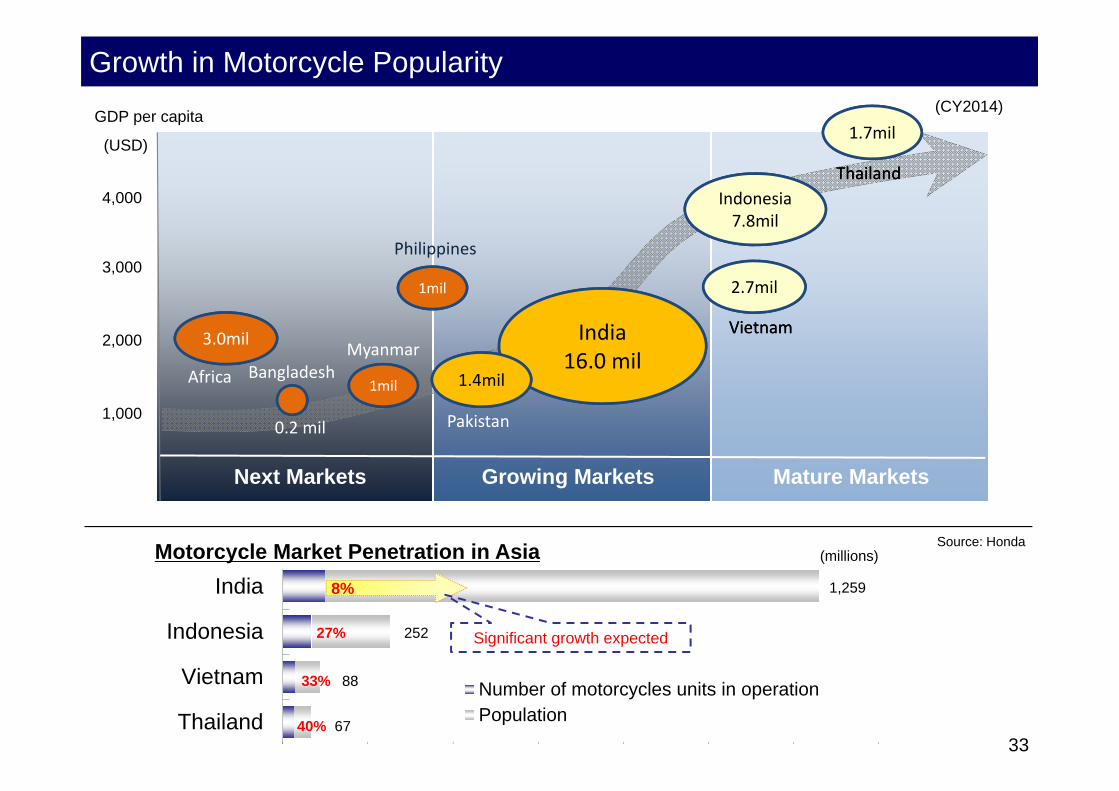
Next Markets Growing Markets Mature Markets
Africa
1,000
2,000
3,000
4,000
(USD)
3.0mil India16.0 mil
Indonesia7.8mil
ThailandThailand
VietnamVietnam
1.4mil
Pakistan
1mil
Philippines
Bangladesh1mil
Myanmar
GDP per capita1.7mil
2.7mil
Growth in Motorcycle Popularity
33
(CY2014)
Thailand
Vietnam
Indonesia
India
Number of motorcycles units in operationPopulation
1,259
252
88
6740%
33%
27%
8%
Significant growth expected
Motorcycle Market Penetration in Asia (millions)Source: Honda
0.2 mil

1.6 1.6 1.6 1.6
1.2 1.2 1.2 1.2
1.2 1.8 1.8 1.8
1.2
CY13 14 15 16
Expanded annual production capacity to 5.8 milThe 4th plant to produce only automatic scooters to meet growing demand.
1st
2nd
3rd
4.0mil4.6mil
5.8mil4.6mil
Capacity Expansion
34
India Motorcycle Operation
4th
Manesar
Rajasthan
Karnataka
Gujarat
3rd
2nd
4th
1st
Product Line-upProduct Line-up
110cc AT-Scooter
Activa
110cc Motorcycle
Dream Yuga
125cc Motorcycle
CB Shine

0%
10%
20%
30%
40%
50%
60%
70%
0
100,000
200,000
300,000
400,000
500,000
600,000Competitors (Unit)
Honda (Unit)
Honda Share(%)
AT Scooter business operation in India
35
■ Monthly Scooter Unit Sales of Honda / Competitors and Honda Share in Scooter Market
18%
82%
In CY201130%
70%
In CY2015SC SC
MCMC
■ Fast Growing Segment
Scooter / Motorcycle Sales Ratio (Industry)
Activa

ATV
S×S
M/C +2%
+8%
U.S. Market by Business Segment(sales volume in 2015 (vs. 2014))
2014 2015
Work
Sport
Multi
Side by Side (S x S) Segments(units sales in 2014 and 2015)
0
10
20
30
2012 2013 2014 2015
+ 89%+ 89%
Pioneer 700(Sep ‘13)
Pioneer 500(Jul ‘14)
Honda S x S Unit Sales
Pioneer 1000(Oct ‘15)
(Source: M/C and ATV: Motorcycle Industry Council / S×S:Honda estimate)
+ 90%+ 90%
(thousand units)
(thousand units)
Side by Side in the U.S.
36
+ 48%+ 48%
-1%

Honda Business Status
FY16 Financial Highlights
Automobile Business Operations
Motorcycle Business Operations
Honda Corporate Update
Business Strategy
37

4,000
5,000
6,000
7,000
Honda Group Unit Sales
12-Month Results
FY15 FY16 Change
Motorcycles 17,592 17,055 - 3.1%
Automobiles 4,367 4,743 + 8.6%
Power Products 5,983 5,965 - 0.3%
Consolidated Unit Sales
12-Month Results
FY15 FY16 Change
Motorcycles 10,725 10,572 - 1.4%
Automobiles 3,513 3,636 + 3.5%
Power Products 5,983 5,965 - 0.3%
5,000
10,000
15,000
20,000
2,000
3,000
4,000
5,000
4,000
5,000
6,000
7,000
5,000
10,000
15,000
20,000
2,000
3,000
4,000
5,000
17,592 17,055 4,3674,743
5,983 5,965
10,72510,5723,5133,636
5,9835,965
38
(thousand)
(thousand)
Honda Group Unit Sales
Consolidated Unit Sales
FY15 FY16
Motorcycles Automobiles Power Products
Motorcycles Automobiles Power Products
Unit (thousand)
Unit (thousand)
Honda Group Unit Sales- Decrease in motorcycle unit sales due mainly to decline in sales in Indonesia and South America,
despite sales growth in Pakistan and Vietnam- Increase in automobile unit sales due primarily to new model launches and full model changes in China
and North America, despite decreased sales in Japan
Outline of FY16 Unit Sales (Consolidated)
38
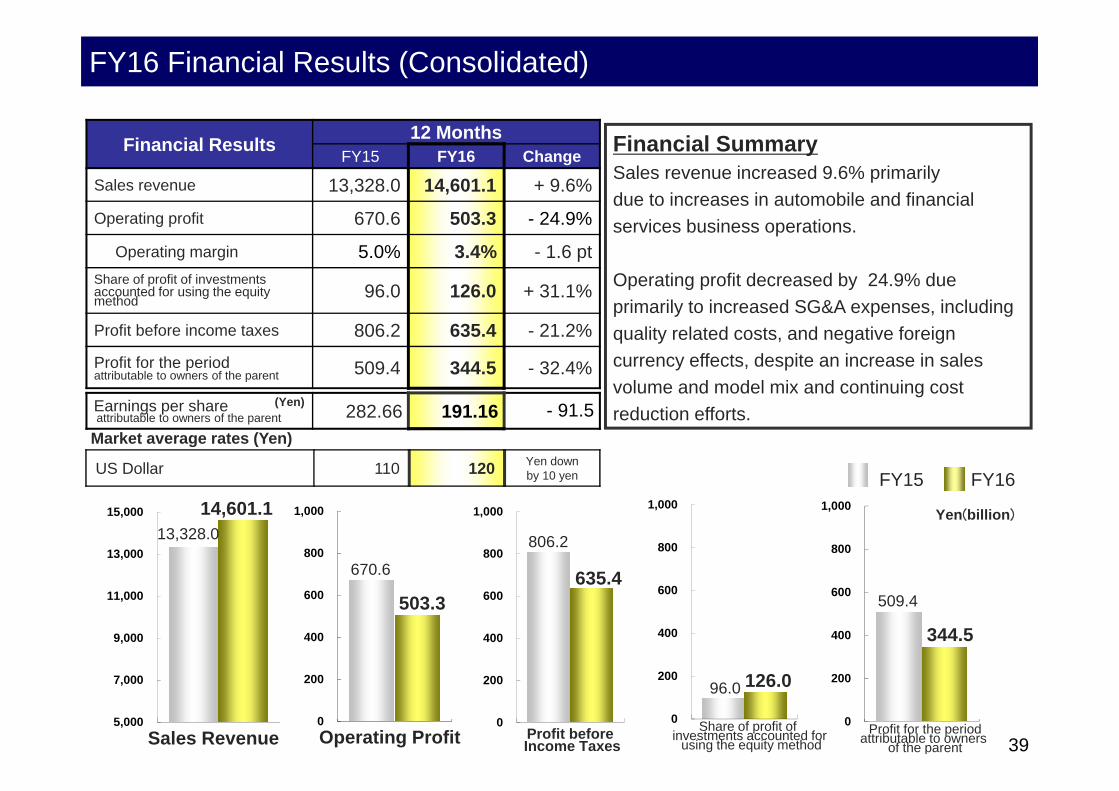
Financial Results 12 MonthsFY15 FY16 Change
Sales revenue 13,328.0 14,601.1 + 9.6%
Operating profit 670.6 503.3 - 24.9%
Operating margin 5.0% 3.4% - 1.6 ptShare of profit of investmentsaccounted for using the equity method 96.0 126.0 + 31.1%
Profit before income taxes 806.2 635.4 - 21.2%
Profit for the periodattributable to owners of the parent 509.4 344.5 - 32.4%
Earnings per shareattributable to owners of the parent 282.66 191.16 - 91.5
US Dollar 110 120 Yen down by 10 yen
*1
0
200
400
600
800
1,000
0
200
400
600
800
1,000
Profit before Income Taxes
Share of profit of investments accounted for
using the equity method
806.2
635.4
96.0 126.0
5,000
7,000
9,000
11,000
13,000
15,000 14,601.1
0
200
400
600
800
1,000
670.6
503.3
0
200
400
600
800
1,000
509.4
344.5
Sales Revenue Operating Profit
13,328.0
Market average rates (Yen)
(Yen)
FY15 FY16
Yen(billion)
Financial SummarySales revenue increased 9.6% primarily due to increases in automobile and financial services business operations.
Operating profit decreased by 24.9% due primarily to increased SG&A expenses, including quality related costs, and negative foreign currency effects, despite an increase in sales volume and model mix and continuing cost reduction efforts.
Profit for the periodattributable to owners
of the parent
FY16 Financial Results (Consolidated)
39

Honda Group Unit Sales
4Q Results (3 Months)
FY15 FY16 Change
Motorcycles 4,307 4,173 - 3.1%
Automobiles 1,069 1,229 + 15.0%
Power Products 2,022 1,955 - 3.3%
Consolidated Unit Sales
4Q Results (3 Months)
FY15 FY16 Change
Motorcycles 2,777 2,633 - 5.2%
Automobiles 881 980 + 11.2%
Power Products 2,022 1,955 - 3.3%
0
1,000
2,000
3,000
4,000
5,000
0
200
400
600
800
1,000
1,200
1,400
1,000
1,500
2,000
2,500
0
1,000
2,000
3,000
4,000
5,000
0
200
400
600
800
1,000
1,200
1,400
4,307 4,1731,069
1,229
2,0221,955
2,777 2,633881
980 2,0221,955
40
(thousand)
(thousand)
Honda Group Unit Sales
Consolidated Unit Sales
FY15 FY16
Unit (thousand)
Unit (thousand)
Motorcycles Automobiles Power Products
Motorcycles Automobiles Power Products1,000
1,500
2,000
2,500
Honda Group Unit Sales- Decrease in motorcycle unit sales due mainly to decreased sales in Brazil and China,
despite sales growth in Pakistan and Philippines- Automobile unit sales increased due to sales growth in North America and China, as well as the positive
impact of new model introductions in Indonesia.
Outline of FY16 4th Quarter Unit Sales (Consolidated)
40

6.4%5.4% 6.0%
2.5%
6.5%
4.6% 4.5%
-1.7%-2%
0%
2%
4%
6%
8%
10%
1Q 2Q 3Q 4Q
FY15FY16
205.5 168.9
210.0
86.0
239.2
164.8 163.0
-63.8 -100
0
100
200
300
1Q 2Q 3Q 4Q
Financial Results 4Q Results (3 Months)FY15 FY16 Change
Sales revenue 3,491.5 3,657.8 + 4.8%
Operating profit 86.0 - 63.8 -
Operating margin 2.5% - 1.7% - 4.2 ptShare of profit of investmentsaccounted for using the equity method 17.9 8.3 - 53.3%
Profit before income taxes 107.6 - 58.7 -Profit for the periodattributable to owners of the parent 81.9 - 93.4 -
Earnings per shareattributable to owners of the parent 45.45 - 51.85 - 97.30
US Dollar 119 115 Yen up by4 yen
*1
Yen (billion)
(Yen)
Market average rates (Yen)
Operating Profit Yen (billion)
Operating Margin
FY15 FY16
Financial SummarySales revenue increased 4.8% primarily due to an increase in automobile business operations despite negative foreign currency translation effects.
Operating loss declined by JPY 149.9 billion due primarily to increased SG&A expenses, including quality related costs, and negative foreign currency effects, despite an increase in sales volume and model mix and continuing cost reduction efforts.
FY16 4th Quarter Financial Results (Consolidated)
41

42
Profit before Income Taxes - 170.7 ( - 21.2 % )
806.2
635.4
+ 220.1+ 109.8 - 397.2
- 39.7 - 60.1 + 29.9 - 33.4
Operating Profit - 167.2 ( - 24.9 % )
OperatingProfit
670.6
OperatingProfit
503.3※Provisions made for warranty programs related to airbag inflators included in Product warranty expenses:FY15: approximately 120.0 billion yen, FY16: approximately 436.0 billion yen
FY15 FY16
Yen (billion)
- JPY / USD - USD / Others
(BRL, CAD, MXN)- Others
+ 122.8- 154.2
- 28.7
Finance income and
finance costs
Revenue,model mix,
etc.
Cost Reduction,etc.
Increase inSG&A Increase in
R&D CurrencyEffects
Share of profit of investments
accounted for using the equity
method
- Currency Effects - 38.1 - Interest rate swap/currency swap
+ 3.6- Others + 0.9<Increase Factors>
- Increased sales volume and model mix,- Decreased Incentives, etc.
<Increase Factors>- Cost reduction efforts, - Raw material price decrease, etc.
<Decrease Factors>- Increased product warranty expenses, etc.
Change in Profit before Income Taxes <FY16 Twelve Months>

43
Profit before Income Taxes - 166.3 ( - 154.5 % )
107.6
- 58.7
+ 96.4+ 37.7 - 210.4
- 31.0- 42.6
- 9.5 - 6.8
Operating Profit - 149.9 ( - 174.1 % )
OperatingProfit
86.0
OperatingProfit
- 63.8
Yen (billion)
FY15 4Q
FY16 4Q
Finance income and
finance costs
Revenue,model mix,
etc.
Cost Reduction,etc.
Increase inSG&A
Increase inR&D
CurrencyEffects Share of profit of
investmentsaccounted for
using the equity method
- JPY / USD - USD / Others
(BRL, CAD, MXN)- Others
- 4.4- 22.8
- 15.4
- Currency Effects - 17.3 - Interest rate swap/currency swap
+ 11.9- Others - 1.5
<Increase Factors>- Increased sales volume and model mix,- Decreased Incentives, etc.
<Increase Factors> - Cost reduction efforts, etc.
<Decrease Factors>- Increased Depreciation
and amortization, etc.
<Decrease Factors>- Increased product warranty
expenses, etc.
Change in Profit before Income Taxes <FY16 4th Qtr>

44
+ 1,430.5 - 709.0
- 306.8- 126.2
1,378.5 1,666.8
Net Change + 288.3
+ 1,068.3 - 706.6
- 232.5 + 77.31,171.9 1,378.5
Free cash flow+ 361.7 Net Change + 206.5
Free cash flow+ 721.4
FY15 Twelve Months
FY16 Twelve Months
Cash & Cash equivalentsat end of period
Cash & Cash equivalentsat beginning of FY15
Cash flows fromoperating activities
Cash flows from investing activities Cash flows from
financing activitiesEffect of exchange
rate changes
Profit before income taxes + 592.0Share of profit of investment accounted for using the equity method - 96.0Depreciation + 622.2Other - 49.8
Capital expenditures - 647.7Intangible assets - 231.2Other + 172.4
Dividends paid - 158.6Others - 73.9
Yen (billion)
Cash flows fromoperating activities
Cash flows from investing activities Cash flows from
financing activities Effect of exchange rate changes
Cash & Cash equivalentsat beginning of FY16
Cash & Cash equivalents at end of period
Profit before income taxes + 419.3Share of profit of investment accounted for using the equity method - 126.0Depreciation + 657.8Other + 479.3
Capital expenditures - 634.4Intangible assets - 232.3Other + 157.7
Dividends paid - 158.6Others - 148.2
* Depreciation, amortization and impairment losses excluding equipment on operating leases
Cash Flows of Non-financial Services Businesses

111 77 110 -18 131 68 70 -115
4.7%3.4% 4.2%
-0.7%
4.8%
2.6% 2.6%
-4.2%
1QFY15
2Q 3Q 4Q 1QFY16
2Q 3Q 4Q
Honda Consolidated Financial Results
FY15O/P
M/CFinance 29%
FY15Revenue
M/CPower Products
Finance14%
42 44 53 53 56 49 50 28
9.8% 10.2%11.2%
10.4%11.8%
10.8% 11.2%
6.3%
0
50
100
150
200
2Q 3Q 4Q 2Q 3Q 4Q
Quarterly Profit Business ScaleYen
(billions)Operating IncomeOperating Margin
69 114 101 151 100 59 139 143 110 177 192 182
6%
9%
7%
10%
7%
5%
11% 11%
8%
10% 10% 10%
0
50
100
150
200
250
300
FY05 FY06 FY07 FY08 FY09 FY10 FY11 FY12 FY13 FY14 FY15 FY16
Annual Profit
Auto
Auto
FY15Revenue
M/CPower Products
Finance
73%
Operating IncomeOperating Margin
Auto
Motorcycle business
Automobile business
Yen (billions)
452 628 600 662 25 127 265 -77 286 461 280 153
6%
8%7% 7%
0%2%
4%
-1%
4%
5%
3%
1%
-200
0
200
400
600
800
1000
FY05 FY06 FY07 FY08 FY09 FY10 FY11 FY12 FY13 FY14 FY15 FY16
(99)*
(8%)*
* (excluding one time profit)
(512)*
(6%)*
* (excluding one time profit)45
FY15O/P
Auto
Finance
42%
M/C
US GAAP IFRS
US GAAP IFRS
IFRS
IFRS

50 49 50 54 52 52 51 44
13.5% 13.4% 13.0% 11.9% 11.0% 11.1% 11.5%9.5%
FY151Q
2Q 3Q 4Q FY161Q
2Q 3Q 4Q
Honda Consolidated Financial Results
FY15Revenue
M/C
Power Products
Finance
2%
3 -1 -3 -3 1-4
-7 -20
4.1%
-1.4% -3.2% -3.4%0.6%
-4.4%-9.1%
-21.6%
FY151Q
2Q 3Q 4Q FY161Q
2Q 3Q 4Q
Quarterly Profit Business Scale
Yen (billions)
Operating IncomeOperating Margin
19 36 36 22 -15 -17 -6 -4 -103
-4-31
6%
9% 8%5%
-4% -5%
-2% -1% -3%
1%
-1%
-9%-50
0
50
FY05 FY06 FY07 FY08 FY09 FY10 FY11 FY12 FY13 FY14 FY15 FY16
Annual Profit
FY15Revenue
M/CPower Products
FinanceOperating IncomeOperating Margin
Auto
Power Product & Other Business
Financial Business
Yen (billions)
90 91 116 118 81 195 186 170 158 183 203 199
35% 29% 28%
21%
14%
31% 32% 32%28%
14% 13%11%
0
50
100
150
200
250
300
FY05 FY06 FY07 FY08 FY09 FY10 FY11 FY12 FY13 FY14 FY15 FY16
11%
46
FY15O/P
Finance
Auto
FY15O/P
Finance
M/C30%
Auto
M/C
US GAAP IFRS
US GAAP IFRS
* Under IFRS, when P.P.E held for lease to others is routinely sold in the course of the ordinary activities, the sale for these itemsis recognized on a gross basis (recognize Revenue and Cos), while it is presented on a net basis under US GAAP
*
IFRS
IFRS

63 63 76 9 28 26 28 -180
6.4% 6.5% 7.9% 0.8%3.0% 2.7% 2.7%
-18.1%
FY151Q
2Q 3Q 4Q FY161Q
2Q 3Q 4Q
67 43 80 -8 109 37 38 26
3.9%2.6%
4.1%
-0.4%
5.0%
1.8%1.8% 1.3%
FY151Q
2Q 3Q 4Q FY161Q
2Q 3Q 4Q
Honda Consolidated Financial Results
Quarterly Profit Business ScaleOperating IncomeOperating Margin
185 371 228 193 -162
-29
66 -110 178 246 210 -99
4%
8%
5%4%
-4%
-1%
2%
-3%
5%6% 5%
-3%-200
-100
0
100
200
300
400
500
FY05 FY06 FY07 FY08 FY09 FY10 FY11 FY12 FY13 FY14 FY15 FY16
Annual Profit
Operating IncomeOperating Margin
Japan
321 354 457 433 80 236 301 223 209 336 182 211
7%6%
7%7%
2%
6%
7%6%
4%5%
3%2%
0
50
100
150
200
250
300
350
400
450
500
FY05 FY06 FY07 FY08 FY09 FY10 FY11 FY12 FY13 FY14 FY15 FY16
FY15Revenue
North America
Other Regions
Europe
Asia
Japan16%
FY15O/P
North America
Other Regions
Europe
Asia
Japan31%
North America
Yen (billions)
(233)*
(5%)*
* (excluding one time profit)
Yen (billions)
47
FY15Revenue
JapanOther Regions
Europe
Asia
NorthAmerica
52%
FY15O/P
Other Regions
Europe
Asia
26%NorthAmerica
Japan
US GAAP IFRS
US GAAP IFRS
IFRS
IFRS

69 61 77 72 96 86 88 66
9.2%7.8%
8.8%7.8%
10.6%9.8% 9.7%
7.8%
FY151Q
2Q 3Q 4Q FY161Q
2Q 3Q 4Q
FY15O/P
FY15Revenue
FY15O/P
FY15Revenue
2-6 -3 -16 -1
3
-5
22
0.9%-3.2% -1.5% -8.9% -0.6%
1.7%
-2.8%
9.5%
FY151Q
2Q 3Q 4Q FY161Q
2Q 3Q 4Q
Honda Consolidated Financial Results
Business Scale
Yen (billions)
Operating IncomeOperating Margin
61 65 77 131 104 113 151 77 147 232 279 336
7% 7%6%
8%6%
7%8%
5%6%
8% 8%9%
0
50
100
150
200
250
300
350
400
FY05 FY06 FY07 FY08 FY09 FY10 FY11 FY12 FY13 FY14 FY15 FY16
Annual Profit
Operating IncomeOperating Margin
Asia (China JVs are not included)
Yen (billions)
41 26 32 52 10 -11 -10 -12 0 -34 -23
19
4%
2% 2%3%
1%-1% -1% -2%
0% -4%-3%
2%
-100
-50
0
50
100
150
200
FY05 FY06 FY07 FY08 FY09 FY10 FY11 FY12 FY13 FY14 FY15 FY16
North America
Other Regions
Europe
Asia
Japan
5%
North America
Other Regions
Europe
Asia
Europe
North America
Other Regions
Europe
Asia Japan
Other Regions
Europe
Asia41%
Japan
Quarterly Profit
Japan
20%
North America
48
US GAAPIFRS
US GAAP IFRS
IFRS
IFRS

9 14 10 8 5 7 0 -20
3.6%5.8% 4.2%
3.4%1.9%
3.4%-0.2%
-12.1%
FY15Q1
Q2 Q3 Q4 FY16Q1
Q2 Q3 Q4
FY15O/P
FY15Revenue
Honda Consolidated Financial Results
Business Scale
Yen (billions)
Operating IncomeOperating Margin
33 57 72 116 135 46 70 57 36 38 40
-8
7%
10%9%
11%12%
5%7% 6%
4% 4% 4%
-1%
-50
0
50
100
150
200
250
300
FY05 FY06 FY07 FY08 FY09 FY10 FY11 FY12 FY13 FY14 FY15 FY16
Annual Profit
Other region
Yen (billions)
78 73 73 86 98 91 111 88 78
18 27 3133
2 2
29
135
0
100
200
FY05 FY06 FY07 FY08 FY09 FY10 FY11 FY12 FY13 FY14 FY15 FY16
Equity Income
North America
Europe
Other Japan
Europe
Asia
6%Japan
Quarterly Profit 7%
North America
Asia
Other
96 100 103119
9993
140
10083
131
36 5 37 18 38 34 45 8
FY151Q
2Q 3Q 4Q FY161Q
2Q 3Q 4Q
*Discontinued JV with Hero at Dec 2010
*ChinaGuangqi HondaDongfeng Honda
IndonesiaP.T Astra Honda
PakistanAtlas Honda
JapanShowa, Keihin, etc
Affiliates
49
96
US GAAP IFRS
US GAAP IFRS
IFRS
IFRS
(from Asia)(30.6) (15.8) (30.4) (16.0) (32.5) (28.9) (39.4)
126
(24.3)

50
FY16Results
FY17Forecast
Change
amount %
Sales revenue 14,601.1 13,750.0 - 851.1 - 5.8%
Operating profit 503.3 600.0 + 96.6 + 19.2%
Operating margin 3.4% 4.4% + 1.0 ptShare of profit of investmentsaccounted for using the equity method
126.0 130.0 + 3.9 + 3.2%
Profit before income taxes 635.4 705.0 + 69.5 + 10.9%
Profit for the yearattributable to owners of the parent 344.5 390.0 + 45.4 + 13.2%
US Dollar 120 105 Yen up by 15 yen
*1Earnings per shareattributable to owners of the parent 191.16 216.39 + 25.23
(Yen)
For *1, please refer to the footnote on page 35
Market average rates (Yen)
Yen (billion)
FY17 Financial Forecasts (Consolidated)

"Honda Group Unit Sales"
Motorcycles Automobiles Power Products
“Consolidated Unit Sales"
Global Honda group unit sales including affiliates, such as China Auto and Motorcycle in Indonesia
Consolidated unit sales do not include sales units in affiliates
(thousands)
Motorcycles Automobiles Power Products(thousands)
( 3.6%)( +7.7%) (+ 1.6%)(vs last FY)
( +3.0%)( +9.2%) ( +1.6%)(vs last FY)
FY17 Guidance: Units Sales by Business Segment [IFRS]
51
FY16Results
FY17Forecast Change FY16
ResultsFY17
Forecast Change FY16Results
FY17Forecast Change
Japan 180 150 - 30 668 650 - 18 363 330 - 33North
America 308 310 + 2 1,929 1,990 + 61 2,811 2,950 + 139Europe 204 180 - 24 172 190 + 18 1,008 1,035 + 27
Asia 15,133 16,595 + 1,462 1,723 1,850 + 127 1,349 1,360 + 11Other
Region 1,230 1,125 - 105 251 235 - 16 434 385 - 49Total 17,055 18,360 + 1,305 4,743 4,915 + 172 5,965 6,060 + 95
FY16Results
FY17Forecast Change FY16
ResultsFY17
Forecast Change FY16Results
FY17Forecast Change
Japan 180 150 - 30 614 600 - 14 363 330 - 33North
America 308 310 + 2 1,929 1,990 + 61 2,811 2,950 + 139Europe 204 180 - 24 172 190 + 18 1,008 1,035 + 27
Asia 8,650 9,780 + 1,130 670 730 + 60 1,349 1,360 + 11Other
Region 1,230 1,125 - 105 251 235 - 16 434 385 - 49Total 10,572 11,545 + 973 3,636 3,745 + 109 5,965 6,060 + 95

52
Operating Profit + 96.6 ( + 19.2 % )
OperatingProfit
600.0
OperatingProfit
503.3
FY16Results
FY17Forecast
Finance income and
finance costsRevenue,model mix,
etc.
Cost Reduction,etc.
Decrease inSG&A
Increase inR&D
CurrencyEffects
Share of profit of investments
accounted for using the equity
method
635.4705.0+ 49.6
+ 113.0
+ 291.0 - 54.0- 303.0
+ 3.9 - 31.0
Profit before Income Taxes + 69.5 ( + 10.9 % )Yen (billion)
- JPY / USD - USD / Others
(BRL, CAD, MXN)- JPY / Asian Currencies
(INR, THB, VND, CNY, IND)- Others
- 182.0- 14.0
- 53.5
- 53.5
FY16 Forecast: Change in Profit before Income Taxes

0%
2%
4%
6%
8%
0
200
400
600
800
FY04 05 06 07 08 09 10 11 12 13 14 15 16
17P
0%
2%
4%
6%
8%
0
200
400
600
800
FY04 05 06 07 08 09 10 11 12 13 14 15 16
17P
0%
2%
4%
6%
8%
0
200
400
600
800
FY04 05 06 07 08 09 10 11 12 13 14 15 16
17P
Capital Expenditures Depreciation / Amortization R&D
Actual Amounts (billion Yen) % against Sales
US GAAP IFRS US GAAP IFRS US GAAP IFRS
560
440
690
FY17 Forecast: Capital Expenditures, Depreciation, R&D Expenditures
53
FY16Results
FY17Forecast
Change
Capitalexpenditures * 647.4 560.0 - 87.4
Depreciation andamortization * 440.4 440.0 - 0.4
Research and developmentexpenditures **
719.8 690.0 - 29.8
* Capital expenditures as well as Depreciation and amortization in results and forecast aforementioned exclude investment in operating leases, capital leases and intangible assets
** Research and development expenditures are research and development activity related costs incurred during the reporting period. In accordance with IFRS, a portion of research and development expenditures is recognized as an intangible asset and amortized over its estimated useful life. As such, this amount is not in conformity with "Research and development" on our Consolidated Statement of Income

Yen
Dividend
54
Dividend per Share FY15 FY16( Projection) FY17
(Expectation)Increase/
Decrease fromFY15
Increase/Decrease from
FY16
1st Quarter End 22 22 - ( 22 ) ( - )
2nd Quarter End 22 22 - ( 22 ) ( - )
3rd Quarter End 22 22 - ( 22 ) ( - )
4th Quarter End 22 ( 22 ) ( - ) ( 22 ) ( - )
Fiscal Year 88 ( 88 ) ( - ) ( 88 ) ( - )

Caution with Respect to Forward-Looking Statements:This slide contains forward-looking statements about the performance of Honda, which are based on management’s assumptions and beliefs taking into account information currently available to it. Therefore, please be advised that Honda’s actual results could differ materially from those described in these forward-looking statements as a result of numerous factors, including general economic conditions in Honda’s principal markets and fluctuation of foreign exchange rates, as well as other factors detailed from time to time.Accounting standards: Our consolidated financial standards are prepared in conformity with International Financial Reporting Standards (IFRS), as issued by the International Accounting Standards Board (IASB)Notice on the Factors for Increases and Decreases in Income:With respect to the discussion above of the change in Operating profit, management has identified the factors set forth below and used what it believes to be a reasonable method to analyze the respective changes in such factors. Each of these factors is explained below. Management has analyzed changes in these factors at the levels of the Company and its material consolidated subsidiaries.(1)“Currency effects” consist of translation adjustments, which come from the translation of the currency of foreignsubsidiaries’ financial statements into Japanese Yen, and foreign currency adjustments, which result from foreign-currency-denominated sales, which, at the levels of the Company and those consolidated subsidiaries which have beenanalyzed, primarily relate to the following currencies: U.S. dollar, Canada dollar, Euro, GBP, BRL and Japanese Yen.(2) With respect to “Cost reduction, etc”, management has analyzed cost reduction and effects of raw material costfluctuations at the levels of the Company and its material foreign manufacturing subsidiaries in North America, Europeand other regions.(3) With respect to “Revenue, model mix, etc”, management has analyzed changes in sales volume and in the mix ofproduct models sold in major markets which have resulted in increases/decreases in profit, as well as certain otherreasons for increases/decreases in sales revenue and cost of sales.(4) With respect to “Selling, General and Administrative expenses”, management has analyzed reasons for anincrease/decrease in selling, general and administrative expenses from the previous fiscal year net of currencytranslation effects.(5) With respect to “Research and Development expenses”, management has analyzed reasons for an increase/decreasein research and development expenses from the previous fiscal year net of currency translation effects.
55

56