classification and reactivity of secondary …tstark.net/wp-content/uploads/2012/10/jp101.pdf ·...
TRANSCRIPT
CLASSIFICATION AND REACTIVITY OF SECONDARY
ALUMINUM PRODUCTION WASTE
Navid H. Jafari
Student Member, ASCE
Doctoral Candidate of Civil and Environmental Engineering
University of Illinois
205 N. Mathews Ave.
Urbana, IL 61801
email: [email protected]
Timothy D. Stark, Ph.D., P.E., D.GE, F.ASCE
Professor of Civil and Environmental Engineering
University of Illinois at Urbana-Champaign
205 N. Mathews Ave.
Urbana, IL 61801
(217) 333-7394
(217) 333-9464 Fax
email: [email protected]
and
Ralph Roper, Ph.D., P.E.
Senior Research Engineer
Heritage Research Group
7901 W Morris St.
Indianapolis, IN 46231
(317) 390-3157
email: [email protected]
A paper submitted for review and possible publication in the ASCE Journal of
Hazardous, Toxic, and Radioactive Waste
November 8, 2012

2
Classification and Reactivity of Secondary Aluminum Production Waste 1
Navid H. Jafari1, Timothy D. Stark
2 and Ralph Roper
3 2
3
ABSTRACT: Secondary aluminum production wastes (APW) are produced during the melting 4
of aluminum scrap and dross. They are frequently disposed in dry form at Subtitle D non-5
hazardous waste landfills, where they can react adversely with liquids. Depending on the APW 6
composition and landfill environment, the heat of reaction can cause sustained temperature 7
increases that inhibit normal anaerobic biodegradation. Further, the reaction products can 8
produce flammable and toxic gases such as hydrogen, ammonia, methane, and hydrogen sulfide 9
and cause foul odors in the neighboring area. The potential for exothermic reactions between 10
APW and landfill leachate necessitates the development of a simple test that quantifies reactivity 11
and potential temperature increase and determines which APW are overly reactive and which are 12
relatively inert. A constant pressure calorimeter test is outlined herein that can simulate the APW 13
reaction in a landfill environment. 14
Keywords: Landfills, aluminum, hydrogen, salt cake, dross, calorimeter, waste disposal 15
16
17
18
1 Doctoral Candidate, Dept. of Civil and Environmental Engineering, Univ. of Illinois, 205 N. Mathews Ave.,
Urbana, IL 61801-2352. E-mail: [email protected] 2 Professor, Dept. of Civil and Environmental Engineering, Univ. of Illinois, 205 N. Mathews Ave., Urbana, IL
61801-2352. E-mail: [email protected] 3 Senior Research Engineer, Heritage Research Group, 7901 W. Morris St., Indianapolis, IN 46231. E-mail:

3
INTRODUCTION 19
Aluminum is a widely used nonferrous metal in the world (IAI 2009), being present in markets 20
such as transportation, packaging, food, construction, electricity, and medicine. Total global 21
primary and secondary aluminum production increased from 28 million tonnes in 1990 to about 22
56 million tonnes in 2009. Recycled scrap aluminum constitutes about 32% of total production 23
of about 56 million tonnes (IAI 2009). In 2003, the metal producing sector manufactured 24
approximately 2,704,000 tonnes of primary aluminum and 2,820,000 tonnes of secondary 25
aluminum (BCS, Inc. 2007). Recycling aluminum scrap is important because the energy 26
required for aluminum recycling is only about 5% of that required for primary aluminum 27
production yet it yields the same quality aluminum as primary smelting (Kammer 1999; Das et 28
al. 2006). As a result, aluminum recycling in the United States has saved more than 1.7x10¹¹
29
kilowatt hours (0.57 quad) of energy in 2003 (BCS, Inc. 2007). In addition, secondary aluminum 30
production process emits seventeen (17) times less pollution to the atmosphere (see Table 1), 31
generates between five to nine (5 to 9) times less solid waste, and consumes thirty-five (35) 32
times less water than primary aluminum processing (Drossel et al. 2003). In short, recycling 33
aluminum is truly beneficial and more sustainable than primary aluminum production. 34
Given the advantages discussed above, market demand for recycled aluminum remains 35
strong especially due to its inherent low-energy cost compared to primary aluminum smelting. 36
However, the wastes produced from secondary aluminum production can be problematic when 37
they contain metallic aluminum fines because finely divided metallic aluminum can oxidize to 38
produce heat and hydrogen gas. As a result, disposal of such wastes in Subtitle D non-39
hazardous waste landfills has caused serious problems requiring expensive remediation efforts 40

4
(Calder and Stark 2010; Stark et al. 2012). Such problems may have been avoided had a simple 41
test been available for assessing reactivity of specific APW prior to disposal. 42
43
Table 1: Comparison of Primary and Secondary Aluminum Smelting Processes (data 44
from Gil 2005) 45
46
Primary Smelting Secondary Smelting
Consumption of energy
(GJ/tonne Al produced) 174 10
Atmospheric emissions
(kg/tonne Al produced) 204 12
Solid waste
(kg/tonne Al produced) 2,100-3,650 400
Consumption of water
(kg/tonne Al produced) 57 1.6
47
The U.S. Department of Energy (1999) estimates that at least one billion kilograms (~2 48
billion pounds) of APWs are annually placed in Subtitle D non-hazardous waste landfills, i.e., 49
municipal solid waste (MSW) landfills. The APW contains variable amounts of metallic 50
aluminum and aluminum compounds such as aluminum carbide (Al4C3), aluminum nitride 51
(AlN), and aluminum oxides (Al2O3) mixed with other substances such as sodium and potassium 52
chloride. Such wastes are referred to as “dross”, “white dross”, “black dross”, and “salt cake.” 53
These terms refer to the amount of aluminum present and the morphology of the wastes raked 54
from the surface of molten aluminum during primary and secondary processing and purification 55
(Manfredi et al. 1997). Tertiary processes have been developed for separating the components of 56
black dross into saleable salt fluxes, metal, and value-added nonmetallic derivatives such as 57
calcium aluminate additives for low-density cement. The economics of tertiary processing are 58
adversely influenced by the current low cost alternative of landfill disposal (BCS, Inc. 2007). 59

5
The potential hazards of aluminum production waste disposal are recognized worldwide 60
(Amer 2002; Australian DEWR 2007; Lucheva et al. 2005; Miškufová et al. 2006; Shinzato and 61
Hypolito 2005). Accordingly, this paper discusses secondary aluminum production waste 62
products in terms of their respective compositions, reactivity, and potential temperature 63
escalation in a Subtitle D landfill. This paper also discusses current APW waste classification 64
and summarizes two case histories in which APW was considered to be a hazardous waste so 65
disposal in a Subtitle D landfill was not allowed. Finally, a test procedure using a constant 66
pressure calorimeter is presented to help APW generators and Subtitle D landfill operators 67
decide whether a certain shipment of APW will cause an adverse reaction and increase in landfill 68
temperature. 69
70
BACKGROUND 71
One of the most important parameters used to assess whether or not a Subtitle D Landfill is 72
operating normally is temperature (Hanson et. al. 2010; Crutcher and Rovers 1982) because it 73
reflects the type of anaerobic bacteria present. There are two types of bacteria that dominate in 74
landfills, i.e., mesophilic and thermophilic. Each type of bacteria has a unique operating 75
temperature. Mesophilic bacteria reproduce in a temperature range of 35o to 45ºC (68
o to 113ºF) 76
with an optimal temperature of 35ºC (95ºF), while thermophilic bacteria reproduce in a 77
temperature range of 45o to 75ºC (113
o to 167ºF) with an optimal temperature of 55
o to 65ºC 78
(131o to 149ºF) (Stark et al. 2012). Yesiller et al. (2005) indicate that most Subtitle D landfills 79
operate in the mesophilic range, although optimal landfill gas production can be achieved in the 80
thermophilic range. The mesophilic and thermophilic anaerobic processes that regulate methane 81
generation occur best within a temperature range of 30o to 60
oC (86
o to 140
oF), and methane 82
6
generation is optimized at a temperature of 41oC (106
oF) (U.S. EPA 2005). Methane production 83
starts to significantly decrease if the temperature of the waste mass exceeds 70oC (158
oF), and 84
typically bacterial activity and methane production stop if the temperature of the waste mass 85
exceeds 80oC (176
oF). Under normal conditions, the temperature of solid waste and landfill gas 86
generated by an MSW landfill range between 25o and 45
oC (77
o to 113
o F) (ASTDR 2001). New 87
Source Performance Standards (NSPS) (40CFR60.753) require that a facility demonstrate that 88
combustion is not occurring within the waste mass if a wellhead temperature exceeds 55°C 89
(131°F). Based on these requirements, it is desirable to maintain landfill temperatures below 90
60°C (140o F) for healthy anaerobic bacteria growth, optimal methane gas production, minimize 91
APW exothermic reactions, and safe landfill operations. 92
93
ENIVORNMENTAL REGULATIONS 94
Residential, institutional, and commercial refuse from a municipality or region comprise the bulk 95
of the waste streams disposed in a Subtitle D landfill. However, Subtitle D landfills also can 96
accept non-hazardous industrial wastes, which are generally referred to as “special wastes.” The 97
primary purpose of referring to waste streams as “special waste” is to provide the operator of 98
Subtitle D landfills with a mechanism to ensure that prohibited wastes, especially RCRA Subtitle 99
C hazardous wastes and TSCA (Toxic Substances Control Act) wastesare not placed in a Subtitle 100
D landfill. A secondary purpose of classifying certain types of waste as “special waste” is to 101
ensure that receipt of such wastes will not adversely affect the near-term or long-term operation 102
of the landfill. 103
A solid waste is deemed hazardous in two ways either of which would make it ineligible 104
for disposal in a Subtitle D facility. First, 40 CFR Sec. 261, Subpart D explicitly lists the 105
7
materials that are defined as hazardous and these materials cannot be placed in a Subtitle D 106
regulated landfill. Aluminum (metal) and aluminum production waste, including aluminum 107
dross, salt cake, and baghouse dust, are not explicitly listed. Second, if a waste exhibits any one 108
of the four characteristics of a hazardous waste, i.e., ignitability, corrosivity, reactivity, or 109
toxicity, the waste is classified as a hazardous waste under 40 CFR Sec. 261, Subpart C and 110
cannot be placed in a Subtitle D facility. Because of aluminum related problems observed in 111
Subtitle D landfills in the past, e.g., Brantley landfill, Countywide, Wabash Alloys, Huelger 112
Kronquist, Arkansas Red River, etc. (see Table 2), toxicity, reactivity, and corrosivity under 40 113
CFR Sec. 261, Subpart C are potentially relevant to APW. Although corrosivity and toxicity can 114
be an issue because APW leachate consists of high concentration of salts (sodium, potassium, 115
chloride) and concentration of heavy metals (arsenic, cadmium, lead, mercury) (Xiao et al. 2005; 116
Swackhamer 2006), reactivity is most applicable because of APW induced exothermic reactions. 117
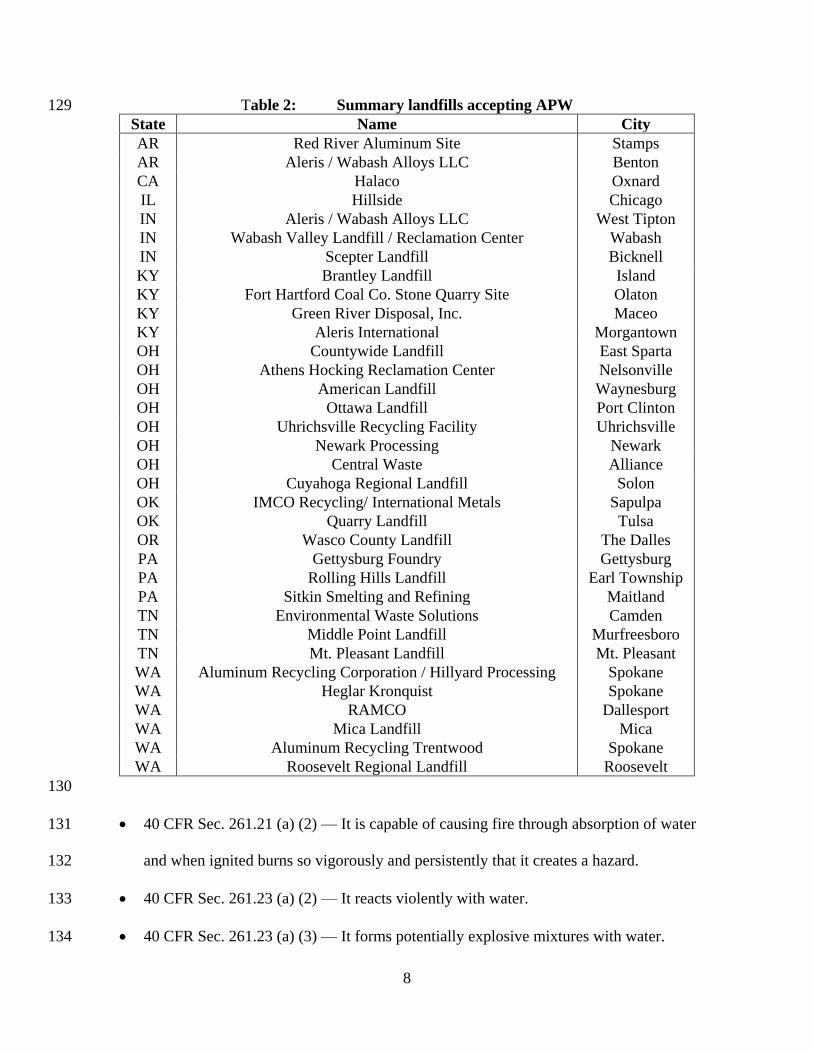
Table 2 provides a summary of known APW landfills in the United States. Though not a 118
complete list, it is evident that many of the landfills are located in the Northwest, e.g., eastern 119
Washington, and in the Ohio River Valley. 120
Unlike ignitability, there is no U.S. EPA certified test method to determine whether or 121
not a material meets the regulatory definition of “reactivity” or potential heat generation under 122
CFR Sec. 261.21. U.S. EPA withdrew its reactivity method in 1998. The U.S. EPA ignitability 123
test is “Ignitability of Solids” (SW-846 Method 1030) to determine whether or not a material 124
meets the regulatory definition of ignitability in CFR Sec. 261.21. 125
126
127
128
8
Table 2: Summary landfills accepting APW 129
State Name City
AR Red River Aluminum Site Stamps
AR Aleris / Wabash Alloys LLC Benton
CA Halaco Oxnard
IL Hillside Chicago
IN Aleris / Wabash Alloys LLC West Tipton
IN Wabash Valley Landfill / Reclamation Center Wabash
IN Scepter Landfill Bicknell
KY Brantley Landfill Island
KY Fort Hartford Coal Co. Stone Quarry Site Olaton
KY Green River Disposal, Inc. Maceo
KY Aleris International Morgantown
OH Countywide Landfill East Sparta
OH Athens Hocking Reclamation Center Nelsonville
OH American Landfill Waynesburg
OH Ottawa Landfill Port Clinton
OH Uhrichsville Recycling Facility Uhrichsville
OH Newark Processing Newark
OH Central Waste Alliance
OH Cuyahoga Regional Landfill Solon
OK IMCO Recycling/ International Metals Sapulpa
OK Quarry Landfill Tulsa
OR Wasco County Landfill The Dalles
PA Gettysburg Foundry Gettysburg
PA Rolling Hills Landfill Earl Township
PA Sitkin Smelting and Refining Maitland
TN Environmental Waste Solutions Camden
TN Middle Point Landfill Murfreesboro
TN Mt. Pleasant Landfill Mt. Pleasant
WA Aluminum Recycling Corporation / Hillyard Processing Spokane
WA Heglar Kronquist Spokane
WA RAMCO Dallesport
WA Mica Landfill Mica
WA Aluminum Recycling Trentwood Spokane
WA Roosevelt Regional Landfill Roosevelt
130
40 CFR Sec. 261.21 (a) (2) — It is capable of causing fire through absorption of water 131
and when ignited burns so vigorously and persistently that it creates a hazard. 132
40 CFR Sec. 261.23 (a) (2) — It reacts violently with water. 133
40 CFR Sec. 261.23 (a) (3) — It forms potentially explosive mixtures with water. 134
9
40 CFR Sec. 261.23 (a) (4) — When mixed with water, it generates toxic gases, vapors, 135
or fumes in a quantity sufficient to present a danger to human health or the environment. 136
137
For comparison purposes, European Union regulations do not allow APW disposal in MSW 138
landfills. European legislation explicitly classifies salt slags and black dross from secondary 139
smelting, waste from treatment of salt slags and black dross, and primary smelting slags and 140
white dross as hazardous waste (European Commission 2000). Waste properties which render 141
APW a hazardous material in Europe (European Commission 2000) consist of the following: 142
“Highly flammable – substances and preparations which, in contact with water or damp 143
air, evolve highly flammable gases in dangerous quantities.” 144
“Irritant – non-corrosive substances or preparations which through immediate prolonged 145
or repeated contact with the skin or mucus membrane can cause inflammation.” 146
“Harmful – substances and preparations which, if they are inhaled or ingested or if they 147
penetrate the skin, involve limited health risk.” 148
“Substances and preparations capable by any means, after disposal, of yielding another 149
substance, e.g. leachate which possess any of the characteristics listed above.” 150
151
CASE STUDIES OF APW CLASSIFICATION 152
This section provides a summary of APW reactivity and classification at three landfill facilities. 153
APW classification was not performed at the first case study, and the resulting exothermic 154
reactions led to a subsurface smoldering event. The final two cases classified the APW and the 155
results are presented herein. 156
157
10
Countywide Reclamation Disposal Facility (CWRDF) – Ohio 158
Permitted in 1991, CWRDF consists of 35.7 hectares (88 acres) or 9.9 million m3 (13 million 159
yd3) of disposal capacity. CWRDF accepted roughly between 0.6 million tonne (600,000 tons) 160
and 1 million tonne (560,000 tons) of APW from 1991 through 2006. The facility began leachate 161
recirculation in April 1996. However, in 2006 leachate recirculation ceased when the ongoing 162
exothermic reaction between APW and recirculated leachate became obvious. Measurement of 163
leachate collection system temperatures near the geomembrane in the single composite liner 164
system exceeded 85°C (185°F). Waste temperatures exceeding 143°C (290°F), downhole 165
temperatures reaching 149°C (300°F), and well-head temperatures up to 110°C (230°F) were 166
recorded at this site. In addition, the heat generated by APW reaction caused smoldering 167
combustion of the surrounding MSW. As of October 2012, the elevated temperatures in the 168
waste, landfill gas, and leachate collection system had been detected over a period of about 9 169
years. The APW reaction and subsurface smoldering has required expensive remedial measures, 170
e.g., installation of over 100 additional gas wells, increased leachate collection removal and 171
treatment from 15 million to 132 million liters/year, excavation of an isolation break, and 172
construction a flexible membrane liner cover to decrease emanating hazardous and noxious 173
odors. The use of the simple reactivity test may have identified the highly reactive nature of this 174
APW before landfill disposal which may have obviated these remedial measures. 175
176
Brantley Landfill - Kentucky 177
Brantley Landfill encompasses approximately 1.6 hectare of a 14.2 hectare parcel located in 178
Island, Kentucky (US EPA 1994). Approximately 227,000 tonnes (250,000 tons) of salt cake 179
fines were placed in Brantley Landfill from 1978 until its closure in 1980 (Swackhamer 2006). 180

11
The waste was deposited below the groundwater surface, thus threatening public and private 181
wells ground water within about 5 km of the site. 182
In 1979 the Kentucky Division of Air Pollution Control conducted a compliance 183
inspection based on complaints from 200 area residents living within a 400 m radius that 184
ammonia odors were emanating from the landfill during disposal activities. During Kentucky 185
Department of Environmental Pollution (KDEP) inspections, officials noticed vigorous reactions 186
with water and received complaints of irritating gas emitting from the landfill. Soil beneath the 187
landfill cap was contaminated with heavy metals including chromium, copper, aluminum, 188
magnesium, and sodium. This discovery prompted the U.S. EPA in 1980 to classify salt cake 189
fines as a hazardous waste under the reactivity criterion. In 1981 Barmet Aluminum Corporation 190
filed a federal civil action against the U.S. EPA and KDEP protesting regulation of salt cake 191
fines as a hazardous waste. The hazardous waste classification was subsequently removed. The 192
Brantley Landfill is still listed on the National Priorities List due to elevated ammonia and metals 193
concentrations in the subsurface. 194
195
Wabash Alloys Landfill - Indiana 196
Wabash Alloys generated 3,600 tonnes (4,000 tons) per month of APW (dross mill silo fines) 197
from its dross reclamation process and disposed of these wastes at an onsite monofill (RMT, Inc. 198
2007). From July 2006 to January 2007, three thermite (oxidation of aluminum at high 199
temperatures) fires occurred in the landfill. Subsequently the Indiana Department of 200
Environmental Management (IDEM) requested assessment of the APW as a hazardous waste 201
according to 40 CFR Sec. 261, Subpart C. The testing and analysis performed indicated that the 202
three thermite fires were caused by abnormal conditions and the thermite fires ceased after 203
12
modifications were made to reduce the metallic aluminum content of the APW being disposed. 204
Specifically, the top screen mesh size was increased from 25.4 mm to 50.8 mm during post-205
processing after smelting. The bottom screen sieve was decreased from No. 16 (1.19 mm) mesh 206
size to No. 25 (0.707 mm). The screen size modifications allowed larger APW granules to pass 207
(thereby increasing the post-processed volume of dross to capture more metallic aluminum 208
before disposal); and by retaining more of the crushed metallic aluminum particles on the final 209
mesh, mainly salts and non-metal oxides passed the final sieve and were identified for landfill 210
disposal. 211
Wabash Alloys concluded that APW was not a reactive or ignitable hazardous waste under 212
40 CFR Secs. 261.2 and 261.4(a) because: 213
The reaction between APW and water occurred over several minutes to hours sothe 214
reaction did not exhibit violent reaction, which is characterized by a rapid evolution of 215
energy. 216
Laboratory testing showed that upon contact with water, gas release was slow, at less 217
than 1 liter/kg-hour in six out of seven hourly increments as measured in the DOT 218
Dangerous When Wet Test (CFR Part 173.124). This test is described in Title 49 219
Transportation (CFR Part 173.124) – Shippers - General Requirements for Shipments and 220
Packing and is used to determine whether the reaction of a material with distilled water at 221
20°C and atmospheric pressure. Dispersion modeling of the APW reaction with water 222
indicated insufficient hydrogen gas was released to generate a vapor cloud explosion in 223
an outdoor environment. A dangerous when wet material is defined as a material in 224
contact with water that becomes spontaneously flammable or gives off flammable or 225
toxic gas at a rate greater than 1 liter per kilogram of the material per hour. 226

13
The reaction between the APW and water (under controlled conditions) did not generate 227
toxic gases, e.g., ammonia, acetylene, methane, or sulfur compounds, in a quantity 228
sufficient to present a danger to human health in an outdoor environment (see Table 3). 229
Ammonia concentrations were measured using Draeger tubes positioned less than 150 230
mm above the processed materials. Measured concentrations ranged from 2 to 23 ppm, 231
where the OSHA Personal Exposure Limit (PEL) is 50 ppm. 232
233
Based on the data in Table 3, IDEM concluded that APW did not meet reactivity characteristics 234
as described by 40 CFR Part 261.23. 235
236
Table 3. Composition of gas generated from Wabash dross mill waste in laboratory 237
tests using U.S. DOT Dangerous When Wet Test (data from RMT, Inc. 2007) 238
239
Gas Percent of Gas Generated
Hydrogen ≤95%
Methane 1 to 5%
Acetylene <0.2%
Allene Below detection limit
Ammonia Below detection limit
Hydrogen Sulfide <0.2%
Methane Thiol <0.2%
Phospine <0.2%
Arsine <0.2%
240
241
To measure heat generation in this case, Wabash Alloys immersed the APW in tap water 242
in an insulated chamber. The testing procedure consisted of thoroughly mixing 1 kg of APW and 243
150 mL of tap water in a plastic beaker. After quickly filling a quart size container with moist 244
APW and placing a thermometer inside the waste, the container was sealed and placed inside an 245
insulated chamber. Fig. 1 summarizes the results that include maximum temperatures of 130°C 246
(266°F). The red dashed line at 60°C denotes the landfill temperature where bacteria growth is 247
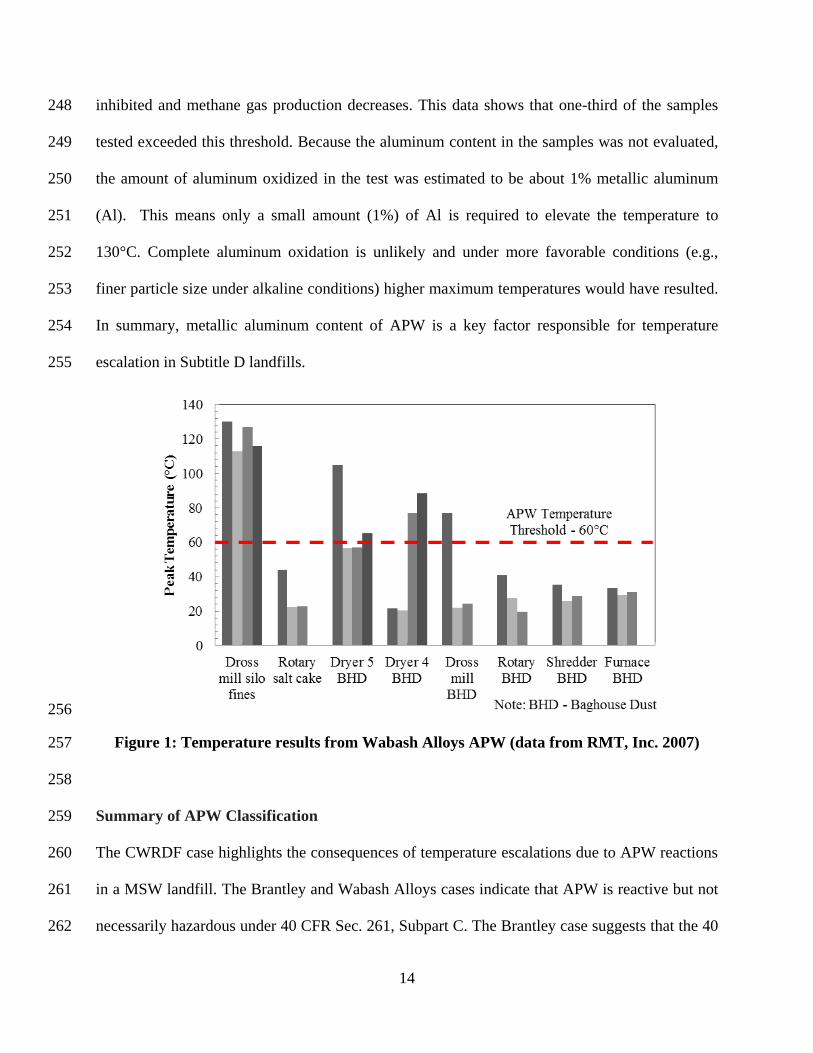
14
inhibited and methane gas production decreases. This data shows that one-third of the samples 248
tested exceeded this threshold. Because the aluminum content in the samples was not evaluated, 249
the amount of aluminum oxidized in the test was estimated to be about 1% metallic aluminum 250
(Al). This means only a small amount (1%) of Al is required to elevate the temperature to 251
130°C. Complete aluminum oxidation is unlikely and under more favorable conditions (e.g., 252
finer particle size under alkaline conditions) higher maximum temperatures would have resulted. 253
In summary, metallic aluminum content of APW is a key factor responsible for temperature 254
escalation in Subtitle D landfills. 255
256
Figure 1: Temperature results from Wabash Alloys APW (data from RMT, Inc. 2007) 257
258
Summary of APW Classification 259
The CWRDF case highlights the consequences of temperature escalations due to APW reactions 260
in a MSW landfill. The Brantley and Wabash Alloys cases indicate that APW is reactive but not 261
necessarily hazardous under 40 CFR Sec. 261, Subpart C. The Brantley case suggests that the 40 262

15
CFR Sec. 261.23 (a) (2) reactive criterion is applicable to APW but testing at Wabash Alloys and 263
other facilities (IMP 2002; David and Kopac 2012; Fukumoto et al. 2001; Huang et al. 2011) 264
suggest the reaction is slow depending on liquid alkalinity. If sufficient time or alkalinity is 265
allowed, the APW may be classified as hazardous. The slow activating reaction is also a 266
drawback of the Dangerous When Wet test method (40 CFR Sec. 170, Appendix E??????) 267
because the reacting solution is distilled water. At near neutral pH conditions, the solubility of 268
metallic aluminum in APW is low so the reaction is slow because aluminum is not readily 269
available. An alkaline solution can accelerate the APW rate of reaction and hydrogen gas 270
production because it increases the solubility of metallic aluminum. 271
Given the field observations of reactivity (US EPA 1994; Swackhamer 2006; RMT, Inc. 272
2007; Stark and Calder 2010; Stark et al. 2012) and variability of reactivity test methods, a new 273
test and criterion is proposed herein to determine whether an APW displays a characteristic of 274
reactivity under 40 CFR Sec. 261, Subpart C and thus should be considered a hazardous waste. 275
276
TYPICAL APW COMPOSITION 277
Generation and composition of metallic aluminum and alkalinity are briefly reviewed in this 278
section to ensure development of a reactivity test that will capture the range of materials being 279
produced and model worse case reactions in a landfill. 280
APW Generation 281
Secondary aluminum production involves the following two general categories of operation: 282
scrap pretreatment and smelting/refining. Pretreatment operations include sorting, processing, 283
and cleaning scrap. Smelting/refining operations include cleaning, melting, refining, alloying, 284
and pouring of aluminum recovered from scrap. The main features of secondary aluminum 285

16
production are the diversity of the raw materials and the variety of furnaces used. Typical 286
sources of aluminum scrap are process scrap, used beverage cans (UBCs), foils, extrusions, 287
commercial scraps, turnings, and rolled or cast metal. The type of raw material and its 288
pretreatment determine the selection of the type of furnace, either reverberatory or rotary salt 289
melting furnaces. 290
General scrap recovery uses gas-or oil-fired reverberatory furnaces, typically of 18 to 100 291
tonne (20 to 110 tons) capacity (Viland 1990). A salt flux layer on the surface of the molten 292
aluminum bath to protect the molten aluminum from oxidation and to improve metal recovery. A 293
salt flux layer consists generally of a mixture of potassium chloride (KCl) and sodium chloride 294
(NaCl). The selection of the types of salt fluxes depends on the type of raw material and on the 295
furnace. These salt fluxes have multiple functions (IAI 2009) some of which are: 296
allow heat transfer to the metal and contribute to the isolation of the metal from the 297
atmosphere. 298
mechanically disperse the oxides and metal substances or solid nonmetal substances 299
present in the furnace. 300
some salt fluxes can react chemically with the aluminum oxides, dissolving them. 301
302
Dross production at a typical secondary smelter with reverberatory furnaces is about 15% 303
of the metal charge where dross contains 8 to 12% metallic aluminum. While this is typical for a 304
specific smelter, some dross may contain as much as 80% aluminum (Viland 1990). In 1996, 305
U.S. secondary smelters consumed 1.44 million tonnes of scrap with a calculated metallic 306
recovery of 1.1 million tonnes (Plunkert 1996), which suggests that about 24% of the scrap 307
charge is lost as aluminum and aluminum oxide in the dross. Viland (1990) reports for every 308

17
454 tonnes (1 million pounds) of scrap processed, 345 tonnes (760,000 pounds) of secondary 309
aluminum is produced, and 109 tonnes (240,000 pounds) of dross residues and 1,360 kg (3,000 310
pounds) of baghouse dusts are generated both of which are usually disposed. 311
312
APW Composition 313
The APW contains variable amounts of metallic aluminum and are referred to as “dross”, “white 314
dross”, “black dross”, and “salt cake.” This section briefly discusses these terms or 315
classifications. 316
317
White Dross 318
The generation of white dross occurs at primary aluminum smelters, extruding plants, sheet 319
mills, foundries, and dies casters (Kulik and Daley 1990). Because these facilities operate 320
without fluxing, dross skimmed from the furnaces have a grey or metallic white color (see Fig. 321
2). White dross has a high metallic aluminum content (15-70%) (Kulik and Daley 1990). The 322
aluminum metal converts to aluminum oxide rapidly because of high temperature and an oxygen 323
rich environment. 324

18
325 Figure 2: White dross excavated during gas well drilling in a Subtitle D landfill 326
experiencing an aluminum reaction 327
328
329
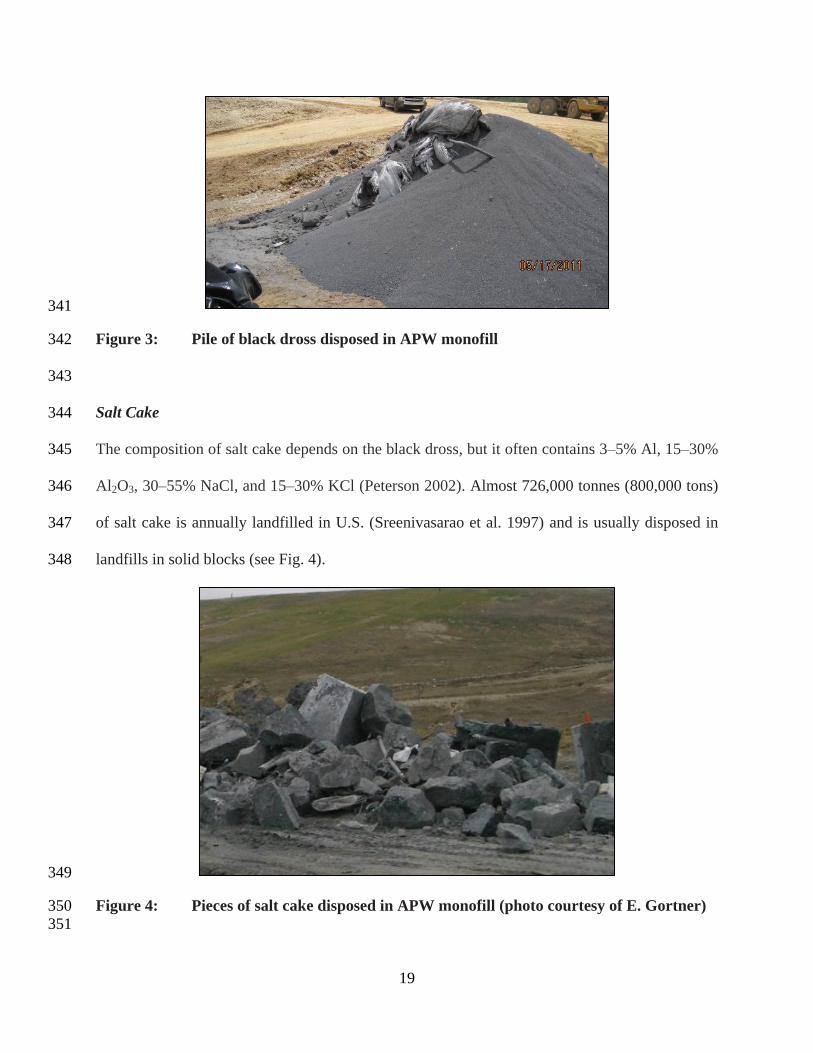
Black Dross 330
Black dross is created during melting of scrap and recycled aluminum. Salt fluxes are added to 331
the scrap to lower the melting point of the mix (700-800°C). At high a molten temperature, the 332
added salt flux becomes dark colored and thus is referred to as “black dross.” At temperatures 333
above the melting point of the salt flux mixture, the black dross (see Fig. 3) consists of two 334
immiscible liquid phases, i.e., aluminum metal and liquid salt containing oxide particles and 335
films. The metal content of the black dross varies depending on the scrap type being charged and 336
the processing conditions, but usually varies from 12 to 18% (Kulik and Daley 1990). The oxide 337
content of the black dross is approximately equal to the salt flux content. The aluminum metal 338
settles in the molten solution and the liquid salt is maintained near the surface and captured for 339
disposal. 340
19
341
Figure 3: Pile of black dross disposed in APW monofill 342
343
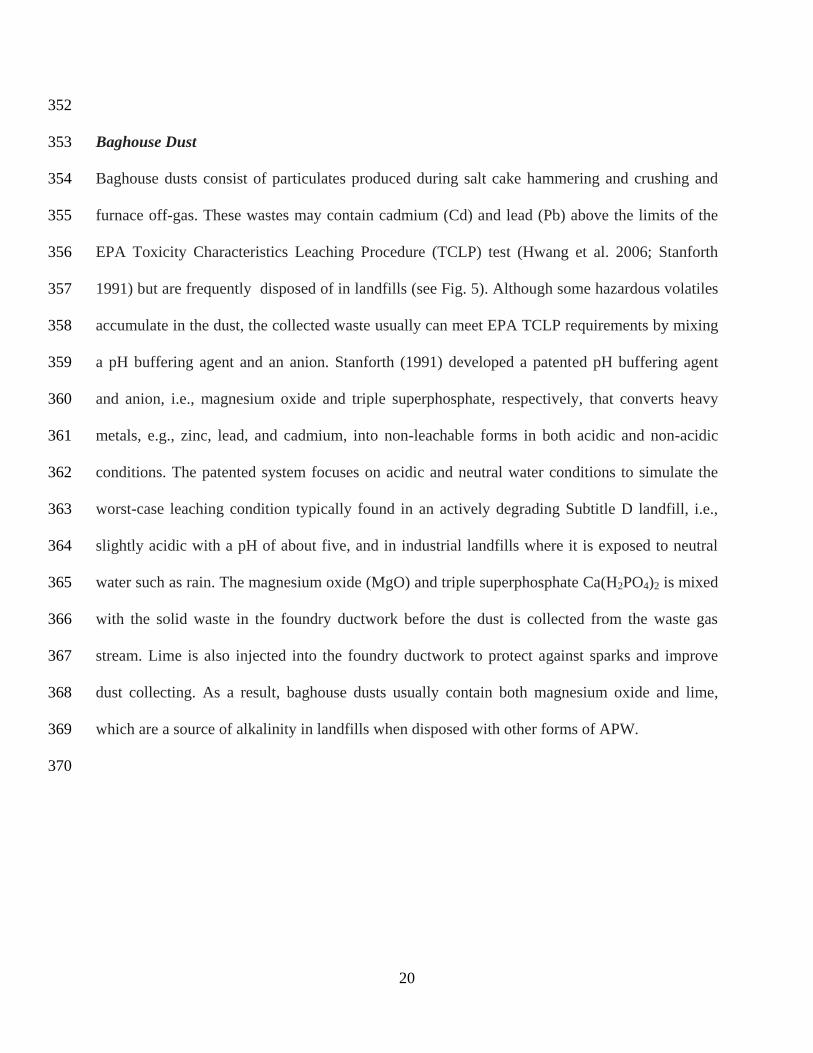
Salt Cake 344
The composition of salt cake depends on the black dross, but it often contains 3–5% Al, 15–30% 345
Al2O3, 30–55% NaCl, and 15–30% KCl (Peterson 2002). Almost 726,000 tonnes (800,000 tons) 346
of salt cake is annually landfilled in U.S. (Sreenivasarao et al. 1997) and is usually disposed in 347
landfills in solid blocks (see Fig. 4). 348
349
Figure 4: Pieces of salt cake disposed in APW monofill (photo courtesy of E. Gortner) 350
351
20
352
Baghouse Dust 353
Baghouse dusts consist of particulates produced during salt cake hammering and crushing and 354
furnace off-gas. These wastes may contain cadmium (Cd) and lead (Pb) above the limits of the 355
EPA Toxicity Characteristics Leaching Procedure (TCLP) test (Hwang et al. 2006; Stanforth 356
1991) but are frequently disposed of in landfills (see Fig. 5). Although some hazardous volatiles 357
accumulate in the dust, the collected waste usually can meet EPA TCLP requirements by mixing 358
a pH buffering agent and an anion. Stanforth (1991) developed a patented pH buffering agent 359
and anion, i.e., magnesium oxide and triple superphosphate, respectively, that converts heavy 360
metals, e.g., zinc, lead, and cadmium, into non-leachable forms in both acidic and non-acidic 361
conditions. The patented system focuses on acidic and neutral water conditions to simulate the 362
worst-case leaching condition typically found in an actively degrading Subtitle D landfill, i.e., 363
slightly acidic with a pH of about five, and in industrial landfills where it is exposed to neutral 364
water such as rain. The magnesium oxide (MgO) and triple superphosphate Ca(H2PO4)2 is mixed 365
with the solid waste in the foundry ductwork before the dust is collected from the waste gas 366
stream. Lime is also injected into the foundry ductwork to protect against sparks and improve 367
dust collecting. As a result, baghouse dusts usually contain both magnesium oxide and lime, 368
which are a source of alkalinity in landfills when disposed with other forms of APW. 369
370

21
371
Figure 5: Sacks of baghouse dust being placed in APW monofill 372
373
374
CONSTANT PRESSURE CALORIMETER TEST 375
This section describes a calorimeter test that can be used to assess the reactivity of APW before 376
it is accepted for disposal in a Subtitle D landfill. This section presents the preliminary 377
equipment and test procedure to assess whether or not the APW is “reactive” under 40 CFR Sec. 378
261, Subpart C and provides an insight to the impact of the APW after disposal in a Subtitle D 379
landfill. 380
381
Purpose 382
APW composition (e.g., alkalinity, particle size, aluminum content, etc.) can vary significantly 383
due to plant operation, smelting furnace, scrap and recycled materials used, salts introduced, etc. 384
The most likely reactions of APWs in a Subtitle D landfill or non-hazardous industrial landfill 385
involve the amphoteric reaction of aluminum with water (Calder and Stark 2010) as shown 386
below: 387

22
388
2 Al (Metal) + 6 H2O (Liquid) → 2 Al(OH)3 + 3 H2 (Gas) + Heat ΔH= -415 kJ/mol Al (1) 389
2 Al (Metal) + 3 H2O (Liquid) → Al2O3
+ 3 H2 (Gas) + Heat ΔH= -415 kJ/mol Al (2) 390
391
At near neutral pH conditions, the solubility of trivalent aluminum is low so the reaction can 392
only proceed slowly, if at all. Under acidic or alkaline conditions, however, the solubility of 393
trivalent aluminum is high enabling oxidation of finely divided metallic aluminum to proceed 394
quickly. This is the basis of the well-known caustic etching reaction used as the initial operation 395
in aluminum anodizing where the aluminum surface is almost instantly etched when immersed in 396
strong caustic solution described by the following equation: 397
398
2 Al (Metal) + 2 NaOH + 2 H2O → 2 NaAlO2 + 3 H2 (gas) + Heat (3) 399
400
In Reaction (3) Al (metal) and NaOH solution combine to yield NaAlO2 (sodium aluminate), 401
H2 gas, and heat. This important reaction is completed quickly, within a few a minutes, and 402
oxidizes all of the aluminum. Thus, the reactivity of APW will depend not only on metallic 403
aluminum content and particle size, but also on the alkalinity of both the APW and landfill 404
leachate. 405
Therefore, a simple experiment that can be conducted before an APW is loaded at the 406
generator or is unloaded at aSubtitle D landfill is needed to identify whether the reactivity of the 407
APW is sufficient to elevate temperatures in the landfill and induce expensive remedial 408
measures. The experiment involves performing a temperature test at the generator or landfill 409
weigh station to simulate the temperature rise that would occur in the landfill if the APW is 410

23
subjected to a alkaline leachate. The test uses a strongly alkaline solution to accelerate the 411
reaction rate so that a worst case scenario is simulated. A side benefit of this test is that it 412
indirectly measures the metallic aluminum content in the APW so that the generator will be more 413
aware of product losses before disposal and actions for better process control can be 414
implemented to capture the remaining aluminum. 415
416
Theory 417
Calorimetry is the quantitative measurement of heat required or evolved during a chemical 418
process (Chang 2005). The proposed constant pressure calorimeter is shown in Fig. 6 and is 419
an instrument for measuring the heat of reaction during a defined process. 420
421
Figure 6: Schematic of constant pressure calorimeter for APW classification 422
423
In a constant pressure calorimeter, the reaction between water and APW will generate heat. 424
Because the calorimeter acts as an insulator, minimal heat loss will occur between the 425
calorimeter and the surrounding air, creating an isolated system. The heat of reaction ( ) 426

24
is defined as the quantity of heat exchanged with the surroundings in restoring the 427
calorimeter to its initial temperature in units of kilojoules (kJ) or calories (cal). 428
Eq. (1)
where T is temperature (°C) and the change in final and initial temperature is ∆T, m is mass 429
of alkaline water and APW (g), and Cp,residue is the specific heat (J/g °C). Cp,residue is a 430
weighted average between specific heats of water and APW, which are 4.186 J/g·°C (1 431
cal/g·°C) and about 0.837 J/g °C (0.2 cal/g·°C), respectively, and is estimated by Eq. (2). 432
APW specific heat is an arithmetic mean of the main constituents Al (metal), Al2O3, NaCl, 433
and KCl. 434
Eq. (2)
435
For example, assuming 25g of APW reacts with 10 mL of water, the Cp,residue is about 3.46 436
J/g·°C (0.826 cal/g·°C) using Eq. (2). The resulting value of qrxn is the heat that will be 437
generated in a Subtitle D landfill by the APW reacting with water. 438
439
Calorimeter Equipment and Procedure 440
The test equipment and recommended procedure for conducting a constant pressure 441
calorimeter test to evaluate APW reactivity is presented in this section. The test equipment is 442
comprised of an insulated calorimeter, sodium hydroxide (NaOH) solution, thermometer, and 443
pressure regulator. Typical insulated calorimeters use glass thermal insulation layers and are 444
tightly sealed using a rubber stopper. A variety of NaOH concentrations, e.g., 20% w/w, can 445

25
be purchased at a chemical supply company. This alkaline solution must be strong enough to 446
ensure all of the aluminum can be reacted and that an excess is present to maintain strong 447
alkaline conditions as the reaction proceeds. This will minimize the reaction time and 448
maximize the temperature rise. A pressure regulator serves to release gas pressure generated 449
by the APW reaction. To simplify and reduce testing time, the production of gases such as 450
ammonia, methane, and hydrogen sulfide gas production are not measured. As a result, it is 451
anticipated that this test can be performed quickly at a secondary processor or a landfill 452
weigh station. 453
The general procedure consists of a representative specimen of APW is weighed and 454
placed inside the insulated constant pressure calorimeter (See Fig. 6). After a predetermined 455
volume of NaOH solution is added to APW and mixed thoroughly for a few moments by 456
shaking and swirling, ensuring the reaction goes to completion. The calorimeter is sealed 457
tightly by placing the rubber stopper in the top of the container to prevent heat loss. The 458
change in temperature inside the calorimeter is monitored by inserting a thermometer through 459
the rubber stopper into the moist APW (see Fig. 6). In addition, a pressure regulator, i.e., a 460
release valve, is necessary to release pressure build-up from gas production. The temperature 461
is monitored and recorded at regular intervals, e.g., one minute, until the maximum 462
temperature is recorded. Because the heat lost from the insulated container is small, the 463
constant pressure calorimeter provides an upper bound temperature and heat of reaction. 464
If the APW generator or analyst desires, the aluminum content can be estimated by 465
measuring the volume of hydrogen gas generated from the reaction. Fig. 7 shows how the 466
calorimeter can be modified to include two calorimeters (reactor and hydrogen collection 467
tank) and a displaced water beaker to measure the volume of hydrogen gas generated. The 468
26
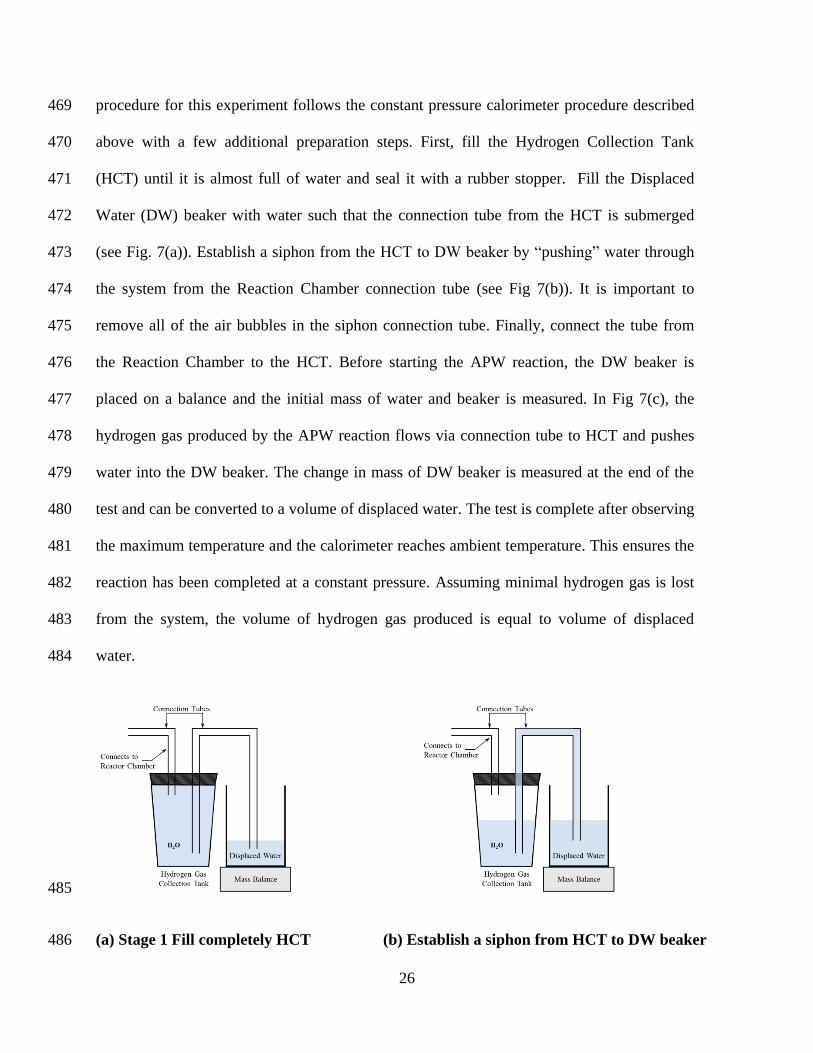
procedure for this experiment follows the constant pressure calorimeter procedure described 469
above with a few additional preparation steps. First, fill the Hydrogen Collection Tank 470
(HCT) until it is almost full of water and seal it with a rubber stopper. Fill the Displaced 471
Water (DW) beaker with water such that the connection tube from the HCT is submerged 472
(see Fig. 7(a)). Establish a siphon from the HCT to DW beaker by “pushing” water through 473
the system from the Reaction Chamber connection tube (see Fig 7(b)). It is important to 474
remove all of the air bubbles in the siphon connection tube. Finally, connect the tube from 475
the Reaction Chamber to the HCT. Before starting the APW reaction, the DW beaker is 476
placed on a balance and the initial mass of water and beaker is measured. In Fig 7(c), the 477
hydrogen gas produced by the APW reaction flows via connection tube to HCT and pushes 478
water into the DW beaker. The change in mass of DW beaker is measured at the end of the 479
test and can be converted to a volume of displaced water. The test is complete after observing 480
the maximum temperature and the calorimeter reaches ambient temperature. This ensures the 481
reaction has been completed at a constant pressure. Assuming minimal hydrogen gas is lost 482
from the system, the volume of hydrogen gas produced is equal to volume of displaced 483
water. 484
485
(a) Stage 1 Fill completely HCT (b) Establish a siphon from HCT to DW beaker 486

27
487
(c) Compete test setup with Reaction Chamber 488
Figure 7: Test to estimate aluminum metal content from APW reaction in calorimeter 489
490
The percentage of aluminum is obtained using Eq. (3): 491
( ) ( )
( )
(3)
492
where R is the ideal gas constant 0.082057 (L·atm/K·mol), Patm is atmospheric pressure (1 493
atm), T is in units of Kelvin (K), ⁄ is the molar ratio of Al and H2 reaction 494
coefficients shown in Reaction (3), MAl is the molar mass of aluminum (27 g/mol), and Minitial 495
is initial mass of APW sample (25 g). Because temperature is evaluated in Kelvin (K), Eq. 496
(4) converts degree Celsius to Kelvin: 497
( ) (4)
498
PRELIMINARY TEST RESULTS 499
28
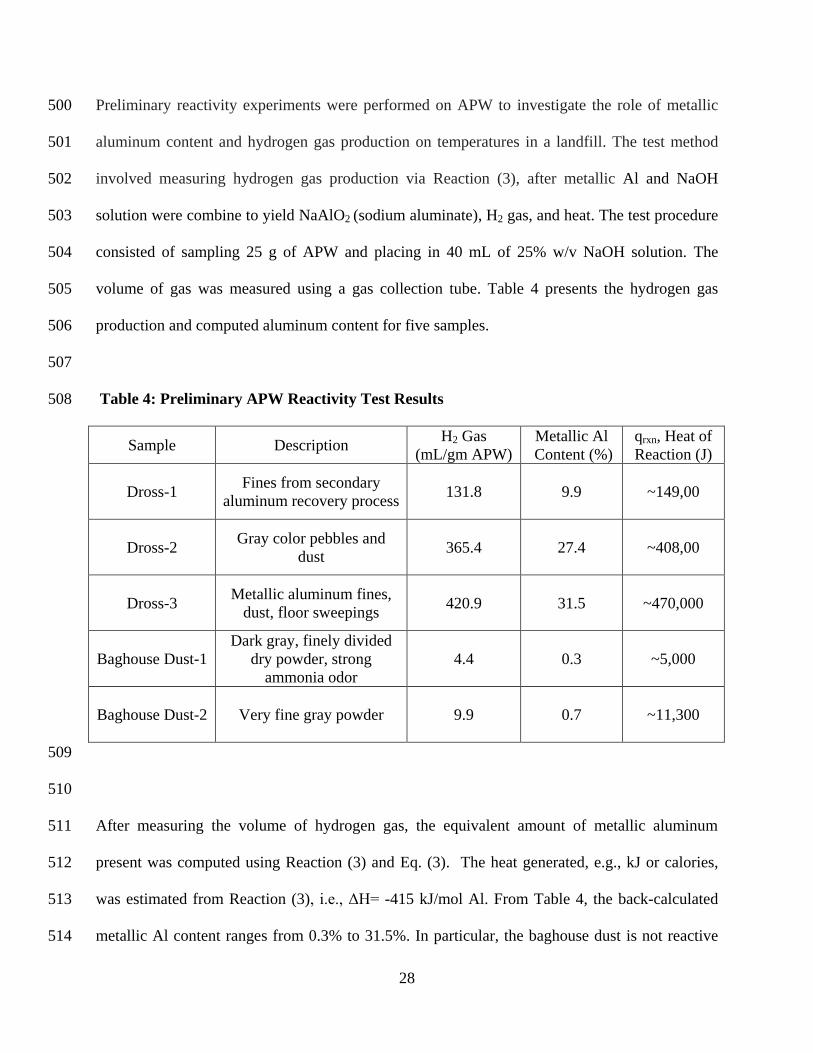
Preliminary reactivity experiments were performed on APW to investigate the role of metallic 500
aluminum content and hydrogen gas production on temperatures in a landfill. The test method 501
involved measuring hydrogen gas production via Reaction (3), after metallic Al and NaOH 502
solution were combine to yield NaAlO2 (sodium aluminate), H2 gas, and heat. The test procedure 503
consisted of sampling 25 g of APW and placing in 40 mL of 25% w/v NaOH solution. The 504
volume of gas was measured using a gas collection tube. Table 4 presents the hydrogen gas 505
production and computed aluminum content for five samples. 506
507
Table 4: Preliminary APW Reactivity Test Results 508
Sample Description H2 Gas
(mL/gm APW)
Metallic Al
Content (%)
qrxn, Heat of
Reaction (J)
Dross-1 Fines from secondary
aluminum recovery process 131.8 9.9 ~149,00
Dross-2 Gray color pebbles and
dust 365.4 27.4 ~408,00
Dross-3 Metallic aluminum fines,
dust, floor sweepings 420.9 31.5 ~470,000
Baghouse Dust-1
Dark gray, finely divided
dry powder, strong
ammonia odor
4.4 0.3 ~5,000
Baghouse Dust-2 Very fine gray powder 9.9 0.7 ~11,300
509
510
After measuring the volume of hydrogen gas, the equivalent amount of metallic aluminum 511
present was computed using Reaction (3) and Eq. (3). The heat generated, e.g., kJ or calories, 512
was estimated from Reaction (3), i.e., ΔH= -415 kJ/mol Al. From Table 4, the back-calculated 513
metallic Al content ranges from 0.3% to 31.5%. In particular, the baghouse dust is not reactive 514

29
due to the small hydrogen production while the dross samples indicate high metallic aluminum 515
content which could be captured with additional processing. 516
Because the maximum reaction temperatures were not measured, the heat of reaction was 517
used to estimate temperatures in a landfill setting. The change in temperature, ΔT, is estimated 518
using Eq. (1), where m is 65 g, Cp,residue ~2.9 J/g∙°C and is estimated using Eq. (2), and qrxn (see 519
Table 4). For example, the Dross-1 sample generated ~149,000 J of energy thus the computed 520
ΔT is about 790°C. This means complete oxidation of 9.9% metallic aluminum can increase 521
temperatures by ~790°C. In a landfill the observed maximum temperatures will be less because 522
complete aluminum oxidation may not occur and heat can be lost through the landfill surface. 523
An APW monofill in Ohio is measuring downhole temperatures of ~96°C (220°F). The 524
metallic aluminum content of APW at this facility is unknown but the downhole temperatures 525
illustrate the effect of heat loss via conduction. In May 2008, temperatures measured at 8 m (26 526
ft) and 20 m (65.5 ft) below ground surface (bgs) were about 96°C (220°F). In September 2011, 527
over a two-year period, the temperatures decreased to ~70°C (158°F) at 8 m bgs but remained 528
constant at 93°C at 20 m bgs. It is likely that heat loss at the surface and waste insulation 529
contributed to the temperature change at 8 m bgs. Fig. 8 presents a possible relationship between 530
metallic aluminum content, heat loss, and maximum temperature in a landfill setting. It is evident 531
that temperatures can dramatically increase depending on the percent aluminum oxidized and 532
heat loss through the landfill cover. The maximum temperatures are capped at 100°C because 533
downhole temperatures measured at an APW monofill are ~96°C, or near the boiling point of 534
water. Even though the reactivity test results provided herein are preliminary, they show the 535
ability of the calorimeter to measure hydrogen gas and back-calculate metallic aluminum 536

30
content. The final development of the test protocol and interpretation of results is currently in 537
progress so the results can be used in field applications. 538
539
540
Figure 8: Effect of aluminum content on maximum reaction temperature 541
542
DISCUSSION 543
The general theory and test procedure to evaluate APW temperature escalation and metallic 544
aluminum content is provided for use by secondary aluminum generators and landfill 545
operators. The following aspects of the reactivity test procedure are being investigated to 546
facilitate field implementation: 547
0
20
40
60
80
100
120
0.0 0.5 1.0 1.5 2.0 2.5 3.0 3.5
Tem
per
ature
(°C
)
Metallic Aluminum Content (%)
0% Heat Loss
15%
30%
45%
60%
31
1. Calibration experiments for the constant pressure calorimeter and hydrogen gas 548
measuring procedure are recommended to verify reproducibility and accuracy, i.e., 549
produces stoichiometric equilibrium quantities of qrxn and hydrogen gas, before using 550
to classify APW as hazardous or non-hazardous. A possible calibration test involves 551
aluminum powder with sodium hydroxide which produces a known amount of heat 552
and hydrogen gas that can compared to the theoretical values in Reaction (1). 553
2. The optimal test conditions should balance the APW sample size, solid to liquid ratio, 554
and strength of sodium hydroxide. Because APW is generally transported from 555
generator to the landfill facility by a transfer dump truck, a representative sample size 556
of APW is necessary for the reactivity test. The US DOT Dangerous When Wet test 557
method (49 CFR 170, Appendix E) uses a series of experiments with increasing 558
sample mass, i.e., from 2 mm diameter specimens to 25 g sample, to evaluate gas 559
production. In addition, the solid to liquid ratio and strength of sodium hydroxide are 560
important because enough alkaline liquid should be present to quickly react all 561
metallic aluminum but highly concentrated sodium hydroxide can be hazardous and 562
also wasteful. 563
3. Huang et al. (2011) found that as APW particle size decreases the reaction rate and 564
temperature increases. Because APW composition and particle size vary among 565
production processes, the effect of APW particle size should be investigated to 566
determine if screening is required before testing. 567
4. Ball-milling of APW can liberate metallic aluminum fines from granules of salt flux. 568
In addition, the crushing and grinding can mechanically activate the aluminum by 569
32
breaking the protective oxide layer and oxidizing the free metallic aluminum. In this 570
case, oxidation can decrease the metallic aluminum content before reactivity testing. 571
5. Huang et al. (2011) reports that increasing the initial starting reaction temperature can 572
increase the maximum temperature measured. Because APW is exposed to the 573
environment during transport, the initial temperature of the APW can vary depending 574
on climate. As a result, testing at varying initial temperatures or recommending a test 575
temperature, e.g. Dangerous When Wet test uses 20°C, requires further investigation. 576
6. During the hydrogen gas measuring procedure, the volume of gas changes with 577
temperature, so a correction factor may be necessary for landfill conditions. 578
579
CONCLUSIONS 580
The following conclusions and recommendations are presented based on the discussion and data 581
presented herein: 582
1. Although recycling aluminum is truly beneficial and sustainable, the disposal of the 583
resulting solid waste is a concern because of APW exothermic reactions. Such problems 584
can be avoided by the proposed calorimeter test that assesses reactivity of specific APW 585
loads or sources prior to disposal. 586
2. The constant pressure calorimeter test presented herein can be used to predict the 587
maximum temperature generated from an APW reaction. The maximum recommended 588
temperature for Subtitle D landfills is 60°C (140°F) to permit waste decomposition and 589
prevent elevated temperatures from impacting engineered components (composite liner 590
system, gas vents, and leachate collection system). 591
33
3. A procedure is also described herein to estimate the aluminum content of APW from the 592
calorimeter test. The estimated aluminum content can be used to judge if further APW 593
recycling is economical. The final decision on whether or not to accept APW for disposal 594
in a Subtitle D landfill is the responsibility of the landfill owner or manager, but the 595
proposed calorimeter test provides a practical means for estimating the potential landfill 596
temperature increase due to the APW. 597
4. The recommended reactivity test is being used to determine a calibration procedure as 598
well as to investigate the effect of particle size, testing conditions, ball-milling, and 599
environmental conditions on the maximum temperature increase and production of 600
hydrogen gas. 601
602
ACKNOWLEDGMENTS 603
This material is based upon work supported by the National Science Foundation through a 604
Graduate Research Fellowship to Navid H. Jafari. Any opinions, findings, and conclusions or 605
recommendations expressed in this material are those of the authors and do not necessarily 606
reflect the views of the NSF. 607
608
609
610
611
612
613
REFERENCES 614
615
Agency for Toxic Substances and Disease Registry (ATSDR). (2001). “Chapter 2: Landfill gas 616
basics.” Landfill gas primer—An overview for environmental health professionals, Atlanta, 617
3–14. 618
Amer, A. M. (2002). “Extracting aluminum from dross tailings.” J. Mater., 54(11), 72–75. 619

34
Australian Gov. Dept. of the Environment and Water Resources. (2007). “Proposal to regulate 620
salt slag under the hazardous waste (Regulation of Exports and Imports) regulations 1996.” 621
⟨http://www.environment.gov.au/settlements/chemicals/hazardous-waste/salt-slag.html⟩. 622
BCS, Inc. (2007). U.S. Energy Requirements for Aluminum Production: Historical Perspective, 623
Theoretical Limits and Current Practices. Prepared for Industrial Technologies Program 624
Energy Efficiency and Renewable Energy U.S. Department of Energy. 625
Calder, G. V., and Stark, T. D. (2010). “Aluminum reactions and problems in municipal solid 626
waste landfills.” Pract. Period. Hazard. Toxic Radioact. Waste Manage., 14(4), 258–265. 627
Chang, R. (2005). Chemistry, 7th
Ed., McGraw Hill, Burr Ridge, IL 628
Crutcher, A.J., McBean, E.A. and Rovers, F.A. (1982). “Temperature as an Indicator of Landfill 629
Behaviour." J. of Water, Air and Soil Pollution, 17, 213-223 630
David, E., and Kopac, J. (2012). “Hydrolysis of aluminum dross material to achieve zero 631
hazardous waste.” J. Hazard. Mater., (accepted in press). 632
Das, B. R., Dash, B., Tripathy, B. C., Bhattacharya, I. N., and Das, S. C. (2007). “Production of 633
alumina from waste aluminum dross.” Min. Eng., 20(3), 252–258. 634
Drossel, G., Friedrich, S., Huppatz, W., Kammer, C., Lehnert, W., Liesenberg, O., Paul, M., and 635
Schemme, K. (2003). Aluminum Handbook, Vol. 2. Forming, Casting, Surface Treatment, 636
Recycling and Ecology. Dusseldorf, Germany. 637
European Commission (EC). (2000). “Establishing a list of hazardous waste pursuant to Article 638
1(4) of Council Directive 91/689/EEC on hazardous waste.” Report Commission Decision 639
(2000/532/EC), DG Environment Europe Commission. 640
Fukumoto, S., Ho’okabe, T., and Tsubakino, H. (2001). “Leaching reactions of aluminum dross 641
in various aqueous solutions.” J. Japan Inst. Light Metals, 51(1), 34–39. 642
Fukumoto S, Hookabe T, Tsubakino H. (2000). “Hydrolysis behavior of aluminum nitride in 643
various solutions.” J Mater Sci.; 35, 2743–2748. 644
Gil, A. (2005). “Management of the salt cake from secondary aluminum fusion processes.” Ind. 645
Eng. Chem. Res., 44, 8852–8857. 646
Hanson, J.L., Yesiller, N., and Oettle, N. K. (2010). “Spatial and temporal temperature 647
distributions in municipal solid waste landfills.” J. Environ. Eng., 136(8), 804-814. 648
Huang, X., Tolaymat, T., Ford, R., and Barlaz, M. (2011). “Characterization of Secondary 649
Aluminum Processing Waste.” Report for US EPA Contract EP-C-11-006, Cincinnati, OH. 650

35
Hwang, J.Y., Huang, X., and Xu, Z. (2006). “Recovery of metals from aluminum dross and salt 651
cake.” J. Min. Mat. Charact. Eng., 5, 47-62. 652
Hyrn, J.N., Daniels, E.J., Gurganus, T.B., and Tomaswick, K.M. (1995). “Products from salt 653
cake residue-oxide.” Proc., Third International Symposium on Recycling of Metals and 654
Engineering Materials, The Minerals, Metals and Materials Society, Warrendale, PA, 905. 655
Institute of Materials Processing (IMP). (2002). “Recycling and reuse of aluminum wastes.” DE-656
FC07-98ID13663, Michigan Technological University. 657
International Aluminum Institute (IAI). (2009). “Global aluminum recycling: A cornerstone of 658
sustainable development.” Report Global Aluminum Recycling Committee, London. 659
Kammer, C. (1999). Aluminum Handbook: Vol. 1 Fundamentals and Materials. Dusseldorf, 660
Germany. 661
Kojan, A., Dakskobler, A., Krnel, K., and Kosmac, T. (2011). “The course of the hydrolysis and 662
the reaction kinetics of AlN powder in diluted aqueous suspensions.” J. of European Ceramic 663
Society, 31, 815-823. 664
Krnel, K., and Kosmac, T. (2004). “Reactivity of AlN powder in an aqueous environment.” Key 665
engineering materials Vols. 264-268, 29-32. 666
Krnel, K., Drazic, G., Kosmac, T. (2004). “Degradation of AlN powder in aqueous 667
environments.” J Mater Res.,19, 1157–1163. 668
Kulik, G.J, and Daley, J.C. (1990). “Aluminum dross processing in the 90’s.” Proc., 2nd Int. 669
Symp. Recycl. Met. Eng. Mater, TMS-AIME, Warrendale, PA, 427. 670
Lorber, K.E., and Antrekowitsch, H. (2010). “Treatment and disposal of residues from aluminum 671
dross recovery.” Proc., 2nd
International Conference on Hazardous and Industrial Waste 672
Management, Crete, Greece. 673
Lucheva, B., Tsonev, Ts., and Petkov, R. (2005). “Non-waste aluminum dross recycling.” J. 674
Univ. Chem. Technol. Metall., 40(4), 335–338. 675
Manfredi, O., Wuth, W., and Bohlinger, I. (1997). “Characterizing the physical and chemical 676
properties of aluminum dross.” J. Mater., November Issue, 48–51. 677
Miškufová, A., Štifner, T., Havlik, T., and Jančok, J. (2006). “Recovery of valuable substances 678
from aluminum dross.” Acta Metall. Slovaca, 12, 303–312. 679
Peterson, R.D., and Newton, L. (2002). “Review of aluminum dross processing.” Light Metals: 680
Proc. of Sessions, TMS Annual Meeting, Warrendale, PA, 1029-1037. 681

36
Petrovic, J., and Thomas, G. (2008). “Reaction of aluminum with water to produce hydrogen.” 682
Report for US DOE Office of Hydrogen Program. 683
Plunkert, P. (1996). “Aluminum annual review: 1995.” Bureau of Mines, U.S. Department of 684
Interior. 685
Roth, D.J. (1996). “Recovery of aluminum from rotary furnace salt cake by low impact rotary 686
tumbling.” Light Metals Proc. of Sessions, TMS Annual Meeting, Warrendale, PA 1251-687
1253. 688
RMT, Inc. (2007). “Response to request for additional information: Permit renewal Wabash 689
Alloys.” Indiana Dept. of Environmental Management, Indianapolis, IN. 690
Shinzato, M. C., and Hypolito, R. (2005). “Solid waste from aluminum recycling process: 691
Characterization and reuse of its economically valuable constituents.” Waste Manage. J., 692
25(1), 37–46. 693
Sreenivasarao, K., Patsiogiannis, F., Hryn, J.N., Daniels, E.J. (1997). “Concentration and 694
precipitation of NaCl and KCl from salt cake leach solutions by electrodialysis.” Light 695
Metals, Proc. of TMS, Orlando, FL, 1153–1158. 696
Stanforth, R.R. (1991). “Method for reduction of heavy metal leaching from hazardous waste 697
under acidic and nonacidic conditions.” US Patent 5,037,479. 698
Stark, T.D., Martin, J.W. Gerbasi, G.T. and Thalhamer, T. (2012). "Aluminum Waste Reaction 699
Indicators in an MSW Landfill," J. of Geotech. and Geoenvir. Engrg., 138(3) 252-261. 700
Swackhamer, R. D. (2006). “Interim remedial action plan Ramco aluminum waste disposal site, 701
Port of Klickitat Industrial Park.” Report Washington State Dept. of Ecology Toxics Cleanup 702
Program, Dallesport, WA. 703
Szczygielski, T. (2007). “Fire in the hole: Aluminum dross in landfills.” J. Nat. Resour. Environ. 704
Law, 22(2), 159–174. 705
Tsakiridis, P.E. (2012). “Aluminum salt slag characterization and utilization – A review.” J. 706
Hazardous Waste, (Accepted Manuscript). 707
Unger, W., and Beckmann, M. (1992). “Salt slag processing for recycling.” Light Metals: Proc. 708
of Sessions, TMS Annual Meeting, San Diego, California, 1159–1162. 709
U.S. Dept. of Energy (DOE). (1999). “Recycling of aluminum dross/saltcake, Aluminum Project 710
fact sheet.” Office of Industrial Technologies Energy Efficiency and Renewable Energy, 711
Washington, DC. 712

37
U.S. Environmental Protection Agency (EPA). (1994). “Brantley landfill site Island, Kentucky.” 713
EPA/ROD/-95/201, Atlanta, GA. 714
U.S. Environmental Protection Agency (EPA). (2005). “Municipal solid waste in the United 715
States, 2005 facts and figures.” EPA530-R-06-011, Washington, DC. 716
U.S. Environmental Protection Agency (EPA). (2010). “Subtitle D: Criteria for municipal solid 717
waste landfills.” Resource Conservation and Recovery Act Doc. No. 40CFR258.40, U.S. 718
EPA, Washington, DC. 719
Viland, J. S. (1990). “A secondary’s view of recycling.” Proc. Second International Symposium: 720
Recycling of Metals and Engineered Material , the Minerals, Metals & Materials Society, 21-721
31. 722
Wernick, I.K., and Themelis, N.J. (1998). “Recycling metals for the environment.” Annu. Rev. 723
Energ. Env., 23, 465-497. 724
Xiao, Y., Reuter, M.A., and Boin, U. (2005). “Aluminum recycling and environmental issues of 725
salt slag treatment.” J. Environ. Sci. Heal. A, 40, 1861-1875. 726
Yeşiller, N., Hanson, J. L., and Liu, W.-L. (2005). “Heat generation in municipal solid waste 727
landfills.”J. Geotech. Geoenviron. Eng., 131(11), 1330–1344. 728
729
730
731
732
733
734
735
736
737
738
739
740
741
742
743
38
744
745
List of Tables 746
Table 1. Comparison of Primary and Secondary Aluminum Smelting Processes (data 747
from Gil 2005) 748
749
Table 2: Summary landfills accepting APW 750
Table 3. Composition of gas generated from Wabash dross mill waste in laboratory 751
tests (data from Wabash 2007) 752
753
754
755
List of Figures 756
Figure 1: Temperature results from Wabash Alloys APW (data from RMT, Inc. 2007) 757
Figure 2. Schematic of constant pressure calorimeter 758
759
Figure 3. Test to estimate aluminum metal content from APW reaction 760
(a) Stage 1 Fill completely HCT 761
(b) Establish a siphon from HCT to DW beaker 762
(c) Compete test setup with Reaction Chamber 763