clean bay blueprint - ecocentre
TRANSCRIPT
Microplastics in Melbourne | October 2020
Clean Bay Blueprint
Fam Charko Neil Blake
April Seymore Dr Christopher Johnstone
Emma Barnett Dr Nicole Kowalczyk
Marinda Pattison
PartnersClean Bay Blueprint involved a large geographical range and associated land and water managers and communities The project outcomes achieved would never have been possible without the collaboration and contribution of our project partners
Our primary project partners were the Department of Environment Land Water and Planning Yarra Riverkeeper Association Werribee River Association Beach Patrol Australia (in particular the St Kilda Rye Seaford Frankston Mt Martha and Werribee groups) Balcombe Estuary Reserve Group Mt Martha Dolphin Research Institute Bellarine Catchment Network Monash University Worcester Polytechnic Institute Blairgowrie Yacht Squadron and 5 Gyres Institute A full list of contributors can be found in the Acknowledgements
Clean Bay Blueprint was funded by the Port Phillip Bay Fund
Acknowledgement of countryThe Port Phillip EcoCentre acknowledges the First Peoples on whose lands and waters this research took place
We acknowledge Kulin Nation Elders past present and emerging and we
strive to uphold their connection to the land and waters We recognise that their sovereignty of these lands and waters was never ceded
1 Executive summary 4
2 Introduction 8
Port Phillip EcoCentre 9
Port Phillip Bay and catchments 9
Clean Bay Blueprint project 10
Project aims 101 Conducting rigorous and replicable
methods to quantify plastic pollution through microplastics trawls and beach litter audits 11
2 Engaging the community in citizen science activities 11
3 Building partnerships with other organisations that target litter and Bay health 11
Plastic pollution in the global context 11Effects on living organisms 12
Climate impacts of plastics 13
The cost of marine plastic pollution 14
Plastic pollution in Victoria 14
Policy context 16Australia 16
Victoria 17
Worldwide 17
3 Microplastics in the Yarra and Maribyrnong Rivers 18
Aims of the microplastics study 19Quantifying plastic pollution to inform legislative reform and behaviour change 19
Tracking changes in litter over time and establishing a baseline 19
Identifying the source of litter items 19
Study method 20Study site 20
River trawls 20
Sample analysis method 21
Trawl data analysis results 22Litter reaching Port Phillip Bay 23
Comparing the rivers 23
Analysis of plastic polymer types 25
Seasonal differences in litter 25
Changes in litter over time 26
Factors driving litter increases and spikes 31
Yarra and Maribyrnong microplastics research discussion 32
Litter increases 32
Litter composition in the rivers 33
Investigating litter by item category34
Seasonal variations36
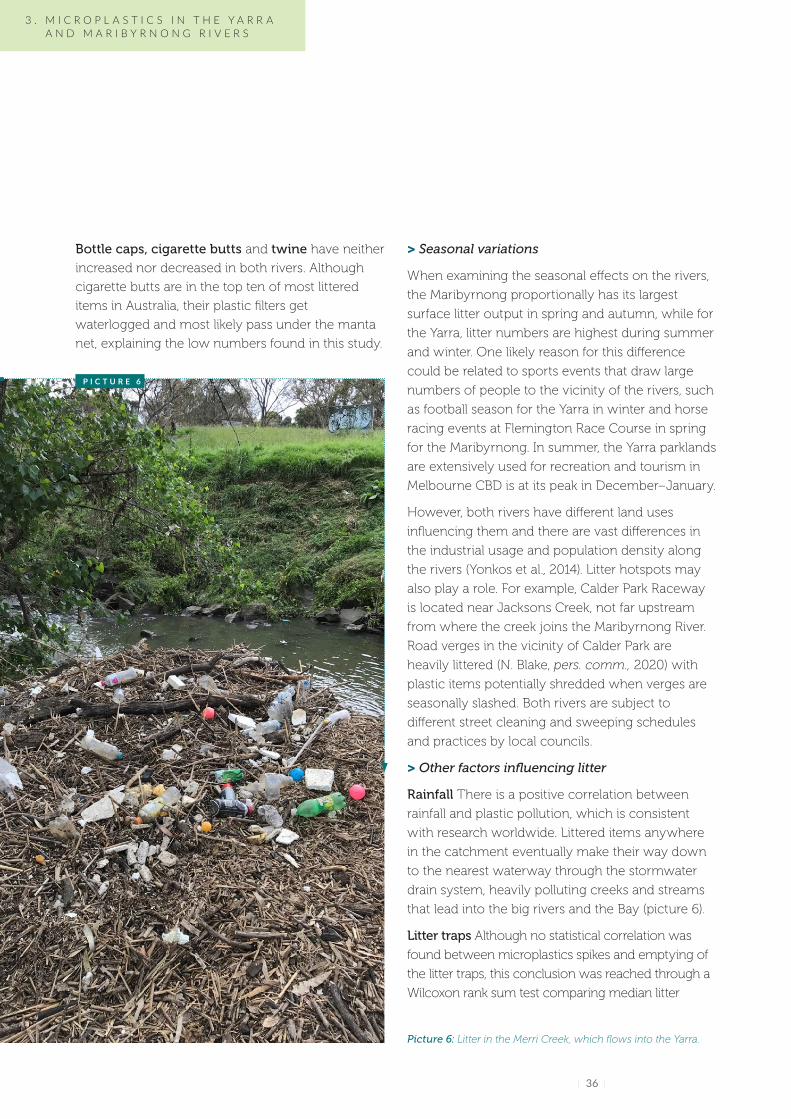
Other factors influencing litter 36
Implications for marine life in the Yarra estuary and Port Phillip Bay 37
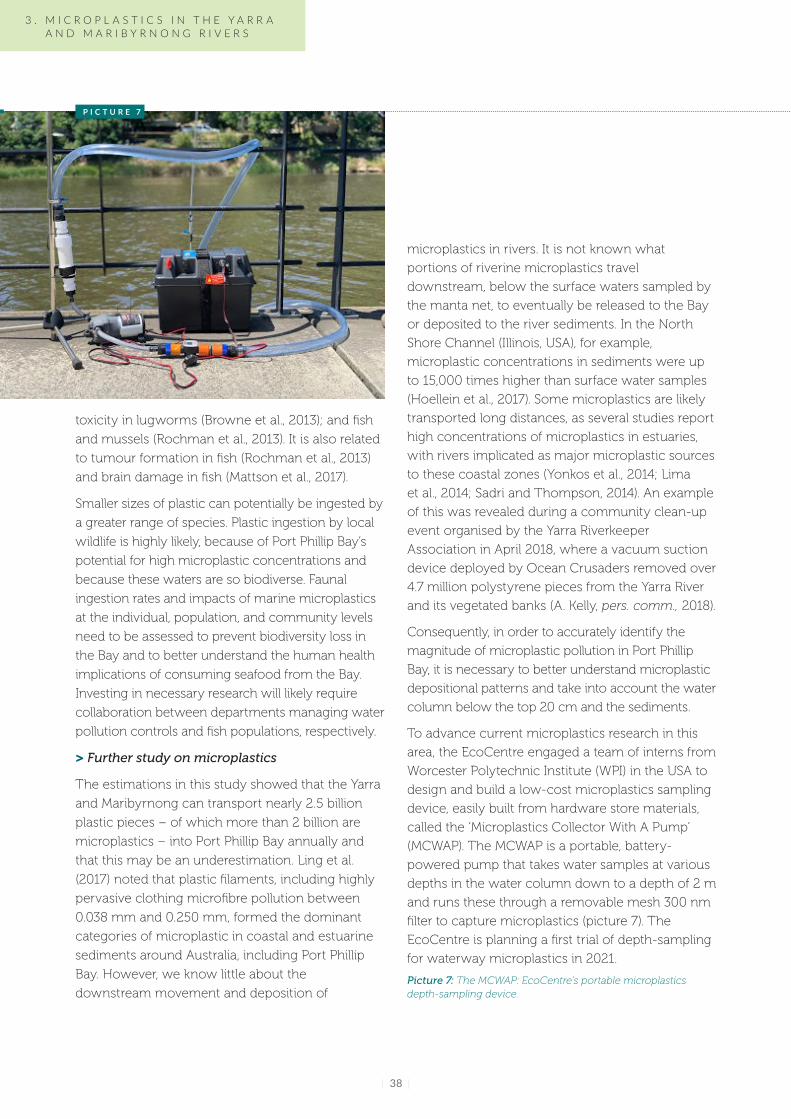
Further study on microplastics 38
4 Bay trawls pilot 40
5 Baykeeper Beach Litter Audits 42
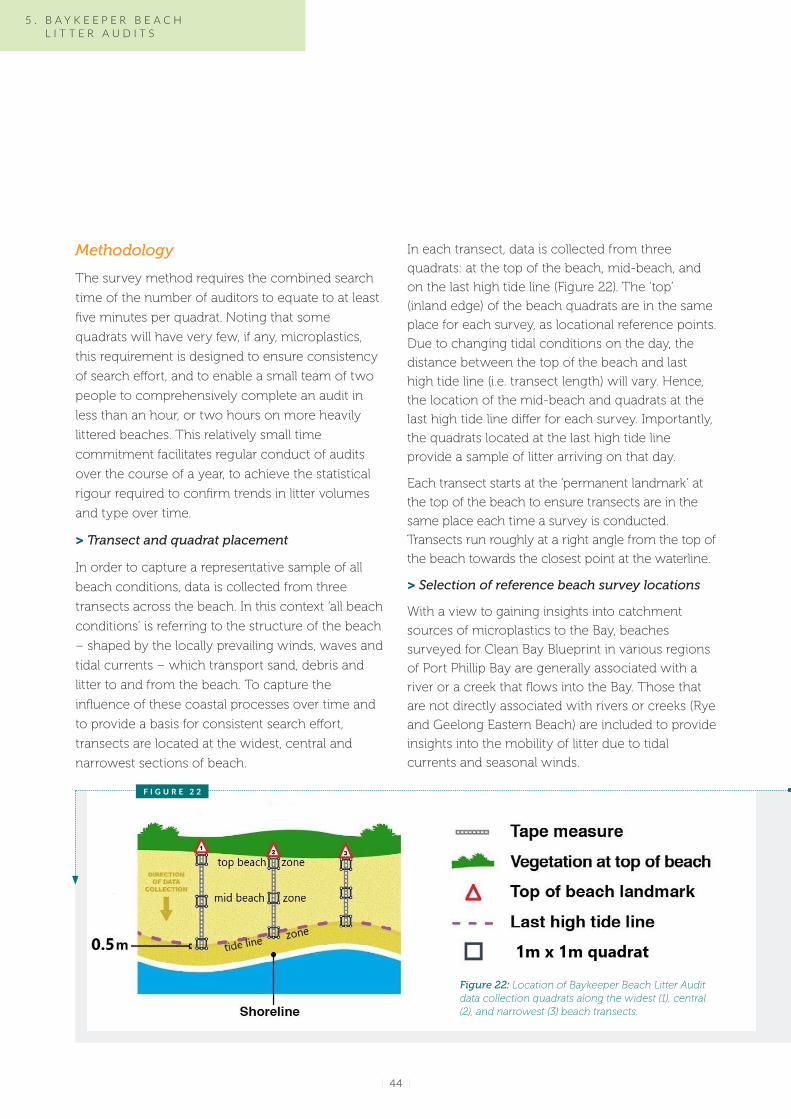
Methodology 44Transect and quadrat placement 44
Selection of reference beach survey locations 44
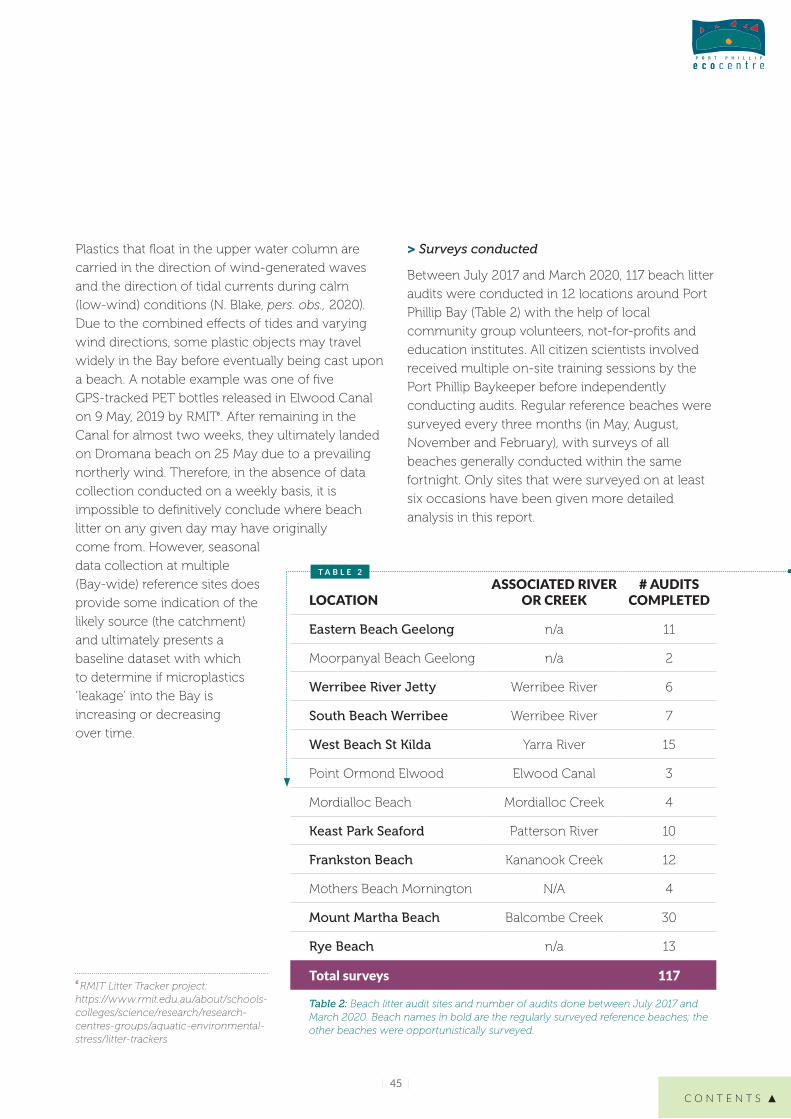
Surveys conducted 45
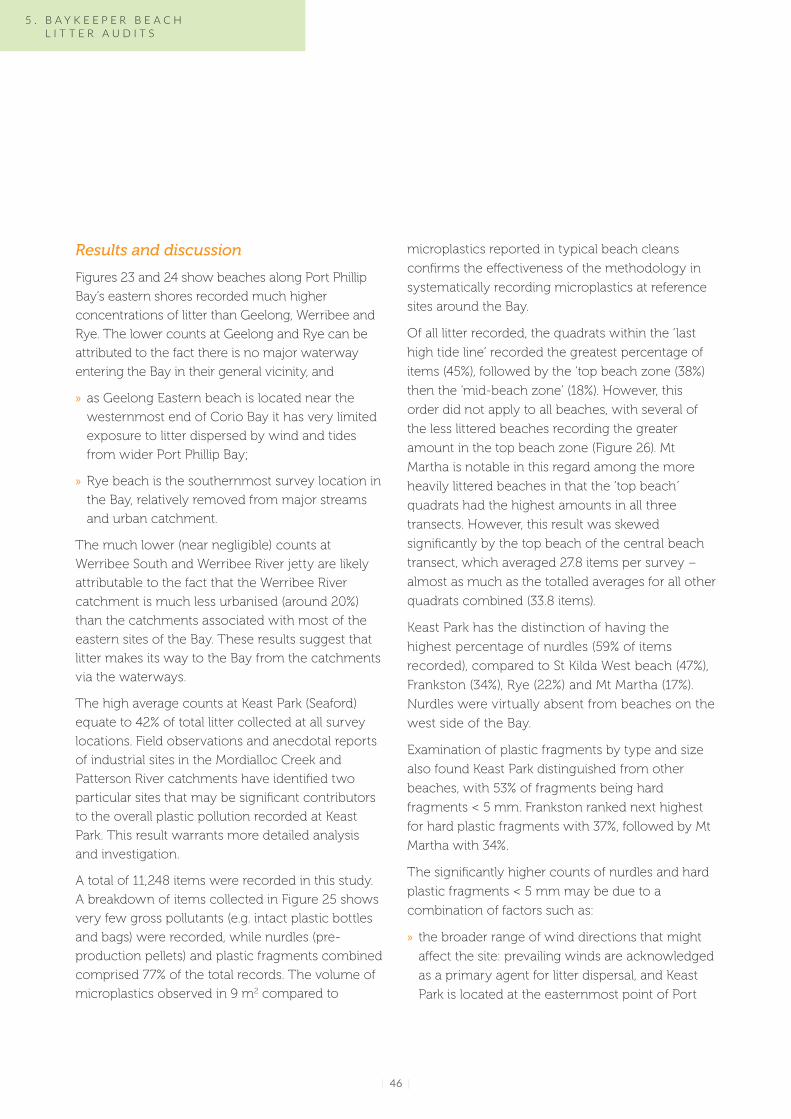
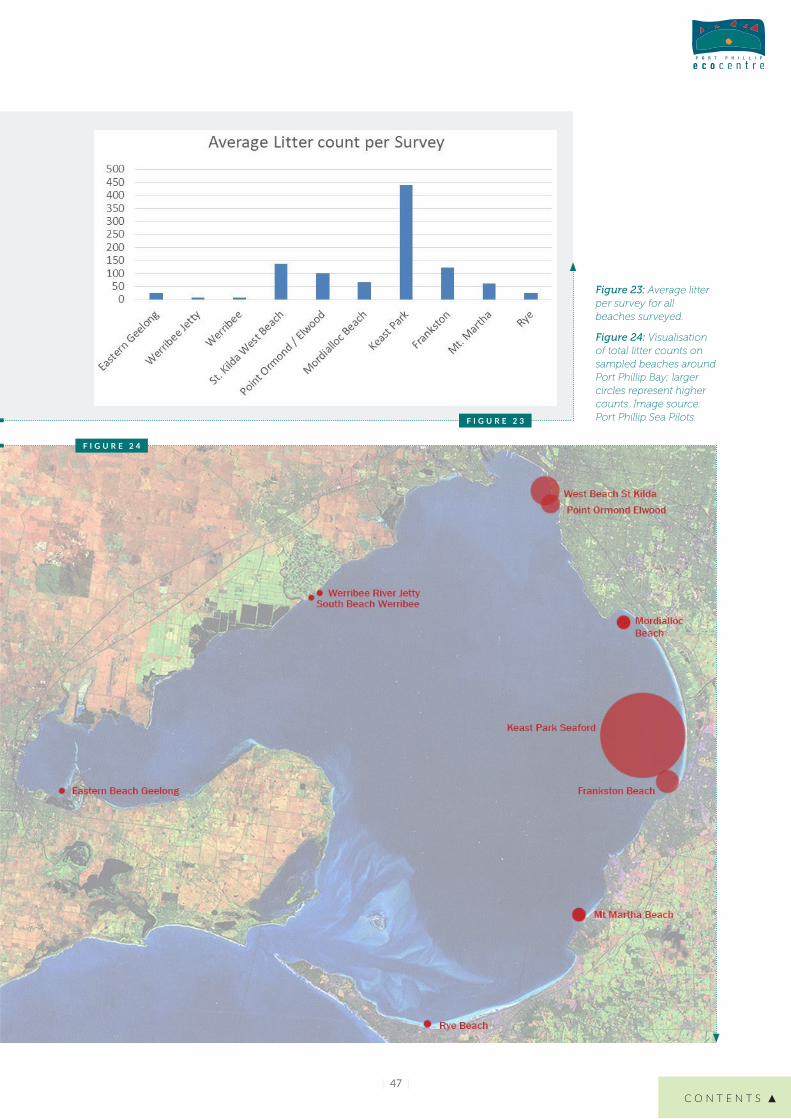
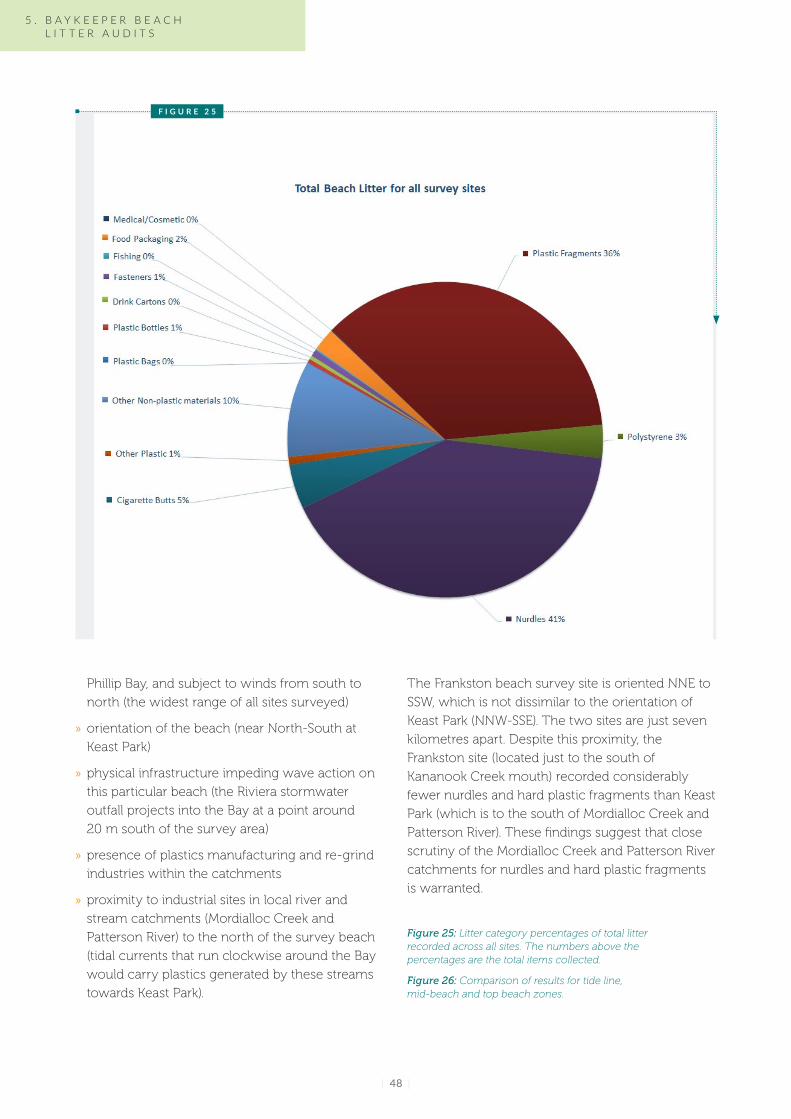
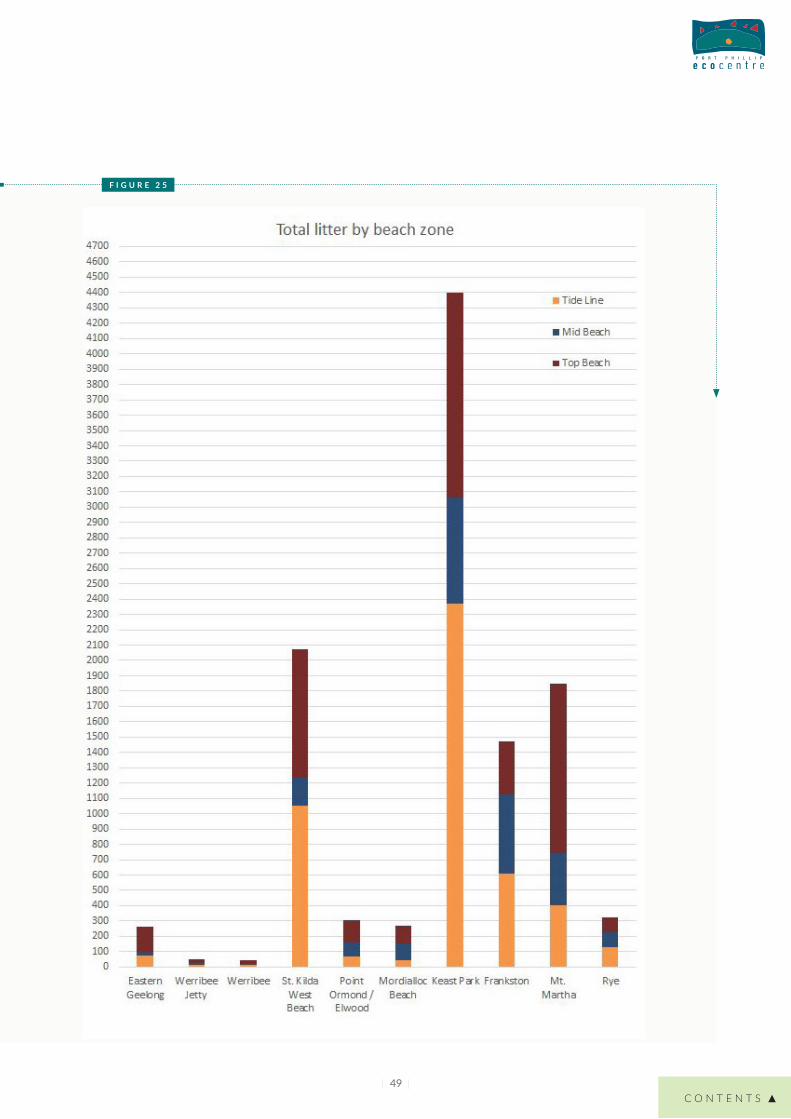
Results and discussion46
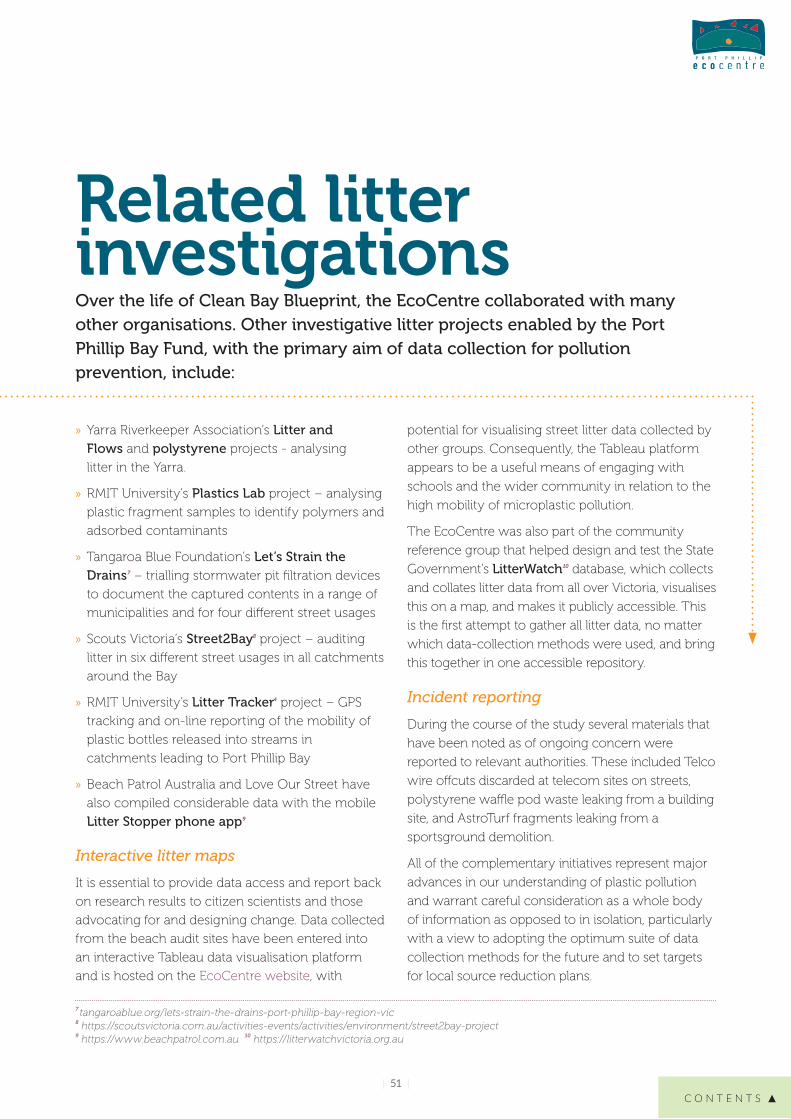
6 Related litter investigations 50
Interactive litter maps 51
Incident reporting 51
7 Recommendations 52
Recommendation 1 Improve product stewardship 54
Recommendation 2 Cultivate effective partnerships 55
Recommendation 3Support local councils in waste management 55
Recommendation 4 Continue monitoring (micro)plastic pollution56
Recommendation 5 Increase education and lsquoplastic literacyrsquo of all plastic users 56
Recommendation 6 Conduct further research 57
8 A note on citizen science 58
9 Acknowledgements 60
Appendices 62Appendix 1 62
Appendix 2 63
Appendix 3 64
Appendix 4 65
Appendix 5 66
Appendix 6 67
References 68
Contents
St Kilda breakwater Port Phillip Bay
1
C O N T E N T S
| 5 |
Clean Bay Blueprint is a three-year litter study conducted between July 2017 and June 2020 The project was funded by the Victorian Governmentrsquos Port Phillip Bay Fund as part of their commitment to deliver the Port Phillip Bay
Environmental Management Plan 2017ndash2027 (Port Phillip Bay EMP) The aims of Clean Bay Blueprint are conducting rigorous and replicable methods to quantify plastic pollution through microplastics trawls and beach litter audits engaging the community in citizen science activities and building partnerships with other organisations that target litter and Bay health A range of complementary investigations were undertaken in parallel to the projectrsquos primary research and where appropriate such activities as well as peer-reviewed research inform the Clean Bay Blueprint recommendations
Microplastics in the Yarra and Maribyrnong rivers
The potential for microplastic pollution to harm
aquatic life is recognised by scientists as a global
problem Microplastics are classified as pieces of
plastic smaller than 5 mm in diameter which
originate from broken-up larger plastic products
This study highlights the pervasiveness of plastics
in our urban water catchments and reflects their
ubiquitous use mobility and extreme persistence
The trawls removed a total of 40030 litter items
from the surface waters of the Yarra and 13658
litter items from the surface waters of the
Maribyrnong River In total over 25 billion litter items flow into Port Phillip Bay annually from the two riversrsquo surface waters Over 2 billion (85) of these items are microplastics Microplastics
accounted for 85 and 83 of the total litter count
in the Yarra and Maribyrnong respectively
In both rivers the vast bulk of the litter caught
consisted of hard plastic remnants of broken-up
plastic items followed by polystyrene and soft
plastics Polystyrene is more problematic in the
Yarra whereas the Maribyrnong carries relatively
more nurdles plastic bottle caps plastic straws
twine and cigarette butts
Although large variations in monthly collections
were noted through the entire study period it was
found the Yarra River carries significantly more litter
than the Maribyrnong
An alarming result of this study is that litter is
increasing in both the Maribyrnong and the Yarra
with plastic pollution in the Yarra increasing at a
much faster rate The rate at which plastic pollution
in both rivers is increasing is very high litter in the
Yarra increased by 400 in 2017 compared to 2016
and then in 2019 it again more than doubled
compared to 2018 levels The Maribyrnong saw a
more gradual increase over time but still increased
by around 57 to 83 year on year since 2017
Executive summary
| 7 || 6 |
Interestingly plastic straws is the only litter item
category declining over time This is most likely due
to community advocacy and action by retailers to
reduce their use showing that community action
and individual behaviour change work
Microplastics trawls in the Bay
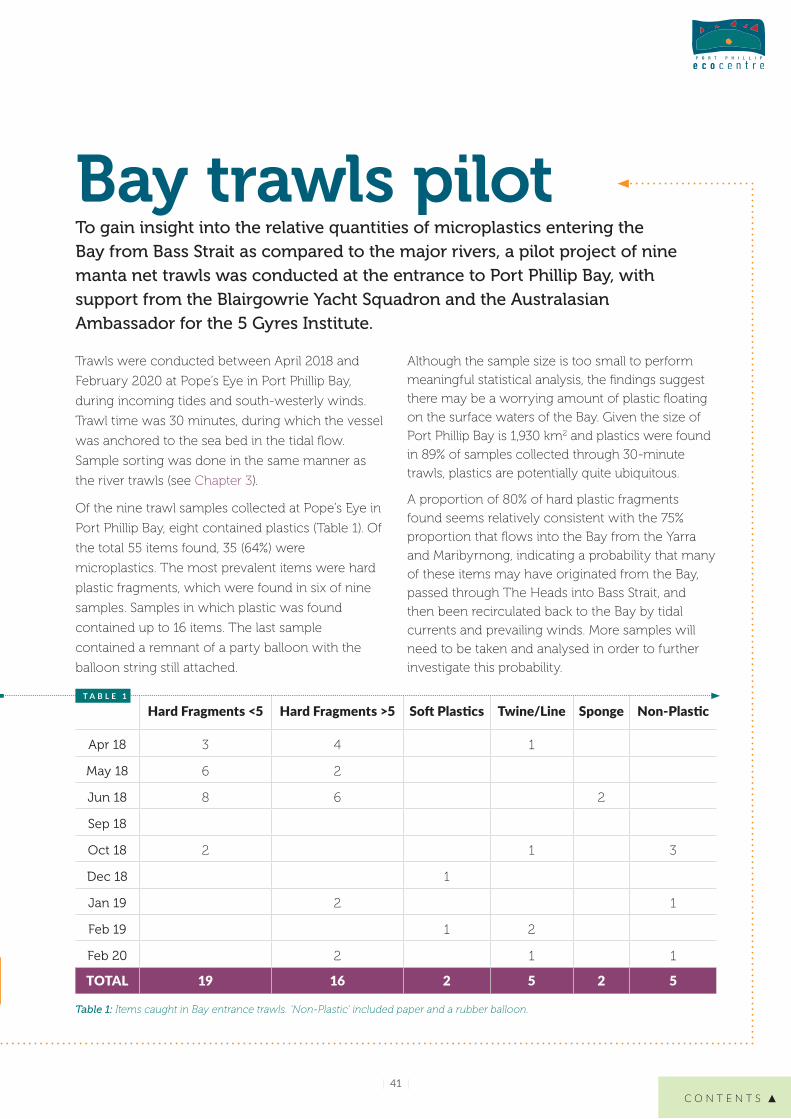
To gain insight into the relative quantities of
microplastics entering the Bay from Bass Strait as
compared to the major rivers a pilot project of nine
manta net trawls was conducted at the entrance to
Port Phillip Bay
Of the nine trawl samples collected at Popersquos Eye in
Port Phillip Bay eight contained plastics
Microplastics made up 64 of samples The most
prevalent items were hard plastic fragments which
aligns with results from the river trawls and
Baykeeper beach litter audits
Baykeeper Beach Litter Audits
The Baykeeper Beach Litter Audit is a citizen
science method designed to focus on microplastic
pollution Twelve beaches around the Bay were
surveyed multiple times with the help of various
community groups Hard plastic fragments and
nurdles were the most recorded items
Recommendations
In view of the high quantities of litter and
microplastics recorded in this study the negative
effects plastic pollution may have on wildlife in
Port Phillip Bay and the potential threat to human
health in the longer term six recommendations for
land managers government industry and
researchers have been formulated based on the
findings in this report
1 Improve product stewardship
11 Transition to a circular economy model
12 Invest in implementing alternatives to plastic
13 Set limits on virgin plastic production
14 Ban broad-scale groups of problematic
single-use plastics
15 Make the Operation CleanSweep program
mandatory
1 E X E C U T I V E S U M M A R Y
| 7 |C O N T E N T S
2 Cultivate effective partnerships
3 Support local councils in waste management 31 Install and maintain pollutant traps in drain
outlets that discharge into creeks and rivers
32 Enforce litter and illegal dumping laws
33 Run effective litter prevention and education
programs
34 Review and improve current street-sweeping
schedules
4 Continue monitoring (micro)plastics pollution
5 Increase education and lsquoplastic literacyrsquo of all plastic users
51 Set standard legal definitions
52 Develop project grants forums and
strategic ongoing partnerships
53 Adequately resource groups who educate
and facilitate action on plastic pollution
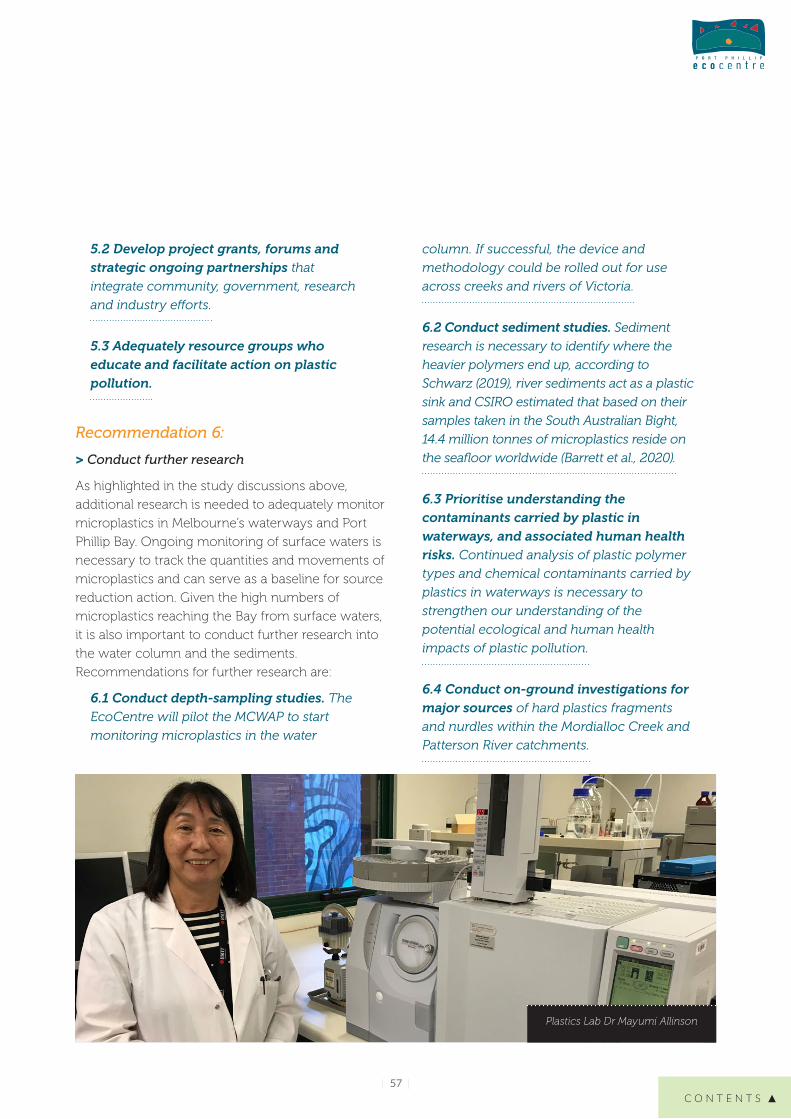
6 Conduct further research 61 Conduct depth-sampling studies
62 Conduct sediment studies
63 Prioritise understanding the contaminants
carried by plastic in waterways and
associated human health risks
64 Conduct on-ground investigations for
major sources
A wide body of research now confirms that the
current pace of rethinking plastics is insufficient to
match the scale of increasing plastic pollution in
our air water soil food chain and human bodies
Substantial changes are justified This study
demonstrates that Melbourne faces an alarming
increase in waterway contamination This poses
particular concern considering the relatively
enclosed configuration of Port Phillip Bay and the
Bayrsquos importance as a recreational fishery
As of July 2021 the jurisdictions studied in Clean
Bay Blueprint are subject to Victoriarsquos legislated
General Environmental Duty to protect the
environment and human health We hope this
studyrsquos baseline data provides government land and
water managers businesses and community with a
clear mandate to invest in reforms that address
plastic pollutionrsquos ongoing threat to Victoriarsquos
economic social and environmental wellbeing
Frankston Pier
2
EcoCentre volunteers conducting a Baykeeper Beach Litter Audit Image Nat Saldumbide
C O N T E N T S
| 9 |
Introductiongt Port Phillip EcoCentre
The Port Phillip EcoCentre (the EcoCentre) is an independent environmental not-for-profit organisation Its mission is to build relationships educate and demonstrate sustainable environmental practice and strengthen peoplersquos connection to the natural world
The EcoCentre is a leading community-managed
organisation with a dedicated team of scientists
educators and volunteers who design and
implement innovative environmental programs Its
expertise is to activate people to look after the
health of Port Phillip Bay and its waterways and
catchments as well as the urban ecology of Greater
Melbourne within the traditional lands and waters
of the Kulin Nation The EcoCentre delivers
specialist education citizen science research and
community action projects with over 250 cross-
sector partners
The EcoCentre is also home to the Port Phillip
Baykeeper who provides an independent voice for
Port Phillip Bay The Baykeeper is affiliated with the
Waterkeeper Alliance (an international network of
waterways protectors) and works closely with the
Yarra Riverkeeper and Werribee Riverkeeper in
protecting their respective waterways each with a
strong local support base
Port Phillip Bay and catchments
Port Phillip Bay is the largest marine embayment in
Victoria with a surface area of 1934 km2 and
333 km of coastline (DELWP 2017) It is relatively
shallow at 13 m average depth and almost half of it
is less than 8 m deep Situated along its northern
shores is the City of Greater Melbourne with a
population of nearly five million people (DELWP
2019) The City of Greater Geelong is located in the
south west
The Bayrsquos catchment area is 9694 km2 with several
rivers creeks and many storm water drains draining
into the Bay (DELWP 2017) The Yarra and
Maribyrnong are the largest of the rivers and flow
through heavily urbanised areas before reaching the
north end of the Bay
| 10 |
Clean Bay Blueprint project
Clean Bay Blueprint is a three-year litter study
conducted between July 2017 and June 2020 The
project was funded by the Victorian Governmentrsquos
Port Phillip Bay Fund as part of its commitment to
deliver the Port Phillip Bay Environmental
Management Plan 2017ndash2027 (Port Phillip Bay EMP)
Clean Bay Blueprint delivers outcomes for the Port
Phillip Bay EMPrsquos Priority Area 4 ndash Litter
Clean Bay Blueprint takes a catchment-to-coast
approach investigating catchment coast and Bay
litter as a whole Litter recognises no geographical
boundaries as it travels from the burbs to the Bay
all areas are connected which makes an integrated
approach to litter research necessary This
integrated approach will help to get a better
understanding of litter prevalence and movement
with the goal of informing local litter source
reduction plans to achieve better environmental
outcomes To gather data from a range of regions
over time a citizen science approach was applied
for community volunteers to collect and contribute
data according to prescribed methods
Project aims
This projectrsquos research methods were designed
primarily to document microplastics which are
defined by Thompson et al (2004) as plastic pieces
between 1 μm and 5 mm in diameter Microplastics
in the environment mostly result from the
inappropriate disposal of consumer products and
industrial by-products and waste that break up into
smaller pieces Their small size renders them
unlikely to be collected in conventional litter traps
by beach-cleaning rakes or manual clean-ups The
Figure 1 Port Phillip Bay and catchment (Image source Port Phillip Bay Environmental Management Plan 2017ndash2027 DELWP 2017)
F I G U R E 1
2 I N T R O D U C T I O N
C O N T E N T S
| 11 |
small size of microplastics causes them to be easily
overlooked when picking up litter even when
clean-ups include a data recording component
Microplastics are recognised as a threat to
waterways and oceans worldwide due to their
small size which makes them easily ingested by
wildlife Clean Bay Blueprint is the latest of the
EcoCentrersquos microplastics research projects which
commenced in 2013 and has refined study
methods in consultation with CSIRO RMIT
University EPA Victoria and others
The three aims of Clean Bay Blueprint are
gt 1 Conducting rigorous and replicable methods
to quantify plastic pollution through
microplastics trawls and beach litter audits
To reflect the catchment-to-coast approach river
and Bay boat trawls as well as land-based litter
audits were conducted The quantification of
microplastics in rivers by trawling is the first research
project of its kind in Australia (see Chapter 3) The
Baykeeper Beach Litter Audits quantify plastics and
microplastics on seven beaches associated with
urbanised stormwater catchments around the Bay
using an audit method that is specifically designed
to collect samples that are representative of all
conditions on a beach and can be performed by
citizen scientists (see Chapter 5)
gt 2 Engaging the community in citizen science
activities
Citizen science is an excellent way of engaging the
community in place-based learning empowering
people to take practical action to create positive
change for the environment as well as regularly
gathering data to track volumes of plastic pollution
over time The Baykeeper Beach Litter Audits
conducted for this project engaged various
community groups schools tertiary students and
individual community members in scientific data
collection education and conversations about plastic
pollution Awareness raised through citizen science
activities is aimed to increase positive behaviour
change in addition to collecting useful data
Evidence to support the case for governments
industry and communities to make changes to
reduce any threatening process will necessarily be
collected systematically over time and space to
confirm the threat is widespread and ongoing The
extent of data collection required over such time
and space would not be achievable without the
contribution of dedicated citizen scientists
gt 3 Building partnerships with other
organisations that target litter and Bay health
Many government environmental and community
organisations have started researching educating
and raising awareness on litter As litter has become
a problematic issue on many different levels
integrated approaches and cross-sector
collaborations are integral to the success of its
reduction in the environment
Over the project life a range of complementary
projects and additional investigations took place
including land surveys data visualisation polymer
analysis of plastic fragments and prototyping a
depth-sampling device to extend surface trawls
Plastic pollution in the global context
Widespread production and consumption of
single-use plastics inadequate waste management
and infrastructure and regulations improper waste
management practices inadequate wastewater
treatment and littering have led to tonnes of marine
plastic pollution entering the ocean on a daily basis
Jambeck et al (2015) estimated that around eight
million metric tonnes of our plastic waste enter the
oceans from land each year often via rivers (Mani
et al 2015)
| 12 |
Two main types of hard microplastics are found
most often in waterways and oceans nurdles and
fragments (Barnes et al 2009) Nurdles also known
as pre-production pellets are the pre-fabrication
material for a wide range of industrial and
consumer plastic products They are classified as
primary plastics and they enter the aquatic
environment mainly through accidental spillage and
poor product management at processing plants
and during transport (Cole et al 2011) They are
spherical or flat-cylindrical in shape and are often
transparent or black although it is not uncommon
to find white red yellow and blue nurdles (picture
1) Hard plastic fragments are known as secondary
microplastics and are derived from the breakup of
larger plastic items They are irregular in shape and
vary greatly in colour due to their primary design
Once in the ocean microplastics can persist for
thousands of years (Andrady 2006) and have been
observed in marine systems worldwide (Cole et al
2011 Barnes et al 2009)
Picture 1 Nurdles (left) and hard plastics fragments (right)
In 2018 alone 359 million metric tonnes of plastic
were produced globally (Statista 2020) and
modelling by Borelle et al (2020) shows that
predicted levels of plastic lost in the environment
will be 53 million metric tonnes per year by 2030 if
no additional action is taken Because of plasticrsquos
durability and extreme mobility (it floats flies and
sinks) it eventually enters our waterways either by
accident or intentionally (Moore and Phillips 2011)
The large litter items frequently captured in this study
including straws lolly wrappers and plastic bottle
caps eventually deteriorate through physical
biological and chemical processes (Andrady 2011)
into tiny fragments that enter Port Phillip Bay at an
alarming rate and can be ingested by aquatic animals
gt Effects on living organisms
Marine plastic pollution has become an urgent
issue affecting wildlife in waterways and oceans
Worldwide at least 690 species have encountered
plastic pollution many of which are listed as
threatened species (Gall and Thompson 2015)
Ingestion of plastic including microplastics can
lead to injury (eg blocked digestive tracts and
organ rupture) and death (Lavers et al 2014)
Furthermore in addition to leachable chemicals
that are added in the manufacturing process itself
plastics adsorb (attract as an exterior film) organic
micro-pollutants or persistent organic pollutants
(POPs) which include polychlorinated biphenyls
(PCBs) Dichlorodiphenyldichloroethylene (DDE) and
nonylphenol (Teuten et al 2009) The ingestion of
these toxic chemicals is known to affect the
physiology and behaviour of organisms which
ultimately affects population stability as shown by
reproductive dysfunctions caused by PCBs in orca
and dolphin populations in Europe (Jepson 2016)
Lamb et al (2018) calculated that the likelihood of
disease in corals that are in physical contact with
plastics increases from 4 to 89 and that by 2025
an estimated 444 billion pieces of plastic items will
be entangled in coral reefs through the Asia-Pacific
Plastic chemicals bioaccumulate and biomagnify
up the food chain (Figure 2) This increasing
P I C T U R E 1
2 I N T R O D U C T I O N
C O N T E N T S
| 13 |
concentration of toxic chemicals in the tissues of
organisms at successively higher levels in a food
chain has been linked to disease and death in
several top predators (Gall and Thompson 2015)
Figure 2 The process of biomagnification of plastic
toxins up the food chain
Relatively few marine and freshwater systems in
Australia have been systematically investigated for
microplastic pollution This is of grave concern
considering coastal and estuarine systems around
Australia are some of the most biodiverse
ecosystems in the world More particularly the
relatively enclosed waters of Port Phillip Bay which
supports an aquaculture industry and a growing
recreational fishery are subject to runoff from
urbanised catchments The potential for marine
plastic pollution to cause environmental harm is
recognised as a global problem and is listed as one of
the greatest threats to marine biodiversity (Gall and
Thompson 2015 Depledge et al 2013) A review of
current understandings of microplastics in the
environment and future research needs by Zeynep
and Basak (2019) concluded that the extent and
effects of microplastic pollution in continental
environments such as rivers lakes soil and air is still
poorly understood Microplastic contamination of
aquatic environments will continue to increase for
the foreseeable future and at present there are
significant knowledge gaps on the occurrence in the
aquatic environment and organisms of the smaller
sized microplastics (less than 150 μm) and their
possible effects on seafood safety (Lusher et al
2017)
Several studies have shown that plastics are now
inside human bodies via our food (Kim et al 2018)
drinking water (Orb Media 2017) and even the air
we breathe (Gasperi et al 2018) It is currently
unknown what if any health effects there are on
human populations (WHO 2019) However in 2019
a research program started in the Netherlands
investigating the potential health effects of ingested
microplastics in humans (ZonMW 2019) Results of
these studies will be released in the near future
gt Climate impacts of plastics
Plastic is linked to climate impacts through
F I G U R E 2
| 14 |
emissions at multiple stages of its lifecycle
Greenhouse gas emissions happen at every step in
the lifecycle of a plastic product the extraction of
fossil fuels and transport plastic refining and
manufacture plastic waste management and the
ongoing impacts of it while polluting the
environment including the oceans (CIEL 2019)
Plastic continues to release greenhouse gases as it
photodegrades when littered (Royer 2018) and
produces methane when degrading in landfills
(Chidambarampadmavathy 2017) Plastic
production also requires large volumes of water in a
world with finite availability of clean freshwater
gt The cost of marine plastic pollution
The following paragraphs are taken from Toxic tide
the threat of marine plastic pollution in Australia a
report delivered to the Federal Senate by the
Environmental amp Communications References
Committee (Commonwealth of Australia 2016)
266 Professor Smith stated that lsquoa key
problem in determining the source of all items
is that fragmented plastics are often the most
numerous and there is no simple way to
determine their sourcersquo Professor Underwood
similarly told the committee that there is
lsquoinsufficient researchrsquo to answer the question
of where marine plastic pollution is sourced
296 Dr Britta Denise Hardesty CSIRO
commented that lsquothe cost of littering and
debris to fisheries small business and
human health remain poorly understood
and littering costs to local government due
to remediation and tourism losses are
substantialrsquo In answer to the committeersquos
questions concerning the estimates of the
damage from marine debris on Australiarsquos
tourism fishing and shipping the
Department of the Environment added that
it did not have any estimates nor did other
Commonwealth agencies including the
Great Barrier Reef Marine Park Authority the
Australian Maritime Safety Authority and the
Australian Fisheries Management Authority
Other than projects funded by the Port Phillip Bay
Fund there has been limited research to address
knowledge gaps in relation to sources and ecosystem
impacts of plastic pollution across Australia since the
release of the Senate Inquiry report in 2016
Plastic pollution in Victoria
Locally Port Phillip Bay and surrounding waters are
supporting an ecosystem that is home to an
estimated 10000 species with many of those
species unique to the Bay1 Most plastic pollution in
Port Phillip Bay originates from land-based sources
Diverse sources include urban streets freeways and
roadside verges stormwater drains wastewater
treatment plants and river and creek runoff
Although plastic pollution has been repeatedly
identified as a major threat to Victorian waterways
there has been limited scientific assessment since
the Melbourne Water Tagged Litter Study in 1993
The EcoCentrersquos Yarra and Maribyrnong river trawls
commenced in 2014 the Litter Trackers project by
RMIT and Melbourne Water was conducted in 2019
and Sustainability Victoria recently conducted a
microplastics study on six beaches around the Bay
In this study they found between 167 and 1232
microscopic microfibres from clothing per kilogram
of sand (Sustainability Victoria 2019)
The Yarra Riverkeeper Association removed
approximately 8000 kg of waste from the Yarra and
Maribyrnong between 2017 and 2020 (Kowalczyk
and Kelly 2020) with some of the most common
collected items being foam insulation and
packaging plastic bottles and cigarette butts Both
this project and their 2020 polystyrene study in
1 httpswwwmarineandcoastsvicgovaugrants port-phillip-bay-fund
2 I N T R O D U C T I O N
C O N T E N T S
| 15 |
A close-up of the Balcombe Estuary nurdles
collaboration with Clean Water Group point to
polystyrene being a major waterway pollutant in
metro Melbourne (Barmand et al 2020)
Community groups such as Beach Patrol Bellarine
Catchment Network various Friends groups and
others across the catchments spend countless
hours of people power cleaning up beaches and
waterways Over the last few years the EcoCentre
has played a role in shifting the general focus from
merely picking up and disposing of the litter to
collecting data on what is found to be used in
advocacy efforts to reduce plastic pollution in the
environment Since February 2018 Scouts Victoria
and the EcoCentre have collaborated in the state
governmentndashfunded Street2Bay project
conducting litter audits with particular attention to
microplastics on streets in all catchments
around the Bay
Bandalong litter trap in the Yarra
| 16 |
Policy context
gt Australia
From 2018 Chinarsquos new bans and 995 purity
standards for uncontaminated recyclables left
Australia with large stockpiles of items now needing
onshore processing Extensive ripple impacts of this
challenge ndash from facility fires to paying fees to send
recyclable plastics to landfill ndash have compelled
significant rethinking of Australian waste
management systems including materials redesign
reduction re-use and recycling Industry bodies
and the Australian Government considered plastics
and other materials in a range of commitments and
aspirations towards an Australian circular economy
in which lsquowastersquo and pollution are designed out
and products and materials are kept in use through
principles such as repair and maximising use of
recycled materials over virgin resources
Australiarsquos National Waste Policy Less waste more
resources (Commonwealth of Australia 2018) and
National Waste Policy Action Plan (2019) apply the
lsquoprinciples of a circular economy to waste
management to support better and repeated use of
our resourcesrsquo The targets include reducing
Australian waste by 10 per capita by 2030 and to
lsquophase out problematic and unnecessary plastics by
2025rsquo Waste policies focus on plastic diversion from
landfill however plastic uncontained by
management systems (eg lost as litter dumping or
spillage) becomes pollution of ecological and
economic concern due to its persistence in the
environment On 18 June 2015 the Senate referred
the threat of marine plastic pollution in Australia for
parliamentary inquiry and report by 8 April 2016
The final report Toxic tide the threat of marine
plastic pollution in Australia was presented on 20
April 2016 (Commonwealth of Australia 2016) The
need for systematic data collection on the extent of
plastic pollution was stated in Recommendation 1
of the report
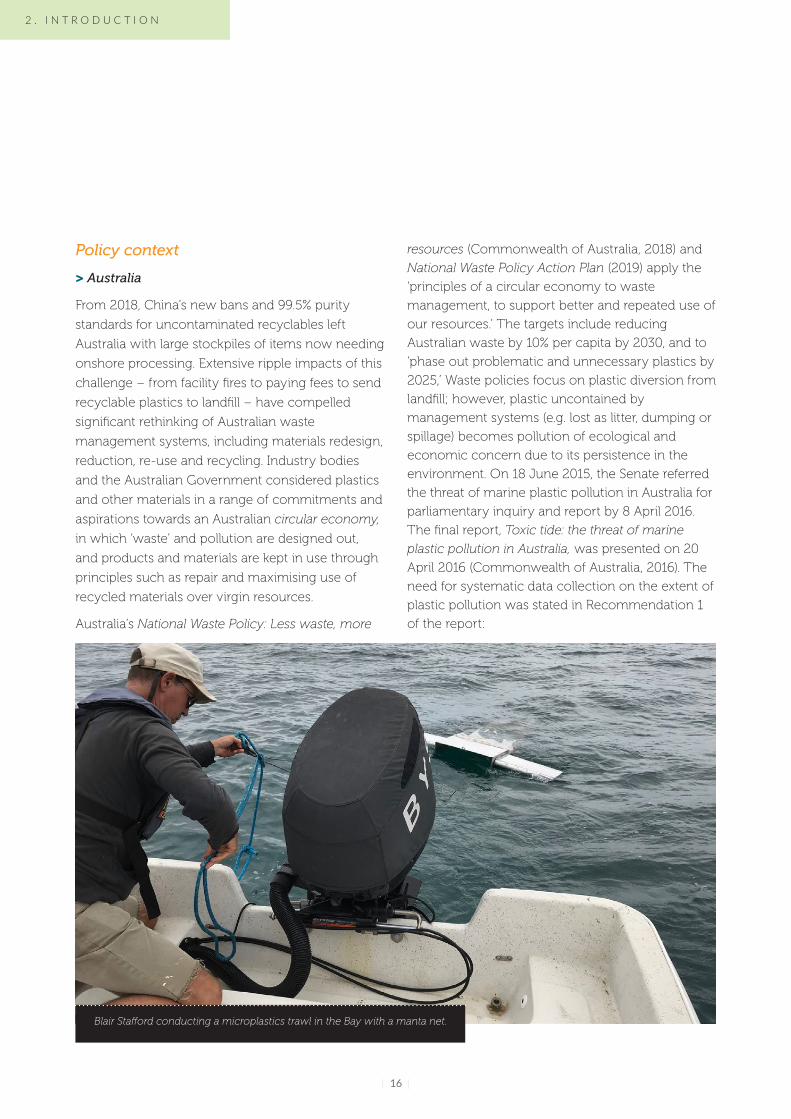
Blair Stafford conducting a microplastics trawl in the Bay with a manta net
2 I N T R O D U C T I O N
C O N T E N T S
| 17 |
2 httpsnicholasinstitutedukeeduplastics-policy-inventory
The committee recommends that any future
Australian Government policies on mitigating
the threat from marine plastic be underpinned
by sound peer-reviewed research
gt Victoria
Plastic pollution is relevant under a range of Victorian
policies and strategies to manage waste and protect
human health and biodiversity In some instances
plastic pollution is discussed explicitly as in the
plastic bag ban (Environment Protection
Amendment Act 2019) or Recycling Victoria lsquoKey
Commitment 3 Address plastics pollutionrsquo Managing
plastics can also fall under broader principles such as
the goal lsquoVictoriarsquos natural environment is healthyrsquo in
Biodiversity 2037 the lsquowastes hierarchyrsquo principle of
environmental protection in the Environmental
Protection Act Victoria (1970) and the introduction of
General Environmental Duty in the Environment
Protection Amendment Act 2018 The General
Environmental Duty requires all Victorians to manage
risks to human health and the environment that their
activities create and becomes active from July 2021
Studies that quantify the effects and extent of
microplastics are necessary to inform policy
frameworks that reduce plastic pollution establish
waterway management strategies and assess
biodiversity health Interim results of the Clean Bay
Blueprint study have helped inform government
documents including
raquo State of the Yarra and its Parklands (2018) ndash
Commissioner for Environmental Sustainability
Victoria
raquo Assessment of the Values of Victoriarsquos Marine
Environment (2019) ndash Victorian Environmental
Assessment Council
A written submission by the EcoCentre to the 2018
review of the State Environment Protection Policy
(Waters) using the results of EcoCentre
microplastics studies led to lsquoplastics and
microplasticsrsquo being added to the list of legally
defined waterway pollutants in Victoria
Prior to the EcoCentrersquos research plastic and
microplastic pollution were not reported in
Victorian State of the Environment reports nor
specifically included in legislated protections
gt Worldwide
The United Nations Sustainable Development Goals
(SDGs) are 17 interlinked goals to achieve lsquoa better and
more sustainable future for allrsquo The management of
plastic materials relates to several SDGs
raquo Goal 12
Responsible production and consumption
raquo Goal 13 Climate action
raquo Goal 14 Life below water
raquo Goal 15 Life on land
The United Nations Environment Programme
(UNEP) has produced numerous studies on plastic
pollution and prevention in the last five years
Assessing policy efforts in 60 countries around the
globe the UNEP reports Single-Use Plastics
Roadmap to Sustainability (2018) includes ten
recommendations including (1) target the most
problematic single-use plastics by collecting
baseline data (5) raise public awareness (7) provide
incentives to industry and (9) enforce new
measures effectively
In 2020 Duke University launched a Plastics Policy
Inventory2 as a searchable database of public policy
documents targeting plastic pollution This includes
the language year enacted location and
jurisdictional level This document is updated
quarterly due to the rapidly evolving nature of policy
responses to address the health economic and
amenity threats of plastic and microplastic pollution
Melbourne City over the Yarra River
3
C O N T E N T S
| 19 |
Microplastics in the Yarra and Maribyrnong RiversThe first ever litter trawls done in rivers in Australia were conducted by the EcoCentre in 2013 The resulting report Pilot study to identify the extent of
microplastics in the Maribyrnong and Yarra Rivers and Port Phillip Bay (July 2014) showed that microplastics were present in Melbournersquos two largest rivers As a result of this pilot study monthly trawls were continued through the Turn off the Tap project (2014ndash2017) funded by the Victorian Government The final samples of this study spiked in microplastic litter which seemed to show an upward trend over time indicating further investigation was warranted Subsequently the Port Phillip Bay Fund funded Clean Bay Blueprint (2017ndash2020) for another three years of continuous research This report presents analysis of the outputs from both these projects and uses the full 55 years of data collected
Aims of the microplastics study
Within Clean Bay Blueprint the quantification of
plastics and microplastics in Melbournersquos two largest
rivers was done as a contained research study
which continued from a previous dataset collected
between 2015 and 2017 Its aims were the following
gt Quantifying plastic pollution to inform
legislative reform and behaviour change
When trawls commenced in 2014 there was no
reported evidence of the ongoing presence of
microplastic pollution in the rivers and Bay apart
from personal observations As legislative reform
and management decisions around litter need to be
driven by scientific evidence the first aims of the
study were to confirm the presence and quantify
the extent of the pollution
gt Tracking changes in litter over time and
establishing a baseline
Once presence is established the next step is to
monitor litter loads over time in order to track if
volumes increase or decrease Continuous
monitoring measures a baseline state of the river
which can be used to measure the effectiveness of
anti-litter measures taken to reduce the loss of
certain items in the environment In addition
monitoring allows researchers to notice unusual
spikes in litter loads or items that may have been
the result of mass spills and one-off pollution
events and might otherwise go unnoticed
gt Identifying the source of litter items
By tracking and quantifying the different litter items
encountered (eg polystyrene balls plastic drinking
straws cigarette butts) it may be possible to identify
| 20 |
their potential source locations This evidence could
be used to inform localised source reduction plans to
prevent an item type from entering the environment
in the first place Anecdotally known problem items
were analysed as distinct categories to learn more
about their prevalence in the waterways
Study method
gt Study site
The Yarra River flows 242 km from its source in the
forested Yarra Ranges National Park through to
central Melbourne where it enters Port Phillip Bay
More than one-third of Victoriarsquos population lives in
the Yarra catchment which covers about 4000 km2
(Barua et al 2013) The catchment includes 40
rivers and creeks including the Maribyrnong River
which runs for 160 km from its source on the
slopes of Mount Macedon The Maribyrnong
catchment covers 1408 km2
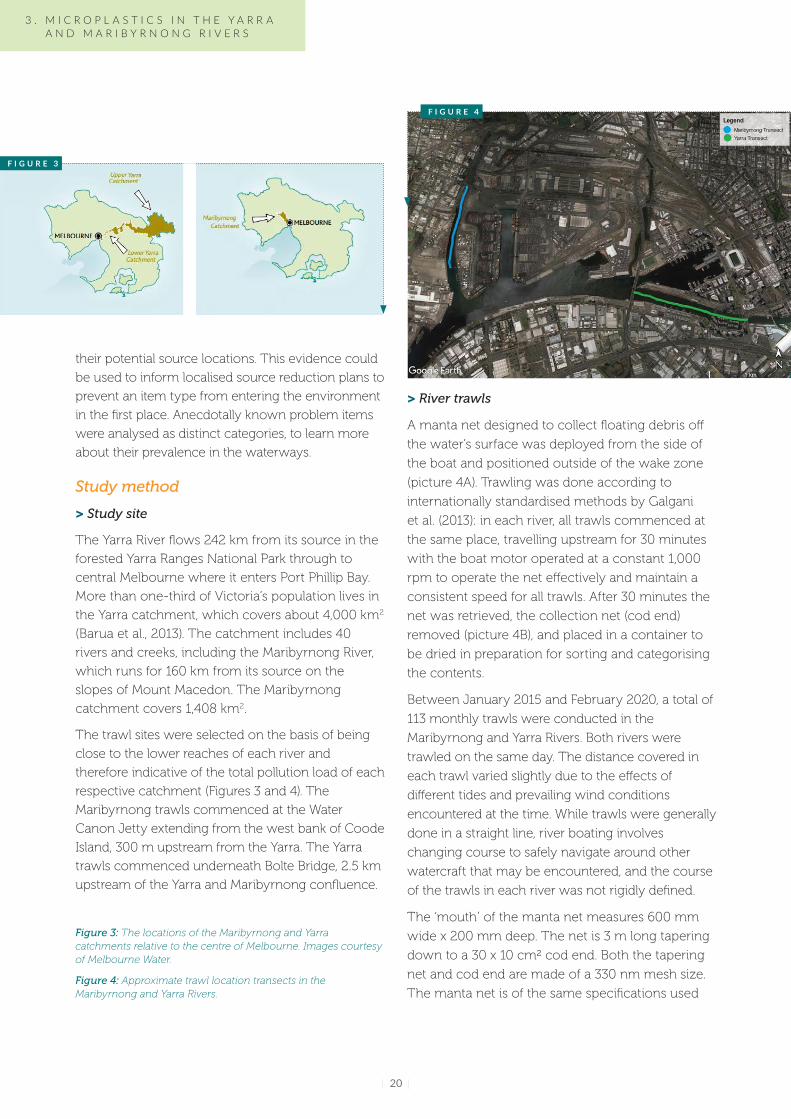
The trawl sites were selected on the basis of being
close to the lower reaches of each river and
therefore indicative of the total pollution load of each
respective catchment (Figures 3 and 4) The
Maribyrnong trawls commenced at the Water
Canon Jetty extending from the west bank of Coode
Island 300 m upstream from the Yarra The Yarra
trawls commenced underneath Bolte Bridge 25 km
upstream of the Yarra and Maribyrnong confluence
Figure 3 The locations of the Maribyrnong and Yarra catchments relative to the centre of Melbourne Images courtesy of Melbourne Water
Figure 4 Approximate trawl location transects in the Maribyrnong and Yarra Rivers
gt River trawls
A manta net designed to collect floating debris off
the waterrsquos surface was deployed from the side of
the boat and positioned outside of the wake zone
(picture 4A) Trawling was done according to
internationally standardised methods by Galgani
et al (2013) in each river all trawls commenced at
the same place travelling upstream for 30 minutes
with the boat motor operated at a constant 1000
rpm to operate the net effectively and maintain a
consistent speed for all trawls After 30 minutes the
net was retrieved the collection net (cod end)
removed (picture 4B) and placed in a container to
be dried in preparation for sorting and categorising
the contents
Between January 2015 and February 2020 a total of
113 monthly trawls were conducted in the
Maribyrnong and Yarra Rivers Both rivers were
trawled on the same day The distance covered in
each trawl varied slightly due to the effects of
different tides and prevailing wind conditions
encountered at the time While trawls were generally
done in a straight line river boating involves
changing course to safely navigate around other
watercraft that may be encountered and the course
of the trawls in each river was not rigidly defined
The lsquomouthrsquo of the manta net measures 600 mm
wide x 200 mm deep The net is 3 m long tapering
down to a 30 x 10 cmsup2 cod end Both the tapering
net and cod end are made of a 330 nm mesh size
The manta net is of the same specifications used
3 M I C R O P L A S T I C S I N T H E Y A R R A A N D M A R I B Y R N O N G R I V E R S
F I G U R E 4
F I G U R E 3
C O N T E N T S
| 21 |
by the 5 Gyres Institute to measure microplastics in
international studies In a recent review of methods
that measure microplastics in aquatic
environments Mai et al (2018) confirmed that this
collection method is recommended for large-scale
surface water sampling
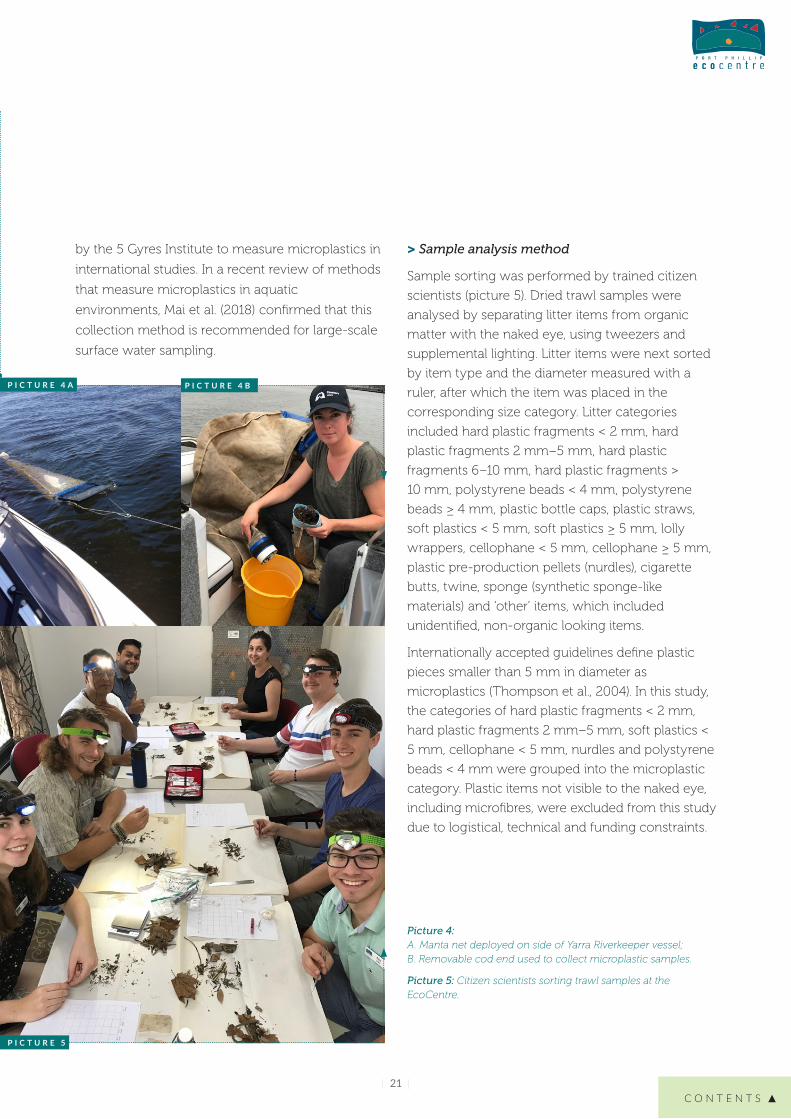
gt Sample analysis method
Sample sorting was performed by trained citizen
scientists (picture 5) Dried trawl samples were
analysed by separating litter items from organic
matter with the naked eye using tweezers and
supplemental lighting Litter items were next sorted
by item type and the diameter measured with a
ruler after which the item was placed in the
corresponding size category Litter categories
included hard plastic fragments lt 2 mm hard
plastic fragments 2 mmndash5 mm hard plastic
fragments 6ndash10 mm hard plastic fragments gt
10 mm polystyrene beads lt 4 mm polystyrene
beads ge 4 mm plastic bottle caps plastic straws
soft plastics lt 5 mm soft plastics ge 5 mm lolly
wrappers cellophane lt 5 mm cellophane ge 5 mm
plastic pre-production pellets (nurdles) cigarette
butts twine sponge (synthetic sponge-like
materials) and lsquootherrsquo items which included
unidentified non-organic looking items
Internationally accepted guidelines define plastic
pieces smaller than 5 mm in diameter as
microplastics (Thompson et al 2004) In this study
the categories of hard plastic fragments lt 2 mm
hard plastic fragments 2 mmndash5 mm soft plastics lt
5 mm cellophane lt 5 mm nurdles and polystyrene
beads lt 4 mm were grouped into the microplastic
category Plastic items not visible to the naked eye
including microfibres were excluded from this study
due to logistical technical and funding constraints
Picture 4 A Manta net deployed on side of Yarra Riverkeeper vessel B Removable cod end used to collect microplastic samples
Picture 5 Citizen scientists sorting trawl samples at the EcoCentre
P I C T U R E 5
P I C T U R E 4 A P I C T U R E 4 B
| 22 |
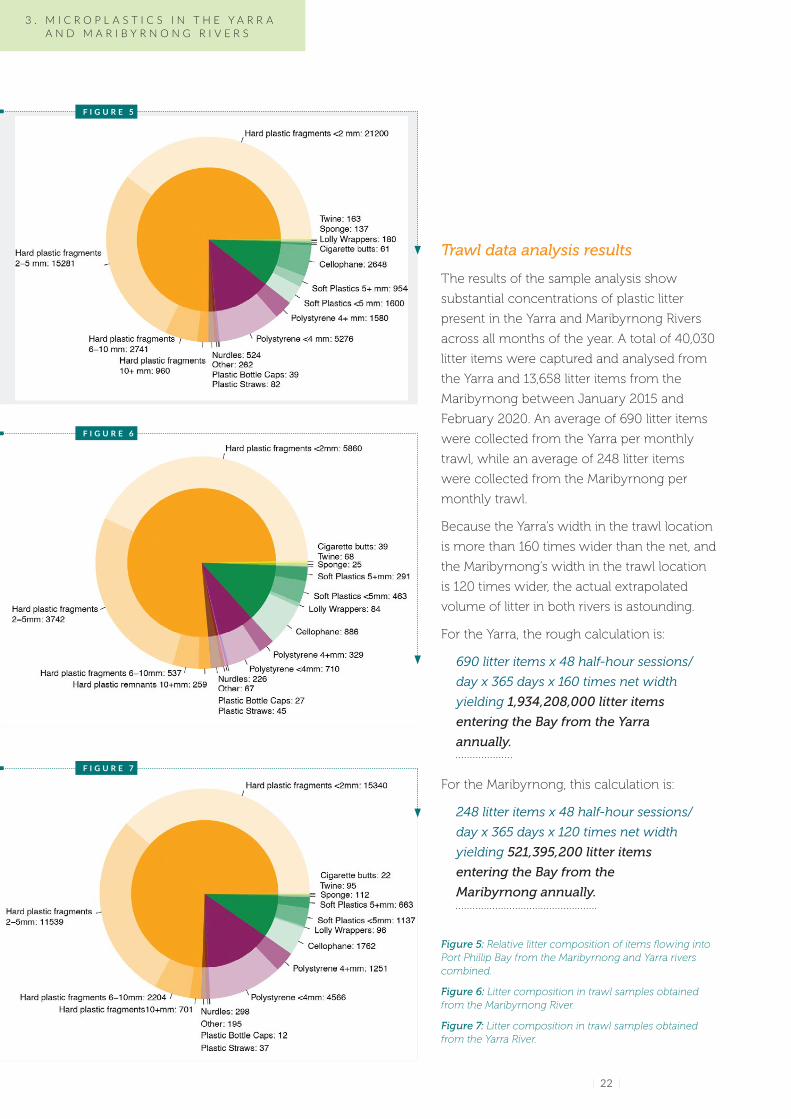
Trawl data analysis results
The results of the sample analysis show
substantial concentrations of plastic litter
present in the Yarra and Maribyrnong Rivers
across all months of the year A total of 40030
litter items were captured and analysed from
the Yarra and 13658 litter items from the
Maribyrnong between January 2015 and
February 2020 An average of 690 litter items
were collected from the Yarra per monthly
trawl while an average of 248 litter items
were collected from the Maribyrnong per
monthly trawl
Because the Yarrarsquos width in the trawl location
is more than 160 times wider than the net and
the Maribyrnongrsquos width in the trawl location
is 120 times wider the actual extrapolated
volume of litter in both rivers is astounding
For the Yarra the rough calculation is
690 litter items x 48 half-hour sessions
day x 365 days x 160 times net width
yielding 1934208000 litter items
entering the Bay from the Yarra
annually
For the Maribyrnong this calculation is
248 litter items x 48 half-hour sessions
day x 365 days x 120 times net width
yielding 521395200 litter items
entering the Bay from the
Maribyrnong annually
Figure 5 Relative litter composition of items flowing into Port Phillip Bay from the Maribyrnong and Yarra rivers combined
Figure 6 Litter composition in trawl samples obtained from the Maribyrnong River
Figure 7 Litter composition in trawl samples obtained from the Yarra River
F I G U R E 5
F I G U R E 7
F I G U R E 6
3 M I C R O P L A S T I C S I N T H E Y A R R A A N D M A R I B Y R N O N G R I V E R S
C O N T E N T S
| 23 |
These calculations suggest that an average total of
2455603200 litter items flow into Port Phillip
Bay annually from surfaces of the Yarra and
Maribyrnong Rivers combined
It should be noted that since these litter items are
only caught in the surface waters (upper 200 mm)
this number is likely to be an underestimation of the
overall plastic pollution loading in each river
Different types of plastic display different levels of
buoyancy characterised as either positively
buoyant (floating at the surface) negatively buoyant
(sinks to the bottom) or neutrally buoyant (in the
water column) It is unknown how many items are
present in the water column or the sediments of
Melbournersquos waterways
gt Litter reaching Port Phillip Bay
Based on the 53688 litter items caught and
analysed the composition of litter entering Port
Phillip Bay shows that hard plastic fragments are by
far the most prevalent litter item (75) followed by
polystyrene (13) and soft plastics (10) (Figure 5)
Trawl samples weighed an average of
approximately 266 g most of which was organic
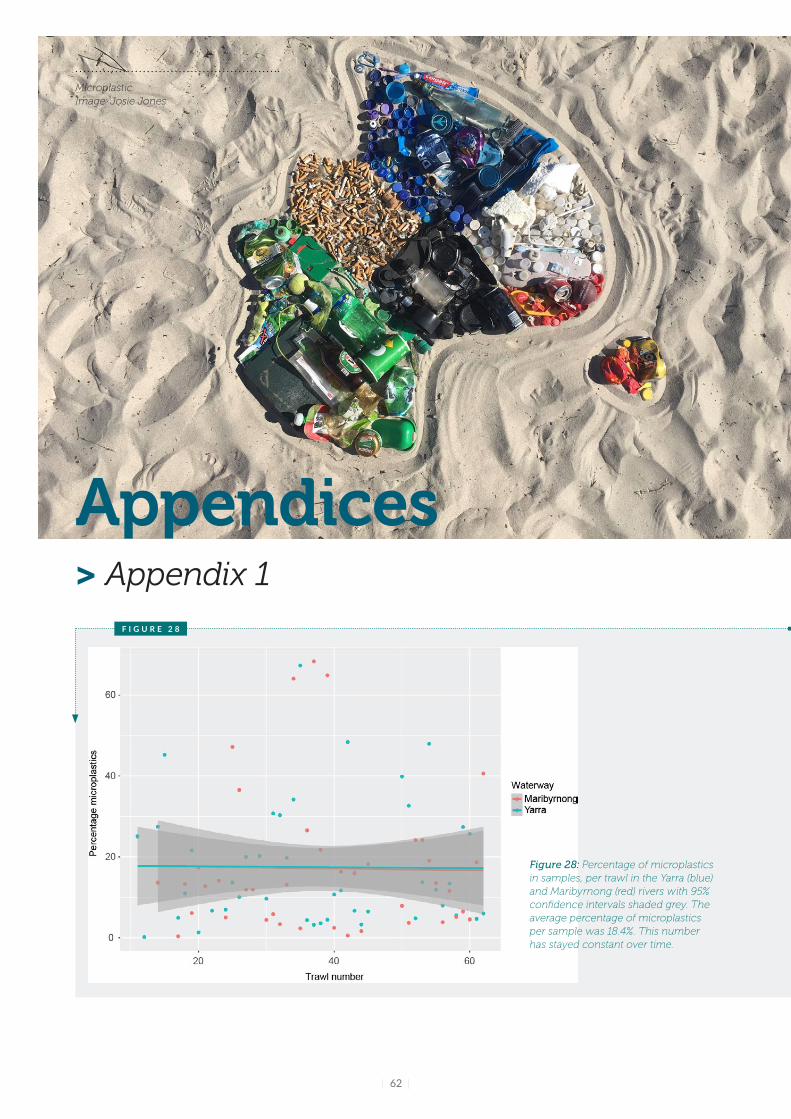
plant matter On average litter comprised 184 of
the total sample weight highlighting the
pervasiveness of litter in our waterways Over time
this percentage has stayed quite constant (see
Appendix 1)
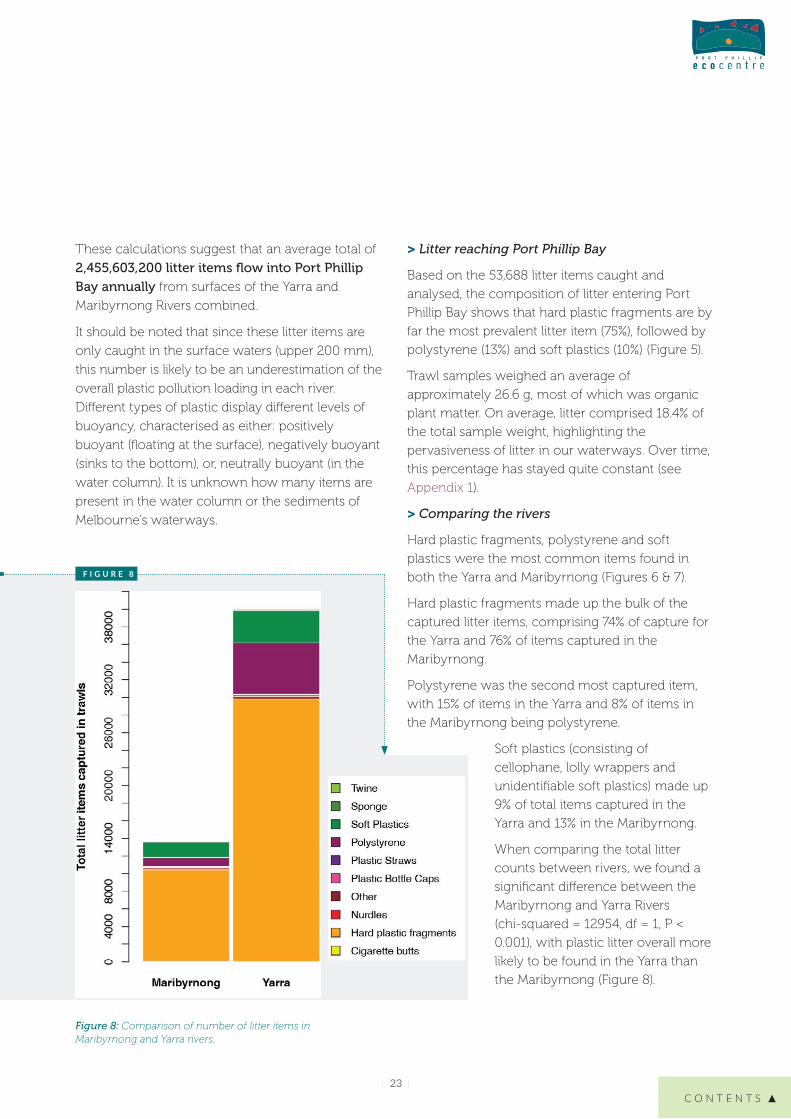
gt Comparing the rivers
Hard plastic fragments polystyrene and soft
plastics were the most common items found in
both the Yarra and Maribyrnong (Figures 6 amp 7)
Hard plastic fragments made up the bulk of the
captured litter items comprising 74 of capture for
the Yarra and 76 of items captured in the
Maribyrnong
Polystyrene was the second most captured item
with 15 of items in the Yarra and 8 of items in
the Maribyrnong being polystyrene
Soft plastics (consisting of
cellophane lolly wrappers and
unidentifiable soft plastics) made up
9 of total items captured in the
Yarra and 13 in the Maribyrnong
When comparing the total litter
counts between rivers we found a
significant difference between the
Maribyrnong and Yarra Rivers
(chi-squared = 12954 df = 1 P lt
0001) with plastic litter overall more
likely to be found in the Yarra than
the Maribyrnong (Figure 8)
F I G U R E 8
Figure 8 Comparison of number of litter items in Maribyrnong and Yarra rivers
| 24 |
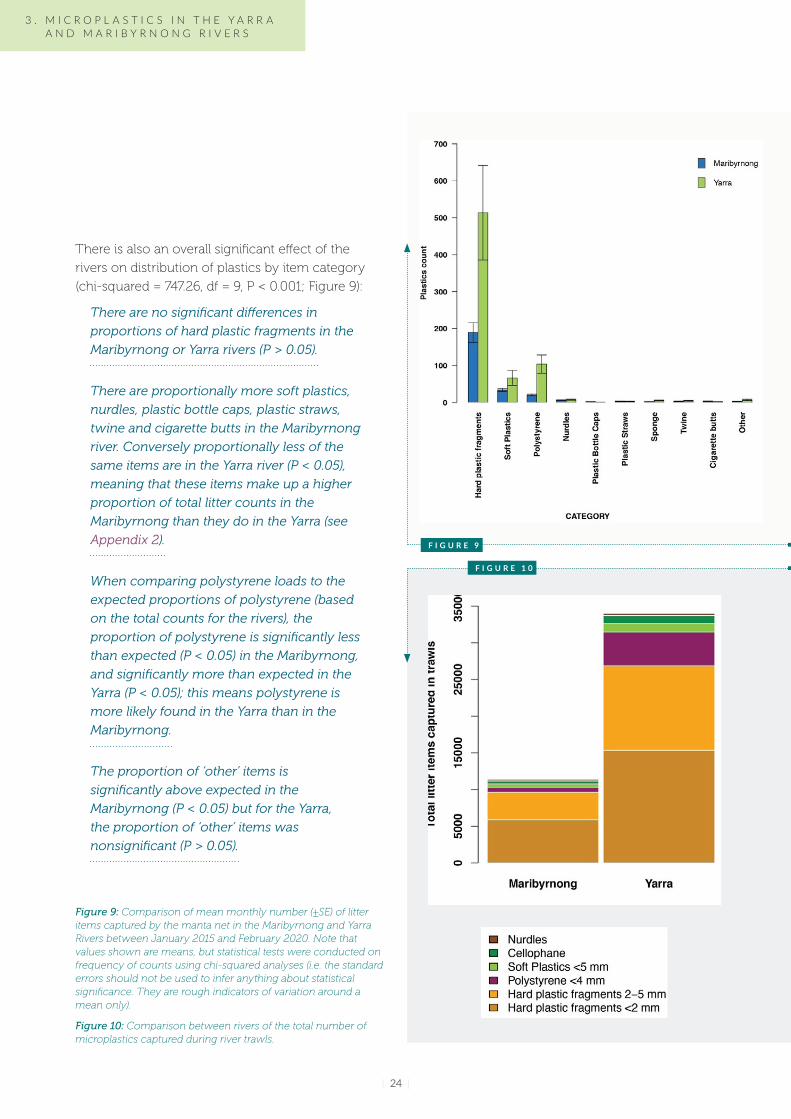
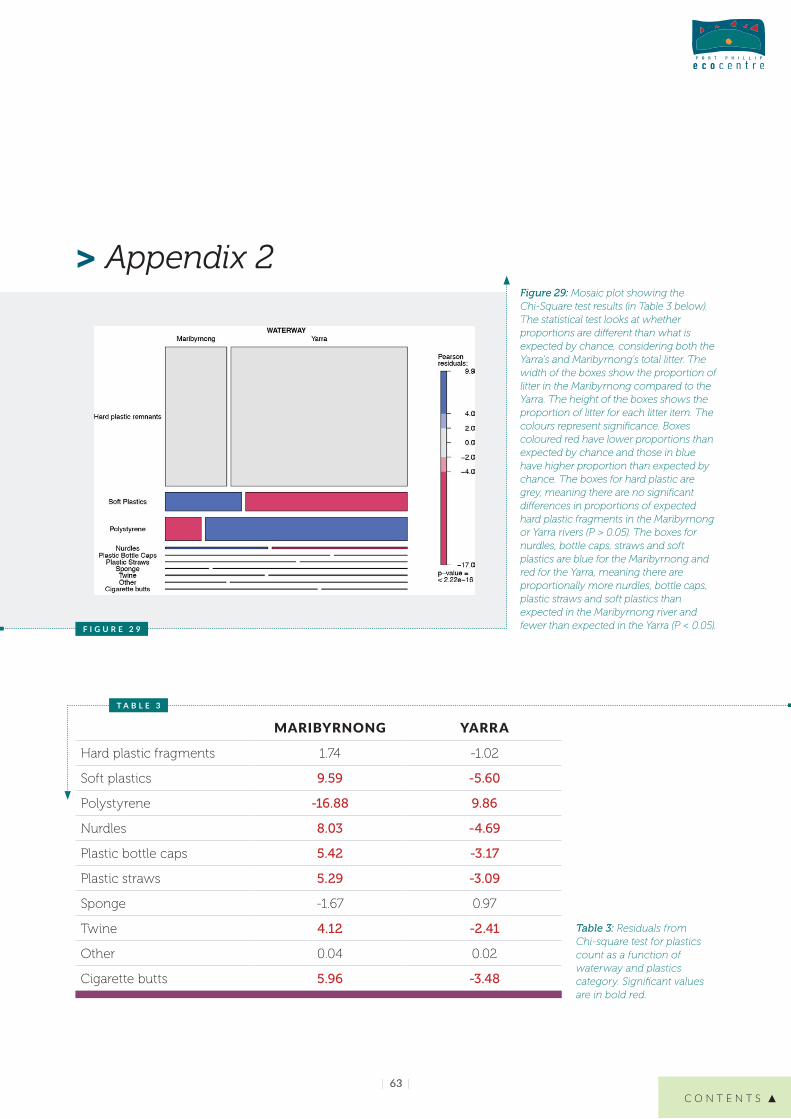
There is also an overall significant effect of the
rivers on distribution of plastics by item category
(chi-squared = 74726 df = 9 P lt 0001 Figure 9)
There are no significant differences in
proportions of hard plastic fragments in the
Maribyrnong or Yarra rivers (P gt 005)
There are proportionally more soft plastics
nurdles plastic bottle caps plastic straws
twine and cigarette butts in the Maribyrnong
river Conversely proportionally less of the
same items are in the Yarra river (P lt 005)
meaning that these items make up a higher
proportion of total litter counts in the
Maribyrnong than they do in the Yarra (see
Appendix 2)
When comparing polystyrene loads to the
expected proportions of polystyrene (based
on the total counts for the rivers) the
proportion of polystyrene is significantly less
than expected (P lt 005) in the Maribyrnong
and significantly more than expected in the
Yarra (P lt 005) this means polystyrene is
more likely found in the Yarra than in the
Maribyrnong
The proportion of lsquootherrsquo items is
significantly above expected in the
Maribyrnong (P lt 005) but for the Yarra
the proportion of lsquootherrsquo items was
nonsignificant (P gt 005)
F I G U R E 9
F I G U R E 1 0
Figure 9 Comparison of mean monthly number (plusmnSE) of litter items captured by the manta net in the Maribyrnong and Yarra Rivers between January 2015 and February 2020 Note that values shown are means but statistical tests were conducted on frequency of counts using chi-squared analyses (ie the standard errors should not be used to infer anything about statistical significance They are rough indicators of variation around a mean only)
Figure 10 Comparison between rivers of the total number of microplastics captured during river trawls
3 M I C R O P L A S T I C S I N T H E Y A R R A A N D M A R I B Y R N O N G R I V E R S
C O N T E N T S
| 25 |
In both rivers microplastics formed the bulk of litter
and accounted for 85 (34013 pieces) of the total
load in the Yarra and 83 (11388 pieces) of the
Maribyrnong load (Figure 10) Hard plastic
fragments lt 2 mm in length dominated the
microplastics category and accounted for 45 and
51 of microplastics in the Yarra and Maribyrnong
respectively
Of the earlier mentioned total litter items entering the
Bay microplastics make up nearly 85 which means
more than 2 billion (2076458066) microplastics flow
from the two rivers into the Bay every year
gt Analysis of plastic polymer types
Sorted trawl samples from July 2016 to August 2019
were sent to the Plastics Lab at RMIT where they
were analysed for plastic polymer types using
Fourier Transform Infrared Spectroscopy (FTIR)3
There are many polymer types each of which has
varying qualities that align it to typical uses
products or applications Through FTIR analysis
microplastics or fragments may be grouped
according to probable source products
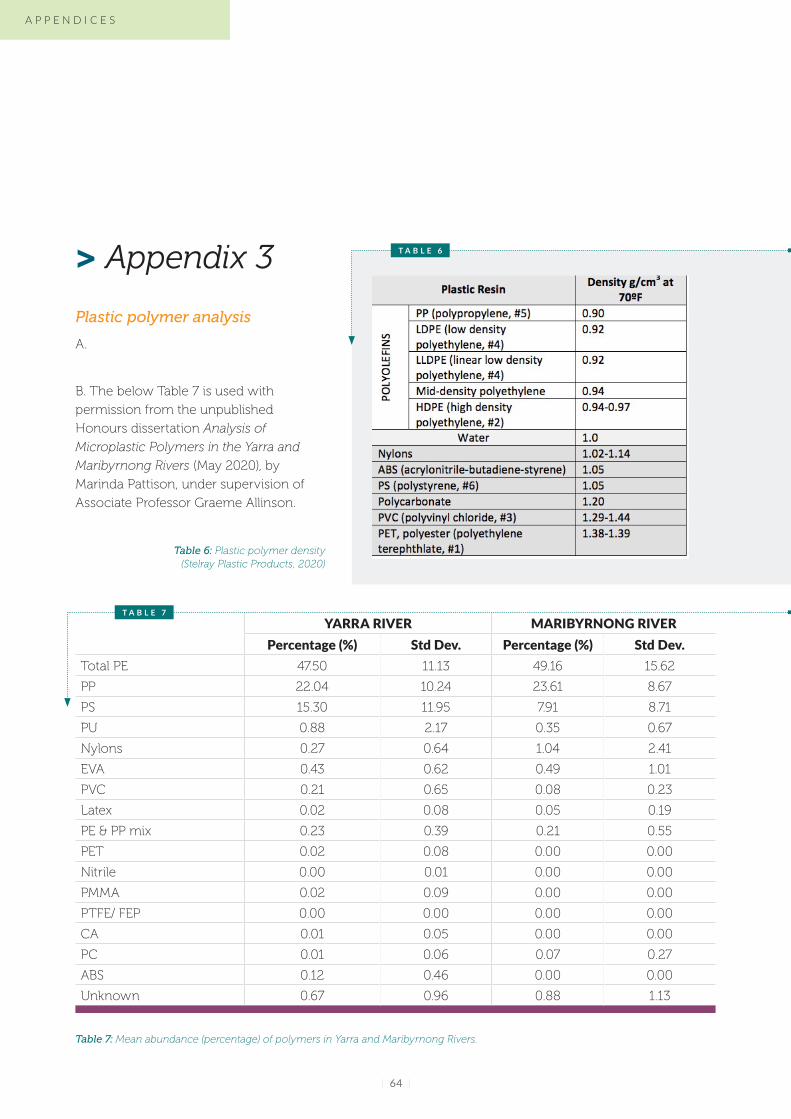
In both the Yarra and the Maribyrnong rivers
polyethylene (PE) was the most prevalent polymer
(48 and 49 respectively) followed by
polypropylene (PP) (22 and 24 respectively)
polystyrene (PS) (15 and 79 respectively)
The Yarra River saw small amounts of 11 other
polymers each of which contributed less than 1
and 067 of samples were of an unknown
material The Maribyrnong saw a small abundance
of other polymers ranging from 1 to 005 and
had 088 of unknown material (see Appendix 3)
The two rivers showed similar trends over the
months for all three of the most prevalent polymers
The abundance of PE and PP did not statistically
differ between the Yarra and Maribyrnong (P = 067
P = 056 respectively) however PS was statistically
lower in the Maribyrnong (P = 002)
Interestingly polyethylene terephthalate (PET) and
polyvinylchloride (PVC) are some of the most
commonly produced and used plastics yet were
some of the least recorded in both the Yarra and
Maribyrnong Rivers
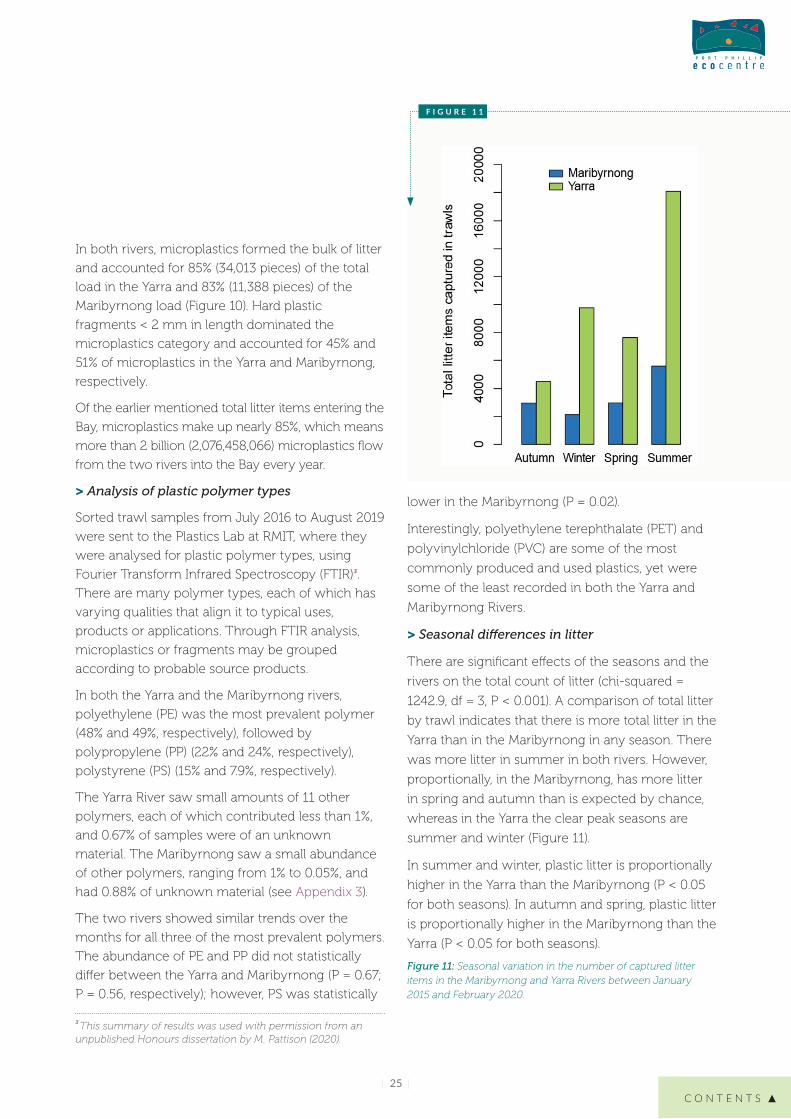
gt Seasonal differences in litter
There are significant effects of the seasons and the
rivers on the total count of litter (chi-squared =
12429 df = 3 P lt 0001) A comparison of total litter
by trawl indicates that there is more total litter in the
Yarra than in the Maribyrnong in any season There
was more litter in summer in both rivers However
proportionally in the Maribyrnong has more litter
in spring and autumn than is expected by chance
whereas in the Yarra the clear peak seasons are
summer and winter (Figure 11)
In summer and winter plastic litter is proportionally
higher in the Yarra than the Maribyrnong (P lt 005
for both seasons) In autumn and spring plastic litter
is proportionally higher in the Maribyrnong than the
Yarra (P lt 005 for both seasons)
Figure 11 Seasonal variation in the number of captured litter items in the Maribyrnong and Yarra Rivers between January 2015 and February 2020
3 This summary of results was used with permission from an unpublished Honours dissertation by M Pattison (2020)
F I G U R E 1 1
| 26 |
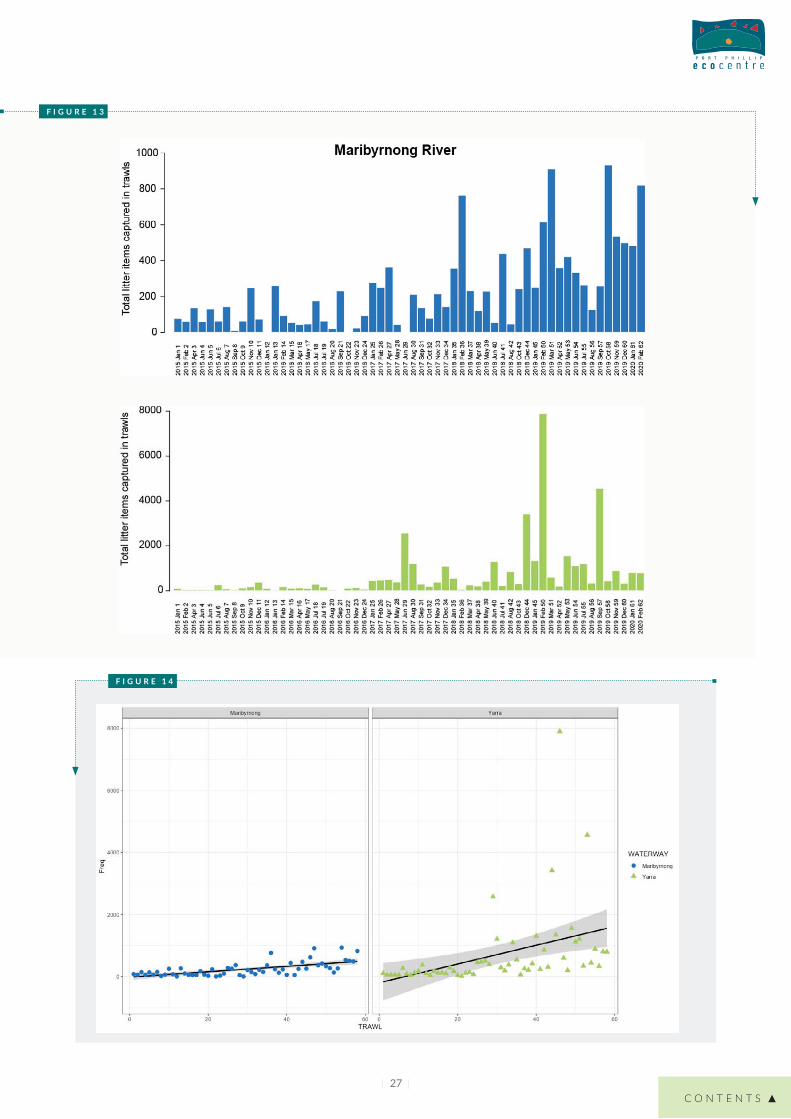
gt Changes in litter over time
The five years of data collection reveal large
increases in litter over time (Figure 13) Note the
difference in numbers on the y-axes when
comparing the rivers
Both rivers are showing a significant increase in
plastics over the sampling period although the trend
is somewhat more pronounced in the Yarra (tau =
017 z = 745 P lt 0001) than in the Maribyrnong (tau
= 010 z = 416 P lt 0001) (Figure 14)
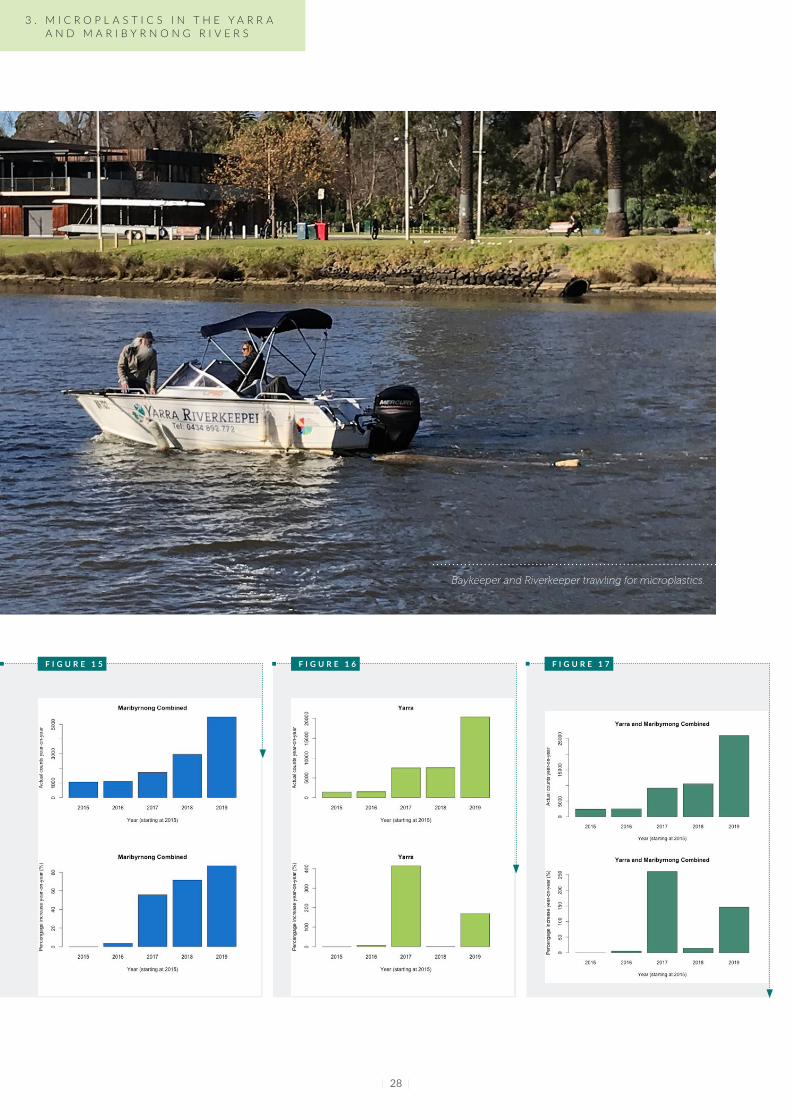
Note the differences in percentages on the y-axes of
the respective rivers in Figures 15 and 16 which
show how much faster the Yarrarsquos litter has been
increasing over the last five years When combining
the above litter numbers and percentages there is a
similar increasing trend in litter en route to Port
Phillip Bay (Figure 17) It is unclear why there was
such an extreme increase in litter in the Yarra in 2017
The above results warranted a closer examination
of the changes in litter item categories over time
In the Maribyrnong hard plastic fragments soft
plastics and lsquootherrsquo are increasing over time
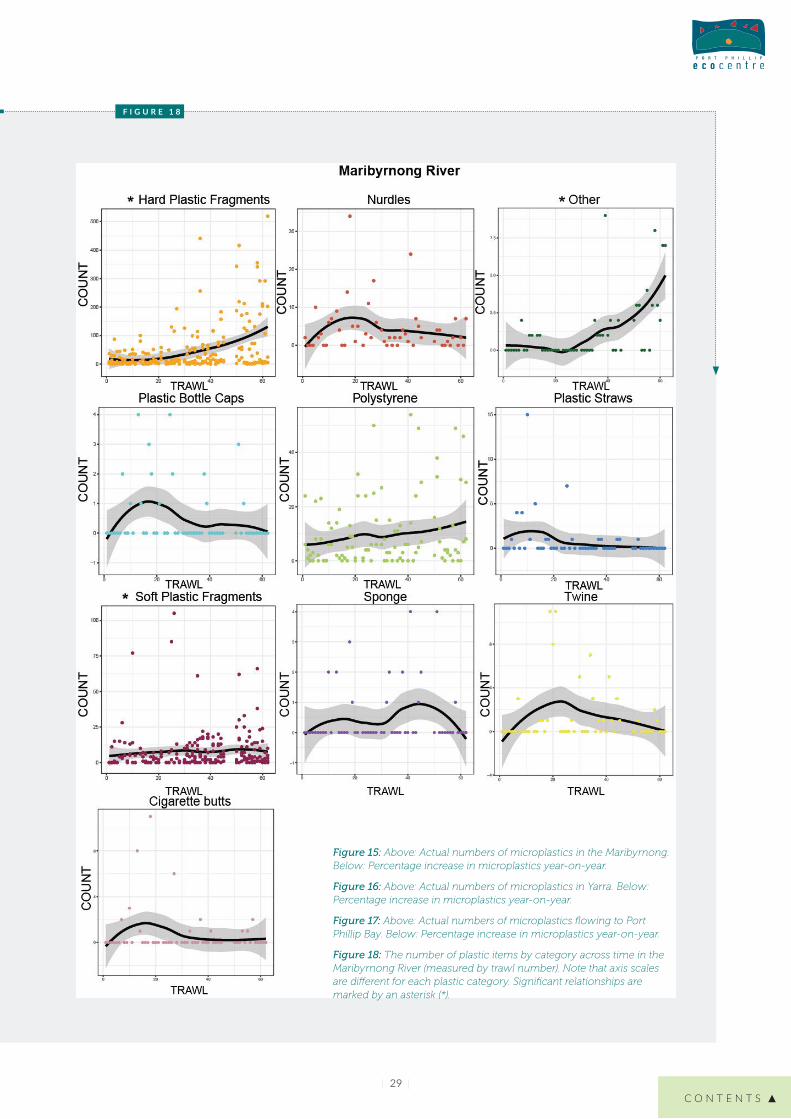
(P lt 005) (Figure 18)
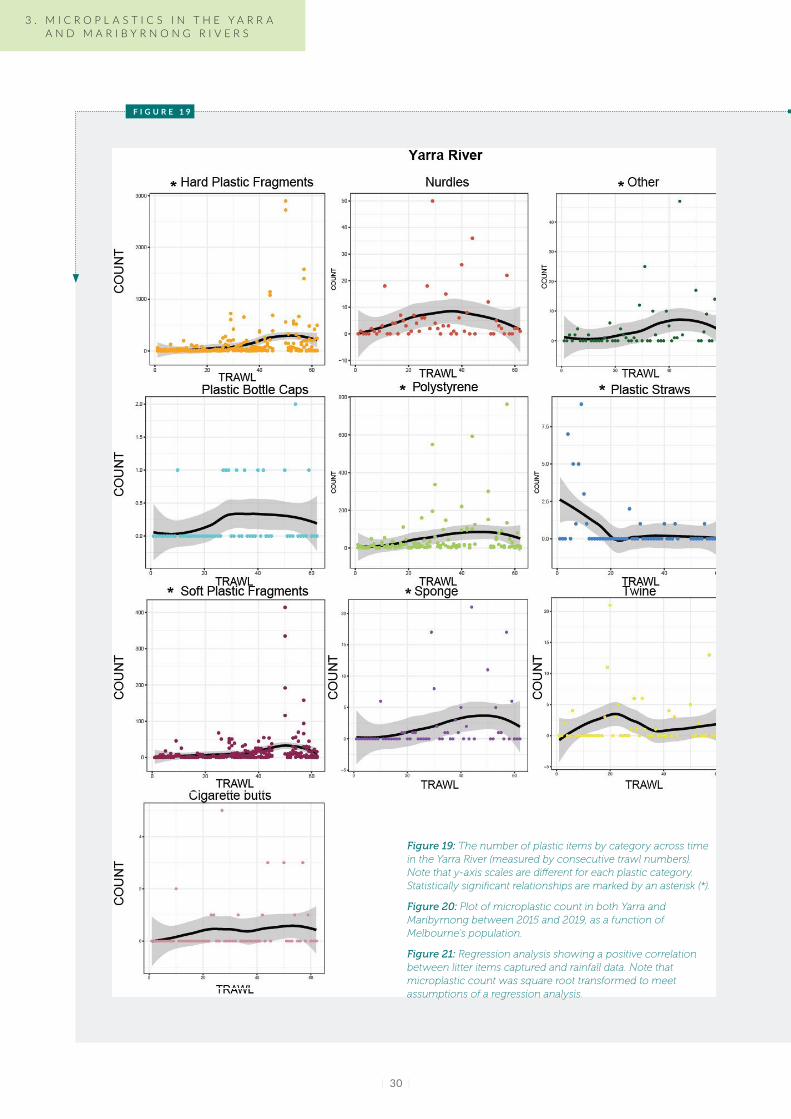
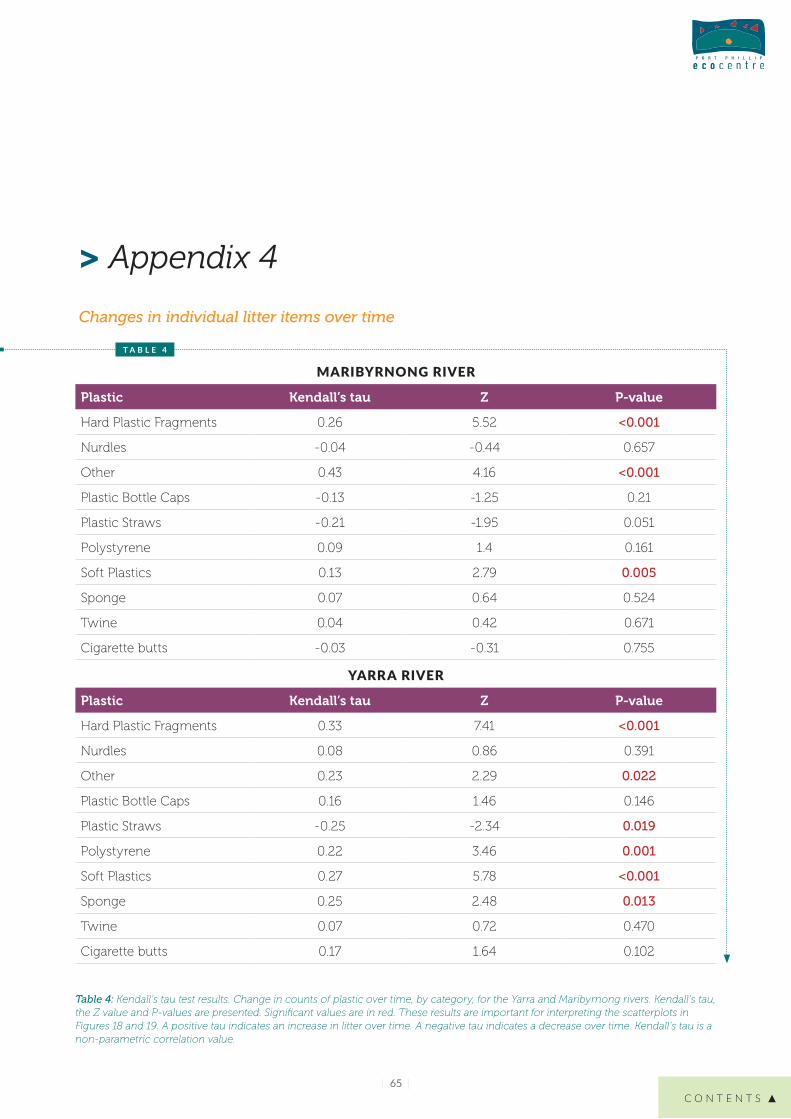
Figure 19 shows that in the Yarra hard plastic
fragments soft plastics polystyrene sponge and
lsquootherrsquo in the Yarra are increasing over time (P lt 005)
However plastic straws are significantly decreasing
over time (z = -234 tau = -025 P = 0019)
All other plastics are steady showing neither a
significant increase nor decrease See Appendix 4
for more details
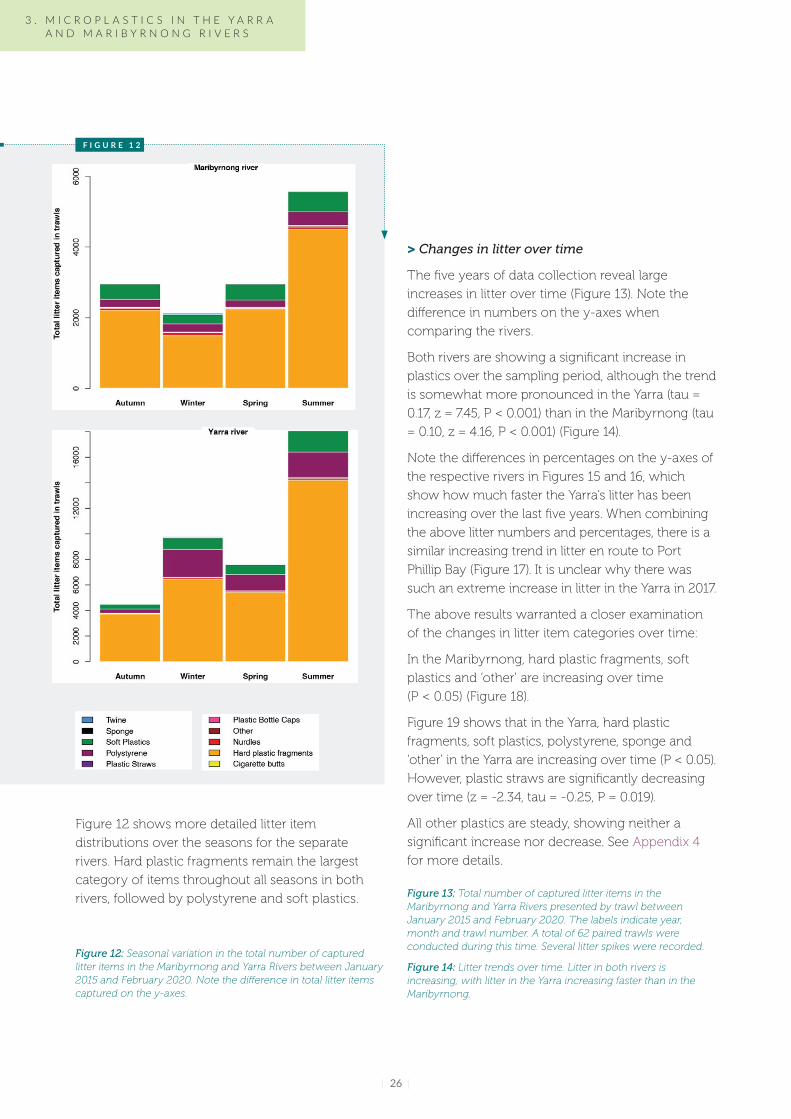
F I G U R E 1 2
Figure 12 shows more detailed litter item
distributions over the seasons for the separate
rivers Hard plastic fragments remain the largest
category of items throughout all seasons in both
rivers followed by polystyrene and soft plastics
Figure 12 Seasonal variation in the total number of captured litter items in the Maribyrnong and Yarra Rivers between January 2015 and February 2020 Note the difference in total litter items captured on the y-axes
Figure 13 Total number of captured litter items in the Maribyrnong and Yarra Rivers presented by trawl between January 2015 and February 2020 The labels indicate year month and trawl number A total of 62 paired trawls were conducted during this time Several litter spikes were recorded
Figure 14 Litter trends over time Litter in both rivers is increasing with litter in the Yarra increasing faster than in the Maribyrnong
3 M I C R O P L A S T I C S I N T H E Y A R R A A N D M A R I B Y R N O N G R I V E R S
C O N T E N T S
| 27 |
F I G U R E 1 3
F I G U R E 1 4
| 28 |
Baykeeper and Riverkeeper trawling for microplastics
F I G U R E 1 5 F I G U R E 1 6 F I G U R E 1 7
3 M I C R O P L A S T I C S I N T H E Y A R R A A N D M A R I B Y R N O N G R I V E R S
C O N T E N T S
| 29 |
Figure 15 Above Actual numbers of microplastics in the Maribyrnong Below Percentage increase in microplastics year-on-year
Figure 16 Above Actual numbers of microplastics in Yarra Below Percentage increase in microplastics year-on-year
Figure 17 Above Actual numbers of microplastics flowing to Port Phillip Bay Below Percentage increase in microplastics year-on-year
Figure 18 The number of plastic items by category across time in the Maribyrnong River (measured by trawl number) Note that axis scales are different for each plastic category Significant relationships are marked by an asterisk ()
F I G U R E 1 8
C O N T E N T S
| 30 |
F I G U R E 1 9
Figure 19 The number of plastic items by category across time in the Yarra River (measured by consecutive trawl numbers) Note that y-axis scales are different for each plastic category Statistically significant relationships are marked by an asterisk ()
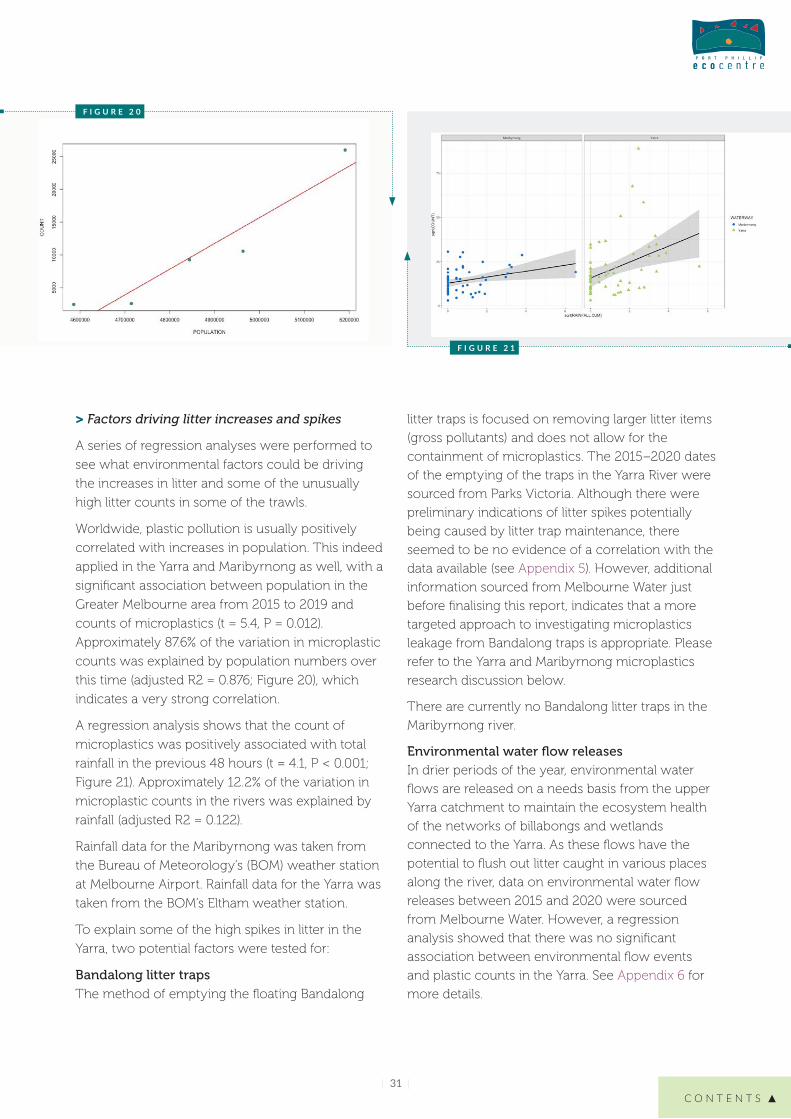
Figure 20 Plot of microplastic count in both Yarra and Maribyrnong between 2015 and 2019 as a function of Melbournersquos population
Figure 21 Regression analysis showing a positive correlation between litter items captured and rainfall data Note that microplastic count was square root transformed to meet assumptions of a regression analysis
3 M I C R O P L A S T I C S I N T H E Y A R R A A N D M A R I B Y R N O N G R I V E R S
C O N T E N T S
| 31 |
gt Factors driving litter increases and spikes
A series of regression analyses were performed to
see what environmental factors could be driving
the increases in litter and some of the unusually
high litter counts in some of the trawls
Worldwide plastic pollution is usually positively
correlated with increases in population This indeed
applied in the Yarra and Maribyrnong as well with a
significant association between population in the
Greater Melbourne area from 2015 to 2019 and
counts of microplastics (t = 54 P = 0012)
Approximately 876 of the variation in microplastic
counts was explained by population numbers over
this time (adjusted R2 = 0876 Figure 20) which
indicates a very strong correlation
A regression analysis shows that the count of
microplastics was positively associated with total
rainfall in the previous 48 hours (t = 41 P lt 0001
Figure 21) Approximately 122 of the variation in
microplastic counts in the rivers was explained by
rainfall (adjusted R2 = 0122)
Rainfall data for the Maribyrnong was taken from
the Bureau of Meteorologyrsquos (BOM) weather station
at Melbourne Airport Rainfall data for the Yarra was
taken from the BOMrsquos Eltham weather station
To explain some of the high spikes in litter in the
Yarra two potential factors were tested for
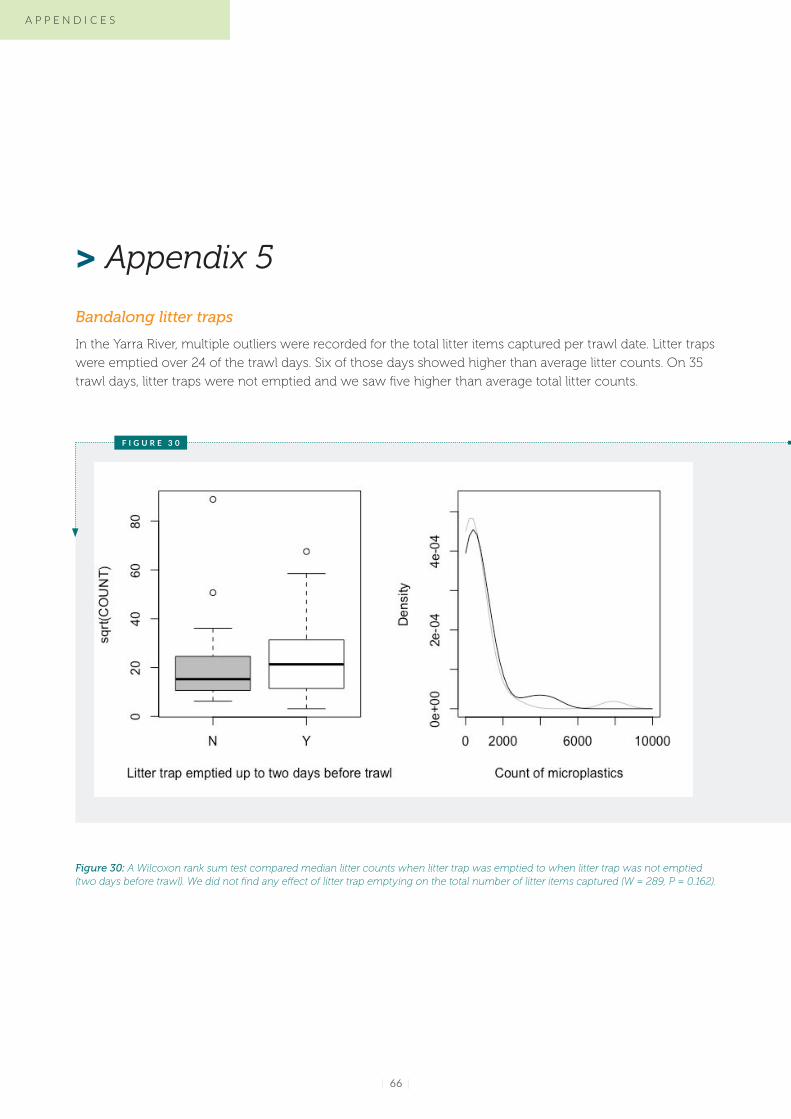
Bandalong litter traps
The method of emptying the floating Bandalong
litter traps is focused on removing larger litter items
(gross pollutants) and does not allow for the
containment of microplastics The 2015ndash2020 dates
of the emptying of the traps in the Yarra River were
sourced from Parks Victoria Although there were
preliminary indications of litter spikes potentially
being caused by litter trap maintenance there
seemed to be no evidence of a correlation with the
data available (see Appendix 5) However additional
information sourced from Melbourne Water just
before finalising this report indicates that a more
targeted approach to investigating microplastics
leakage from Bandalong traps is appropriate Please
refer to the Yarra and Maribyrnong microplastics
research discussion below
There are currently no Bandalong litter traps in the
Maribyrnong river
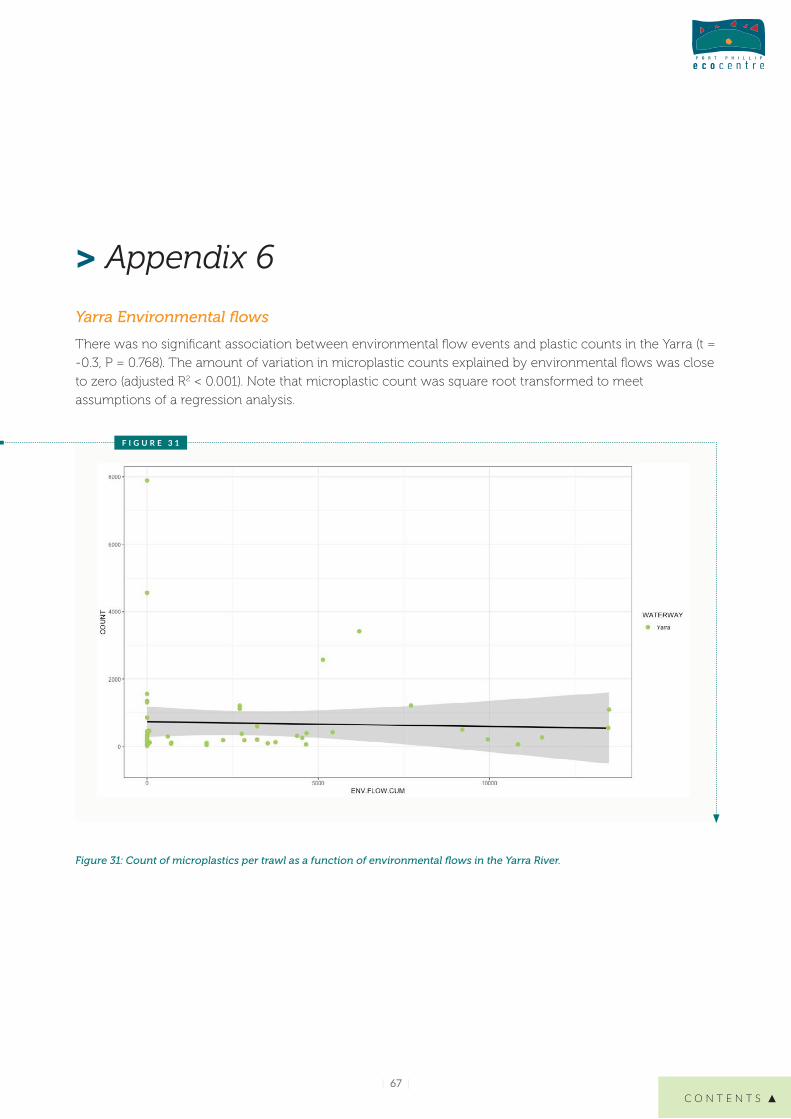
Environmental water flow releases In drier periods of the year environmental water
flows are released on a needs basis from the upper
Yarra catchment to maintain the ecosystem health
of the networks of billabongs and wetlands
connected to the Yarra As these flows have the
potential to flush out litter caught in various places
along the river data on environmental water flow
releases between 2015 and 2020 were sourced
from Melbourne Water However a regression
analysis showed that there was no significant
association between environmental flow events
and plastic counts in the Yarra See Appendix 6 for
more details
F I G U R E 2 0
F I G U R E 2 1
| 32 |
Yarra and Maribyrnong microplastics research discussion
Clean Bay Blueprint and the preceding EcoCentre
projects are the first studies to investigate
microplastic loads in the Yarra and Maribyrnong
Rivers and provide the first estimation of microplastic
loads entering Port Phillip Bay on an annual basis
Every one of the 113 trawl samples analysed
between January 2015 and February 2020 contained
plastic pollution mostly consisting of microplastics
Nearly 25 billion pieces of plastic flow into Port
Phillip Bay annually from the surface waters of the
two major rivers of which over 2 billion are
microplastics smaller than 5 mm in diameter
These results are expected to be underestimations
of the litter volume entering the Bay as it does not
take into account the depth of the river and the fact
that high-density particles with additives or other
attachments and larger items will sink below the
level of trawled surface area (Mai et al 2018
Pattison 2020) As the mesh size of the net was
330 nm and sorting and counting of microplastics
was done with the naked eye particles smaller than
what could be caught in the net or observed and
confirmed as plastics during sorting (including
microfibres and nanoparticles) were not included It
must therefore be emphasised that total plastic
pollution numbers in the rivers are likely to be
much higher than the numbers in this report and
preventative and mitigating actions to reduce
plastic pollution are urgently required
gt Litter increases
An alarming result of this study is that litter is
increasing in both the Maribyrnong and the Yarra
with plastic pollution in the Yarra increasing at a
much faster rate The rate at which plastic pollution
in both rivers is increasing is very high litter in the
Yarra increased by 400 in 2017 compared to 2016
and then in 2019 it again more than doubled
compared to 2018 levels The Maribyrnong saw a
more gradual increase over time but still increased
by around 57 to 83 year on year since 2017
The Yarra exceeded the Maribyrnong in terms of
expected plastic pollution loads in 2016 (Charko
et al 2018) These changes are mostly driven by
increases in hard and soft plastic fragments and
polystyrene rather than the other categories of litter
meaning these are the litter categories that should
be addressed immediately at their source
As this study shows a very strong positive
correlation of plastic pollution with population
growth in Melbourne and the population of Greater
Melbourne is projected to grow from 5 million to 9
million by 2056 (DELWP 2019) it is expected that
plastic pollution increases will continue until
effective source reduction measures are taken
Nearly 25 billion pieces of plastic flow into
Port Phillip Bay annually from the surface waters
of the two major rivers of which over 2 billion are
microplastics smaller than 5 mm in diameter
3 M I C R O P L A S T I C S I N T H E Y A R R A A N D M A R I B Y R N O N G R I V E R S
C O N T E N T S
| 33 |
gt Litter composition in the rivers
Sample analyses revealed that hard plastic fragments
polystyrene and soft plastics were the most
common items captured Despite the manta netrsquos
selectivity to small buoyant items the sample results
largely align with several other local litter audits
Litter audits along the Westgate Park foreshore and
along St Kilda beaches between 2015 and 2017
revealed polystyrene packaging and soft plastics
(bits of plastic bags wrap cellophane etc) are the
second and third most dominant litter categories
after cigarette butts4 Hard plastic fragments were
the most captured items in manta net trawls in the
Bay (see Chapter 4) and the second most prevalent
litter items found on beaches around the Bay using
the Baykeeper Beach Litter Audit method to
monitor for microplastics (see Chapter 5)
Polystyrene is the most captured litter item in the
Bandalong litter traps in the Yarra River (Kowalczyk
and Kelly 2020) As cigarette butts much like other
heavier items sink after a relatively short period in
water and pass under the manta net their numbers
in the Yarra and Maribyrnong River trawls do not
align with general beach clean-up data where
cigarettes often dominate In addition beach
clean-up efforts are typically geared towards the
collection of large litter items Consequently hard
plastic fragments and microplastics are not
systematically recorded in litter clean-ups
In general trawl findings provide a fairly robust
representation of the microplastic pollution issue
providing valuable information about the
composition and relative abundance of dominant
buoyant litter items entering Port Phillip Bay
It is worth noting that hard plastic fragments
polystyrene and soft plastics also dominate
microplastic pollution in other urbanised
catchments around the globe These items were
the most abundant litter types collected in trawls in
the New York-New Jersey Harbour estuary USA
one of the most urbanized estuaries on earth (S
Meola New YorkndashNew Jersey Baykeeper pers
comm 2015) Similarly hard plastic fragments
polystyrene and plastic foil dominated microplastic
loads along the length of the Rhine River in Europe
(Mani et al 2015) This is not surprising given that
worldwide the packaging industry the primary
material source of microplastics in this study is the
third largest after food and energy (Moore and
Phillips 2011) and around 11 of plastic waste
generated gets lost in the environment (Borelle
et al 2020) where it breaks up into smaller pieces
under the prevailing environmental conditions
It is clear that the Yarra has much higher total litter
counts than the Maribyrnong This is probably
because the Yarrarsquos catchment area (4046 km2) is
larger than the Maribyrnongrsquos (1408 km2) and land
use between the catchments differs apart from the
Upper Yarra region the Yarra River catchment
includes 43 times more of urbanised area than the
Maribyrnong The respective Catchment Region
documents from Melbourne Waterrsquos Healthy
Waterways Strategy state that in the Maribyrnong
catchment
raquo about 10 retains its natural vegetation
(1408 km2)
raquo 80 is used for agriculture (11264 km2)
raquo 10 is urban development Greater Melbourne
and larger townships (1408 km2)
In the Yarra catchment
raquo 55 of the area retains its natural vegetation
(22253 km2)
raquo 30 is used for agriculture (12138 km2)
raquo 15 is urban development (6069 km2)
When comparing the other types of litter between
the rivers it was found that the Maribyrnong
4 amditangaroablueorg
| 34 |
(proportionally) has higher counts of soft plastics
nurdles bottle caps straws twine cigarette butts
and lsquootherrsquo items than the Yarra whereas
polystyrene is more problematic in the Yarra
gt Investigating litter by item category
Hard plastic fragments remain the most
problematic items in both rivers and have been
significantly increasing over the last five years Due
to their small size it is nearly impossible to trace
them back to their individual sources of pollution
They originate from broken-up larger items that are
lost from overflowing commercial household and
public bins littering and illegal dumping of waste
are blown off trucks during transport or from
construction andor demolition sites
The plastic polymer analysis showed that most
items in the samples were polyethylene (PE)
polypropylene (PP) or polystyrene (PS) which are
some of the most commonly used plastics in the
world However other common plastics like
polyethylene terephthalate (PET) and
polyvinylchloride (PVC) were largely absent from
the results Notably as per Pattison (2020)
degradation of polymers is not uniform and
different polymers break up via a range of
processes at varying rates (Gewert et al 2015)
Polymer types such as PE PP and PS break up faster
when exposed to UV radiation than PET and PU
thus potentially increasing the prevalence of these
secondary microplastics The varying densities of
polymers may also influence what is collected with
equipment such as the manta net which sits on the
water surface
The lowest density polymers found in the river
samples are most likely to float were PP
(090 g cm3) and PE (from 092- 097 g cm3) (see
Appendix 3A) Some of the higher density polymers
included PET (138-139 g cm3) and PVC (129-
144 g cm3) which are commonly used worldwide
but were only present in study samples in trace
amounts (see Appendix 3B) It is therefore likely that
denser polymers may be in sub-surface waters
floating underneath the manta net or have sunken
into the sediments as there is a strong correlation
between the number of microplastics found in river
sediments and increasing polymer density (Klein
et al 2015)
Further investigation of the water column and the
sediments are logical next steps in the process of
investigating microplastics pollution in the rivers
Polystyrene is the second most prevalent litter item
in the Yarra and in third place in the Maribyrnong
These findings are supported by litter research
conducted between 2017 and 2019 by the Yarra
Riverkeeper Association which found that
polystyrene was the most found item on the
riverbanks during community clean-ups as well as
in the Bandalong litter traps (Kowalczyk and Kelly
2020) A subsequent polystyrene pollution research
project by Cleanwater Group and Yarra Riverkeeper
Association attempted to trace this litter back to the
source by surveying 64 manufacturing and
distribution facilities (Barmand et al 2020) Over
80 of surveyed sites were found to have some
sort of polystyrene leakage into the environment
even when all reasonable precautions had been
taken to prevent this In addition more evidence is
being collected revealing that building sites are a
potential source of polystyrene pollution when
using insulation waffle pods5 Polystyrene also gets
lost in transport on loading bays and at waste
transfer and recycling facilities The fact that
polystyrene loss still occurs even when all
reasonable precautions are taken indicates that the
problems lie with the material itself and how it is
handled It therefore needs to be questioned if this
material should still be used for its current
purposes meanwhile alternatives should be
sought
3 M I C R O P L A S T I C S I N T H E Y A R R A A N D M A R I B Y R N O N G R I V E R S
C O N T E N T S
| 35 |
as community-led advocacy has led to retailers
swapping plastic straws for paper ones or not
offering plastic straws unless specifically requested
by their customers In some instances entire retail
precincts have pledged to cease the distribution of
plastic straws such as the traders on Gertrude
Street in Fitzroy (The Everleigh pers comm 2017)
The fact that the results of these community
initiatives are reflected in the monitoring data
indicates two things
raquo 1) Individual behaviour change community-led
advocacy and community action to reduce
plastic pollution can make a significant positive
difference for the environment
raquo 2) Ongoing data collection and monitoring of
plastic pollution are necessary to evaluate which
litter reduction initiatives are effective
Sponge is a category that has been significantly
increasing in the Yarra and mostly captures artificial
lsquospongeyrsquo substances such as sponge-like
household items building insulation foam and soft
packaging material When speculating where this
material comes from and why it is more prevalent
and increasing in the Yarra the increased residential
construction projects in the Yarra catchment may
correlate Further source tracing may provide insight
Other is a category applied to record items that are
not readily identifiable as fitting into any of the
other categories but are obviously not organic In
both rivers this category is significantly increasing
especially in the Maribyrnong where the graphrsquos
J-curve in Figure 18 suggests an exponential
increase This warrants closer investigation of this
category in future research to see if there are
specific items that are trending and if another litter
item category should be added for specific
monitoring focus
Soft plastic fragments are steadily increasing over
time Much like hard plastic fragments soft plastics
are difficult to trace back to a single source Much of
it likely comes from plastic littered on the streets or
it blows out of bins and skips due to its light weight
and prevailing wind strength and direction in relation
to the bin Once in waterways soft plastics carried
on rapid flood flows commonly snag on woody
streamside vegetation causing them to shred
Nurdles are ubiquitous in waterways all over
Victoria as supported by evidence gathered by
Tangaroa Blue Foundation and the EcoCentre since
2014 (N Blake F Charko pers comm 2020)
Although nurdles have neither significantly
increased nor decreased over the life of this project
they are still making up a steady 1 of microplastics
flowing into the Bay over time Chapter 5 of this
report shows that nurdles are the number one
microplastic type found on beaches around the
Bay indicating that this type of pollution is an
ongoing issue
As nurdles are classed as an industrial pollutant
rather than litter it is relatively easy to identify their
source These pellets can be traced back to the
premises of plastic manufacturers where they are
spilled on the loading bays and driveways and are
often incompletely or not at all recovered after a
spill Some get lost in road transport on their way to
manufacturers and end up in the gutters Refer to
Chapter 7 for recommendations on this issue
Plastic straws are the only item category that has
significantly declined over time in the Yarra This is
notably going against the trend of all other items in
both rivers that are either increasing or staying
constant over time The most likely explanation for
this is that over the last several years community
and business-driven source reduction initiatives
such as lsquoThe Last Strawrsquo have gained great traction
in Melbourne Individual behaviour change as well
5 Although the Master Builders Association offers a waste minimisation guide that includes waffle pods it does not outline how this material should be handled onsite to prevent spillage
| 36 |
Bottle caps cigarette butts and twine have neither
increased nor decreased in both rivers Although
cigarette butts are in the top ten of most littered
items in Australia their plastic filters get
waterlogged and most likely pass under the manta
net explaining the low numbers found in this study
gt Seasonal variations
When examining the seasonal effects on the rivers
the Maribyrnong proportionally has its largest
surface litter output in spring and autumn while for
the Yarra litter numbers are highest during summer
and winter One likely reason for this difference
could be related to sports events that draw large
numbers of people to the vicinity of the rivers such
as football season for the Yarra in winter and horse
racing events at Flemington Race Course in spring
for the Maribyrnong In summer the Yarra parklands
are extensively used for recreation and tourism in
Melbourne CBD is at its peak in DecemberndashJanuary
However both rivers have different land uses
influencing them and there are vast differences in
the industrial usage and population density along
the rivers (Yonkos et al 2014) Litter hotspots may
also play a role For example Calder Park Raceway
is located near Jacksons Creek not far upstream
from where the creek joins the Maribyrnong River
Road verges in the vicinity of Calder Park are
heavily littered (N Blake pers comm 2020) with
plastic items potentially shredded when verges are
seasonally slashed Both rivers are subject to
different street cleaning and sweeping schedules
and practices by local councils
gt Other factors influencing litter
Rainfall There is a positive correlation between
rainfall and plastic pollution which is consistent
with research worldwide Littered items anywhere
in the catchment eventually make their way down
to the nearest waterway through the stormwater
drain system heavily polluting creeks and streams
that lead into the big rivers and the Bay (picture 6)
Litter traps Although no statistical correlation was
found between microplastics spikes and emptying of
the litter traps this conclusion was reached through a
Wilcoxon rank sum test comparing median litter
Picture 6 Litter in the Merri Creek which flows into the Yarra
P I C T U R E 6
3 M I C R O P L A S T I C S I N T H E Y A R R A A N D M A R I B Y R N O N G R I V E R S
C O N T E N T S
| 37 |
counts when the litter trap was emptied to when the
litter trap was not emptied (two days before trawl) See
Appendix 5 for more details Just before publication of
this report subsequent advice was received from
Melbourne Water that the average Yarra River current
speeds between Burnley and Bolte Bridge is 55 km
per hour (P Rasmussen Melbourne Water Team
Leader Flood Preparedness pers comm 2020)
The distance from Burnley to Bolte Bridge is
approximately 758 km therefore estimated travel time
is about 06 to 38 hours with the average
approximately 15 hours The shorter duration could
be applied during higher flows following rainfall runoff
The longer durations are generally normal conditions
With tides ebbing and flowing for all conditions the
average may be best applied Accordingly any spikes
in trawl contents attributable to emptying of
Bandalong traps could only apply to trawls conducted
within just a few hours of the traps being emptied
Apart from litter prevention measures gross
pollutant traps could be installed on the
problematic major drain outlets and catch items
before they make it into the creeks Once it reaches
the creeks plastic pollution mixes in with organic
materials and will be more onerous and costly to
remove from the waterways due to the much
higher volumes presented by these combined
materials To be effective gross pollutant traps
require adequate and proactive maintenance
schedules and resources to prevent them from
blocking or overflowing
However gross pollutant traps do not often catch
microplastics Although the data in this report do
not show a direct statistically significant correlation
between microplastic capture and the emptying of
the Bandalong litter traps in the Yarra personal
observation of the manner in which the traps are
emptied confirms that microplastics do escape
during this process More targeted research
specifically designed to test for the effectiveness of
microplastics captured by gross pollutant traps
during their operation and maintenance is
therefore necessary
Yarra environmental water flow releases No
correlation was found between microplastics
captured in the trawls and Melbourne Waterrsquos
regulated release of environmental water flows for
the Yarra There is no evidence that environmental
water flows exacerbate plastic pollution in
waterways This supports the result that litter
originates from the street making its way into the
rivers through stormwater drains
gt Implications for marine life in the Yarra estuary
and Port Phillip Bay
Port Phillip Bay is a relatively closed system due to
the distance between the Bellarine and Mornington
Peninsulas being only just under 35 km Due to
prevailing winds it is likely the Bay is a sink for a major
portion of the plastics that enter it from the rivers
This study found that microplastics form the bulk of
items entering the Bay from the surface waters of the
Maribyrnong and Yarra rivers The results of a pilot
project of nine Bay trawls showed the presences of
microplastics in eight of nine samples (see Chapter 4)
To date very few studies have assessed
microplastic ingestioninteraction rates for faunal
species in Port Phillip Bay However worldwide
freshwater and marine species at all trophic levels
possessing varied feeding strategies ingest
microplastics (Eerkes-Medrano et al 2015) In
lab-based studies ingestion has been associated
with the retention and accumulation of
microplastics in organisms including but not limited
to mussels (Browne et al 2008) lobsters (Murray
and Cowie 2011) scallops (Brillant and MacDonald
2000) injury and subsequent disrupted feeding
swimming activity in lugworms as well as stress
immune response altered metabolic function and
| 38 |
toxicity in lugworms (Browne et al 2013) and fish
and mussels (Rochman et al 2013) It is also related
to tumour formation in fish (Rochman et al 2013)
and brain damage in fish (Mattson et al 2017)
Smaller sizes of plastic can potentially be ingested by
a greater range of species Plastic ingestion by local
wildlife is highly likely because of Port Phillip Bayrsquos
potential for high microplastic concentrations and
because these waters are so biodiverse Faunal
ingestion rates and impacts of marine microplastics
at the individual population and community levels
need to be assessed to prevent biodiversity loss in
the Bay and to better understand the human health
implications of consuming seafood from the Bay
Investing in necessary research will likely require
collaboration between departments managing water
pollution controls and fish populations respectively
gt Further study on microplastics
The estimations in this study showed that the Yarra
and Maribyrnong can transport nearly 25 billion
plastic pieces ndash of which more than 2 billion are
microplastics ndash into Port Phillip Bay annually and
that this may be an underestimation Ling et al
(2017) noted that plastic filaments including highly
pervasive clothing microfibre pollution between
0038 mm and 0250 mm formed the dominant
categories of microplastic in coastal and estuarine
sediments around Australia including Port Phillip
Bay However we know little about the
downstream movement and deposition of
microplastics in rivers It is not known what
portions of riverine microplastics travel
downstream below the surface waters sampled by
the manta net to eventually be released to the Bay
or deposited to the river sediments In the North
Shore Channel (Illinois USA) for example
microplastic concentrations in sediments were up
to 15000 times higher than surface water samples
(Hoellein et al 2017) Some microplastics are likely
transported long distances as several studies report
high concentrations of microplastics in estuaries
with rivers implicated as major microplastic sources
to these coastal zones (Yonkos et al 2014 Lima
et al 2014 Sadri and Thompson 2014) An example
of this was revealed during a community clean-up
event organised by the Yarra Riverkeeper
Association in April 2018 where a vacuum suction
device deployed by Ocean Crusaders removed over
47 million polystyrene pieces from the Yarra River
and its vegetated banks (A Kelly pers comm 2018)
Consequently in order to accurately identify the
magnitude of microplastic pollution in Port Phillip
Bay it is necessary to better understand microplastic
depositional patterns and take into account the water
column below the top 20 cm and the sediments
To advance current microplastics research in this
area the EcoCentre engaged a team of interns from
Worcester Polytechnic Institute (WPI) in the USA to
design and build a low-cost microplastics sampling
device easily built from hardware store materials
called the lsquoMicroplastics Collector With A Pumprsquo
(MCWAP) The MCWAP is a portable battery-
powered pump that takes water samples at various
depths in the water column down to a depth of 2 m
and runs these through a removable mesh 300 nm
filter to capture microplastics (picture 7) The
EcoCentre is planning a first trial of depth-sampling
for waterway microplastics in 2021
Picture 7 The MCWAP EcoCentrersquos portable microplastics depth-sampling device
P I C T U R E 7
3 M I C R O P L A S T I C S I N T H E Y A R R A A N D M A R I B Y R N O N G R I V E R S
C O N T E N T S
| 39 |
Maribyrnong River
Fishing in Port Phillip Bay
4
C O N T E N T S
| 41 |
Bay trawls pilotTo gain insight into the relative quantities of microplastics entering the Bay from Bass Strait as compared to the major rivers a pilot project of nine manta net trawls was conducted at the entrance to Port Phillip Bay with support from the Blairgowrie Yacht Squadron and the Australasian Ambassador for the 5 Gyres Institute
Trawls were conducted between April 2018 and
February 2020 at Popersquos Eye in Port Phillip Bay
during incoming tides and south-westerly winds
Trawl time was 30 minutes during which the vessel
was anchored to the sea bed in the tidal flow
Sample sorting was done in the same manner as
the river trawls (see Chapter 3)
Of the nine trawl samples collected at Popersquos Eye in
Port Phillip Bay eight contained plastics (Table 1) Of
the total 55 items found 35 (64) were
microplastics The most prevalent items were hard
plastic fragments which were found in six of nine
samples Samples in which plastic was found
contained up to 16 items The last sample
contained a remnant of a party balloon with the
balloon string still attached
Although the sample size is too small to perform
meaningful statistical analysis the findings suggest
there may be a worrying amount of plastic floating
on the surface waters of the Bay Given the size of
Port Phillip Bay is 1930 km2 and plastics were found
in 89 of samples collected through 30-minute
trawls plastics are potentially quite ubiquitous
A proportion of 80 of hard plastic fragments
found seems relatively consistent with the 75
proportion that flows into the Bay from the Yarra
and Maribyrnong indicating a probability that many
of these items may have originated from the Bay
passed through The Heads into Bass Strait and
then been recirculated back to the Bay by tidal
currents and prevailing winds More samples will
need to be taken and analysed in order to further
investigate this probability
Hard Fragments lt5 Hard Fragments gt5 Soft Plastics TwineLine Sponge Non-Plastic
Apr 18 3 4 1
May 18 6 2
Jun 18 8 6 2
Sep 18
Oct 18 2 1 3
Dec 18 1
Jan 19 2 1
Feb 19 1 2
Feb 20 2 1 1
TOTAL 19 16 2 5 2 5
Table 1 Items caught in Bay entrance trawls lsquoNon-Plasticrsquo included paper and a rubber balloon
T A B L E 1
4
Microplastic beach litter 5
C O N T E N T S
| 43 || 43 |
Baykeeper Beach Litter AuditsDevelopment of the Port Phillip Baykeeper Beach Litter Audit method commenced in 2014 in response to international studies confirming the environmental threat of plastic pollution At that time and to date there remains no international standard survey method with various existing data collection methods used by different leading bodies
While each method provided valuable information
their capacity to accurately record volumes of litter
over time ndash particularly microplastics ndash was seen to
be limited by one or more of the following factors
raquo lack of a clearly defined data collection area
raquo clean-up andor data collection methods
conducted on a scale that was unlikely to be
systematically repeated
raquo data collection recorded in a single area on a beach
(as opposed to a set of locations that represented
samples of all conditions on the beach)
raquo data recording conducted from a standing
position reducing the likelihood of recording
hard-to-spot microplastics
raquo data collection without removing litter
eliminating the possibility of clearly measuring
change in volumes occurring between surveys
The Baykeeper Beach Litter Audit methodology
was designed to focus on microplastic pollution
that poses an immediate threat to aquatic
organisms Key considerations in the design of this
method were the need to
raquo capture a representative sample of the conditions
on the beach
raquo establish an easily replicated method that can be
cost-effectively and consistently applied by
different groups around the Bay
raquo use data field terminology that was consistent
with terms used in the Australian Marine Debris
Initiative database
The Clean Bay Blueprint project provided an
opportunity to test the survey methodology over
several years with a range of user groups
| 44 |
Methodology
The survey method requires the combined search
time of the number of auditors to equate to at least
five minutes per quadrat Noting that some
quadrats will have very few if any microplastics
this requirement is designed to ensure consistency
of search effort and to enable a small team of two
people to comprehensively complete an audit in
less than an hour or two hours on more heavily
littered beaches This relatively small time
commitment facilitates regular conduct of audits
over the course of a year to achieve the statistical
rigour required to confirm trends in litter volumes
and type over time
gt Transect and quadrat placement
In order to capture a representative sample of all
beach conditions data is collected from three
transects across the beach In this context lsquoall beach
conditionsrsquo is referring to the structure of the beach
ndash shaped by the locally prevailing winds waves and
tidal currents ndash which transport sand debris and
litter to and from the beach To capture the
influence of these coastal processes over time and
to provide a basis for consistent search effort
transects are located at the widest central and
narrowest sections of beach
In each transect data is collected from three
quadrats at the top of the beach mid-beach and
on the last high tide line (Figure 22) The lsquotoprsquo
(inland edge) of the beach quadrats are in the same
place for each survey as locational reference points
Due to changing tidal conditions on the day the
distance between the top of the beach and last
high tide line (ie transect length) will vary Hence
the location of the mid-beach and quadrats at the
last high tide line differ for each survey Importantly
the quadrats located at the last high tide line
provide a sample of litter arriving on that day
Each transect starts at the lsquopermanent landmarkrsquo at
the top of the beach to ensure transects are in the
same place each time a survey is conducted
Transects run roughly at a right angle from the top of
the beach towards the closest point at the waterline
gt Selection of reference beach survey locations
With a view to gaining insights into catchment
sources of microplastics to the Bay beaches
surveyed for Clean Bay Blueprint in various regions
of Port Phillip Bay are generally associated with a
river or a creek that flows into the Bay Those that
are not directly associated with rivers or creeks (Rye
and Geelong Eastern Beach) are included to provide
insights into the mobility of litter due to tidal
currents and seasonal winds
5 B A Y K E E P E R B E A C H L I T T E R A U D I T S
Figure 22 Location of Baykeeper Beach Litter Audit data collection quadrats along the widest (1) central (2) and narrowest (3) beach transects
F I G U R E 2 2
C O N T E N T S
| 45 |
Plastics that float in the upper water column are
carried in the direction of wind-generated waves
and the direction of tidal currents during calm
(low-wind) conditions (N Blake pers obs 2020)
Due to the combined effects of tides and varying
wind directions some plastic objects may travel
widely in the Bay before eventually being cast upon
a beach A notable example was one of five
GPS-tracked PET bottles released in Elwood Canal
on 9 May 2019 by RMIT6 After remaining in the
Canal for almost two weeks they ultimately landed
on Dromana beach on 25 May due to a prevailing
northerly wind Therefore in the absence of data
collection conducted on a weekly basis it is
impossible to definitively conclude where beach
litter on any given day may have originally
come from However seasonal
data collection at multiple
(Bay-wide) reference sites does
provide some indication of the
likely source (the catchment)
and ultimately presents a
baseline dataset with which
to determine if microplastics
lsquoleakagersquo into the Bay is
increasing or decreasing
over time
gt Surveys conducted
Between July 2017 and March 2020 117 beach litter
audits were conducted in 12 locations around Port
Phillip Bay (Table 2) with the help of local
community group volunteers not-for-profits and
education institutes All citizen scientists involved
received multiple on-site training sessions by the
Port Phillip Baykeeper before independently
conducting audits Regular reference beaches were
surveyed every three months (in May August
November and February) with surveys of all
beaches generally conducted within the same
fortnight Only sites that were surveyed on at least
six occasions have been given more detailed
analysis in this report
LOCATION ASSOCIATED RIVER
OR CREEK AUDITS
COMPLETED
Eastern Beach Geelong na 11
Moorpanyal Beach Geelong na 2
Werribee River Jetty Werribee River 6
South Beach Werribee Werribee River 7
West Beach St Kilda Yarra River 15
Point Ormond Elwood Elwood Canal 3
Mordialloc Beach Mordialloc Creek 4
Keast Park Seaford Patterson River 10
Frankston Beach Kananook Creek 12
Mothers Beach Mornington NA 4
Mount Martha Beach Balcombe Creek 30
Rye Beach na 13
Total surveys 117
Table 2 Beach litter audit sites and number of audits done between July 2017 and March 2020 Beach names in bold are the regularly surveyed reference beaches the other beaches were opportunistically surveyed
T A B L E 2
6 RMIT Litter Tracker project httpswwwrmiteduauaboutschools-collegesscienceresearchresearch-centres-groupsaquatic-environmental-stresslitter-trackers
| 46 |
Results and discussion
Figures 23 and 24 show beaches along Port Phillip
Bayrsquos eastern shores recorded much higher
concentrations of litter than Geelong Werribee and
Rye The lower counts at Geelong and Rye can be
attributed to the fact there is no major waterway
entering the Bay in their general vicinity and
raquo as Geelong Eastern beach is located near the
westernmost end of Corio Bay it has very limited
exposure to litter dispersed by wind and tides
from wider Port Phillip Bay
raquo Rye beach is the southernmost survey location in
the Bay relatively removed from major streams
and urban catchment
The much lower (near negligible) counts at
Werribee South and Werribee River jetty are likely
attributable to the fact that the Werribee River
catchment is much less urbanised (around 20)
than the catchments associated with most of the
eastern sites of the Bay These results suggest that
litter makes its way to the Bay from the catchments
via the waterways
The high average counts at Keast Park (Seaford)
equate to 42 of total litter collected at all survey
locations Field observations and anecdotal reports
of industrial sites in the Mordialloc Creek and
Patterson River catchments have identified two
particular sites that may be significant contributors
to the overall plastic pollution recorded at Keast
Park This result warrants more detailed analysis
and investigation
A total of 11248 items were recorded in this study
A breakdown of items collected in Figure 25 shows
very few gross pollutants (eg intact plastic bottles
and bags) were recorded while nurdles (pre-
production pellets) and plastic fragments combined
comprised 77 of the total records The volume of
microplastics observed in 9 m2 compared to
microplastics reported in typical beach cleans
confirms the effectiveness of the methodology in
systematically recording microplastics at reference
sites around the Bay
Of all litter recorded the quadrats within the lsquolast
high tide linersquo recorded the greatest percentage of
items (45) followed by the lsquotop beach zone (38)
then the lsquomid-beach zonersquo (18) However this
order did not apply to all beaches with several of
the less littered beaches recording the greater
amount in the top beach zone (Figure 26) Mt
Martha is notable in this regard among the more
heavily littered beaches in that the lsquotop beachrsquo
quadrats had the highest amounts in all three
transects However this result was skewed
significantly by the top beach of the central beach
transect which averaged 278 items per survey ndash
almost as much as the totalled averages for all other
quadrats combined (338 items)
Keast Park has the distinction of having the
highest percentage of nurdles (59 of items
recorded) compared to St Kilda West beach (47)
Frankston (34) Rye (22) and Mt Martha (17)
Nurdles were virtually absent from beaches on the
west side of the Bay
Examination of plastic fragments by type and size
also found Keast Park distinguished from other
beaches with 53 of fragments being hard
fragments lt 5 mm Frankston ranked next highest
for hard plastic fragments with 37 followed by Mt
Martha with 34
The significantly higher counts of nurdles and hard
plastic fragments lt 5 mm may be due to a
combination of factors such as
raquo the broader range of wind directions that might
affect the site prevailing winds are acknowledged
as a primary agent for litter dispersal and Keast
Park is located at the easternmost point of Port
5 B A Y K E E P E R B E A C H L I T T E R A U D I T S
C O N T E N T S
| 47 |
Figure 23 Average litter per survey for all beaches surveyed
Figure 24 Visualisation of total litter counts on sampled beaches around Port Phillip Bay larger circles represent higher counts Image source Port Phillip Sea Pilots
F I G U R E 2 4
F I G U R E 2 3
| 48 |
Figure 25 Litter category percentages of total litter recorded across all sites The numbers above the percentages are the total items collected
Figure 26 Comparison of results for tide line mid-beach and top beach zones
Phillip Bay and subject to winds from south to
north (the widest range of all sites surveyed)
raquo orientation of the beach (near North-South at
Keast Park)
raquo physical infrastructure impeding wave action on
this particular beach (the Riviera stormwater
outfall projects into the Bay at a point around
20 m south of the survey area)
raquo presence of plastics manufacturing and re-grind
industries within the catchments
raquo proximity to industrial sites in local river and
stream catchments (Mordialloc Creek and
Patterson River) to the north of the survey beach
(tidal currents that run clockwise around the Bay
would carry plastics generated by these streams
towards Keast Park)
The Frankston beach survey site is oriented NNE to
SSW which is not dissimilar to the orientation of
Keast Park (NNW-SSE) The two sites are just seven
kilometres apart Despite this proximity the
Frankston site (located just to the south of
Kananook Creek mouth) recorded considerably
fewer nurdles and hard plastic fragments than Keast
Park (which is to the south of Mordialloc Creek and
Patterson River) These findings suggest that close
scrutiny of the Mordialloc Creek and Patterson River
catchments for nurdles and hard plastic fragments
is warranted
F I G U R E 2 5
5 B A Y K E E P E R B E A C H L I T T E R A U D I T S
C O N T E N T S
| 49 |
F I G U R E 2 5
| 51 |
Port Phillip Bay on a windy day
6
| 51 |C O N T E N T S
Related litter investigations Over the life of Clean Bay Blueprint the EcoCentre collaborated with many other organisations Other investigative litter projects enabled by the Port Phillip Bay Fund with the primary aim of data collection for pollution prevention include
raquo Yarra Riverkeeper Associationrsquos Litter and Flows and polystyrene projects - analysing
litter in the Yarra
raquo RMIT Universityrsquos Plastics Lab project ndash analysing
plastic fragment samples to identify polymers and
adsorbed contaminants
raquo Tangaroa Blue Foundationrsquos Letrsquos Strain the Drains7 ndash trialling stormwater pit filtration devices
to document the captured contents in a range of
municipalities and for four different street usages
raquo Scouts Victoriarsquos Street2Bay8 project ndash auditing
litter in six different street usages in all catchments
around the Bay
raquo RMIT Universityrsquos Litter Tracker4 project ndash GPS
tracking and on-line reporting of the mobility of
plastic bottles released into streams in
catchments leading to Port Phillip Bay
raquo Beach Patrol Australia and Love Our Street have
also compiled considerable data with the mobile
Litter Stopper phone app9
Interactive litter maps
It is essential to provide data access and report back
on research results to citizen scientists and those
advocating for and designing change Data collected
from the beach audit sites have been entered into
an interactive Tableau data visualisation platform
and is hosted on the EcoCentre website with
potential for visualising street litter data collected by
other groups Consequently the Tableau platform
appears to be a useful means of engaging with
schools and the wider community in relation to the
high mobility of microplastic pollution
The EcoCentre was also part of the community
reference group that helped design and test the State
Governmentrsquos LitterWatch10 database which collects
and collates litter data from all over Victoria visualises
this on a map and makes it publicly accessible This
is the first attempt to gather all litter data no matter
which data-collection methods were used and bring
this together in one accessible repository
Incident reporting
During the course of the study several materials that
have been noted as of ongoing concern were
reported to relevant authorities These included Telco
wire offcuts discarded at telecom sites on streets
polystyrene waffle pod waste leaking from a building
site and AstroTurf fragments leaking from a
sportsground demolition
All of the complementary initiatives represent major
advances in our understanding of plastic pollution
and warrant careful consideration as a whole body
of information as opposed to in isolation particularly
with a view to adopting the optimum suite of data
collection methods for the future and to set targets
for local source reduction plans
7 tangaroablueorglets-strain-the-drains-port-phillip-bay-region-vic 8 httpsscoutsvictoriacomauactivities-eventsactivitiesenvironmentstreet2bay-project 9 httpswwwbeachpatrolcomau 10 httpslitterwatchvictoriaorgau
Sunset over Port Phillip Bay
RecommendationsOver the life of the Clean Bay Blueprint project microplastic pollution has stopped being an lsquoemerging issuersquo The irrefutable evidence of its unacceptable impact on the environment is well-documented all over the world
7
C O N T E N T S
| 53 |
Many governments are acting on the
recommendation from the science community that
society should not wait for any more quantification
of damage before taking action to reduce marine
plastic pollution impacts (Lavers and Bond 2017
Gall and Thompson 2015) In their report Marine
Plastics Debris and Microplastics the United Nations
stated there is a moral argument that we should not
allow the ocean to become further polluted with
plastic waste and that marine littering should be
considered a lsquocommon concern for humankindrsquo
(UNEP 2016)
The high quantities of litter and microplastics in the
Yarra and Maribyrnong rivers highlight the large
contribution of these rivers to marine plastic
pollution in Port Phillip Bay Recent research by
Borelle et al (2020) projected the future of plastic
pollution in our oceans and concluded that the
predicted growth in plastic waste in the next 10
years far exceeds the impacts of mitigation efforts
currently deployed Therefore significant changes
and investments need to be made to counter the
rising tide of plastic pollution in the oceans
| 54 |
Recommendation 1
gt Improve product stewardship
Plastic and microplastic pollution are everybodyrsquos
problem Over the lsquolifecyclersquo of a plastic item it
travels through the fossil fuel and petrochemical
industries transport and shipping plastic product
manufacturers retailers community local councils
waste contractors and the recycling industry
However whereas every link in this user chain has
some level of responsibility not everyone should be
expected to have the same level of accountability
for plastic waste The current responsibilities for the
fate of plastic products are not well-defined and are
often passed on to the next group down the line
putting a disproportionately large strain on
communities and local councils There is very little
meaningful manufacturing industry accountability
for the end-of-life destination of plastic whether for
waste management or pollution of the environment
The plastics industry is set to grow 40 by 203011
yet hardly any producer responsibility is taken for
the waste and problems its products cause Only
94 of manufactured plastic is being recycled in
Australia (OrsquoFarrell 2019) which is consistent with
9 world-wide9 An astonishing 11 enters the
oceans (Borelle et al 2020) Currently local councils
and the community are expected to deal with the
consequences of unregulated production of a
material that lasts in the environment forever
As Victoria is moving from a linear to a circular
economy model this is the perfect time to change
and define the responsibilities of the plastics
industry and their accountability Federal and state
governments play a key role in leading and
managing this change Some of the changes that
the EcoCentre believes should be made in the short
and long term are
11 Transition to a circular economy model
Product recovery schemes (such as the
container deposit legislation) that are part of a
circular economy model should be funded by
the industries which produce the product
and managed by an independent government
agency to prevent perversion of the initiative
12 Invest in implementing alternatives to
plastic Plastic is not the right material for
the majority of functions it performs eg
using a material that lasts forever for single-
use packaging The ever-increasing
monetary and environmental costs of
dealing with plasticrsquos end-of-life stage are too
high Many alternative truly biodegradable
materials have already been invented but
have not been taken up for large-scale use
Industry needs to be given incentives to
transition towards producing large-scale
alternative packaging solutions eg through
new legislation or stimulus measures such
as innovation grants or tax incentives
13 Set limits on virgin plastic production
This includes avoiding investments in
waste-to-energy schemes that burn plastic
as it perpetuates our reliance on a product
that should not be burned in the first place
14 Ban broad-scale groups of problematic
single-use plastics12 Examples such as South
Australiarsquos ban on single-use plastic items
will provide some of the incentives driving
innovation and transformation Bans may be
premised on design qualities rather than
product type for example banning oxo-
11 httpswwwplasticsoupfoundationorg 12 The Australian National Waste Policy Action Plan commits to banning lsquoproblematic and unnecessary single-use plasticsrsquo by 2025 and delegated the Australian Packaging Covenant Organisation to lead all governments to lsquoIdentify problematic and unnecessary single-use plastic packaging to provide an evidence base for industry to take coordinated actionrsquo by 2019 The resulting report identified four priority categories (including expanded polystyrene and non-certified compostable packaging such as oxo-degradable) and three materials for further investigation httpswwwpackagingcovenantorgaudocumentsitem3183
7 R E C O M M E N D A T I O N S
C O N T E N T S
| 55 |
13 Operation CleanSweep is a best-practice manual for plastic manufacturers that employs cost-effective ways of preventing nurdles leaking into the environment
degradable plastics (that merely break into
microplastics faster rather than biodegrade to
natural component materials) or non-
recyclablenon-compostable packaging
15 Make the Operation CleanSweep13
program mandatory instead of voluntary
for any manufacturer using nurdles and have
this enforced by EPA Victoria
Recommendation 2
gt Cultivate effective partnerships
It is critical that conversations and true working
partnerships are forged and maintained with a
long-term vision of collaboration and tangible
positive outcomes In the case of an issue as big as
plastic pollution cross-sectoral collaborations are
essential to ensure effective changes Industry local
government state government agencies (such as
EPA Victoria the Catchment Management
Authorities and Melbourne Water and others)
research institutes community organisations and
businesses all need to engage in ongoing dialogue
about responsibilities and most importantly to
reach clear agreement on which group is
accountable for delivery of each defined outcome
that is necessary to the success of the overall
enterprise This might be achieved through
stakeholder working forums similar to the Victorian
Department of Environment Land Water and
Planningrsquos Integrated Water Management Forums
Recommendation 3
gt Support local councils in waste management
Until larger systemic changes in waste
management are made the end-of-line
responsibilities councils have for plastic waste need
to be adequately supported and resourced The
costs of this should not be transferred to the
community via rate increases nor by reliance on ad
hoc manual volunteer clean-ups
Measures should include effectively resourcing
councils to
31 Install and maintain pollutant traps in
drain outlets that discharge into creeks
and rivers This could be a collaboration
with Melbourne Water Care should be taken
to not just install gross pollutant traps but
also traps that catch microplastics such as
Drain Buddies
32 Enforce litter and illegal dumping law
33 Run effective litter prevention and
education programs in the community and
especially with local businesses and industry
This may be best done by partnership with
trusted business or community
organisations supporting the outreach
34 Review and improve current street
sweeping schedules and where necessary
adapt these to be more effective at the
occurrence of large sporting events and
seasons when litter peaks occur
| 56 |
Recommendation 4
gt Continue monitoring (micro)plastic pollution
Existing waste management and anti-litter
initiatives are not effective enough to stop plastic
and microplastic pollution from reaching Port Phillip
Bay The research in this report has established a
baseline data set that shows that the problem is
getting worse over time
The river trawls and beach litter audit methods
described in this report are both demonstrated to
be scientifically valid means of ongoing data
collection and the multiple years of data gathered
represent a benchmark of plastic pollution in the
major rivers and Port Phillip Bay The street litter
audit method applied by Scouts Victoria in the
Street2Bay project has also proven to be an
effective and replicable means of monitoring plastic
pollution on streets in Port Phillip Bay catchments
Continued data collection using these methods can
provide a means of evaluating any future strategies
to reduce plastic pollution in waterways
Recommendation 5
gt Increase education and lsquoplastic literacyrsquo of all
plastic users
As part of cultivating a shared responsibility for
plastic use and disposal education of plastic users
is essential The general public has become much
more aware of the issues of plastic pollution in the
environment thanks to a boom in scientific
research followed by mainstream film
documentaries and social media and community
campaigns over recent years
However there is still much confusion about how
plastic can be avoided or what plastics are more
preferable to others An example of this is the actual
meanings of the words lsquobiodegradablersquo lsquodegradablersquo
lsquooxo-degradablersquo and lsquocompostablersquo for plastic bags
People generally try to do the right thing and want
to invest in better products but industry uses the
terms in misleading ways (picture 8)
Recommendations are therefore
51 Set standard legal definitions for
degradability labels
Not-for-profit organisations as well as local councils
play a key role in educating the community and
implementing education programs in schools
Organisations that specialise in this should be
adequately resourced It is likely the reduction in
plastic straws in the Yarra can be attributed to
education efforts and community behaviour change
projects showing that these approaches work The
community and NGOs are not significantly
mentioned in Recycle Victoria (February 2020)
whereas community and cross-sector
collaborations are mentioned in the Port Phillip Bay
EMP but funding for joint activities is unclear after
the conclusion of the Port Phillip Bay Fund in 2020Picture 8
Industry messaging on plastic bag
7 R E C O M M E N D A T I O N S
C O N T E N T S
| 57 |
52 Develop project grants forums and
strategic ongoing partnerships that
integrate community government research
and industry efforts
53 Adequately resource groups who
educate and facilitate action on plastic
pollution
Recommendation 6
gt Conduct further research
As highlighted in the study discussions above
additional research is needed to adequately monitor
microplastics in Melbournersquos waterways and Port
Phillip Bay Ongoing monitoring of surface waters is
necessary to track the quantities and movements of
microplastics and can serve as a baseline for source
reduction action Given the high numbers of
microplastics reaching the Bay from surface waters
it is also important to conduct further research into
the water column and the sediments
Recommendations for further research are
61 Conduct depth-sampling studies The
EcoCentre will pilot the MCWAP to start
monitoring microplastics in the water
column If successful the device and
methodology could be rolled out for use
across creeks and rivers of Victoria
62 Conduct sediment studies Sediment
research is necessary to identify where the
heavier polymers end up according to
Schwarz (2019) river sediments act as a plastic
sink and CSIRO estimated that based on their
samples taken in the South Australian Bight
144 million tonnes of microplastics reside on
the seafloor worldwide (Barrett et al 2020)
63 Prioritise understanding the
contaminants carried by plastic in
waterways and associated human health
risks Continued analysis of plastic polymer
types and chemical contaminants carried by
plastics in waterways is necessary to
strengthen our understanding of the
potential ecological and human health
impacts of plastic pollution
64 Conduct on-ground investigations for
major sources of hard plastics fragments
and nurdles within the Mordialloc Creek and
Patterson River catchments
Plastics Lab Dr Mayumi Allinson
View of St Kilda Beach
8
C O N T E N T S
| 59 |
A note on citizen scienceThe research conducted in this study strongly relied on the collaborations with volunteer citizen scientists Citizen science has received increasing recognition over the last decade and rightly so without more than 8800 hours contributed by volunteers for data collection sample sorting and analysis Clean Bay Blueprint could not have produced such robust results
This project is hardly an exception these days as
volunteers both individually and via community
groups put countless hours of their time and
expertise towards environmental projects that rely
on large datasets and labour-intensive analyses
It needs to be recognised that the contributions of
citizen scientists to science and environmental
change-making are both invaluable and essential
and that collaborations between research
institutions and community provide a powerful
opportunity to build understanding of complex
issues of Victorian Australian and global
significance Resourcing the professional
coordination of such collaborative studies often
provides funders with a multifold return on the
investment through generating new knowledge
inspiring extensive in-kind contributions and
activating community-led conversations and action
on topics that might otherwise be uncommon
around dinner tables classrooms and clubs
9
Little Penguin in Port Phillip Bay
C O N T E N T S
| 61 || 61 |
AcknowledgementsOne of Clean Bay Blueprintrsquos main goals was to build partnerships with other organisations that target litter and improve Bay health
raquo Khadija Muhanna Saif Al
Nabhani - RMIT University
raquo Hilda Poloso - RMIT University
raquo Minh Tu - Deakin University
raquo Daniel Cox - RMIT University
raquo Nick Bergstrom - Worcester
Polytechnic Institute
raquo Sarah Duquette - Worcester
Polytechnic Institute
raquo Madison Healy - Worcester Polytechnic Institute
raquo Nick Sorensen - Worcester Polytechnic Institute
raquo Cameron Collins - Worcester Polytechnic Institute
raquo Samantha Comeau - Worcester Polytechnic Institute
raquo Brendan Gallagher - Worcester Polytechnic Institute
raquo Gina Visser - Worcester Polytechnic Institute
raquo Katie Donovan - Worcester Polytechnic Institute
raquo Spencer Hoagland - Worcester Polytechnic Institute
raquo Thomas Lipkin - Worcester Polytechnic Institute
raquo Eric Stultz - Worcester Polytechnic Institute
We recognise the extensive and energetic contributions of many interns
Many new collaborations and ongoing partnerships were formed and many existing relationships were
leveraged during this project This was made possible by the funding from the Port Phillip Bay Fund of
EcoCentre projects as well as those of other organisations We therefore thank the State Government of
Victoria for its support
Our sincere thanks goes out to the many volunteers including work placement students and interns who
have donated hours of their time and expertise to the project to make it a success We acknowledge your
great passion for the environment and deep dedication to making positive change for the future of our
waterways This project would not have been possible without your support
raquo Balcombe Estuary Reserves
Group Mt Martha
raquo Beach Patrol Mt Martha
raquo Frankston Beach Patrol
raquo Rye Beach Patrol
raquo Beach Patrol Australia
raquo Seaford Beach Patrol
raquo Werribee Beach Patrol
raquo Werribee River Association
raquo Yarra Riverkeeper Association
raquo David Flew
(Karringal boat skipper)
raquo Blair Stafford Australasian
Ambassador of the 5 Gyres
Institute
raquo Blairgowrie Yacht Squadron
raquo Metropolitan Waste and Resource Recovery Group
raquo Melbourne Water
raquo Parks Victoria
raquo 3CR Community Radio
raquo 3RRR Community Radio
raquo Sacred Heart Mission
raquo Bellarine Catchment Network
raquo RMIT Plastics Lab Prof Graeme Allinson Dr Mayumi Allinson Marinda Pattison and students
raquo Scouts Victoria
raquo Worcester Polytechnic Institute
raquo Dolphin Research Institute
raquo Sustainability Victoria
raquo Victorian Litter Action Alliance
raquo Gordon TAFE
raquo Dr Christopher Johnstone and Emma Barnett of Monash University
raquo Victorian National Parks Association
raquo Federation University
raquo Australian Citizen Science Association
raquo The Age
raquo Department of Environment Land Water and Planning
raquo Ying Quek
raquo Port Phillip Menrsquos Shed
We thank the following organisations groups and individuals for their contribution and collaboration (in no particular order)
Appendicesgt Appendix 1
| 62 |
Figure 28 Percentage of microplastics in samples per trawl in the Yarra (blue) and Maribyrnong (red) rivers with 95 confidence intervals shaded grey The average percentage of microplastics per sample was 184 This number has stayed constant over time
F I G U R E 2 8
Appendices
Microplastic Image Josie Jones
C O N T E N T S
| 63 || 63 |
gt Appendix 2
MARIBYRNONG YARRA
Hard plastic fragments 174 -102
Soft plastics 959 -560
Polystyrene -1688 986
Nurdles 803 -469
Plastic bottle caps 542 -317
Plastic straws 529 -309
Sponge -167 097
Twine 412 -241
Other 004 002
Cigarette butts 596 -348
F I G U R E 2 9
Figure 29 Mosaic plot showing the Chi-Square test results (in Table 3 below) The statistical test looks at whether proportions are different than what is expected by chance considering both the Yarrarsquos and Maribyrnongrsquos total litter The width of the boxes show the proportion of litter in the Maribyrnong compared to the Yarra The height of the boxes shows the proportion of litter for each litter item The colours represent significance Boxes coloured red have lower proportions than expected by chance and those in blue have higher proportion than expected by chance The boxes for hard plastic are grey meaning there are no significant differences in proportions of expected hard plastic fragments in the Maribyrnong or Yarra rivers (P gt 005) The boxes for nurdles bottle caps straws and soft plastics are blue for the Maribyrnong and red for the Yarra meaning there are proportionally more nurdles bottle caps plastic straws and soft plastics than expected in the Maribyrnong river and fewer than expected in the Yarra (P lt 005)
Table 3 Residuals from Chi-square test for plastics count as a function of waterway and plastics category Significant values are in bold red
T A B L E 3
| 64 |
gt Appendix 3
Plastic polymer analysis
A
B The below Table 7 is used with
permission from the unpublished
Honours dissertation Analysis of
Microplastic Polymers in the Yarra and
Maribyrnong Rivers (May 2020) by
Marinda Pattison under supervision of
Associate Professor Graeme Allinson
Table 6 Plastic polymer density (Stelray Plastic Products 2020)
T A B L E 6
YARRA RIVER MARIBYRNONG RIVERPercentage () Std Dev Percentage () Std Dev
Total PE 4750 1113 4916 1562
PP 2204 1024 2361 867
PS 1530 1195 791 871
PU 088 217 035 067
Nylons 027 064 104 241
EVA 043 062 049 101
PVC 021 065 008 023
Latex 002 008 005 019
PE amp PP mix 023 039 021 055
PET 002 008 000 000
Nitrile 000 001 000 000
PMMA 002 009 000 000
PTFE FEP 000 000 000 000
CA 001 005 000 000
PC 001 006 007 027
ABS 012 046 000 000
Unknown 067 096 088 113
T A B L E 7
Table 7 Mean abundance (percentage) of polymers in Yarra and Maribyrnong Rivers
A P P E N D I C E S
C O N T E N T S
| 65 |
gt Appendix 4
Changes in individual litter items over time
YARRA RIVER
Plastic Kendallrsquos tau Z P-value
Hard Plastic Fragments 033 741 lt0001
Nurdles 008 086 0391
Other 023 229 0022
Plastic Bottle Caps 016 146 0146
Plastic Straws -025 -234 0019
Polystyrene 022 346 0001
Soft Plastics 027 578 lt0001
Sponge 025 248 0013
Twine 007 072 0470
Cigarette butts 017 164 0102
MARIBYRNONG RIVER
Plastic Kendallrsquos tau Z P-value
Hard Plastic Fragments 026 552 lt0001
Nurdles -004 -044 0657
Other 043 416 lt0001
Plastic Bottle Caps -013 -125 021
Plastic Straws -021 -195 0051
Polystyrene 009 14 0161
Soft Plastics 013 279 0005
Sponge 007 064 0524
Twine 004 042 0671
Cigarette butts -003 -031 0755
Table 4 Kendallrsquos tau test results Change in counts of plastic over time by category for the Yarra and Maribyrnong rivers Kendallrsquos tau the Z value and P-values are presented Significant values are in red These results are important for interpreting the scatterplots in Figures 18 and 19 A positive tau indicates an increase in litter over time A negative tau indicates a decrease over time Kendallrsquos tau is a non-parametric correlation value
T A B L E 4
| 66 |
gt Appendix 5
Bandalong litter traps
In the Yarra River multiple outliers were recorded for the total litter items captured per trawl date Litter traps
were emptied over 24 of the trawl days Six of those days showed higher than average litter counts On 35
trawl days litter traps were not emptied and we saw five higher than average total litter counts
Figure 30 A Wilcoxon rank sum test compared median litter counts when litter trap was emptied to when litter trap was not emptied (two days before trawl) We did not find any effect of litter trap emptying on the total number of litter items captured (W = 289 P = 0162)
F I G U R E 3 0
A P P E N D I C E S
C O N T E N T S
| 67 |
gt Appendix 6
Yarra Environmental flows
There was no significant association between environmental flow events and plastic counts in the Yarra (t =
-03 P = 0768) The amount of variation in microplastic counts explained by environmental flows was close
to zero (adjusted R2 lt 0001) Note that microplastic count was square root transformed to meet
assumptions of a regression analysis
Figure 31 Count of microplastics per trawl as a function of environmental flows in the Yarra River
F I G U R E 3 1
raquo Andrady A L (2006) Assessment of
environmental biodegradation of synthetic
polymers Polym Rev 1994 3425ndash76
raquo Andrady A L (2011) Microplastics in the marine
environment Marine pollution bulletin 62
1596-1605
raquo Barua S Muttil N Ng A amp Perera B (2013) Rainfall
trend and its implications for water resource
management within the Yarra River catchment
Australia Hydrological Processes 27 1727-1738
raquo Barmand S Goodsell K Yardley D Kowalczyk N
(2020) Polystyrene pollution in the Yarra river
sources and solutions Yarra Riverkeeper
Association
raquo Barnes D K Galgani F Thompson R C amp Barlaz
M (2009) Accumulation and fragmentation of
plastic debris in global environments
Philosophical Transactions of the Royal Society of
London B Biological Sciences 364 1985-1998
raquo Barrett J Chase Z Zhang J Banaszak Holl M M
Willis K Williams A Hardesty B D Wilcox C
(2020) Microplastics pollution in deep-sea
sediments from the Great Australian Bight
Frontiers in Marine Science October 2020
Volume 7 Article 576170
raquo Blake N amp Charko F (2014) Pilot study to identify
the extent of microplastics in the Maribyrnong
and Yarra Rivers and Port Phillip Bay Port Phillip
EcoCentre report
raquo Borelle S B Ringma J Law K L Monnahan C C
Lebreton L McGivern A Murphy E Jambeck J
Leonard G H Hilleary M A Eriksen M
Possingham H P De Frond H Gerber L H
Polidoro B Tahir A Bernard M Mallos N Barnes
M Rochman C M (2020) Predicted growth in
plastic waste exceeds efforts to mitigate plastic
pollution Science 369 (6510) 1515-1518
raquo Brillant M amp Macdonald B (2000) Postingestive
selection in the sea scallop Placopecten
magellanicus (Gmelin) the role of particle size
and density Journal of Experimental Marine
Biology and Ecology 253 211-227
raquo Browne M A Dissanayake A Galloway T S
Lowe D M amp Thompson R C (2008) Ingested
microscopic plastic translocates to the circulatory
system of the mussel Mytilus edulis (L)
Environmental science amp technology 42
5026-5031
raquo Browne M A Niven S J Galloway T S Rowland
S J amp Thompson R C (2013) Microplastic moves
pollutants and additives to worms reducing
functions linked to health and biodiversity
Current Biology 23 2388-2392
raquo Charko F Blake N Kowalczyk N Johnstone C
Seymore A Quek Y (2018) Microplastics in the
Maribyrnong and Yarra Rivers Melbourne
Australia Port Phillip EcoCentre report
raquo CIEL (2019) Plastic amp climate the hidden costs
of a plastic planet Center for International
Environmental Law
httpswwwcielorgplasticandclimate
raquo Chidambarampadmavathy (2017) Sustainable
bio-plastic production through landfill methane
recycling Renewable and Sustainable Energy
Reviews Volume 71 May 2017 Pages 555-562
raquo Cole M Lindeque P Halsband C amp Galloway T S
References
| 68 |
R E F E R E N C E S
C O N T E N T S
| 69 || 69 |
(2011) Microplastics as contaminants in the
marine environment a review Marine pollution
bulletin 62 2588-2597
raquo Commonwealth of Australia (2016) Toxic tide the
threat of marine plastic pollution in Australia
Environment and Communications Reference
Committee
raquo DAWE (2018) National Waste Policy - less waste
more resources Department of Agriculture Water
and the Environment
raquo DAWE (2019) National Waste Policy - Action plan
Department of Agriculture Water and the
Environment
raquo DELWP (2017) Port Phillip Bay Environmental
Management Plan The State of Victoria
Department of Environment Land Water
and Planning
raquo DELWP (2019) Victoria in Future 2019 ndash
Population Projections 2016 to 2056 The State of
Victoria Department of Environment Land Water
and Planning
raquo Depledge M Galgani F Panti C Caliani I Casini
S amp Fossi M (2013) Plastic litter in the sea Marine
environmental research 92 279-281
raquo Eerkes-Meedrano D Thompson R C amp Aldridge
D C (2015) Microplastics in freshwater systems a
review of the emerging threats identification of
knowledge gaps and prioritisation of research
needs Water research 75 63-82
raquo Galgani F Hanke G Werner S Oosterbaan
Nilsson P Fleet D (2013) Guidance on monitoring
of marine litter in European seas European
Commission
raquo Gall S amp Thompson R (2015) The impact of debris
on marine life Marine Pollution Bulletin 92 170-179
raquo Gasperi J Wright S L Dris R Collard F Mandin
C Guerrouache M Langlois V Kelly F J Tassing
B (2018) Microplastics in air are we breathing it
in Current Opinion in Envi Sci amp Health vol 1 1-5
raquo Gewert B Plassmann M M MacLeod M (2015)
Pathways for degradation of plastic polymers
floating in the marine environment
Environmental Science Processes amp Impacts vol
17 no 9 pp 1513-1521
raquo Hoellein T J McCormick A R Hittie J London
M G Scott J W amp Kelly J J (2017) Longitudinal
patterns of microplastic concentration and
bacterial assemblages in surface and benthic
habitats of an urban river Freshwater science
35(3) 000-000
raquo Jambeck J R Geyer R Wilcox C Siegler T R
Perryman M Andrady A Narayan R amp Law K L
(2015) Plastic waste inputs from land into the
ocean Science 347 768-771
raquo Jepson P D Deaville R Barber J L Aguilar A
Borrell A Murphy S Barry J Brownlow A
Barnett J Berrow S Cunningham A A Davidson
N J Ten Doeschate M Esteban R Ferreira M
Foote A D Genov T Gimenez J Loveridge J
Llvona A Martin V Maxwell D L Papachlimitzou
A Penrose R Perkins MW Smith B De Stephanis
R Tregenza N Verborg P Fernandez A Law R J
(2016) PCB pollution continues to impact
populations of orcas and other dolphins in
European Waters Nature Science Reports 6 18573
raquo Kim JS Lee HJ Kim SK Kim HJ (2018) Global
Pattern of Microplastics (MPs) in Commercial
| 70 |
Food-Grade Salts Sea Salt as an Indicator of
Seawater MP Pollution Environ Sci Technol
2018 52 21 12819-12828
raquo Klein S Worch E Knepper T P (2015) Occurrence
and spatial distribution of microplastics in river
shore sediments of the Rhine-Main area in
Germany Environmental Science amp Technology
vol 49 no 10 pp 6070-6076
raquo Kowalczyk N Kelly A (2020) Litter and Flows
Connecting the Yarra and Bay Yarra Riverkeeper
Association
raquo Lamb JB Willis BL Fiorenza EA Couch CS
Howard R Rader DN True JD Kelly LA Ahmad
A Jompa J Harvell CD (2018) Plastic waste
associated with disease on coral reefs Science
359 460-462 (2018)
raquo Lavers J L Bond A L (2017) Exceptional and
rapid accumulation of anthropogenic debris on
one of the worldrsquos most remote and pristine
islands Proceedings of the National Academy of
Sciences 201619818
raquo Lavers J L Bond A L amp Hutton I (2014) Plastic
ingestion by Flesh-footed Shearwaters (Puffinus
carneipes) Implications for fledgling body
condition and the accumulation of plastic-derived
chemicals Environmental Pollution 187 124-129
raquo Lima A Costa M amp Barletta M (2014) Distribution
patterns of microplastics within the plankton of a
tropical estuary Environmental Research 132
146-155
raquo Ling S Sinclair M Levi C Reeves S amp Edgar G
(2017) Ubiquity of microplastics in coastal seafloor
sediments Marine Pollution Bulletin 121(1-2)
raquo Lusher A Hollman P Mendoza-Hill J (2017)
Microplastics in Fisheries and Aquaculture ndash
status of knowledge on their occurrence and
implications for aquatic organisms and food
safety Food amp Agriculture Organisation of the
United Nations Technical paper 615 Abstract V
raquo Mai L Bao LJ Shi L Wong CS Zeng EY (2018)
A review of methods for measuring microplastics
in aquatic environments Environ Sci Pollut Res
25 11319-11332 (2018)
raquo Mani T Hauk A Walter U amp Burkhardt-Holm P
(2015) Microplastics profile along the Rhine River
Scientific Reports 5 17988
raquo Mattson K Johnson E V Malmendal A Linse S
Hansson L-A Cedervall T (2017) Brain damage
and behavioural disorders in fish induced by
plastic nanoparticles delivered through the food
chain Scientific Reports volume 7 Article
number 11452 (2017)
raquo Melbourne Water (2018) Co-Designed Catchment
Program for the Maribyrnong Catchment Region
(including Moonee Ponds Creek) ndash October 2018 |
Version 1
raquo Melbourne Water (2018) Co-Designed Catchment
Program for the Yarra Catchment ndash October 2018
| Version 1
raquo Moore C amp Phillips C (2011) Plastic Ocean How a
sea captainrsquos chance discovery launched a
determined quest to save the oceans Avery
New York
raquo Murray F amp Cowie P R (2011) Plastic
contamination in the decapod crustacean
Nephrops norvegicus (Linnaeus 1758) Marine
pollution bulletin 62 1207-1217
References (cont)
R E F E R E N C E S
C O N T E N T S
| 71 |
raquo OrsquoFarrell K (2019) 2017-2018 Australian Plastics
Recycling Survey ndash National Report Envisage
Works Australian Government Department of the
Environment and Energy EPA NSW Sustainability
Victoria Government of Western Australia ndash
Department of Water and Environmental Regulation
raquo Orb Media (2017) Invisibles the plastics inside us
Orbmediaorgstoriesinvisibles_plastics
raquo Pattison M (2020) Analysis of microplastic
polymers in the Yarra and Maribyrnong Rivers
Unpublished Honours dissertation
raquo Rochman C M Hoh E Kurobe T amp Teh S J
(2013) Ingested plastic transfers hazardous
chemicals to fish and induces hepatic stress
Scientific reports 3
raquo Royer S-J Ferroacuten S Wilson S T Karl D M (2018)
Production of methane and ethylene from plastic
in the environment PLOS One 13(8) e0200574
raquo Sadri S S amp Thompson R C (2014) On the
quantity and composition of floating plastic debris
entering and leaving the Tamar Estuary Southwest
England Marine pollution bulletin 81 55-60
raquo Schwartz A E Ligthart T N Boukris E Van
Harmelen T (2019) Sources transport and
accumulation of different types of plastic litter in
aquatic environments A review study Marine
Pollution Bulletin 143 (2019) 92-100
raquo Sustainability Victoria (2019) Microplastics and
Port Phillip Bay - Citizen science study finds
significant amounts of microplastics on Port
Phillip Bay beaches Summary report
raquo Teuten E L Saquing J M Knappe D R Barlaz M
A Jonsson S Bjoumlrn A Rowland S J Thompson
R C Galloway T S amp Yamashita R (2009)
Transport and release of chemicals from plastics
to the environment and to wildlife Philosophical
Transactions of the Royal Society of London B
Biological Sciences 364 2027-2045
raquo Thompson R C Olsen Y Mitchell R P Davis A
Rowland S J John A W McGonigle D amp Russell
A E (2004) Lost at sea where is all the plastic
Science 304 838-838
raquo UNEP (2016) Marine plastic debris and
microplastics ndash Global lessons and research to
inspire action and guide policy change United
Nations Environment Programme Nairobi
raquo World Health Organisation (2019) Microplastics in
drinking water WHO Technical report
raquo Zeynep A Basak G (2019) Microplastics in the
environment A critical review of current
understanding and identification of future
research needs Environmental Pollution 254
(2019) 113011
raquo Yonkos L T Friedel E A Perez-Reyes A C
Ghosal S amp Arthur C D (2014) Microplastics in
four estuarine rivers in the Chesapeake Bay
USA Environmental science amp technology 48
14195-14202
raquo ZonMW (2019) httpswwwzonmwnlen
research-and-resultslife-sciences-health
programmasprogramme-detail
microplastics-health
Imag
e J
osi
e Jo
ne
s
Imag
e J
osi
e Jo
ne
s
Imag
e N
at S
ald
um
bid
e
PartnersClean Bay Blueprint involved a large geographical range and associated land and water managers and communities The project outcomes achieved would never have been possible without the collaboration and contribution of our project partners
Our primary project partners were the Department of Environment Land Water and Planning Yarra Riverkeeper Association Werribee River Association Beach Patrol Australia (in particular the St Kilda Rye Seaford Frankston Mt Martha and Werribee groups) Balcombe Estuary Reserve Group Mt Martha Dolphin Research Institute Bellarine Catchment Network Monash University Worcester Polytechnic Institute Blairgowrie Yacht Squadron and 5 Gyres Institute A full list of contributors can be found in the Acknowledgements
Clean Bay Blueprint was funded by the Port Phillip Bay Fund
Acknowledgement of countryThe Port Phillip EcoCentre acknowledges the First Peoples on whose lands and waters this research took place
We acknowledge Kulin Nation Elders past present and emerging and we
strive to uphold their connection to the land and waters We recognise that their sovereignty of these lands and waters was never ceded
1 Executive summary 4
2 Introduction 8
Port Phillip EcoCentre 9
Port Phillip Bay and catchments 9
Clean Bay Blueprint project 10
Project aims 101 Conducting rigorous and replicable
methods to quantify plastic pollution through microplastics trawls and beach litter audits 11
2 Engaging the community in citizen science activities 11
3 Building partnerships with other organisations that target litter and Bay health 11
Plastic pollution in the global context 11Effects on living organisms 12
Climate impacts of plastics 13
The cost of marine plastic pollution 14
Plastic pollution in Victoria 14
Policy context 16Australia 16
Victoria 17
Worldwide 17
3 Microplastics in the Yarra and Maribyrnong Rivers 18
Aims of the microplastics study 19Quantifying plastic pollution to inform legislative reform and behaviour change 19
Tracking changes in litter over time and establishing a baseline 19
Identifying the source of litter items 19
Study method 20Study site 20
River trawls 20
Sample analysis method 21
Trawl data analysis results 22Litter reaching Port Phillip Bay 23
Comparing the rivers 23
Analysis of plastic polymer types 25
Seasonal differences in litter 25
Changes in litter over time 26
Factors driving litter increases and spikes 31
Yarra and Maribyrnong microplastics research discussion 32
Litter increases 32
Litter composition in the rivers 33
Investigating litter by item category34
Seasonal variations36
Other factors influencing litter 36
Implications for marine life in the Yarra estuary and Port Phillip Bay 37
Further study on microplastics 38
4 Bay trawls pilot 40
5 Baykeeper Beach Litter Audits 42
Methodology 44Transect and quadrat placement 44
Selection of reference beach survey locations 44
Surveys conducted 45
Results and discussion46
6 Related litter investigations 50
Interactive litter maps 51
Incident reporting 51
7 Recommendations 52
Recommendation 1 Improve product stewardship 54
Recommendation 2 Cultivate effective partnerships 55
Recommendation 3Support local councils in waste management 55
Recommendation 4 Continue monitoring (micro)plastic pollution56
Recommendation 5 Increase education and lsquoplastic literacyrsquo of all plastic users 56
Recommendation 6 Conduct further research 57
8 A note on citizen science 58
9 Acknowledgements 60
Appendices 62Appendix 1 62
Appendix 2 63
Appendix 3 64
Appendix 4 65
Appendix 5 66
Appendix 6 67
References 68
Contents
St Kilda breakwater Port Phillip Bay
1
C O N T E N T S
| 5 |
Clean Bay Blueprint is a three-year litter study conducted between July 2017 and June 2020 The project was funded by the Victorian Governmentrsquos Port Phillip Bay Fund as part of their commitment to deliver the Port Phillip Bay
Environmental Management Plan 2017ndash2027 (Port Phillip Bay EMP) The aims of Clean Bay Blueprint are conducting rigorous and replicable methods to quantify plastic pollution through microplastics trawls and beach litter audits engaging the community in citizen science activities and building partnerships with other organisations that target litter and Bay health A range of complementary investigations were undertaken in parallel to the projectrsquos primary research and where appropriate such activities as well as peer-reviewed research inform the Clean Bay Blueprint recommendations
Microplastics in the Yarra and Maribyrnong rivers
The potential for microplastic pollution to harm
aquatic life is recognised by scientists as a global
problem Microplastics are classified as pieces of
plastic smaller than 5 mm in diameter which
originate from broken-up larger plastic products
This study highlights the pervasiveness of plastics
in our urban water catchments and reflects their
ubiquitous use mobility and extreme persistence
The trawls removed a total of 40030 litter items
from the surface waters of the Yarra and 13658
litter items from the surface waters of the
Maribyrnong River In total over 25 billion litter items flow into Port Phillip Bay annually from the two riversrsquo surface waters Over 2 billion (85) of these items are microplastics Microplastics
accounted for 85 and 83 of the total litter count
in the Yarra and Maribyrnong respectively
In both rivers the vast bulk of the litter caught
consisted of hard plastic remnants of broken-up
plastic items followed by polystyrene and soft
plastics Polystyrene is more problematic in the
Yarra whereas the Maribyrnong carries relatively
more nurdles plastic bottle caps plastic straws
twine and cigarette butts
Although large variations in monthly collections
were noted through the entire study period it was
found the Yarra River carries significantly more litter
than the Maribyrnong
An alarming result of this study is that litter is
increasing in both the Maribyrnong and the Yarra
with plastic pollution in the Yarra increasing at a
much faster rate The rate at which plastic pollution
in both rivers is increasing is very high litter in the
Yarra increased by 400 in 2017 compared to 2016
and then in 2019 it again more than doubled
compared to 2018 levels The Maribyrnong saw a
more gradual increase over time but still increased
by around 57 to 83 year on year since 2017
Executive summary
| 7 || 6 |
Interestingly plastic straws is the only litter item
category declining over time This is most likely due
to community advocacy and action by retailers to
reduce their use showing that community action
and individual behaviour change work
Microplastics trawls in the Bay
To gain insight into the relative quantities of
microplastics entering the Bay from Bass Strait as
compared to the major rivers a pilot project of nine
manta net trawls was conducted at the entrance to
Port Phillip Bay
Of the nine trawl samples collected at Popersquos Eye in
Port Phillip Bay eight contained plastics
Microplastics made up 64 of samples The most
prevalent items were hard plastic fragments which
aligns with results from the river trawls and
Baykeeper beach litter audits
Baykeeper Beach Litter Audits
The Baykeeper Beach Litter Audit is a citizen
science method designed to focus on microplastic
pollution Twelve beaches around the Bay were
surveyed multiple times with the help of various
community groups Hard plastic fragments and
nurdles were the most recorded items
Recommendations
In view of the high quantities of litter and
microplastics recorded in this study the negative
effects plastic pollution may have on wildlife in
Port Phillip Bay and the potential threat to human
health in the longer term six recommendations for
land managers government industry and
researchers have been formulated based on the
findings in this report
1 Improve product stewardship
11 Transition to a circular economy model
12 Invest in implementing alternatives to plastic
13 Set limits on virgin plastic production
14 Ban broad-scale groups of problematic
single-use plastics
15 Make the Operation CleanSweep program
mandatory
1 E X E C U T I V E S U M M A R Y
| 7 |C O N T E N T S
2 Cultivate effective partnerships
3 Support local councils in waste management 31 Install and maintain pollutant traps in drain
outlets that discharge into creeks and rivers
32 Enforce litter and illegal dumping laws
33 Run effective litter prevention and education
programs
34 Review and improve current street-sweeping
schedules
4 Continue monitoring (micro)plastics pollution
5 Increase education and lsquoplastic literacyrsquo of all plastic users
51 Set standard legal definitions
52 Develop project grants forums and
strategic ongoing partnerships
53 Adequately resource groups who educate
and facilitate action on plastic pollution
6 Conduct further research 61 Conduct depth-sampling studies
62 Conduct sediment studies
63 Prioritise understanding the contaminants
carried by plastic in waterways and
associated human health risks
64 Conduct on-ground investigations for
major sources
A wide body of research now confirms that the
current pace of rethinking plastics is insufficient to
match the scale of increasing plastic pollution in
our air water soil food chain and human bodies
Substantial changes are justified This study
demonstrates that Melbourne faces an alarming
increase in waterway contamination This poses
particular concern considering the relatively
enclosed configuration of Port Phillip Bay and the
Bayrsquos importance as a recreational fishery
As of July 2021 the jurisdictions studied in Clean
Bay Blueprint are subject to Victoriarsquos legislated
General Environmental Duty to protect the
environment and human health We hope this
studyrsquos baseline data provides government land and
water managers businesses and community with a
clear mandate to invest in reforms that address
plastic pollutionrsquos ongoing threat to Victoriarsquos
economic social and environmental wellbeing
Frankston Pier
2
EcoCentre volunteers conducting a Baykeeper Beach Litter Audit Image Nat Saldumbide
C O N T E N T S
| 9 |
Introductiongt Port Phillip EcoCentre
The Port Phillip EcoCentre (the EcoCentre) is an independent environmental not-for-profit organisation Its mission is to build relationships educate and demonstrate sustainable environmental practice and strengthen peoplersquos connection to the natural world
The EcoCentre is a leading community-managed
organisation with a dedicated team of scientists
educators and volunteers who design and
implement innovative environmental programs Its
expertise is to activate people to look after the
health of Port Phillip Bay and its waterways and
catchments as well as the urban ecology of Greater
Melbourne within the traditional lands and waters
of the Kulin Nation The EcoCentre delivers
specialist education citizen science research and
community action projects with over 250 cross-
sector partners
The EcoCentre is also home to the Port Phillip
Baykeeper who provides an independent voice for
Port Phillip Bay The Baykeeper is affiliated with the
Waterkeeper Alliance (an international network of
waterways protectors) and works closely with the
Yarra Riverkeeper and Werribee Riverkeeper in
protecting their respective waterways each with a
strong local support base
Port Phillip Bay and catchments
Port Phillip Bay is the largest marine embayment in
Victoria with a surface area of 1934 km2 and
333 km of coastline (DELWP 2017) It is relatively
shallow at 13 m average depth and almost half of it
is less than 8 m deep Situated along its northern
shores is the City of Greater Melbourne with a
population of nearly five million people (DELWP
2019) The City of Greater Geelong is located in the
south west
The Bayrsquos catchment area is 9694 km2 with several
rivers creeks and many storm water drains draining
into the Bay (DELWP 2017) The Yarra and
Maribyrnong are the largest of the rivers and flow
through heavily urbanised areas before reaching the
north end of the Bay
| 10 |
Clean Bay Blueprint project
Clean Bay Blueprint is a three-year litter study
conducted between July 2017 and June 2020 The
project was funded by the Victorian Governmentrsquos
Port Phillip Bay Fund as part of its commitment to
deliver the Port Phillip Bay Environmental
Management Plan 2017ndash2027 (Port Phillip Bay EMP)
Clean Bay Blueprint delivers outcomes for the Port
Phillip Bay EMPrsquos Priority Area 4 ndash Litter
Clean Bay Blueprint takes a catchment-to-coast
approach investigating catchment coast and Bay
litter as a whole Litter recognises no geographical
boundaries as it travels from the burbs to the Bay
all areas are connected which makes an integrated
approach to litter research necessary This
integrated approach will help to get a better
understanding of litter prevalence and movement
with the goal of informing local litter source
reduction plans to achieve better environmental
outcomes To gather data from a range of regions
over time a citizen science approach was applied
for community volunteers to collect and contribute
data according to prescribed methods
Project aims
This projectrsquos research methods were designed
primarily to document microplastics which are
defined by Thompson et al (2004) as plastic pieces
between 1 μm and 5 mm in diameter Microplastics
in the environment mostly result from the
inappropriate disposal of consumer products and
industrial by-products and waste that break up into
smaller pieces Their small size renders them
unlikely to be collected in conventional litter traps
by beach-cleaning rakes or manual clean-ups The
Figure 1 Port Phillip Bay and catchment (Image source Port Phillip Bay Environmental Management Plan 2017ndash2027 DELWP 2017)
F I G U R E 1
2 I N T R O D U C T I O N
C O N T E N T S
| 11 |
small size of microplastics causes them to be easily
overlooked when picking up litter even when
clean-ups include a data recording component
Microplastics are recognised as a threat to
waterways and oceans worldwide due to their
small size which makes them easily ingested by
wildlife Clean Bay Blueprint is the latest of the
EcoCentrersquos microplastics research projects which
commenced in 2013 and has refined study
methods in consultation with CSIRO RMIT
University EPA Victoria and others
The three aims of Clean Bay Blueprint are
gt 1 Conducting rigorous and replicable methods
to quantify plastic pollution through
microplastics trawls and beach litter audits
To reflect the catchment-to-coast approach river
and Bay boat trawls as well as land-based litter
audits were conducted The quantification of
microplastics in rivers by trawling is the first research
project of its kind in Australia (see Chapter 3) The
Baykeeper Beach Litter Audits quantify plastics and
microplastics on seven beaches associated with
urbanised stormwater catchments around the Bay
using an audit method that is specifically designed
to collect samples that are representative of all
conditions on a beach and can be performed by
citizen scientists (see Chapter 5)
gt 2 Engaging the community in citizen science
activities
Citizen science is an excellent way of engaging the
community in place-based learning empowering
people to take practical action to create positive
change for the environment as well as regularly
gathering data to track volumes of plastic pollution
over time The Baykeeper Beach Litter Audits
conducted for this project engaged various
community groups schools tertiary students and
individual community members in scientific data
collection education and conversations about plastic
pollution Awareness raised through citizen science
activities is aimed to increase positive behaviour
change in addition to collecting useful data
Evidence to support the case for governments
industry and communities to make changes to
reduce any threatening process will necessarily be
collected systematically over time and space to
confirm the threat is widespread and ongoing The
extent of data collection required over such time
and space would not be achievable without the
contribution of dedicated citizen scientists
gt 3 Building partnerships with other
organisations that target litter and Bay health
Many government environmental and community
organisations have started researching educating
and raising awareness on litter As litter has become
a problematic issue on many different levels
integrated approaches and cross-sector
collaborations are integral to the success of its
reduction in the environment
Over the project life a range of complementary
projects and additional investigations took place
including land surveys data visualisation polymer
analysis of plastic fragments and prototyping a
depth-sampling device to extend surface trawls
Plastic pollution in the global context
Widespread production and consumption of
single-use plastics inadequate waste management
and infrastructure and regulations improper waste
management practices inadequate wastewater
treatment and littering have led to tonnes of marine
plastic pollution entering the ocean on a daily basis
Jambeck et al (2015) estimated that around eight
million metric tonnes of our plastic waste enter the
oceans from land each year often via rivers (Mani
et al 2015)
| 12 |
Two main types of hard microplastics are found
most often in waterways and oceans nurdles and
fragments (Barnes et al 2009) Nurdles also known
as pre-production pellets are the pre-fabrication
material for a wide range of industrial and
consumer plastic products They are classified as
primary plastics and they enter the aquatic
environment mainly through accidental spillage and
poor product management at processing plants
and during transport (Cole et al 2011) They are
spherical or flat-cylindrical in shape and are often
transparent or black although it is not uncommon
to find white red yellow and blue nurdles (picture
1) Hard plastic fragments are known as secondary
microplastics and are derived from the breakup of
larger plastic items They are irregular in shape and
vary greatly in colour due to their primary design
Once in the ocean microplastics can persist for
thousands of years (Andrady 2006) and have been
observed in marine systems worldwide (Cole et al
2011 Barnes et al 2009)
Picture 1 Nurdles (left) and hard plastics fragments (right)
In 2018 alone 359 million metric tonnes of plastic
were produced globally (Statista 2020) and
modelling by Borelle et al (2020) shows that
predicted levels of plastic lost in the environment
will be 53 million metric tonnes per year by 2030 if
no additional action is taken Because of plasticrsquos
durability and extreme mobility (it floats flies and
sinks) it eventually enters our waterways either by
accident or intentionally (Moore and Phillips 2011)
The large litter items frequently captured in this study
including straws lolly wrappers and plastic bottle
caps eventually deteriorate through physical
biological and chemical processes (Andrady 2011)
into tiny fragments that enter Port Phillip Bay at an
alarming rate and can be ingested by aquatic animals
gt Effects on living organisms
Marine plastic pollution has become an urgent
issue affecting wildlife in waterways and oceans
Worldwide at least 690 species have encountered
plastic pollution many of which are listed as
threatened species (Gall and Thompson 2015)
Ingestion of plastic including microplastics can
lead to injury (eg blocked digestive tracts and
organ rupture) and death (Lavers et al 2014)
Furthermore in addition to leachable chemicals
that are added in the manufacturing process itself
plastics adsorb (attract as an exterior film) organic
micro-pollutants or persistent organic pollutants
(POPs) which include polychlorinated biphenyls
(PCBs) Dichlorodiphenyldichloroethylene (DDE) and
nonylphenol (Teuten et al 2009) The ingestion of
these toxic chemicals is known to affect the
physiology and behaviour of organisms which
ultimately affects population stability as shown by
reproductive dysfunctions caused by PCBs in orca
and dolphin populations in Europe (Jepson 2016)
Lamb et al (2018) calculated that the likelihood of
disease in corals that are in physical contact with
plastics increases from 4 to 89 and that by 2025
an estimated 444 billion pieces of plastic items will
be entangled in coral reefs through the Asia-Pacific
Plastic chemicals bioaccumulate and biomagnify
up the food chain (Figure 2) This increasing
P I C T U R E 1
2 I N T R O D U C T I O N
C O N T E N T S
| 13 |
concentration of toxic chemicals in the tissues of
organisms at successively higher levels in a food
chain has been linked to disease and death in
several top predators (Gall and Thompson 2015)
Figure 2 The process of biomagnification of plastic
toxins up the food chain
Relatively few marine and freshwater systems in
Australia have been systematically investigated for
microplastic pollution This is of grave concern
considering coastal and estuarine systems around
Australia are some of the most biodiverse
ecosystems in the world More particularly the
relatively enclosed waters of Port Phillip Bay which
supports an aquaculture industry and a growing
recreational fishery are subject to runoff from
urbanised catchments The potential for marine
plastic pollution to cause environmental harm is
recognised as a global problem and is listed as one of
the greatest threats to marine biodiversity (Gall and
Thompson 2015 Depledge et al 2013) A review of
current understandings of microplastics in the
environment and future research needs by Zeynep
and Basak (2019) concluded that the extent and
effects of microplastic pollution in continental
environments such as rivers lakes soil and air is still
poorly understood Microplastic contamination of
aquatic environments will continue to increase for
the foreseeable future and at present there are
significant knowledge gaps on the occurrence in the
aquatic environment and organisms of the smaller
sized microplastics (less than 150 μm) and their
possible effects on seafood safety (Lusher et al
2017)
Several studies have shown that plastics are now
inside human bodies via our food (Kim et al 2018)
drinking water (Orb Media 2017) and even the air
we breathe (Gasperi et al 2018) It is currently
unknown what if any health effects there are on
human populations (WHO 2019) However in 2019
a research program started in the Netherlands
investigating the potential health effects of ingested
microplastics in humans (ZonMW 2019) Results of
these studies will be released in the near future
gt Climate impacts of plastics
Plastic is linked to climate impacts through
F I G U R E 2
| 14 |
emissions at multiple stages of its lifecycle
Greenhouse gas emissions happen at every step in
the lifecycle of a plastic product the extraction of
fossil fuels and transport plastic refining and
manufacture plastic waste management and the
ongoing impacts of it while polluting the
environment including the oceans (CIEL 2019)
Plastic continues to release greenhouse gases as it
photodegrades when littered (Royer 2018) and
produces methane when degrading in landfills
(Chidambarampadmavathy 2017) Plastic
production also requires large volumes of water in a
world with finite availability of clean freshwater
gt The cost of marine plastic pollution
The following paragraphs are taken from Toxic tide
the threat of marine plastic pollution in Australia a
report delivered to the Federal Senate by the
Environmental amp Communications References
Committee (Commonwealth of Australia 2016)
266 Professor Smith stated that lsquoa key
problem in determining the source of all items
is that fragmented plastics are often the most
numerous and there is no simple way to
determine their sourcersquo Professor Underwood
similarly told the committee that there is
lsquoinsufficient researchrsquo to answer the question
of where marine plastic pollution is sourced
296 Dr Britta Denise Hardesty CSIRO
commented that lsquothe cost of littering and
debris to fisheries small business and
human health remain poorly understood
and littering costs to local government due
to remediation and tourism losses are
substantialrsquo In answer to the committeersquos
questions concerning the estimates of the
damage from marine debris on Australiarsquos
tourism fishing and shipping the
Department of the Environment added that
it did not have any estimates nor did other
Commonwealth agencies including the
Great Barrier Reef Marine Park Authority the
Australian Maritime Safety Authority and the
Australian Fisheries Management Authority
Other than projects funded by the Port Phillip Bay
Fund there has been limited research to address
knowledge gaps in relation to sources and ecosystem
impacts of plastic pollution across Australia since the
release of the Senate Inquiry report in 2016
Plastic pollution in Victoria
Locally Port Phillip Bay and surrounding waters are
supporting an ecosystem that is home to an
estimated 10000 species with many of those
species unique to the Bay1 Most plastic pollution in
Port Phillip Bay originates from land-based sources
Diverse sources include urban streets freeways and
roadside verges stormwater drains wastewater
treatment plants and river and creek runoff
Although plastic pollution has been repeatedly
identified as a major threat to Victorian waterways
there has been limited scientific assessment since
the Melbourne Water Tagged Litter Study in 1993
The EcoCentrersquos Yarra and Maribyrnong river trawls
commenced in 2014 the Litter Trackers project by
RMIT and Melbourne Water was conducted in 2019
and Sustainability Victoria recently conducted a
microplastics study on six beaches around the Bay
In this study they found between 167 and 1232
microscopic microfibres from clothing per kilogram
of sand (Sustainability Victoria 2019)
The Yarra Riverkeeper Association removed
approximately 8000 kg of waste from the Yarra and
Maribyrnong between 2017 and 2020 (Kowalczyk
and Kelly 2020) with some of the most common
collected items being foam insulation and
packaging plastic bottles and cigarette butts Both
this project and their 2020 polystyrene study in
1 httpswwwmarineandcoastsvicgovaugrants port-phillip-bay-fund
2 I N T R O D U C T I O N
C O N T E N T S
| 15 |
A close-up of the Balcombe Estuary nurdles
collaboration with Clean Water Group point to
polystyrene being a major waterway pollutant in
metro Melbourne (Barmand et al 2020)
Community groups such as Beach Patrol Bellarine
Catchment Network various Friends groups and
others across the catchments spend countless
hours of people power cleaning up beaches and
waterways Over the last few years the EcoCentre
has played a role in shifting the general focus from
merely picking up and disposing of the litter to
collecting data on what is found to be used in
advocacy efforts to reduce plastic pollution in the
environment Since February 2018 Scouts Victoria
and the EcoCentre have collaborated in the state
governmentndashfunded Street2Bay project
conducting litter audits with particular attention to
microplastics on streets in all catchments
around the Bay
Bandalong litter trap in the Yarra
| 16 |
Policy context
gt Australia
From 2018 Chinarsquos new bans and 995 purity
standards for uncontaminated recyclables left
Australia with large stockpiles of items now needing
onshore processing Extensive ripple impacts of this
challenge ndash from facility fires to paying fees to send
recyclable plastics to landfill ndash have compelled
significant rethinking of Australian waste
management systems including materials redesign
reduction re-use and recycling Industry bodies
and the Australian Government considered plastics
and other materials in a range of commitments and
aspirations towards an Australian circular economy
in which lsquowastersquo and pollution are designed out
and products and materials are kept in use through
principles such as repair and maximising use of
recycled materials over virgin resources
Australiarsquos National Waste Policy Less waste more
resources (Commonwealth of Australia 2018) and
National Waste Policy Action Plan (2019) apply the
lsquoprinciples of a circular economy to waste
management to support better and repeated use of
our resourcesrsquo The targets include reducing
Australian waste by 10 per capita by 2030 and to
lsquophase out problematic and unnecessary plastics by
2025rsquo Waste policies focus on plastic diversion from
landfill however plastic uncontained by
management systems (eg lost as litter dumping or
spillage) becomes pollution of ecological and
economic concern due to its persistence in the
environment On 18 June 2015 the Senate referred
the threat of marine plastic pollution in Australia for
parliamentary inquiry and report by 8 April 2016
The final report Toxic tide the threat of marine
plastic pollution in Australia was presented on 20
April 2016 (Commonwealth of Australia 2016) The
need for systematic data collection on the extent of
plastic pollution was stated in Recommendation 1
of the report
Blair Stafford conducting a microplastics trawl in the Bay with a manta net
2 I N T R O D U C T I O N
C O N T E N T S
| 17 |
2 httpsnicholasinstitutedukeeduplastics-policy-inventory
The committee recommends that any future
Australian Government policies on mitigating
the threat from marine plastic be underpinned
by sound peer-reviewed research
gt Victoria
Plastic pollution is relevant under a range of Victorian
policies and strategies to manage waste and protect
human health and biodiversity In some instances
plastic pollution is discussed explicitly as in the
plastic bag ban (Environment Protection
Amendment Act 2019) or Recycling Victoria lsquoKey
Commitment 3 Address plastics pollutionrsquo Managing
plastics can also fall under broader principles such as
the goal lsquoVictoriarsquos natural environment is healthyrsquo in
Biodiversity 2037 the lsquowastes hierarchyrsquo principle of
environmental protection in the Environmental
Protection Act Victoria (1970) and the introduction of
General Environmental Duty in the Environment
Protection Amendment Act 2018 The General
Environmental Duty requires all Victorians to manage
risks to human health and the environment that their
activities create and becomes active from July 2021
Studies that quantify the effects and extent of
microplastics are necessary to inform policy
frameworks that reduce plastic pollution establish
waterway management strategies and assess
biodiversity health Interim results of the Clean Bay
Blueprint study have helped inform government
documents including
raquo State of the Yarra and its Parklands (2018) ndash
Commissioner for Environmental Sustainability
Victoria
raquo Assessment of the Values of Victoriarsquos Marine
Environment (2019) ndash Victorian Environmental
Assessment Council
A written submission by the EcoCentre to the 2018
review of the State Environment Protection Policy
(Waters) using the results of EcoCentre
microplastics studies led to lsquoplastics and
microplasticsrsquo being added to the list of legally
defined waterway pollutants in Victoria
Prior to the EcoCentrersquos research plastic and
microplastic pollution were not reported in
Victorian State of the Environment reports nor
specifically included in legislated protections
gt Worldwide
The United Nations Sustainable Development Goals
(SDGs) are 17 interlinked goals to achieve lsquoa better and
more sustainable future for allrsquo The management of
plastic materials relates to several SDGs
raquo Goal 12
Responsible production and consumption
raquo Goal 13 Climate action
raquo Goal 14 Life below water
raquo Goal 15 Life on land
The United Nations Environment Programme
(UNEP) has produced numerous studies on plastic
pollution and prevention in the last five years
Assessing policy efforts in 60 countries around the
globe the UNEP reports Single-Use Plastics
Roadmap to Sustainability (2018) includes ten
recommendations including (1) target the most
problematic single-use plastics by collecting
baseline data (5) raise public awareness (7) provide
incentives to industry and (9) enforce new
measures effectively
In 2020 Duke University launched a Plastics Policy
Inventory2 as a searchable database of public policy
documents targeting plastic pollution This includes
the language year enacted location and
jurisdictional level This document is updated
quarterly due to the rapidly evolving nature of policy
responses to address the health economic and
amenity threats of plastic and microplastic pollution
Melbourne City over the Yarra River
3
C O N T E N T S
| 19 |
Microplastics in the Yarra and Maribyrnong RiversThe first ever litter trawls done in rivers in Australia were conducted by the EcoCentre in 2013 The resulting report Pilot study to identify the extent of
microplastics in the Maribyrnong and Yarra Rivers and Port Phillip Bay (July 2014) showed that microplastics were present in Melbournersquos two largest rivers As a result of this pilot study monthly trawls were continued through the Turn off the Tap project (2014ndash2017) funded by the Victorian Government The final samples of this study spiked in microplastic litter which seemed to show an upward trend over time indicating further investigation was warranted Subsequently the Port Phillip Bay Fund funded Clean Bay Blueprint (2017ndash2020) for another three years of continuous research This report presents analysis of the outputs from both these projects and uses the full 55 years of data collected
Aims of the microplastics study
Within Clean Bay Blueprint the quantification of
plastics and microplastics in Melbournersquos two largest
rivers was done as a contained research study
which continued from a previous dataset collected
between 2015 and 2017 Its aims were the following
gt Quantifying plastic pollution to inform
legislative reform and behaviour change
When trawls commenced in 2014 there was no
reported evidence of the ongoing presence of
microplastic pollution in the rivers and Bay apart
from personal observations As legislative reform
and management decisions around litter need to be
driven by scientific evidence the first aims of the
study were to confirm the presence and quantify
the extent of the pollution
gt Tracking changes in litter over time and
establishing a baseline
Once presence is established the next step is to
monitor litter loads over time in order to track if
volumes increase or decrease Continuous
monitoring measures a baseline state of the river
which can be used to measure the effectiveness of
anti-litter measures taken to reduce the loss of
certain items in the environment In addition
monitoring allows researchers to notice unusual
spikes in litter loads or items that may have been
the result of mass spills and one-off pollution
events and might otherwise go unnoticed
gt Identifying the source of litter items
By tracking and quantifying the different litter items
encountered (eg polystyrene balls plastic drinking
straws cigarette butts) it may be possible to identify
| 20 |
their potential source locations This evidence could
be used to inform localised source reduction plans to
prevent an item type from entering the environment
in the first place Anecdotally known problem items
were analysed as distinct categories to learn more
about their prevalence in the waterways
Study method
gt Study site
The Yarra River flows 242 km from its source in the
forested Yarra Ranges National Park through to
central Melbourne where it enters Port Phillip Bay
More than one-third of Victoriarsquos population lives in
the Yarra catchment which covers about 4000 km2
(Barua et al 2013) The catchment includes 40
rivers and creeks including the Maribyrnong River
which runs for 160 km from its source on the
slopes of Mount Macedon The Maribyrnong
catchment covers 1408 km2
The trawl sites were selected on the basis of being
close to the lower reaches of each river and
therefore indicative of the total pollution load of each
respective catchment (Figures 3 and 4) The
Maribyrnong trawls commenced at the Water
Canon Jetty extending from the west bank of Coode
Island 300 m upstream from the Yarra The Yarra
trawls commenced underneath Bolte Bridge 25 km
upstream of the Yarra and Maribyrnong confluence
Figure 3 The locations of the Maribyrnong and Yarra catchments relative to the centre of Melbourne Images courtesy of Melbourne Water
Figure 4 Approximate trawl location transects in the Maribyrnong and Yarra Rivers
gt River trawls
A manta net designed to collect floating debris off
the waterrsquos surface was deployed from the side of
the boat and positioned outside of the wake zone
(picture 4A) Trawling was done according to
internationally standardised methods by Galgani
et al (2013) in each river all trawls commenced at
the same place travelling upstream for 30 minutes
with the boat motor operated at a constant 1000
rpm to operate the net effectively and maintain a
consistent speed for all trawls After 30 minutes the
net was retrieved the collection net (cod end)
removed (picture 4B) and placed in a container to
be dried in preparation for sorting and categorising
the contents
Between January 2015 and February 2020 a total of
113 monthly trawls were conducted in the
Maribyrnong and Yarra Rivers Both rivers were
trawled on the same day The distance covered in
each trawl varied slightly due to the effects of
different tides and prevailing wind conditions
encountered at the time While trawls were generally
done in a straight line river boating involves
changing course to safely navigate around other
watercraft that may be encountered and the course
of the trawls in each river was not rigidly defined
The lsquomouthrsquo of the manta net measures 600 mm
wide x 200 mm deep The net is 3 m long tapering
down to a 30 x 10 cmsup2 cod end Both the tapering
net and cod end are made of a 330 nm mesh size
The manta net is of the same specifications used
3 M I C R O P L A S T I C S I N T H E Y A R R A A N D M A R I B Y R N O N G R I V E R S
F I G U R E 4
F I G U R E 3
C O N T E N T S
| 21 |
by the 5 Gyres Institute to measure microplastics in
international studies In a recent review of methods
that measure microplastics in aquatic
environments Mai et al (2018) confirmed that this
collection method is recommended for large-scale
surface water sampling
gt Sample analysis method
Sample sorting was performed by trained citizen
scientists (picture 5) Dried trawl samples were
analysed by separating litter items from organic
matter with the naked eye using tweezers and
supplemental lighting Litter items were next sorted
by item type and the diameter measured with a
ruler after which the item was placed in the
corresponding size category Litter categories
included hard plastic fragments lt 2 mm hard
plastic fragments 2 mmndash5 mm hard plastic
fragments 6ndash10 mm hard plastic fragments gt
10 mm polystyrene beads lt 4 mm polystyrene
beads ge 4 mm plastic bottle caps plastic straws
soft plastics lt 5 mm soft plastics ge 5 mm lolly
wrappers cellophane lt 5 mm cellophane ge 5 mm
plastic pre-production pellets (nurdles) cigarette
butts twine sponge (synthetic sponge-like
materials) and lsquootherrsquo items which included
unidentified non-organic looking items
Internationally accepted guidelines define plastic
pieces smaller than 5 mm in diameter as
microplastics (Thompson et al 2004) In this study
the categories of hard plastic fragments lt 2 mm
hard plastic fragments 2 mmndash5 mm soft plastics lt
5 mm cellophane lt 5 mm nurdles and polystyrene
beads lt 4 mm were grouped into the microplastic
category Plastic items not visible to the naked eye
including microfibres were excluded from this study
due to logistical technical and funding constraints
Picture 4 A Manta net deployed on side of Yarra Riverkeeper vessel B Removable cod end used to collect microplastic samples
Picture 5 Citizen scientists sorting trawl samples at the EcoCentre
P I C T U R E 5
P I C T U R E 4 A P I C T U R E 4 B
| 22 |
Trawl data analysis results
The results of the sample analysis show
substantial concentrations of plastic litter
present in the Yarra and Maribyrnong Rivers
across all months of the year A total of 40030
litter items were captured and analysed from
the Yarra and 13658 litter items from the
Maribyrnong between January 2015 and
February 2020 An average of 690 litter items
were collected from the Yarra per monthly
trawl while an average of 248 litter items
were collected from the Maribyrnong per
monthly trawl
Because the Yarrarsquos width in the trawl location
is more than 160 times wider than the net and
the Maribyrnongrsquos width in the trawl location
is 120 times wider the actual extrapolated
volume of litter in both rivers is astounding
For the Yarra the rough calculation is
690 litter items x 48 half-hour sessions
day x 365 days x 160 times net width
yielding 1934208000 litter items
entering the Bay from the Yarra
annually
For the Maribyrnong this calculation is
248 litter items x 48 half-hour sessions
day x 365 days x 120 times net width
yielding 521395200 litter items
entering the Bay from the
Maribyrnong annually
Figure 5 Relative litter composition of items flowing into Port Phillip Bay from the Maribyrnong and Yarra rivers combined
Figure 6 Litter composition in trawl samples obtained from the Maribyrnong River
Figure 7 Litter composition in trawl samples obtained from the Yarra River
F I G U R E 5
F I G U R E 7
F I G U R E 6
3 M I C R O P L A S T I C S I N T H E Y A R R A A N D M A R I B Y R N O N G R I V E R S
C O N T E N T S
| 23 |
These calculations suggest that an average total of
2455603200 litter items flow into Port Phillip
Bay annually from surfaces of the Yarra and
Maribyrnong Rivers combined
It should be noted that since these litter items are
only caught in the surface waters (upper 200 mm)
this number is likely to be an underestimation of the
overall plastic pollution loading in each river
Different types of plastic display different levels of
buoyancy characterised as either positively
buoyant (floating at the surface) negatively buoyant
(sinks to the bottom) or neutrally buoyant (in the
water column) It is unknown how many items are
present in the water column or the sediments of
Melbournersquos waterways
gt Litter reaching Port Phillip Bay
Based on the 53688 litter items caught and
analysed the composition of litter entering Port
Phillip Bay shows that hard plastic fragments are by
far the most prevalent litter item (75) followed by
polystyrene (13) and soft plastics (10) (Figure 5)
Trawl samples weighed an average of
approximately 266 g most of which was organic
plant matter On average litter comprised 184 of
the total sample weight highlighting the
pervasiveness of litter in our waterways Over time
this percentage has stayed quite constant (see
Appendix 1)
gt Comparing the rivers
Hard plastic fragments polystyrene and soft
plastics were the most common items found in
both the Yarra and Maribyrnong (Figures 6 amp 7)
Hard plastic fragments made up the bulk of the
captured litter items comprising 74 of capture for
the Yarra and 76 of items captured in the
Maribyrnong
Polystyrene was the second most captured item
with 15 of items in the Yarra and 8 of items in
the Maribyrnong being polystyrene
Soft plastics (consisting of
cellophane lolly wrappers and
unidentifiable soft plastics) made up
9 of total items captured in the
Yarra and 13 in the Maribyrnong
When comparing the total litter
counts between rivers we found a
significant difference between the
Maribyrnong and Yarra Rivers
(chi-squared = 12954 df = 1 P lt
0001) with plastic litter overall more
likely to be found in the Yarra than
the Maribyrnong (Figure 8)
F I G U R E 8
Figure 8 Comparison of number of litter items in Maribyrnong and Yarra rivers
| 24 |
There is also an overall significant effect of the
rivers on distribution of plastics by item category
(chi-squared = 74726 df = 9 P lt 0001 Figure 9)
There are no significant differences in
proportions of hard plastic fragments in the
Maribyrnong or Yarra rivers (P gt 005)
There are proportionally more soft plastics
nurdles plastic bottle caps plastic straws
twine and cigarette butts in the Maribyrnong
river Conversely proportionally less of the
same items are in the Yarra river (P lt 005)
meaning that these items make up a higher
proportion of total litter counts in the
Maribyrnong than they do in the Yarra (see
Appendix 2)
When comparing polystyrene loads to the
expected proportions of polystyrene (based
on the total counts for the rivers) the
proportion of polystyrene is significantly less
than expected (P lt 005) in the Maribyrnong
and significantly more than expected in the
Yarra (P lt 005) this means polystyrene is
more likely found in the Yarra than in the
Maribyrnong
The proportion of lsquootherrsquo items is
significantly above expected in the
Maribyrnong (P lt 005) but for the Yarra
the proportion of lsquootherrsquo items was
nonsignificant (P gt 005)
F I G U R E 9
F I G U R E 1 0
Figure 9 Comparison of mean monthly number (plusmnSE) of litter items captured by the manta net in the Maribyrnong and Yarra Rivers between January 2015 and February 2020 Note that values shown are means but statistical tests were conducted on frequency of counts using chi-squared analyses (ie the standard errors should not be used to infer anything about statistical significance They are rough indicators of variation around a mean only)
Figure 10 Comparison between rivers of the total number of microplastics captured during river trawls
3 M I C R O P L A S T I C S I N T H E Y A R R A A N D M A R I B Y R N O N G R I V E R S
C O N T E N T S
| 25 |
In both rivers microplastics formed the bulk of litter
and accounted for 85 (34013 pieces) of the total
load in the Yarra and 83 (11388 pieces) of the
Maribyrnong load (Figure 10) Hard plastic
fragments lt 2 mm in length dominated the
microplastics category and accounted for 45 and
51 of microplastics in the Yarra and Maribyrnong
respectively
Of the earlier mentioned total litter items entering the
Bay microplastics make up nearly 85 which means
more than 2 billion (2076458066) microplastics flow
from the two rivers into the Bay every year
gt Analysis of plastic polymer types
Sorted trawl samples from July 2016 to August 2019
were sent to the Plastics Lab at RMIT where they
were analysed for plastic polymer types using
Fourier Transform Infrared Spectroscopy (FTIR)3
There are many polymer types each of which has
varying qualities that align it to typical uses
products or applications Through FTIR analysis
microplastics or fragments may be grouped
according to probable source products
In both the Yarra and the Maribyrnong rivers
polyethylene (PE) was the most prevalent polymer
(48 and 49 respectively) followed by
polypropylene (PP) (22 and 24 respectively)
polystyrene (PS) (15 and 79 respectively)
The Yarra River saw small amounts of 11 other
polymers each of which contributed less than 1
and 067 of samples were of an unknown
material The Maribyrnong saw a small abundance
of other polymers ranging from 1 to 005 and
had 088 of unknown material (see Appendix 3)
The two rivers showed similar trends over the
months for all three of the most prevalent polymers
The abundance of PE and PP did not statistically
differ between the Yarra and Maribyrnong (P = 067
P = 056 respectively) however PS was statistically
lower in the Maribyrnong (P = 002)
Interestingly polyethylene terephthalate (PET) and
polyvinylchloride (PVC) are some of the most
commonly produced and used plastics yet were
some of the least recorded in both the Yarra and
Maribyrnong Rivers
gt Seasonal differences in litter
There are significant effects of the seasons and the
rivers on the total count of litter (chi-squared =
12429 df = 3 P lt 0001) A comparison of total litter
by trawl indicates that there is more total litter in the
Yarra than in the Maribyrnong in any season There
was more litter in summer in both rivers However
proportionally in the Maribyrnong has more litter
in spring and autumn than is expected by chance
whereas in the Yarra the clear peak seasons are
summer and winter (Figure 11)
In summer and winter plastic litter is proportionally
higher in the Yarra than the Maribyrnong (P lt 005
for both seasons) In autumn and spring plastic litter
is proportionally higher in the Maribyrnong than the
Yarra (P lt 005 for both seasons)
Figure 11 Seasonal variation in the number of captured litter items in the Maribyrnong and Yarra Rivers between January 2015 and February 2020
3 This summary of results was used with permission from an unpublished Honours dissertation by M Pattison (2020)
F I G U R E 1 1
| 26 |
gt Changes in litter over time
The five years of data collection reveal large
increases in litter over time (Figure 13) Note the
difference in numbers on the y-axes when
comparing the rivers
Both rivers are showing a significant increase in
plastics over the sampling period although the trend
is somewhat more pronounced in the Yarra (tau =
017 z = 745 P lt 0001) than in the Maribyrnong (tau
= 010 z = 416 P lt 0001) (Figure 14)
Note the differences in percentages on the y-axes of
the respective rivers in Figures 15 and 16 which
show how much faster the Yarrarsquos litter has been
increasing over the last five years When combining
the above litter numbers and percentages there is a
similar increasing trend in litter en route to Port
Phillip Bay (Figure 17) It is unclear why there was
such an extreme increase in litter in the Yarra in 2017
The above results warranted a closer examination
of the changes in litter item categories over time
In the Maribyrnong hard plastic fragments soft
plastics and lsquootherrsquo are increasing over time
(P lt 005) (Figure 18)
Figure 19 shows that in the Yarra hard plastic
fragments soft plastics polystyrene sponge and
lsquootherrsquo in the Yarra are increasing over time (P lt 005)
However plastic straws are significantly decreasing
over time (z = -234 tau = -025 P = 0019)
All other plastics are steady showing neither a
significant increase nor decrease See Appendix 4
for more details
F I G U R E 1 2
Figure 12 shows more detailed litter item
distributions over the seasons for the separate
rivers Hard plastic fragments remain the largest
category of items throughout all seasons in both
rivers followed by polystyrene and soft plastics
Figure 12 Seasonal variation in the total number of captured litter items in the Maribyrnong and Yarra Rivers between January 2015 and February 2020 Note the difference in total litter items captured on the y-axes
Figure 13 Total number of captured litter items in the Maribyrnong and Yarra Rivers presented by trawl between January 2015 and February 2020 The labels indicate year month and trawl number A total of 62 paired trawls were conducted during this time Several litter spikes were recorded
Figure 14 Litter trends over time Litter in both rivers is increasing with litter in the Yarra increasing faster than in the Maribyrnong
3 M I C R O P L A S T I C S I N T H E Y A R R A A N D M A R I B Y R N O N G R I V E R S
C O N T E N T S
| 27 |
F I G U R E 1 3
F I G U R E 1 4
| 28 |
Baykeeper and Riverkeeper trawling for microplastics
F I G U R E 1 5 F I G U R E 1 6 F I G U R E 1 7
3 M I C R O P L A S T I C S I N T H E Y A R R A A N D M A R I B Y R N O N G R I V E R S
C O N T E N T S
| 29 |
Figure 15 Above Actual numbers of microplastics in the Maribyrnong Below Percentage increase in microplastics year-on-year
Figure 16 Above Actual numbers of microplastics in Yarra Below Percentage increase in microplastics year-on-year
Figure 17 Above Actual numbers of microplastics flowing to Port Phillip Bay Below Percentage increase in microplastics year-on-year
Figure 18 The number of plastic items by category across time in the Maribyrnong River (measured by trawl number) Note that axis scales are different for each plastic category Significant relationships are marked by an asterisk ()
F I G U R E 1 8
C O N T E N T S
| 30 |
F I G U R E 1 9
Figure 19 The number of plastic items by category across time in the Yarra River (measured by consecutive trawl numbers) Note that y-axis scales are different for each plastic category Statistically significant relationships are marked by an asterisk ()
Figure 20 Plot of microplastic count in both Yarra and Maribyrnong between 2015 and 2019 as a function of Melbournersquos population
Figure 21 Regression analysis showing a positive correlation between litter items captured and rainfall data Note that microplastic count was square root transformed to meet assumptions of a regression analysis
3 M I C R O P L A S T I C S I N T H E Y A R R A A N D M A R I B Y R N O N G R I V E R S
C O N T E N T S
| 31 |
gt Factors driving litter increases and spikes
A series of regression analyses were performed to
see what environmental factors could be driving
the increases in litter and some of the unusually
high litter counts in some of the trawls
Worldwide plastic pollution is usually positively
correlated with increases in population This indeed
applied in the Yarra and Maribyrnong as well with a
significant association between population in the
Greater Melbourne area from 2015 to 2019 and
counts of microplastics (t = 54 P = 0012)
Approximately 876 of the variation in microplastic
counts was explained by population numbers over
this time (adjusted R2 = 0876 Figure 20) which
indicates a very strong correlation
A regression analysis shows that the count of
microplastics was positively associated with total
rainfall in the previous 48 hours (t = 41 P lt 0001
Figure 21) Approximately 122 of the variation in
microplastic counts in the rivers was explained by
rainfall (adjusted R2 = 0122)
Rainfall data for the Maribyrnong was taken from
the Bureau of Meteorologyrsquos (BOM) weather station
at Melbourne Airport Rainfall data for the Yarra was
taken from the BOMrsquos Eltham weather station
To explain some of the high spikes in litter in the
Yarra two potential factors were tested for
Bandalong litter traps
The method of emptying the floating Bandalong
litter traps is focused on removing larger litter items
(gross pollutants) and does not allow for the
containment of microplastics The 2015ndash2020 dates
of the emptying of the traps in the Yarra River were
sourced from Parks Victoria Although there were
preliminary indications of litter spikes potentially
being caused by litter trap maintenance there
seemed to be no evidence of a correlation with the
data available (see Appendix 5) However additional
information sourced from Melbourne Water just
before finalising this report indicates that a more
targeted approach to investigating microplastics
leakage from Bandalong traps is appropriate Please
refer to the Yarra and Maribyrnong microplastics
research discussion below
There are currently no Bandalong litter traps in the
Maribyrnong river
Environmental water flow releases In drier periods of the year environmental water
flows are released on a needs basis from the upper
Yarra catchment to maintain the ecosystem health
of the networks of billabongs and wetlands
connected to the Yarra As these flows have the
potential to flush out litter caught in various places
along the river data on environmental water flow
releases between 2015 and 2020 were sourced
from Melbourne Water However a regression
analysis showed that there was no significant
association between environmental flow events
and plastic counts in the Yarra See Appendix 6 for
more details
F I G U R E 2 0
F I G U R E 2 1
| 32 |
Yarra and Maribyrnong microplastics research discussion
Clean Bay Blueprint and the preceding EcoCentre
projects are the first studies to investigate
microplastic loads in the Yarra and Maribyrnong
Rivers and provide the first estimation of microplastic
loads entering Port Phillip Bay on an annual basis
Every one of the 113 trawl samples analysed
between January 2015 and February 2020 contained
plastic pollution mostly consisting of microplastics
Nearly 25 billion pieces of plastic flow into Port
Phillip Bay annually from the surface waters of the
two major rivers of which over 2 billion are
microplastics smaller than 5 mm in diameter
These results are expected to be underestimations
of the litter volume entering the Bay as it does not
take into account the depth of the river and the fact
that high-density particles with additives or other
attachments and larger items will sink below the
level of trawled surface area (Mai et al 2018
Pattison 2020) As the mesh size of the net was
330 nm and sorting and counting of microplastics
was done with the naked eye particles smaller than
what could be caught in the net or observed and
confirmed as plastics during sorting (including
microfibres and nanoparticles) were not included It
must therefore be emphasised that total plastic
pollution numbers in the rivers are likely to be
much higher than the numbers in this report and
preventative and mitigating actions to reduce
plastic pollution are urgently required
gt Litter increases
An alarming result of this study is that litter is
increasing in both the Maribyrnong and the Yarra
with plastic pollution in the Yarra increasing at a
much faster rate The rate at which plastic pollution
in both rivers is increasing is very high litter in the
Yarra increased by 400 in 2017 compared to 2016
and then in 2019 it again more than doubled
compared to 2018 levels The Maribyrnong saw a
more gradual increase over time but still increased
by around 57 to 83 year on year since 2017
The Yarra exceeded the Maribyrnong in terms of
expected plastic pollution loads in 2016 (Charko
et al 2018) These changes are mostly driven by
increases in hard and soft plastic fragments and
polystyrene rather than the other categories of litter
meaning these are the litter categories that should
be addressed immediately at their source
As this study shows a very strong positive
correlation of plastic pollution with population
growth in Melbourne and the population of Greater
Melbourne is projected to grow from 5 million to 9
million by 2056 (DELWP 2019) it is expected that
plastic pollution increases will continue until
effective source reduction measures are taken
Nearly 25 billion pieces of plastic flow into
Port Phillip Bay annually from the surface waters
of the two major rivers of which over 2 billion are
microplastics smaller than 5 mm in diameter
3 M I C R O P L A S T I C S I N T H E Y A R R A A N D M A R I B Y R N O N G R I V E R S
C O N T E N T S
| 33 |
gt Litter composition in the rivers
Sample analyses revealed that hard plastic fragments
polystyrene and soft plastics were the most
common items captured Despite the manta netrsquos
selectivity to small buoyant items the sample results
largely align with several other local litter audits
Litter audits along the Westgate Park foreshore and
along St Kilda beaches between 2015 and 2017
revealed polystyrene packaging and soft plastics
(bits of plastic bags wrap cellophane etc) are the
second and third most dominant litter categories
after cigarette butts4 Hard plastic fragments were
the most captured items in manta net trawls in the
Bay (see Chapter 4) and the second most prevalent
litter items found on beaches around the Bay using
the Baykeeper Beach Litter Audit method to
monitor for microplastics (see Chapter 5)
Polystyrene is the most captured litter item in the
Bandalong litter traps in the Yarra River (Kowalczyk
and Kelly 2020) As cigarette butts much like other
heavier items sink after a relatively short period in
water and pass under the manta net their numbers
in the Yarra and Maribyrnong River trawls do not
align with general beach clean-up data where
cigarettes often dominate In addition beach
clean-up efforts are typically geared towards the
collection of large litter items Consequently hard
plastic fragments and microplastics are not
systematically recorded in litter clean-ups
In general trawl findings provide a fairly robust
representation of the microplastic pollution issue
providing valuable information about the
composition and relative abundance of dominant
buoyant litter items entering Port Phillip Bay
It is worth noting that hard plastic fragments
polystyrene and soft plastics also dominate
microplastic pollution in other urbanised
catchments around the globe These items were
the most abundant litter types collected in trawls in
the New York-New Jersey Harbour estuary USA
one of the most urbanized estuaries on earth (S
Meola New YorkndashNew Jersey Baykeeper pers
comm 2015) Similarly hard plastic fragments
polystyrene and plastic foil dominated microplastic
loads along the length of the Rhine River in Europe
(Mani et al 2015) This is not surprising given that
worldwide the packaging industry the primary
material source of microplastics in this study is the
third largest after food and energy (Moore and
Phillips 2011) and around 11 of plastic waste
generated gets lost in the environment (Borelle
et al 2020) where it breaks up into smaller pieces
under the prevailing environmental conditions
It is clear that the Yarra has much higher total litter
counts than the Maribyrnong This is probably
because the Yarrarsquos catchment area (4046 km2) is
larger than the Maribyrnongrsquos (1408 km2) and land
use between the catchments differs apart from the
Upper Yarra region the Yarra River catchment
includes 43 times more of urbanised area than the
Maribyrnong The respective Catchment Region
documents from Melbourne Waterrsquos Healthy
Waterways Strategy state that in the Maribyrnong
catchment
raquo about 10 retains its natural vegetation
(1408 km2)
raquo 80 is used for agriculture (11264 km2)
raquo 10 is urban development Greater Melbourne
and larger townships (1408 km2)
In the Yarra catchment
raquo 55 of the area retains its natural vegetation
(22253 km2)
raquo 30 is used for agriculture (12138 km2)
raquo 15 is urban development (6069 km2)
When comparing the other types of litter between
the rivers it was found that the Maribyrnong
4 amditangaroablueorg
| 34 |
(proportionally) has higher counts of soft plastics
nurdles bottle caps straws twine cigarette butts
and lsquootherrsquo items than the Yarra whereas
polystyrene is more problematic in the Yarra
gt Investigating litter by item category
Hard plastic fragments remain the most
problematic items in both rivers and have been
significantly increasing over the last five years Due
to their small size it is nearly impossible to trace
them back to their individual sources of pollution
They originate from broken-up larger items that are
lost from overflowing commercial household and
public bins littering and illegal dumping of waste
are blown off trucks during transport or from
construction andor demolition sites
The plastic polymer analysis showed that most
items in the samples were polyethylene (PE)
polypropylene (PP) or polystyrene (PS) which are
some of the most commonly used plastics in the
world However other common plastics like
polyethylene terephthalate (PET) and
polyvinylchloride (PVC) were largely absent from
the results Notably as per Pattison (2020)
degradation of polymers is not uniform and
different polymers break up via a range of
processes at varying rates (Gewert et al 2015)
Polymer types such as PE PP and PS break up faster
when exposed to UV radiation than PET and PU
thus potentially increasing the prevalence of these
secondary microplastics The varying densities of
polymers may also influence what is collected with
equipment such as the manta net which sits on the
water surface
The lowest density polymers found in the river
samples are most likely to float were PP
(090 g cm3) and PE (from 092- 097 g cm3) (see
Appendix 3A) Some of the higher density polymers
included PET (138-139 g cm3) and PVC (129-
144 g cm3) which are commonly used worldwide
but were only present in study samples in trace
amounts (see Appendix 3B) It is therefore likely that
denser polymers may be in sub-surface waters
floating underneath the manta net or have sunken
into the sediments as there is a strong correlation
between the number of microplastics found in river
sediments and increasing polymer density (Klein
et al 2015)
Further investigation of the water column and the
sediments are logical next steps in the process of
investigating microplastics pollution in the rivers
Polystyrene is the second most prevalent litter item
in the Yarra and in third place in the Maribyrnong
These findings are supported by litter research
conducted between 2017 and 2019 by the Yarra
Riverkeeper Association which found that
polystyrene was the most found item on the
riverbanks during community clean-ups as well as
in the Bandalong litter traps (Kowalczyk and Kelly
2020) A subsequent polystyrene pollution research
project by Cleanwater Group and Yarra Riverkeeper
Association attempted to trace this litter back to the
source by surveying 64 manufacturing and
distribution facilities (Barmand et al 2020) Over
80 of surveyed sites were found to have some
sort of polystyrene leakage into the environment
even when all reasonable precautions had been
taken to prevent this In addition more evidence is
being collected revealing that building sites are a
potential source of polystyrene pollution when
using insulation waffle pods5 Polystyrene also gets
lost in transport on loading bays and at waste
transfer and recycling facilities The fact that
polystyrene loss still occurs even when all
reasonable precautions are taken indicates that the
problems lie with the material itself and how it is
handled It therefore needs to be questioned if this
material should still be used for its current
purposes meanwhile alternatives should be
sought
3 M I C R O P L A S T I C S I N T H E Y A R R A A N D M A R I B Y R N O N G R I V E R S
C O N T E N T S
| 35 |
as community-led advocacy has led to retailers
swapping plastic straws for paper ones or not
offering plastic straws unless specifically requested
by their customers In some instances entire retail
precincts have pledged to cease the distribution of
plastic straws such as the traders on Gertrude
Street in Fitzroy (The Everleigh pers comm 2017)
The fact that the results of these community
initiatives are reflected in the monitoring data
indicates two things
raquo 1) Individual behaviour change community-led
advocacy and community action to reduce
plastic pollution can make a significant positive
difference for the environment
raquo 2) Ongoing data collection and monitoring of
plastic pollution are necessary to evaluate which
litter reduction initiatives are effective
Sponge is a category that has been significantly
increasing in the Yarra and mostly captures artificial
lsquospongeyrsquo substances such as sponge-like
household items building insulation foam and soft
packaging material When speculating where this
material comes from and why it is more prevalent
and increasing in the Yarra the increased residential
construction projects in the Yarra catchment may
correlate Further source tracing may provide insight
Other is a category applied to record items that are
not readily identifiable as fitting into any of the
other categories but are obviously not organic In
both rivers this category is significantly increasing
especially in the Maribyrnong where the graphrsquos
J-curve in Figure 18 suggests an exponential
increase This warrants closer investigation of this
category in future research to see if there are
specific items that are trending and if another litter
item category should be added for specific
monitoring focus
Soft plastic fragments are steadily increasing over
time Much like hard plastic fragments soft plastics
are difficult to trace back to a single source Much of
it likely comes from plastic littered on the streets or
it blows out of bins and skips due to its light weight
and prevailing wind strength and direction in relation
to the bin Once in waterways soft plastics carried
on rapid flood flows commonly snag on woody
streamside vegetation causing them to shred
Nurdles are ubiquitous in waterways all over
Victoria as supported by evidence gathered by
Tangaroa Blue Foundation and the EcoCentre since
2014 (N Blake F Charko pers comm 2020)
Although nurdles have neither significantly
increased nor decreased over the life of this project
they are still making up a steady 1 of microplastics
flowing into the Bay over time Chapter 5 of this
report shows that nurdles are the number one
microplastic type found on beaches around the
Bay indicating that this type of pollution is an
ongoing issue
As nurdles are classed as an industrial pollutant
rather than litter it is relatively easy to identify their
source These pellets can be traced back to the
premises of plastic manufacturers where they are
spilled on the loading bays and driveways and are
often incompletely or not at all recovered after a
spill Some get lost in road transport on their way to
manufacturers and end up in the gutters Refer to
Chapter 7 for recommendations on this issue
Plastic straws are the only item category that has
significantly declined over time in the Yarra This is
notably going against the trend of all other items in
both rivers that are either increasing or staying
constant over time The most likely explanation for
this is that over the last several years community
and business-driven source reduction initiatives
such as lsquoThe Last Strawrsquo have gained great traction
in Melbourne Individual behaviour change as well
5 Although the Master Builders Association offers a waste minimisation guide that includes waffle pods it does not outline how this material should be handled onsite to prevent spillage
| 36 |
Bottle caps cigarette butts and twine have neither
increased nor decreased in both rivers Although
cigarette butts are in the top ten of most littered
items in Australia their plastic filters get
waterlogged and most likely pass under the manta
net explaining the low numbers found in this study
gt Seasonal variations
When examining the seasonal effects on the rivers
the Maribyrnong proportionally has its largest
surface litter output in spring and autumn while for
the Yarra litter numbers are highest during summer
and winter One likely reason for this difference
could be related to sports events that draw large
numbers of people to the vicinity of the rivers such
as football season for the Yarra in winter and horse
racing events at Flemington Race Course in spring
for the Maribyrnong In summer the Yarra parklands
are extensively used for recreation and tourism in
Melbourne CBD is at its peak in DecemberndashJanuary
However both rivers have different land uses
influencing them and there are vast differences in
the industrial usage and population density along
the rivers (Yonkos et al 2014) Litter hotspots may
also play a role For example Calder Park Raceway
is located near Jacksons Creek not far upstream
from where the creek joins the Maribyrnong River
Road verges in the vicinity of Calder Park are
heavily littered (N Blake pers comm 2020) with
plastic items potentially shredded when verges are
seasonally slashed Both rivers are subject to
different street cleaning and sweeping schedules
and practices by local councils
gt Other factors influencing litter
Rainfall There is a positive correlation between
rainfall and plastic pollution which is consistent
with research worldwide Littered items anywhere
in the catchment eventually make their way down
to the nearest waterway through the stormwater
drain system heavily polluting creeks and streams
that lead into the big rivers and the Bay (picture 6)
Litter traps Although no statistical correlation was
found between microplastics spikes and emptying of
the litter traps this conclusion was reached through a
Wilcoxon rank sum test comparing median litter
Picture 6 Litter in the Merri Creek which flows into the Yarra
P I C T U R E 6
3 M I C R O P L A S T I C S I N T H E Y A R R A A N D M A R I B Y R N O N G R I V E R S
C O N T E N T S
| 37 |
counts when the litter trap was emptied to when the
litter trap was not emptied (two days before trawl) See
Appendix 5 for more details Just before publication of
this report subsequent advice was received from
Melbourne Water that the average Yarra River current
speeds between Burnley and Bolte Bridge is 55 km
per hour (P Rasmussen Melbourne Water Team
Leader Flood Preparedness pers comm 2020)
The distance from Burnley to Bolte Bridge is
approximately 758 km therefore estimated travel time
is about 06 to 38 hours with the average
approximately 15 hours The shorter duration could
be applied during higher flows following rainfall runoff
The longer durations are generally normal conditions
With tides ebbing and flowing for all conditions the
average may be best applied Accordingly any spikes
in trawl contents attributable to emptying of
Bandalong traps could only apply to trawls conducted
within just a few hours of the traps being emptied
Apart from litter prevention measures gross
pollutant traps could be installed on the
problematic major drain outlets and catch items
before they make it into the creeks Once it reaches
the creeks plastic pollution mixes in with organic
materials and will be more onerous and costly to
remove from the waterways due to the much
higher volumes presented by these combined
materials To be effective gross pollutant traps
require adequate and proactive maintenance
schedules and resources to prevent them from
blocking or overflowing
However gross pollutant traps do not often catch
microplastics Although the data in this report do
not show a direct statistically significant correlation
between microplastic capture and the emptying of
the Bandalong litter traps in the Yarra personal
observation of the manner in which the traps are
emptied confirms that microplastics do escape
during this process More targeted research
specifically designed to test for the effectiveness of
microplastics captured by gross pollutant traps
during their operation and maintenance is
therefore necessary
Yarra environmental water flow releases No
correlation was found between microplastics
captured in the trawls and Melbourne Waterrsquos
regulated release of environmental water flows for
the Yarra There is no evidence that environmental
water flows exacerbate plastic pollution in
waterways This supports the result that litter
originates from the street making its way into the
rivers through stormwater drains
gt Implications for marine life in the Yarra estuary
and Port Phillip Bay
Port Phillip Bay is a relatively closed system due to
the distance between the Bellarine and Mornington
Peninsulas being only just under 35 km Due to
prevailing winds it is likely the Bay is a sink for a major
portion of the plastics that enter it from the rivers
This study found that microplastics form the bulk of
items entering the Bay from the surface waters of the
Maribyrnong and Yarra rivers The results of a pilot
project of nine Bay trawls showed the presences of
microplastics in eight of nine samples (see Chapter 4)
To date very few studies have assessed
microplastic ingestioninteraction rates for faunal
species in Port Phillip Bay However worldwide
freshwater and marine species at all trophic levels
possessing varied feeding strategies ingest
microplastics (Eerkes-Medrano et al 2015) In
lab-based studies ingestion has been associated
with the retention and accumulation of
microplastics in organisms including but not limited
to mussels (Browne et al 2008) lobsters (Murray
and Cowie 2011) scallops (Brillant and MacDonald
2000) injury and subsequent disrupted feeding
swimming activity in lugworms as well as stress
immune response altered metabolic function and
| 38 |
toxicity in lugworms (Browne et al 2013) and fish
and mussels (Rochman et al 2013) It is also related
to tumour formation in fish (Rochman et al 2013)
and brain damage in fish (Mattson et al 2017)
Smaller sizes of plastic can potentially be ingested by
a greater range of species Plastic ingestion by local
wildlife is highly likely because of Port Phillip Bayrsquos
potential for high microplastic concentrations and
because these waters are so biodiverse Faunal
ingestion rates and impacts of marine microplastics
at the individual population and community levels
need to be assessed to prevent biodiversity loss in
the Bay and to better understand the human health
implications of consuming seafood from the Bay
Investing in necessary research will likely require
collaboration between departments managing water
pollution controls and fish populations respectively
gt Further study on microplastics
The estimations in this study showed that the Yarra
and Maribyrnong can transport nearly 25 billion
plastic pieces ndash of which more than 2 billion are
microplastics ndash into Port Phillip Bay annually and
that this may be an underestimation Ling et al
(2017) noted that plastic filaments including highly
pervasive clothing microfibre pollution between
0038 mm and 0250 mm formed the dominant
categories of microplastic in coastal and estuarine
sediments around Australia including Port Phillip
Bay However we know little about the
downstream movement and deposition of
microplastics in rivers It is not known what
portions of riverine microplastics travel
downstream below the surface waters sampled by
the manta net to eventually be released to the Bay
or deposited to the river sediments In the North
Shore Channel (Illinois USA) for example
microplastic concentrations in sediments were up
to 15000 times higher than surface water samples
(Hoellein et al 2017) Some microplastics are likely
transported long distances as several studies report
high concentrations of microplastics in estuaries
with rivers implicated as major microplastic sources
to these coastal zones (Yonkos et al 2014 Lima
et al 2014 Sadri and Thompson 2014) An example
of this was revealed during a community clean-up
event organised by the Yarra Riverkeeper
Association in April 2018 where a vacuum suction
device deployed by Ocean Crusaders removed over
47 million polystyrene pieces from the Yarra River
and its vegetated banks (A Kelly pers comm 2018)
Consequently in order to accurately identify the
magnitude of microplastic pollution in Port Phillip
Bay it is necessary to better understand microplastic
depositional patterns and take into account the water
column below the top 20 cm and the sediments
To advance current microplastics research in this
area the EcoCentre engaged a team of interns from
Worcester Polytechnic Institute (WPI) in the USA to
design and build a low-cost microplastics sampling
device easily built from hardware store materials
called the lsquoMicroplastics Collector With A Pumprsquo
(MCWAP) The MCWAP is a portable battery-
powered pump that takes water samples at various
depths in the water column down to a depth of 2 m
and runs these through a removable mesh 300 nm
filter to capture microplastics (picture 7) The
EcoCentre is planning a first trial of depth-sampling
for waterway microplastics in 2021
Picture 7 The MCWAP EcoCentrersquos portable microplastics depth-sampling device
P I C T U R E 7
3 M I C R O P L A S T I C S I N T H E Y A R R A A N D M A R I B Y R N O N G R I V E R S
C O N T E N T S
| 39 |
Maribyrnong River
Fishing in Port Phillip Bay
4
C O N T E N T S
| 41 |
Bay trawls pilotTo gain insight into the relative quantities of microplastics entering the Bay from Bass Strait as compared to the major rivers a pilot project of nine manta net trawls was conducted at the entrance to Port Phillip Bay with support from the Blairgowrie Yacht Squadron and the Australasian Ambassador for the 5 Gyres Institute
Trawls were conducted between April 2018 and
February 2020 at Popersquos Eye in Port Phillip Bay
during incoming tides and south-westerly winds
Trawl time was 30 minutes during which the vessel
was anchored to the sea bed in the tidal flow
Sample sorting was done in the same manner as
the river trawls (see Chapter 3)
Of the nine trawl samples collected at Popersquos Eye in
Port Phillip Bay eight contained plastics (Table 1) Of
the total 55 items found 35 (64) were
microplastics The most prevalent items were hard
plastic fragments which were found in six of nine
samples Samples in which plastic was found
contained up to 16 items The last sample
contained a remnant of a party balloon with the
balloon string still attached
Although the sample size is too small to perform
meaningful statistical analysis the findings suggest
there may be a worrying amount of plastic floating
on the surface waters of the Bay Given the size of
Port Phillip Bay is 1930 km2 and plastics were found
in 89 of samples collected through 30-minute
trawls plastics are potentially quite ubiquitous
A proportion of 80 of hard plastic fragments
found seems relatively consistent with the 75
proportion that flows into the Bay from the Yarra
and Maribyrnong indicating a probability that many
of these items may have originated from the Bay
passed through The Heads into Bass Strait and
then been recirculated back to the Bay by tidal
currents and prevailing winds More samples will
need to be taken and analysed in order to further
investigate this probability
Hard Fragments lt5 Hard Fragments gt5 Soft Plastics TwineLine Sponge Non-Plastic
Apr 18 3 4 1
May 18 6 2
Jun 18 8 6 2
Sep 18
Oct 18 2 1 3
Dec 18 1
Jan 19 2 1
Feb 19 1 2
Feb 20 2 1 1
TOTAL 19 16 2 5 2 5
Table 1 Items caught in Bay entrance trawls lsquoNon-Plasticrsquo included paper and a rubber balloon
T A B L E 1
4
Microplastic beach litter 5
C O N T E N T S
| 43 || 43 |
Baykeeper Beach Litter AuditsDevelopment of the Port Phillip Baykeeper Beach Litter Audit method commenced in 2014 in response to international studies confirming the environmental threat of plastic pollution At that time and to date there remains no international standard survey method with various existing data collection methods used by different leading bodies
While each method provided valuable information
their capacity to accurately record volumes of litter
over time ndash particularly microplastics ndash was seen to
be limited by one or more of the following factors
raquo lack of a clearly defined data collection area
raquo clean-up andor data collection methods
conducted on a scale that was unlikely to be
systematically repeated
raquo data collection recorded in a single area on a beach
(as opposed to a set of locations that represented
samples of all conditions on the beach)
raquo data recording conducted from a standing
position reducing the likelihood of recording
hard-to-spot microplastics
raquo data collection without removing litter
eliminating the possibility of clearly measuring
change in volumes occurring between surveys
The Baykeeper Beach Litter Audit methodology
was designed to focus on microplastic pollution
that poses an immediate threat to aquatic
organisms Key considerations in the design of this
method were the need to
raquo capture a representative sample of the conditions
on the beach
raquo establish an easily replicated method that can be
cost-effectively and consistently applied by
different groups around the Bay
raquo use data field terminology that was consistent
with terms used in the Australian Marine Debris
Initiative database
The Clean Bay Blueprint project provided an
opportunity to test the survey methodology over
several years with a range of user groups
| 44 |
Methodology
The survey method requires the combined search
time of the number of auditors to equate to at least
five minutes per quadrat Noting that some
quadrats will have very few if any microplastics
this requirement is designed to ensure consistency
of search effort and to enable a small team of two
people to comprehensively complete an audit in
less than an hour or two hours on more heavily
littered beaches This relatively small time
commitment facilitates regular conduct of audits
over the course of a year to achieve the statistical
rigour required to confirm trends in litter volumes
and type over time
gt Transect and quadrat placement
In order to capture a representative sample of all
beach conditions data is collected from three
transects across the beach In this context lsquoall beach
conditionsrsquo is referring to the structure of the beach
ndash shaped by the locally prevailing winds waves and
tidal currents ndash which transport sand debris and
litter to and from the beach To capture the
influence of these coastal processes over time and
to provide a basis for consistent search effort
transects are located at the widest central and
narrowest sections of beach
In each transect data is collected from three
quadrats at the top of the beach mid-beach and
on the last high tide line (Figure 22) The lsquotoprsquo
(inland edge) of the beach quadrats are in the same
place for each survey as locational reference points
Due to changing tidal conditions on the day the
distance between the top of the beach and last
high tide line (ie transect length) will vary Hence
the location of the mid-beach and quadrats at the
last high tide line differ for each survey Importantly
the quadrats located at the last high tide line
provide a sample of litter arriving on that day
Each transect starts at the lsquopermanent landmarkrsquo at
the top of the beach to ensure transects are in the
same place each time a survey is conducted
Transects run roughly at a right angle from the top of
the beach towards the closest point at the waterline
gt Selection of reference beach survey locations
With a view to gaining insights into catchment
sources of microplastics to the Bay beaches
surveyed for Clean Bay Blueprint in various regions
of Port Phillip Bay are generally associated with a
river or a creek that flows into the Bay Those that
are not directly associated with rivers or creeks (Rye
and Geelong Eastern Beach) are included to provide
insights into the mobility of litter due to tidal
currents and seasonal winds
5 B A Y K E E P E R B E A C H L I T T E R A U D I T S
Figure 22 Location of Baykeeper Beach Litter Audit data collection quadrats along the widest (1) central (2) and narrowest (3) beach transects
F I G U R E 2 2
C O N T E N T S
| 45 |
Plastics that float in the upper water column are
carried in the direction of wind-generated waves
and the direction of tidal currents during calm
(low-wind) conditions (N Blake pers obs 2020)
Due to the combined effects of tides and varying
wind directions some plastic objects may travel
widely in the Bay before eventually being cast upon
a beach A notable example was one of five
GPS-tracked PET bottles released in Elwood Canal
on 9 May 2019 by RMIT6 After remaining in the
Canal for almost two weeks they ultimately landed
on Dromana beach on 25 May due to a prevailing
northerly wind Therefore in the absence of data
collection conducted on a weekly basis it is
impossible to definitively conclude where beach
litter on any given day may have originally
come from However seasonal
data collection at multiple
(Bay-wide) reference sites does
provide some indication of the
likely source (the catchment)
and ultimately presents a
baseline dataset with which
to determine if microplastics
lsquoleakagersquo into the Bay is
increasing or decreasing
over time
gt Surveys conducted
Between July 2017 and March 2020 117 beach litter
audits were conducted in 12 locations around Port
Phillip Bay (Table 2) with the help of local
community group volunteers not-for-profits and
education institutes All citizen scientists involved
received multiple on-site training sessions by the
Port Phillip Baykeeper before independently
conducting audits Regular reference beaches were
surveyed every three months (in May August
November and February) with surveys of all
beaches generally conducted within the same
fortnight Only sites that were surveyed on at least
six occasions have been given more detailed
analysis in this report
LOCATION ASSOCIATED RIVER
OR CREEK AUDITS
COMPLETED
Eastern Beach Geelong na 11
Moorpanyal Beach Geelong na 2
Werribee River Jetty Werribee River 6
South Beach Werribee Werribee River 7
West Beach St Kilda Yarra River 15
Point Ormond Elwood Elwood Canal 3
Mordialloc Beach Mordialloc Creek 4
Keast Park Seaford Patterson River 10
Frankston Beach Kananook Creek 12
Mothers Beach Mornington NA 4
Mount Martha Beach Balcombe Creek 30
Rye Beach na 13
Total surveys 117
Table 2 Beach litter audit sites and number of audits done between July 2017 and March 2020 Beach names in bold are the regularly surveyed reference beaches the other beaches were opportunistically surveyed
T A B L E 2
6 RMIT Litter Tracker project httpswwwrmiteduauaboutschools-collegesscienceresearchresearch-centres-groupsaquatic-environmental-stresslitter-trackers
| 46 |
Results and discussion
Figures 23 and 24 show beaches along Port Phillip
Bayrsquos eastern shores recorded much higher
concentrations of litter than Geelong Werribee and
Rye The lower counts at Geelong and Rye can be
attributed to the fact there is no major waterway
entering the Bay in their general vicinity and
raquo as Geelong Eastern beach is located near the
westernmost end of Corio Bay it has very limited
exposure to litter dispersed by wind and tides
from wider Port Phillip Bay
raquo Rye beach is the southernmost survey location in
the Bay relatively removed from major streams
and urban catchment
The much lower (near negligible) counts at
Werribee South and Werribee River jetty are likely
attributable to the fact that the Werribee River
catchment is much less urbanised (around 20)
than the catchments associated with most of the
eastern sites of the Bay These results suggest that
litter makes its way to the Bay from the catchments
via the waterways
The high average counts at Keast Park (Seaford)
equate to 42 of total litter collected at all survey
locations Field observations and anecdotal reports
of industrial sites in the Mordialloc Creek and
Patterson River catchments have identified two
particular sites that may be significant contributors
to the overall plastic pollution recorded at Keast
Park This result warrants more detailed analysis
and investigation
A total of 11248 items were recorded in this study
A breakdown of items collected in Figure 25 shows
very few gross pollutants (eg intact plastic bottles
and bags) were recorded while nurdles (pre-
production pellets) and plastic fragments combined
comprised 77 of the total records The volume of
microplastics observed in 9 m2 compared to
microplastics reported in typical beach cleans
confirms the effectiveness of the methodology in
systematically recording microplastics at reference
sites around the Bay
Of all litter recorded the quadrats within the lsquolast
high tide linersquo recorded the greatest percentage of
items (45) followed by the lsquotop beach zone (38)
then the lsquomid-beach zonersquo (18) However this
order did not apply to all beaches with several of
the less littered beaches recording the greater
amount in the top beach zone (Figure 26) Mt
Martha is notable in this regard among the more
heavily littered beaches in that the lsquotop beachrsquo
quadrats had the highest amounts in all three
transects However this result was skewed
significantly by the top beach of the central beach
transect which averaged 278 items per survey ndash
almost as much as the totalled averages for all other
quadrats combined (338 items)
Keast Park has the distinction of having the
highest percentage of nurdles (59 of items
recorded) compared to St Kilda West beach (47)
Frankston (34) Rye (22) and Mt Martha (17)
Nurdles were virtually absent from beaches on the
west side of the Bay
Examination of plastic fragments by type and size
also found Keast Park distinguished from other
beaches with 53 of fragments being hard
fragments lt 5 mm Frankston ranked next highest
for hard plastic fragments with 37 followed by Mt
Martha with 34
The significantly higher counts of nurdles and hard
plastic fragments lt 5 mm may be due to a
combination of factors such as
raquo the broader range of wind directions that might
affect the site prevailing winds are acknowledged
as a primary agent for litter dispersal and Keast
Park is located at the easternmost point of Port
5 B A Y K E E P E R B E A C H L I T T E R A U D I T S
C O N T E N T S
| 47 |
Figure 23 Average litter per survey for all beaches surveyed
Figure 24 Visualisation of total litter counts on sampled beaches around Port Phillip Bay larger circles represent higher counts Image source Port Phillip Sea Pilots
F I G U R E 2 4
F I G U R E 2 3
| 48 |
Figure 25 Litter category percentages of total litter recorded across all sites The numbers above the percentages are the total items collected
Figure 26 Comparison of results for tide line mid-beach and top beach zones
Phillip Bay and subject to winds from south to
north (the widest range of all sites surveyed)
raquo orientation of the beach (near North-South at
Keast Park)
raquo physical infrastructure impeding wave action on
this particular beach (the Riviera stormwater
outfall projects into the Bay at a point around
20 m south of the survey area)
raquo presence of plastics manufacturing and re-grind
industries within the catchments
raquo proximity to industrial sites in local river and
stream catchments (Mordialloc Creek and
Patterson River) to the north of the survey beach
(tidal currents that run clockwise around the Bay
would carry plastics generated by these streams
towards Keast Park)
The Frankston beach survey site is oriented NNE to
SSW which is not dissimilar to the orientation of
Keast Park (NNW-SSE) The two sites are just seven
kilometres apart Despite this proximity the
Frankston site (located just to the south of
Kananook Creek mouth) recorded considerably
fewer nurdles and hard plastic fragments than Keast
Park (which is to the south of Mordialloc Creek and
Patterson River) These findings suggest that close
scrutiny of the Mordialloc Creek and Patterson River
catchments for nurdles and hard plastic fragments
is warranted
F I G U R E 2 5
5 B A Y K E E P E R B E A C H L I T T E R A U D I T S
C O N T E N T S
| 49 |
F I G U R E 2 5
| 51 |
Port Phillip Bay on a windy day
6
| 51 |C O N T E N T S
Related litter investigations Over the life of Clean Bay Blueprint the EcoCentre collaborated with many other organisations Other investigative litter projects enabled by the Port Phillip Bay Fund with the primary aim of data collection for pollution prevention include
raquo Yarra Riverkeeper Associationrsquos Litter and Flows and polystyrene projects - analysing
litter in the Yarra
raquo RMIT Universityrsquos Plastics Lab project ndash analysing
plastic fragment samples to identify polymers and
adsorbed contaminants
raquo Tangaroa Blue Foundationrsquos Letrsquos Strain the Drains7 ndash trialling stormwater pit filtration devices
to document the captured contents in a range of
municipalities and for four different street usages
raquo Scouts Victoriarsquos Street2Bay8 project ndash auditing
litter in six different street usages in all catchments
around the Bay
raquo RMIT Universityrsquos Litter Tracker4 project ndash GPS
tracking and on-line reporting of the mobility of
plastic bottles released into streams in
catchments leading to Port Phillip Bay
raquo Beach Patrol Australia and Love Our Street have
also compiled considerable data with the mobile
Litter Stopper phone app9
Interactive litter maps
It is essential to provide data access and report back
on research results to citizen scientists and those
advocating for and designing change Data collected
from the beach audit sites have been entered into
an interactive Tableau data visualisation platform
and is hosted on the EcoCentre website with
potential for visualising street litter data collected by
other groups Consequently the Tableau platform
appears to be a useful means of engaging with
schools and the wider community in relation to the
high mobility of microplastic pollution
The EcoCentre was also part of the community
reference group that helped design and test the State
Governmentrsquos LitterWatch10 database which collects
and collates litter data from all over Victoria visualises
this on a map and makes it publicly accessible This
is the first attempt to gather all litter data no matter
which data-collection methods were used and bring
this together in one accessible repository
Incident reporting
During the course of the study several materials that
have been noted as of ongoing concern were
reported to relevant authorities These included Telco
wire offcuts discarded at telecom sites on streets
polystyrene waffle pod waste leaking from a building
site and AstroTurf fragments leaking from a
sportsground demolition
All of the complementary initiatives represent major
advances in our understanding of plastic pollution
and warrant careful consideration as a whole body
of information as opposed to in isolation particularly
with a view to adopting the optimum suite of data
collection methods for the future and to set targets
for local source reduction plans
7 tangaroablueorglets-strain-the-drains-port-phillip-bay-region-vic 8 httpsscoutsvictoriacomauactivities-eventsactivitiesenvironmentstreet2bay-project 9 httpswwwbeachpatrolcomau 10 httpslitterwatchvictoriaorgau
Sunset over Port Phillip Bay
RecommendationsOver the life of the Clean Bay Blueprint project microplastic pollution has stopped being an lsquoemerging issuersquo The irrefutable evidence of its unacceptable impact on the environment is well-documented all over the world
7
C O N T E N T S
| 53 |
Many governments are acting on the
recommendation from the science community that
society should not wait for any more quantification
of damage before taking action to reduce marine
plastic pollution impacts (Lavers and Bond 2017
Gall and Thompson 2015) In their report Marine
Plastics Debris and Microplastics the United Nations
stated there is a moral argument that we should not
allow the ocean to become further polluted with
plastic waste and that marine littering should be
considered a lsquocommon concern for humankindrsquo
(UNEP 2016)
The high quantities of litter and microplastics in the
Yarra and Maribyrnong rivers highlight the large
contribution of these rivers to marine plastic
pollution in Port Phillip Bay Recent research by
Borelle et al (2020) projected the future of plastic
pollution in our oceans and concluded that the
predicted growth in plastic waste in the next 10
years far exceeds the impacts of mitigation efforts
currently deployed Therefore significant changes
and investments need to be made to counter the
rising tide of plastic pollution in the oceans
| 54 |
Recommendation 1
gt Improve product stewardship
Plastic and microplastic pollution are everybodyrsquos
problem Over the lsquolifecyclersquo of a plastic item it
travels through the fossil fuel and petrochemical
industries transport and shipping plastic product
manufacturers retailers community local councils
waste contractors and the recycling industry
However whereas every link in this user chain has
some level of responsibility not everyone should be
expected to have the same level of accountability
for plastic waste The current responsibilities for the
fate of plastic products are not well-defined and are
often passed on to the next group down the line
putting a disproportionately large strain on
communities and local councils There is very little
meaningful manufacturing industry accountability
for the end-of-life destination of plastic whether for
waste management or pollution of the environment
The plastics industry is set to grow 40 by 203011
yet hardly any producer responsibility is taken for
the waste and problems its products cause Only
94 of manufactured plastic is being recycled in
Australia (OrsquoFarrell 2019) which is consistent with
9 world-wide9 An astonishing 11 enters the
oceans (Borelle et al 2020) Currently local councils
and the community are expected to deal with the
consequences of unregulated production of a
material that lasts in the environment forever
As Victoria is moving from a linear to a circular
economy model this is the perfect time to change
and define the responsibilities of the plastics
industry and their accountability Federal and state
governments play a key role in leading and
managing this change Some of the changes that
the EcoCentre believes should be made in the short
and long term are
11 Transition to a circular economy model
Product recovery schemes (such as the
container deposit legislation) that are part of a
circular economy model should be funded by
the industries which produce the product
and managed by an independent government
agency to prevent perversion of the initiative
12 Invest in implementing alternatives to
plastic Plastic is not the right material for
the majority of functions it performs eg
using a material that lasts forever for single-
use packaging The ever-increasing
monetary and environmental costs of
dealing with plasticrsquos end-of-life stage are too
high Many alternative truly biodegradable
materials have already been invented but
have not been taken up for large-scale use
Industry needs to be given incentives to
transition towards producing large-scale
alternative packaging solutions eg through
new legislation or stimulus measures such
as innovation grants or tax incentives
13 Set limits on virgin plastic production
This includes avoiding investments in
waste-to-energy schemes that burn plastic
as it perpetuates our reliance on a product
that should not be burned in the first place
14 Ban broad-scale groups of problematic
single-use plastics12 Examples such as South
Australiarsquos ban on single-use plastic items
will provide some of the incentives driving
innovation and transformation Bans may be
premised on design qualities rather than
product type for example banning oxo-
11 httpswwwplasticsoupfoundationorg 12 The Australian National Waste Policy Action Plan commits to banning lsquoproblematic and unnecessary single-use plasticsrsquo by 2025 and delegated the Australian Packaging Covenant Organisation to lead all governments to lsquoIdentify problematic and unnecessary single-use plastic packaging to provide an evidence base for industry to take coordinated actionrsquo by 2019 The resulting report identified four priority categories (including expanded polystyrene and non-certified compostable packaging such as oxo-degradable) and three materials for further investigation httpswwwpackagingcovenantorgaudocumentsitem3183
7 R E C O M M E N D A T I O N S
C O N T E N T S
| 55 |
13 Operation CleanSweep is a best-practice manual for plastic manufacturers that employs cost-effective ways of preventing nurdles leaking into the environment
degradable plastics (that merely break into
microplastics faster rather than biodegrade to
natural component materials) or non-
recyclablenon-compostable packaging
15 Make the Operation CleanSweep13
program mandatory instead of voluntary
for any manufacturer using nurdles and have
this enforced by EPA Victoria
Recommendation 2
gt Cultivate effective partnerships
It is critical that conversations and true working
partnerships are forged and maintained with a
long-term vision of collaboration and tangible
positive outcomes In the case of an issue as big as
plastic pollution cross-sectoral collaborations are
essential to ensure effective changes Industry local
government state government agencies (such as
EPA Victoria the Catchment Management
Authorities and Melbourne Water and others)
research institutes community organisations and
businesses all need to engage in ongoing dialogue
about responsibilities and most importantly to
reach clear agreement on which group is
accountable for delivery of each defined outcome
that is necessary to the success of the overall
enterprise This might be achieved through
stakeholder working forums similar to the Victorian
Department of Environment Land Water and
Planningrsquos Integrated Water Management Forums
Recommendation 3
gt Support local councils in waste management
Until larger systemic changes in waste
management are made the end-of-line
responsibilities councils have for plastic waste need
to be adequately supported and resourced The
costs of this should not be transferred to the
community via rate increases nor by reliance on ad
hoc manual volunteer clean-ups
Measures should include effectively resourcing
councils to
31 Install and maintain pollutant traps in
drain outlets that discharge into creeks
and rivers This could be a collaboration
with Melbourne Water Care should be taken
to not just install gross pollutant traps but
also traps that catch microplastics such as
Drain Buddies
32 Enforce litter and illegal dumping law
33 Run effective litter prevention and
education programs in the community and
especially with local businesses and industry
This may be best done by partnership with
trusted business or community
organisations supporting the outreach
34 Review and improve current street
sweeping schedules and where necessary
adapt these to be more effective at the
occurrence of large sporting events and
seasons when litter peaks occur
| 56 |
Recommendation 4
gt Continue monitoring (micro)plastic pollution
Existing waste management and anti-litter
initiatives are not effective enough to stop plastic
and microplastic pollution from reaching Port Phillip
Bay The research in this report has established a
baseline data set that shows that the problem is
getting worse over time
The river trawls and beach litter audit methods
described in this report are both demonstrated to
be scientifically valid means of ongoing data
collection and the multiple years of data gathered
represent a benchmark of plastic pollution in the
major rivers and Port Phillip Bay The street litter
audit method applied by Scouts Victoria in the
Street2Bay project has also proven to be an
effective and replicable means of monitoring plastic
pollution on streets in Port Phillip Bay catchments
Continued data collection using these methods can
provide a means of evaluating any future strategies
to reduce plastic pollution in waterways
Recommendation 5
gt Increase education and lsquoplastic literacyrsquo of all
plastic users
As part of cultivating a shared responsibility for
plastic use and disposal education of plastic users
is essential The general public has become much
more aware of the issues of plastic pollution in the
environment thanks to a boom in scientific
research followed by mainstream film
documentaries and social media and community
campaigns over recent years
However there is still much confusion about how
plastic can be avoided or what plastics are more
preferable to others An example of this is the actual
meanings of the words lsquobiodegradablersquo lsquodegradablersquo
lsquooxo-degradablersquo and lsquocompostablersquo for plastic bags
People generally try to do the right thing and want
to invest in better products but industry uses the
terms in misleading ways (picture 8)
Recommendations are therefore
51 Set standard legal definitions for
degradability labels
Not-for-profit organisations as well as local councils
play a key role in educating the community and
implementing education programs in schools
Organisations that specialise in this should be
adequately resourced It is likely the reduction in
plastic straws in the Yarra can be attributed to
education efforts and community behaviour change
projects showing that these approaches work The
community and NGOs are not significantly
mentioned in Recycle Victoria (February 2020)
whereas community and cross-sector
collaborations are mentioned in the Port Phillip Bay
EMP but funding for joint activities is unclear after
the conclusion of the Port Phillip Bay Fund in 2020Picture 8
Industry messaging on plastic bag
7 R E C O M M E N D A T I O N S
C O N T E N T S
| 57 |
52 Develop project grants forums and
strategic ongoing partnerships that
integrate community government research
and industry efforts
53 Adequately resource groups who
educate and facilitate action on plastic
pollution
Recommendation 6
gt Conduct further research
As highlighted in the study discussions above
additional research is needed to adequately monitor
microplastics in Melbournersquos waterways and Port
Phillip Bay Ongoing monitoring of surface waters is
necessary to track the quantities and movements of
microplastics and can serve as a baseline for source
reduction action Given the high numbers of
microplastics reaching the Bay from surface waters
it is also important to conduct further research into
the water column and the sediments
Recommendations for further research are
61 Conduct depth-sampling studies The
EcoCentre will pilot the MCWAP to start
monitoring microplastics in the water
column If successful the device and
methodology could be rolled out for use
across creeks and rivers of Victoria
62 Conduct sediment studies Sediment
research is necessary to identify where the
heavier polymers end up according to
Schwarz (2019) river sediments act as a plastic
sink and CSIRO estimated that based on their
samples taken in the South Australian Bight
144 million tonnes of microplastics reside on
the seafloor worldwide (Barrett et al 2020)
63 Prioritise understanding the
contaminants carried by plastic in
waterways and associated human health
risks Continued analysis of plastic polymer
types and chemical contaminants carried by
plastics in waterways is necessary to
strengthen our understanding of the
potential ecological and human health
impacts of plastic pollution
64 Conduct on-ground investigations for
major sources of hard plastics fragments
and nurdles within the Mordialloc Creek and
Patterson River catchments
Plastics Lab Dr Mayumi Allinson
View of St Kilda Beach
8
C O N T E N T S
| 59 |
A note on citizen scienceThe research conducted in this study strongly relied on the collaborations with volunteer citizen scientists Citizen science has received increasing recognition over the last decade and rightly so without more than 8800 hours contributed by volunteers for data collection sample sorting and analysis Clean Bay Blueprint could not have produced such robust results
This project is hardly an exception these days as
volunteers both individually and via community
groups put countless hours of their time and
expertise towards environmental projects that rely
on large datasets and labour-intensive analyses
It needs to be recognised that the contributions of
citizen scientists to science and environmental
change-making are both invaluable and essential
and that collaborations between research
institutions and community provide a powerful
opportunity to build understanding of complex
issues of Victorian Australian and global
significance Resourcing the professional
coordination of such collaborative studies often
provides funders with a multifold return on the
investment through generating new knowledge
inspiring extensive in-kind contributions and
activating community-led conversations and action
on topics that might otherwise be uncommon
around dinner tables classrooms and clubs
9
Little Penguin in Port Phillip Bay
C O N T E N T S
| 61 || 61 |
AcknowledgementsOne of Clean Bay Blueprintrsquos main goals was to build partnerships with other organisations that target litter and improve Bay health
raquo Khadija Muhanna Saif Al
Nabhani - RMIT University
raquo Hilda Poloso - RMIT University
raquo Minh Tu - Deakin University
raquo Daniel Cox - RMIT University
raquo Nick Bergstrom - Worcester
Polytechnic Institute
raquo Sarah Duquette - Worcester
Polytechnic Institute
raquo Madison Healy - Worcester Polytechnic Institute
raquo Nick Sorensen - Worcester Polytechnic Institute
raquo Cameron Collins - Worcester Polytechnic Institute
raquo Samantha Comeau - Worcester Polytechnic Institute
raquo Brendan Gallagher - Worcester Polytechnic Institute
raquo Gina Visser - Worcester Polytechnic Institute
raquo Katie Donovan - Worcester Polytechnic Institute
raquo Spencer Hoagland - Worcester Polytechnic Institute
raquo Thomas Lipkin - Worcester Polytechnic Institute
raquo Eric Stultz - Worcester Polytechnic Institute
We recognise the extensive and energetic contributions of many interns
Many new collaborations and ongoing partnerships were formed and many existing relationships were
leveraged during this project This was made possible by the funding from the Port Phillip Bay Fund of
EcoCentre projects as well as those of other organisations We therefore thank the State Government of
Victoria for its support
Our sincere thanks goes out to the many volunteers including work placement students and interns who
have donated hours of their time and expertise to the project to make it a success We acknowledge your
great passion for the environment and deep dedication to making positive change for the future of our
waterways This project would not have been possible without your support
raquo Balcombe Estuary Reserves
Group Mt Martha
raquo Beach Patrol Mt Martha
raquo Frankston Beach Patrol
raquo Rye Beach Patrol
raquo Beach Patrol Australia
raquo Seaford Beach Patrol
raquo Werribee Beach Patrol
raquo Werribee River Association
raquo Yarra Riverkeeper Association
raquo David Flew
(Karringal boat skipper)
raquo Blair Stafford Australasian
Ambassador of the 5 Gyres
Institute
raquo Blairgowrie Yacht Squadron
raquo Metropolitan Waste and Resource Recovery Group
raquo Melbourne Water
raquo Parks Victoria
raquo 3CR Community Radio
raquo 3RRR Community Radio
raquo Sacred Heart Mission
raquo Bellarine Catchment Network
raquo RMIT Plastics Lab Prof Graeme Allinson Dr Mayumi Allinson Marinda Pattison and students
raquo Scouts Victoria
raquo Worcester Polytechnic Institute
raquo Dolphin Research Institute
raquo Sustainability Victoria
raquo Victorian Litter Action Alliance
raquo Gordon TAFE
raquo Dr Christopher Johnstone and Emma Barnett of Monash University
raquo Victorian National Parks Association
raquo Federation University
raquo Australian Citizen Science Association
raquo The Age
raquo Department of Environment Land Water and Planning
raquo Ying Quek
raquo Port Phillip Menrsquos Shed
We thank the following organisations groups and individuals for their contribution and collaboration (in no particular order)
Appendicesgt Appendix 1
| 62 |
Figure 28 Percentage of microplastics in samples per trawl in the Yarra (blue) and Maribyrnong (red) rivers with 95 confidence intervals shaded grey The average percentage of microplastics per sample was 184 This number has stayed constant over time
F I G U R E 2 8
Appendices
Microplastic Image Josie Jones
C O N T E N T S
| 63 || 63 |
gt Appendix 2
MARIBYRNONG YARRA
Hard plastic fragments 174 -102
Soft plastics 959 -560
Polystyrene -1688 986
Nurdles 803 -469
Plastic bottle caps 542 -317
Plastic straws 529 -309
Sponge -167 097
Twine 412 -241
Other 004 002
Cigarette butts 596 -348
F I G U R E 2 9
Figure 29 Mosaic plot showing the Chi-Square test results (in Table 3 below) The statistical test looks at whether proportions are different than what is expected by chance considering both the Yarrarsquos and Maribyrnongrsquos total litter The width of the boxes show the proportion of litter in the Maribyrnong compared to the Yarra The height of the boxes shows the proportion of litter for each litter item The colours represent significance Boxes coloured red have lower proportions than expected by chance and those in blue have higher proportion than expected by chance The boxes for hard plastic are grey meaning there are no significant differences in proportions of expected hard plastic fragments in the Maribyrnong or Yarra rivers (P gt 005) The boxes for nurdles bottle caps straws and soft plastics are blue for the Maribyrnong and red for the Yarra meaning there are proportionally more nurdles bottle caps plastic straws and soft plastics than expected in the Maribyrnong river and fewer than expected in the Yarra (P lt 005)
Table 3 Residuals from Chi-square test for plastics count as a function of waterway and plastics category Significant values are in bold red
T A B L E 3
| 64 |
gt Appendix 3
Plastic polymer analysis
A
B The below Table 7 is used with
permission from the unpublished
Honours dissertation Analysis of
Microplastic Polymers in the Yarra and
Maribyrnong Rivers (May 2020) by
Marinda Pattison under supervision of
Associate Professor Graeme Allinson
Table 6 Plastic polymer density (Stelray Plastic Products 2020)
T A B L E 6
YARRA RIVER MARIBYRNONG RIVERPercentage () Std Dev Percentage () Std Dev
Total PE 4750 1113 4916 1562
PP 2204 1024 2361 867
PS 1530 1195 791 871
PU 088 217 035 067
Nylons 027 064 104 241
EVA 043 062 049 101
PVC 021 065 008 023
Latex 002 008 005 019
PE amp PP mix 023 039 021 055
PET 002 008 000 000
Nitrile 000 001 000 000
PMMA 002 009 000 000
PTFE FEP 000 000 000 000
CA 001 005 000 000
PC 001 006 007 027
ABS 012 046 000 000
Unknown 067 096 088 113
T A B L E 7
Table 7 Mean abundance (percentage) of polymers in Yarra and Maribyrnong Rivers
A P P E N D I C E S
C O N T E N T S
| 65 |
gt Appendix 4
Changes in individual litter items over time
YARRA RIVER
Plastic Kendallrsquos tau Z P-value
Hard Plastic Fragments 033 741 lt0001
Nurdles 008 086 0391
Other 023 229 0022
Plastic Bottle Caps 016 146 0146
Plastic Straws -025 -234 0019
Polystyrene 022 346 0001
Soft Plastics 027 578 lt0001
Sponge 025 248 0013
Twine 007 072 0470
Cigarette butts 017 164 0102
MARIBYRNONG RIVER
Plastic Kendallrsquos tau Z P-value
Hard Plastic Fragments 026 552 lt0001
Nurdles -004 -044 0657
Other 043 416 lt0001
Plastic Bottle Caps -013 -125 021
Plastic Straws -021 -195 0051
Polystyrene 009 14 0161
Soft Plastics 013 279 0005
Sponge 007 064 0524
Twine 004 042 0671
Cigarette butts -003 -031 0755
Table 4 Kendallrsquos tau test results Change in counts of plastic over time by category for the Yarra and Maribyrnong rivers Kendallrsquos tau the Z value and P-values are presented Significant values are in red These results are important for interpreting the scatterplots in Figures 18 and 19 A positive tau indicates an increase in litter over time A negative tau indicates a decrease over time Kendallrsquos tau is a non-parametric correlation value
T A B L E 4
| 66 |
gt Appendix 5
Bandalong litter traps
In the Yarra River multiple outliers were recorded for the total litter items captured per trawl date Litter traps
were emptied over 24 of the trawl days Six of those days showed higher than average litter counts On 35
trawl days litter traps were not emptied and we saw five higher than average total litter counts
Figure 30 A Wilcoxon rank sum test compared median litter counts when litter trap was emptied to when litter trap was not emptied (two days before trawl) We did not find any effect of litter trap emptying on the total number of litter items captured (W = 289 P = 0162)
F I G U R E 3 0
A P P E N D I C E S
C O N T E N T S
| 67 |
gt Appendix 6
Yarra Environmental flows
There was no significant association between environmental flow events and plastic counts in the Yarra (t =
-03 P = 0768) The amount of variation in microplastic counts explained by environmental flows was close
to zero (adjusted R2 lt 0001) Note that microplastic count was square root transformed to meet
assumptions of a regression analysis
Figure 31 Count of microplastics per trawl as a function of environmental flows in the Yarra River
F I G U R E 3 1
raquo Andrady A L (2006) Assessment of
environmental biodegradation of synthetic
polymers Polym Rev 1994 3425ndash76
raquo Andrady A L (2011) Microplastics in the marine
environment Marine pollution bulletin 62
1596-1605
raquo Barua S Muttil N Ng A amp Perera B (2013) Rainfall
trend and its implications for water resource
management within the Yarra River catchment
Australia Hydrological Processes 27 1727-1738
raquo Barmand S Goodsell K Yardley D Kowalczyk N
(2020) Polystyrene pollution in the Yarra river
sources and solutions Yarra Riverkeeper
Association
raquo Barnes D K Galgani F Thompson R C amp Barlaz
M (2009) Accumulation and fragmentation of
plastic debris in global environments
Philosophical Transactions of the Royal Society of
London B Biological Sciences 364 1985-1998
raquo Barrett J Chase Z Zhang J Banaszak Holl M M
Willis K Williams A Hardesty B D Wilcox C
(2020) Microplastics pollution in deep-sea
sediments from the Great Australian Bight
Frontiers in Marine Science October 2020
Volume 7 Article 576170
raquo Blake N amp Charko F (2014) Pilot study to identify
the extent of microplastics in the Maribyrnong
and Yarra Rivers and Port Phillip Bay Port Phillip
EcoCentre report
raquo Borelle S B Ringma J Law K L Monnahan C C
Lebreton L McGivern A Murphy E Jambeck J
Leonard G H Hilleary M A Eriksen M
Possingham H P De Frond H Gerber L H
Polidoro B Tahir A Bernard M Mallos N Barnes
M Rochman C M (2020) Predicted growth in
plastic waste exceeds efforts to mitigate plastic
pollution Science 369 (6510) 1515-1518
raquo Brillant M amp Macdonald B (2000) Postingestive
selection in the sea scallop Placopecten
magellanicus (Gmelin) the role of particle size
and density Journal of Experimental Marine
Biology and Ecology 253 211-227
raquo Browne M A Dissanayake A Galloway T S
Lowe D M amp Thompson R C (2008) Ingested
microscopic plastic translocates to the circulatory
system of the mussel Mytilus edulis (L)
Environmental science amp technology 42
5026-5031
raquo Browne M A Niven S J Galloway T S Rowland
S J amp Thompson R C (2013) Microplastic moves
pollutants and additives to worms reducing
functions linked to health and biodiversity
Current Biology 23 2388-2392
raquo Charko F Blake N Kowalczyk N Johnstone C
Seymore A Quek Y (2018) Microplastics in the
Maribyrnong and Yarra Rivers Melbourne
Australia Port Phillip EcoCentre report
raquo CIEL (2019) Plastic amp climate the hidden costs
of a plastic planet Center for International
Environmental Law
httpswwwcielorgplasticandclimate
raquo Chidambarampadmavathy (2017) Sustainable
bio-plastic production through landfill methane
recycling Renewable and Sustainable Energy
Reviews Volume 71 May 2017 Pages 555-562
raquo Cole M Lindeque P Halsband C amp Galloway T S
References
| 68 |
R E F E R E N C E S
C O N T E N T S
| 69 || 69 |
(2011) Microplastics as contaminants in the
marine environment a review Marine pollution
bulletin 62 2588-2597
raquo Commonwealth of Australia (2016) Toxic tide the
threat of marine plastic pollution in Australia
Environment and Communications Reference
Committee
raquo DAWE (2018) National Waste Policy - less waste
more resources Department of Agriculture Water
and the Environment
raquo DAWE (2019) National Waste Policy - Action plan
Department of Agriculture Water and the
Environment
raquo DELWP (2017) Port Phillip Bay Environmental
Management Plan The State of Victoria
Department of Environment Land Water
and Planning
raquo DELWP (2019) Victoria in Future 2019 ndash
Population Projections 2016 to 2056 The State of
Victoria Department of Environment Land Water
and Planning
raquo Depledge M Galgani F Panti C Caliani I Casini
S amp Fossi M (2013) Plastic litter in the sea Marine
environmental research 92 279-281
raquo Eerkes-Meedrano D Thompson R C amp Aldridge
D C (2015) Microplastics in freshwater systems a
review of the emerging threats identification of
knowledge gaps and prioritisation of research
needs Water research 75 63-82
raquo Galgani F Hanke G Werner S Oosterbaan
Nilsson P Fleet D (2013) Guidance on monitoring
of marine litter in European seas European
Commission
raquo Gall S amp Thompson R (2015) The impact of debris
on marine life Marine Pollution Bulletin 92 170-179
raquo Gasperi J Wright S L Dris R Collard F Mandin
C Guerrouache M Langlois V Kelly F J Tassing
B (2018) Microplastics in air are we breathing it
in Current Opinion in Envi Sci amp Health vol 1 1-5
raquo Gewert B Plassmann M M MacLeod M (2015)
Pathways for degradation of plastic polymers
floating in the marine environment
Environmental Science Processes amp Impacts vol
17 no 9 pp 1513-1521
raquo Hoellein T J McCormick A R Hittie J London
M G Scott J W amp Kelly J J (2017) Longitudinal
patterns of microplastic concentration and
bacterial assemblages in surface and benthic
habitats of an urban river Freshwater science
35(3) 000-000
raquo Jambeck J R Geyer R Wilcox C Siegler T R
Perryman M Andrady A Narayan R amp Law K L
(2015) Plastic waste inputs from land into the
ocean Science 347 768-771
raquo Jepson P D Deaville R Barber J L Aguilar A
Borrell A Murphy S Barry J Brownlow A
Barnett J Berrow S Cunningham A A Davidson
N J Ten Doeschate M Esteban R Ferreira M
Foote A D Genov T Gimenez J Loveridge J
Llvona A Martin V Maxwell D L Papachlimitzou
A Penrose R Perkins MW Smith B De Stephanis
R Tregenza N Verborg P Fernandez A Law R J
(2016) PCB pollution continues to impact
populations of orcas and other dolphins in
European Waters Nature Science Reports 6 18573
raquo Kim JS Lee HJ Kim SK Kim HJ (2018) Global
Pattern of Microplastics (MPs) in Commercial
| 70 |
Food-Grade Salts Sea Salt as an Indicator of
Seawater MP Pollution Environ Sci Technol
2018 52 21 12819-12828
raquo Klein S Worch E Knepper T P (2015) Occurrence
and spatial distribution of microplastics in river
shore sediments of the Rhine-Main area in
Germany Environmental Science amp Technology
vol 49 no 10 pp 6070-6076
raquo Kowalczyk N Kelly A (2020) Litter and Flows
Connecting the Yarra and Bay Yarra Riverkeeper
Association
raquo Lamb JB Willis BL Fiorenza EA Couch CS
Howard R Rader DN True JD Kelly LA Ahmad
A Jompa J Harvell CD (2018) Plastic waste
associated with disease on coral reefs Science
359 460-462 (2018)
raquo Lavers J L Bond A L (2017) Exceptional and
rapid accumulation of anthropogenic debris on
one of the worldrsquos most remote and pristine
islands Proceedings of the National Academy of
Sciences 201619818
raquo Lavers J L Bond A L amp Hutton I (2014) Plastic
ingestion by Flesh-footed Shearwaters (Puffinus
carneipes) Implications for fledgling body
condition and the accumulation of plastic-derived
chemicals Environmental Pollution 187 124-129
raquo Lima A Costa M amp Barletta M (2014) Distribution
patterns of microplastics within the plankton of a
tropical estuary Environmental Research 132
146-155
raquo Ling S Sinclair M Levi C Reeves S amp Edgar G
(2017) Ubiquity of microplastics in coastal seafloor
sediments Marine Pollution Bulletin 121(1-2)
raquo Lusher A Hollman P Mendoza-Hill J (2017)
Microplastics in Fisheries and Aquaculture ndash
status of knowledge on their occurrence and
implications for aquatic organisms and food
safety Food amp Agriculture Organisation of the
United Nations Technical paper 615 Abstract V
raquo Mai L Bao LJ Shi L Wong CS Zeng EY (2018)
A review of methods for measuring microplastics
in aquatic environments Environ Sci Pollut Res
25 11319-11332 (2018)
raquo Mani T Hauk A Walter U amp Burkhardt-Holm P
(2015) Microplastics profile along the Rhine River
Scientific Reports 5 17988
raquo Mattson K Johnson E V Malmendal A Linse S
Hansson L-A Cedervall T (2017) Brain damage
and behavioural disorders in fish induced by
plastic nanoparticles delivered through the food
chain Scientific Reports volume 7 Article
number 11452 (2017)
raquo Melbourne Water (2018) Co-Designed Catchment
Program for the Maribyrnong Catchment Region
(including Moonee Ponds Creek) ndash October 2018 |
Version 1
raquo Melbourne Water (2018) Co-Designed Catchment
Program for the Yarra Catchment ndash October 2018
| Version 1
raquo Moore C amp Phillips C (2011) Plastic Ocean How a
sea captainrsquos chance discovery launched a
determined quest to save the oceans Avery
New York
raquo Murray F amp Cowie P R (2011) Plastic
contamination in the decapod crustacean
Nephrops norvegicus (Linnaeus 1758) Marine
pollution bulletin 62 1207-1217
References (cont)
R E F E R E N C E S
C O N T E N T S
| 71 |
raquo OrsquoFarrell K (2019) 2017-2018 Australian Plastics
Recycling Survey ndash National Report Envisage
Works Australian Government Department of the
Environment and Energy EPA NSW Sustainability
Victoria Government of Western Australia ndash
Department of Water and Environmental Regulation
raquo Orb Media (2017) Invisibles the plastics inside us
Orbmediaorgstoriesinvisibles_plastics
raquo Pattison M (2020) Analysis of microplastic
polymers in the Yarra and Maribyrnong Rivers
Unpublished Honours dissertation
raquo Rochman C M Hoh E Kurobe T amp Teh S J
(2013) Ingested plastic transfers hazardous
chemicals to fish and induces hepatic stress
Scientific reports 3
raquo Royer S-J Ferroacuten S Wilson S T Karl D M (2018)
Production of methane and ethylene from plastic
in the environment PLOS One 13(8) e0200574
raquo Sadri S S amp Thompson R C (2014) On the
quantity and composition of floating plastic debris
entering and leaving the Tamar Estuary Southwest
England Marine pollution bulletin 81 55-60
raquo Schwartz A E Ligthart T N Boukris E Van
Harmelen T (2019) Sources transport and
accumulation of different types of plastic litter in
aquatic environments A review study Marine
Pollution Bulletin 143 (2019) 92-100
raquo Sustainability Victoria (2019) Microplastics and
Port Phillip Bay - Citizen science study finds
significant amounts of microplastics on Port
Phillip Bay beaches Summary report
raquo Teuten E L Saquing J M Knappe D R Barlaz M
A Jonsson S Bjoumlrn A Rowland S J Thompson
R C Galloway T S amp Yamashita R (2009)
Transport and release of chemicals from plastics
to the environment and to wildlife Philosophical
Transactions of the Royal Society of London B
Biological Sciences 364 2027-2045
raquo Thompson R C Olsen Y Mitchell R P Davis A
Rowland S J John A W McGonigle D amp Russell
A E (2004) Lost at sea where is all the plastic
Science 304 838-838
raquo UNEP (2016) Marine plastic debris and
microplastics ndash Global lessons and research to
inspire action and guide policy change United
Nations Environment Programme Nairobi
raquo World Health Organisation (2019) Microplastics in
drinking water WHO Technical report
raquo Zeynep A Basak G (2019) Microplastics in the
environment A critical review of current
understanding and identification of future
research needs Environmental Pollution 254
(2019) 113011
raquo Yonkos L T Friedel E A Perez-Reyes A C
Ghosal S amp Arthur C D (2014) Microplastics in
four estuarine rivers in the Chesapeake Bay
USA Environmental science amp technology 48
14195-14202
raquo ZonMW (2019) httpswwwzonmwnlen
research-and-resultslife-sciences-health
programmasprogramme-detail
microplastics-health
Imag
e J
osi
e Jo
ne
s
Imag
e J
osi
e Jo
ne
s
Imag
e N
at S
ald
um
bid
e
C O N T E N T S
| 5 |
Clean Bay Blueprint is a three-year litter study conducted between July 2017 and June 2020 The project was funded by the Victorian Governmentrsquos Port Phillip Bay Fund as part of their commitment to deliver the Port Phillip Bay
Environmental Management Plan 2017ndash2027 (Port Phillip Bay EMP) The aims of Clean Bay Blueprint are conducting rigorous and replicable methods to quantify plastic pollution through microplastics trawls and beach litter audits engaging the community in citizen science activities and building partnerships with other organisations that target litter and Bay health A range of complementary investigations were undertaken in parallel to the projectrsquos primary research and where appropriate such activities as well as peer-reviewed research inform the Clean Bay Blueprint recommendations
Microplastics in the Yarra and Maribyrnong rivers
The potential for microplastic pollution to harm
aquatic life is recognised by scientists as a global
problem Microplastics are classified as pieces of
plastic smaller than 5 mm in diameter which
originate from broken-up larger plastic products
This study highlights the pervasiveness of plastics
in our urban water catchments and reflects their
ubiquitous use mobility and extreme persistence
The trawls removed a total of 40030 litter items
from the surface waters of the Yarra and 13658
litter items from the surface waters of the
Maribyrnong River In total over 25 billion litter items flow into Port Phillip Bay annually from the two riversrsquo surface waters Over 2 billion (85) of these items are microplastics Microplastics
accounted for 85 and 83 of the total litter count
in the Yarra and Maribyrnong respectively
In both rivers the vast bulk of the litter caught
consisted of hard plastic remnants of broken-up
plastic items followed by polystyrene and soft
plastics Polystyrene is more problematic in the
Yarra whereas the Maribyrnong carries relatively
more nurdles plastic bottle caps plastic straws
twine and cigarette butts
Although large variations in monthly collections
were noted through the entire study period it was
found the Yarra River carries significantly more litter
than the Maribyrnong
An alarming result of this study is that litter is
increasing in both the Maribyrnong and the Yarra
with plastic pollution in the Yarra increasing at a
much faster rate The rate at which plastic pollution
in both rivers is increasing is very high litter in the
Yarra increased by 400 in 2017 compared to 2016
and then in 2019 it again more than doubled
compared to 2018 levels The Maribyrnong saw a
more gradual increase over time but still increased
by around 57 to 83 year on year since 2017
Executive summary
| 7 || 6 |
Interestingly plastic straws is the only litter item
category declining over time This is most likely due
to community advocacy and action by retailers to
reduce their use showing that community action
and individual behaviour change work
Microplastics trawls in the Bay
To gain insight into the relative quantities of
microplastics entering the Bay from Bass Strait as
compared to the major rivers a pilot project of nine
manta net trawls was conducted at the entrance to
Port Phillip Bay
Of the nine trawl samples collected at Popersquos Eye in
Port Phillip Bay eight contained plastics
Microplastics made up 64 of samples The most
prevalent items were hard plastic fragments which
aligns with results from the river trawls and
Baykeeper beach litter audits
Baykeeper Beach Litter Audits
The Baykeeper Beach Litter Audit is a citizen
science method designed to focus on microplastic
pollution Twelve beaches around the Bay were
surveyed multiple times with the help of various
community groups Hard plastic fragments and
nurdles were the most recorded items
Recommendations
In view of the high quantities of litter and
microplastics recorded in this study the negative
effects plastic pollution may have on wildlife in
Port Phillip Bay and the potential threat to human
health in the longer term six recommendations for
land managers government industry and
researchers have been formulated based on the
findings in this report
1 Improve product stewardship
11 Transition to a circular economy model
12 Invest in implementing alternatives to plastic
13 Set limits on virgin plastic production
14 Ban broad-scale groups of problematic
single-use plastics
15 Make the Operation CleanSweep program
mandatory
1 E X E C U T I V E S U M M A R Y
| 7 |C O N T E N T S
2 Cultivate effective partnerships
3 Support local councils in waste management 31 Install and maintain pollutant traps in drain
outlets that discharge into creeks and rivers
32 Enforce litter and illegal dumping laws
33 Run effective litter prevention and education
programs
34 Review and improve current street-sweeping
schedules
4 Continue monitoring (micro)plastics pollution
5 Increase education and lsquoplastic literacyrsquo of all plastic users
51 Set standard legal definitions
52 Develop project grants forums and
strategic ongoing partnerships
53 Adequately resource groups who educate
and facilitate action on plastic pollution
6 Conduct further research 61 Conduct depth-sampling studies
62 Conduct sediment studies
63 Prioritise understanding the contaminants
carried by plastic in waterways and
associated human health risks
64 Conduct on-ground investigations for
major sources
A wide body of research now confirms that the
current pace of rethinking plastics is insufficient to
match the scale of increasing plastic pollution in
our air water soil food chain and human bodies
Substantial changes are justified This study
demonstrates that Melbourne faces an alarming
increase in waterway contamination This poses
particular concern considering the relatively
enclosed configuration of Port Phillip Bay and the
Bayrsquos importance as a recreational fishery
As of July 2021 the jurisdictions studied in Clean
Bay Blueprint are subject to Victoriarsquos legislated
General Environmental Duty to protect the
environment and human health We hope this
studyrsquos baseline data provides government land and
water managers businesses and community with a
clear mandate to invest in reforms that address
plastic pollutionrsquos ongoing threat to Victoriarsquos
economic social and environmental wellbeing
Frankston Pier
2
EcoCentre volunteers conducting a Baykeeper Beach Litter Audit Image Nat Saldumbide
C O N T E N T S
| 9 |
Introductiongt Port Phillip EcoCentre
The Port Phillip EcoCentre (the EcoCentre) is an independent environmental not-for-profit organisation Its mission is to build relationships educate and demonstrate sustainable environmental practice and strengthen peoplersquos connection to the natural world
The EcoCentre is a leading community-managed
organisation with a dedicated team of scientists
educators and volunteers who design and
implement innovative environmental programs Its
expertise is to activate people to look after the
health of Port Phillip Bay and its waterways and
catchments as well as the urban ecology of Greater
Melbourne within the traditional lands and waters
of the Kulin Nation The EcoCentre delivers
specialist education citizen science research and
community action projects with over 250 cross-
sector partners
The EcoCentre is also home to the Port Phillip
Baykeeper who provides an independent voice for
Port Phillip Bay The Baykeeper is affiliated with the
Waterkeeper Alliance (an international network of
waterways protectors) and works closely with the
Yarra Riverkeeper and Werribee Riverkeeper in
protecting their respective waterways each with a
strong local support base
Port Phillip Bay and catchments
Port Phillip Bay is the largest marine embayment in
Victoria with a surface area of 1934 km2 and
333 km of coastline (DELWP 2017) It is relatively
shallow at 13 m average depth and almost half of it
is less than 8 m deep Situated along its northern
shores is the City of Greater Melbourne with a
population of nearly five million people (DELWP
2019) The City of Greater Geelong is located in the
south west
The Bayrsquos catchment area is 9694 km2 with several
rivers creeks and many storm water drains draining
into the Bay (DELWP 2017) The Yarra and
Maribyrnong are the largest of the rivers and flow
through heavily urbanised areas before reaching the
north end of the Bay
| 10 |
Clean Bay Blueprint project
Clean Bay Blueprint is a three-year litter study
conducted between July 2017 and June 2020 The
project was funded by the Victorian Governmentrsquos
Port Phillip Bay Fund as part of its commitment to
deliver the Port Phillip Bay Environmental
Management Plan 2017ndash2027 (Port Phillip Bay EMP)
Clean Bay Blueprint delivers outcomes for the Port
Phillip Bay EMPrsquos Priority Area 4 ndash Litter
Clean Bay Blueprint takes a catchment-to-coast
approach investigating catchment coast and Bay
litter as a whole Litter recognises no geographical
boundaries as it travels from the burbs to the Bay
all areas are connected which makes an integrated
approach to litter research necessary This
integrated approach will help to get a better
understanding of litter prevalence and movement
with the goal of informing local litter source
reduction plans to achieve better environmental
outcomes To gather data from a range of regions
over time a citizen science approach was applied
for community volunteers to collect and contribute
data according to prescribed methods
Project aims
This projectrsquos research methods were designed
primarily to document microplastics which are
defined by Thompson et al (2004) as plastic pieces
between 1 μm and 5 mm in diameter Microplastics
in the environment mostly result from the
inappropriate disposal of consumer products and
industrial by-products and waste that break up into
smaller pieces Their small size renders them
unlikely to be collected in conventional litter traps
by beach-cleaning rakes or manual clean-ups The
Figure 1 Port Phillip Bay and catchment (Image source Port Phillip Bay Environmental Management Plan 2017ndash2027 DELWP 2017)
F I G U R E 1
2 I N T R O D U C T I O N
C O N T E N T S
| 11 |
small size of microplastics causes them to be easily
overlooked when picking up litter even when
clean-ups include a data recording component
Microplastics are recognised as a threat to
waterways and oceans worldwide due to their
small size which makes them easily ingested by
wildlife Clean Bay Blueprint is the latest of the
EcoCentrersquos microplastics research projects which
commenced in 2013 and has refined study
methods in consultation with CSIRO RMIT
University EPA Victoria and others
The three aims of Clean Bay Blueprint are
gt 1 Conducting rigorous and replicable methods
to quantify plastic pollution through
microplastics trawls and beach litter audits
To reflect the catchment-to-coast approach river
and Bay boat trawls as well as land-based litter
audits were conducted The quantification of
microplastics in rivers by trawling is the first research
project of its kind in Australia (see Chapter 3) The
Baykeeper Beach Litter Audits quantify plastics and
microplastics on seven beaches associated with
urbanised stormwater catchments around the Bay
using an audit method that is specifically designed
to collect samples that are representative of all
conditions on a beach and can be performed by
citizen scientists (see Chapter 5)
gt 2 Engaging the community in citizen science
activities
Citizen science is an excellent way of engaging the
community in place-based learning empowering
people to take practical action to create positive
change for the environment as well as regularly
gathering data to track volumes of plastic pollution
over time The Baykeeper Beach Litter Audits
conducted for this project engaged various
community groups schools tertiary students and
individual community members in scientific data
collection education and conversations about plastic
pollution Awareness raised through citizen science
activities is aimed to increase positive behaviour
change in addition to collecting useful data
Evidence to support the case for governments
industry and communities to make changes to
reduce any threatening process will necessarily be
collected systematically over time and space to
confirm the threat is widespread and ongoing The
extent of data collection required over such time
and space would not be achievable without the
contribution of dedicated citizen scientists
gt 3 Building partnerships with other
organisations that target litter and Bay health
Many government environmental and community
organisations have started researching educating
and raising awareness on litter As litter has become
a problematic issue on many different levels
integrated approaches and cross-sector
collaborations are integral to the success of its
reduction in the environment
Over the project life a range of complementary
projects and additional investigations took place
including land surveys data visualisation polymer
analysis of plastic fragments and prototyping a
depth-sampling device to extend surface trawls
Plastic pollution in the global context
Widespread production and consumption of
single-use plastics inadequate waste management
and infrastructure and regulations improper waste
management practices inadequate wastewater
treatment and littering have led to tonnes of marine
plastic pollution entering the ocean on a daily basis
Jambeck et al (2015) estimated that around eight
million metric tonnes of our plastic waste enter the
oceans from land each year often via rivers (Mani
et al 2015)
| 12 |
Two main types of hard microplastics are found
most often in waterways and oceans nurdles and
fragments (Barnes et al 2009) Nurdles also known
as pre-production pellets are the pre-fabrication
material for a wide range of industrial and
consumer plastic products They are classified as
primary plastics and they enter the aquatic
environment mainly through accidental spillage and
poor product management at processing plants
and during transport (Cole et al 2011) They are
spherical or flat-cylindrical in shape and are often
transparent or black although it is not uncommon
to find white red yellow and blue nurdles (picture
1) Hard plastic fragments are known as secondary
microplastics and are derived from the breakup of
larger plastic items They are irregular in shape and
vary greatly in colour due to their primary design
Once in the ocean microplastics can persist for
thousands of years (Andrady 2006) and have been
observed in marine systems worldwide (Cole et al
2011 Barnes et al 2009)
Picture 1 Nurdles (left) and hard plastics fragments (right)
In 2018 alone 359 million metric tonnes of plastic
were produced globally (Statista 2020) and
modelling by Borelle et al (2020) shows that
predicted levels of plastic lost in the environment
will be 53 million metric tonnes per year by 2030 if
no additional action is taken Because of plasticrsquos
durability and extreme mobility (it floats flies and
sinks) it eventually enters our waterways either by
accident or intentionally (Moore and Phillips 2011)
The large litter items frequently captured in this study
including straws lolly wrappers and plastic bottle
caps eventually deteriorate through physical
biological and chemical processes (Andrady 2011)
into tiny fragments that enter Port Phillip Bay at an
alarming rate and can be ingested by aquatic animals
gt Effects on living organisms
Marine plastic pollution has become an urgent
issue affecting wildlife in waterways and oceans
Worldwide at least 690 species have encountered
plastic pollution many of which are listed as
threatened species (Gall and Thompson 2015)
Ingestion of plastic including microplastics can
lead to injury (eg blocked digestive tracts and
organ rupture) and death (Lavers et al 2014)
Furthermore in addition to leachable chemicals
that are added in the manufacturing process itself
plastics adsorb (attract as an exterior film) organic
micro-pollutants or persistent organic pollutants
(POPs) which include polychlorinated biphenyls
(PCBs) Dichlorodiphenyldichloroethylene (DDE) and
nonylphenol (Teuten et al 2009) The ingestion of
these toxic chemicals is known to affect the
physiology and behaviour of organisms which
ultimately affects population stability as shown by
reproductive dysfunctions caused by PCBs in orca
and dolphin populations in Europe (Jepson 2016)
Lamb et al (2018) calculated that the likelihood of
disease in corals that are in physical contact with
plastics increases from 4 to 89 and that by 2025
an estimated 444 billion pieces of plastic items will
be entangled in coral reefs through the Asia-Pacific
Plastic chemicals bioaccumulate and biomagnify
up the food chain (Figure 2) This increasing
P I C T U R E 1
2 I N T R O D U C T I O N
C O N T E N T S
| 13 |
concentration of toxic chemicals in the tissues of
organisms at successively higher levels in a food
chain has been linked to disease and death in
several top predators (Gall and Thompson 2015)
Figure 2 The process of biomagnification of plastic
toxins up the food chain
Relatively few marine and freshwater systems in
Australia have been systematically investigated for
microplastic pollution This is of grave concern
considering coastal and estuarine systems around
Australia are some of the most biodiverse
ecosystems in the world More particularly the
relatively enclosed waters of Port Phillip Bay which
supports an aquaculture industry and a growing
recreational fishery are subject to runoff from
urbanised catchments The potential for marine
plastic pollution to cause environmental harm is
recognised as a global problem and is listed as one of
the greatest threats to marine biodiversity (Gall and
Thompson 2015 Depledge et al 2013) A review of
current understandings of microplastics in the
environment and future research needs by Zeynep
and Basak (2019) concluded that the extent and
effects of microplastic pollution in continental
environments such as rivers lakes soil and air is still
poorly understood Microplastic contamination of
aquatic environments will continue to increase for
the foreseeable future and at present there are
significant knowledge gaps on the occurrence in the
aquatic environment and organisms of the smaller
sized microplastics (less than 150 μm) and their
possible effects on seafood safety (Lusher et al
2017)
Several studies have shown that plastics are now
inside human bodies via our food (Kim et al 2018)
drinking water (Orb Media 2017) and even the air
we breathe (Gasperi et al 2018) It is currently
unknown what if any health effects there are on
human populations (WHO 2019) However in 2019
a research program started in the Netherlands
investigating the potential health effects of ingested
microplastics in humans (ZonMW 2019) Results of
these studies will be released in the near future
gt Climate impacts of plastics
Plastic is linked to climate impacts through
F I G U R E 2
| 14 |
emissions at multiple stages of its lifecycle
Greenhouse gas emissions happen at every step in
the lifecycle of a plastic product the extraction of
fossil fuels and transport plastic refining and
manufacture plastic waste management and the
ongoing impacts of it while polluting the
environment including the oceans (CIEL 2019)
Plastic continues to release greenhouse gases as it
photodegrades when littered (Royer 2018) and
produces methane when degrading in landfills
(Chidambarampadmavathy 2017) Plastic
production also requires large volumes of water in a
world with finite availability of clean freshwater
gt The cost of marine plastic pollution
The following paragraphs are taken from Toxic tide
the threat of marine plastic pollution in Australia a
report delivered to the Federal Senate by the
Environmental amp Communications References
Committee (Commonwealth of Australia 2016)
266 Professor Smith stated that lsquoa key
problem in determining the source of all items
is that fragmented plastics are often the most
numerous and there is no simple way to
determine their sourcersquo Professor Underwood
similarly told the committee that there is
lsquoinsufficient researchrsquo to answer the question
of where marine plastic pollution is sourced
296 Dr Britta Denise Hardesty CSIRO
commented that lsquothe cost of littering and
debris to fisheries small business and
human health remain poorly understood
and littering costs to local government due
to remediation and tourism losses are
substantialrsquo In answer to the committeersquos
questions concerning the estimates of the
damage from marine debris on Australiarsquos
tourism fishing and shipping the
Department of the Environment added that
it did not have any estimates nor did other
Commonwealth agencies including the
Great Barrier Reef Marine Park Authority the
Australian Maritime Safety Authority and the
Australian Fisheries Management Authority
Other than projects funded by the Port Phillip Bay
Fund there has been limited research to address
knowledge gaps in relation to sources and ecosystem
impacts of plastic pollution across Australia since the
release of the Senate Inquiry report in 2016
Plastic pollution in Victoria
Locally Port Phillip Bay and surrounding waters are
supporting an ecosystem that is home to an
estimated 10000 species with many of those
species unique to the Bay1 Most plastic pollution in
Port Phillip Bay originates from land-based sources
Diverse sources include urban streets freeways and
roadside verges stormwater drains wastewater
treatment plants and river and creek runoff
Although plastic pollution has been repeatedly
identified as a major threat to Victorian waterways
there has been limited scientific assessment since
the Melbourne Water Tagged Litter Study in 1993
The EcoCentrersquos Yarra and Maribyrnong river trawls
commenced in 2014 the Litter Trackers project by
RMIT and Melbourne Water was conducted in 2019
and Sustainability Victoria recently conducted a
microplastics study on six beaches around the Bay
In this study they found between 167 and 1232
microscopic microfibres from clothing per kilogram
of sand (Sustainability Victoria 2019)
The Yarra Riverkeeper Association removed
approximately 8000 kg of waste from the Yarra and
Maribyrnong between 2017 and 2020 (Kowalczyk
and Kelly 2020) with some of the most common
collected items being foam insulation and
packaging plastic bottles and cigarette butts Both
this project and their 2020 polystyrene study in
1 httpswwwmarineandcoastsvicgovaugrants port-phillip-bay-fund
2 I N T R O D U C T I O N
C O N T E N T S
| 15 |
A close-up of the Balcombe Estuary nurdles
collaboration with Clean Water Group point to
polystyrene being a major waterway pollutant in
metro Melbourne (Barmand et al 2020)
Community groups such as Beach Patrol Bellarine
Catchment Network various Friends groups and
others across the catchments spend countless
hours of people power cleaning up beaches and
waterways Over the last few years the EcoCentre
has played a role in shifting the general focus from
merely picking up and disposing of the litter to
collecting data on what is found to be used in
advocacy efforts to reduce plastic pollution in the
environment Since February 2018 Scouts Victoria
and the EcoCentre have collaborated in the state
governmentndashfunded Street2Bay project
conducting litter audits with particular attention to
microplastics on streets in all catchments
around the Bay
Bandalong litter trap in the Yarra
| 16 |
Policy context
gt Australia
From 2018 Chinarsquos new bans and 995 purity
standards for uncontaminated recyclables left
Australia with large stockpiles of items now needing
onshore processing Extensive ripple impacts of this
challenge ndash from facility fires to paying fees to send
recyclable plastics to landfill ndash have compelled
significant rethinking of Australian waste
management systems including materials redesign
reduction re-use and recycling Industry bodies
and the Australian Government considered plastics
and other materials in a range of commitments and
aspirations towards an Australian circular economy
in which lsquowastersquo and pollution are designed out
and products and materials are kept in use through
principles such as repair and maximising use of
recycled materials over virgin resources
Australiarsquos National Waste Policy Less waste more
resources (Commonwealth of Australia 2018) and
National Waste Policy Action Plan (2019) apply the
lsquoprinciples of a circular economy to waste
management to support better and repeated use of
our resourcesrsquo The targets include reducing
Australian waste by 10 per capita by 2030 and to
lsquophase out problematic and unnecessary plastics by
2025rsquo Waste policies focus on plastic diversion from
landfill however plastic uncontained by
management systems (eg lost as litter dumping or
spillage) becomes pollution of ecological and
economic concern due to its persistence in the
environment On 18 June 2015 the Senate referred
the threat of marine plastic pollution in Australia for
parliamentary inquiry and report by 8 April 2016
The final report Toxic tide the threat of marine
plastic pollution in Australia was presented on 20
April 2016 (Commonwealth of Australia 2016) The
need for systematic data collection on the extent of
plastic pollution was stated in Recommendation 1
of the report
Blair Stafford conducting a microplastics trawl in the Bay with a manta net
2 I N T R O D U C T I O N
C O N T E N T S
| 17 |
2 httpsnicholasinstitutedukeeduplastics-policy-inventory
The committee recommends that any future
Australian Government policies on mitigating
the threat from marine plastic be underpinned
by sound peer-reviewed research
gt Victoria
Plastic pollution is relevant under a range of Victorian
policies and strategies to manage waste and protect
human health and biodiversity In some instances
plastic pollution is discussed explicitly as in the
plastic bag ban (Environment Protection
Amendment Act 2019) or Recycling Victoria lsquoKey
Commitment 3 Address plastics pollutionrsquo Managing
plastics can also fall under broader principles such as
the goal lsquoVictoriarsquos natural environment is healthyrsquo in
Biodiversity 2037 the lsquowastes hierarchyrsquo principle of
environmental protection in the Environmental
Protection Act Victoria (1970) and the introduction of
General Environmental Duty in the Environment
Protection Amendment Act 2018 The General
Environmental Duty requires all Victorians to manage
risks to human health and the environment that their
activities create and becomes active from July 2021
Studies that quantify the effects and extent of
microplastics are necessary to inform policy
frameworks that reduce plastic pollution establish
waterway management strategies and assess
biodiversity health Interim results of the Clean Bay
Blueprint study have helped inform government
documents including
raquo State of the Yarra and its Parklands (2018) ndash
Commissioner for Environmental Sustainability
Victoria
raquo Assessment of the Values of Victoriarsquos Marine
Environment (2019) ndash Victorian Environmental
Assessment Council
A written submission by the EcoCentre to the 2018
review of the State Environment Protection Policy
(Waters) using the results of EcoCentre
microplastics studies led to lsquoplastics and
microplasticsrsquo being added to the list of legally
defined waterway pollutants in Victoria
Prior to the EcoCentrersquos research plastic and
microplastic pollution were not reported in
Victorian State of the Environment reports nor
specifically included in legislated protections
gt Worldwide
The United Nations Sustainable Development Goals
(SDGs) are 17 interlinked goals to achieve lsquoa better and
more sustainable future for allrsquo The management of
plastic materials relates to several SDGs
raquo Goal 12
Responsible production and consumption
raquo Goal 13 Climate action
raquo Goal 14 Life below water
raquo Goal 15 Life on land
The United Nations Environment Programme
(UNEP) has produced numerous studies on plastic
pollution and prevention in the last five years
Assessing policy efforts in 60 countries around the
globe the UNEP reports Single-Use Plastics
Roadmap to Sustainability (2018) includes ten
recommendations including (1) target the most
problematic single-use plastics by collecting
baseline data (5) raise public awareness (7) provide
incentives to industry and (9) enforce new
measures effectively
In 2020 Duke University launched a Plastics Policy
Inventory2 as a searchable database of public policy
documents targeting plastic pollution This includes
the language year enacted location and
jurisdictional level This document is updated
quarterly due to the rapidly evolving nature of policy
responses to address the health economic and
amenity threats of plastic and microplastic pollution
Melbourne City over the Yarra River
3
C O N T E N T S
| 19 |
Microplastics in the Yarra and Maribyrnong RiversThe first ever litter trawls done in rivers in Australia were conducted by the EcoCentre in 2013 The resulting report Pilot study to identify the extent of
microplastics in the Maribyrnong and Yarra Rivers and Port Phillip Bay (July 2014) showed that microplastics were present in Melbournersquos two largest rivers As a result of this pilot study monthly trawls were continued through the Turn off the Tap project (2014ndash2017) funded by the Victorian Government The final samples of this study spiked in microplastic litter which seemed to show an upward trend over time indicating further investigation was warranted Subsequently the Port Phillip Bay Fund funded Clean Bay Blueprint (2017ndash2020) for another three years of continuous research This report presents analysis of the outputs from both these projects and uses the full 55 years of data collected
Aims of the microplastics study
Within Clean Bay Blueprint the quantification of
plastics and microplastics in Melbournersquos two largest
rivers was done as a contained research study
which continued from a previous dataset collected
between 2015 and 2017 Its aims were the following
gt Quantifying plastic pollution to inform
legislative reform and behaviour change
When trawls commenced in 2014 there was no
reported evidence of the ongoing presence of
microplastic pollution in the rivers and Bay apart
from personal observations As legislative reform
and management decisions around litter need to be
driven by scientific evidence the first aims of the
study were to confirm the presence and quantify
the extent of the pollution
gt Tracking changes in litter over time and
establishing a baseline
Once presence is established the next step is to
monitor litter loads over time in order to track if
volumes increase or decrease Continuous
monitoring measures a baseline state of the river
which can be used to measure the effectiveness of
anti-litter measures taken to reduce the loss of
certain items in the environment In addition
monitoring allows researchers to notice unusual
spikes in litter loads or items that may have been
the result of mass spills and one-off pollution
events and might otherwise go unnoticed
gt Identifying the source of litter items
By tracking and quantifying the different litter items
encountered (eg polystyrene balls plastic drinking
straws cigarette butts) it may be possible to identify
| 20 |
their potential source locations This evidence could
be used to inform localised source reduction plans to
prevent an item type from entering the environment
in the first place Anecdotally known problem items
were analysed as distinct categories to learn more
about their prevalence in the waterways
Study method
gt Study site
The Yarra River flows 242 km from its source in the
forested Yarra Ranges National Park through to
central Melbourne where it enters Port Phillip Bay
More than one-third of Victoriarsquos population lives in
the Yarra catchment which covers about 4000 km2
(Barua et al 2013) The catchment includes 40
rivers and creeks including the Maribyrnong River
which runs for 160 km from its source on the
slopes of Mount Macedon The Maribyrnong
catchment covers 1408 km2
The trawl sites were selected on the basis of being
close to the lower reaches of each river and
therefore indicative of the total pollution load of each
respective catchment (Figures 3 and 4) The
Maribyrnong trawls commenced at the Water
Canon Jetty extending from the west bank of Coode
Island 300 m upstream from the Yarra The Yarra
trawls commenced underneath Bolte Bridge 25 km
upstream of the Yarra and Maribyrnong confluence
Figure 3 The locations of the Maribyrnong and Yarra catchments relative to the centre of Melbourne Images courtesy of Melbourne Water
Figure 4 Approximate trawl location transects in the Maribyrnong and Yarra Rivers
gt River trawls
A manta net designed to collect floating debris off
the waterrsquos surface was deployed from the side of
the boat and positioned outside of the wake zone
(picture 4A) Trawling was done according to
internationally standardised methods by Galgani
et al (2013) in each river all trawls commenced at
the same place travelling upstream for 30 minutes
with the boat motor operated at a constant 1000
rpm to operate the net effectively and maintain a
consistent speed for all trawls After 30 minutes the
net was retrieved the collection net (cod end)
removed (picture 4B) and placed in a container to
be dried in preparation for sorting and categorising
the contents
Between January 2015 and February 2020 a total of
113 monthly trawls were conducted in the
Maribyrnong and Yarra Rivers Both rivers were
trawled on the same day The distance covered in
each trawl varied slightly due to the effects of
different tides and prevailing wind conditions
encountered at the time While trawls were generally
done in a straight line river boating involves
changing course to safely navigate around other
watercraft that may be encountered and the course
of the trawls in each river was not rigidly defined
The lsquomouthrsquo of the manta net measures 600 mm
wide x 200 mm deep The net is 3 m long tapering
down to a 30 x 10 cmsup2 cod end Both the tapering
net and cod end are made of a 330 nm mesh size
The manta net is of the same specifications used
3 M I C R O P L A S T I C S I N T H E Y A R R A A N D M A R I B Y R N O N G R I V E R S
F I G U R E 4
F I G U R E 3
C O N T E N T S
| 21 |
by the 5 Gyres Institute to measure microplastics in
international studies In a recent review of methods
that measure microplastics in aquatic
environments Mai et al (2018) confirmed that this
collection method is recommended for large-scale
surface water sampling
gt Sample analysis method
Sample sorting was performed by trained citizen
scientists (picture 5) Dried trawl samples were
analysed by separating litter items from organic
matter with the naked eye using tweezers and
supplemental lighting Litter items were next sorted
by item type and the diameter measured with a
ruler after which the item was placed in the
corresponding size category Litter categories
included hard plastic fragments lt 2 mm hard
plastic fragments 2 mmndash5 mm hard plastic
fragments 6ndash10 mm hard plastic fragments gt
10 mm polystyrene beads lt 4 mm polystyrene
beads ge 4 mm plastic bottle caps plastic straws
soft plastics lt 5 mm soft plastics ge 5 mm lolly
wrappers cellophane lt 5 mm cellophane ge 5 mm
plastic pre-production pellets (nurdles) cigarette
butts twine sponge (synthetic sponge-like
materials) and lsquootherrsquo items which included
unidentified non-organic looking items
Internationally accepted guidelines define plastic
pieces smaller than 5 mm in diameter as
microplastics (Thompson et al 2004) In this study
the categories of hard plastic fragments lt 2 mm
hard plastic fragments 2 mmndash5 mm soft plastics lt
5 mm cellophane lt 5 mm nurdles and polystyrene
beads lt 4 mm were grouped into the microplastic
category Plastic items not visible to the naked eye
including microfibres were excluded from this study
due to logistical technical and funding constraints
Picture 4 A Manta net deployed on side of Yarra Riverkeeper vessel B Removable cod end used to collect microplastic samples
Picture 5 Citizen scientists sorting trawl samples at the EcoCentre
P I C T U R E 5
P I C T U R E 4 A P I C T U R E 4 B
| 22 |
Trawl data analysis results
The results of the sample analysis show
substantial concentrations of plastic litter
present in the Yarra and Maribyrnong Rivers
across all months of the year A total of 40030
litter items were captured and analysed from
the Yarra and 13658 litter items from the
Maribyrnong between January 2015 and
February 2020 An average of 690 litter items
were collected from the Yarra per monthly
trawl while an average of 248 litter items
were collected from the Maribyrnong per
monthly trawl
Because the Yarrarsquos width in the trawl location
is more than 160 times wider than the net and
the Maribyrnongrsquos width in the trawl location
is 120 times wider the actual extrapolated
volume of litter in both rivers is astounding
For the Yarra the rough calculation is
690 litter items x 48 half-hour sessions
day x 365 days x 160 times net width
yielding 1934208000 litter items
entering the Bay from the Yarra
annually
For the Maribyrnong this calculation is
248 litter items x 48 half-hour sessions
day x 365 days x 120 times net width
yielding 521395200 litter items
entering the Bay from the
Maribyrnong annually
Figure 5 Relative litter composition of items flowing into Port Phillip Bay from the Maribyrnong and Yarra rivers combined
Figure 6 Litter composition in trawl samples obtained from the Maribyrnong River
Figure 7 Litter composition in trawl samples obtained from the Yarra River
F I G U R E 5
F I G U R E 7
F I G U R E 6
3 M I C R O P L A S T I C S I N T H E Y A R R A A N D M A R I B Y R N O N G R I V E R S
C O N T E N T S
| 23 |
These calculations suggest that an average total of
2455603200 litter items flow into Port Phillip
Bay annually from surfaces of the Yarra and
Maribyrnong Rivers combined
It should be noted that since these litter items are
only caught in the surface waters (upper 200 mm)
this number is likely to be an underestimation of the
overall plastic pollution loading in each river
Different types of plastic display different levels of
buoyancy characterised as either positively
buoyant (floating at the surface) negatively buoyant
(sinks to the bottom) or neutrally buoyant (in the
water column) It is unknown how many items are
present in the water column or the sediments of
Melbournersquos waterways
gt Litter reaching Port Phillip Bay
Based on the 53688 litter items caught and
analysed the composition of litter entering Port
Phillip Bay shows that hard plastic fragments are by
far the most prevalent litter item (75) followed by
polystyrene (13) and soft plastics (10) (Figure 5)
Trawl samples weighed an average of
approximately 266 g most of which was organic
plant matter On average litter comprised 184 of
the total sample weight highlighting the
pervasiveness of litter in our waterways Over time
this percentage has stayed quite constant (see
Appendix 1)
gt Comparing the rivers
Hard plastic fragments polystyrene and soft
plastics were the most common items found in
both the Yarra and Maribyrnong (Figures 6 amp 7)
Hard plastic fragments made up the bulk of the
captured litter items comprising 74 of capture for
the Yarra and 76 of items captured in the
Maribyrnong
Polystyrene was the second most captured item
with 15 of items in the Yarra and 8 of items in
the Maribyrnong being polystyrene
Soft plastics (consisting of
cellophane lolly wrappers and
unidentifiable soft plastics) made up
9 of total items captured in the
Yarra and 13 in the Maribyrnong
When comparing the total litter
counts between rivers we found a
significant difference between the
Maribyrnong and Yarra Rivers
(chi-squared = 12954 df = 1 P lt
0001) with plastic litter overall more
likely to be found in the Yarra than
the Maribyrnong (Figure 8)
F I G U R E 8
Figure 8 Comparison of number of litter items in Maribyrnong and Yarra rivers
| 24 |
There is also an overall significant effect of the
rivers on distribution of plastics by item category
(chi-squared = 74726 df = 9 P lt 0001 Figure 9)
There are no significant differences in
proportions of hard plastic fragments in the
Maribyrnong or Yarra rivers (P gt 005)
There are proportionally more soft plastics
nurdles plastic bottle caps plastic straws
twine and cigarette butts in the Maribyrnong
river Conversely proportionally less of the
same items are in the Yarra river (P lt 005)
meaning that these items make up a higher
proportion of total litter counts in the
Maribyrnong than they do in the Yarra (see
Appendix 2)
When comparing polystyrene loads to the
expected proportions of polystyrene (based
on the total counts for the rivers) the
proportion of polystyrene is significantly less
than expected (P lt 005) in the Maribyrnong
and significantly more than expected in the
Yarra (P lt 005) this means polystyrene is
more likely found in the Yarra than in the
Maribyrnong
The proportion of lsquootherrsquo items is
significantly above expected in the
Maribyrnong (P lt 005) but for the Yarra
the proportion of lsquootherrsquo items was
nonsignificant (P gt 005)
F I G U R E 9
F I G U R E 1 0
Figure 9 Comparison of mean monthly number (plusmnSE) of litter items captured by the manta net in the Maribyrnong and Yarra Rivers between January 2015 and February 2020 Note that values shown are means but statistical tests were conducted on frequency of counts using chi-squared analyses (ie the standard errors should not be used to infer anything about statistical significance They are rough indicators of variation around a mean only)
Figure 10 Comparison between rivers of the total number of microplastics captured during river trawls
3 M I C R O P L A S T I C S I N T H E Y A R R A A N D M A R I B Y R N O N G R I V E R S
C O N T E N T S
| 25 |
In both rivers microplastics formed the bulk of litter
and accounted for 85 (34013 pieces) of the total
load in the Yarra and 83 (11388 pieces) of the
Maribyrnong load (Figure 10) Hard plastic
fragments lt 2 mm in length dominated the
microplastics category and accounted for 45 and
51 of microplastics in the Yarra and Maribyrnong
respectively
Of the earlier mentioned total litter items entering the
Bay microplastics make up nearly 85 which means
more than 2 billion (2076458066) microplastics flow
from the two rivers into the Bay every year
gt Analysis of plastic polymer types
Sorted trawl samples from July 2016 to August 2019
were sent to the Plastics Lab at RMIT where they
were analysed for plastic polymer types using
Fourier Transform Infrared Spectroscopy (FTIR)3
There are many polymer types each of which has
varying qualities that align it to typical uses
products or applications Through FTIR analysis
microplastics or fragments may be grouped
according to probable source products
In both the Yarra and the Maribyrnong rivers
polyethylene (PE) was the most prevalent polymer
(48 and 49 respectively) followed by
polypropylene (PP) (22 and 24 respectively)
polystyrene (PS) (15 and 79 respectively)
The Yarra River saw small amounts of 11 other
polymers each of which contributed less than 1
and 067 of samples were of an unknown
material The Maribyrnong saw a small abundance
of other polymers ranging from 1 to 005 and
had 088 of unknown material (see Appendix 3)
The two rivers showed similar trends over the
months for all three of the most prevalent polymers
The abundance of PE and PP did not statistically
differ between the Yarra and Maribyrnong (P = 067
P = 056 respectively) however PS was statistically
lower in the Maribyrnong (P = 002)
Interestingly polyethylene terephthalate (PET) and
polyvinylchloride (PVC) are some of the most
commonly produced and used plastics yet were
some of the least recorded in both the Yarra and
Maribyrnong Rivers
gt Seasonal differences in litter
There are significant effects of the seasons and the
rivers on the total count of litter (chi-squared =
12429 df = 3 P lt 0001) A comparison of total litter
by trawl indicates that there is more total litter in the
Yarra than in the Maribyrnong in any season There
was more litter in summer in both rivers However
proportionally in the Maribyrnong has more litter
in spring and autumn than is expected by chance
whereas in the Yarra the clear peak seasons are
summer and winter (Figure 11)
In summer and winter plastic litter is proportionally
higher in the Yarra than the Maribyrnong (P lt 005
for both seasons) In autumn and spring plastic litter
is proportionally higher in the Maribyrnong than the
Yarra (P lt 005 for both seasons)
Figure 11 Seasonal variation in the number of captured litter items in the Maribyrnong and Yarra Rivers between January 2015 and February 2020
3 This summary of results was used with permission from an unpublished Honours dissertation by M Pattison (2020)
F I G U R E 1 1
| 26 |
gt Changes in litter over time
The five years of data collection reveal large
increases in litter over time (Figure 13) Note the
difference in numbers on the y-axes when
comparing the rivers
Both rivers are showing a significant increase in
plastics over the sampling period although the trend
is somewhat more pronounced in the Yarra (tau =
017 z = 745 P lt 0001) than in the Maribyrnong (tau
= 010 z = 416 P lt 0001) (Figure 14)
Note the differences in percentages on the y-axes of
the respective rivers in Figures 15 and 16 which
show how much faster the Yarrarsquos litter has been
increasing over the last five years When combining
the above litter numbers and percentages there is a
similar increasing trend in litter en route to Port
Phillip Bay (Figure 17) It is unclear why there was
such an extreme increase in litter in the Yarra in 2017
The above results warranted a closer examination
of the changes in litter item categories over time
In the Maribyrnong hard plastic fragments soft
plastics and lsquootherrsquo are increasing over time
(P lt 005) (Figure 18)
Figure 19 shows that in the Yarra hard plastic
fragments soft plastics polystyrene sponge and
lsquootherrsquo in the Yarra are increasing over time (P lt 005)
However plastic straws are significantly decreasing
over time (z = -234 tau = -025 P = 0019)
All other plastics are steady showing neither a
significant increase nor decrease See Appendix 4
for more details
F I G U R E 1 2
Figure 12 shows more detailed litter item
distributions over the seasons for the separate
rivers Hard plastic fragments remain the largest
category of items throughout all seasons in both
rivers followed by polystyrene and soft plastics
Figure 12 Seasonal variation in the total number of captured litter items in the Maribyrnong and Yarra Rivers between January 2015 and February 2020 Note the difference in total litter items captured on the y-axes
Figure 13 Total number of captured litter items in the Maribyrnong and Yarra Rivers presented by trawl between January 2015 and February 2020 The labels indicate year month and trawl number A total of 62 paired trawls were conducted during this time Several litter spikes were recorded
Figure 14 Litter trends over time Litter in both rivers is increasing with litter in the Yarra increasing faster than in the Maribyrnong
3 M I C R O P L A S T I C S I N T H E Y A R R A A N D M A R I B Y R N O N G R I V E R S
C O N T E N T S
| 27 |
F I G U R E 1 3
F I G U R E 1 4
| 28 |
Baykeeper and Riverkeeper trawling for microplastics
F I G U R E 1 5 F I G U R E 1 6 F I G U R E 1 7
3 M I C R O P L A S T I C S I N T H E Y A R R A A N D M A R I B Y R N O N G R I V E R S
C O N T E N T S
| 29 |
Figure 15 Above Actual numbers of microplastics in the Maribyrnong Below Percentage increase in microplastics year-on-year
Figure 16 Above Actual numbers of microplastics in Yarra Below Percentage increase in microplastics year-on-year
Figure 17 Above Actual numbers of microplastics flowing to Port Phillip Bay Below Percentage increase in microplastics year-on-year
Figure 18 The number of plastic items by category across time in the Maribyrnong River (measured by trawl number) Note that axis scales are different for each plastic category Significant relationships are marked by an asterisk ()
F I G U R E 1 8
C O N T E N T S
| 30 |
F I G U R E 1 9
Figure 19 The number of plastic items by category across time in the Yarra River (measured by consecutive trawl numbers) Note that y-axis scales are different for each plastic category Statistically significant relationships are marked by an asterisk ()
Figure 20 Plot of microplastic count in both Yarra and Maribyrnong between 2015 and 2019 as a function of Melbournersquos population
Figure 21 Regression analysis showing a positive correlation between litter items captured and rainfall data Note that microplastic count was square root transformed to meet assumptions of a regression analysis
3 M I C R O P L A S T I C S I N T H E Y A R R A A N D M A R I B Y R N O N G R I V E R S
C O N T E N T S
| 31 |
gt Factors driving litter increases and spikes
A series of regression analyses were performed to
see what environmental factors could be driving
the increases in litter and some of the unusually
high litter counts in some of the trawls
Worldwide plastic pollution is usually positively
correlated with increases in population This indeed
applied in the Yarra and Maribyrnong as well with a
significant association between population in the
Greater Melbourne area from 2015 to 2019 and
counts of microplastics (t = 54 P = 0012)
Approximately 876 of the variation in microplastic
counts was explained by population numbers over
this time (adjusted R2 = 0876 Figure 20) which
indicates a very strong correlation
A regression analysis shows that the count of
microplastics was positively associated with total
rainfall in the previous 48 hours (t = 41 P lt 0001
Figure 21) Approximately 122 of the variation in
microplastic counts in the rivers was explained by
rainfall (adjusted R2 = 0122)
Rainfall data for the Maribyrnong was taken from
the Bureau of Meteorologyrsquos (BOM) weather station
at Melbourne Airport Rainfall data for the Yarra was
taken from the BOMrsquos Eltham weather station
To explain some of the high spikes in litter in the
Yarra two potential factors were tested for
Bandalong litter traps
The method of emptying the floating Bandalong
litter traps is focused on removing larger litter items
(gross pollutants) and does not allow for the
containment of microplastics The 2015ndash2020 dates
of the emptying of the traps in the Yarra River were
sourced from Parks Victoria Although there were
preliminary indications of litter spikes potentially
being caused by litter trap maintenance there
seemed to be no evidence of a correlation with the
data available (see Appendix 5) However additional
information sourced from Melbourne Water just
before finalising this report indicates that a more
targeted approach to investigating microplastics
leakage from Bandalong traps is appropriate Please
refer to the Yarra and Maribyrnong microplastics
research discussion below
There are currently no Bandalong litter traps in the
Maribyrnong river
Environmental water flow releases In drier periods of the year environmental water
flows are released on a needs basis from the upper
Yarra catchment to maintain the ecosystem health
of the networks of billabongs and wetlands
connected to the Yarra As these flows have the
potential to flush out litter caught in various places
along the river data on environmental water flow
releases between 2015 and 2020 were sourced
from Melbourne Water However a regression
analysis showed that there was no significant
association between environmental flow events
and plastic counts in the Yarra See Appendix 6 for
more details
F I G U R E 2 0
F I G U R E 2 1
| 32 |
Yarra and Maribyrnong microplastics research discussion
Clean Bay Blueprint and the preceding EcoCentre
projects are the first studies to investigate
microplastic loads in the Yarra and Maribyrnong
Rivers and provide the first estimation of microplastic
loads entering Port Phillip Bay on an annual basis
Every one of the 113 trawl samples analysed
between January 2015 and February 2020 contained
plastic pollution mostly consisting of microplastics
Nearly 25 billion pieces of plastic flow into Port
Phillip Bay annually from the surface waters of the
two major rivers of which over 2 billion are
microplastics smaller than 5 mm in diameter
These results are expected to be underestimations
of the litter volume entering the Bay as it does not
take into account the depth of the river and the fact
that high-density particles with additives or other
attachments and larger items will sink below the
level of trawled surface area (Mai et al 2018
Pattison 2020) As the mesh size of the net was
330 nm and sorting and counting of microplastics
was done with the naked eye particles smaller than
what could be caught in the net or observed and
confirmed as plastics during sorting (including
microfibres and nanoparticles) were not included It
must therefore be emphasised that total plastic
pollution numbers in the rivers are likely to be
much higher than the numbers in this report and
preventative and mitigating actions to reduce
plastic pollution are urgently required
gt Litter increases
An alarming result of this study is that litter is
increasing in both the Maribyrnong and the Yarra
with plastic pollution in the Yarra increasing at a
much faster rate The rate at which plastic pollution
in both rivers is increasing is very high litter in the
Yarra increased by 400 in 2017 compared to 2016
and then in 2019 it again more than doubled
compared to 2018 levels The Maribyrnong saw a
more gradual increase over time but still increased
by around 57 to 83 year on year since 2017
The Yarra exceeded the Maribyrnong in terms of
expected plastic pollution loads in 2016 (Charko
et al 2018) These changes are mostly driven by
increases in hard and soft plastic fragments and
polystyrene rather than the other categories of litter
meaning these are the litter categories that should
be addressed immediately at their source
As this study shows a very strong positive
correlation of plastic pollution with population
growth in Melbourne and the population of Greater
Melbourne is projected to grow from 5 million to 9
million by 2056 (DELWP 2019) it is expected that
plastic pollution increases will continue until
effective source reduction measures are taken
Nearly 25 billion pieces of plastic flow into
Port Phillip Bay annually from the surface waters
of the two major rivers of which over 2 billion are
microplastics smaller than 5 mm in diameter
3 M I C R O P L A S T I C S I N T H E Y A R R A A N D M A R I B Y R N O N G R I V E R S
C O N T E N T S
| 33 |
gt Litter composition in the rivers
Sample analyses revealed that hard plastic fragments
polystyrene and soft plastics were the most
common items captured Despite the manta netrsquos
selectivity to small buoyant items the sample results
largely align with several other local litter audits
Litter audits along the Westgate Park foreshore and
along St Kilda beaches between 2015 and 2017
revealed polystyrene packaging and soft plastics
(bits of plastic bags wrap cellophane etc) are the
second and third most dominant litter categories
after cigarette butts4 Hard plastic fragments were
the most captured items in manta net trawls in the
Bay (see Chapter 4) and the second most prevalent
litter items found on beaches around the Bay using
the Baykeeper Beach Litter Audit method to
monitor for microplastics (see Chapter 5)
Polystyrene is the most captured litter item in the
Bandalong litter traps in the Yarra River (Kowalczyk
and Kelly 2020) As cigarette butts much like other
heavier items sink after a relatively short period in
water and pass under the manta net their numbers
in the Yarra and Maribyrnong River trawls do not
align with general beach clean-up data where
cigarettes often dominate In addition beach
clean-up efforts are typically geared towards the
collection of large litter items Consequently hard
plastic fragments and microplastics are not
systematically recorded in litter clean-ups
In general trawl findings provide a fairly robust
representation of the microplastic pollution issue
providing valuable information about the
composition and relative abundance of dominant
buoyant litter items entering Port Phillip Bay
It is worth noting that hard plastic fragments
polystyrene and soft plastics also dominate
microplastic pollution in other urbanised
catchments around the globe These items were
the most abundant litter types collected in trawls in
the New York-New Jersey Harbour estuary USA
one of the most urbanized estuaries on earth (S
Meola New YorkndashNew Jersey Baykeeper pers
comm 2015) Similarly hard plastic fragments
polystyrene and plastic foil dominated microplastic
loads along the length of the Rhine River in Europe
(Mani et al 2015) This is not surprising given that
worldwide the packaging industry the primary
material source of microplastics in this study is the
third largest after food and energy (Moore and
Phillips 2011) and around 11 of plastic waste
generated gets lost in the environment (Borelle
et al 2020) where it breaks up into smaller pieces
under the prevailing environmental conditions
It is clear that the Yarra has much higher total litter
counts than the Maribyrnong This is probably
because the Yarrarsquos catchment area (4046 km2) is
larger than the Maribyrnongrsquos (1408 km2) and land
use between the catchments differs apart from the
Upper Yarra region the Yarra River catchment
includes 43 times more of urbanised area than the
Maribyrnong The respective Catchment Region
documents from Melbourne Waterrsquos Healthy
Waterways Strategy state that in the Maribyrnong
catchment
raquo about 10 retains its natural vegetation
(1408 km2)
raquo 80 is used for agriculture (11264 km2)
raquo 10 is urban development Greater Melbourne
and larger townships (1408 km2)
In the Yarra catchment
raquo 55 of the area retains its natural vegetation
(22253 km2)
raquo 30 is used for agriculture (12138 km2)
raquo 15 is urban development (6069 km2)
When comparing the other types of litter between
the rivers it was found that the Maribyrnong
4 amditangaroablueorg
| 34 |
(proportionally) has higher counts of soft plastics
nurdles bottle caps straws twine cigarette butts
and lsquootherrsquo items than the Yarra whereas
polystyrene is more problematic in the Yarra
gt Investigating litter by item category
Hard plastic fragments remain the most
problematic items in both rivers and have been
significantly increasing over the last five years Due
to their small size it is nearly impossible to trace
them back to their individual sources of pollution
They originate from broken-up larger items that are
lost from overflowing commercial household and
public bins littering and illegal dumping of waste
are blown off trucks during transport or from
construction andor demolition sites
The plastic polymer analysis showed that most
items in the samples were polyethylene (PE)
polypropylene (PP) or polystyrene (PS) which are
some of the most commonly used plastics in the
world However other common plastics like
polyethylene terephthalate (PET) and
polyvinylchloride (PVC) were largely absent from
the results Notably as per Pattison (2020)
degradation of polymers is not uniform and
different polymers break up via a range of
processes at varying rates (Gewert et al 2015)
Polymer types such as PE PP and PS break up faster
when exposed to UV radiation than PET and PU
thus potentially increasing the prevalence of these
secondary microplastics The varying densities of
polymers may also influence what is collected with
equipment such as the manta net which sits on the
water surface
The lowest density polymers found in the river
samples are most likely to float were PP
(090 g cm3) and PE (from 092- 097 g cm3) (see
Appendix 3A) Some of the higher density polymers
included PET (138-139 g cm3) and PVC (129-
144 g cm3) which are commonly used worldwide
but were only present in study samples in trace
amounts (see Appendix 3B) It is therefore likely that
denser polymers may be in sub-surface waters
floating underneath the manta net or have sunken
into the sediments as there is a strong correlation
between the number of microplastics found in river
sediments and increasing polymer density (Klein
et al 2015)
Further investigation of the water column and the
sediments are logical next steps in the process of
investigating microplastics pollution in the rivers
Polystyrene is the second most prevalent litter item
in the Yarra and in third place in the Maribyrnong
These findings are supported by litter research
conducted between 2017 and 2019 by the Yarra
Riverkeeper Association which found that
polystyrene was the most found item on the
riverbanks during community clean-ups as well as
in the Bandalong litter traps (Kowalczyk and Kelly
2020) A subsequent polystyrene pollution research
project by Cleanwater Group and Yarra Riverkeeper
Association attempted to trace this litter back to the
source by surveying 64 manufacturing and
distribution facilities (Barmand et al 2020) Over
80 of surveyed sites were found to have some
sort of polystyrene leakage into the environment
even when all reasonable precautions had been
taken to prevent this In addition more evidence is
being collected revealing that building sites are a
potential source of polystyrene pollution when
using insulation waffle pods5 Polystyrene also gets
lost in transport on loading bays and at waste
transfer and recycling facilities The fact that
polystyrene loss still occurs even when all
reasonable precautions are taken indicates that the
problems lie with the material itself and how it is
handled It therefore needs to be questioned if this
material should still be used for its current
purposes meanwhile alternatives should be
sought
3 M I C R O P L A S T I C S I N T H E Y A R R A A N D M A R I B Y R N O N G R I V E R S
C O N T E N T S
| 35 |
as community-led advocacy has led to retailers
swapping plastic straws for paper ones or not
offering plastic straws unless specifically requested
by their customers In some instances entire retail
precincts have pledged to cease the distribution of
plastic straws such as the traders on Gertrude
Street in Fitzroy (The Everleigh pers comm 2017)
The fact that the results of these community
initiatives are reflected in the monitoring data
indicates two things
raquo 1) Individual behaviour change community-led
advocacy and community action to reduce
plastic pollution can make a significant positive
difference for the environment
raquo 2) Ongoing data collection and monitoring of
plastic pollution are necessary to evaluate which
litter reduction initiatives are effective
Sponge is a category that has been significantly
increasing in the Yarra and mostly captures artificial
lsquospongeyrsquo substances such as sponge-like
household items building insulation foam and soft
packaging material When speculating where this
material comes from and why it is more prevalent
and increasing in the Yarra the increased residential
construction projects in the Yarra catchment may
correlate Further source tracing may provide insight
Other is a category applied to record items that are
not readily identifiable as fitting into any of the
other categories but are obviously not organic In
both rivers this category is significantly increasing
especially in the Maribyrnong where the graphrsquos
J-curve in Figure 18 suggests an exponential
increase This warrants closer investigation of this
category in future research to see if there are
specific items that are trending and if another litter
item category should be added for specific
monitoring focus
Soft plastic fragments are steadily increasing over
time Much like hard plastic fragments soft plastics
are difficult to trace back to a single source Much of
it likely comes from plastic littered on the streets or
it blows out of bins and skips due to its light weight
and prevailing wind strength and direction in relation
to the bin Once in waterways soft plastics carried
on rapid flood flows commonly snag on woody
streamside vegetation causing them to shred
Nurdles are ubiquitous in waterways all over
Victoria as supported by evidence gathered by
Tangaroa Blue Foundation and the EcoCentre since
2014 (N Blake F Charko pers comm 2020)
Although nurdles have neither significantly
increased nor decreased over the life of this project
they are still making up a steady 1 of microplastics
flowing into the Bay over time Chapter 5 of this
report shows that nurdles are the number one
microplastic type found on beaches around the
Bay indicating that this type of pollution is an
ongoing issue
As nurdles are classed as an industrial pollutant
rather than litter it is relatively easy to identify their
source These pellets can be traced back to the
premises of plastic manufacturers where they are
spilled on the loading bays and driveways and are
often incompletely or not at all recovered after a
spill Some get lost in road transport on their way to
manufacturers and end up in the gutters Refer to
Chapter 7 for recommendations on this issue
Plastic straws are the only item category that has
significantly declined over time in the Yarra This is
notably going against the trend of all other items in
both rivers that are either increasing or staying
constant over time The most likely explanation for
this is that over the last several years community
and business-driven source reduction initiatives
such as lsquoThe Last Strawrsquo have gained great traction
in Melbourne Individual behaviour change as well
5 Although the Master Builders Association offers a waste minimisation guide that includes waffle pods it does not outline how this material should be handled onsite to prevent spillage
| 36 |
Bottle caps cigarette butts and twine have neither
increased nor decreased in both rivers Although
cigarette butts are in the top ten of most littered
items in Australia their plastic filters get
waterlogged and most likely pass under the manta
net explaining the low numbers found in this study
gt Seasonal variations
When examining the seasonal effects on the rivers
the Maribyrnong proportionally has its largest
surface litter output in spring and autumn while for
the Yarra litter numbers are highest during summer
and winter One likely reason for this difference
could be related to sports events that draw large
numbers of people to the vicinity of the rivers such
as football season for the Yarra in winter and horse
racing events at Flemington Race Course in spring
for the Maribyrnong In summer the Yarra parklands
are extensively used for recreation and tourism in
Melbourne CBD is at its peak in DecemberndashJanuary
However both rivers have different land uses
influencing them and there are vast differences in
the industrial usage and population density along
the rivers (Yonkos et al 2014) Litter hotspots may
also play a role For example Calder Park Raceway
is located near Jacksons Creek not far upstream
from where the creek joins the Maribyrnong River
Road verges in the vicinity of Calder Park are
heavily littered (N Blake pers comm 2020) with
plastic items potentially shredded when verges are
seasonally slashed Both rivers are subject to
different street cleaning and sweeping schedules
and practices by local councils
gt Other factors influencing litter
Rainfall There is a positive correlation between
rainfall and plastic pollution which is consistent
with research worldwide Littered items anywhere
in the catchment eventually make their way down
to the nearest waterway through the stormwater
drain system heavily polluting creeks and streams
that lead into the big rivers and the Bay (picture 6)
Litter traps Although no statistical correlation was
found between microplastics spikes and emptying of
the litter traps this conclusion was reached through a
Wilcoxon rank sum test comparing median litter
Picture 6 Litter in the Merri Creek which flows into the Yarra
P I C T U R E 6
3 M I C R O P L A S T I C S I N T H E Y A R R A A N D M A R I B Y R N O N G R I V E R S
C O N T E N T S
| 37 |
counts when the litter trap was emptied to when the
litter trap was not emptied (two days before trawl) See
Appendix 5 for more details Just before publication of
this report subsequent advice was received from
Melbourne Water that the average Yarra River current
speeds between Burnley and Bolte Bridge is 55 km
per hour (P Rasmussen Melbourne Water Team
Leader Flood Preparedness pers comm 2020)
The distance from Burnley to Bolte Bridge is
approximately 758 km therefore estimated travel time
is about 06 to 38 hours with the average
approximately 15 hours The shorter duration could
be applied during higher flows following rainfall runoff
The longer durations are generally normal conditions
With tides ebbing and flowing for all conditions the
average may be best applied Accordingly any spikes
in trawl contents attributable to emptying of
Bandalong traps could only apply to trawls conducted
within just a few hours of the traps being emptied
Apart from litter prevention measures gross
pollutant traps could be installed on the
problematic major drain outlets and catch items
before they make it into the creeks Once it reaches
the creeks plastic pollution mixes in with organic
materials and will be more onerous and costly to
remove from the waterways due to the much
higher volumes presented by these combined
materials To be effective gross pollutant traps
require adequate and proactive maintenance
schedules and resources to prevent them from
blocking or overflowing
However gross pollutant traps do not often catch
microplastics Although the data in this report do
not show a direct statistically significant correlation
between microplastic capture and the emptying of
the Bandalong litter traps in the Yarra personal
observation of the manner in which the traps are
emptied confirms that microplastics do escape
during this process More targeted research
specifically designed to test for the effectiveness of
microplastics captured by gross pollutant traps
during their operation and maintenance is
therefore necessary
Yarra environmental water flow releases No
correlation was found between microplastics
captured in the trawls and Melbourne Waterrsquos
regulated release of environmental water flows for
the Yarra There is no evidence that environmental
water flows exacerbate plastic pollution in
waterways This supports the result that litter
originates from the street making its way into the
rivers through stormwater drains
gt Implications for marine life in the Yarra estuary
and Port Phillip Bay
Port Phillip Bay is a relatively closed system due to
the distance between the Bellarine and Mornington
Peninsulas being only just under 35 km Due to
prevailing winds it is likely the Bay is a sink for a major
portion of the plastics that enter it from the rivers
This study found that microplastics form the bulk of
items entering the Bay from the surface waters of the
Maribyrnong and Yarra rivers The results of a pilot
project of nine Bay trawls showed the presences of
microplastics in eight of nine samples (see Chapter 4)
To date very few studies have assessed
microplastic ingestioninteraction rates for faunal
species in Port Phillip Bay However worldwide
freshwater and marine species at all trophic levels
possessing varied feeding strategies ingest
microplastics (Eerkes-Medrano et al 2015) In
lab-based studies ingestion has been associated
with the retention and accumulation of
microplastics in organisms including but not limited
to mussels (Browne et al 2008) lobsters (Murray
and Cowie 2011) scallops (Brillant and MacDonald
2000) injury and subsequent disrupted feeding
swimming activity in lugworms as well as stress
immune response altered metabolic function and
| 38 |
toxicity in lugworms (Browne et al 2013) and fish
and mussels (Rochman et al 2013) It is also related
to tumour formation in fish (Rochman et al 2013)
and brain damage in fish (Mattson et al 2017)
Smaller sizes of plastic can potentially be ingested by
a greater range of species Plastic ingestion by local
wildlife is highly likely because of Port Phillip Bayrsquos
potential for high microplastic concentrations and
because these waters are so biodiverse Faunal
ingestion rates and impacts of marine microplastics
at the individual population and community levels
need to be assessed to prevent biodiversity loss in
the Bay and to better understand the human health
implications of consuming seafood from the Bay
Investing in necessary research will likely require
collaboration between departments managing water
pollution controls and fish populations respectively
gt Further study on microplastics
The estimations in this study showed that the Yarra
and Maribyrnong can transport nearly 25 billion
plastic pieces ndash of which more than 2 billion are
microplastics ndash into Port Phillip Bay annually and
that this may be an underestimation Ling et al
(2017) noted that plastic filaments including highly
pervasive clothing microfibre pollution between
0038 mm and 0250 mm formed the dominant
categories of microplastic in coastal and estuarine
sediments around Australia including Port Phillip
Bay However we know little about the
downstream movement and deposition of
microplastics in rivers It is not known what
portions of riverine microplastics travel
downstream below the surface waters sampled by
the manta net to eventually be released to the Bay
or deposited to the river sediments In the North
Shore Channel (Illinois USA) for example
microplastic concentrations in sediments were up
to 15000 times higher than surface water samples
(Hoellein et al 2017) Some microplastics are likely
transported long distances as several studies report
high concentrations of microplastics in estuaries
with rivers implicated as major microplastic sources
to these coastal zones (Yonkos et al 2014 Lima
et al 2014 Sadri and Thompson 2014) An example
of this was revealed during a community clean-up
event organised by the Yarra Riverkeeper
Association in April 2018 where a vacuum suction
device deployed by Ocean Crusaders removed over
47 million polystyrene pieces from the Yarra River
and its vegetated banks (A Kelly pers comm 2018)
Consequently in order to accurately identify the
magnitude of microplastic pollution in Port Phillip
Bay it is necessary to better understand microplastic
depositional patterns and take into account the water
column below the top 20 cm and the sediments
To advance current microplastics research in this
area the EcoCentre engaged a team of interns from
Worcester Polytechnic Institute (WPI) in the USA to
design and build a low-cost microplastics sampling
device easily built from hardware store materials
called the lsquoMicroplastics Collector With A Pumprsquo
(MCWAP) The MCWAP is a portable battery-
powered pump that takes water samples at various
depths in the water column down to a depth of 2 m
and runs these through a removable mesh 300 nm
filter to capture microplastics (picture 7) The
EcoCentre is planning a first trial of depth-sampling
for waterway microplastics in 2021
Picture 7 The MCWAP EcoCentrersquos portable microplastics depth-sampling device
P I C T U R E 7
3 M I C R O P L A S T I C S I N T H E Y A R R A A N D M A R I B Y R N O N G R I V E R S
C O N T E N T S
| 39 |
Maribyrnong River
Fishing in Port Phillip Bay
4
C O N T E N T S
| 41 |
Bay trawls pilotTo gain insight into the relative quantities of microplastics entering the Bay from Bass Strait as compared to the major rivers a pilot project of nine manta net trawls was conducted at the entrance to Port Phillip Bay with support from the Blairgowrie Yacht Squadron and the Australasian Ambassador for the 5 Gyres Institute
Trawls were conducted between April 2018 and
February 2020 at Popersquos Eye in Port Phillip Bay
during incoming tides and south-westerly winds
Trawl time was 30 minutes during which the vessel
was anchored to the sea bed in the tidal flow
Sample sorting was done in the same manner as
the river trawls (see Chapter 3)
Of the nine trawl samples collected at Popersquos Eye in
Port Phillip Bay eight contained plastics (Table 1) Of
the total 55 items found 35 (64) were
microplastics The most prevalent items were hard
plastic fragments which were found in six of nine
samples Samples in which plastic was found
contained up to 16 items The last sample
contained a remnant of a party balloon with the
balloon string still attached
Although the sample size is too small to perform
meaningful statistical analysis the findings suggest
there may be a worrying amount of plastic floating
on the surface waters of the Bay Given the size of
Port Phillip Bay is 1930 km2 and plastics were found
in 89 of samples collected through 30-minute
trawls plastics are potentially quite ubiquitous
A proportion of 80 of hard plastic fragments
found seems relatively consistent with the 75
proportion that flows into the Bay from the Yarra
and Maribyrnong indicating a probability that many
of these items may have originated from the Bay
passed through The Heads into Bass Strait and
then been recirculated back to the Bay by tidal
currents and prevailing winds More samples will
need to be taken and analysed in order to further
investigate this probability
Hard Fragments lt5 Hard Fragments gt5 Soft Plastics TwineLine Sponge Non-Plastic
Apr 18 3 4 1
May 18 6 2
Jun 18 8 6 2
Sep 18
Oct 18 2 1 3
Dec 18 1
Jan 19 2 1
Feb 19 1 2
Feb 20 2 1 1
TOTAL 19 16 2 5 2 5
Table 1 Items caught in Bay entrance trawls lsquoNon-Plasticrsquo included paper and a rubber balloon
T A B L E 1
4
Microplastic beach litter 5
C O N T E N T S
| 43 || 43 |
Baykeeper Beach Litter AuditsDevelopment of the Port Phillip Baykeeper Beach Litter Audit method commenced in 2014 in response to international studies confirming the environmental threat of plastic pollution At that time and to date there remains no international standard survey method with various existing data collection methods used by different leading bodies
While each method provided valuable information
their capacity to accurately record volumes of litter
over time ndash particularly microplastics ndash was seen to
be limited by one or more of the following factors
raquo lack of a clearly defined data collection area
raquo clean-up andor data collection methods
conducted on a scale that was unlikely to be
systematically repeated
raquo data collection recorded in a single area on a beach
(as opposed to a set of locations that represented
samples of all conditions on the beach)
raquo data recording conducted from a standing
position reducing the likelihood of recording
hard-to-spot microplastics
raquo data collection without removing litter
eliminating the possibility of clearly measuring
change in volumes occurring between surveys
The Baykeeper Beach Litter Audit methodology
was designed to focus on microplastic pollution
that poses an immediate threat to aquatic
organisms Key considerations in the design of this
method were the need to
raquo capture a representative sample of the conditions
on the beach
raquo establish an easily replicated method that can be
cost-effectively and consistently applied by
different groups around the Bay
raquo use data field terminology that was consistent
with terms used in the Australian Marine Debris
Initiative database
The Clean Bay Blueprint project provided an
opportunity to test the survey methodology over
several years with a range of user groups
| 44 |
Methodology
The survey method requires the combined search
time of the number of auditors to equate to at least
five minutes per quadrat Noting that some
quadrats will have very few if any microplastics
this requirement is designed to ensure consistency
of search effort and to enable a small team of two
people to comprehensively complete an audit in
less than an hour or two hours on more heavily
littered beaches This relatively small time
commitment facilitates regular conduct of audits
over the course of a year to achieve the statistical
rigour required to confirm trends in litter volumes
and type over time
gt Transect and quadrat placement
In order to capture a representative sample of all
beach conditions data is collected from three
transects across the beach In this context lsquoall beach
conditionsrsquo is referring to the structure of the beach
ndash shaped by the locally prevailing winds waves and
tidal currents ndash which transport sand debris and
litter to and from the beach To capture the
influence of these coastal processes over time and
to provide a basis for consistent search effort
transects are located at the widest central and
narrowest sections of beach
In each transect data is collected from three
quadrats at the top of the beach mid-beach and
on the last high tide line (Figure 22) The lsquotoprsquo
(inland edge) of the beach quadrats are in the same
place for each survey as locational reference points
Due to changing tidal conditions on the day the
distance between the top of the beach and last
high tide line (ie transect length) will vary Hence
the location of the mid-beach and quadrats at the
last high tide line differ for each survey Importantly
the quadrats located at the last high tide line
provide a sample of litter arriving on that day
Each transect starts at the lsquopermanent landmarkrsquo at
the top of the beach to ensure transects are in the
same place each time a survey is conducted
Transects run roughly at a right angle from the top of
the beach towards the closest point at the waterline
gt Selection of reference beach survey locations
With a view to gaining insights into catchment
sources of microplastics to the Bay beaches
surveyed for Clean Bay Blueprint in various regions
of Port Phillip Bay are generally associated with a
river or a creek that flows into the Bay Those that
are not directly associated with rivers or creeks (Rye
and Geelong Eastern Beach) are included to provide
insights into the mobility of litter due to tidal
currents and seasonal winds
5 B A Y K E E P E R B E A C H L I T T E R A U D I T S
Figure 22 Location of Baykeeper Beach Litter Audit data collection quadrats along the widest (1) central (2) and narrowest (3) beach transects
F I G U R E 2 2
C O N T E N T S
| 45 |
Plastics that float in the upper water column are
carried in the direction of wind-generated waves
and the direction of tidal currents during calm
(low-wind) conditions (N Blake pers obs 2020)
Due to the combined effects of tides and varying
wind directions some plastic objects may travel
widely in the Bay before eventually being cast upon
a beach A notable example was one of five
GPS-tracked PET bottles released in Elwood Canal
on 9 May 2019 by RMIT6 After remaining in the
Canal for almost two weeks they ultimately landed
on Dromana beach on 25 May due to a prevailing
northerly wind Therefore in the absence of data
collection conducted on a weekly basis it is
impossible to definitively conclude where beach
litter on any given day may have originally
come from However seasonal
data collection at multiple
(Bay-wide) reference sites does
provide some indication of the
likely source (the catchment)
and ultimately presents a
baseline dataset with which
to determine if microplastics
lsquoleakagersquo into the Bay is
increasing or decreasing
over time
gt Surveys conducted
Between July 2017 and March 2020 117 beach litter
audits were conducted in 12 locations around Port
Phillip Bay (Table 2) with the help of local
community group volunteers not-for-profits and
education institutes All citizen scientists involved
received multiple on-site training sessions by the
Port Phillip Baykeeper before independently
conducting audits Regular reference beaches were
surveyed every three months (in May August
November and February) with surveys of all
beaches generally conducted within the same
fortnight Only sites that were surveyed on at least
six occasions have been given more detailed
analysis in this report
LOCATION ASSOCIATED RIVER
OR CREEK AUDITS
COMPLETED
Eastern Beach Geelong na 11
Moorpanyal Beach Geelong na 2
Werribee River Jetty Werribee River 6
South Beach Werribee Werribee River 7
West Beach St Kilda Yarra River 15
Point Ormond Elwood Elwood Canal 3
Mordialloc Beach Mordialloc Creek 4
Keast Park Seaford Patterson River 10
Frankston Beach Kananook Creek 12
Mothers Beach Mornington NA 4
Mount Martha Beach Balcombe Creek 30
Rye Beach na 13
Total surveys 117
Table 2 Beach litter audit sites and number of audits done between July 2017 and March 2020 Beach names in bold are the regularly surveyed reference beaches the other beaches were opportunistically surveyed
T A B L E 2
6 RMIT Litter Tracker project httpswwwrmiteduauaboutschools-collegesscienceresearchresearch-centres-groupsaquatic-environmental-stresslitter-trackers
| 46 |
Results and discussion
Figures 23 and 24 show beaches along Port Phillip
Bayrsquos eastern shores recorded much higher
concentrations of litter than Geelong Werribee and
Rye The lower counts at Geelong and Rye can be
attributed to the fact there is no major waterway
entering the Bay in their general vicinity and
raquo as Geelong Eastern beach is located near the
westernmost end of Corio Bay it has very limited
exposure to litter dispersed by wind and tides
from wider Port Phillip Bay
raquo Rye beach is the southernmost survey location in
the Bay relatively removed from major streams
and urban catchment
The much lower (near negligible) counts at
Werribee South and Werribee River jetty are likely
attributable to the fact that the Werribee River
catchment is much less urbanised (around 20)
than the catchments associated with most of the
eastern sites of the Bay These results suggest that
litter makes its way to the Bay from the catchments
via the waterways
The high average counts at Keast Park (Seaford)
equate to 42 of total litter collected at all survey
locations Field observations and anecdotal reports
of industrial sites in the Mordialloc Creek and
Patterson River catchments have identified two
particular sites that may be significant contributors
to the overall plastic pollution recorded at Keast
Park This result warrants more detailed analysis
and investigation
A total of 11248 items were recorded in this study
A breakdown of items collected in Figure 25 shows
very few gross pollutants (eg intact plastic bottles
and bags) were recorded while nurdles (pre-
production pellets) and plastic fragments combined
comprised 77 of the total records The volume of
microplastics observed in 9 m2 compared to
microplastics reported in typical beach cleans
confirms the effectiveness of the methodology in
systematically recording microplastics at reference
sites around the Bay
Of all litter recorded the quadrats within the lsquolast
high tide linersquo recorded the greatest percentage of
items (45) followed by the lsquotop beach zone (38)
then the lsquomid-beach zonersquo (18) However this
order did not apply to all beaches with several of
the less littered beaches recording the greater
amount in the top beach zone (Figure 26) Mt
Martha is notable in this regard among the more
heavily littered beaches in that the lsquotop beachrsquo
quadrats had the highest amounts in all three
transects However this result was skewed
significantly by the top beach of the central beach
transect which averaged 278 items per survey ndash
almost as much as the totalled averages for all other
quadrats combined (338 items)
Keast Park has the distinction of having the
highest percentage of nurdles (59 of items
recorded) compared to St Kilda West beach (47)
Frankston (34) Rye (22) and Mt Martha (17)
Nurdles were virtually absent from beaches on the
west side of the Bay
Examination of plastic fragments by type and size
also found Keast Park distinguished from other
beaches with 53 of fragments being hard
fragments lt 5 mm Frankston ranked next highest
for hard plastic fragments with 37 followed by Mt
Martha with 34
The significantly higher counts of nurdles and hard
plastic fragments lt 5 mm may be due to a
combination of factors such as
raquo the broader range of wind directions that might
affect the site prevailing winds are acknowledged
as a primary agent for litter dispersal and Keast
Park is located at the easternmost point of Port
5 B A Y K E E P E R B E A C H L I T T E R A U D I T S
C O N T E N T S
| 47 |
Figure 23 Average litter per survey for all beaches surveyed
Figure 24 Visualisation of total litter counts on sampled beaches around Port Phillip Bay larger circles represent higher counts Image source Port Phillip Sea Pilots
F I G U R E 2 4
F I G U R E 2 3
| 48 |
Figure 25 Litter category percentages of total litter recorded across all sites The numbers above the percentages are the total items collected
Figure 26 Comparison of results for tide line mid-beach and top beach zones
Phillip Bay and subject to winds from south to
north (the widest range of all sites surveyed)
raquo orientation of the beach (near North-South at
Keast Park)
raquo physical infrastructure impeding wave action on
this particular beach (the Riviera stormwater
outfall projects into the Bay at a point around
20 m south of the survey area)
raquo presence of plastics manufacturing and re-grind
industries within the catchments
raquo proximity to industrial sites in local river and
stream catchments (Mordialloc Creek and
Patterson River) to the north of the survey beach
(tidal currents that run clockwise around the Bay
would carry plastics generated by these streams
towards Keast Park)
The Frankston beach survey site is oriented NNE to
SSW which is not dissimilar to the orientation of
Keast Park (NNW-SSE) The two sites are just seven
kilometres apart Despite this proximity the
Frankston site (located just to the south of
Kananook Creek mouth) recorded considerably
fewer nurdles and hard plastic fragments than Keast
Park (which is to the south of Mordialloc Creek and
Patterson River) These findings suggest that close
scrutiny of the Mordialloc Creek and Patterson River
catchments for nurdles and hard plastic fragments
is warranted
F I G U R E 2 5
5 B A Y K E E P E R B E A C H L I T T E R A U D I T S
C O N T E N T S
| 49 |
F I G U R E 2 5
| 51 |
Port Phillip Bay on a windy day
6
| 51 |C O N T E N T S
Related litter investigations Over the life of Clean Bay Blueprint the EcoCentre collaborated with many other organisations Other investigative litter projects enabled by the Port Phillip Bay Fund with the primary aim of data collection for pollution prevention include
raquo Yarra Riverkeeper Associationrsquos Litter and Flows and polystyrene projects - analysing
litter in the Yarra
raquo RMIT Universityrsquos Plastics Lab project ndash analysing
plastic fragment samples to identify polymers and
adsorbed contaminants
raquo Tangaroa Blue Foundationrsquos Letrsquos Strain the Drains7 ndash trialling stormwater pit filtration devices
to document the captured contents in a range of
municipalities and for four different street usages
raquo Scouts Victoriarsquos Street2Bay8 project ndash auditing
litter in six different street usages in all catchments
around the Bay
raquo RMIT Universityrsquos Litter Tracker4 project ndash GPS
tracking and on-line reporting of the mobility of
plastic bottles released into streams in
catchments leading to Port Phillip Bay
raquo Beach Patrol Australia and Love Our Street have
also compiled considerable data with the mobile
Litter Stopper phone app9
Interactive litter maps
It is essential to provide data access and report back
on research results to citizen scientists and those
advocating for and designing change Data collected
from the beach audit sites have been entered into
an interactive Tableau data visualisation platform
and is hosted on the EcoCentre website with
potential for visualising street litter data collected by
other groups Consequently the Tableau platform
appears to be a useful means of engaging with
schools and the wider community in relation to the
high mobility of microplastic pollution
The EcoCentre was also part of the community
reference group that helped design and test the State
Governmentrsquos LitterWatch10 database which collects
and collates litter data from all over Victoria visualises
this on a map and makes it publicly accessible This
is the first attempt to gather all litter data no matter
which data-collection methods were used and bring
this together in one accessible repository
Incident reporting
During the course of the study several materials that
have been noted as of ongoing concern were
reported to relevant authorities These included Telco
wire offcuts discarded at telecom sites on streets
polystyrene waffle pod waste leaking from a building
site and AstroTurf fragments leaking from a
sportsground demolition
All of the complementary initiatives represent major
advances in our understanding of plastic pollution
and warrant careful consideration as a whole body
of information as opposed to in isolation particularly
with a view to adopting the optimum suite of data
collection methods for the future and to set targets
for local source reduction plans
7 tangaroablueorglets-strain-the-drains-port-phillip-bay-region-vic 8 httpsscoutsvictoriacomauactivities-eventsactivitiesenvironmentstreet2bay-project 9 httpswwwbeachpatrolcomau 10 httpslitterwatchvictoriaorgau
Sunset over Port Phillip Bay
RecommendationsOver the life of the Clean Bay Blueprint project microplastic pollution has stopped being an lsquoemerging issuersquo The irrefutable evidence of its unacceptable impact on the environment is well-documented all over the world
7
C O N T E N T S
| 53 |
Many governments are acting on the
recommendation from the science community that
society should not wait for any more quantification
of damage before taking action to reduce marine
plastic pollution impacts (Lavers and Bond 2017
Gall and Thompson 2015) In their report Marine
Plastics Debris and Microplastics the United Nations
stated there is a moral argument that we should not
allow the ocean to become further polluted with
plastic waste and that marine littering should be
considered a lsquocommon concern for humankindrsquo
(UNEP 2016)
The high quantities of litter and microplastics in the
Yarra and Maribyrnong rivers highlight the large
contribution of these rivers to marine plastic
pollution in Port Phillip Bay Recent research by
Borelle et al (2020) projected the future of plastic
pollution in our oceans and concluded that the
predicted growth in plastic waste in the next 10
years far exceeds the impacts of mitigation efforts
currently deployed Therefore significant changes
and investments need to be made to counter the
rising tide of plastic pollution in the oceans
| 54 |
Recommendation 1
gt Improve product stewardship
Plastic and microplastic pollution are everybodyrsquos
problem Over the lsquolifecyclersquo of a plastic item it
travels through the fossil fuel and petrochemical
industries transport and shipping plastic product
manufacturers retailers community local councils
waste contractors and the recycling industry
However whereas every link in this user chain has
some level of responsibility not everyone should be
expected to have the same level of accountability
for plastic waste The current responsibilities for the
fate of plastic products are not well-defined and are
often passed on to the next group down the line
putting a disproportionately large strain on
communities and local councils There is very little
meaningful manufacturing industry accountability
for the end-of-life destination of plastic whether for
waste management or pollution of the environment
The plastics industry is set to grow 40 by 203011
yet hardly any producer responsibility is taken for
the waste and problems its products cause Only
94 of manufactured plastic is being recycled in
Australia (OrsquoFarrell 2019) which is consistent with
9 world-wide9 An astonishing 11 enters the
oceans (Borelle et al 2020) Currently local councils
and the community are expected to deal with the
consequences of unregulated production of a
material that lasts in the environment forever
As Victoria is moving from a linear to a circular
economy model this is the perfect time to change
and define the responsibilities of the plastics
industry and their accountability Federal and state
governments play a key role in leading and
managing this change Some of the changes that
the EcoCentre believes should be made in the short
and long term are
11 Transition to a circular economy model
Product recovery schemes (such as the
container deposit legislation) that are part of a
circular economy model should be funded by
the industries which produce the product
and managed by an independent government
agency to prevent perversion of the initiative
12 Invest in implementing alternatives to
plastic Plastic is not the right material for
the majority of functions it performs eg
using a material that lasts forever for single-
use packaging The ever-increasing
monetary and environmental costs of
dealing with plasticrsquos end-of-life stage are too
high Many alternative truly biodegradable
materials have already been invented but
have not been taken up for large-scale use
Industry needs to be given incentives to
transition towards producing large-scale
alternative packaging solutions eg through
new legislation or stimulus measures such
as innovation grants or tax incentives
13 Set limits on virgin plastic production
This includes avoiding investments in
waste-to-energy schemes that burn plastic
as it perpetuates our reliance on a product
that should not be burned in the first place
14 Ban broad-scale groups of problematic
single-use plastics12 Examples such as South
Australiarsquos ban on single-use plastic items
will provide some of the incentives driving
innovation and transformation Bans may be
premised on design qualities rather than
product type for example banning oxo-
11 httpswwwplasticsoupfoundationorg 12 The Australian National Waste Policy Action Plan commits to banning lsquoproblematic and unnecessary single-use plasticsrsquo by 2025 and delegated the Australian Packaging Covenant Organisation to lead all governments to lsquoIdentify problematic and unnecessary single-use plastic packaging to provide an evidence base for industry to take coordinated actionrsquo by 2019 The resulting report identified four priority categories (including expanded polystyrene and non-certified compostable packaging such as oxo-degradable) and three materials for further investigation httpswwwpackagingcovenantorgaudocumentsitem3183
7 R E C O M M E N D A T I O N S
C O N T E N T S
| 55 |
13 Operation CleanSweep is a best-practice manual for plastic manufacturers that employs cost-effective ways of preventing nurdles leaking into the environment
degradable plastics (that merely break into
microplastics faster rather than biodegrade to
natural component materials) or non-
recyclablenon-compostable packaging
15 Make the Operation CleanSweep13
program mandatory instead of voluntary
for any manufacturer using nurdles and have
this enforced by EPA Victoria
Recommendation 2
gt Cultivate effective partnerships
It is critical that conversations and true working
partnerships are forged and maintained with a
long-term vision of collaboration and tangible
positive outcomes In the case of an issue as big as
plastic pollution cross-sectoral collaborations are
essential to ensure effective changes Industry local
government state government agencies (such as
EPA Victoria the Catchment Management
Authorities and Melbourne Water and others)
research institutes community organisations and
businesses all need to engage in ongoing dialogue
about responsibilities and most importantly to
reach clear agreement on which group is
accountable for delivery of each defined outcome
that is necessary to the success of the overall
enterprise This might be achieved through
stakeholder working forums similar to the Victorian
Department of Environment Land Water and
Planningrsquos Integrated Water Management Forums
Recommendation 3
gt Support local councils in waste management
Until larger systemic changes in waste
management are made the end-of-line
responsibilities councils have for plastic waste need
to be adequately supported and resourced The
costs of this should not be transferred to the
community via rate increases nor by reliance on ad
hoc manual volunteer clean-ups
Measures should include effectively resourcing
councils to
31 Install and maintain pollutant traps in
drain outlets that discharge into creeks
and rivers This could be a collaboration
with Melbourne Water Care should be taken
to not just install gross pollutant traps but
also traps that catch microplastics such as
Drain Buddies
32 Enforce litter and illegal dumping law
33 Run effective litter prevention and
education programs in the community and
especially with local businesses and industry
This may be best done by partnership with
trusted business or community
organisations supporting the outreach
34 Review and improve current street
sweeping schedules and where necessary
adapt these to be more effective at the
occurrence of large sporting events and
seasons when litter peaks occur
| 56 |
Recommendation 4
gt Continue monitoring (micro)plastic pollution
Existing waste management and anti-litter
initiatives are not effective enough to stop plastic
and microplastic pollution from reaching Port Phillip
Bay The research in this report has established a
baseline data set that shows that the problem is
getting worse over time
The river trawls and beach litter audit methods
described in this report are both demonstrated to
be scientifically valid means of ongoing data
collection and the multiple years of data gathered
represent a benchmark of plastic pollution in the
major rivers and Port Phillip Bay The street litter
audit method applied by Scouts Victoria in the
Street2Bay project has also proven to be an
effective and replicable means of monitoring plastic
pollution on streets in Port Phillip Bay catchments
Continued data collection using these methods can
provide a means of evaluating any future strategies
to reduce plastic pollution in waterways
Recommendation 5
gt Increase education and lsquoplastic literacyrsquo of all
plastic users
As part of cultivating a shared responsibility for
plastic use and disposal education of plastic users
is essential The general public has become much
more aware of the issues of plastic pollution in the
environment thanks to a boom in scientific
research followed by mainstream film
documentaries and social media and community
campaigns over recent years
However there is still much confusion about how
plastic can be avoided or what plastics are more
preferable to others An example of this is the actual
meanings of the words lsquobiodegradablersquo lsquodegradablersquo
lsquooxo-degradablersquo and lsquocompostablersquo for plastic bags
People generally try to do the right thing and want
to invest in better products but industry uses the
terms in misleading ways (picture 8)
Recommendations are therefore
51 Set standard legal definitions for
degradability labels
Not-for-profit organisations as well as local councils
play a key role in educating the community and
implementing education programs in schools
Organisations that specialise in this should be
adequately resourced It is likely the reduction in
plastic straws in the Yarra can be attributed to
education efforts and community behaviour change
projects showing that these approaches work The
community and NGOs are not significantly
mentioned in Recycle Victoria (February 2020)
whereas community and cross-sector
collaborations are mentioned in the Port Phillip Bay
EMP but funding for joint activities is unclear after
the conclusion of the Port Phillip Bay Fund in 2020Picture 8
Industry messaging on plastic bag
7 R E C O M M E N D A T I O N S
C O N T E N T S
| 57 |
52 Develop project grants forums and
strategic ongoing partnerships that
integrate community government research
and industry efforts
53 Adequately resource groups who
educate and facilitate action on plastic
pollution
Recommendation 6
gt Conduct further research
As highlighted in the study discussions above
additional research is needed to adequately monitor
microplastics in Melbournersquos waterways and Port
Phillip Bay Ongoing monitoring of surface waters is
necessary to track the quantities and movements of
microplastics and can serve as a baseline for source
reduction action Given the high numbers of
microplastics reaching the Bay from surface waters
it is also important to conduct further research into
the water column and the sediments
Recommendations for further research are
61 Conduct depth-sampling studies The
EcoCentre will pilot the MCWAP to start
monitoring microplastics in the water
column If successful the device and
methodology could be rolled out for use
across creeks and rivers of Victoria
62 Conduct sediment studies Sediment
research is necessary to identify where the
heavier polymers end up according to
Schwarz (2019) river sediments act as a plastic
sink and CSIRO estimated that based on their
samples taken in the South Australian Bight
144 million tonnes of microplastics reside on
the seafloor worldwide (Barrett et al 2020)
63 Prioritise understanding the
contaminants carried by plastic in
waterways and associated human health
risks Continued analysis of plastic polymer
types and chemical contaminants carried by
plastics in waterways is necessary to
strengthen our understanding of the
potential ecological and human health
impacts of plastic pollution
64 Conduct on-ground investigations for
major sources of hard plastics fragments
and nurdles within the Mordialloc Creek and
Patterson River catchments
Plastics Lab Dr Mayumi Allinson
View of St Kilda Beach
8
C O N T E N T S
| 59 |
A note on citizen scienceThe research conducted in this study strongly relied on the collaborations with volunteer citizen scientists Citizen science has received increasing recognition over the last decade and rightly so without more than 8800 hours contributed by volunteers for data collection sample sorting and analysis Clean Bay Blueprint could not have produced such robust results
This project is hardly an exception these days as
volunteers both individually and via community
groups put countless hours of their time and
expertise towards environmental projects that rely
on large datasets and labour-intensive analyses
It needs to be recognised that the contributions of
citizen scientists to science and environmental
change-making are both invaluable and essential
and that collaborations between research
institutions and community provide a powerful
opportunity to build understanding of complex
issues of Victorian Australian and global
significance Resourcing the professional
coordination of such collaborative studies often
provides funders with a multifold return on the
investment through generating new knowledge
inspiring extensive in-kind contributions and
activating community-led conversations and action
on topics that might otherwise be uncommon
around dinner tables classrooms and clubs
9
Little Penguin in Port Phillip Bay
C O N T E N T S
| 61 || 61 |
AcknowledgementsOne of Clean Bay Blueprintrsquos main goals was to build partnerships with other organisations that target litter and improve Bay health
raquo Khadija Muhanna Saif Al
Nabhani - RMIT University
raquo Hilda Poloso - RMIT University
raquo Minh Tu - Deakin University
raquo Daniel Cox - RMIT University
raquo Nick Bergstrom - Worcester
Polytechnic Institute
raquo Sarah Duquette - Worcester
Polytechnic Institute
raquo Madison Healy - Worcester Polytechnic Institute
raquo Nick Sorensen - Worcester Polytechnic Institute
raquo Cameron Collins - Worcester Polytechnic Institute
raquo Samantha Comeau - Worcester Polytechnic Institute
raquo Brendan Gallagher - Worcester Polytechnic Institute
raquo Gina Visser - Worcester Polytechnic Institute
raquo Katie Donovan - Worcester Polytechnic Institute
raquo Spencer Hoagland - Worcester Polytechnic Institute
raquo Thomas Lipkin - Worcester Polytechnic Institute
raquo Eric Stultz - Worcester Polytechnic Institute
We recognise the extensive and energetic contributions of many interns
Many new collaborations and ongoing partnerships were formed and many existing relationships were
leveraged during this project This was made possible by the funding from the Port Phillip Bay Fund of
EcoCentre projects as well as those of other organisations We therefore thank the State Government of
Victoria for its support
Our sincere thanks goes out to the many volunteers including work placement students and interns who
have donated hours of their time and expertise to the project to make it a success We acknowledge your
great passion for the environment and deep dedication to making positive change for the future of our
waterways This project would not have been possible without your support
raquo Balcombe Estuary Reserves
Group Mt Martha
raquo Beach Patrol Mt Martha
raquo Frankston Beach Patrol
raquo Rye Beach Patrol
raquo Beach Patrol Australia
raquo Seaford Beach Patrol
raquo Werribee Beach Patrol
raquo Werribee River Association
raquo Yarra Riverkeeper Association
raquo David Flew
(Karringal boat skipper)
raquo Blair Stafford Australasian
Ambassador of the 5 Gyres
Institute
raquo Blairgowrie Yacht Squadron
raquo Metropolitan Waste and Resource Recovery Group
raquo Melbourne Water
raquo Parks Victoria
raquo 3CR Community Radio
raquo 3RRR Community Radio
raquo Sacred Heart Mission
raquo Bellarine Catchment Network
raquo RMIT Plastics Lab Prof Graeme Allinson Dr Mayumi Allinson Marinda Pattison and students
raquo Scouts Victoria
raquo Worcester Polytechnic Institute
raquo Dolphin Research Institute
raquo Sustainability Victoria
raquo Victorian Litter Action Alliance
raquo Gordon TAFE
raquo Dr Christopher Johnstone and Emma Barnett of Monash University
raquo Victorian National Parks Association
raquo Federation University
raquo Australian Citizen Science Association
raquo The Age
raquo Department of Environment Land Water and Planning
raquo Ying Quek
raquo Port Phillip Menrsquos Shed
We thank the following organisations groups and individuals for their contribution and collaboration (in no particular order)
Appendicesgt Appendix 1
| 62 |
Figure 28 Percentage of microplastics in samples per trawl in the Yarra (blue) and Maribyrnong (red) rivers with 95 confidence intervals shaded grey The average percentage of microplastics per sample was 184 This number has stayed constant over time
F I G U R E 2 8
Appendices
Microplastic Image Josie Jones
C O N T E N T S
| 63 || 63 |
gt Appendix 2
MARIBYRNONG YARRA
Hard plastic fragments 174 -102
Soft plastics 959 -560
Polystyrene -1688 986
Nurdles 803 -469
Plastic bottle caps 542 -317
Plastic straws 529 -309
Sponge -167 097
Twine 412 -241
Other 004 002
Cigarette butts 596 -348
F I G U R E 2 9
Figure 29 Mosaic plot showing the Chi-Square test results (in Table 3 below) The statistical test looks at whether proportions are different than what is expected by chance considering both the Yarrarsquos and Maribyrnongrsquos total litter The width of the boxes show the proportion of litter in the Maribyrnong compared to the Yarra The height of the boxes shows the proportion of litter for each litter item The colours represent significance Boxes coloured red have lower proportions than expected by chance and those in blue have higher proportion than expected by chance The boxes for hard plastic are grey meaning there are no significant differences in proportions of expected hard plastic fragments in the Maribyrnong or Yarra rivers (P gt 005) The boxes for nurdles bottle caps straws and soft plastics are blue for the Maribyrnong and red for the Yarra meaning there are proportionally more nurdles bottle caps plastic straws and soft plastics than expected in the Maribyrnong river and fewer than expected in the Yarra (P lt 005)
Table 3 Residuals from Chi-square test for plastics count as a function of waterway and plastics category Significant values are in bold red
T A B L E 3
| 64 |
gt Appendix 3
Plastic polymer analysis
A
B The below Table 7 is used with
permission from the unpublished
Honours dissertation Analysis of
Microplastic Polymers in the Yarra and
Maribyrnong Rivers (May 2020) by
Marinda Pattison under supervision of
Associate Professor Graeme Allinson
Table 6 Plastic polymer density (Stelray Plastic Products 2020)
T A B L E 6
YARRA RIVER MARIBYRNONG RIVERPercentage () Std Dev Percentage () Std Dev
Total PE 4750 1113 4916 1562
PP 2204 1024 2361 867
PS 1530 1195 791 871
PU 088 217 035 067
Nylons 027 064 104 241
EVA 043 062 049 101
PVC 021 065 008 023
Latex 002 008 005 019
PE amp PP mix 023 039 021 055
PET 002 008 000 000
Nitrile 000 001 000 000
PMMA 002 009 000 000
PTFE FEP 000 000 000 000
CA 001 005 000 000
PC 001 006 007 027
ABS 012 046 000 000
Unknown 067 096 088 113
T A B L E 7
Table 7 Mean abundance (percentage) of polymers in Yarra and Maribyrnong Rivers
A P P E N D I C E S
C O N T E N T S
| 65 |
gt Appendix 4
Changes in individual litter items over time
YARRA RIVER
Plastic Kendallrsquos tau Z P-value
Hard Plastic Fragments 033 741 lt0001
Nurdles 008 086 0391
Other 023 229 0022
Plastic Bottle Caps 016 146 0146
Plastic Straws -025 -234 0019
Polystyrene 022 346 0001
Soft Plastics 027 578 lt0001
Sponge 025 248 0013
Twine 007 072 0470
Cigarette butts 017 164 0102
MARIBYRNONG RIVER
Plastic Kendallrsquos tau Z P-value
Hard Plastic Fragments 026 552 lt0001
Nurdles -004 -044 0657
Other 043 416 lt0001
Plastic Bottle Caps -013 -125 021
Plastic Straws -021 -195 0051
Polystyrene 009 14 0161
Soft Plastics 013 279 0005
Sponge 007 064 0524
Twine 004 042 0671
Cigarette butts -003 -031 0755
Table 4 Kendallrsquos tau test results Change in counts of plastic over time by category for the Yarra and Maribyrnong rivers Kendallrsquos tau the Z value and P-values are presented Significant values are in red These results are important for interpreting the scatterplots in Figures 18 and 19 A positive tau indicates an increase in litter over time A negative tau indicates a decrease over time Kendallrsquos tau is a non-parametric correlation value
T A B L E 4
| 66 |
gt Appendix 5
Bandalong litter traps
In the Yarra River multiple outliers were recorded for the total litter items captured per trawl date Litter traps
were emptied over 24 of the trawl days Six of those days showed higher than average litter counts On 35
trawl days litter traps were not emptied and we saw five higher than average total litter counts
Figure 30 A Wilcoxon rank sum test compared median litter counts when litter trap was emptied to when litter trap was not emptied (two days before trawl) We did not find any effect of litter trap emptying on the total number of litter items captured (W = 289 P = 0162)
F I G U R E 3 0
A P P E N D I C E S
C O N T E N T S
| 67 |
gt Appendix 6
Yarra Environmental flows
There was no significant association between environmental flow events and plastic counts in the Yarra (t =
-03 P = 0768) The amount of variation in microplastic counts explained by environmental flows was close
to zero (adjusted R2 lt 0001) Note that microplastic count was square root transformed to meet
assumptions of a regression analysis
Figure 31 Count of microplastics per trawl as a function of environmental flows in the Yarra River
F I G U R E 3 1
raquo Andrady A L (2006) Assessment of
environmental biodegradation of synthetic
polymers Polym Rev 1994 3425ndash76
raquo Andrady A L (2011) Microplastics in the marine
environment Marine pollution bulletin 62
1596-1605
raquo Barua S Muttil N Ng A amp Perera B (2013) Rainfall
trend and its implications for water resource
management within the Yarra River catchment
Australia Hydrological Processes 27 1727-1738
raquo Barmand S Goodsell K Yardley D Kowalczyk N
(2020) Polystyrene pollution in the Yarra river
sources and solutions Yarra Riverkeeper
Association
raquo Barnes D K Galgani F Thompson R C amp Barlaz
M (2009) Accumulation and fragmentation of
plastic debris in global environments
Philosophical Transactions of the Royal Society of
London B Biological Sciences 364 1985-1998
raquo Barrett J Chase Z Zhang J Banaszak Holl M M
Willis K Williams A Hardesty B D Wilcox C
(2020) Microplastics pollution in deep-sea
sediments from the Great Australian Bight
Frontiers in Marine Science October 2020
Volume 7 Article 576170
raquo Blake N amp Charko F (2014) Pilot study to identify
the extent of microplastics in the Maribyrnong
and Yarra Rivers and Port Phillip Bay Port Phillip
EcoCentre report
raquo Borelle S B Ringma J Law K L Monnahan C C
Lebreton L McGivern A Murphy E Jambeck J
Leonard G H Hilleary M A Eriksen M
Possingham H P De Frond H Gerber L H
Polidoro B Tahir A Bernard M Mallos N Barnes
M Rochman C M (2020) Predicted growth in
plastic waste exceeds efforts to mitigate plastic
pollution Science 369 (6510) 1515-1518
raquo Brillant M amp Macdonald B (2000) Postingestive
selection in the sea scallop Placopecten
magellanicus (Gmelin) the role of particle size
and density Journal of Experimental Marine
Biology and Ecology 253 211-227
raquo Browne M A Dissanayake A Galloway T S
Lowe D M amp Thompson R C (2008) Ingested
microscopic plastic translocates to the circulatory
system of the mussel Mytilus edulis (L)
Environmental science amp technology 42
5026-5031
raquo Browne M A Niven S J Galloway T S Rowland
S J amp Thompson R C (2013) Microplastic moves
pollutants and additives to worms reducing
functions linked to health and biodiversity
Current Biology 23 2388-2392
raquo Charko F Blake N Kowalczyk N Johnstone C
Seymore A Quek Y (2018) Microplastics in the
Maribyrnong and Yarra Rivers Melbourne
Australia Port Phillip EcoCentre report
raquo CIEL (2019) Plastic amp climate the hidden costs
of a plastic planet Center for International
Environmental Law
httpswwwcielorgplasticandclimate
raquo Chidambarampadmavathy (2017) Sustainable
bio-plastic production through landfill methane
recycling Renewable and Sustainable Energy
Reviews Volume 71 May 2017 Pages 555-562
raquo Cole M Lindeque P Halsband C amp Galloway T S
References
| 68 |
R E F E R E N C E S
C O N T E N T S
| 69 || 69 |
(2011) Microplastics as contaminants in the
marine environment a review Marine pollution
bulletin 62 2588-2597
raquo Commonwealth of Australia (2016) Toxic tide the
threat of marine plastic pollution in Australia
Environment and Communications Reference
Committee
raquo DAWE (2018) National Waste Policy - less waste
more resources Department of Agriculture Water
and the Environment
raquo DAWE (2019) National Waste Policy - Action plan
Department of Agriculture Water and the
Environment
raquo DELWP (2017) Port Phillip Bay Environmental
Management Plan The State of Victoria
Department of Environment Land Water
and Planning
raquo DELWP (2019) Victoria in Future 2019 ndash
Population Projections 2016 to 2056 The State of
Victoria Department of Environment Land Water
and Planning
raquo Depledge M Galgani F Panti C Caliani I Casini
S amp Fossi M (2013) Plastic litter in the sea Marine
environmental research 92 279-281
raquo Eerkes-Meedrano D Thompson R C amp Aldridge
D C (2015) Microplastics in freshwater systems a
review of the emerging threats identification of
knowledge gaps and prioritisation of research
needs Water research 75 63-82
raquo Galgani F Hanke G Werner S Oosterbaan
Nilsson P Fleet D (2013) Guidance on monitoring
of marine litter in European seas European
Commission
raquo Gall S amp Thompson R (2015) The impact of debris
on marine life Marine Pollution Bulletin 92 170-179
raquo Gasperi J Wright S L Dris R Collard F Mandin
C Guerrouache M Langlois V Kelly F J Tassing
B (2018) Microplastics in air are we breathing it
in Current Opinion in Envi Sci amp Health vol 1 1-5
raquo Gewert B Plassmann M M MacLeod M (2015)
Pathways for degradation of plastic polymers
floating in the marine environment
Environmental Science Processes amp Impacts vol
17 no 9 pp 1513-1521
raquo Hoellein T J McCormick A R Hittie J London
M G Scott J W amp Kelly J J (2017) Longitudinal
patterns of microplastic concentration and
bacterial assemblages in surface and benthic
habitats of an urban river Freshwater science
35(3) 000-000
raquo Jambeck J R Geyer R Wilcox C Siegler T R
Perryman M Andrady A Narayan R amp Law K L
(2015) Plastic waste inputs from land into the
ocean Science 347 768-771
raquo Jepson P D Deaville R Barber J L Aguilar A
Borrell A Murphy S Barry J Brownlow A
Barnett J Berrow S Cunningham A A Davidson
N J Ten Doeschate M Esteban R Ferreira M
Foote A D Genov T Gimenez J Loveridge J
Llvona A Martin V Maxwell D L Papachlimitzou
A Penrose R Perkins MW Smith B De Stephanis
R Tregenza N Verborg P Fernandez A Law R J
(2016) PCB pollution continues to impact
populations of orcas and other dolphins in
European Waters Nature Science Reports 6 18573
raquo Kim JS Lee HJ Kim SK Kim HJ (2018) Global
Pattern of Microplastics (MPs) in Commercial
| 70 |
Food-Grade Salts Sea Salt as an Indicator of
Seawater MP Pollution Environ Sci Technol
2018 52 21 12819-12828
raquo Klein S Worch E Knepper T P (2015) Occurrence
and spatial distribution of microplastics in river
shore sediments of the Rhine-Main area in
Germany Environmental Science amp Technology
vol 49 no 10 pp 6070-6076
raquo Kowalczyk N Kelly A (2020) Litter and Flows
Connecting the Yarra and Bay Yarra Riverkeeper
Association
raquo Lamb JB Willis BL Fiorenza EA Couch CS
Howard R Rader DN True JD Kelly LA Ahmad
A Jompa J Harvell CD (2018) Plastic waste
associated with disease on coral reefs Science
359 460-462 (2018)
raquo Lavers J L Bond A L (2017) Exceptional and
rapid accumulation of anthropogenic debris on
one of the worldrsquos most remote and pristine
islands Proceedings of the National Academy of
Sciences 201619818
raquo Lavers J L Bond A L amp Hutton I (2014) Plastic
ingestion by Flesh-footed Shearwaters (Puffinus
carneipes) Implications for fledgling body
condition and the accumulation of plastic-derived
chemicals Environmental Pollution 187 124-129
raquo Lima A Costa M amp Barletta M (2014) Distribution
patterns of microplastics within the plankton of a
tropical estuary Environmental Research 132
146-155
raquo Ling S Sinclair M Levi C Reeves S amp Edgar G
(2017) Ubiquity of microplastics in coastal seafloor
sediments Marine Pollution Bulletin 121(1-2)
raquo Lusher A Hollman P Mendoza-Hill J (2017)
Microplastics in Fisheries and Aquaculture ndash
status of knowledge on their occurrence and
implications for aquatic organisms and food
safety Food amp Agriculture Organisation of the
United Nations Technical paper 615 Abstract V
raquo Mai L Bao LJ Shi L Wong CS Zeng EY (2018)
A review of methods for measuring microplastics
in aquatic environments Environ Sci Pollut Res
25 11319-11332 (2018)
raquo Mani T Hauk A Walter U amp Burkhardt-Holm P
(2015) Microplastics profile along the Rhine River
Scientific Reports 5 17988
raquo Mattson K Johnson E V Malmendal A Linse S
Hansson L-A Cedervall T (2017) Brain damage
and behavioural disorders in fish induced by
plastic nanoparticles delivered through the food
chain Scientific Reports volume 7 Article
number 11452 (2017)
raquo Melbourne Water (2018) Co-Designed Catchment
Program for the Maribyrnong Catchment Region
(including Moonee Ponds Creek) ndash October 2018 |
Version 1
raquo Melbourne Water (2018) Co-Designed Catchment
Program for the Yarra Catchment ndash October 2018
| Version 1
raquo Moore C amp Phillips C (2011) Plastic Ocean How a
sea captainrsquos chance discovery launched a
determined quest to save the oceans Avery
New York
raquo Murray F amp Cowie P R (2011) Plastic
contamination in the decapod crustacean
Nephrops norvegicus (Linnaeus 1758) Marine
pollution bulletin 62 1207-1217
References (cont)
R E F E R E N C E S
C O N T E N T S
| 71 |
raquo OrsquoFarrell K (2019) 2017-2018 Australian Plastics
Recycling Survey ndash National Report Envisage
Works Australian Government Department of the
Environment and Energy EPA NSW Sustainability
Victoria Government of Western Australia ndash
Department of Water and Environmental Regulation
raquo Orb Media (2017) Invisibles the plastics inside us
Orbmediaorgstoriesinvisibles_plastics
raquo Pattison M (2020) Analysis of microplastic
polymers in the Yarra and Maribyrnong Rivers
Unpublished Honours dissertation
raquo Rochman C M Hoh E Kurobe T amp Teh S J
(2013) Ingested plastic transfers hazardous
chemicals to fish and induces hepatic stress
Scientific reports 3
raquo Royer S-J Ferroacuten S Wilson S T Karl D M (2018)
Production of methane and ethylene from plastic
in the environment PLOS One 13(8) e0200574
raquo Sadri S S amp Thompson R C (2014) On the
quantity and composition of floating plastic debris
entering and leaving the Tamar Estuary Southwest
England Marine pollution bulletin 81 55-60
raquo Schwartz A E Ligthart T N Boukris E Van
Harmelen T (2019) Sources transport and
accumulation of different types of plastic litter in
aquatic environments A review study Marine
Pollution Bulletin 143 (2019) 92-100
raquo Sustainability Victoria (2019) Microplastics and
Port Phillip Bay - Citizen science study finds
significant amounts of microplastics on Port
Phillip Bay beaches Summary report
raquo Teuten E L Saquing J M Knappe D R Barlaz M
A Jonsson S Bjoumlrn A Rowland S J Thompson
R C Galloway T S amp Yamashita R (2009)
Transport and release of chemicals from plastics
to the environment and to wildlife Philosophical
Transactions of the Royal Society of London B
Biological Sciences 364 2027-2045
raquo Thompson R C Olsen Y Mitchell R P Davis A
Rowland S J John A W McGonigle D amp Russell
A E (2004) Lost at sea where is all the plastic
Science 304 838-838
raquo UNEP (2016) Marine plastic debris and
microplastics ndash Global lessons and research to
inspire action and guide policy change United
Nations Environment Programme Nairobi
raquo World Health Organisation (2019) Microplastics in
drinking water WHO Technical report
raquo Zeynep A Basak G (2019) Microplastics in the
environment A critical review of current
understanding and identification of future
research needs Environmental Pollution 254
(2019) 113011
raquo Yonkos L T Friedel E A Perez-Reyes A C
Ghosal S amp Arthur C D (2014) Microplastics in
four estuarine rivers in the Chesapeake Bay
USA Environmental science amp technology 48
14195-14202
raquo ZonMW (2019) httpswwwzonmwnlen
research-and-resultslife-sciences-health
programmasprogramme-detail
microplastics-health
Imag
e J
osi
e Jo
ne
s
Imag
e J
osi
e Jo
ne
s
Imag
e N
at S
ald
um
bid
e
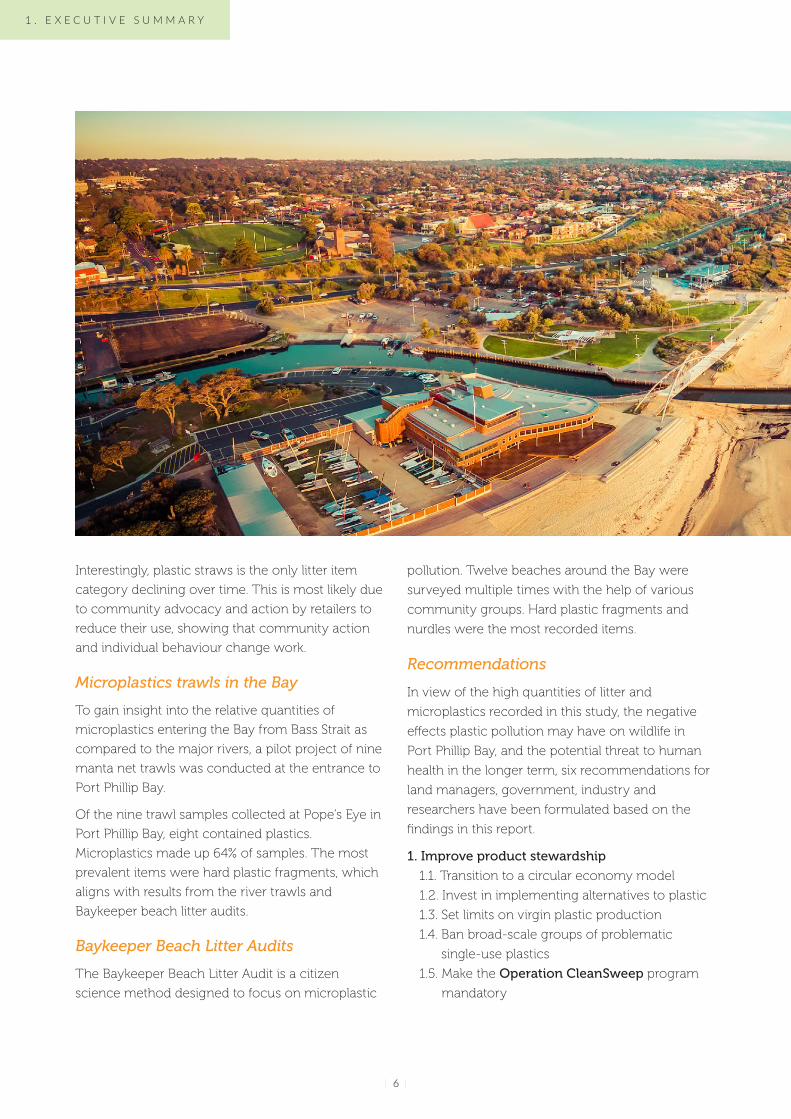
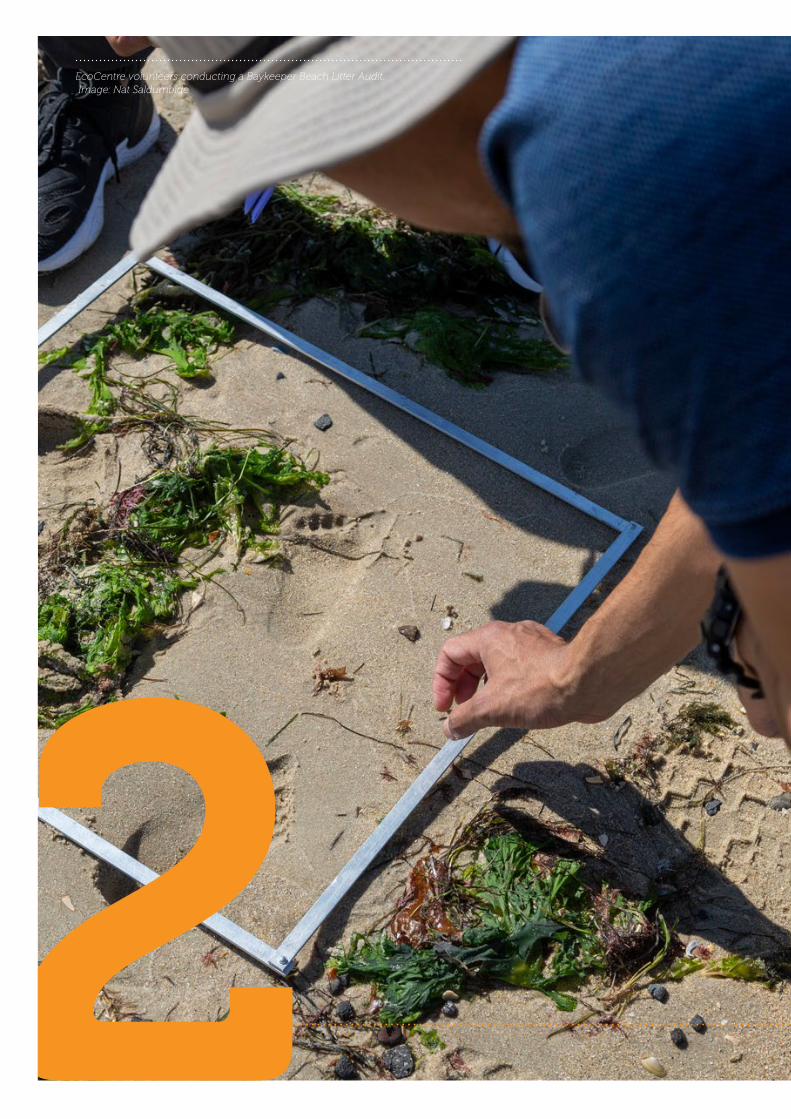
C O N T E N T S
| 9 |
Introductiongt Port Phillip EcoCentre
The Port Phillip EcoCentre (the EcoCentre) is an independent environmental not-for-profit organisation Its mission is to build relationships educate and demonstrate sustainable environmental practice and strengthen peoplersquos connection to the natural world
The EcoCentre is a leading community-managed
organisation with a dedicated team of scientists
educators and volunteers who design and
implement innovative environmental programs Its
expertise is to activate people to look after the
health of Port Phillip Bay and its waterways and
catchments as well as the urban ecology of Greater
Melbourne within the traditional lands and waters
of the Kulin Nation The EcoCentre delivers
specialist education citizen science research and
community action projects with over 250 cross-
sector partners
The EcoCentre is also home to the Port Phillip
Baykeeper who provides an independent voice for
Port Phillip Bay The Baykeeper is affiliated with the
Waterkeeper Alliance (an international network of
waterways protectors) and works closely with the
Yarra Riverkeeper and Werribee Riverkeeper in
protecting their respective waterways each with a
strong local support base
Port Phillip Bay and catchments
Port Phillip Bay is the largest marine embayment in
Victoria with a surface area of 1934 km2 and
333 km of coastline (DELWP 2017) It is relatively
shallow at 13 m average depth and almost half of it
is less than 8 m deep Situated along its northern
shores is the City of Greater Melbourne with a
population of nearly five million people (DELWP
2019) The City of Greater Geelong is located in the
south west
The Bayrsquos catchment area is 9694 km2 with several
rivers creeks and many storm water drains draining
into the Bay (DELWP 2017) The Yarra and
Maribyrnong are the largest of the rivers and flow
through heavily urbanised areas before reaching the
north end of the Bay
| 10 |
Clean Bay Blueprint project
Clean Bay Blueprint is a three-year litter study
conducted between July 2017 and June 2020 The
project was funded by the Victorian Governmentrsquos
Port Phillip Bay Fund as part of its commitment to
deliver the Port Phillip Bay Environmental
Management Plan 2017ndash2027 (Port Phillip Bay EMP)
Clean Bay Blueprint delivers outcomes for the Port
Phillip Bay EMPrsquos Priority Area 4 ndash Litter
Clean Bay Blueprint takes a catchment-to-coast
approach investigating catchment coast and Bay
litter as a whole Litter recognises no geographical
boundaries as it travels from the burbs to the Bay
all areas are connected which makes an integrated
approach to litter research necessary This
integrated approach will help to get a better
understanding of litter prevalence and movement
with the goal of informing local litter source
reduction plans to achieve better environmental
outcomes To gather data from a range of regions
over time a citizen science approach was applied
for community volunteers to collect and contribute
data according to prescribed methods
Project aims
This projectrsquos research methods were designed
primarily to document microplastics which are
defined by Thompson et al (2004) as plastic pieces
between 1 μm and 5 mm in diameter Microplastics
in the environment mostly result from the
inappropriate disposal of consumer products and
industrial by-products and waste that break up into
smaller pieces Their small size renders them
unlikely to be collected in conventional litter traps
by beach-cleaning rakes or manual clean-ups The
Figure 1 Port Phillip Bay and catchment (Image source Port Phillip Bay Environmental Management Plan 2017ndash2027 DELWP 2017)
F I G U R E 1
2 I N T R O D U C T I O N
C O N T E N T S
| 11 |
small size of microplastics causes them to be easily
overlooked when picking up litter even when
clean-ups include a data recording component
Microplastics are recognised as a threat to
waterways and oceans worldwide due to their
small size which makes them easily ingested by
wildlife Clean Bay Blueprint is the latest of the
EcoCentrersquos microplastics research projects which
commenced in 2013 and has refined study
methods in consultation with CSIRO RMIT
University EPA Victoria and others
The three aims of Clean Bay Blueprint are
gt 1 Conducting rigorous and replicable methods
to quantify plastic pollution through
microplastics trawls and beach litter audits
To reflect the catchment-to-coast approach river
and Bay boat trawls as well as land-based litter
audits were conducted The quantification of
microplastics in rivers by trawling is the first research
project of its kind in Australia (see Chapter 3) The
Baykeeper Beach Litter Audits quantify plastics and
microplastics on seven beaches associated with
urbanised stormwater catchments around the Bay
using an audit method that is specifically designed
to collect samples that are representative of all
conditions on a beach and can be performed by
citizen scientists (see Chapter 5)
gt 2 Engaging the community in citizen science
activities
Citizen science is an excellent way of engaging the
community in place-based learning empowering
people to take practical action to create positive
change for the environment as well as regularly
gathering data to track volumes of plastic pollution
over time The Baykeeper Beach Litter Audits
conducted for this project engaged various
community groups schools tertiary students and
individual community members in scientific data
collection education and conversations about plastic
pollution Awareness raised through citizen science
activities is aimed to increase positive behaviour
change in addition to collecting useful data
Evidence to support the case for governments
industry and communities to make changes to
reduce any threatening process will necessarily be
collected systematically over time and space to
confirm the threat is widespread and ongoing The
extent of data collection required over such time
and space would not be achievable without the
contribution of dedicated citizen scientists
gt 3 Building partnerships with other
organisations that target litter and Bay health
Many government environmental and community
organisations have started researching educating
and raising awareness on litter As litter has become
a problematic issue on many different levels
integrated approaches and cross-sector
collaborations are integral to the success of its
reduction in the environment
Over the project life a range of complementary
projects and additional investigations took place
including land surveys data visualisation polymer
analysis of plastic fragments and prototyping a
depth-sampling device to extend surface trawls
Plastic pollution in the global context
Widespread production and consumption of
single-use plastics inadequate waste management
and infrastructure and regulations improper waste
management practices inadequate wastewater
treatment and littering have led to tonnes of marine
plastic pollution entering the ocean on a daily basis
Jambeck et al (2015) estimated that around eight
million metric tonnes of our plastic waste enter the
oceans from land each year often via rivers (Mani
et al 2015)
| 12 |
Two main types of hard microplastics are found
most often in waterways and oceans nurdles and
fragments (Barnes et al 2009) Nurdles also known
as pre-production pellets are the pre-fabrication
material for a wide range of industrial and
consumer plastic products They are classified as
primary plastics and they enter the aquatic
environment mainly through accidental spillage and
poor product management at processing plants
and during transport (Cole et al 2011) They are
spherical or flat-cylindrical in shape and are often
transparent or black although it is not uncommon
to find white red yellow and blue nurdles (picture
1) Hard plastic fragments are known as secondary
microplastics and are derived from the breakup of
larger plastic items They are irregular in shape and
vary greatly in colour due to their primary design
Once in the ocean microplastics can persist for
thousands of years (Andrady 2006) and have been
observed in marine systems worldwide (Cole et al
2011 Barnes et al 2009)
Picture 1 Nurdles (left) and hard plastics fragments (right)
In 2018 alone 359 million metric tonnes of plastic
were produced globally (Statista 2020) and
modelling by Borelle et al (2020) shows that
predicted levels of plastic lost in the environment
will be 53 million metric tonnes per year by 2030 if
no additional action is taken Because of plasticrsquos
durability and extreme mobility (it floats flies and
sinks) it eventually enters our waterways either by
accident or intentionally (Moore and Phillips 2011)
The large litter items frequently captured in this study
including straws lolly wrappers and plastic bottle
caps eventually deteriorate through physical
biological and chemical processes (Andrady 2011)
into tiny fragments that enter Port Phillip Bay at an
alarming rate and can be ingested by aquatic animals
gt Effects on living organisms
Marine plastic pollution has become an urgent
issue affecting wildlife in waterways and oceans
Worldwide at least 690 species have encountered
plastic pollution many of which are listed as
threatened species (Gall and Thompson 2015)
Ingestion of plastic including microplastics can
lead to injury (eg blocked digestive tracts and
organ rupture) and death (Lavers et al 2014)
Furthermore in addition to leachable chemicals
that are added in the manufacturing process itself
plastics adsorb (attract as an exterior film) organic
micro-pollutants or persistent organic pollutants
(POPs) which include polychlorinated biphenyls
(PCBs) Dichlorodiphenyldichloroethylene (DDE) and
nonylphenol (Teuten et al 2009) The ingestion of
these toxic chemicals is known to affect the
physiology and behaviour of organisms which
ultimately affects population stability as shown by
reproductive dysfunctions caused by PCBs in orca
and dolphin populations in Europe (Jepson 2016)
Lamb et al (2018) calculated that the likelihood of
disease in corals that are in physical contact with
plastics increases from 4 to 89 and that by 2025
an estimated 444 billion pieces of plastic items will
be entangled in coral reefs through the Asia-Pacific
Plastic chemicals bioaccumulate and biomagnify
up the food chain (Figure 2) This increasing
P I C T U R E 1
2 I N T R O D U C T I O N
C O N T E N T S
| 13 |
concentration of toxic chemicals in the tissues of
organisms at successively higher levels in a food
chain has been linked to disease and death in
several top predators (Gall and Thompson 2015)
Figure 2 The process of biomagnification of plastic
toxins up the food chain
Relatively few marine and freshwater systems in
Australia have been systematically investigated for
microplastic pollution This is of grave concern
considering coastal and estuarine systems around
Australia are some of the most biodiverse
ecosystems in the world More particularly the
relatively enclosed waters of Port Phillip Bay which
supports an aquaculture industry and a growing
recreational fishery are subject to runoff from
urbanised catchments The potential for marine
plastic pollution to cause environmental harm is
recognised as a global problem and is listed as one of
the greatest threats to marine biodiversity (Gall and
Thompson 2015 Depledge et al 2013) A review of
current understandings of microplastics in the
environment and future research needs by Zeynep
and Basak (2019) concluded that the extent and
effects of microplastic pollution in continental
environments such as rivers lakes soil and air is still
poorly understood Microplastic contamination of
aquatic environments will continue to increase for
the foreseeable future and at present there are
significant knowledge gaps on the occurrence in the
aquatic environment and organisms of the smaller
sized microplastics (less than 150 μm) and their
possible effects on seafood safety (Lusher et al
2017)
Several studies have shown that plastics are now
inside human bodies via our food (Kim et al 2018)
drinking water (Orb Media 2017) and even the air
we breathe (Gasperi et al 2018) It is currently
unknown what if any health effects there are on
human populations (WHO 2019) However in 2019
a research program started in the Netherlands
investigating the potential health effects of ingested
microplastics in humans (ZonMW 2019) Results of
these studies will be released in the near future
gt Climate impacts of plastics
Plastic is linked to climate impacts through
F I G U R E 2
| 14 |
emissions at multiple stages of its lifecycle
Greenhouse gas emissions happen at every step in
the lifecycle of a plastic product the extraction of
fossil fuels and transport plastic refining and
manufacture plastic waste management and the
ongoing impacts of it while polluting the
environment including the oceans (CIEL 2019)
Plastic continues to release greenhouse gases as it
photodegrades when littered (Royer 2018) and
produces methane when degrading in landfills
(Chidambarampadmavathy 2017) Plastic
production also requires large volumes of water in a
world with finite availability of clean freshwater
gt The cost of marine plastic pollution
The following paragraphs are taken from Toxic tide
the threat of marine plastic pollution in Australia a
report delivered to the Federal Senate by the
Environmental amp Communications References
Committee (Commonwealth of Australia 2016)
266 Professor Smith stated that lsquoa key
problem in determining the source of all items
is that fragmented plastics are often the most
numerous and there is no simple way to
determine their sourcersquo Professor Underwood
similarly told the committee that there is
lsquoinsufficient researchrsquo to answer the question
of where marine plastic pollution is sourced
296 Dr Britta Denise Hardesty CSIRO
commented that lsquothe cost of littering and
debris to fisheries small business and
human health remain poorly understood
and littering costs to local government due
to remediation and tourism losses are
substantialrsquo In answer to the committeersquos
questions concerning the estimates of the
damage from marine debris on Australiarsquos
tourism fishing and shipping the
Department of the Environment added that
it did not have any estimates nor did other
Commonwealth agencies including the
Great Barrier Reef Marine Park Authority the
Australian Maritime Safety Authority and the
Australian Fisheries Management Authority
Other than projects funded by the Port Phillip Bay
Fund there has been limited research to address
knowledge gaps in relation to sources and ecosystem
impacts of plastic pollution across Australia since the
release of the Senate Inquiry report in 2016
Plastic pollution in Victoria
Locally Port Phillip Bay and surrounding waters are
supporting an ecosystem that is home to an
estimated 10000 species with many of those
species unique to the Bay1 Most plastic pollution in
Port Phillip Bay originates from land-based sources
Diverse sources include urban streets freeways and
roadside verges stormwater drains wastewater
treatment plants and river and creek runoff
Although plastic pollution has been repeatedly
identified as a major threat to Victorian waterways
there has been limited scientific assessment since
the Melbourne Water Tagged Litter Study in 1993
The EcoCentrersquos Yarra and Maribyrnong river trawls
commenced in 2014 the Litter Trackers project by
RMIT and Melbourne Water was conducted in 2019
and Sustainability Victoria recently conducted a
microplastics study on six beaches around the Bay
In this study they found between 167 and 1232
microscopic microfibres from clothing per kilogram
of sand (Sustainability Victoria 2019)
The Yarra Riverkeeper Association removed
approximately 8000 kg of waste from the Yarra and
Maribyrnong between 2017 and 2020 (Kowalczyk
and Kelly 2020) with some of the most common
collected items being foam insulation and
packaging plastic bottles and cigarette butts Both
this project and their 2020 polystyrene study in
1 httpswwwmarineandcoastsvicgovaugrants port-phillip-bay-fund
2 I N T R O D U C T I O N
C O N T E N T S
| 15 |
A close-up of the Balcombe Estuary nurdles
collaboration with Clean Water Group point to
polystyrene being a major waterway pollutant in
metro Melbourne (Barmand et al 2020)
Community groups such as Beach Patrol Bellarine
Catchment Network various Friends groups and
others across the catchments spend countless
hours of people power cleaning up beaches and
waterways Over the last few years the EcoCentre
has played a role in shifting the general focus from
merely picking up and disposing of the litter to
collecting data on what is found to be used in
advocacy efforts to reduce plastic pollution in the
environment Since February 2018 Scouts Victoria
and the EcoCentre have collaborated in the state
governmentndashfunded Street2Bay project
conducting litter audits with particular attention to
microplastics on streets in all catchments
around the Bay
Bandalong litter trap in the Yarra
| 16 |
Policy context
gt Australia
From 2018 Chinarsquos new bans and 995 purity
standards for uncontaminated recyclables left
Australia with large stockpiles of items now needing
onshore processing Extensive ripple impacts of this
challenge ndash from facility fires to paying fees to send
recyclable plastics to landfill ndash have compelled
significant rethinking of Australian waste
management systems including materials redesign
reduction re-use and recycling Industry bodies
and the Australian Government considered plastics
and other materials in a range of commitments and
aspirations towards an Australian circular economy
in which lsquowastersquo and pollution are designed out
and products and materials are kept in use through
principles such as repair and maximising use of
recycled materials over virgin resources
Australiarsquos National Waste Policy Less waste more
resources (Commonwealth of Australia 2018) and
National Waste Policy Action Plan (2019) apply the
lsquoprinciples of a circular economy to waste
management to support better and repeated use of
our resourcesrsquo The targets include reducing
Australian waste by 10 per capita by 2030 and to
lsquophase out problematic and unnecessary plastics by
2025rsquo Waste policies focus on plastic diversion from
landfill however plastic uncontained by
management systems (eg lost as litter dumping or
spillage) becomes pollution of ecological and
economic concern due to its persistence in the
environment On 18 June 2015 the Senate referred
the threat of marine plastic pollution in Australia for
parliamentary inquiry and report by 8 April 2016
The final report Toxic tide the threat of marine
plastic pollution in Australia was presented on 20
April 2016 (Commonwealth of Australia 2016) The
need for systematic data collection on the extent of
plastic pollution was stated in Recommendation 1
of the report
Blair Stafford conducting a microplastics trawl in the Bay with a manta net
2 I N T R O D U C T I O N
C O N T E N T S
| 17 |
2 httpsnicholasinstitutedukeeduplastics-policy-inventory
The committee recommends that any future
Australian Government policies on mitigating
the threat from marine plastic be underpinned
by sound peer-reviewed research
gt Victoria
Plastic pollution is relevant under a range of Victorian
policies and strategies to manage waste and protect
human health and biodiversity In some instances
plastic pollution is discussed explicitly as in the
plastic bag ban (Environment Protection
Amendment Act 2019) or Recycling Victoria lsquoKey
Commitment 3 Address plastics pollutionrsquo Managing
plastics can also fall under broader principles such as
the goal lsquoVictoriarsquos natural environment is healthyrsquo in
Biodiversity 2037 the lsquowastes hierarchyrsquo principle of
environmental protection in the Environmental
Protection Act Victoria (1970) and the introduction of
General Environmental Duty in the Environment
Protection Amendment Act 2018 The General
Environmental Duty requires all Victorians to manage
risks to human health and the environment that their
activities create and becomes active from July 2021
Studies that quantify the effects and extent of
microplastics are necessary to inform policy
frameworks that reduce plastic pollution establish
waterway management strategies and assess
biodiversity health Interim results of the Clean Bay
Blueprint study have helped inform government
documents including
raquo State of the Yarra and its Parklands (2018) ndash
Commissioner for Environmental Sustainability
Victoria
raquo Assessment of the Values of Victoriarsquos Marine
Environment (2019) ndash Victorian Environmental
Assessment Council
A written submission by the EcoCentre to the 2018
review of the State Environment Protection Policy
(Waters) using the results of EcoCentre
microplastics studies led to lsquoplastics and
microplasticsrsquo being added to the list of legally
defined waterway pollutants in Victoria
Prior to the EcoCentrersquos research plastic and
microplastic pollution were not reported in
Victorian State of the Environment reports nor
specifically included in legislated protections
gt Worldwide
The United Nations Sustainable Development Goals
(SDGs) are 17 interlinked goals to achieve lsquoa better and
more sustainable future for allrsquo The management of
plastic materials relates to several SDGs
raquo Goal 12
Responsible production and consumption
raquo Goal 13 Climate action
raquo Goal 14 Life below water
raquo Goal 15 Life on land
The United Nations Environment Programme
(UNEP) has produced numerous studies on plastic
pollution and prevention in the last five years
Assessing policy efforts in 60 countries around the
globe the UNEP reports Single-Use Plastics
Roadmap to Sustainability (2018) includes ten
recommendations including (1) target the most
problematic single-use plastics by collecting
baseline data (5) raise public awareness (7) provide
incentives to industry and (9) enforce new
measures effectively
In 2020 Duke University launched a Plastics Policy
Inventory2 as a searchable database of public policy
documents targeting plastic pollution This includes
the language year enacted location and
jurisdictional level This document is updated
quarterly due to the rapidly evolving nature of policy
responses to address the health economic and
amenity threats of plastic and microplastic pollution
Melbourne City over the Yarra River
3
C O N T E N T S
| 19 |
Microplastics in the Yarra and Maribyrnong RiversThe first ever litter trawls done in rivers in Australia were conducted by the EcoCentre in 2013 The resulting report Pilot study to identify the extent of
microplastics in the Maribyrnong and Yarra Rivers and Port Phillip Bay (July 2014) showed that microplastics were present in Melbournersquos two largest rivers As a result of this pilot study monthly trawls were continued through the Turn off the Tap project (2014ndash2017) funded by the Victorian Government The final samples of this study spiked in microplastic litter which seemed to show an upward trend over time indicating further investigation was warranted Subsequently the Port Phillip Bay Fund funded Clean Bay Blueprint (2017ndash2020) for another three years of continuous research This report presents analysis of the outputs from both these projects and uses the full 55 years of data collected
Aims of the microplastics study
Within Clean Bay Blueprint the quantification of
plastics and microplastics in Melbournersquos two largest
rivers was done as a contained research study
which continued from a previous dataset collected
between 2015 and 2017 Its aims were the following
gt Quantifying plastic pollution to inform
legislative reform and behaviour change
When trawls commenced in 2014 there was no
reported evidence of the ongoing presence of
microplastic pollution in the rivers and Bay apart
from personal observations As legislative reform
and management decisions around litter need to be
driven by scientific evidence the first aims of the
study were to confirm the presence and quantify
the extent of the pollution
gt Tracking changes in litter over time and
establishing a baseline
Once presence is established the next step is to
monitor litter loads over time in order to track if
volumes increase or decrease Continuous
monitoring measures a baseline state of the river
which can be used to measure the effectiveness of
anti-litter measures taken to reduce the loss of
certain items in the environment In addition
monitoring allows researchers to notice unusual
spikes in litter loads or items that may have been
the result of mass spills and one-off pollution
events and might otherwise go unnoticed
gt Identifying the source of litter items
By tracking and quantifying the different litter items
encountered (eg polystyrene balls plastic drinking
straws cigarette butts) it may be possible to identify
| 20 |
their potential source locations This evidence could
be used to inform localised source reduction plans to
prevent an item type from entering the environment
in the first place Anecdotally known problem items
were analysed as distinct categories to learn more
about their prevalence in the waterways
Study method
gt Study site
The Yarra River flows 242 km from its source in the
forested Yarra Ranges National Park through to
central Melbourne where it enters Port Phillip Bay
More than one-third of Victoriarsquos population lives in
the Yarra catchment which covers about 4000 km2
(Barua et al 2013) The catchment includes 40
rivers and creeks including the Maribyrnong River
which runs for 160 km from its source on the
slopes of Mount Macedon The Maribyrnong
catchment covers 1408 km2
The trawl sites were selected on the basis of being
close to the lower reaches of each river and
therefore indicative of the total pollution load of each
respective catchment (Figures 3 and 4) The
Maribyrnong trawls commenced at the Water
Canon Jetty extending from the west bank of Coode
Island 300 m upstream from the Yarra The Yarra
trawls commenced underneath Bolte Bridge 25 km
upstream of the Yarra and Maribyrnong confluence
Figure 3 The locations of the Maribyrnong and Yarra catchments relative to the centre of Melbourne Images courtesy of Melbourne Water
Figure 4 Approximate trawl location transects in the Maribyrnong and Yarra Rivers
gt River trawls
A manta net designed to collect floating debris off
the waterrsquos surface was deployed from the side of
the boat and positioned outside of the wake zone
(picture 4A) Trawling was done according to
internationally standardised methods by Galgani
et al (2013) in each river all trawls commenced at
the same place travelling upstream for 30 minutes
with the boat motor operated at a constant 1000
rpm to operate the net effectively and maintain a
consistent speed for all trawls After 30 minutes the
net was retrieved the collection net (cod end)
removed (picture 4B) and placed in a container to
be dried in preparation for sorting and categorising
the contents
Between January 2015 and February 2020 a total of
113 monthly trawls were conducted in the
Maribyrnong and Yarra Rivers Both rivers were
trawled on the same day The distance covered in
each trawl varied slightly due to the effects of
different tides and prevailing wind conditions
encountered at the time While trawls were generally
done in a straight line river boating involves
changing course to safely navigate around other
watercraft that may be encountered and the course
of the trawls in each river was not rigidly defined
The lsquomouthrsquo of the manta net measures 600 mm
wide x 200 mm deep The net is 3 m long tapering
down to a 30 x 10 cmsup2 cod end Both the tapering
net and cod end are made of a 330 nm mesh size
The manta net is of the same specifications used
3 M I C R O P L A S T I C S I N T H E Y A R R A A N D M A R I B Y R N O N G R I V E R S
F I G U R E 4
F I G U R E 3
C O N T E N T S
| 21 |
by the 5 Gyres Institute to measure microplastics in
international studies In a recent review of methods
that measure microplastics in aquatic
environments Mai et al (2018) confirmed that this
collection method is recommended for large-scale
surface water sampling
gt Sample analysis method
Sample sorting was performed by trained citizen
scientists (picture 5) Dried trawl samples were
analysed by separating litter items from organic
matter with the naked eye using tweezers and
supplemental lighting Litter items were next sorted
by item type and the diameter measured with a
ruler after which the item was placed in the
corresponding size category Litter categories
included hard plastic fragments lt 2 mm hard
plastic fragments 2 mmndash5 mm hard plastic
fragments 6ndash10 mm hard plastic fragments gt
10 mm polystyrene beads lt 4 mm polystyrene
beads ge 4 mm plastic bottle caps plastic straws
soft plastics lt 5 mm soft plastics ge 5 mm lolly
wrappers cellophane lt 5 mm cellophane ge 5 mm
plastic pre-production pellets (nurdles) cigarette
butts twine sponge (synthetic sponge-like
materials) and lsquootherrsquo items which included
unidentified non-organic looking items
Internationally accepted guidelines define plastic
pieces smaller than 5 mm in diameter as
microplastics (Thompson et al 2004) In this study
the categories of hard plastic fragments lt 2 mm
hard plastic fragments 2 mmndash5 mm soft plastics lt
5 mm cellophane lt 5 mm nurdles and polystyrene
beads lt 4 mm were grouped into the microplastic
category Plastic items not visible to the naked eye
including microfibres were excluded from this study
due to logistical technical and funding constraints
Picture 4 A Manta net deployed on side of Yarra Riverkeeper vessel B Removable cod end used to collect microplastic samples
Picture 5 Citizen scientists sorting trawl samples at the EcoCentre
P I C T U R E 5
P I C T U R E 4 A P I C T U R E 4 B
| 22 |
Trawl data analysis results
The results of the sample analysis show
substantial concentrations of plastic litter
present in the Yarra and Maribyrnong Rivers
across all months of the year A total of 40030
litter items were captured and analysed from
the Yarra and 13658 litter items from the
Maribyrnong between January 2015 and
February 2020 An average of 690 litter items
were collected from the Yarra per monthly
trawl while an average of 248 litter items
were collected from the Maribyrnong per
monthly trawl
Because the Yarrarsquos width in the trawl location
is more than 160 times wider than the net and
the Maribyrnongrsquos width in the trawl location
is 120 times wider the actual extrapolated
volume of litter in both rivers is astounding
For the Yarra the rough calculation is
690 litter items x 48 half-hour sessions
day x 365 days x 160 times net width
yielding 1934208000 litter items
entering the Bay from the Yarra
annually
For the Maribyrnong this calculation is
248 litter items x 48 half-hour sessions
day x 365 days x 120 times net width
yielding 521395200 litter items
entering the Bay from the
Maribyrnong annually
Figure 5 Relative litter composition of items flowing into Port Phillip Bay from the Maribyrnong and Yarra rivers combined
Figure 6 Litter composition in trawl samples obtained from the Maribyrnong River
Figure 7 Litter composition in trawl samples obtained from the Yarra River
F I G U R E 5
F I G U R E 7
F I G U R E 6
3 M I C R O P L A S T I C S I N T H E Y A R R A A N D M A R I B Y R N O N G R I V E R S
C O N T E N T S
| 23 |
These calculations suggest that an average total of
2455603200 litter items flow into Port Phillip
Bay annually from surfaces of the Yarra and
Maribyrnong Rivers combined
It should be noted that since these litter items are
only caught in the surface waters (upper 200 mm)
this number is likely to be an underestimation of the
overall plastic pollution loading in each river
Different types of plastic display different levels of
buoyancy characterised as either positively
buoyant (floating at the surface) negatively buoyant
(sinks to the bottom) or neutrally buoyant (in the
water column) It is unknown how many items are
present in the water column or the sediments of
Melbournersquos waterways
gt Litter reaching Port Phillip Bay
Based on the 53688 litter items caught and
analysed the composition of litter entering Port
Phillip Bay shows that hard plastic fragments are by
far the most prevalent litter item (75) followed by
polystyrene (13) and soft plastics (10) (Figure 5)
Trawl samples weighed an average of
approximately 266 g most of which was organic
plant matter On average litter comprised 184 of
the total sample weight highlighting the
pervasiveness of litter in our waterways Over time
this percentage has stayed quite constant (see
Appendix 1)
gt Comparing the rivers
Hard plastic fragments polystyrene and soft
plastics were the most common items found in
both the Yarra and Maribyrnong (Figures 6 amp 7)
Hard plastic fragments made up the bulk of the
captured litter items comprising 74 of capture for
the Yarra and 76 of items captured in the
Maribyrnong
Polystyrene was the second most captured item
with 15 of items in the Yarra and 8 of items in
the Maribyrnong being polystyrene
Soft plastics (consisting of
cellophane lolly wrappers and
unidentifiable soft plastics) made up
9 of total items captured in the
Yarra and 13 in the Maribyrnong
When comparing the total litter
counts between rivers we found a
significant difference between the
Maribyrnong and Yarra Rivers
(chi-squared = 12954 df = 1 P lt
0001) with plastic litter overall more
likely to be found in the Yarra than
the Maribyrnong (Figure 8)
F I G U R E 8
Figure 8 Comparison of number of litter items in Maribyrnong and Yarra rivers
| 24 |
There is also an overall significant effect of the
rivers on distribution of plastics by item category
(chi-squared = 74726 df = 9 P lt 0001 Figure 9)
There are no significant differences in
proportions of hard plastic fragments in the
Maribyrnong or Yarra rivers (P gt 005)
There are proportionally more soft plastics
nurdles plastic bottle caps plastic straws
twine and cigarette butts in the Maribyrnong
river Conversely proportionally less of the
same items are in the Yarra river (P lt 005)
meaning that these items make up a higher
proportion of total litter counts in the
Maribyrnong than they do in the Yarra (see
Appendix 2)
When comparing polystyrene loads to the
expected proportions of polystyrene (based
on the total counts for the rivers) the
proportion of polystyrene is significantly less
than expected (P lt 005) in the Maribyrnong
and significantly more than expected in the
Yarra (P lt 005) this means polystyrene is
more likely found in the Yarra than in the
Maribyrnong
The proportion of lsquootherrsquo items is
significantly above expected in the
Maribyrnong (P lt 005) but for the Yarra
the proportion of lsquootherrsquo items was
nonsignificant (P gt 005)
F I G U R E 9
F I G U R E 1 0
Figure 9 Comparison of mean monthly number (plusmnSE) of litter items captured by the manta net in the Maribyrnong and Yarra Rivers between January 2015 and February 2020 Note that values shown are means but statistical tests were conducted on frequency of counts using chi-squared analyses (ie the standard errors should not be used to infer anything about statistical significance They are rough indicators of variation around a mean only)
Figure 10 Comparison between rivers of the total number of microplastics captured during river trawls
3 M I C R O P L A S T I C S I N T H E Y A R R A A N D M A R I B Y R N O N G R I V E R S
C O N T E N T S
| 25 |
In both rivers microplastics formed the bulk of litter
and accounted for 85 (34013 pieces) of the total
load in the Yarra and 83 (11388 pieces) of the
Maribyrnong load (Figure 10) Hard plastic
fragments lt 2 mm in length dominated the
microplastics category and accounted for 45 and
51 of microplastics in the Yarra and Maribyrnong
respectively
Of the earlier mentioned total litter items entering the
Bay microplastics make up nearly 85 which means
more than 2 billion (2076458066) microplastics flow
from the two rivers into the Bay every year
gt Analysis of plastic polymer types
Sorted trawl samples from July 2016 to August 2019
were sent to the Plastics Lab at RMIT where they
were analysed for plastic polymer types using
Fourier Transform Infrared Spectroscopy (FTIR)3
There are many polymer types each of which has
varying qualities that align it to typical uses
products or applications Through FTIR analysis
microplastics or fragments may be grouped
according to probable source products
In both the Yarra and the Maribyrnong rivers
polyethylene (PE) was the most prevalent polymer
(48 and 49 respectively) followed by
polypropylene (PP) (22 and 24 respectively)
polystyrene (PS) (15 and 79 respectively)
The Yarra River saw small amounts of 11 other
polymers each of which contributed less than 1
and 067 of samples were of an unknown
material The Maribyrnong saw a small abundance
of other polymers ranging from 1 to 005 and
had 088 of unknown material (see Appendix 3)
The two rivers showed similar trends over the
months for all three of the most prevalent polymers
The abundance of PE and PP did not statistically
differ between the Yarra and Maribyrnong (P = 067
P = 056 respectively) however PS was statistically
lower in the Maribyrnong (P = 002)
Interestingly polyethylene terephthalate (PET) and
polyvinylchloride (PVC) are some of the most
commonly produced and used plastics yet were
some of the least recorded in both the Yarra and
Maribyrnong Rivers
gt Seasonal differences in litter
There are significant effects of the seasons and the
rivers on the total count of litter (chi-squared =
12429 df = 3 P lt 0001) A comparison of total litter
by trawl indicates that there is more total litter in the
Yarra than in the Maribyrnong in any season There
was more litter in summer in both rivers However
proportionally in the Maribyrnong has more litter
in spring and autumn than is expected by chance
whereas in the Yarra the clear peak seasons are
summer and winter (Figure 11)
In summer and winter plastic litter is proportionally
higher in the Yarra than the Maribyrnong (P lt 005
for both seasons) In autumn and spring plastic litter
is proportionally higher in the Maribyrnong than the
Yarra (P lt 005 for both seasons)
Figure 11 Seasonal variation in the number of captured litter items in the Maribyrnong and Yarra Rivers between January 2015 and February 2020
3 This summary of results was used with permission from an unpublished Honours dissertation by M Pattison (2020)
F I G U R E 1 1
| 26 |
gt Changes in litter over time
The five years of data collection reveal large
increases in litter over time (Figure 13) Note the
difference in numbers on the y-axes when
comparing the rivers
Both rivers are showing a significant increase in
plastics over the sampling period although the trend
is somewhat more pronounced in the Yarra (tau =
017 z = 745 P lt 0001) than in the Maribyrnong (tau
= 010 z = 416 P lt 0001) (Figure 14)
Note the differences in percentages on the y-axes of
the respective rivers in Figures 15 and 16 which
show how much faster the Yarrarsquos litter has been
increasing over the last five years When combining
the above litter numbers and percentages there is a
similar increasing trend in litter en route to Port
Phillip Bay (Figure 17) It is unclear why there was
such an extreme increase in litter in the Yarra in 2017
The above results warranted a closer examination
of the changes in litter item categories over time
In the Maribyrnong hard plastic fragments soft
plastics and lsquootherrsquo are increasing over time
(P lt 005) (Figure 18)
Figure 19 shows that in the Yarra hard plastic
fragments soft plastics polystyrene sponge and
lsquootherrsquo in the Yarra are increasing over time (P lt 005)
However plastic straws are significantly decreasing
over time (z = -234 tau = -025 P = 0019)
All other plastics are steady showing neither a
significant increase nor decrease See Appendix 4
for more details
F I G U R E 1 2
Figure 12 shows more detailed litter item
distributions over the seasons for the separate
rivers Hard plastic fragments remain the largest
category of items throughout all seasons in both
rivers followed by polystyrene and soft plastics
Figure 12 Seasonal variation in the total number of captured litter items in the Maribyrnong and Yarra Rivers between January 2015 and February 2020 Note the difference in total litter items captured on the y-axes
Figure 13 Total number of captured litter items in the Maribyrnong and Yarra Rivers presented by trawl between January 2015 and February 2020 The labels indicate year month and trawl number A total of 62 paired trawls were conducted during this time Several litter spikes were recorded
Figure 14 Litter trends over time Litter in both rivers is increasing with litter in the Yarra increasing faster than in the Maribyrnong
3 M I C R O P L A S T I C S I N T H E Y A R R A A N D M A R I B Y R N O N G R I V E R S
C O N T E N T S
| 27 |
F I G U R E 1 3
F I G U R E 1 4
| 28 |
Baykeeper and Riverkeeper trawling for microplastics
F I G U R E 1 5 F I G U R E 1 6 F I G U R E 1 7
3 M I C R O P L A S T I C S I N T H E Y A R R A A N D M A R I B Y R N O N G R I V E R S
C O N T E N T S
| 29 |
Figure 15 Above Actual numbers of microplastics in the Maribyrnong Below Percentage increase in microplastics year-on-year
Figure 16 Above Actual numbers of microplastics in Yarra Below Percentage increase in microplastics year-on-year
Figure 17 Above Actual numbers of microplastics flowing to Port Phillip Bay Below Percentage increase in microplastics year-on-year
Figure 18 The number of plastic items by category across time in the Maribyrnong River (measured by trawl number) Note that axis scales are different for each plastic category Significant relationships are marked by an asterisk ()
F I G U R E 1 8
C O N T E N T S
| 30 |
F I G U R E 1 9
Figure 19 The number of plastic items by category across time in the Yarra River (measured by consecutive trawl numbers) Note that y-axis scales are different for each plastic category Statistically significant relationships are marked by an asterisk ()
Figure 20 Plot of microplastic count in both Yarra and Maribyrnong between 2015 and 2019 as a function of Melbournersquos population
Figure 21 Regression analysis showing a positive correlation between litter items captured and rainfall data Note that microplastic count was square root transformed to meet assumptions of a regression analysis
3 M I C R O P L A S T I C S I N T H E Y A R R A A N D M A R I B Y R N O N G R I V E R S
C O N T E N T S
| 31 |
gt Factors driving litter increases and spikes
A series of regression analyses were performed to
see what environmental factors could be driving
the increases in litter and some of the unusually
high litter counts in some of the trawls
Worldwide plastic pollution is usually positively
correlated with increases in population This indeed
applied in the Yarra and Maribyrnong as well with a
significant association between population in the
Greater Melbourne area from 2015 to 2019 and
counts of microplastics (t = 54 P = 0012)
Approximately 876 of the variation in microplastic
counts was explained by population numbers over
this time (adjusted R2 = 0876 Figure 20) which
indicates a very strong correlation
A regression analysis shows that the count of
microplastics was positively associated with total
rainfall in the previous 48 hours (t = 41 P lt 0001
Figure 21) Approximately 122 of the variation in
microplastic counts in the rivers was explained by
rainfall (adjusted R2 = 0122)
Rainfall data for the Maribyrnong was taken from
the Bureau of Meteorologyrsquos (BOM) weather station
at Melbourne Airport Rainfall data for the Yarra was
taken from the BOMrsquos Eltham weather station
To explain some of the high spikes in litter in the
Yarra two potential factors were tested for
Bandalong litter traps
The method of emptying the floating Bandalong
litter traps is focused on removing larger litter items
(gross pollutants) and does not allow for the
containment of microplastics The 2015ndash2020 dates
of the emptying of the traps in the Yarra River were
sourced from Parks Victoria Although there were
preliminary indications of litter spikes potentially
being caused by litter trap maintenance there
seemed to be no evidence of a correlation with the
data available (see Appendix 5) However additional
information sourced from Melbourne Water just
before finalising this report indicates that a more
targeted approach to investigating microplastics
leakage from Bandalong traps is appropriate Please
refer to the Yarra and Maribyrnong microplastics
research discussion below
There are currently no Bandalong litter traps in the
Maribyrnong river
Environmental water flow releases In drier periods of the year environmental water
flows are released on a needs basis from the upper
Yarra catchment to maintain the ecosystem health
of the networks of billabongs and wetlands
connected to the Yarra As these flows have the
potential to flush out litter caught in various places
along the river data on environmental water flow
releases between 2015 and 2020 were sourced
from Melbourne Water However a regression
analysis showed that there was no significant
association between environmental flow events
and plastic counts in the Yarra See Appendix 6 for
more details
F I G U R E 2 0
F I G U R E 2 1
| 32 |
Yarra and Maribyrnong microplastics research discussion
Clean Bay Blueprint and the preceding EcoCentre
projects are the first studies to investigate
microplastic loads in the Yarra and Maribyrnong
Rivers and provide the first estimation of microplastic
loads entering Port Phillip Bay on an annual basis
Every one of the 113 trawl samples analysed
between January 2015 and February 2020 contained
plastic pollution mostly consisting of microplastics
Nearly 25 billion pieces of plastic flow into Port
Phillip Bay annually from the surface waters of the
two major rivers of which over 2 billion are
microplastics smaller than 5 mm in diameter
These results are expected to be underestimations
of the litter volume entering the Bay as it does not
take into account the depth of the river and the fact
that high-density particles with additives or other
attachments and larger items will sink below the
level of trawled surface area (Mai et al 2018
Pattison 2020) As the mesh size of the net was
330 nm and sorting and counting of microplastics
was done with the naked eye particles smaller than
what could be caught in the net or observed and
confirmed as plastics during sorting (including
microfibres and nanoparticles) were not included It
must therefore be emphasised that total plastic
pollution numbers in the rivers are likely to be
much higher than the numbers in this report and
preventative and mitigating actions to reduce
plastic pollution are urgently required
gt Litter increases
An alarming result of this study is that litter is
increasing in both the Maribyrnong and the Yarra
with plastic pollution in the Yarra increasing at a
much faster rate The rate at which plastic pollution
in both rivers is increasing is very high litter in the
Yarra increased by 400 in 2017 compared to 2016
and then in 2019 it again more than doubled
compared to 2018 levels The Maribyrnong saw a
more gradual increase over time but still increased
by around 57 to 83 year on year since 2017
The Yarra exceeded the Maribyrnong in terms of
expected plastic pollution loads in 2016 (Charko
et al 2018) These changes are mostly driven by
increases in hard and soft plastic fragments and
polystyrene rather than the other categories of litter
meaning these are the litter categories that should
be addressed immediately at their source
As this study shows a very strong positive
correlation of plastic pollution with population
growth in Melbourne and the population of Greater
Melbourne is projected to grow from 5 million to 9
million by 2056 (DELWP 2019) it is expected that
plastic pollution increases will continue until
effective source reduction measures are taken
Nearly 25 billion pieces of plastic flow into
Port Phillip Bay annually from the surface waters
of the two major rivers of which over 2 billion are
microplastics smaller than 5 mm in diameter
3 M I C R O P L A S T I C S I N T H E Y A R R A A N D M A R I B Y R N O N G R I V E R S
C O N T E N T S
| 33 |
gt Litter composition in the rivers
Sample analyses revealed that hard plastic fragments
polystyrene and soft plastics were the most
common items captured Despite the manta netrsquos
selectivity to small buoyant items the sample results
largely align with several other local litter audits
Litter audits along the Westgate Park foreshore and
along St Kilda beaches between 2015 and 2017
revealed polystyrene packaging and soft plastics
(bits of plastic bags wrap cellophane etc) are the
second and third most dominant litter categories
after cigarette butts4 Hard plastic fragments were
the most captured items in manta net trawls in the
Bay (see Chapter 4) and the second most prevalent
litter items found on beaches around the Bay using
the Baykeeper Beach Litter Audit method to
monitor for microplastics (see Chapter 5)
Polystyrene is the most captured litter item in the
Bandalong litter traps in the Yarra River (Kowalczyk
and Kelly 2020) As cigarette butts much like other
heavier items sink after a relatively short period in
water and pass under the manta net their numbers
in the Yarra and Maribyrnong River trawls do not
align with general beach clean-up data where
cigarettes often dominate In addition beach
clean-up efforts are typically geared towards the
collection of large litter items Consequently hard
plastic fragments and microplastics are not
systematically recorded in litter clean-ups
In general trawl findings provide a fairly robust
representation of the microplastic pollution issue
providing valuable information about the
composition and relative abundance of dominant
buoyant litter items entering Port Phillip Bay
It is worth noting that hard plastic fragments
polystyrene and soft plastics also dominate
microplastic pollution in other urbanised
catchments around the globe These items were
the most abundant litter types collected in trawls in
the New York-New Jersey Harbour estuary USA
one of the most urbanized estuaries on earth (S
Meola New YorkndashNew Jersey Baykeeper pers
comm 2015) Similarly hard plastic fragments
polystyrene and plastic foil dominated microplastic
loads along the length of the Rhine River in Europe
(Mani et al 2015) This is not surprising given that
worldwide the packaging industry the primary
material source of microplastics in this study is the
third largest after food and energy (Moore and
Phillips 2011) and around 11 of plastic waste
generated gets lost in the environment (Borelle
et al 2020) where it breaks up into smaller pieces
under the prevailing environmental conditions
It is clear that the Yarra has much higher total litter
counts than the Maribyrnong This is probably
because the Yarrarsquos catchment area (4046 km2) is
larger than the Maribyrnongrsquos (1408 km2) and land
use between the catchments differs apart from the
Upper Yarra region the Yarra River catchment
includes 43 times more of urbanised area than the
Maribyrnong The respective Catchment Region
documents from Melbourne Waterrsquos Healthy
Waterways Strategy state that in the Maribyrnong
catchment
raquo about 10 retains its natural vegetation
(1408 km2)
raquo 80 is used for agriculture (11264 km2)
raquo 10 is urban development Greater Melbourne
and larger townships (1408 km2)
In the Yarra catchment
raquo 55 of the area retains its natural vegetation
(22253 km2)
raquo 30 is used for agriculture (12138 km2)
raquo 15 is urban development (6069 km2)
When comparing the other types of litter between
the rivers it was found that the Maribyrnong
4 amditangaroablueorg
| 34 |
(proportionally) has higher counts of soft plastics
nurdles bottle caps straws twine cigarette butts
and lsquootherrsquo items than the Yarra whereas
polystyrene is more problematic in the Yarra
gt Investigating litter by item category
Hard plastic fragments remain the most
problematic items in both rivers and have been
significantly increasing over the last five years Due
to their small size it is nearly impossible to trace
them back to their individual sources of pollution
They originate from broken-up larger items that are
lost from overflowing commercial household and
public bins littering and illegal dumping of waste
are blown off trucks during transport or from
construction andor demolition sites
The plastic polymer analysis showed that most
items in the samples were polyethylene (PE)
polypropylene (PP) or polystyrene (PS) which are
some of the most commonly used plastics in the
world However other common plastics like
polyethylene terephthalate (PET) and
polyvinylchloride (PVC) were largely absent from
the results Notably as per Pattison (2020)
degradation of polymers is not uniform and
different polymers break up via a range of
processes at varying rates (Gewert et al 2015)
Polymer types such as PE PP and PS break up faster
when exposed to UV radiation than PET and PU
thus potentially increasing the prevalence of these
secondary microplastics The varying densities of
polymers may also influence what is collected with
equipment such as the manta net which sits on the
water surface
The lowest density polymers found in the river
samples are most likely to float were PP
(090 g cm3) and PE (from 092- 097 g cm3) (see
Appendix 3A) Some of the higher density polymers
included PET (138-139 g cm3) and PVC (129-
144 g cm3) which are commonly used worldwide
but were only present in study samples in trace
amounts (see Appendix 3B) It is therefore likely that
denser polymers may be in sub-surface waters
floating underneath the manta net or have sunken
into the sediments as there is a strong correlation
between the number of microplastics found in river
sediments and increasing polymer density (Klein
et al 2015)
Further investigation of the water column and the
sediments are logical next steps in the process of
investigating microplastics pollution in the rivers
Polystyrene is the second most prevalent litter item
in the Yarra and in third place in the Maribyrnong
These findings are supported by litter research
conducted between 2017 and 2019 by the Yarra
Riverkeeper Association which found that
polystyrene was the most found item on the
riverbanks during community clean-ups as well as
in the Bandalong litter traps (Kowalczyk and Kelly
2020) A subsequent polystyrene pollution research
project by Cleanwater Group and Yarra Riverkeeper
Association attempted to trace this litter back to the
source by surveying 64 manufacturing and
distribution facilities (Barmand et al 2020) Over
80 of surveyed sites were found to have some
sort of polystyrene leakage into the environment
even when all reasonable precautions had been
taken to prevent this In addition more evidence is
being collected revealing that building sites are a
potential source of polystyrene pollution when
using insulation waffle pods5 Polystyrene also gets
lost in transport on loading bays and at waste
transfer and recycling facilities The fact that
polystyrene loss still occurs even when all
reasonable precautions are taken indicates that the
problems lie with the material itself and how it is
handled It therefore needs to be questioned if this
material should still be used for its current
purposes meanwhile alternatives should be
sought
3 M I C R O P L A S T I C S I N T H E Y A R R A A N D M A R I B Y R N O N G R I V E R S
C O N T E N T S
| 35 |
as community-led advocacy has led to retailers
swapping plastic straws for paper ones or not
offering plastic straws unless specifically requested
by their customers In some instances entire retail
precincts have pledged to cease the distribution of
plastic straws such as the traders on Gertrude
Street in Fitzroy (The Everleigh pers comm 2017)
The fact that the results of these community
initiatives are reflected in the monitoring data
indicates two things
raquo 1) Individual behaviour change community-led
advocacy and community action to reduce
plastic pollution can make a significant positive
difference for the environment
raquo 2) Ongoing data collection and monitoring of
plastic pollution are necessary to evaluate which
litter reduction initiatives are effective
Sponge is a category that has been significantly
increasing in the Yarra and mostly captures artificial
lsquospongeyrsquo substances such as sponge-like
household items building insulation foam and soft
packaging material When speculating where this
material comes from and why it is more prevalent
and increasing in the Yarra the increased residential
construction projects in the Yarra catchment may
correlate Further source tracing may provide insight
Other is a category applied to record items that are
not readily identifiable as fitting into any of the
other categories but are obviously not organic In
both rivers this category is significantly increasing
especially in the Maribyrnong where the graphrsquos
J-curve in Figure 18 suggests an exponential
increase This warrants closer investigation of this
category in future research to see if there are
specific items that are trending and if another litter
item category should be added for specific
monitoring focus
Soft plastic fragments are steadily increasing over
time Much like hard plastic fragments soft plastics
are difficult to trace back to a single source Much of
it likely comes from plastic littered on the streets or
it blows out of bins and skips due to its light weight
and prevailing wind strength and direction in relation
to the bin Once in waterways soft plastics carried
on rapid flood flows commonly snag on woody
streamside vegetation causing them to shred
Nurdles are ubiquitous in waterways all over
Victoria as supported by evidence gathered by
Tangaroa Blue Foundation and the EcoCentre since
2014 (N Blake F Charko pers comm 2020)
Although nurdles have neither significantly
increased nor decreased over the life of this project
they are still making up a steady 1 of microplastics
flowing into the Bay over time Chapter 5 of this
report shows that nurdles are the number one
microplastic type found on beaches around the
Bay indicating that this type of pollution is an
ongoing issue
As nurdles are classed as an industrial pollutant
rather than litter it is relatively easy to identify their
source These pellets can be traced back to the
premises of plastic manufacturers where they are
spilled on the loading bays and driveways and are
often incompletely or not at all recovered after a
spill Some get lost in road transport on their way to
manufacturers and end up in the gutters Refer to
Chapter 7 for recommendations on this issue
Plastic straws are the only item category that has
significantly declined over time in the Yarra This is
notably going against the trend of all other items in
both rivers that are either increasing or staying
constant over time The most likely explanation for
this is that over the last several years community
and business-driven source reduction initiatives
such as lsquoThe Last Strawrsquo have gained great traction
in Melbourne Individual behaviour change as well
5 Although the Master Builders Association offers a waste minimisation guide that includes waffle pods it does not outline how this material should be handled onsite to prevent spillage
| 36 |
Bottle caps cigarette butts and twine have neither
increased nor decreased in both rivers Although
cigarette butts are in the top ten of most littered
items in Australia their plastic filters get
waterlogged and most likely pass under the manta
net explaining the low numbers found in this study
gt Seasonal variations
When examining the seasonal effects on the rivers
the Maribyrnong proportionally has its largest
surface litter output in spring and autumn while for
the Yarra litter numbers are highest during summer
and winter One likely reason for this difference
could be related to sports events that draw large
numbers of people to the vicinity of the rivers such
as football season for the Yarra in winter and horse
racing events at Flemington Race Course in spring
for the Maribyrnong In summer the Yarra parklands
are extensively used for recreation and tourism in
Melbourne CBD is at its peak in DecemberndashJanuary
However both rivers have different land uses
influencing them and there are vast differences in
the industrial usage and population density along
the rivers (Yonkos et al 2014) Litter hotspots may
also play a role For example Calder Park Raceway
is located near Jacksons Creek not far upstream
from where the creek joins the Maribyrnong River
Road verges in the vicinity of Calder Park are
heavily littered (N Blake pers comm 2020) with
plastic items potentially shredded when verges are
seasonally slashed Both rivers are subject to
different street cleaning and sweeping schedules
and practices by local councils
gt Other factors influencing litter
Rainfall There is a positive correlation between
rainfall and plastic pollution which is consistent
with research worldwide Littered items anywhere
in the catchment eventually make their way down
to the nearest waterway through the stormwater
drain system heavily polluting creeks and streams
that lead into the big rivers and the Bay (picture 6)
Litter traps Although no statistical correlation was
found between microplastics spikes and emptying of
the litter traps this conclusion was reached through a
Wilcoxon rank sum test comparing median litter
Picture 6 Litter in the Merri Creek which flows into the Yarra
P I C T U R E 6
3 M I C R O P L A S T I C S I N T H E Y A R R A A N D M A R I B Y R N O N G R I V E R S
C O N T E N T S
| 37 |
counts when the litter trap was emptied to when the
litter trap was not emptied (two days before trawl) See
Appendix 5 for more details Just before publication of
this report subsequent advice was received from
Melbourne Water that the average Yarra River current
speeds between Burnley and Bolte Bridge is 55 km
per hour (P Rasmussen Melbourne Water Team
Leader Flood Preparedness pers comm 2020)
The distance from Burnley to Bolte Bridge is
approximately 758 km therefore estimated travel time
is about 06 to 38 hours with the average
approximately 15 hours The shorter duration could
be applied during higher flows following rainfall runoff
The longer durations are generally normal conditions
With tides ebbing and flowing for all conditions the
average may be best applied Accordingly any spikes
in trawl contents attributable to emptying of
Bandalong traps could only apply to trawls conducted
within just a few hours of the traps being emptied
Apart from litter prevention measures gross
pollutant traps could be installed on the
problematic major drain outlets and catch items
before they make it into the creeks Once it reaches
the creeks plastic pollution mixes in with organic
materials and will be more onerous and costly to
remove from the waterways due to the much
higher volumes presented by these combined
materials To be effective gross pollutant traps
require adequate and proactive maintenance
schedules and resources to prevent them from
blocking or overflowing
However gross pollutant traps do not often catch
microplastics Although the data in this report do
not show a direct statistically significant correlation
between microplastic capture and the emptying of
the Bandalong litter traps in the Yarra personal
observation of the manner in which the traps are
emptied confirms that microplastics do escape
during this process More targeted research
specifically designed to test for the effectiveness of
microplastics captured by gross pollutant traps
during their operation and maintenance is
therefore necessary
Yarra environmental water flow releases No
correlation was found between microplastics
captured in the trawls and Melbourne Waterrsquos
regulated release of environmental water flows for
the Yarra There is no evidence that environmental
water flows exacerbate plastic pollution in
waterways This supports the result that litter
originates from the street making its way into the
rivers through stormwater drains
gt Implications for marine life in the Yarra estuary
and Port Phillip Bay
Port Phillip Bay is a relatively closed system due to
the distance between the Bellarine and Mornington
Peninsulas being only just under 35 km Due to
prevailing winds it is likely the Bay is a sink for a major
portion of the plastics that enter it from the rivers
This study found that microplastics form the bulk of
items entering the Bay from the surface waters of the
Maribyrnong and Yarra rivers The results of a pilot
project of nine Bay trawls showed the presences of
microplastics in eight of nine samples (see Chapter 4)
To date very few studies have assessed
microplastic ingestioninteraction rates for faunal
species in Port Phillip Bay However worldwide
freshwater and marine species at all trophic levels
possessing varied feeding strategies ingest
microplastics (Eerkes-Medrano et al 2015) In
lab-based studies ingestion has been associated
with the retention and accumulation of
microplastics in organisms including but not limited
to mussels (Browne et al 2008) lobsters (Murray
and Cowie 2011) scallops (Brillant and MacDonald
2000) injury and subsequent disrupted feeding
swimming activity in lugworms as well as stress
immune response altered metabolic function and
| 38 |
toxicity in lugworms (Browne et al 2013) and fish
and mussels (Rochman et al 2013) It is also related
to tumour formation in fish (Rochman et al 2013)
and brain damage in fish (Mattson et al 2017)
Smaller sizes of plastic can potentially be ingested by
a greater range of species Plastic ingestion by local
wildlife is highly likely because of Port Phillip Bayrsquos
potential for high microplastic concentrations and
because these waters are so biodiverse Faunal
ingestion rates and impacts of marine microplastics
at the individual population and community levels
need to be assessed to prevent biodiversity loss in
the Bay and to better understand the human health
implications of consuming seafood from the Bay
Investing in necessary research will likely require
collaboration between departments managing water
pollution controls and fish populations respectively
gt Further study on microplastics
The estimations in this study showed that the Yarra
and Maribyrnong can transport nearly 25 billion
plastic pieces ndash of which more than 2 billion are
microplastics ndash into Port Phillip Bay annually and
that this may be an underestimation Ling et al
(2017) noted that plastic filaments including highly
pervasive clothing microfibre pollution between
0038 mm and 0250 mm formed the dominant
categories of microplastic in coastal and estuarine
sediments around Australia including Port Phillip
Bay However we know little about the
downstream movement and deposition of
microplastics in rivers It is not known what
portions of riverine microplastics travel
downstream below the surface waters sampled by
the manta net to eventually be released to the Bay
or deposited to the river sediments In the North
Shore Channel (Illinois USA) for example
microplastic concentrations in sediments were up
to 15000 times higher than surface water samples
(Hoellein et al 2017) Some microplastics are likely
transported long distances as several studies report
high concentrations of microplastics in estuaries
with rivers implicated as major microplastic sources
to these coastal zones (Yonkos et al 2014 Lima
et al 2014 Sadri and Thompson 2014) An example
of this was revealed during a community clean-up
event organised by the Yarra Riverkeeper
Association in April 2018 where a vacuum suction
device deployed by Ocean Crusaders removed over
47 million polystyrene pieces from the Yarra River
and its vegetated banks (A Kelly pers comm 2018)
Consequently in order to accurately identify the
magnitude of microplastic pollution in Port Phillip
Bay it is necessary to better understand microplastic
depositional patterns and take into account the water
column below the top 20 cm and the sediments
To advance current microplastics research in this
area the EcoCentre engaged a team of interns from
Worcester Polytechnic Institute (WPI) in the USA to
design and build a low-cost microplastics sampling
device easily built from hardware store materials
called the lsquoMicroplastics Collector With A Pumprsquo
(MCWAP) The MCWAP is a portable battery-
powered pump that takes water samples at various
depths in the water column down to a depth of 2 m
and runs these through a removable mesh 300 nm
filter to capture microplastics (picture 7) The
EcoCentre is planning a first trial of depth-sampling
for waterway microplastics in 2021
Picture 7 The MCWAP EcoCentrersquos portable microplastics depth-sampling device
P I C T U R E 7
3 M I C R O P L A S T I C S I N T H E Y A R R A A N D M A R I B Y R N O N G R I V E R S
C O N T E N T S
| 39 |
Maribyrnong River
Fishing in Port Phillip Bay
4
C O N T E N T S
| 41 |
Bay trawls pilotTo gain insight into the relative quantities of microplastics entering the Bay from Bass Strait as compared to the major rivers a pilot project of nine manta net trawls was conducted at the entrance to Port Phillip Bay with support from the Blairgowrie Yacht Squadron and the Australasian Ambassador for the 5 Gyres Institute
Trawls were conducted between April 2018 and
February 2020 at Popersquos Eye in Port Phillip Bay
during incoming tides and south-westerly winds
Trawl time was 30 minutes during which the vessel
was anchored to the sea bed in the tidal flow
Sample sorting was done in the same manner as
the river trawls (see Chapter 3)
Of the nine trawl samples collected at Popersquos Eye in
Port Phillip Bay eight contained plastics (Table 1) Of
the total 55 items found 35 (64) were
microplastics The most prevalent items were hard
plastic fragments which were found in six of nine
samples Samples in which plastic was found
contained up to 16 items The last sample
contained a remnant of a party balloon with the
balloon string still attached
Although the sample size is too small to perform
meaningful statistical analysis the findings suggest
there may be a worrying amount of plastic floating
on the surface waters of the Bay Given the size of
Port Phillip Bay is 1930 km2 and plastics were found
in 89 of samples collected through 30-minute
trawls plastics are potentially quite ubiquitous
A proportion of 80 of hard plastic fragments
found seems relatively consistent with the 75
proportion that flows into the Bay from the Yarra
and Maribyrnong indicating a probability that many
of these items may have originated from the Bay
passed through The Heads into Bass Strait and
then been recirculated back to the Bay by tidal
currents and prevailing winds More samples will
need to be taken and analysed in order to further
investigate this probability
Hard Fragments lt5 Hard Fragments gt5 Soft Plastics TwineLine Sponge Non-Plastic
Apr 18 3 4 1
May 18 6 2
Jun 18 8 6 2
Sep 18
Oct 18 2 1 3
Dec 18 1
Jan 19 2 1
Feb 19 1 2
Feb 20 2 1 1
TOTAL 19 16 2 5 2 5
Table 1 Items caught in Bay entrance trawls lsquoNon-Plasticrsquo included paper and a rubber balloon
T A B L E 1
4
Microplastic beach litter 5
C O N T E N T S
| 43 || 43 |
Baykeeper Beach Litter AuditsDevelopment of the Port Phillip Baykeeper Beach Litter Audit method commenced in 2014 in response to international studies confirming the environmental threat of plastic pollution At that time and to date there remains no international standard survey method with various existing data collection methods used by different leading bodies
While each method provided valuable information
their capacity to accurately record volumes of litter
over time ndash particularly microplastics ndash was seen to
be limited by one or more of the following factors
raquo lack of a clearly defined data collection area
raquo clean-up andor data collection methods
conducted on a scale that was unlikely to be
systematically repeated
raquo data collection recorded in a single area on a beach
(as opposed to a set of locations that represented
samples of all conditions on the beach)
raquo data recording conducted from a standing
position reducing the likelihood of recording
hard-to-spot microplastics
raquo data collection without removing litter
eliminating the possibility of clearly measuring
change in volumes occurring between surveys
The Baykeeper Beach Litter Audit methodology
was designed to focus on microplastic pollution
that poses an immediate threat to aquatic
organisms Key considerations in the design of this
method were the need to
raquo capture a representative sample of the conditions
on the beach
raquo establish an easily replicated method that can be
cost-effectively and consistently applied by
different groups around the Bay
raquo use data field terminology that was consistent
with terms used in the Australian Marine Debris
Initiative database
The Clean Bay Blueprint project provided an
opportunity to test the survey methodology over
several years with a range of user groups
| 44 |
Methodology
The survey method requires the combined search
time of the number of auditors to equate to at least
five minutes per quadrat Noting that some
quadrats will have very few if any microplastics
this requirement is designed to ensure consistency
of search effort and to enable a small team of two
people to comprehensively complete an audit in
less than an hour or two hours on more heavily
littered beaches This relatively small time
commitment facilitates regular conduct of audits
over the course of a year to achieve the statistical
rigour required to confirm trends in litter volumes
and type over time
gt Transect and quadrat placement
In order to capture a representative sample of all
beach conditions data is collected from three
transects across the beach In this context lsquoall beach
conditionsrsquo is referring to the structure of the beach
ndash shaped by the locally prevailing winds waves and
tidal currents ndash which transport sand debris and
litter to and from the beach To capture the
influence of these coastal processes over time and
to provide a basis for consistent search effort
transects are located at the widest central and
narrowest sections of beach
In each transect data is collected from three
quadrats at the top of the beach mid-beach and
on the last high tide line (Figure 22) The lsquotoprsquo
(inland edge) of the beach quadrats are in the same
place for each survey as locational reference points
Due to changing tidal conditions on the day the
distance between the top of the beach and last
high tide line (ie transect length) will vary Hence
the location of the mid-beach and quadrats at the
last high tide line differ for each survey Importantly
the quadrats located at the last high tide line
provide a sample of litter arriving on that day
Each transect starts at the lsquopermanent landmarkrsquo at
the top of the beach to ensure transects are in the
same place each time a survey is conducted
Transects run roughly at a right angle from the top of
the beach towards the closest point at the waterline
gt Selection of reference beach survey locations
With a view to gaining insights into catchment
sources of microplastics to the Bay beaches
surveyed for Clean Bay Blueprint in various regions
of Port Phillip Bay are generally associated with a
river or a creek that flows into the Bay Those that
are not directly associated with rivers or creeks (Rye
and Geelong Eastern Beach) are included to provide
insights into the mobility of litter due to tidal
currents and seasonal winds
5 B A Y K E E P E R B E A C H L I T T E R A U D I T S
Figure 22 Location of Baykeeper Beach Litter Audit data collection quadrats along the widest (1) central (2) and narrowest (3) beach transects
F I G U R E 2 2
C O N T E N T S
| 45 |
Plastics that float in the upper water column are
carried in the direction of wind-generated waves
and the direction of tidal currents during calm
(low-wind) conditions (N Blake pers obs 2020)
Due to the combined effects of tides and varying
wind directions some plastic objects may travel
widely in the Bay before eventually being cast upon
a beach A notable example was one of five
GPS-tracked PET bottles released in Elwood Canal
on 9 May 2019 by RMIT6 After remaining in the
Canal for almost two weeks they ultimately landed
on Dromana beach on 25 May due to a prevailing
northerly wind Therefore in the absence of data
collection conducted on a weekly basis it is
impossible to definitively conclude where beach
litter on any given day may have originally
come from However seasonal
data collection at multiple
(Bay-wide) reference sites does
provide some indication of the
likely source (the catchment)
and ultimately presents a
baseline dataset with which
to determine if microplastics
lsquoleakagersquo into the Bay is
increasing or decreasing
over time
gt Surveys conducted
Between July 2017 and March 2020 117 beach litter
audits were conducted in 12 locations around Port
Phillip Bay (Table 2) with the help of local
community group volunteers not-for-profits and
education institutes All citizen scientists involved
received multiple on-site training sessions by the
Port Phillip Baykeeper before independently
conducting audits Regular reference beaches were
surveyed every three months (in May August
November and February) with surveys of all
beaches generally conducted within the same
fortnight Only sites that were surveyed on at least
six occasions have been given more detailed
analysis in this report
LOCATION ASSOCIATED RIVER
OR CREEK AUDITS
COMPLETED
Eastern Beach Geelong na 11
Moorpanyal Beach Geelong na 2
Werribee River Jetty Werribee River 6
South Beach Werribee Werribee River 7
West Beach St Kilda Yarra River 15
Point Ormond Elwood Elwood Canal 3
Mordialloc Beach Mordialloc Creek 4
Keast Park Seaford Patterson River 10
Frankston Beach Kananook Creek 12
Mothers Beach Mornington NA 4
Mount Martha Beach Balcombe Creek 30
Rye Beach na 13
Total surveys 117
Table 2 Beach litter audit sites and number of audits done between July 2017 and March 2020 Beach names in bold are the regularly surveyed reference beaches the other beaches were opportunistically surveyed
T A B L E 2
6 RMIT Litter Tracker project httpswwwrmiteduauaboutschools-collegesscienceresearchresearch-centres-groupsaquatic-environmental-stresslitter-trackers
| 46 |
Results and discussion
Figures 23 and 24 show beaches along Port Phillip
Bayrsquos eastern shores recorded much higher
concentrations of litter than Geelong Werribee and
Rye The lower counts at Geelong and Rye can be
attributed to the fact there is no major waterway
entering the Bay in their general vicinity and
raquo as Geelong Eastern beach is located near the
westernmost end of Corio Bay it has very limited
exposure to litter dispersed by wind and tides
from wider Port Phillip Bay
raquo Rye beach is the southernmost survey location in
the Bay relatively removed from major streams
and urban catchment
The much lower (near negligible) counts at
Werribee South and Werribee River jetty are likely
attributable to the fact that the Werribee River
catchment is much less urbanised (around 20)
than the catchments associated with most of the
eastern sites of the Bay These results suggest that
litter makes its way to the Bay from the catchments
via the waterways
The high average counts at Keast Park (Seaford)
equate to 42 of total litter collected at all survey
locations Field observations and anecdotal reports
of industrial sites in the Mordialloc Creek and
Patterson River catchments have identified two
particular sites that may be significant contributors
to the overall plastic pollution recorded at Keast
Park This result warrants more detailed analysis
and investigation
A total of 11248 items were recorded in this study
A breakdown of items collected in Figure 25 shows
very few gross pollutants (eg intact plastic bottles
and bags) were recorded while nurdles (pre-
production pellets) and plastic fragments combined
comprised 77 of the total records The volume of
microplastics observed in 9 m2 compared to
microplastics reported in typical beach cleans
confirms the effectiveness of the methodology in
systematically recording microplastics at reference
sites around the Bay
Of all litter recorded the quadrats within the lsquolast
high tide linersquo recorded the greatest percentage of
items (45) followed by the lsquotop beach zone (38)
then the lsquomid-beach zonersquo (18) However this
order did not apply to all beaches with several of
the less littered beaches recording the greater
amount in the top beach zone (Figure 26) Mt
Martha is notable in this regard among the more
heavily littered beaches in that the lsquotop beachrsquo
quadrats had the highest amounts in all three
transects However this result was skewed
significantly by the top beach of the central beach
transect which averaged 278 items per survey ndash
almost as much as the totalled averages for all other
quadrats combined (338 items)
Keast Park has the distinction of having the
highest percentage of nurdles (59 of items
recorded) compared to St Kilda West beach (47)
Frankston (34) Rye (22) and Mt Martha (17)
Nurdles were virtually absent from beaches on the
west side of the Bay
Examination of plastic fragments by type and size
also found Keast Park distinguished from other
beaches with 53 of fragments being hard
fragments lt 5 mm Frankston ranked next highest
for hard plastic fragments with 37 followed by Mt
Martha with 34
The significantly higher counts of nurdles and hard
plastic fragments lt 5 mm may be due to a
combination of factors such as
raquo the broader range of wind directions that might
affect the site prevailing winds are acknowledged
as a primary agent for litter dispersal and Keast
Park is located at the easternmost point of Port
5 B A Y K E E P E R B E A C H L I T T E R A U D I T S
C O N T E N T S
| 47 |
Figure 23 Average litter per survey for all beaches surveyed
Figure 24 Visualisation of total litter counts on sampled beaches around Port Phillip Bay larger circles represent higher counts Image source Port Phillip Sea Pilots
F I G U R E 2 4
F I G U R E 2 3
| 48 |
Figure 25 Litter category percentages of total litter recorded across all sites The numbers above the percentages are the total items collected
Figure 26 Comparison of results for tide line mid-beach and top beach zones
Phillip Bay and subject to winds from south to
north (the widest range of all sites surveyed)
raquo orientation of the beach (near North-South at
Keast Park)
raquo physical infrastructure impeding wave action on
this particular beach (the Riviera stormwater
outfall projects into the Bay at a point around
20 m south of the survey area)
raquo presence of plastics manufacturing and re-grind
industries within the catchments
raquo proximity to industrial sites in local river and
stream catchments (Mordialloc Creek and
Patterson River) to the north of the survey beach
(tidal currents that run clockwise around the Bay
would carry plastics generated by these streams
towards Keast Park)
The Frankston beach survey site is oriented NNE to
SSW which is not dissimilar to the orientation of
Keast Park (NNW-SSE) The two sites are just seven
kilometres apart Despite this proximity the
Frankston site (located just to the south of
Kananook Creek mouth) recorded considerably
fewer nurdles and hard plastic fragments than Keast
Park (which is to the south of Mordialloc Creek and
Patterson River) These findings suggest that close
scrutiny of the Mordialloc Creek and Patterson River
catchments for nurdles and hard plastic fragments
is warranted
F I G U R E 2 5
5 B A Y K E E P E R B E A C H L I T T E R A U D I T S
C O N T E N T S
| 49 |
F I G U R E 2 5
| 51 |
Port Phillip Bay on a windy day
6
| 51 |C O N T E N T S
Related litter investigations Over the life of Clean Bay Blueprint the EcoCentre collaborated with many other organisations Other investigative litter projects enabled by the Port Phillip Bay Fund with the primary aim of data collection for pollution prevention include
raquo Yarra Riverkeeper Associationrsquos Litter and Flows and polystyrene projects - analysing
litter in the Yarra
raquo RMIT Universityrsquos Plastics Lab project ndash analysing
plastic fragment samples to identify polymers and
adsorbed contaminants
raquo Tangaroa Blue Foundationrsquos Letrsquos Strain the Drains7 ndash trialling stormwater pit filtration devices
to document the captured contents in a range of
municipalities and for four different street usages
raquo Scouts Victoriarsquos Street2Bay8 project ndash auditing
litter in six different street usages in all catchments
around the Bay
raquo RMIT Universityrsquos Litter Tracker4 project ndash GPS
tracking and on-line reporting of the mobility of
plastic bottles released into streams in
catchments leading to Port Phillip Bay
raquo Beach Patrol Australia and Love Our Street have
also compiled considerable data with the mobile
Litter Stopper phone app9
Interactive litter maps
It is essential to provide data access and report back
on research results to citizen scientists and those
advocating for and designing change Data collected
from the beach audit sites have been entered into
an interactive Tableau data visualisation platform
and is hosted on the EcoCentre website with
potential for visualising street litter data collected by
other groups Consequently the Tableau platform
appears to be a useful means of engaging with
schools and the wider community in relation to the
high mobility of microplastic pollution
The EcoCentre was also part of the community
reference group that helped design and test the State
Governmentrsquos LitterWatch10 database which collects
and collates litter data from all over Victoria visualises
this on a map and makes it publicly accessible This
is the first attempt to gather all litter data no matter
which data-collection methods were used and bring
this together in one accessible repository
Incident reporting
During the course of the study several materials that
have been noted as of ongoing concern were
reported to relevant authorities These included Telco
wire offcuts discarded at telecom sites on streets
polystyrene waffle pod waste leaking from a building
site and AstroTurf fragments leaking from a
sportsground demolition
All of the complementary initiatives represent major
advances in our understanding of plastic pollution
and warrant careful consideration as a whole body
of information as opposed to in isolation particularly
with a view to adopting the optimum suite of data
collection methods for the future and to set targets
for local source reduction plans
7 tangaroablueorglets-strain-the-drains-port-phillip-bay-region-vic 8 httpsscoutsvictoriacomauactivities-eventsactivitiesenvironmentstreet2bay-project 9 httpswwwbeachpatrolcomau 10 httpslitterwatchvictoriaorgau
Sunset over Port Phillip Bay
RecommendationsOver the life of the Clean Bay Blueprint project microplastic pollution has stopped being an lsquoemerging issuersquo The irrefutable evidence of its unacceptable impact on the environment is well-documented all over the world
7
C O N T E N T S
| 53 |
Many governments are acting on the
recommendation from the science community that
society should not wait for any more quantification
of damage before taking action to reduce marine
plastic pollution impacts (Lavers and Bond 2017
Gall and Thompson 2015) In their report Marine
Plastics Debris and Microplastics the United Nations
stated there is a moral argument that we should not
allow the ocean to become further polluted with
plastic waste and that marine littering should be
considered a lsquocommon concern for humankindrsquo
(UNEP 2016)
The high quantities of litter and microplastics in the
Yarra and Maribyrnong rivers highlight the large
contribution of these rivers to marine plastic
pollution in Port Phillip Bay Recent research by
Borelle et al (2020) projected the future of plastic
pollution in our oceans and concluded that the
predicted growth in plastic waste in the next 10
years far exceeds the impacts of mitigation efforts
currently deployed Therefore significant changes
and investments need to be made to counter the
rising tide of plastic pollution in the oceans
| 54 |
Recommendation 1
gt Improve product stewardship
Plastic and microplastic pollution are everybodyrsquos
problem Over the lsquolifecyclersquo of a plastic item it
travels through the fossil fuel and petrochemical
industries transport and shipping plastic product
manufacturers retailers community local councils
waste contractors and the recycling industry
However whereas every link in this user chain has
some level of responsibility not everyone should be
expected to have the same level of accountability
for plastic waste The current responsibilities for the
fate of plastic products are not well-defined and are
often passed on to the next group down the line
putting a disproportionately large strain on
communities and local councils There is very little
meaningful manufacturing industry accountability
for the end-of-life destination of plastic whether for
waste management or pollution of the environment
The plastics industry is set to grow 40 by 203011
yet hardly any producer responsibility is taken for
the waste and problems its products cause Only
94 of manufactured plastic is being recycled in
Australia (OrsquoFarrell 2019) which is consistent with
9 world-wide9 An astonishing 11 enters the
oceans (Borelle et al 2020) Currently local councils
and the community are expected to deal with the
consequences of unregulated production of a
material that lasts in the environment forever
As Victoria is moving from a linear to a circular
economy model this is the perfect time to change
and define the responsibilities of the plastics
industry and their accountability Federal and state
governments play a key role in leading and
managing this change Some of the changes that
the EcoCentre believes should be made in the short
and long term are
11 Transition to a circular economy model
Product recovery schemes (such as the
container deposit legislation) that are part of a
circular economy model should be funded by
the industries which produce the product
and managed by an independent government
agency to prevent perversion of the initiative
12 Invest in implementing alternatives to
plastic Plastic is not the right material for
the majority of functions it performs eg
using a material that lasts forever for single-
use packaging The ever-increasing
monetary and environmental costs of
dealing with plasticrsquos end-of-life stage are too
high Many alternative truly biodegradable
materials have already been invented but
have not been taken up for large-scale use
Industry needs to be given incentives to
transition towards producing large-scale
alternative packaging solutions eg through
new legislation or stimulus measures such
as innovation grants or tax incentives
13 Set limits on virgin plastic production
This includes avoiding investments in
waste-to-energy schemes that burn plastic
as it perpetuates our reliance on a product
that should not be burned in the first place
14 Ban broad-scale groups of problematic
single-use plastics12 Examples such as South
Australiarsquos ban on single-use plastic items
will provide some of the incentives driving
innovation and transformation Bans may be
premised on design qualities rather than
product type for example banning oxo-
11 httpswwwplasticsoupfoundationorg 12 The Australian National Waste Policy Action Plan commits to banning lsquoproblematic and unnecessary single-use plasticsrsquo by 2025 and delegated the Australian Packaging Covenant Organisation to lead all governments to lsquoIdentify problematic and unnecessary single-use plastic packaging to provide an evidence base for industry to take coordinated actionrsquo by 2019 The resulting report identified four priority categories (including expanded polystyrene and non-certified compostable packaging such as oxo-degradable) and three materials for further investigation httpswwwpackagingcovenantorgaudocumentsitem3183
7 R E C O M M E N D A T I O N S
C O N T E N T S
| 55 |
13 Operation CleanSweep is a best-practice manual for plastic manufacturers that employs cost-effective ways of preventing nurdles leaking into the environment
degradable plastics (that merely break into
microplastics faster rather than biodegrade to
natural component materials) or non-
recyclablenon-compostable packaging
15 Make the Operation CleanSweep13
program mandatory instead of voluntary
for any manufacturer using nurdles and have
this enforced by EPA Victoria
Recommendation 2
gt Cultivate effective partnerships
It is critical that conversations and true working
partnerships are forged and maintained with a
long-term vision of collaboration and tangible
positive outcomes In the case of an issue as big as
plastic pollution cross-sectoral collaborations are
essential to ensure effective changes Industry local
government state government agencies (such as
EPA Victoria the Catchment Management
Authorities and Melbourne Water and others)
research institutes community organisations and
businesses all need to engage in ongoing dialogue
about responsibilities and most importantly to
reach clear agreement on which group is
accountable for delivery of each defined outcome
that is necessary to the success of the overall
enterprise This might be achieved through
stakeholder working forums similar to the Victorian
Department of Environment Land Water and
Planningrsquos Integrated Water Management Forums
Recommendation 3
gt Support local councils in waste management
Until larger systemic changes in waste
management are made the end-of-line
responsibilities councils have for plastic waste need
to be adequately supported and resourced The
costs of this should not be transferred to the
community via rate increases nor by reliance on ad
hoc manual volunteer clean-ups
Measures should include effectively resourcing
councils to
31 Install and maintain pollutant traps in
drain outlets that discharge into creeks
and rivers This could be a collaboration
with Melbourne Water Care should be taken
to not just install gross pollutant traps but
also traps that catch microplastics such as
Drain Buddies
32 Enforce litter and illegal dumping law
33 Run effective litter prevention and
education programs in the community and
especially with local businesses and industry
This may be best done by partnership with
trusted business or community
organisations supporting the outreach
34 Review and improve current street
sweeping schedules and where necessary
adapt these to be more effective at the
occurrence of large sporting events and
seasons when litter peaks occur
| 56 |
Recommendation 4
gt Continue monitoring (micro)plastic pollution
Existing waste management and anti-litter
initiatives are not effective enough to stop plastic
and microplastic pollution from reaching Port Phillip
Bay The research in this report has established a
baseline data set that shows that the problem is
getting worse over time
The river trawls and beach litter audit methods
described in this report are both demonstrated to
be scientifically valid means of ongoing data
collection and the multiple years of data gathered
represent a benchmark of plastic pollution in the
major rivers and Port Phillip Bay The street litter
audit method applied by Scouts Victoria in the
Street2Bay project has also proven to be an
effective and replicable means of monitoring plastic
pollution on streets in Port Phillip Bay catchments
Continued data collection using these methods can
provide a means of evaluating any future strategies
to reduce plastic pollution in waterways
Recommendation 5
gt Increase education and lsquoplastic literacyrsquo of all
plastic users
As part of cultivating a shared responsibility for
plastic use and disposal education of plastic users
is essential The general public has become much
more aware of the issues of plastic pollution in the
environment thanks to a boom in scientific
research followed by mainstream film
documentaries and social media and community
campaigns over recent years
However there is still much confusion about how
plastic can be avoided or what plastics are more
preferable to others An example of this is the actual
meanings of the words lsquobiodegradablersquo lsquodegradablersquo
lsquooxo-degradablersquo and lsquocompostablersquo for plastic bags
People generally try to do the right thing and want
to invest in better products but industry uses the
terms in misleading ways (picture 8)
Recommendations are therefore
51 Set standard legal definitions for
degradability labels
Not-for-profit organisations as well as local councils
play a key role in educating the community and
implementing education programs in schools
Organisations that specialise in this should be
adequately resourced It is likely the reduction in
plastic straws in the Yarra can be attributed to
education efforts and community behaviour change
projects showing that these approaches work The
community and NGOs are not significantly
mentioned in Recycle Victoria (February 2020)
whereas community and cross-sector
collaborations are mentioned in the Port Phillip Bay
EMP but funding for joint activities is unclear after
the conclusion of the Port Phillip Bay Fund in 2020Picture 8
Industry messaging on plastic bag
7 R E C O M M E N D A T I O N S
C O N T E N T S
| 57 |
52 Develop project grants forums and
strategic ongoing partnerships that
integrate community government research
and industry efforts
53 Adequately resource groups who
educate and facilitate action on plastic
pollution
Recommendation 6
gt Conduct further research
As highlighted in the study discussions above
additional research is needed to adequately monitor
microplastics in Melbournersquos waterways and Port
Phillip Bay Ongoing monitoring of surface waters is
necessary to track the quantities and movements of
microplastics and can serve as a baseline for source
reduction action Given the high numbers of
microplastics reaching the Bay from surface waters
it is also important to conduct further research into
the water column and the sediments
Recommendations for further research are
61 Conduct depth-sampling studies The
EcoCentre will pilot the MCWAP to start
monitoring microplastics in the water
column If successful the device and
methodology could be rolled out for use
across creeks and rivers of Victoria
62 Conduct sediment studies Sediment
research is necessary to identify where the
heavier polymers end up according to
Schwarz (2019) river sediments act as a plastic
sink and CSIRO estimated that based on their
samples taken in the South Australian Bight
144 million tonnes of microplastics reside on
the seafloor worldwide (Barrett et al 2020)
63 Prioritise understanding the
contaminants carried by plastic in
waterways and associated human health
risks Continued analysis of plastic polymer
types and chemical contaminants carried by
plastics in waterways is necessary to
strengthen our understanding of the
potential ecological and human health
impacts of plastic pollution
64 Conduct on-ground investigations for
major sources of hard plastics fragments
and nurdles within the Mordialloc Creek and
Patterson River catchments
Plastics Lab Dr Mayumi Allinson
View of St Kilda Beach
8
C O N T E N T S
| 59 |
A note on citizen scienceThe research conducted in this study strongly relied on the collaborations with volunteer citizen scientists Citizen science has received increasing recognition over the last decade and rightly so without more than 8800 hours contributed by volunteers for data collection sample sorting and analysis Clean Bay Blueprint could not have produced such robust results
This project is hardly an exception these days as
volunteers both individually and via community
groups put countless hours of their time and
expertise towards environmental projects that rely
on large datasets and labour-intensive analyses
It needs to be recognised that the contributions of
citizen scientists to science and environmental
change-making are both invaluable and essential
and that collaborations between research
institutions and community provide a powerful
opportunity to build understanding of complex
issues of Victorian Australian and global
significance Resourcing the professional
coordination of such collaborative studies often
provides funders with a multifold return on the
investment through generating new knowledge
inspiring extensive in-kind contributions and
activating community-led conversations and action
on topics that might otherwise be uncommon
around dinner tables classrooms and clubs
9
Little Penguin in Port Phillip Bay
C O N T E N T S
| 61 || 61 |
AcknowledgementsOne of Clean Bay Blueprintrsquos main goals was to build partnerships with other organisations that target litter and improve Bay health
raquo Khadija Muhanna Saif Al
Nabhani - RMIT University
raquo Hilda Poloso - RMIT University
raquo Minh Tu - Deakin University
raquo Daniel Cox - RMIT University
raquo Nick Bergstrom - Worcester
Polytechnic Institute
raquo Sarah Duquette - Worcester
Polytechnic Institute
raquo Madison Healy - Worcester Polytechnic Institute
raquo Nick Sorensen - Worcester Polytechnic Institute
raquo Cameron Collins - Worcester Polytechnic Institute
raquo Samantha Comeau - Worcester Polytechnic Institute
raquo Brendan Gallagher - Worcester Polytechnic Institute
raquo Gina Visser - Worcester Polytechnic Institute
raquo Katie Donovan - Worcester Polytechnic Institute
raquo Spencer Hoagland - Worcester Polytechnic Institute
raquo Thomas Lipkin - Worcester Polytechnic Institute
raquo Eric Stultz - Worcester Polytechnic Institute
We recognise the extensive and energetic contributions of many interns
Many new collaborations and ongoing partnerships were formed and many existing relationships were
leveraged during this project This was made possible by the funding from the Port Phillip Bay Fund of
EcoCentre projects as well as those of other organisations We therefore thank the State Government of
Victoria for its support
Our sincere thanks goes out to the many volunteers including work placement students and interns who
have donated hours of their time and expertise to the project to make it a success We acknowledge your
great passion for the environment and deep dedication to making positive change for the future of our
waterways This project would not have been possible without your support
raquo Balcombe Estuary Reserves
Group Mt Martha
raquo Beach Patrol Mt Martha
raquo Frankston Beach Patrol
raquo Rye Beach Patrol
raquo Beach Patrol Australia
raquo Seaford Beach Patrol
raquo Werribee Beach Patrol
raquo Werribee River Association
raquo Yarra Riverkeeper Association
raquo David Flew
(Karringal boat skipper)
raquo Blair Stafford Australasian
Ambassador of the 5 Gyres
Institute
raquo Blairgowrie Yacht Squadron
raquo Metropolitan Waste and Resource Recovery Group
raquo Melbourne Water
raquo Parks Victoria
raquo 3CR Community Radio
raquo 3RRR Community Radio
raquo Sacred Heart Mission
raquo Bellarine Catchment Network
raquo RMIT Plastics Lab Prof Graeme Allinson Dr Mayumi Allinson Marinda Pattison and students
raquo Scouts Victoria
raquo Worcester Polytechnic Institute
raquo Dolphin Research Institute
raquo Sustainability Victoria
raquo Victorian Litter Action Alliance
raquo Gordon TAFE
raquo Dr Christopher Johnstone and Emma Barnett of Monash University
raquo Victorian National Parks Association
raquo Federation University
raquo Australian Citizen Science Association
raquo The Age
raquo Department of Environment Land Water and Planning
raquo Ying Quek
raquo Port Phillip Menrsquos Shed
We thank the following organisations groups and individuals for their contribution and collaboration (in no particular order)
Appendicesgt Appendix 1
| 62 |
Figure 28 Percentage of microplastics in samples per trawl in the Yarra (blue) and Maribyrnong (red) rivers with 95 confidence intervals shaded grey The average percentage of microplastics per sample was 184 This number has stayed constant over time
F I G U R E 2 8
Appendices
Microplastic Image Josie Jones
C O N T E N T S
| 63 || 63 |
gt Appendix 2
MARIBYRNONG YARRA
Hard plastic fragments 174 -102
Soft plastics 959 -560
Polystyrene -1688 986
Nurdles 803 -469
Plastic bottle caps 542 -317
Plastic straws 529 -309
Sponge -167 097
Twine 412 -241
Other 004 002
Cigarette butts 596 -348
F I G U R E 2 9
Figure 29 Mosaic plot showing the Chi-Square test results (in Table 3 below) The statistical test looks at whether proportions are different than what is expected by chance considering both the Yarrarsquos and Maribyrnongrsquos total litter The width of the boxes show the proportion of litter in the Maribyrnong compared to the Yarra The height of the boxes shows the proportion of litter for each litter item The colours represent significance Boxes coloured red have lower proportions than expected by chance and those in blue have higher proportion than expected by chance The boxes for hard plastic are grey meaning there are no significant differences in proportions of expected hard plastic fragments in the Maribyrnong or Yarra rivers (P gt 005) The boxes for nurdles bottle caps straws and soft plastics are blue for the Maribyrnong and red for the Yarra meaning there are proportionally more nurdles bottle caps plastic straws and soft plastics than expected in the Maribyrnong river and fewer than expected in the Yarra (P lt 005)
Table 3 Residuals from Chi-square test for plastics count as a function of waterway and plastics category Significant values are in bold red
T A B L E 3
| 64 |
gt Appendix 3
Plastic polymer analysis
A
B The below Table 7 is used with
permission from the unpublished
Honours dissertation Analysis of
Microplastic Polymers in the Yarra and
Maribyrnong Rivers (May 2020) by
Marinda Pattison under supervision of
Associate Professor Graeme Allinson
Table 6 Plastic polymer density (Stelray Plastic Products 2020)
T A B L E 6
YARRA RIVER MARIBYRNONG RIVERPercentage () Std Dev Percentage () Std Dev
Total PE 4750 1113 4916 1562
PP 2204 1024 2361 867
PS 1530 1195 791 871
PU 088 217 035 067
Nylons 027 064 104 241
EVA 043 062 049 101
PVC 021 065 008 023
Latex 002 008 005 019
PE amp PP mix 023 039 021 055
PET 002 008 000 000
Nitrile 000 001 000 000
PMMA 002 009 000 000
PTFE FEP 000 000 000 000
CA 001 005 000 000
PC 001 006 007 027
ABS 012 046 000 000
Unknown 067 096 088 113
T A B L E 7
Table 7 Mean abundance (percentage) of polymers in Yarra and Maribyrnong Rivers
A P P E N D I C E S
C O N T E N T S
| 65 |
gt Appendix 4
Changes in individual litter items over time
YARRA RIVER
Plastic Kendallrsquos tau Z P-value
Hard Plastic Fragments 033 741 lt0001
Nurdles 008 086 0391
Other 023 229 0022
Plastic Bottle Caps 016 146 0146
Plastic Straws -025 -234 0019
Polystyrene 022 346 0001
Soft Plastics 027 578 lt0001
Sponge 025 248 0013
Twine 007 072 0470
Cigarette butts 017 164 0102
MARIBYRNONG RIVER
Plastic Kendallrsquos tau Z P-value
Hard Plastic Fragments 026 552 lt0001
Nurdles -004 -044 0657
Other 043 416 lt0001
Plastic Bottle Caps -013 -125 021
Plastic Straws -021 -195 0051
Polystyrene 009 14 0161
Soft Plastics 013 279 0005
Sponge 007 064 0524
Twine 004 042 0671
Cigarette butts -003 -031 0755
Table 4 Kendallrsquos tau test results Change in counts of plastic over time by category for the Yarra and Maribyrnong rivers Kendallrsquos tau the Z value and P-values are presented Significant values are in red These results are important for interpreting the scatterplots in Figures 18 and 19 A positive tau indicates an increase in litter over time A negative tau indicates a decrease over time Kendallrsquos tau is a non-parametric correlation value
T A B L E 4
| 66 |
gt Appendix 5
Bandalong litter traps
In the Yarra River multiple outliers were recorded for the total litter items captured per trawl date Litter traps
were emptied over 24 of the trawl days Six of those days showed higher than average litter counts On 35
trawl days litter traps were not emptied and we saw five higher than average total litter counts
Figure 30 A Wilcoxon rank sum test compared median litter counts when litter trap was emptied to when litter trap was not emptied (two days before trawl) We did not find any effect of litter trap emptying on the total number of litter items captured (W = 289 P = 0162)
F I G U R E 3 0
A P P E N D I C E S
C O N T E N T S
| 67 |
gt Appendix 6
Yarra Environmental flows
There was no significant association between environmental flow events and plastic counts in the Yarra (t =
-03 P = 0768) The amount of variation in microplastic counts explained by environmental flows was close
to zero (adjusted R2 lt 0001) Note that microplastic count was square root transformed to meet
assumptions of a regression analysis
Figure 31 Count of microplastics per trawl as a function of environmental flows in the Yarra River
F I G U R E 3 1
raquo Andrady A L (2006) Assessment of
environmental biodegradation of synthetic
polymers Polym Rev 1994 3425ndash76
raquo Andrady A L (2011) Microplastics in the marine
environment Marine pollution bulletin 62
1596-1605
raquo Barua S Muttil N Ng A amp Perera B (2013) Rainfall
trend and its implications for water resource
management within the Yarra River catchment
Australia Hydrological Processes 27 1727-1738
raquo Barmand S Goodsell K Yardley D Kowalczyk N
(2020) Polystyrene pollution in the Yarra river
sources and solutions Yarra Riverkeeper
Association
raquo Barnes D K Galgani F Thompson R C amp Barlaz
M (2009) Accumulation and fragmentation of
plastic debris in global environments
Philosophical Transactions of the Royal Society of
London B Biological Sciences 364 1985-1998
raquo Barrett J Chase Z Zhang J Banaszak Holl M M
Willis K Williams A Hardesty B D Wilcox C
(2020) Microplastics pollution in deep-sea
sediments from the Great Australian Bight
Frontiers in Marine Science October 2020
Volume 7 Article 576170
raquo Blake N amp Charko F (2014) Pilot study to identify
the extent of microplastics in the Maribyrnong
and Yarra Rivers and Port Phillip Bay Port Phillip
EcoCentre report
raquo Borelle S B Ringma J Law K L Monnahan C C
Lebreton L McGivern A Murphy E Jambeck J
Leonard G H Hilleary M A Eriksen M
Possingham H P De Frond H Gerber L H
Polidoro B Tahir A Bernard M Mallos N Barnes
M Rochman C M (2020) Predicted growth in
plastic waste exceeds efforts to mitigate plastic
pollution Science 369 (6510) 1515-1518
raquo Brillant M amp Macdonald B (2000) Postingestive
selection in the sea scallop Placopecten
magellanicus (Gmelin) the role of particle size
and density Journal of Experimental Marine
Biology and Ecology 253 211-227
raquo Browne M A Dissanayake A Galloway T S
Lowe D M amp Thompson R C (2008) Ingested
microscopic plastic translocates to the circulatory
system of the mussel Mytilus edulis (L)
Environmental science amp technology 42
5026-5031
raquo Browne M A Niven S J Galloway T S Rowland
S J amp Thompson R C (2013) Microplastic moves
pollutants and additives to worms reducing
functions linked to health and biodiversity
Current Biology 23 2388-2392
raquo Charko F Blake N Kowalczyk N Johnstone C
Seymore A Quek Y (2018) Microplastics in the
Maribyrnong and Yarra Rivers Melbourne
Australia Port Phillip EcoCentre report
raquo CIEL (2019) Plastic amp climate the hidden costs
of a plastic planet Center for International
Environmental Law
httpswwwcielorgplasticandclimate
raquo Chidambarampadmavathy (2017) Sustainable
bio-plastic production through landfill methane
recycling Renewable and Sustainable Energy
Reviews Volume 71 May 2017 Pages 555-562
raquo Cole M Lindeque P Halsband C amp Galloway T S
References
| 68 |
R E F E R E N C E S
C O N T E N T S
| 69 || 69 |
(2011) Microplastics as contaminants in the
marine environment a review Marine pollution
bulletin 62 2588-2597
raquo Commonwealth of Australia (2016) Toxic tide the
threat of marine plastic pollution in Australia
Environment and Communications Reference
Committee
raquo DAWE (2018) National Waste Policy - less waste
more resources Department of Agriculture Water
and the Environment
raquo DAWE (2019) National Waste Policy - Action plan
Department of Agriculture Water and the
Environment
raquo DELWP (2017) Port Phillip Bay Environmental
Management Plan The State of Victoria
Department of Environment Land Water
and Planning
raquo DELWP (2019) Victoria in Future 2019 ndash
Population Projections 2016 to 2056 The State of
Victoria Department of Environment Land Water
and Planning
raquo Depledge M Galgani F Panti C Caliani I Casini
S amp Fossi M (2013) Plastic litter in the sea Marine
environmental research 92 279-281
raquo Eerkes-Meedrano D Thompson R C amp Aldridge
D C (2015) Microplastics in freshwater systems a
review of the emerging threats identification of
knowledge gaps and prioritisation of research
needs Water research 75 63-82
raquo Galgani F Hanke G Werner S Oosterbaan
Nilsson P Fleet D (2013) Guidance on monitoring
of marine litter in European seas European
Commission
raquo Gall S amp Thompson R (2015) The impact of debris
on marine life Marine Pollution Bulletin 92 170-179
raquo Gasperi J Wright S L Dris R Collard F Mandin
C Guerrouache M Langlois V Kelly F J Tassing
B (2018) Microplastics in air are we breathing it
in Current Opinion in Envi Sci amp Health vol 1 1-5
raquo Gewert B Plassmann M M MacLeod M (2015)
Pathways for degradation of plastic polymers
floating in the marine environment
Environmental Science Processes amp Impacts vol
17 no 9 pp 1513-1521
raquo Hoellein T J McCormick A R Hittie J London
M G Scott J W amp Kelly J J (2017) Longitudinal
patterns of microplastic concentration and
bacterial assemblages in surface and benthic
habitats of an urban river Freshwater science
35(3) 000-000
raquo Jambeck J R Geyer R Wilcox C Siegler T R
Perryman M Andrady A Narayan R amp Law K L
(2015) Plastic waste inputs from land into the
ocean Science 347 768-771
raquo Jepson P D Deaville R Barber J L Aguilar A
Borrell A Murphy S Barry J Brownlow A
Barnett J Berrow S Cunningham A A Davidson
N J Ten Doeschate M Esteban R Ferreira M
Foote A D Genov T Gimenez J Loveridge J
Llvona A Martin V Maxwell D L Papachlimitzou
A Penrose R Perkins MW Smith B De Stephanis
R Tregenza N Verborg P Fernandez A Law R J
(2016) PCB pollution continues to impact
populations of orcas and other dolphins in
European Waters Nature Science Reports 6 18573
raquo Kim JS Lee HJ Kim SK Kim HJ (2018) Global
Pattern of Microplastics (MPs) in Commercial
| 70 |
Food-Grade Salts Sea Salt as an Indicator of
Seawater MP Pollution Environ Sci Technol
2018 52 21 12819-12828
raquo Klein S Worch E Knepper T P (2015) Occurrence
and spatial distribution of microplastics in river
shore sediments of the Rhine-Main area in
Germany Environmental Science amp Technology
vol 49 no 10 pp 6070-6076
raquo Kowalczyk N Kelly A (2020) Litter and Flows
Connecting the Yarra and Bay Yarra Riverkeeper
Association
raquo Lamb JB Willis BL Fiorenza EA Couch CS
Howard R Rader DN True JD Kelly LA Ahmad
A Jompa J Harvell CD (2018) Plastic waste
associated with disease on coral reefs Science
359 460-462 (2018)
raquo Lavers J L Bond A L (2017) Exceptional and
rapid accumulation of anthropogenic debris on
one of the worldrsquos most remote and pristine
islands Proceedings of the National Academy of
Sciences 201619818
raquo Lavers J L Bond A L amp Hutton I (2014) Plastic
ingestion by Flesh-footed Shearwaters (Puffinus
carneipes) Implications for fledgling body
condition and the accumulation of plastic-derived
chemicals Environmental Pollution 187 124-129
raquo Lima A Costa M amp Barletta M (2014) Distribution
patterns of microplastics within the plankton of a
tropical estuary Environmental Research 132
146-155
raquo Ling S Sinclair M Levi C Reeves S amp Edgar G
(2017) Ubiquity of microplastics in coastal seafloor
sediments Marine Pollution Bulletin 121(1-2)
raquo Lusher A Hollman P Mendoza-Hill J (2017)
Microplastics in Fisheries and Aquaculture ndash
status of knowledge on their occurrence and
implications for aquatic organisms and food
safety Food amp Agriculture Organisation of the
United Nations Technical paper 615 Abstract V
raquo Mai L Bao LJ Shi L Wong CS Zeng EY (2018)
A review of methods for measuring microplastics
in aquatic environments Environ Sci Pollut Res
25 11319-11332 (2018)
raquo Mani T Hauk A Walter U amp Burkhardt-Holm P
(2015) Microplastics profile along the Rhine River
Scientific Reports 5 17988
raquo Mattson K Johnson E V Malmendal A Linse S
Hansson L-A Cedervall T (2017) Brain damage
and behavioural disorders in fish induced by
plastic nanoparticles delivered through the food
chain Scientific Reports volume 7 Article
number 11452 (2017)
raquo Melbourne Water (2018) Co-Designed Catchment
Program for the Maribyrnong Catchment Region
(including Moonee Ponds Creek) ndash October 2018 |
Version 1
raquo Melbourne Water (2018) Co-Designed Catchment
Program for the Yarra Catchment ndash October 2018
| Version 1
raquo Moore C amp Phillips C (2011) Plastic Ocean How a
sea captainrsquos chance discovery launched a
determined quest to save the oceans Avery
New York
raquo Murray F amp Cowie P R (2011) Plastic
contamination in the decapod crustacean
Nephrops norvegicus (Linnaeus 1758) Marine
pollution bulletin 62 1207-1217
References (cont)
R E F E R E N C E S
C O N T E N T S
| 71 |
raquo OrsquoFarrell K (2019) 2017-2018 Australian Plastics
Recycling Survey ndash National Report Envisage
Works Australian Government Department of the
Environment and Energy EPA NSW Sustainability
Victoria Government of Western Australia ndash
Department of Water and Environmental Regulation
raquo Orb Media (2017) Invisibles the plastics inside us
Orbmediaorgstoriesinvisibles_plastics
raquo Pattison M (2020) Analysis of microplastic
polymers in the Yarra and Maribyrnong Rivers
Unpublished Honours dissertation
raquo Rochman C M Hoh E Kurobe T amp Teh S J
(2013) Ingested plastic transfers hazardous
chemicals to fish and induces hepatic stress
Scientific reports 3
raquo Royer S-J Ferroacuten S Wilson S T Karl D M (2018)
Production of methane and ethylene from plastic
in the environment PLOS One 13(8) e0200574
raquo Sadri S S amp Thompson R C (2014) On the
quantity and composition of floating plastic debris
entering and leaving the Tamar Estuary Southwest
England Marine pollution bulletin 81 55-60
raquo Schwartz A E Ligthart T N Boukris E Van
Harmelen T (2019) Sources transport and
accumulation of different types of plastic litter in
aquatic environments A review study Marine
Pollution Bulletin 143 (2019) 92-100
raquo Sustainability Victoria (2019) Microplastics and
Port Phillip Bay - Citizen science study finds
significant amounts of microplastics on Port
Phillip Bay beaches Summary report
raquo Teuten E L Saquing J M Knappe D R Barlaz M
A Jonsson S Bjoumlrn A Rowland S J Thompson
R C Galloway T S amp Yamashita R (2009)
Transport and release of chemicals from plastics
to the environment and to wildlife Philosophical
Transactions of the Royal Society of London B
Biological Sciences 364 2027-2045
raquo Thompson R C Olsen Y Mitchell R P Davis A
Rowland S J John A W McGonigle D amp Russell
A E (2004) Lost at sea where is all the plastic
Science 304 838-838
raquo UNEP (2016) Marine plastic debris and
microplastics ndash Global lessons and research to
inspire action and guide policy change United
Nations Environment Programme Nairobi
raquo World Health Organisation (2019) Microplastics in
drinking water WHO Technical report
raquo Zeynep A Basak G (2019) Microplastics in the
environment A critical review of current
understanding and identification of future
research needs Environmental Pollution 254
(2019) 113011
raquo Yonkos L T Friedel E A Perez-Reyes A C
Ghosal S amp Arthur C D (2014) Microplastics in
four estuarine rivers in the Chesapeake Bay
USA Environmental science amp technology 48
14195-14202
raquo ZonMW (2019) httpswwwzonmwnlen
research-and-resultslife-sciences-health
programmasprogramme-detail
microplastics-health
Imag
e J
osi
e Jo
ne
s
Imag
e J
osi
e Jo
ne
s
Imag
e N
at S
ald
um
bid
e
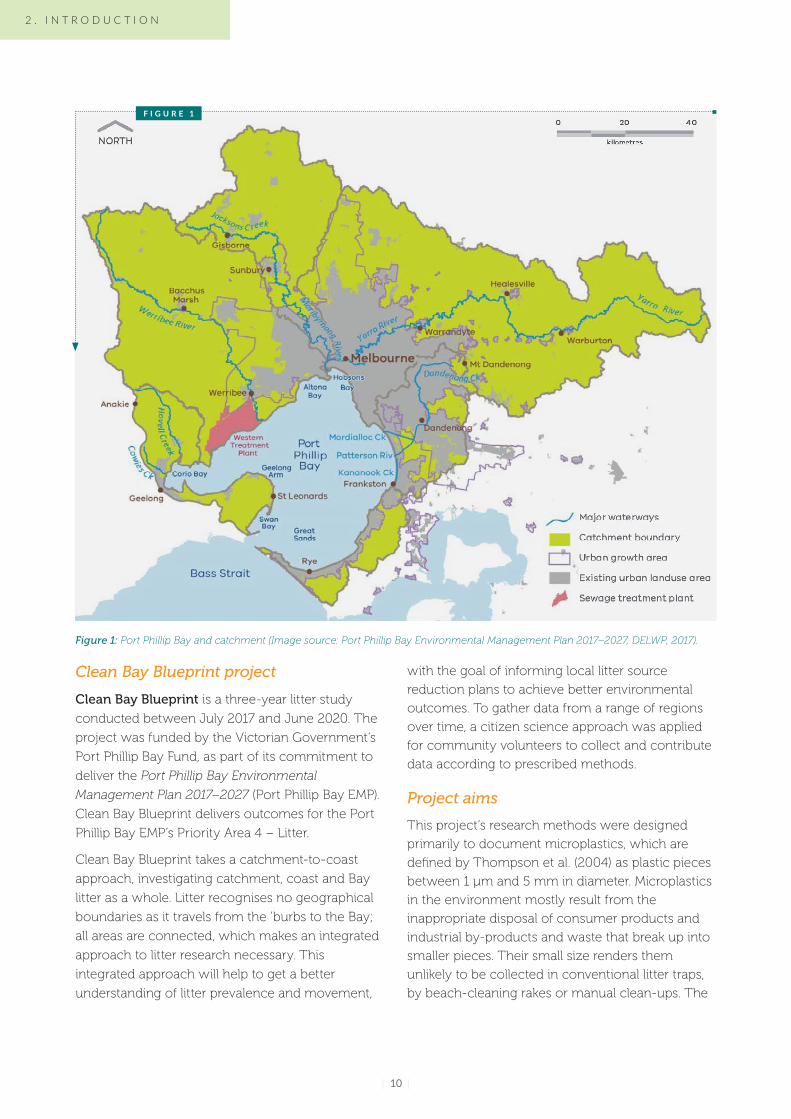
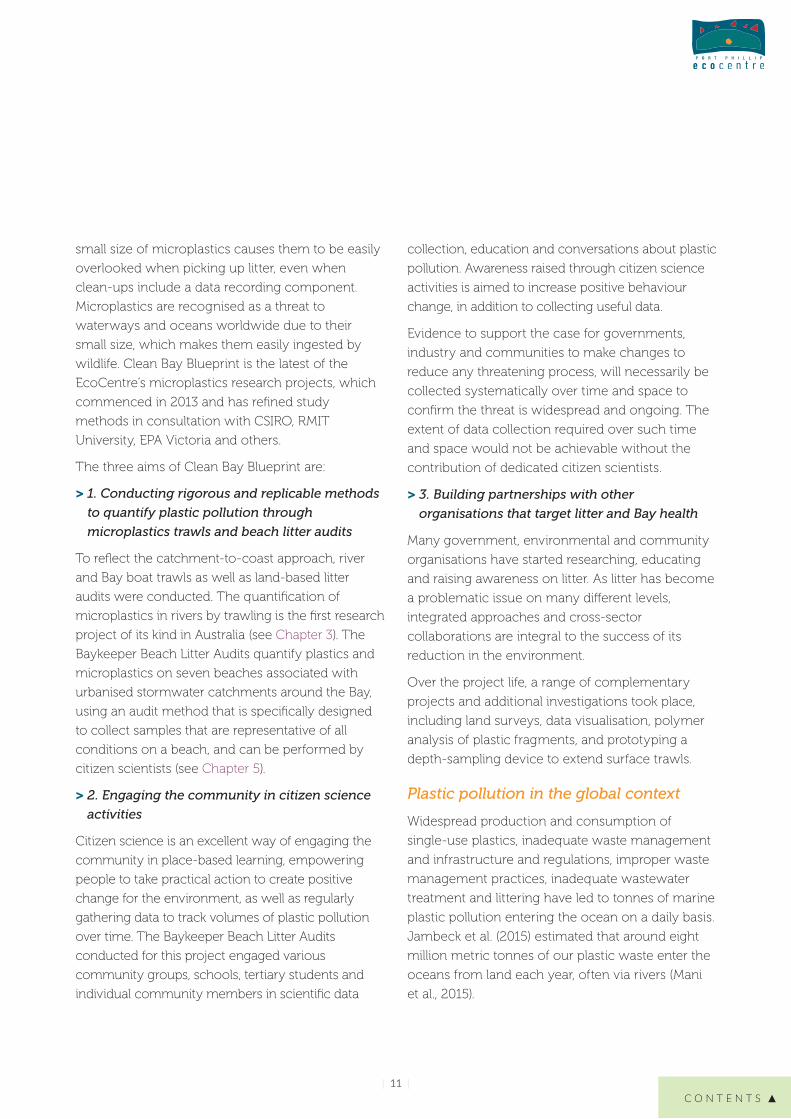
C O N T E N T S
| 11 |
small size of microplastics causes them to be easily
overlooked when picking up litter even when
clean-ups include a data recording component
Microplastics are recognised as a threat to
waterways and oceans worldwide due to their
small size which makes them easily ingested by
wildlife Clean Bay Blueprint is the latest of the
EcoCentrersquos microplastics research projects which
commenced in 2013 and has refined study
methods in consultation with CSIRO RMIT
University EPA Victoria and others
The three aims of Clean Bay Blueprint are
gt 1 Conducting rigorous and replicable methods
to quantify plastic pollution through
microplastics trawls and beach litter audits
To reflect the catchment-to-coast approach river
and Bay boat trawls as well as land-based litter
audits were conducted The quantification of
microplastics in rivers by trawling is the first research
project of its kind in Australia (see Chapter 3) The
Baykeeper Beach Litter Audits quantify plastics and
microplastics on seven beaches associated with
urbanised stormwater catchments around the Bay
using an audit method that is specifically designed
to collect samples that are representative of all
conditions on a beach and can be performed by
citizen scientists (see Chapter 5)
gt 2 Engaging the community in citizen science
activities
Citizen science is an excellent way of engaging the
community in place-based learning empowering
people to take practical action to create positive
change for the environment as well as regularly
gathering data to track volumes of plastic pollution
over time The Baykeeper Beach Litter Audits
conducted for this project engaged various
community groups schools tertiary students and
individual community members in scientific data
collection education and conversations about plastic
pollution Awareness raised through citizen science
activities is aimed to increase positive behaviour
change in addition to collecting useful data
Evidence to support the case for governments
industry and communities to make changes to
reduce any threatening process will necessarily be
collected systematically over time and space to
confirm the threat is widespread and ongoing The
extent of data collection required over such time
and space would not be achievable without the
contribution of dedicated citizen scientists
gt 3 Building partnerships with other
organisations that target litter and Bay health
Many government environmental and community
organisations have started researching educating
and raising awareness on litter As litter has become
a problematic issue on many different levels
integrated approaches and cross-sector
collaborations are integral to the success of its
reduction in the environment
Over the project life a range of complementary
projects and additional investigations took place
including land surveys data visualisation polymer
analysis of plastic fragments and prototyping a
depth-sampling device to extend surface trawls
Plastic pollution in the global context
Widespread production and consumption of
single-use plastics inadequate waste management
and infrastructure and regulations improper waste
management practices inadequate wastewater
treatment and littering have led to tonnes of marine
plastic pollution entering the ocean on a daily basis
Jambeck et al (2015) estimated that around eight
million metric tonnes of our plastic waste enter the
oceans from land each year often via rivers (Mani
et al 2015)
| 12 |
Two main types of hard microplastics are found
most often in waterways and oceans nurdles and
fragments (Barnes et al 2009) Nurdles also known
as pre-production pellets are the pre-fabrication
material for a wide range of industrial and
consumer plastic products They are classified as
primary plastics and they enter the aquatic
environment mainly through accidental spillage and
poor product management at processing plants
and during transport (Cole et al 2011) They are
spherical or flat-cylindrical in shape and are often
transparent or black although it is not uncommon
to find white red yellow and blue nurdles (picture
1) Hard plastic fragments are known as secondary
microplastics and are derived from the breakup of
larger plastic items They are irregular in shape and
vary greatly in colour due to their primary design
Once in the ocean microplastics can persist for
thousands of years (Andrady 2006) and have been
observed in marine systems worldwide (Cole et al
2011 Barnes et al 2009)
Picture 1 Nurdles (left) and hard plastics fragments (right)
In 2018 alone 359 million metric tonnes of plastic
were produced globally (Statista 2020) and
modelling by Borelle et al (2020) shows that
predicted levels of plastic lost in the environment
will be 53 million metric tonnes per year by 2030 if
no additional action is taken Because of plasticrsquos
durability and extreme mobility (it floats flies and
sinks) it eventually enters our waterways either by
accident or intentionally (Moore and Phillips 2011)
The large litter items frequently captured in this study
including straws lolly wrappers and plastic bottle
caps eventually deteriorate through physical
biological and chemical processes (Andrady 2011)
into tiny fragments that enter Port Phillip Bay at an
alarming rate and can be ingested by aquatic animals
gt Effects on living organisms
Marine plastic pollution has become an urgent
issue affecting wildlife in waterways and oceans
Worldwide at least 690 species have encountered
plastic pollution many of which are listed as
threatened species (Gall and Thompson 2015)
Ingestion of plastic including microplastics can
lead to injury (eg blocked digestive tracts and
organ rupture) and death (Lavers et al 2014)
Furthermore in addition to leachable chemicals
that are added in the manufacturing process itself
plastics adsorb (attract as an exterior film) organic
micro-pollutants or persistent organic pollutants
(POPs) which include polychlorinated biphenyls
(PCBs) Dichlorodiphenyldichloroethylene (DDE) and
nonylphenol (Teuten et al 2009) The ingestion of
these toxic chemicals is known to affect the
physiology and behaviour of organisms which
ultimately affects population stability as shown by
reproductive dysfunctions caused by PCBs in orca
and dolphin populations in Europe (Jepson 2016)
Lamb et al (2018) calculated that the likelihood of
disease in corals that are in physical contact with
plastics increases from 4 to 89 and that by 2025
an estimated 444 billion pieces of plastic items will
be entangled in coral reefs through the Asia-Pacific
Plastic chemicals bioaccumulate and biomagnify
up the food chain (Figure 2) This increasing
P I C T U R E 1
2 I N T R O D U C T I O N
C O N T E N T S
| 13 |
concentration of toxic chemicals in the tissues of
organisms at successively higher levels in a food
chain has been linked to disease and death in
several top predators (Gall and Thompson 2015)
Figure 2 The process of biomagnification of plastic
toxins up the food chain
Relatively few marine and freshwater systems in
Australia have been systematically investigated for
microplastic pollution This is of grave concern
considering coastal and estuarine systems around
Australia are some of the most biodiverse
ecosystems in the world More particularly the
relatively enclosed waters of Port Phillip Bay which
supports an aquaculture industry and a growing
recreational fishery are subject to runoff from
urbanised catchments The potential for marine
plastic pollution to cause environmental harm is
recognised as a global problem and is listed as one of
the greatest threats to marine biodiversity (Gall and
Thompson 2015 Depledge et al 2013) A review of
current understandings of microplastics in the
environment and future research needs by Zeynep
and Basak (2019) concluded that the extent and
effects of microplastic pollution in continental
environments such as rivers lakes soil and air is still
poorly understood Microplastic contamination of
aquatic environments will continue to increase for
the foreseeable future and at present there are
significant knowledge gaps on the occurrence in the
aquatic environment and organisms of the smaller
sized microplastics (less than 150 μm) and their
possible effects on seafood safety (Lusher et al
2017)
Several studies have shown that plastics are now
inside human bodies via our food (Kim et al 2018)
drinking water (Orb Media 2017) and even the air
we breathe (Gasperi et al 2018) It is currently
unknown what if any health effects there are on
human populations (WHO 2019) However in 2019
a research program started in the Netherlands
investigating the potential health effects of ingested
microplastics in humans (ZonMW 2019) Results of
these studies will be released in the near future
gt Climate impacts of plastics
Plastic is linked to climate impacts through
F I G U R E 2
| 14 |
emissions at multiple stages of its lifecycle
Greenhouse gas emissions happen at every step in
the lifecycle of a plastic product the extraction of
fossil fuels and transport plastic refining and
manufacture plastic waste management and the
ongoing impacts of it while polluting the
environment including the oceans (CIEL 2019)
Plastic continues to release greenhouse gases as it
photodegrades when littered (Royer 2018) and
produces methane when degrading in landfills
(Chidambarampadmavathy 2017) Plastic
production also requires large volumes of water in a
world with finite availability of clean freshwater
gt The cost of marine plastic pollution
The following paragraphs are taken from Toxic tide
the threat of marine plastic pollution in Australia a
report delivered to the Federal Senate by the
Environmental amp Communications References
Committee (Commonwealth of Australia 2016)
266 Professor Smith stated that lsquoa key
problem in determining the source of all items
is that fragmented plastics are often the most
numerous and there is no simple way to
determine their sourcersquo Professor Underwood
similarly told the committee that there is
lsquoinsufficient researchrsquo to answer the question
of where marine plastic pollution is sourced
296 Dr Britta Denise Hardesty CSIRO
commented that lsquothe cost of littering and
debris to fisheries small business and
human health remain poorly understood
and littering costs to local government due
to remediation and tourism losses are
substantialrsquo In answer to the committeersquos
questions concerning the estimates of the
damage from marine debris on Australiarsquos
tourism fishing and shipping the
Department of the Environment added that
it did not have any estimates nor did other
Commonwealth agencies including the
Great Barrier Reef Marine Park Authority the
Australian Maritime Safety Authority and the
Australian Fisheries Management Authority
Other than projects funded by the Port Phillip Bay
Fund there has been limited research to address
knowledge gaps in relation to sources and ecosystem
impacts of plastic pollution across Australia since the
release of the Senate Inquiry report in 2016
Plastic pollution in Victoria
Locally Port Phillip Bay and surrounding waters are
supporting an ecosystem that is home to an
estimated 10000 species with many of those
species unique to the Bay1 Most plastic pollution in
Port Phillip Bay originates from land-based sources
Diverse sources include urban streets freeways and
roadside verges stormwater drains wastewater
treatment plants and river and creek runoff
Although plastic pollution has been repeatedly
identified as a major threat to Victorian waterways
there has been limited scientific assessment since
the Melbourne Water Tagged Litter Study in 1993
The EcoCentrersquos Yarra and Maribyrnong river trawls
commenced in 2014 the Litter Trackers project by
RMIT and Melbourne Water was conducted in 2019
and Sustainability Victoria recently conducted a
microplastics study on six beaches around the Bay
In this study they found between 167 and 1232
microscopic microfibres from clothing per kilogram
of sand (Sustainability Victoria 2019)
The Yarra Riverkeeper Association removed
approximately 8000 kg of waste from the Yarra and
Maribyrnong between 2017 and 2020 (Kowalczyk
and Kelly 2020) with some of the most common
collected items being foam insulation and
packaging plastic bottles and cigarette butts Both
this project and their 2020 polystyrene study in
1 httpswwwmarineandcoastsvicgovaugrants port-phillip-bay-fund
2 I N T R O D U C T I O N
C O N T E N T S
| 15 |
A close-up of the Balcombe Estuary nurdles
collaboration with Clean Water Group point to
polystyrene being a major waterway pollutant in
metro Melbourne (Barmand et al 2020)
Community groups such as Beach Patrol Bellarine
Catchment Network various Friends groups and
others across the catchments spend countless
hours of people power cleaning up beaches and
waterways Over the last few years the EcoCentre
has played a role in shifting the general focus from
merely picking up and disposing of the litter to
collecting data on what is found to be used in
advocacy efforts to reduce plastic pollution in the
environment Since February 2018 Scouts Victoria
and the EcoCentre have collaborated in the state
governmentndashfunded Street2Bay project
conducting litter audits with particular attention to
microplastics on streets in all catchments
around the Bay
Bandalong litter trap in the Yarra
| 16 |
Policy context
gt Australia
From 2018 Chinarsquos new bans and 995 purity
standards for uncontaminated recyclables left
Australia with large stockpiles of items now needing
onshore processing Extensive ripple impacts of this
challenge ndash from facility fires to paying fees to send
recyclable plastics to landfill ndash have compelled
significant rethinking of Australian waste
management systems including materials redesign
reduction re-use and recycling Industry bodies
and the Australian Government considered plastics
and other materials in a range of commitments and
aspirations towards an Australian circular economy
in which lsquowastersquo and pollution are designed out
and products and materials are kept in use through
principles such as repair and maximising use of
recycled materials over virgin resources
Australiarsquos National Waste Policy Less waste more
resources (Commonwealth of Australia 2018) and
National Waste Policy Action Plan (2019) apply the
lsquoprinciples of a circular economy to waste
management to support better and repeated use of
our resourcesrsquo The targets include reducing
Australian waste by 10 per capita by 2030 and to
lsquophase out problematic and unnecessary plastics by
2025rsquo Waste policies focus on plastic diversion from
landfill however plastic uncontained by
management systems (eg lost as litter dumping or
spillage) becomes pollution of ecological and
economic concern due to its persistence in the
environment On 18 June 2015 the Senate referred
the threat of marine plastic pollution in Australia for
parliamentary inquiry and report by 8 April 2016
The final report Toxic tide the threat of marine
plastic pollution in Australia was presented on 20
April 2016 (Commonwealth of Australia 2016) The
need for systematic data collection on the extent of
plastic pollution was stated in Recommendation 1
of the report
Blair Stafford conducting a microplastics trawl in the Bay with a manta net
2 I N T R O D U C T I O N
C O N T E N T S
| 17 |
2 httpsnicholasinstitutedukeeduplastics-policy-inventory
The committee recommends that any future
Australian Government policies on mitigating
the threat from marine plastic be underpinned
by sound peer-reviewed research
gt Victoria
Plastic pollution is relevant under a range of Victorian
policies and strategies to manage waste and protect
human health and biodiversity In some instances
plastic pollution is discussed explicitly as in the
plastic bag ban (Environment Protection
Amendment Act 2019) or Recycling Victoria lsquoKey
Commitment 3 Address plastics pollutionrsquo Managing
plastics can also fall under broader principles such as
the goal lsquoVictoriarsquos natural environment is healthyrsquo in
Biodiversity 2037 the lsquowastes hierarchyrsquo principle of
environmental protection in the Environmental
Protection Act Victoria (1970) and the introduction of
General Environmental Duty in the Environment
Protection Amendment Act 2018 The General
Environmental Duty requires all Victorians to manage
risks to human health and the environment that their
activities create and becomes active from July 2021
Studies that quantify the effects and extent of
microplastics are necessary to inform policy
frameworks that reduce plastic pollution establish
waterway management strategies and assess
biodiversity health Interim results of the Clean Bay
Blueprint study have helped inform government
documents including
raquo State of the Yarra and its Parklands (2018) ndash
Commissioner for Environmental Sustainability
Victoria
raquo Assessment of the Values of Victoriarsquos Marine
Environment (2019) ndash Victorian Environmental
Assessment Council
A written submission by the EcoCentre to the 2018
review of the State Environment Protection Policy
(Waters) using the results of EcoCentre
microplastics studies led to lsquoplastics and
microplasticsrsquo being added to the list of legally
defined waterway pollutants in Victoria
Prior to the EcoCentrersquos research plastic and
microplastic pollution were not reported in
Victorian State of the Environment reports nor
specifically included in legislated protections
gt Worldwide
The United Nations Sustainable Development Goals
(SDGs) are 17 interlinked goals to achieve lsquoa better and
more sustainable future for allrsquo The management of
plastic materials relates to several SDGs
raquo Goal 12
Responsible production and consumption
raquo Goal 13 Climate action
raquo Goal 14 Life below water
raquo Goal 15 Life on land
The United Nations Environment Programme
(UNEP) has produced numerous studies on plastic
pollution and prevention in the last five years
Assessing policy efforts in 60 countries around the
globe the UNEP reports Single-Use Plastics
Roadmap to Sustainability (2018) includes ten
recommendations including (1) target the most
problematic single-use plastics by collecting
baseline data (5) raise public awareness (7) provide
incentives to industry and (9) enforce new
measures effectively
In 2020 Duke University launched a Plastics Policy
Inventory2 as a searchable database of public policy
documents targeting plastic pollution This includes
the language year enacted location and
jurisdictional level This document is updated
quarterly due to the rapidly evolving nature of policy
responses to address the health economic and
amenity threats of plastic and microplastic pollution
Melbourne City over the Yarra River
3
C O N T E N T S
| 19 |
Microplastics in the Yarra and Maribyrnong RiversThe first ever litter trawls done in rivers in Australia were conducted by the EcoCentre in 2013 The resulting report Pilot study to identify the extent of
microplastics in the Maribyrnong and Yarra Rivers and Port Phillip Bay (July 2014) showed that microplastics were present in Melbournersquos two largest rivers As a result of this pilot study monthly trawls were continued through the Turn off the Tap project (2014ndash2017) funded by the Victorian Government The final samples of this study spiked in microplastic litter which seemed to show an upward trend over time indicating further investigation was warranted Subsequently the Port Phillip Bay Fund funded Clean Bay Blueprint (2017ndash2020) for another three years of continuous research This report presents analysis of the outputs from both these projects and uses the full 55 years of data collected
Aims of the microplastics study
Within Clean Bay Blueprint the quantification of
plastics and microplastics in Melbournersquos two largest
rivers was done as a contained research study
which continued from a previous dataset collected
between 2015 and 2017 Its aims were the following
gt Quantifying plastic pollution to inform
legislative reform and behaviour change
When trawls commenced in 2014 there was no
reported evidence of the ongoing presence of
microplastic pollution in the rivers and Bay apart
from personal observations As legislative reform
and management decisions around litter need to be
driven by scientific evidence the first aims of the
study were to confirm the presence and quantify
the extent of the pollution
gt Tracking changes in litter over time and
establishing a baseline
Once presence is established the next step is to
monitor litter loads over time in order to track if
volumes increase or decrease Continuous
monitoring measures a baseline state of the river
which can be used to measure the effectiveness of
anti-litter measures taken to reduce the loss of
certain items in the environment In addition
monitoring allows researchers to notice unusual
spikes in litter loads or items that may have been
the result of mass spills and one-off pollution
events and might otherwise go unnoticed
gt Identifying the source of litter items
By tracking and quantifying the different litter items
encountered (eg polystyrene balls plastic drinking
straws cigarette butts) it may be possible to identify
| 20 |
their potential source locations This evidence could
be used to inform localised source reduction plans to
prevent an item type from entering the environment
in the first place Anecdotally known problem items
were analysed as distinct categories to learn more
about their prevalence in the waterways
Study method
gt Study site
The Yarra River flows 242 km from its source in the
forested Yarra Ranges National Park through to
central Melbourne where it enters Port Phillip Bay
More than one-third of Victoriarsquos population lives in
the Yarra catchment which covers about 4000 km2
(Barua et al 2013) The catchment includes 40
rivers and creeks including the Maribyrnong River
which runs for 160 km from its source on the
slopes of Mount Macedon The Maribyrnong
catchment covers 1408 km2
The trawl sites were selected on the basis of being
close to the lower reaches of each river and
therefore indicative of the total pollution load of each
respective catchment (Figures 3 and 4) The
Maribyrnong trawls commenced at the Water
Canon Jetty extending from the west bank of Coode
Island 300 m upstream from the Yarra The Yarra
trawls commenced underneath Bolte Bridge 25 km
upstream of the Yarra and Maribyrnong confluence
Figure 3 The locations of the Maribyrnong and Yarra catchments relative to the centre of Melbourne Images courtesy of Melbourne Water
Figure 4 Approximate trawl location transects in the Maribyrnong and Yarra Rivers
gt River trawls
A manta net designed to collect floating debris off
the waterrsquos surface was deployed from the side of
the boat and positioned outside of the wake zone
(picture 4A) Trawling was done according to
internationally standardised methods by Galgani
et al (2013) in each river all trawls commenced at
the same place travelling upstream for 30 minutes
with the boat motor operated at a constant 1000
rpm to operate the net effectively and maintain a
consistent speed for all trawls After 30 minutes the
net was retrieved the collection net (cod end)
removed (picture 4B) and placed in a container to
be dried in preparation for sorting and categorising
the contents
Between January 2015 and February 2020 a total of
113 monthly trawls were conducted in the
Maribyrnong and Yarra Rivers Both rivers were
trawled on the same day The distance covered in
each trawl varied slightly due to the effects of
different tides and prevailing wind conditions
encountered at the time While trawls were generally
done in a straight line river boating involves
changing course to safely navigate around other
watercraft that may be encountered and the course
of the trawls in each river was not rigidly defined
The lsquomouthrsquo of the manta net measures 600 mm
wide x 200 mm deep The net is 3 m long tapering
down to a 30 x 10 cmsup2 cod end Both the tapering
net and cod end are made of a 330 nm mesh size
The manta net is of the same specifications used
3 M I C R O P L A S T I C S I N T H E Y A R R A A N D M A R I B Y R N O N G R I V E R S
F I G U R E 4
F I G U R E 3
C O N T E N T S
| 21 |
by the 5 Gyres Institute to measure microplastics in
international studies In a recent review of methods
that measure microplastics in aquatic
environments Mai et al (2018) confirmed that this
collection method is recommended for large-scale
surface water sampling
gt Sample analysis method
Sample sorting was performed by trained citizen
scientists (picture 5) Dried trawl samples were
analysed by separating litter items from organic
matter with the naked eye using tweezers and
supplemental lighting Litter items were next sorted
by item type and the diameter measured with a
ruler after which the item was placed in the
corresponding size category Litter categories
included hard plastic fragments lt 2 mm hard
plastic fragments 2 mmndash5 mm hard plastic
fragments 6ndash10 mm hard plastic fragments gt
10 mm polystyrene beads lt 4 mm polystyrene
beads ge 4 mm plastic bottle caps plastic straws
soft plastics lt 5 mm soft plastics ge 5 mm lolly
wrappers cellophane lt 5 mm cellophane ge 5 mm
plastic pre-production pellets (nurdles) cigarette
butts twine sponge (synthetic sponge-like
materials) and lsquootherrsquo items which included
unidentified non-organic looking items
Internationally accepted guidelines define plastic
pieces smaller than 5 mm in diameter as
microplastics (Thompson et al 2004) In this study
the categories of hard plastic fragments lt 2 mm
hard plastic fragments 2 mmndash5 mm soft plastics lt
5 mm cellophane lt 5 mm nurdles and polystyrene
beads lt 4 mm were grouped into the microplastic
category Plastic items not visible to the naked eye
including microfibres were excluded from this study
due to logistical technical and funding constraints
Picture 4 A Manta net deployed on side of Yarra Riverkeeper vessel B Removable cod end used to collect microplastic samples
Picture 5 Citizen scientists sorting trawl samples at the EcoCentre
P I C T U R E 5
P I C T U R E 4 A P I C T U R E 4 B
| 22 |
Trawl data analysis results
The results of the sample analysis show
substantial concentrations of plastic litter
present in the Yarra and Maribyrnong Rivers
across all months of the year A total of 40030
litter items were captured and analysed from
the Yarra and 13658 litter items from the
Maribyrnong between January 2015 and
February 2020 An average of 690 litter items
were collected from the Yarra per monthly
trawl while an average of 248 litter items
were collected from the Maribyrnong per
monthly trawl
Because the Yarrarsquos width in the trawl location
is more than 160 times wider than the net and
the Maribyrnongrsquos width in the trawl location
is 120 times wider the actual extrapolated
volume of litter in both rivers is astounding
For the Yarra the rough calculation is
690 litter items x 48 half-hour sessions
day x 365 days x 160 times net width
yielding 1934208000 litter items
entering the Bay from the Yarra
annually
For the Maribyrnong this calculation is
248 litter items x 48 half-hour sessions
day x 365 days x 120 times net width
yielding 521395200 litter items
entering the Bay from the
Maribyrnong annually
Figure 5 Relative litter composition of items flowing into Port Phillip Bay from the Maribyrnong and Yarra rivers combined
Figure 6 Litter composition in trawl samples obtained from the Maribyrnong River
Figure 7 Litter composition in trawl samples obtained from the Yarra River
F I G U R E 5
F I G U R E 7
F I G U R E 6
3 M I C R O P L A S T I C S I N T H E Y A R R A A N D M A R I B Y R N O N G R I V E R S
C O N T E N T S
| 23 |
These calculations suggest that an average total of
2455603200 litter items flow into Port Phillip
Bay annually from surfaces of the Yarra and
Maribyrnong Rivers combined
It should be noted that since these litter items are
only caught in the surface waters (upper 200 mm)
this number is likely to be an underestimation of the
overall plastic pollution loading in each river
Different types of plastic display different levels of
buoyancy characterised as either positively
buoyant (floating at the surface) negatively buoyant
(sinks to the bottom) or neutrally buoyant (in the
water column) It is unknown how many items are
present in the water column or the sediments of
Melbournersquos waterways
gt Litter reaching Port Phillip Bay
Based on the 53688 litter items caught and
analysed the composition of litter entering Port
Phillip Bay shows that hard plastic fragments are by
far the most prevalent litter item (75) followed by
polystyrene (13) and soft plastics (10) (Figure 5)
Trawl samples weighed an average of
approximately 266 g most of which was organic
plant matter On average litter comprised 184 of
the total sample weight highlighting the
pervasiveness of litter in our waterways Over time
this percentage has stayed quite constant (see
Appendix 1)
gt Comparing the rivers
Hard plastic fragments polystyrene and soft
plastics were the most common items found in
both the Yarra and Maribyrnong (Figures 6 amp 7)
Hard plastic fragments made up the bulk of the
captured litter items comprising 74 of capture for
the Yarra and 76 of items captured in the
Maribyrnong
Polystyrene was the second most captured item
with 15 of items in the Yarra and 8 of items in
the Maribyrnong being polystyrene
Soft plastics (consisting of
cellophane lolly wrappers and
unidentifiable soft plastics) made up
9 of total items captured in the
Yarra and 13 in the Maribyrnong
When comparing the total litter
counts between rivers we found a
significant difference between the
Maribyrnong and Yarra Rivers
(chi-squared = 12954 df = 1 P lt
0001) with plastic litter overall more
likely to be found in the Yarra than
the Maribyrnong (Figure 8)
F I G U R E 8
Figure 8 Comparison of number of litter items in Maribyrnong and Yarra rivers
| 24 |
There is also an overall significant effect of the
rivers on distribution of plastics by item category
(chi-squared = 74726 df = 9 P lt 0001 Figure 9)
There are no significant differences in
proportions of hard plastic fragments in the
Maribyrnong or Yarra rivers (P gt 005)
There are proportionally more soft plastics
nurdles plastic bottle caps plastic straws
twine and cigarette butts in the Maribyrnong
river Conversely proportionally less of the
same items are in the Yarra river (P lt 005)
meaning that these items make up a higher
proportion of total litter counts in the
Maribyrnong than they do in the Yarra (see
Appendix 2)
When comparing polystyrene loads to the
expected proportions of polystyrene (based
on the total counts for the rivers) the
proportion of polystyrene is significantly less
than expected (P lt 005) in the Maribyrnong
and significantly more than expected in the
Yarra (P lt 005) this means polystyrene is
more likely found in the Yarra than in the
Maribyrnong
The proportion of lsquootherrsquo items is
significantly above expected in the
Maribyrnong (P lt 005) but for the Yarra
the proportion of lsquootherrsquo items was
nonsignificant (P gt 005)
F I G U R E 9
F I G U R E 1 0
Figure 9 Comparison of mean monthly number (plusmnSE) of litter items captured by the manta net in the Maribyrnong and Yarra Rivers between January 2015 and February 2020 Note that values shown are means but statistical tests were conducted on frequency of counts using chi-squared analyses (ie the standard errors should not be used to infer anything about statistical significance They are rough indicators of variation around a mean only)
Figure 10 Comparison between rivers of the total number of microplastics captured during river trawls
3 M I C R O P L A S T I C S I N T H E Y A R R A A N D M A R I B Y R N O N G R I V E R S
C O N T E N T S
| 25 |
In both rivers microplastics formed the bulk of litter
and accounted for 85 (34013 pieces) of the total
load in the Yarra and 83 (11388 pieces) of the
Maribyrnong load (Figure 10) Hard plastic
fragments lt 2 mm in length dominated the
microplastics category and accounted for 45 and
51 of microplastics in the Yarra and Maribyrnong
respectively
Of the earlier mentioned total litter items entering the
Bay microplastics make up nearly 85 which means
more than 2 billion (2076458066) microplastics flow
from the two rivers into the Bay every year
gt Analysis of plastic polymer types
Sorted trawl samples from July 2016 to August 2019
were sent to the Plastics Lab at RMIT where they
were analysed for plastic polymer types using
Fourier Transform Infrared Spectroscopy (FTIR)3
There are many polymer types each of which has
varying qualities that align it to typical uses
products or applications Through FTIR analysis
microplastics or fragments may be grouped
according to probable source products
In both the Yarra and the Maribyrnong rivers
polyethylene (PE) was the most prevalent polymer
(48 and 49 respectively) followed by
polypropylene (PP) (22 and 24 respectively)
polystyrene (PS) (15 and 79 respectively)
The Yarra River saw small amounts of 11 other
polymers each of which contributed less than 1
and 067 of samples were of an unknown
material The Maribyrnong saw a small abundance
of other polymers ranging from 1 to 005 and
had 088 of unknown material (see Appendix 3)
The two rivers showed similar trends over the
months for all three of the most prevalent polymers
The abundance of PE and PP did not statistically
differ between the Yarra and Maribyrnong (P = 067
P = 056 respectively) however PS was statistically
lower in the Maribyrnong (P = 002)
Interestingly polyethylene terephthalate (PET) and
polyvinylchloride (PVC) are some of the most
commonly produced and used plastics yet were
some of the least recorded in both the Yarra and
Maribyrnong Rivers
gt Seasonal differences in litter
There are significant effects of the seasons and the
rivers on the total count of litter (chi-squared =
12429 df = 3 P lt 0001) A comparison of total litter
by trawl indicates that there is more total litter in the
Yarra than in the Maribyrnong in any season There
was more litter in summer in both rivers However
proportionally in the Maribyrnong has more litter
in spring and autumn than is expected by chance
whereas in the Yarra the clear peak seasons are
summer and winter (Figure 11)
In summer and winter plastic litter is proportionally
higher in the Yarra than the Maribyrnong (P lt 005
for both seasons) In autumn and spring plastic litter
is proportionally higher in the Maribyrnong than the
Yarra (P lt 005 for both seasons)
Figure 11 Seasonal variation in the number of captured litter items in the Maribyrnong and Yarra Rivers between January 2015 and February 2020
3 This summary of results was used with permission from an unpublished Honours dissertation by M Pattison (2020)
F I G U R E 1 1
| 26 |
gt Changes in litter over time
The five years of data collection reveal large
increases in litter over time (Figure 13) Note the
difference in numbers on the y-axes when
comparing the rivers
Both rivers are showing a significant increase in
plastics over the sampling period although the trend
is somewhat more pronounced in the Yarra (tau =
017 z = 745 P lt 0001) than in the Maribyrnong (tau
= 010 z = 416 P lt 0001) (Figure 14)
Note the differences in percentages on the y-axes of
the respective rivers in Figures 15 and 16 which
show how much faster the Yarrarsquos litter has been
increasing over the last five years When combining
the above litter numbers and percentages there is a
similar increasing trend in litter en route to Port
Phillip Bay (Figure 17) It is unclear why there was
such an extreme increase in litter in the Yarra in 2017
The above results warranted a closer examination
of the changes in litter item categories over time
In the Maribyrnong hard plastic fragments soft
plastics and lsquootherrsquo are increasing over time
(P lt 005) (Figure 18)
Figure 19 shows that in the Yarra hard plastic
fragments soft plastics polystyrene sponge and
lsquootherrsquo in the Yarra are increasing over time (P lt 005)
However plastic straws are significantly decreasing
over time (z = -234 tau = -025 P = 0019)
All other plastics are steady showing neither a
significant increase nor decrease See Appendix 4
for more details
F I G U R E 1 2
Figure 12 shows more detailed litter item
distributions over the seasons for the separate
rivers Hard plastic fragments remain the largest
category of items throughout all seasons in both
rivers followed by polystyrene and soft plastics
Figure 12 Seasonal variation in the total number of captured litter items in the Maribyrnong and Yarra Rivers between January 2015 and February 2020 Note the difference in total litter items captured on the y-axes
Figure 13 Total number of captured litter items in the Maribyrnong and Yarra Rivers presented by trawl between January 2015 and February 2020 The labels indicate year month and trawl number A total of 62 paired trawls were conducted during this time Several litter spikes were recorded
Figure 14 Litter trends over time Litter in both rivers is increasing with litter in the Yarra increasing faster than in the Maribyrnong
3 M I C R O P L A S T I C S I N T H E Y A R R A A N D M A R I B Y R N O N G R I V E R S
C O N T E N T S
| 27 |
F I G U R E 1 3
F I G U R E 1 4
| 28 |
Baykeeper and Riverkeeper trawling for microplastics
F I G U R E 1 5 F I G U R E 1 6 F I G U R E 1 7
3 M I C R O P L A S T I C S I N T H E Y A R R A A N D M A R I B Y R N O N G R I V E R S
C O N T E N T S
| 29 |
Figure 15 Above Actual numbers of microplastics in the Maribyrnong Below Percentage increase in microplastics year-on-year
Figure 16 Above Actual numbers of microplastics in Yarra Below Percentage increase in microplastics year-on-year
Figure 17 Above Actual numbers of microplastics flowing to Port Phillip Bay Below Percentage increase in microplastics year-on-year
Figure 18 The number of plastic items by category across time in the Maribyrnong River (measured by trawl number) Note that axis scales are different for each plastic category Significant relationships are marked by an asterisk ()
F I G U R E 1 8
C O N T E N T S
| 30 |
F I G U R E 1 9
Figure 19 The number of plastic items by category across time in the Yarra River (measured by consecutive trawl numbers) Note that y-axis scales are different for each plastic category Statistically significant relationships are marked by an asterisk ()
Figure 20 Plot of microplastic count in both Yarra and Maribyrnong between 2015 and 2019 as a function of Melbournersquos population
Figure 21 Regression analysis showing a positive correlation between litter items captured and rainfall data Note that microplastic count was square root transformed to meet assumptions of a regression analysis
3 M I C R O P L A S T I C S I N T H E Y A R R A A N D M A R I B Y R N O N G R I V E R S
C O N T E N T S
| 31 |
gt Factors driving litter increases and spikes
A series of regression analyses were performed to
see what environmental factors could be driving
the increases in litter and some of the unusually
high litter counts in some of the trawls
Worldwide plastic pollution is usually positively
correlated with increases in population This indeed
applied in the Yarra and Maribyrnong as well with a
significant association between population in the
Greater Melbourne area from 2015 to 2019 and
counts of microplastics (t = 54 P = 0012)
Approximately 876 of the variation in microplastic
counts was explained by population numbers over
this time (adjusted R2 = 0876 Figure 20) which
indicates a very strong correlation
A regression analysis shows that the count of
microplastics was positively associated with total
rainfall in the previous 48 hours (t = 41 P lt 0001
Figure 21) Approximately 122 of the variation in
microplastic counts in the rivers was explained by
rainfall (adjusted R2 = 0122)
Rainfall data for the Maribyrnong was taken from
the Bureau of Meteorologyrsquos (BOM) weather station
at Melbourne Airport Rainfall data for the Yarra was
taken from the BOMrsquos Eltham weather station
To explain some of the high spikes in litter in the
Yarra two potential factors were tested for
Bandalong litter traps
The method of emptying the floating Bandalong
litter traps is focused on removing larger litter items
(gross pollutants) and does not allow for the
containment of microplastics The 2015ndash2020 dates
of the emptying of the traps in the Yarra River were
sourced from Parks Victoria Although there were
preliminary indications of litter spikes potentially
being caused by litter trap maintenance there
seemed to be no evidence of a correlation with the
data available (see Appendix 5) However additional
information sourced from Melbourne Water just
before finalising this report indicates that a more
targeted approach to investigating microplastics
leakage from Bandalong traps is appropriate Please
refer to the Yarra and Maribyrnong microplastics
research discussion below
There are currently no Bandalong litter traps in the
Maribyrnong river
Environmental water flow releases In drier periods of the year environmental water
flows are released on a needs basis from the upper
Yarra catchment to maintain the ecosystem health
of the networks of billabongs and wetlands
connected to the Yarra As these flows have the
potential to flush out litter caught in various places
along the river data on environmental water flow
releases between 2015 and 2020 were sourced
from Melbourne Water However a regression
analysis showed that there was no significant
association between environmental flow events
and plastic counts in the Yarra See Appendix 6 for
more details
F I G U R E 2 0
F I G U R E 2 1
| 32 |
Yarra and Maribyrnong microplastics research discussion
Clean Bay Blueprint and the preceding EcoCentre
projects are the first studies to investigate
microplastic loads in the Yarra and Maribyrnong
Rivers and provide the first estimation of microplastic
loads entering Port Phillip Bay on an annual basis
Every one of the 113 trawl samples analysed
between January 2015 and February 2020 contained
plastic pollution mostly consisting of microplastics
Nearly 25 billion pieces of plastic flow into Port
Phillip Bay annually from the surface waters of the
two major rivers of which over 2 billion are
microplastics smaller than 5 mm in diameter
These results are expected to be underestimations
of the litter volume entering the Bay as it does not
take into account the depth of the river and the fact
that high-density particles with additives or other
attachments and larger items will sink below the
level of trawled surface area (Mai et al 2018
Pattison 2020) As the mesh size of the net was
330 nm and sorting and counting of microplastics
was done with the naked eye particles smaller than
what could be caught in the net or observed and
confirmed as plastics during sorting (including
microfibres and nanoparticles) were not included It
must therefore be emphasised that total plastic
pollution numbers in the rivers are likely to be
much higher than the numbers in this report and
preventative and mitigating actions to reduce
plastic pollution are urgently required
gt Litter increases
An alarming result of this study is that litter is
increasing in both the Maribyrnong and the Yarra
with plastic pollution in the Yarra increasing at a
much faster rate The rate at which plastic pollution
in both rivers is increasing is very high litter in the
Yarra increased by 400 in 2017 compared to 2016
and then in 2019 it again more than doubled
compared to 2018 levels The Maribyrnong saw a
more gradual increase over time but still increased
by around 57 to 83 year on year since 2017
The Yarra exceeded the Maribyrnong in terms of
expected plastic pollution loads in 2016 (Charko
et al 2018) These changes are mostly driven by
increases in hard and soft plastic fragments and
polystyrene rather than the other categories of litter
meaning these are the litter categories that should
be addressed immediately at their source
As this study shows a very strong positive
correlation of plastic pollution with population
growth in Melbourne and the population of Greater
Melbourne is projected to grow from 5 million to 9
million by 2056 (DELWP 2019) it is expected that
plastic pollution increases will continue until
effective source reduction measures are taken
Nearly 25 billion pieces of plastic flow into
Port Phillip Bay annually from the surface waters
of the two major rivers of which over 2 billion are
microplastics smaller than 5 mm in diameter
3 M I C R O P L A S T I C S I N T H E Y A R R A A N D M A R I B Y R N O N G R I V E R S
C O N T E N T S
| 33 |
gt Litter composition in the rivers
Sample analyses revealed that hard plastic fragments
polystyrene and soft plastics were the most
common items captured Despite the manta netrsquos
selectivity to small buoyant items the sample results
largely align with several other local litter audits
Litter audits along the Westgate Park foreshore and
along St Kilda beaches between 2015 and 2017
revealed polystyrene packaging and soft plastics
(bits of plastic bags wrap cellophane etc) are the
second and third most dominant litter categories
after cigarette butts4 Hard plastic fragments were
the most captured items in manta net trawls in the
Bay (see Chapter 4) and the second most prevalent
litter items found on beaches around the Bay using
the Baykeeper Beach Litter Audit method to
monitor for microplastics (see Chapter 5)
Polystyrene is the most captured litter item in the
Bandalong litter traps in the Yarra River (Kowalczyk
and Kelly 2020) As cigarette butts much like other
heavier items sink after a relatively short period in
water and pass under the manta net their numbers
in the Yarra and Maribyrnong River trawls do not
align with general beach clean-up data where
cigarettes often dominate In addition beach
clean-up efforts are typically geared towards the
collection of large litter items Consequently hard
plastic fragments and microplastics are not
systematically recorded in litter clean-ups
In general trawl findings provide a fairly robust
representation of the microplastic pollution issue
providing valuable information about the
composition and relative abundance of dominant
buoyant litter items entering Port Phillip Bay
It is worth noting that hard plastic fragments
polystyrene and soft plastics also dominate
microplastic pollution in other urbanised
catchments around the globe These items were
the most abundant litter types collected in trawls in
the New York-New Jersey Harbour estuary USA
one of the most urbanized estuaries on earth (S
Meola New YorkndashNew Jersey Baykeeper pers
comm 2015) Similarly hard plastic fragments
polystyrene and plastic foil dominated microplastic
loads along the length of the Rhine River in Europe
(Mani et al 2015) This is not surprising given that
worldwide the packaging industry the primary
material source of microplastics in this study is the
third largest after food and energy (Moore and
Phillips 2011) and around 11 of plastic waste
generated gets lost in the environment (Borelle
et al 2020) where it breaks up into smaller pieces
under the prevailing environmental conditions
It is clear that the Yarra has much higher total litter
counts than the Maribyrnong This is probably
because the Yarrarsquos catchment area (4046 km2) is
larger than the Maribyrnongrsquos (1408 km2) and land
use between the catchments differs apart from the
Upper Yarra region the Yarra River catchment
includes 43 times more of urbanised area than the
Maribyrnong The respective Catchment Region
documents from Melbourne Waterrsquos Healthy
Waterways Strategy state that in the Maribyrnong
catchment
raquo about 10 retains its natural vegetation
(1408 km2)
raquo 80 is used for agriculture (11264 km2)
raquo 10 is urban development Greater Melbourne
and larger townships (1408 km2)
In the Yarra catchment
raquo 55 of the area retains its natural vegetation
(22253 km2)
raquo 30 is used for agriculture (12138 km2)
raquo 15 is urban development (6069 km2)
When comparing the other types of litter between
the rivers it was found that the Maribyrnong
4 amditangaroablueorg
| 34 |
(proportionally) has higher counts of soft plastics
nurdles bottle caps straws twine cigarette butts
and lsquootherrsquo items than the Yarra whereas
polystyrene is more problematic in the Yarra
gt Investigating litter by item category
Hard plastic fragments remain the most
problematic items in both rivers and have been
significantly increasing over the last five years Due
to their small size it is nearly impossible to trace
them back to their individual sources of pollution
They originate from broken-up larger items that are
lost from overflowing commercial household and
public bins littering and illegal dumping of waste
are blown off trucks during transport or from
construction andor demolition sites
The plastic polymer analysis showed that most
items in the samples were polyethylene (PE)
polypropylene (PP) or polystyrene (PS) which are
some of the most commonly used plastics in the
world However other common plastics like
polyethylene terephthalate (PET) and
polyvinylchloride (PVC) were largely absent from
the results Notably as per Pattison (2020)
degradation of polymers is not uniform and
different polymers break up via a range of
processes at varying rates (Gewert et al 2015)
Polymer types such as PE PP and PS break up faster
when exposed to UV radiation than PET and PU
thus potentially increasing the prevalence of these
secondary microplastics The varying densities of
polymers may also influence what is collected with
equipment such as the manta net which sits on the
water surface
The lowest density polymers found in the river
samples are most likely to float were PP
(090 g cm3) and PE (from 092- 097 g cm3) (see
Appendix 3A) Some of the higher density polymers
included PET (138-139 g cm3) and PVC (129-
144 g cm3) which are commonly used worldwide
but were only present in study samples in trace
amounts (see Appendix 3B) It is therefore likely that
denser polymers may be in sub-surface waters
floating underneath the manta net or have sunken
into the sediments as there is a strong correlation
between the number of microplastics found in river
sediments and increasing polymer density (Klein
et al 2015)
Further investigation of the water column and the
sediments are logical next steps in the process of
investigating microplastics pollution in the rivers
Polystyrene is the second most prevalent litter item
in the Yarra and in third place in the Maribyrnong
These findings are supported by litter research
conducted between 2017 and 2019 by the Yarra
Riverkeeper Association which found that
polystyrene was the most found item on the
riverbanks during community clean-ups as well as
in the Bandalong litter traps (Kowalczyk and Kelly
2020) A subsequent polystyrene pollution research
project by Cleanwater Group and Yarra Riverkeeper
Association attempted to trace this litter back to the
source by surveying 64 manufacturing and
distribution facilities (Barmand et al 2020) Over
80 of surveyed sites were found to have some
sort of polystyrene leakage into the environment
even when all reasonable precautions had been
taken to prevent this In addition more evidence is
being collected revealing that building sites are a
potential source of polystyrene pollution when
using insulation waffle pods5 Polystyrene also gets
lost in transport on loading bays and at waste
transfer and recycling facilities The fact that
polystyrene loss still occurs even when all
reasonable precautions are taken indicates that the
problems lie with the material itself and how it is
handled It therefore needs to be questioned if this
material should still be used for its current
purposes meanwhile alternatives should be
sought
3 M I C R O P L A S T I C S I N T H E Y A R R A A N D M A R I B Y R N O N G R I V E R S
C O N T E N T S
| 35 |
as community-led advocacy has led to retailers
swapping plastic straws for paper ones or not
offering plastic straws unless specifically requested
by their customers In some instances entire retail
precincts have pledged to cease the distribution of
plastic straws such as the traders on Gertrude
Street in Fitzroy (The Everleigh pers comm 2017)
The fact that the results of these community
initiatives are reflected in the monitoring data
indicates two things
raquo 1) Individual behaviour change community-led
advocacy and community action to reduce
plastic pollution can make a significant positive
difference for the environment
raquo 2) Ongoing data collection and monitoring of
plastic pollution are necessary to evaluate which
litter reduction initiatives are effective
Sponge is a category that has been significantly
increasing in the Yarra and mostly captures artificial
lsquospongeyrsquo substances such as sponge-like
household items building insulation foam and soft
packaging material When speculating where this
material comes from and why it is more prevalent
and increasing in the Yarra the increased residential
construction projects in the Yarra catchment may
correlate Further source tracing may provide insight
Other is a category applied to record items that are
not readily identifiable as fitting into any of the
other categories but are obviously not organic In
both rivers this category is significantly increasing
especially in the Maribyrnong where the graphrsquos
J-curve in Figure 18 suggests an exponential
increase This warrants closer investigation of this
category in future research to see if there are
specific items that are trending and if another litter
item category should be added for specific
monitoring focus
Soft plastic fragments are steadily increasing over
time Much like hard plastic fragments soft plastics
are difficult to trace back to a single source Much of
it likely comes from plastic littered on the streets or
it blows out of bins and skips due to its light weight
and prevailing wind strength and direction in relation
to the bin Once in waterways soft plastics carried
on rapid flood flows commonly snag on woody
streamside vegetation causing them to shred
Nurdles are ubiquitous in waterways all over
Victoria as supported by evidence gathered by
Tangaroa Blue Foundation and the EcoCentre since
2014 (N Blake F Charko pers comm 2020)
Although nurdles have neither significantly
increased nor decreased over the life of this project
they are still making up a steady 1 of microplastics
flowing into the Bay over time Chapter 5 of this
report shows that nurdles are the number one
microplastic type found on beaches around the
Bay indicating that this type of pollution is an
ongoing issue
As nurdles are classed as an industrial pollutant
rather than litter it is relatively easy to identify their
source These pellets can be traced back to the
premises of plastic manufacturers where they are
spilled on the loading bays and driveways and are
often incompletely or not at all recovered after a
spill Some get lost in road transport on their way to
manufacturers and end up in the gutters Refer to
Chapter 7 for recommendations on this issue
Plastic straws are the only item category that has
significantly declined over time in the Yarra This is
notably going against the trend of all other items in
both rivers that are either increasing or staying
constant over time The most likely explanation for
this is that over the last several years community
and business-driven source reduction initiatives
such as lsquoThe Last Strawrsquo have gained great traction
in Melbourne Individual behaviour change as well
5 Although the Master Builders Association offers a waste minimisation guide that includes waffle pods it does not outline how this material should be handled onsite to prevent spillage
| 36 |
Bottle caps cigarette butts and twine have neither
increased nor decreased in both rivers Although
cigarette butts are in the top ten of most littered
items in Australia their plastic filters get
waterlogged and most likely pass under the manta
net explaining the low numbers found in this study
gt Seasonal variations
When examining the seasonal effects on the rivers
the Maribyrnong proportionally has its largest
surface litter output in spring and autumn while for
the Yarra litter numbers are highest during summer
and winter One likely reason for this difference
could be related to sports events that draw large
numbers of people to the vicinity of the rivers such
as football season for the Yarra in winter and horse
racing events at Flemington Race Course in spring
for the Maribyrnong In summer the Yarra parklands
are extensively used for recreation and tourism in
Melbourne CBD is at its peak in DecemberndashJanuary
However both rivers have different land uses
influencing them and there are vast differences in
the industrial usage and population density along
the rivers (Yonkos et al 2014) Litter hotspots may
also play a role For example Calder Park Raceway
is located near Jacksons Creek not far upstream
from where the creek joins the Maribyrnong River
Road verges in the vicinity of Calder Park are
heavily littered (N Blake pers comm 2020) with
plastic items potentially shredded when verges are
seasonally slashed Both rivers are subject to
different street cleaning and sweeping schedules
and practices by local councils
gt Other factors influencing litter
Rainfall There is a positive correlation between
rainfall and plastic pollution which is consistent
with research worldwide Littered items anywhere
in the catchment eventually make their way down
to the nearest waterway through the stormwater
drain system heavily polluting creeks and streams
that lead into the big rivers and the Bay (picture 6)
Litter traps Although no statistical correlation was
found between microplastics spikes and emptying of
the litter traps this conclusion was reached through a
Wilcoxon rank sum test comparing median litter
Picture 6 Litter in the Merri Creek which flows into the Yarra
P I C T U R E 6
3 M I C R O P L A S T I C S I N T H E Y A R R A A N D M A R I B Y R N O N G R I V E R S
C O N T E N T S
| 37 |
counts when the litter trap was emptied to when the
litter trap was not emptied (two days before trawl) See
Appendix 5 for more details Just before publication of
this report subsequent advice was received from
Melbourne Water that the average Yarra River current
speeds between Burnley and Bolte Bridge is 55 km
per hour (P Rasmussen Melbourne Water Team
Leader Flood Preparedness pers comm 2020)
The distance from Burnley to Bolte Bridge is
approximately 758 km therefore estimated travel time
is about 06 to 38 hours with the average
approximately 15 hours The shorter duration could
be applied during higher flows following rainfall runoff
The longer durations are generally normal conditions
With tides ebbing and flowing for all conditions the
average may be best applied Accordingly any spikes
in trawl contents attributable to emptying of
Bandalong traps could only apply to trawls conducted
within just a few hours of the traps being emptied
Apart from litter prevention measures gross
pollutant traps could be installed on the
problematic major drain outlets and catch items
before they make it into the creeks Once it reaches
the creeks plastic pollution mixes in with organic
materials and will be more onerous and costly to
remove from the waterways due to the much
higher volumes presented by these combined
materials To be effective gross pollutant traps
require adequate and proactive maintenance
schedules and resources to prevent them from
blocking or overflowing
However gross pollutant traps do not often catch
microplastics Although the data in this report do
not show a direct statistically significant correlation
between microplastic capture and the emptying of
the Bandalong litter traps in the Yarra personal
observation of the manner in which the traps are
emptied confirms that microplastics do escape
during this process More targeted research
specifically designed to test for the effectiveness of
microplastics captured by gross pollutant traps
during their operation and maintenance is
therefore necessary
Yarra environmental water flow releases No
correlation was found between microplastics
captured in the trawls and Melbourne Waterrsquos
regulated release of environmental water flows for
the Yarra There is no evidence that environmental
water flows exacerbate plastic pollution in
waterways This supports the result that litter
originates from the street making its way into the
rivers through stormwater drains
gt Implications for marine life in the Yarra estuary
and Port Phillip Bay
Port Phillip Bay is a relatively closed system due to
the distance between the Bellarine and Mornington
Peninsulas being only just under 35 km Due to
prevailing winds it is likely the Bay is a sink for a major
portion of the plastics that enter it from the rivers
This study found that microplastics form the bulk of
items entering the Bay from the surface waters of the
Maribyrnong and Yarra rivers The results of a pilot
project of nine Bay trawls showed the presences of
microplastics in eight of nine samples (see Chapter 4)
To date very few studies have assessed
microplastic ingestioninteraction rates for faunal
species in Port Phillip Bay However worldwide
freshwater and marine species at all trophic levels
possessing varied feeding strategies ingest
microplastics (Eerkes-Medrano et al 2015) In
lab-based studies ingestion has been associated
with the retention and accumulation of
microplastics in organisms including but not limited
to mussels (Browne et al 2008) lobsters (Murray
and Cowie 2011) scallops (Brillant and MacDonald
2000) injury and subsequent disrupted feeding
swimming activity in lugworms as well as stress
immune response altered metabolic function and
| 38 |
toxicity in lugworms (Browne et al 2013) and fish
and mussels (Rochman et al 2013) It is also related
to tumour formation in fish (Rochman et al 2013)
and brain damage in fish (Mattson et al 2017)
Smaller sizes of plastic can potentially be ingested by
a greater range of species Plastic ingestion by local
wildlife is highly likely because of Port Phillip Bayrsquos
potential for high microplastic concentrations and
because these waters are so biodiverse Faunal
ingestion rates and impacts of marine microplastics
at the individual population and community levels
need to be assessed to prevent biodiversity loss in
the Bay and to better understand the human health
implications of consuming seafood from the Bay
Investing in necessary research will likely require
collaboration between departments managing water
pollution controls and fish populations respectively
gt Further study on microplastics
The estimations in this study showed that the Yarra
and Maribyrnong can transport nearly 25 billion
plastic pieces ndash of which more than 2 billion are
microplastics ndash into Port Phillip Bay annually and
that this may be an underestimation Ling et al
(2017) noted that plastic filaments including highly
pervasive clothing microfibre pollution between
0038 mm and 0250 mm formed the dominant
categories of microplastic in coastal and estuarine
sediments around Australia including Port Phillip
Bay However we know little about the
downstream movement and deposition of
microplastics in rivers It is not known what
portions of riverine microplastics travel
downstream below the surface waters sampled by
the manta net to eventually be released to the Bay
or deposited to the river sediments In the North
Shore Channel (Illinois USA) for example
microplastic concentrations in sediments were up
to 15000 times higher than surface water samples
(Hoellein et al 2017) Some microplastics are likely
transported long distances as several studies report
high concentrations of microplastics in estuaries
with rivers implicated as major microplastic sources
to these coastal zones (Yonkos et al 2014 Lima
et al 2014 Sadri and Thompson 2014) An example
of this was revealed during a community clean-up
event organised by the Yarra Riverkeeper
Association in April 2018 where a vacuum suction
device deployed by Ocean Crusaders removed over
47 million polystyrene pieces from the Yarra River
and its vegetated banks (A Kelly pers comm 2018)
Consequently in order to accurately identify the
magnitude of microplastic pollution in Port Phillip
Bay it is necessary to better understand microplastic
depositional patterns and take into account the water
column below the top 20 cm and the sediments
To advance current microplastics research in this
area the EcoCentre engaged a team of interns from
Worcester Polytechnic Institute (WPI) in the USA to
design and build a low-cost microplastics sampling
device easily built from hardware store materials
called the lsquoMicroplastics Collector With A Pumprsquo
(MCWAP) The MCWAP is a portable battery-
powered pump that takes water samples at various
depths in the water column down to a depth of 2 m
and runs these through a removable mesh 300 nm
filter to capture microplastics (picture 7) The
EcoCentre is planning a first trial of depth-sampling
for waterway microplastics in 2021
Picture 7 The MCWAP EcoCentrersquos portable microplastics depth-sampling device
P I C T U R E 7
3 M I C R O P L A S T I C S I N T H E Y A R R A A N D M A R I B Y R N O N G R I V E R S
C O N T E N T S
| 39 |
Maribyrnong River
Fishing in Port Phillip Bay
4
C O N T E N T S
| 41 |
Bay trawls pilotTo gain insight into the relative quantities of microplastics entering the Bay from Bass Strait as compared to the major rivers a pilot project of nine manta net trawls was conducted at the entrance to Port Phillip Bay with support from the Blairgowrie Yacht Squadron and the Australasian Ambassador for the 5 Gyres Institute
Trawls were conducted between April 2018 and
February 2020 at Popersquos Eye in Port Phillip Bay
during incoming tides and south-westerly winds
Trawl time was 30 minutes during which the vessel
was anchored to the sea bed in the tidal flow
Sample sorting was done in the same manner as
the river trawls (see Chapter 3)
Of the nine trawl samples collected at Popersquos Eye in
Port Phillip Bay eight contained plastics (Table 1) Of
the total 55 items found 35 (64) were
microplastics The most prevalent items were hard
plastic fragments which were found in six of nine
samples Samples in which plastic was found
contained up to 16 items The last sample
contained a remnant of a party balloon with the
balloon string still attached
Although the sample size is too small to perform
meaningful statistical analysis the findings suggest
there may be a worrying amount of plastic floating
on the surface waters of the Bay Given the size of
Port Phillip Bay is 1930 km2 and plastics were found
in 89 of samples collected through 30-minute
trawls plastics are potentially quite ubiquitous
A proportion of 80 of hard plastic fragments
found seems relatively consistent with the 75
proportion that flows into the Bay from the Yarra
and Maribyrnong indicating a probability that many
of these items may have originated from the Bay
passed through The Heads into Bass Strait and
then been recirculated back to the Bay by tidal
currents and prevailing winds More samples will
need to be taken and analysed in order to further
investigate this probability
Hard Fragments lt5 Hard Fragments gt5 Soft Plastics TwineLine Sponge Non-Plastic
Apr 18 3 4 1
May 18 6 2
Jun 18 8 6 2
Sep 18
Oct 18 2 1 3
Dec 18 1
Jan 19 2 1
Feb 19 1 2
Feb 20 2 1 1
TOTAL 19 16 2 5 2 5
Table 1 Items caught in Bay entrance trawls lsquoNon-Plasticrsquo included paper and a rubber balloon
T A B L E 1
4
Microplastic beach litter 5
C O N T E N T S
| 43 || 43 |
Baykeeper Beach Litter AuditsDevelopment of the Port Phillip Baykeeper Beach Litter Audit method commenced in 2014 in response to international studies confirming the environmental threat of plastic pollution At that time and to date there remains no international standard survey method with various existing data collection methods used by different leading bodies
While each method provided valuable information
their capacity to accurately record volumes of litter
over time ndash particularly microplastics ndash was seen to
be limited by one or more of the following factors
raquo lack of a clearly defined data collection area
raquo clean-up andor data collection methods
conducted on a scale that was unlikely to be
systematically repeated
raquo data collection recorded in a single area on a beach
(as opposed to a set of locations that represented
samples of all conditions on the beach)
raquo data recording conducted from a standing
position reducing the likelihood of recording
hard-to-spot microplastics
raquo data collection without removing litter
eliminating the possibility of clearly measuring
change in volumes occurring between surveys
The Baykeeper Beach Litter Audit methodology
was designed to focus on microplastic pollution
that poses an immediate threat to aquatic
organisms Key considerations in the design of this
method were the need to
raquo capture a representative sample of the conditions
on the beach
raquo establish an easily replicated method that can be
cost-effectively and consistently applied by
different groups around the Bay
raquo use data field terminology that was consistent
with terms used in the Australian Marine Debris
Initiative database
The Clean Bay Blueprint project provided an
opportunity to test the survey methodology over
several years with a range of user groups
| 44 |
Methodology
The survey method requires the combined search
time of the number of auditors to equate to at least
five minutes per quadrat Noting that some
quadrats will have very few if any microplastics
this requirement is designed to ensure consistency
of search effort and to enable a small team of two
people to comprehensively complete an audit in
less than an hour or two hours on more heavily
littered beaches This relatively small time
commitment facilitates regular conduct of audits
over the course of a year to achieve the statistical
rigour required to confirm trends in litter volumes
and type over time
gt Transect and quadrat placement
In order to capture a representative sample of all
beach conditions data is collected from three
transects across the beach In this context lsquoall beach
conditionsrsquo is referring to the structure of the beach
ndash shaped by the locally prevailing winds waves and
tidal currents ndash which transport sand debris and
litter to and from the beach To capture the
influence of these coastal processes over time and
to provide a basis for consistent search effort
transects are located at the widest central and
narrowest sections of beach
In each transect data is collected from three
quadrats at the top of the beach mid-beach and
on the last high tide line (Figure 22) The lsquotoprsquo
(inland edge) of the beach quadrats are in the same
place for each survey as locational reference points
Due to changing tidal conditions on the day the
distance between the top of the beach and last
high tide line (ie transect length) will vary Hence
the location of the mid-beach and quadrats at the
last high tide line differ for each survey Importantly
the quadrats located at the last high tide line
provide a sample of litter arriving on that day
Each transect starts at the lsquopermanent landmarkrsquo at
the top of the beach to ensure transects are in the
same place each time a survey is conducted
Transects run roughly at a right angle from the top of
the beach towards the closest point at the waterline
gt Selection of reference beach survey locations
With a view to gaining insights into catchment
sources of microplastics to the Bay beaches
surveyed for Clean Bay Blueprint in various regions
of Port Phillip Bay are generally associated with a
river or a creek that flows into the Bay Those that
are not directly associated with rivers or creeks (Rye
and Geelong Eastern Beach) are included to provide
insights into the mobility of litter due to tidal
currents and seasonal winds
5 B A Y K E E P E R B E A C H L I T T E R A U D I T S
Figure 22 Location of Baykeeper Beach Litter Audit data collection quadrats along the widest (1) central (2) and narrowest (3) beach transects
F I G U R E 2 2
C O N T E N T S
| 45 |
Plastics that float in the upper water column are
carried in the direction of wind-generated waves
and the direction of tidal currents during calm
(low-wind) conditions (N Blake pers obs 2020)
Due to the combined effects of tides and varying
wind directions some plastic objects may travel
widely in the Bay before eventually being cast upon
a beach A notable example was one of five
GPS-tracked PET bottles released in Elwood Canal
on 9 May 2019 by RMIT6 After remaining in the
Canal for almost two weeks they ultimately landed
on Dromana beach on 25 May due to a prevailing
northerly wind Therefore in the absence of data
collection conducted on a weekly basis it is
impossible to definitively conclude where beach
litter on any given day may have originally
come from However seasonal
data collection at multiple
(Bay-wide) reference sites does
provide some indication of the
likely source (the catchment)
and ultimately presents a
baseline dataset with which
to determine if microplastics
lsquoleakagersquo into the Bay is
increasing or decreasing
over time
gt Surveys conducted
Between July 2017 and March 2020 117 beach litter
audits were conducted in 12 locations around Port
Phillip Bay (Table 2) with the help of local
community group volunteers not-for-profits and
education institutes All citizen scientists involved
received multiple on-site training sessions by the
Port Phillip Baykeeper before independently
conducting audits Regular reference beaches were
surveyed every three months (in May August
November and February) with surveys of all
beaches generally conducted within the same
fortnight Only sites that were surveyed on at least
six occasions have been given more detailed
analysis in this report
LOCATION ASSOCIATED RIVER
OR CREEK AUDITS
COMPLETED
Eastern Beach Geelong na 11
Moorpanyal Beach Geelong na 2
Werribee River Jetty Werribee River 6
South Beach Werribee Werribee River 7
West Beach St Kilda Yarra River 15
Point Ormond Elwood Elwood Canal 3
Mordialloc Beach Mordialloc Creek 4
Keast Park Seaford Patterson River 10
Frankston Beach Kananook Creek 12
Mothers Beach Mornington NA 4
Mount Martha Beach Balcombe Creek 30
Rye Beach na 13
Total surveys 117
Table 2 Beach litter audit sites and number of audits done between July 2017 and March 2020 Beach names in bold are the regularly surveyed reference beaches the other beaches were opportunistically surveyed
T A B L E 2
6 RMIT Litter Tracker project httpswwwrmiteduauaboutschools-collegesscienceresearchresearch-centres-groupsaquatic-environmental-stresslitter-trackers
| 46 |
Results and discussion
Figures 23 and 24 show beaches along Port Phillip
Bayrsquos eastern shores recorded much higher
concentrations of litter than Geelong Werribee and
Rye The lower counts at Geelong and Rye can be
attributed to the fact there is no major waterway
entering the Bay in their general vicinity and
raquo as Geelong Eastern beach is located near the
westernmost end of Corio Bay it has very limited
exposure to litter dispersed by wind and tides
from wider Port Phillip Bay
raquo Rye beach is the southernmost survey location in
the Bay relatively removed from major streams
and urban catchment
The much lower (near negligible) counts at
Werribee South and Werribee River jetty are likely
attributable to the fact that the Werribee River
catchment is much less urbanised (around 20)
than the catchments associated with most of the
eastern sites of the Bay These results suggest that
litter makes its way to the Bay from the catchments
via the waterways
The high average counts at Keast Park (Seaford)
equate to 42 of total litter collected at all survey
locations Field observations and anecdotal reports
of industrial sites in the Mordialloc Creek and
Patterson River catchments have identified two
particular sites that may be significant contributors
to the overall plastic pollution recorded at Keast
Park This result warrants more detailed analysis
and investigation
A total of 11248 items were recorded in this study
A breakdown of items collected in Figure 25 shows
very few gross pollutants (eg intact plastic bottles
and bags) were recorded while nurdles (pre-
production pellets) and plastic fragments combined
comprised 77 of the total records The volume of
microplastics observed in 9 m2 compared to
microplastics reported in typical beach cleans
confirms the effectiveness of the methodology in
systematically recording microplastics at reference
sites around the Bay
Of all litter recorded the quadrats within the lsquolast
high tide linersquo recorded the greatest percentage of
items (45) followed by the lsquotop beach zone (38)
then the lsquomid-beach zonersquo (18) However this
order did not apply to all beaches with several of
the less littered beaches recording the greater
amount in the top beach zone (Figure 26) Mt
Martha is notable in this regard among the more
heavily littered beaches in that the lsquotop beachrsquo
quadrats had the highest amounts in all three
transects However this result was skewed
significantly by the top beach of the central beach
transect which averaged 278 items per survey ndash
almost as much as the totalled averages for all other
quadrats combined (338 items)
Keast Park has the distinction of having the
highest percentage of nurdles (59 of items
recorded) compared to St Kilda West beach (47)
Frankston (34) Rye (22) and Mt Martha (17)
Nurdles were virtually absent from beaches on the
west side of the Bay
Examination of plastic fragments by type and size
also found Keast Park distinguished from other
beaches with 53 of fragments being hard
fragments lt 5 mm Frankston ranked next highest
for hard plastic fragments with 37 followed by Mt
Martha with 34
The significantly higher counts of nurdles and hard
plastic fragments lt 5 mm may be due to a
combination of factors such as
raquo the broader range of wind directions that might
affect the site prevailing winds are acknowledged
as a primary agent for litter dispersal and Keast
Park is located at the easternmost point of Port
5 B A Y K E E P E R B E A C H L I T T E R A U D I T S
C O N T E N T S
| 47 |
Figure 23 Average litter per survey for all beaches surveyed
Figure 24 Visualisation of total litter counts on sampled beaches around Port Phillip Bay larger circles represent higher counts Image source Port Phillip Sea Pilots
F I G U R E 2 4
F I G U R E 2 3
| 48 |
Figure 25 Litter category percentages of total litter recorded across all sites The numbers above the percentages are the total items collected
Figure 26 Comparison of results for tide line mid-beach and top beach zones
Phillip Bay and subject to winds from south to
north (the widest range of all sites surveyed)
raquo orientation of the beach (near North-South at
Keast Park)
raquo physical infrastructure impeding wave action on
this particular beach (the Riviera stormwater
outfall projects into the Bay at a point around
20 m south of the survey area)
raquo presence of plastics manufacturing and re-grind
industries within the catchments
raquo proximity to industrial sites in local river and
stream catchments (Mordialloc Creek and
Patterson River) to the north of the survey beach
(tidal currents that run clockwise around the Bay
would carry plastics generated by these streams
towards Keast Park)
The Frankston beach survey site is oriented NNE to
SSW which is not dissimilar to the orientation of
Keast Park (NNW-SSE) The two sites are just seven
kilometres apart Despite this proximity the
Frankston site (located just to the south of
Kananook Creek mouth) recorded considerably
fewer nurdles and hard plastic fragments than Keast
Park (which is to the south of Mordialloc Creek and
Patterson River) These findings suggest that close
scrutiny of the Mordialloc Creek and Patterson River
catchments for nurdles and hard plastic fragments
is warranted
F I G U R E 2 5
5 B A Y K E E P E R B E A C H L I T T E R A U D I T S
C O N T E N T S
| 49 |
F I G U R E 2 5
| 51 |
Port Phillip Bay on a windy day
6
| 51 |C O N T E N T S
Related litter investigations Over the life of Clean Bay Blueprint the EcoCentre collaborated with many other organisations Other investigative litter projects enabled by the Port Phillip Bay Fund with the primary aim of data collection for pollution prevention include
raquo Yarra Riverkeeper Associationrsquos Litter and Flows and polystyrene projects - analysing
litter in the Yarra
raquo RMIT Universityrsquos Plastics Lab project ndash analysing
plastic fragment samples to identify polymers and
adsorbed contaminants
raquo Tangaroa Blue Foundationrsquos Letrsquos Strain the Drains7 ndash trialling stormwater pit filtration devices
to document the captured contents in a range of
municipalities and for four different street usages
raquo Scouts Victoriarsquos Street2Bay8 project ndash auditing
litter in six different street usages in all catchments
around the Bay
raquo RMIT Universityrsquos Litter Tracker4 project ndash GPS
tracking and on-line reporting of the mobility of
plastic bottles released into streams in
catchments leading to Port Phillip Bay
raquo Beach Patrol Australia and Love Our Street have
also compiled considerable data with the mobile
Litter Stopper phone app9
Interactive litter maps
It is essential to provide data access and report back
on research results to citizen scientists and those
advocating for and designing change Data collected
from the beach audit sites have been entered into
an interactive Tableau data visualisation platform
and is hosted on the EcoCentre website with
potential for visualising street litter data collected by
other groups Consequently the Tableau platform
appears to be a useful means of engaging with
schools and the wider community in relation to the
high mobility of microplastic pollution
The EcoCentre was also part of the community
reference group that helped design and test the State
Governmentrsquos LitterWatch10 database which collects
and collates litter data from all over Victoria visualises
this on a map and makes it publicly accessible This
is the first attempt to gather all litter data no matter
which data-collection methods were used and bring
this together in one accessible repository
Incident reporting
During the course of the study several materials that
have been noted as of ongoing concern were
reported to relevant authorities These included Telco
wire offcuts discarded at telecom sites on streets
polystyrene waffle pod waste leaking from a building
site and AstroTurf fragments leaking from a
sportsground demolition
All of the complementary initiatives represent major
advances in our understanding of plastic pollution
and warrant careful consideration as a whole body
of information as opposed to in isolation particularly
with a view to adopting the optimum suite of data
collection methods for the future and to set targets
for local source reduction plans
7 tangaroablueorglets-strain-the-drains-port-phillip-bay-region-vic 8 httpsscoutsvictoriacomauactivities-eventsactivitiesenvironmentstreet2bay-project 9 httpswwwbeachpatrolcomau 10 httpslitterwatchvictoriaorgau
Sunset over Port Phillip Bay
RecommendationsOver the life of the Clean Bay Blueprint project microplastic pollution has stopped being an lsquoemerging issuersquo The irrefutable evidence of its unacceptable impact on the environment is well-documented all over the world
7
C O N T E N T S
| 53 |
Many governments are acting on the
recommendation from the science community that
society should not wait for any more quantification
of damage before taking action to reduce marine
plastic pollution impacts (Lavers and Bond 2017
Gall and Thompson 2015) In their report Marine
Plastics Debris and Microplastics the United Nations
stated there is a moral argument that we should not
allow the ocean to become further polluted with
plastic waste and that marine littering should be
considered a lsquocommon concern for humankindrsquo
(UNEP 2016)
The high quantities of litter and microplastics in the
Yarra and Maribyrnong rivers highlight the large
contribution of these rivers to marine plastic
pollution in Port Phillip Bay Recent research by
Borelle et al (2020) projected the future of plastic
pollution in our oceans and concluded that the
predicted growth in plastic waste in the next 10
years far exceeds the impacts of mitigation efforts
currently deployed Therefore significant changes
and investments need to be made to counter the
rising tide of plastic pollution in the oceans
| 54 |
Recommendation 1
gt Improve product stewardship
Plastic and microplastic pollution are everybodyrsquos
problem Over the lsquolifecyclersquo of a plastic item it
travels through the fossil fuel and petrochemical
industries transport and shipping plastic product
manufacturers retailers community local councils
waste contractors and the recycling industry
However whereas every link in this user chain has
some level of responsibility not everyone should be
expected to have the same level of accountability
for plastic waste The current responsibilities for the
fate of plastic products are not well-defined and are
often passed on to the next group down the line
putting a disproportionately large strain on
communities and local councils There is very little
meaningful manufacturing industry accountability
for the end-of-life destination of plastic whether for
waste management or pollution of the environment
The plastics industry is set to grow 40 by 203011
yet hardly any producer responsibility is taken for
the waste and problems its products cause Only
94 of manufactured plastic is being recycled in
Australia (OrsquoFarrell 2019) which is consistent with
9 world-wide9 An astonishing 11 enters the
oceans (Borelle et al 2020) Currently local councils
and the community are expected to deal with the
consequences of unregulated production of a
material that lasts in the environment forever
As Victoria is moving from a linear to a circular
economy model this is the perfect time to change
and define the responsibilities of the plastics
industry and their accountability Federal and state
governments play a key role in leading and
managing this change Some of the changes that
the EcoCentre believes should be made in the short
and long term are
11 Transition to a circular economy model
Product recovery schemes (such as the
container deposit legislation) that are part of a
circular economy model should be funded by
the industries which produce the product
and managed by an independent government
agency to prevent perversion of the initiative
12 Invest in implementing alternatives to
plastic Plastic is not the right material for
the majority of functions it performs eg
using a material that lasts forever for single-
use packaging The ever-increasing
monetary and environmental costs of
dealing with plasticrsquos end-of-life stage are too
high Many alternative truly biodegradable
materials have already been invented but
have not been taken up for large-scale use
Industry needs to be given incentives to
transition towards producing large-scale
alternative packaging solutions eg through
new legislation or stimulus measures such
as innovation grants or tax incentives
13 Set limits on virgin plastic production
This includes avoiding investments in
waste-to-energy schemes that burn plastic
as it perpetuates our reliance on a product
that should not be burned in the first place
14 Ban broad-scale groups of problematic
single-use plastics12 Examples such as South
Australiarsquos ban on single-use plastic items
will provide some of the incentives driving
innovation and transformation Bans may be
premised on design qualities rather than
product type for example banning oxo-
11 httpswwwplasticsoupfoundationorg 12 The Australian National Waste Policy Action Plan commits to banning lsquoproblematic and unnecessary single-use plasticsrsquo by 2025 and delegated the Australian Packaging Covenant Organisation to lead all governments to lsquoIdentify problematic and unnecessary single-use plastic packaging to provide an evidence base for industry to take coordinated actionrsquo by 2019 The resulting report identified four priority categories (including expanded polystyrene and non-certified compostable packaging such as oxo-degradable) and three materials for further investigation httpswwwpackagingcovenantorgaudocumentsitem3183
7 R E C O M M E N D A T I O N S
C O N T E N T S
| 55 |
13 Operation CleanSweep is a best-practice manual for plastic manufacturers that employs cost-effective ways of preventing nurdles leaking into the environment
degradable plastics (that merely break into
microplastics faster rather than biodegrade to
natural component materials) or non-
recyclablenon-compostable packaging
15 Make the Operation CleanSweep13
program mandatory instead of voluntary
for any manufacturer using nurdles and have
this enforced by EPA Victoria
Recommendation 2
gt Cultivate effective partnerships
It is critical that conversations and true working
partnerships are forged and maintained with a
long-term vision of collaboration and tangible
positive outcomes In the case of an issue as big as
plastic pollution cross-sectoral collaborations are
essential to ensure effective changes Industry local
government state government agencies (such as
EPA Victoria the Catchment Management
Authorities and Melbourne Water and others)
research institutes community organisations and
businesses all need to engage in ongoing dialogue
about responsibilities and most importantly to
reach clear agreement on which group is
accountable for delivery of each defined outcome
that is necessary to the success of the overall
enterprise This might be achieved through
stakeholder working forums similar to the Victorian
Department of Environment Land Water and
Planningrsquos Integrated Water Management Forums
Recommendation 3
gt Support local councils in waste management
Until larger systemic changes in waste
management are made the end-of-line
responsibilities councils have for plastic waste need
to be adequately supported and resourced The
costs of this should not be transferred to the
community via rate increases nor by reliance on ad
hoc manual volunteer clean-ups
Measures should include effectively resourcing
councils to
31 Install and maintain pollutant traps in
drain outlets that discharge into creeks
and rivers This could be a collaboration
with Melbourne Water Care should be taken
to not just install gross pollutant traps but
also traps that catch microplastics such as
Drain Buddies
32 Enforce litter and illegal dumping law
33 Run effective litter prevention and
education programs in the community and
especially with local businesses and industry
This may be best done by partnership with
trusted business or community
organisations supporting the outreach
34 Review and improve current street
sweeping schedules and where necessary
adapt these to be more effective at the
occurrence of large sporting events and
seasons when litter peaks occur
| 56 |
Recommendation 4
gt Continue monitoring (micro)plastic pollution
Existing waste management and anti-litter
initiatives are not effective enough to stop plastic
and microplastic pollution from reaching Port Phillip
Bay The research in this report has established a
baseline data set that shows that the problem is
getting worse over time
The river trawls and beach litter audit methods
described in this report are both demonstrated to
be scientifically valid means of ongoing data
collection and the multiple years of data gathered
represent a benchmark of plastic pollution in the
major rivers and Port Phillip Bay The street litter
audit method applied by Scouts Victoria in the
Street2Bay project has also proven to be an
effective and replicable means of monitoring plastic
pollution on streets in Port Phillip Bay catchments
Continued data collection using these methods can
provide a means of evaluating any future strategies
to reduce plastic pollution in waterways
Recommendation 5
gt Increase education and lsquoplastic literacyrsquo of all
plastic users
As part of cultivating a shared responsibility for
plastic use and disposal education of plastic users
is essential The general public has become much
more aware of the issues of plastic pollution in the
environment thanks to a boom in scientific
research followed by mainstream film
documentaries and social media and community
campaigns over recent years
However there is still much confusion about how
plastic can be avoided or what plastics are more
preferable to others An example of this is the actual
meanings of the words lsquobiodegradablersquo lsquodegradablersquo
lsquooxo-degradablersquo and lsquocompostablersquo for plastic bags
People generally try to do the right thing and want
to invest in better products but industry uses the
terms in misleading ways (picture 8)
Recommendations are therefore
51 Set standard legal definitions for
degradability labels
Not-for-profit organisations as well as local councils
play a key role in educating the community and
implementing education programs in schools
Organisations that specialise in this should be
adequately resourced It is likely the reduction in
plastic straws in the Yarra can be attributed to
education efforts and community behaviour change
projects showing that these approaches work The
community and NGOs are not significantly
mentioned in Recycle Victoria (February 2020)
whereas community and cross-sector
collaborations are mentioned in the Port Phillip Bay
EMP but funding for joint activities is unclear after
the conclusion of the Port Phillip Bay Fund in 2020Picture 8
Industry messaging on plastic bag
7 R E C O M M E N D A T I O N S
C O N T E N T S
| 57 |
52 Develop project grants forums and
strategic ongoing partnerships that
integrate community government research
and industry efforts
53 Adequately resource groups who
educate and facilitate action on plastic
pollution
Recommendation 6
gt Conduct further research
As highlighted in the study discussions above
additional research is needed to adequately monitor
microplastics in Melbournersquos waterways and Port
Phillip Bay Ongoing monitoring of surface waters is
necessary to track the quantities and movements of
microplastics and can serve as a baseline for source
reduction action Given the high numbers of
microplastics reaching the Bay from surface waters
it is also important to conduct further research into
the water column and the sediments
Recommendations for further research are
61 Conduct depth-sampling studies The
EcoCentre will pilot the MCWAP to start
monitoring microplastics in the water
column If successful the device and
methodology could be rolled out for use
across creeks and rivers of Victoria
62 Conduct sediment studies Sediment
research is necessary to identify where the
heavier polymers end up according to
Schwarz (2019) river sediments act as a plastic
sink and CSIRO estimated that based on their
samples taken in the South Australian Bight
144 million tonnes of microplastics reside on
the seafloor worldwide (Barrett et al 2020)
63 Prioritise understanding the
contaminants carried by plastic in
waterways and associated human health
risks Continued analysis of plastic polymer
types and chemical contaminants carried by
plastics in waterways is necessary to
strengthen our understanding of the
potential ecological and human health
impacts of plastic pollution
64 Conduct on-ground investigations for
major sources of hard plastics fragments
and nurdles within the Mordialloc Creek and
Patterson River catchments
Plastics Lab Dr Mayumi Allinson
View of St Kilda Beach
8
C O N T E N T S
| 59 |
A note on citizen scienceThe research conducted in this study strongly relied on the collaborations with volunteer citizen scientists Citizen science has received increasing recognition over the last decade and rightly so without more than 8800 hours contributed by volunteers for data collection sample sorting and analysis Clean Bay Blueprint could not have produced such robust results
This project is hardly an exception these days as
volunteers both individually and via community
groups put countless hours of their time and
expertise towards environmental projects that rely
on large datasets and labour-intensive analyses
It needs to be recognised that the contributions of
citizen scientists to science and environmental
change-making are both invaluable and essential
and that collaborations between research
institutions and community provide a powerful
opportunity to build understanding of complex
issues of Victorian Australian and global
significance Resourcing the professional
coordination of such collaborative studies often
provides funders with a multifold return on the
investment through generating new knowledge
inspiring extensive in-kind contributions and
activating community-led conversations and action
on topics that might otherwise be uncommon
around dinner tables classrooms and clubs
9
Little Penguin in Port Phillip Bay
C O N T E N T S
| 61 || 61 |
AcknowledgementsOne of Clean Bay Blueprintrsquos main goals was to build partnerships with other organisations that target litter and improve Bay health
raquo Khadija Muhanna Saif Al
Nabhani - RMIT University
raquo Hilda Poloso - RMIT University
raquo Minh Tu - Deakin University
raquo Daniel Cox - RMIT University
raquo Nick Bergstrom - Worcester
Polytechnic Institute
raquo Sarah Duquette - Worcester
Polytechnic Institute
raquo Madison Healy - Worcester Polytechnic Institute
raquo Nick Sorensen - Worcester Polytechnic Institute
raquo Cameron Collins - Worcester Polytechnic Institute
raquo Samantha Comeau - Worcester Polytechnic Institute
raquo Brendan Gallagher - Worcester Polytechnic Institute
raquo Gina Visser - Worcester Polytechnic Institute
raquo Katie Donovan - Worcester Polytechnic Institute
raquo Spencer Hoagland - Worcester Polytechnic Institute
raquo Thomas Lipkin - Worcester Polytechnic Institute
raquo Eric Stultz - Worcester Polytechnic Institute
We recognise the extensive and energetic contributions of many interns
Many new collaborations and ongoing partnerships were formed and many existing relationships were
leveraged during this project This was made possible by the funding from the Port Phillip Bay Fund of
EcoCentre projects as well as those of other organisations We therefore thank the State Government of
Victoria for its support
Our sincere thanks goes out to the many volunteers including work placement students and interns who
have donated hours of their time and expertise to the project to make it a success We acknowledge your
great passion for the environment and deep dedication to making positive change for the future of our
waterways This project would not have been possible without your support
raquo Balcombe Estuary Reserves
Group Mt Martha
raquo Beach Patrol Mt Martha
raquo Frankston Beach Patrol
raquo Rye Beach Patrol
raquo Beach Patrol Australia
raquo Seaford Beach Patrol
raquo Werribee Beach Patrol
raquo Werribee River Association
raquo Yarra Riverkeeper Association
raquo David Flew
(Karringal boat skipper)
raquo Blair Stafford Australasian
Ambassador of the 5 Gyres
Institute
raquo Blairgowrie Yacht Squadron
raquo Metropolitan Waste and Resource Recovery Group
raquo Melbourne Water
raquo Parks Victoria
raquo 3CR Community Radio
raquo 3RRR Community Radio
raquo Sacred Heart Mission
raquo Bellarine Catchment Network
raquo RMIT Plastics Lab Prof Graeme Allinson Dr Mayumi Allinson Marinda Pattison and students
raquo Scouts Victoria
raquo Worcester Polytechnic Institute
raquo Dolphin Research Institute
raquo Sustainability Victoria
raquo Victorian Litter Action Alliance
raquo Gordon TAFE
raquo Dr Christopher Johnstone and Emma Barnett of Monash University
raquo Victorian National Parks Association
raquo Federation University
raquo Australian Citizen Science Association
raquo The Age
raquo Department of Environment Land Water and Planning
raquo Ying Quek
raquo Port Phillip Menrsquos Shed
We thank the following organisations groups and individuals for their contribution and collaboration (in no particular order)
Appendicesgt Appendix 1
| 62 |
Figure 28 Percentage of microplastics in samples per trawl in the Yarra (blue) and Maribyrnong (red) rivers with 95 confidence intervals shaded grey The average percentage of microplastics per sample was 184 This number has stayed constant over time
F I G U R E 2 8
Appendices
Microplastic Image Josie Jones
C O N T E N T S
| 63 || 63 |
gt Appendix 2
MARIBYRNONG YARRA
Hard plastic fragments 174 -102
Soft plastics 959 -560
Polystyrene -1688 986
Nurdles 803 -469
Plastic bottle caps 542 -317
Plastic straws 529 -309
Sponge -167 097
Twine 412 -241
Other 004 002
Cigarette butts 596 -348
F I G U R E 2 9
Figure 29 Mosaic plot showing the Chi-Square test results (in Table 3 below) The statistical test looks at whether proportions are different than what is expected by chance considering both the Yarrarsquos and Maribyrnongrsquos total litter The width of the boxes show the proportion of litter in the Maribyrnong compared to the Yarra The height of the boxes shows the proportion of litter for each litter item The colours represent significance Boxes coloured red have lower proportions than expected by chance and those in blue have higher proportion than expected by chance The boxes for hard plastic are grey meaning there are no significant differences in proportions of expected hard plastic fragments in the Maribyrnong or Yarra rivers (P gt 005) The boxes for nurdles bottle caps straws and soft plastics are blue for the Maribyrnong and red for the Yarra meaning there are proportionally more nurdles bottle caps plastic straws and soft plastics than expected in the Maribyrnong river and fewer than expected in the Yarra (P lt 005)
Table 3 Residuals from Chi-square test for plastics count as a function of waterway and plastics category Significant values are in bold red
T A B L E 3
| 64 |
gt Appendix 3
Plastic polymer analysis
A
B The below Table 7 is used with
permission from the unpublished
Honours dissertation Analysis of
Microplastic Polymers in the Yarra and
Maribyrnong Rivers (May 2020) by
Marinda Pattison under supervision of
Associate Professor Graeme Allinson
Table 6 Plastic polymer density (Stelray Plastic Products 2020)
T A B L E 6
YARRA RIVER MARIBYRNONG RIVERPercentage () Std Dev Percentage () Std Dev
Total PE 4750 1113 4916 1562
PP 2204 1024 2361 867
PS 1530 1195 791 871
PU 088 217 035 067
Nylons 027 064 104 241
EVA 043 062 049 101
PVC 021 065 008 023
Latex 002 008 005 019
PE amp PP mix 023 039 021 055
PET 002 008 000 000
Nitrile 000 001 000 000
PMMA 002 009 000 000
PTFE FEP 000 000 000 000
CA 001 005 000 000
PC 001 006 007 027
ABS 012 046 000 000
Unknown 067 096 088 113
T A B L E 7
Table 7 Mean abundance (percentage) of polymers in Yarra and Maribyrnong Rivers
A P P E N D I C E S
C O N T E N T S
| 65 |
gt Appendix 4
Changes in individual litter items over time
YARRA RIVER
Plastic Kendallrsquos tau Z P-value
Hard Plastic Fragments 033 741 lt0001
Nurdles 008 086 0391
Other 023 229 0022
Plastic Bottle Caps 016 146 0146
Plastic Straws -025 -234 0019
Polystyrene 022 346 0001
Soft Plastics 027 578 lt0001
Sponge 025 248 0013
Twine 007 072 0470
Cigarette butts 017 164 0102
MARIBYRNONG RIVER
Plastic Kendallrsquos tau Z P-value
Hard Plastic Fragments 026 552 lt0001
Nurdles -004 -044 0657
Other 043 416 lt0001
Plastic Bottle Caps -013 -125 021
Plastic Straws -021 -195 0051
Polystyrene 009 14 0161
Soft Plastics 013 279 0005
Sponge 007 064 0524
Twine 004 042 0671
Cigarette butts -003 -031 0755
Table 4 Kendallrsquos tau test results Change in counts of plastic over time by category for the Yarra and Maribyrnong rivers Kendallrsquos tau the Z value and P-values are presented Significant values are in red These results are important for interpreting the scatterplots in Figures 18 and 19 A positive tau indicates an increase in litter over time A negative tau indicates a decrease over time Kendallrsquos tau is a non-parametric correlation value
T A B L E 4
| 66 |
gt Appendix 5
Bandalong litter traps
In the Yarra River multiple outliers were recorded for the total litter items captured per trawl date Litter traps
were emptied over 24 of the trawl days Six of those days showed higher than average litter counts On 35
trawl days litter traps were not emptied and we saw five higher than average total litter counts
Figure 30 A Wilcoxon rank sum test compared median litter counts when litter trap was emptied to when litter trap was not emptied (two days before trawl) We did not find any effect of litter trap emptying on the total number of litter items captured (W = 289 P = 0162)
F I G U R E 3 0
A P P E N D I C E S
C O N T E N T S
| 67 |
gt Appendix 6
Yarra Environmental flows
There was no significant association between environmental flow events and plastic counts in the Yarra (t =
-03 P = 0768) The amount of variation in microplastic counts explained by environmental flows was close
to zero (adjusted R2 lt 0001) Note that microplastic count was square root transformed to meet
assumptions of a regression analysis
Figure 31 Count of microplastics per trawl as a function of environmental flows in the Yarra River
F I G U R E 3 1
raquo Andrady A L (2006) Assessment of
environmental biodegradation of synthetic
polymers Polym Rev 1994 3425ndash76
raquo Andrady A L (2011) Microplastics in the marine
environment Marine pollution bulletin 62
1596-1605
raquo Barua S Muttil N Ng A amp Perera B (2013) Rainfall
trend and its implications for water resource
management within the Yarra River catchment
Australia Hydrological Processes 27 1727-1738
raquo Barmand S Goodsell K Yardley D Kowalczyk N
(2020) Polystyrene pollution in the Yarra river
sources and solutions Yarra Riverkeeper
Association
raquo Barnes D K Galgani F Thompson R C amp Barlaz
M (2009) Accumulation and fragmentation of
plastic debris in global environments
Philosophical Transactions of the Royal Society of
London B Biological Sciences 364 1985-1998
raquo Barrett J Chase Z Zhang J Banaszak Holl M M
Willis K Williams A Hardesty B D Wilcox C
(2020) Microplastics pollution in deep-sea
sediments from the Great Australian Bight
Frontiers in Marine Science October 2020
Volume 7 Article 576170
raquo Blake N amp Charko F (2014) Pilot study to identify
the extent of microplastics in the Maribyrnong
and Yarra Rivers and Port Phillip Bay Port Phillip
EcoCentre report
raquo Borelle S B Ringma J Law K L Monnahan C C
Lebreton L McGivern A Murphy E Jambeck J
Leonard G H Hilleary M A Eriksen M
Possingham H P De Frond H Gerber L H
Polidoro B Tahir A Bernard M Mallos N Barnes
M Rochman C M (2020) Predicted growth in
plastic waste exceeds efforts to mitigate plastic
pollution Science 369 (6510) 1515-1518
raquo Brillant M amp Macdonald B (2000) Postingestive
selection in the sea scallop Placopecten
magellanicus (Gmelin) the role of particle size
and density Journal of Experimental Marine
Biology and Ecology 253 211-227
raquo Browne M A Dissanayake A Galloway T S
Lowe D M amp Thompson R C (2008) Ingested
microscopic plastic translocates to the circulatory
system of the mussel Mytilus edulis (L)
Environmental science amp technology 42
5026-5031
raquo Browne M A Niven S J Galloway T S Rowland
S J amp Thompson R C (2013) Microplastic moves
pollutants and additives to worms reducing
functions linked to health and biodiversity
Current Biology 23 2388-2392
raquo Charko F Blake N Kowalczyk N Johnstone C
Seymore A Quek Y (2018) Microplastics in the
Maribyrnong and Yarra Rivers Melbourne
Australia Port Phillip EcoCentre report
raquo CIEL (2019) Plastic amp climate the hidden costs
of a plastic planet Center for International
Environmental Law
httpswwwcielorgplasticandclimate
raquo Chidambarampadmavathy (2017) Sustainable
bio-plastic production through landfill methane
recycling Renewable and Sustainable Energy
Reviews Volume 71 May 2017 Pages 555-562
raquo Cole M Lindeque P Halsband C amp Galloway T S
References
| 68 |
R E F E R E N C E S
C O N T E N T S
| 69 || 69 |
(2011) Microplastics as contaminants in the
marine environment a review Marine pollution
bulletin 62 2588-2597
raquo Commonwealth of Australia (2016) Toxic tide the
threat of marine plastic pollution in Australia
Environment and Communications Reference
Committee
raquo DAWE (2018) National Waste Policy - less waste
more resources Department of Agriculture Water
and the Environment
raquo DAWE (2019) National Waste Policy - Action plan
Department of Agriculture Water and the
Environment
raquo DELWP (2017) Port Phillip Bay Environmental
Management Plan The State of Victoria
Department of Environment Land Water
and Planning
raquo DELWP (2019) Victoria in Future 2019 ndash
Population Projections 2016 to 2056 The State of
Victoria Department of Environment Land Water
and Planning
raquo Depledge M Galgani F Panti C Caliani I Casini
S amp Fossi M (2013) Plastic litter in the sea Marine
environmental research 92 279-281
raquo Eerkes-Meedrano D Thompson R C amp Aldridge
D C (2015) Microplastics in freshwater systems a
review of the emerging threats identification of
knowledge gaps and prioritisation of research
needs Water research 75 63-82
raquo Galgani F Hanke G Werner S Oosterbaan
Nilsson P Fleet D (2013) Guidance on monitoring
of marine litter in European seas European
Commission
raquo Gall S amp Thompson R (2015) The impact of debris
on marine life Marine Pollution Bulletin 92 170-179
raquo Gasperi J Wright S L Dris R Collard F Mandin
C Guerrouache M Langlois V Kelly F J Tassing
B (2018) Microplastics in air are we breathing it
in Current Opinion in Envi Sci amp Health vol 1 1-5
raquo Gewert B Plassmann M M MacLeod M (2015)
Pathways for degradation of plastic polymers
floating in the marine environment
Environmental Science Processes amp Impacts vol
17 no 9 pp 1513-1521
raquo Hoellein T J McCormick A R Hittie J London
M G Scott J W amp Kelly J J (2017) Longitudinal
patterns of microplastic concentration and
bacterial assemblages in surface and benthic
habitats of an urban river Freshwater science
35(3) 000-000
raquo Jambeck J R Geyer R Wilcox C Siegler T R
Perryman M Andrady A Narayan R amp Law K L
(2015) Plastic waste inputs from land into the
ocean Science 347 768-771
raquo Jepson P D Deaville R Barber J L Aguilar A
Borrell A Murphy S Barry J Brownlow A
Barnett J Berrow S Cunningham A A Davidson
N J Ten Doeschate M Esteban R Ferreira M
Foote A D Genov T Gimenez J Loveridge J
Llvona A Martin V Maxwell D L Papachlimitzou
A Penrose R Perkins MW Smith B De Stephanis
R Tregenza N Verborg P Fernandez A Law R J
(2016) PCB pollution continues to impact
populations of orcas and other dolphins in
European Waters Nature Science Reports 6 18573
raquo Kim JS Lee HJ Kim SK Kim HJ (2018) Global
Pattern of Microplastics (MPs) in Commercial
| 70 |
Food-Grade Salts Sea Salt as an Indicator of
Seawater MP Pollution Environ Sci Technol
2018 52 21 12819-12828
raquo Klein S Worch E Knepper T P (2015) Occurrence
and spatial distribution of microplastics in river
shore sediments of the Rhine-Main area in
Germany Environmental Science amp Technology
vol 49 no 10 pp 6070-6076
raquo Kowalczyk N Kelly A (2020) Litter and Flows
Connecting the Yarra and Bay Yarra Riverkeeper
Association
raquo Lamb JB Willis BL Fiorenza EA Couch CS
Howard R Rader DN True JD Kelly LA Ahmad
A Jompa J Harvell CD (2018) Plastic waste
associated with disease on coral reefs Science
359 460-462 (2018)
raquo Lavers J L Bond A L (2017) Exceptional and
rapid accumulation of anthropogenic debris on
one of the worldrsquos most remote and pristine
islands Proceedings of the National Academy of
Sciences 201619818
raquo Lavers J L Bond A L amp Hutton I (2014) Plastic
ingestion by Flesh-footed Shearwaters (Puffinus
carneipes) Implications for fledgling body
condition and the accumulation of plastic-derived
chemicals Environmental Pollution 187 124-129
raquo Lima A Costa M amp Barletta M (2014) Distribution
patterns of microplastics within the plankton of a
tropical estuary Environmental Research 132
146-155
raquo Ling S Sinclair M Levi C Reeves S amp Edgar G
(2017) Ubiquity of microplastics in coastal seafloor
sediments Marine Pollution Bulletin 121(1-2)
raquo Lusher A Hollman P Mendoza-Hill J (2017)
Microplastics in Fisheries and Aquaculture ndash
status of knowledge on their occurrence and
implications for aquatic organisms and food
safety Food amp Agriculture Organisation of the
United Nations Technical paper 615 Abstract V
raquo Mai L Bao LJ Shi L Wong CS Zeng EY (2018)
A review of methods for measuring microplastics
in aquatic environments Environ Sci Pollut Res
25 11319-11332 (2018)
raquo Mani T Hauk A Walter U amp Burkhardt-Holm P
(2015) Microplastics profile along the Rhine River
Scientific Reports 5 17988
raquo Mattson K Johnson E V Malmendal A Linse S
Hansson L-A Cedervall T (2017) Brain damage
and behavioural disorders in fish induced by
plastic nanoparticles delivered through the food
chain Scientific Reports volume 7 Article
number 11452 (2017)
raquo Melbourne Water (2018) Co-Designed Catchment
Program for the Maribyrnong Catchment Region
(including Moonee Ponds Creek) ndash October 2018 |
Version 1
raquo Melbourne Water (2018) Co-Designed Catchment
Program for the Yarra Catchment ndash October 2018
| Version 1
raquo Moore C amp Phillips C (2011) Plastic Ocean How a
sea captainrsquos chance discovery launched a
determined quest to save the oceans Avery
New York
raquo Murray F amp Cowie P R (2011) Plastic
contamination in the decapod crustacean
Nephrops norvegicus (Linnaeus 1758) Marine
pollution bulletin 62 1207-1217
References (cont)
R E F E R E N C E S
C O N T E N T S
| 71 |
raquo OrsquoFarrell K (2019) 2017-2018 Australian Plastics
Recycling Survey ndash National Report Envisage
Works Australian Government Department of the
Environment and Energy EPA NSW Sustainability
Victoria Government of Western Australia ndash
Department of Water and Environmental Regulation
raquo Orb Media (2017) Invisibles the plastics inside us
Orbmediaorgstoriesinvisibles_plastics
raquo Pattison M (2020) Analysis of microplastic
polymers in the Yarra and Maribyrnong Rivers
Unpublished Honours dissertation
raquo Rochman C M Hoh E Kurobe T amp Teh S J
(2013) Ingested plastic transfers hazardous
chemicals to fish and induces hepatic stress
Scientific reports 3
raquo Royer S-J Ferroacuten S Wilson S T Karl D M (2018)
Production of methane and ethylene from plastic
in the environment PLOS One 13(8) e0200574
raquo Sadri S S amp Thompson R C (2014) On the
quantity and composition of floating plastic debris
entering and leaving the Tamar Estuary Southwest
England Marine pollution bulletin 81 55-60
raquo Schwartz A E Ligthart T N Boukris E Van
Harmelen T (2019) Sources transport and
accumulation of different types of plastic litter in
aquatic environments A review study Marine
Pollution Bulletin 143 (2019) 92-100
raquo Sustainability Victoria (2019) Microplastics and
Port Phillip Bay - Citizen science study finds
significant amounts of microplastics on Port
Phillip Bay beaches Summary report
raquo Teuten E L Saquing J M Knappe D R Barlaz M
A Jonsson S Bjoumlrn A Rowland S J Thompson
R C Galloway T S amp Yamashita R (2009)
Transport and release of chemicals from plastics
to the environment and to wildlife Philosophical
Transactions of the Royal Society of London B
Biological Sciences 364 2027-2045
raquo Thompson R C Olsen Y Mitchell R P Davis A
Rowland S J John A W McGonigle D amp Russell
A E (2004) Lost at sea where is all the plastic
Science 304 838-838
raquo UNEP (2016) Marine plastic debris and
microplastics ndash Global lessons and research to
inspire action and guide policy change United
Nations Environment Programme Nairobi
raquo World Health Organisation (2019) Microplastics in
drinking water WHO Technical report
raquo Zeynep A Basak G (2019) Microplastics in the
environment A critical review of current
understanding and identification of future
research needs Environmental Pollution 254
(2019) 113011
raquo Yonkos L T Friedel E A Perez-Reyes A C
Ghosal S amp Arthur C D (2014) Microplastics in
four estuarine rivers in the Chesapeake Bay
USA Environmental science amp technology 48
14195-14202
raquo ZonMW (2019) httpswwwzonmwnlen
research-and-resultslife-sciences-health
programmasprogramme-detail
microplastics-health
Imag
e J
osi
e Jo
ne
s
Imag
e J
osi
e Jo
ne
s
Imag
e N
at S
ald
um
bid
e
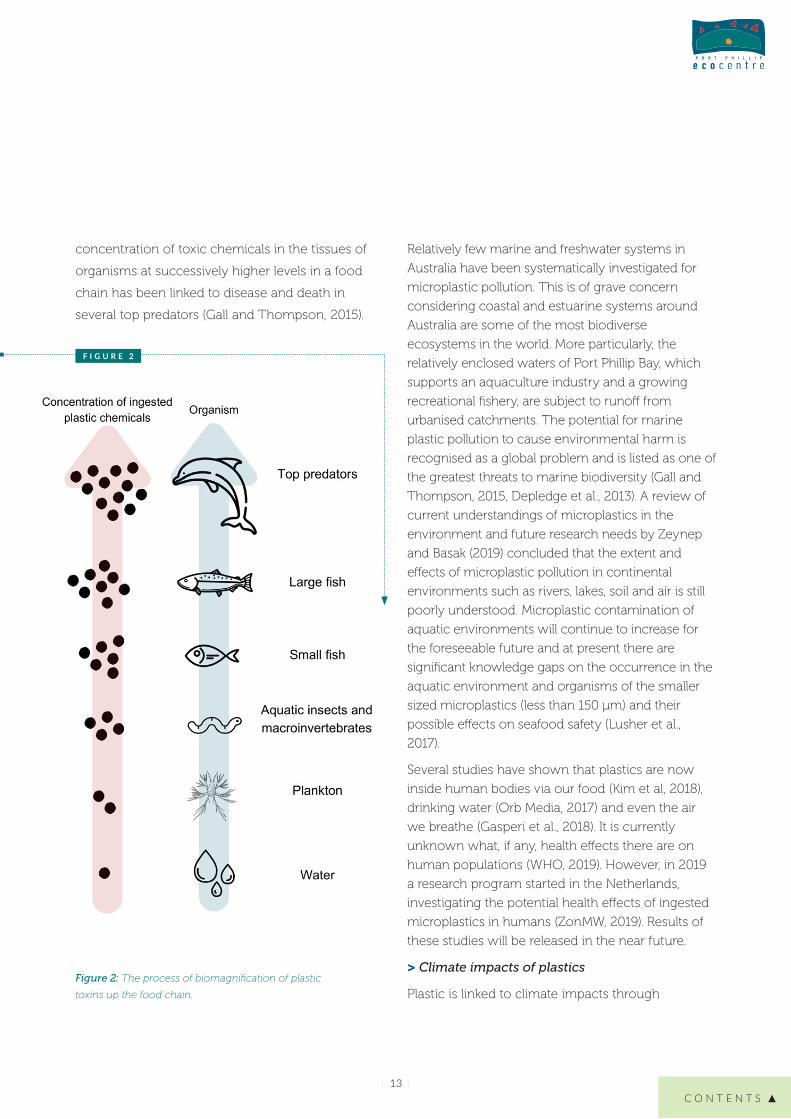
C O N T E N T S
| 13 |
concentration of toxic chemicals in the tissues of
organisms at successively higher levels in a food
chain has been linked to disease and death in
several top predators (Gall and Thompson 2015)
Figure 2 The process of biomagnification of plastic
toxins up the food chain
Relatively few marine and freshwater systems in
Australia have been systematically investigated for
microplastic pollution This is of grave concern
considering coastal and estuarine systems around
Australia are some of the most biodiverse
ecosystems in the world More particularly the
relatively enclosed waters of Port Phillip Bay which
supports an aquaculture industry and a growing
recreational fishery are subject to runoff from
urbanised catchments The potential for marine
plastic pollution to cause environmental harm is
recognised as a global problem and is listed as one of
the greatest threats to marine biodiversity (Gall and
Thompson 2015 Depledge et al 2013) A review of
current understandings of microplastics in the
environment and future research needs by Zeynep
and Basak (2019) concluded that the extent and
effects of microplastic pollution in continental
environments such as rivers lakes soil and air is still
poorly understood Microplastic contamination of
aquatic environments will continue to increase for
the foreseeable future and at present there are
significant knowledge gaps on the occurrence in the
aquatic environment and organisms of the smaller
sized microplastics (less than 150 μm) and their
possible effects on seafood safety (Lusher et al
2017)
Several studies have shown that plastics are now
inside human bodies via our food (Kim et al 2018)
drinking water (Orb Media 2017) and even the air
we breathe (Gasperi et al 2018) It is currently
unknown what if any health effects there are on
human populations (WHO 2019) However in 2019
a research program started in the Netherlands
investigating the potential health effects of ingested
microplastics in humans (ZonMW 2019) Results of
these studies will be released in the near future
gt Climate impacts of plastics
Plastic is linked to climate impacts through
F I G U R E 2
| 14 |
emissions at multiple stages of its lifecycle
Greenhouse gas emissions happen at every step in
the lifecycle of a plastic product the extraction of
fossil fuels and transport plastic refining and
manufacture plastic waste management and the
ongoing impacts of it while polluting the
environment including the oceans (CIEL 2019)
Plastic continues to release greenhouse gases as it
photodegrades when littered (Royer 2018) and
produces methane when degrading in landfills
(Chidambarampadmavathy 2017) Plastic
production also requires large volumes of water in a
world with finite availability of clean freshwater
gt The cost of marine plastic pollution
The following paragraphs are taken from Toxic tide
the threat of marine plastic pollution in Australia a
report delivered to the Federal Senate by the
Environmental amp Communications References
Committee (Commonwealth of Australia 2016)
266 Professor Smith stated that lsquoa key
problem in determining the source of all items
is that fragmented plastics are often the most
numerous and there is no simple way to
determine their sourcersquo Professor Underwood
similarly told the committee that there is
lsquoinsufficient researchrsquo to answer the question
of where marine plastic pollution is sourced
296 Dr Britta Denise Hardesty CSIRO
commented that lsquothe cost of littering and
debris to fisheries small business and
human health remain poorly understood
and littering costs to local government due
to remediation and tourism losses are
substantialrsquo In answer to the committeersquos
questions concerning the estimates of the
damage from marine debris on Australiarsquos
tourism fishing and shipping the
Department of the Environment added that
it did not have any estimates nor did other
Commonwealth agencies including the
Great Barrier Reef Marine Park Authority the
Australian Maritime Safety Authority and the
Australian Fisheries Management Authority
Other than projects funded by the Port Phillip Bay
Fund there has been limited research to address
knowledge gaps in relation to sources and ecosystem
impacts of plastic pollution across Australia since the
release of the Senate Inquiry report in 2016
Plastic pollution in Victoria
Locally Port Phillip Bay and surrounding waters are
supporting an ecosystem that is home to an
estimated 10000 species with many of those
species unique to the Bay1 Most plastic pollution in
Port Phillip Bay originates from land-based sources
Diverse sources include urban streets freeways and
roadside verges stormwater drains wastewater
treatment plants and river and creek runoff
Although plastic pollution has been repeatedly
identified as a major threat to Victorian waterways
there has been limited scientific assessment since
the Melbourne Water Tagged Litter Study in 1993
The EcoCentrersquos Yarra and Maribyrnong river trawls
commenced in 2014 the Litter Trackers project by
RMIT and Melbourne Water was conducted in 2019
and Sustainability Victoria recently conducted a
microplastics study on six beaches around the Bay
In this study they found between 167 and 1232
microscopic microfibres from clothing per kilogram
of sand (Sustainability Victoria 2019)
The Yarra Riverkeeper Association removed
approximately 8000 kg of waste from the Yarra and
Maribyrnong between 2017 and 2020 (Kowalczyk
and Kelly 2020) with some of the most common
collected items being foam insulation and
packaging plastic bottles and cigarette butts Both
this project and their 2020 polystyrene study in
1 httpswwwmarineandcoastsvicgovaugrants port-phillip-bay-fund
2 I N T R O D U C T I O N
C O N T E N T S
| 15 |
A close-up of the Balcombe Estuary nurdles
collaboration with Clean Water Group point to
polystyrene being a major waterway pollutant in
metro Melbourne (Barmand et al 2020)
Community groups such as Beach Patrol Bellarine
Catchment Network various Friends groups and
others across the catchments spend countless
hours of people power cleaning up beaches and
waterways Over the last few years the EcoCentre
has played a role in shifting the general focus from
merely picking up and disposing of the litter to
collecting data on what is found to be used in
advocacy efforts to reduce plastic pollution in the
environment Since February 2018 Scouts Victoria
and the EcoCentre have collaborated in the state
governmentndashfunded Street2Bay project
conducting litter audits with particular attention to
microplastics on streets in all catchments
around the Bay
Bandalong litter trap in the Yarra
| 16 |
Policy context
gt Australia
From 2018 Chinarsquos new bans and 995 purity
standards for uncontaminated recyclables left
Australia with large stockpiles of items now needing
onshore processing Extensive ripple impacts of this
challenge ndash from facility fires to paying fees to send
recyclable plastics to landfill ndash have compelled
significant rethinking of Australian waste
management systems including materials redesign
reduction re-use and recycling Industry bodies
and the Australian Government considered plastics
and other materials in a range of commitments and
aspirations towards an Australian circular economy
in which lsquowastersquo and pollution are designed out
and products and materials are kept in use through
principles such as repair and maximising use of
recycled materials over virgin resources
Australiarsquos National Waste Policy Less waste more
resources (Commonwealth of Australia 2018) and
National Waste Policy Action Plan (2019) apply the
lsquoprinciples of a circular economy to waste
management to support better and repeated use of
our resourcesrsquo The targets include reducing
Australian waste by 10 per capita by 2030 and to
lsquophase out problematic and unnecessary plastics by
2025rsquo Waste policies focus on plastic diversion from
landfill however plastic uncontained by
management systems (eg lost as litter dumping or
spillage) becomes pollution of ecological and
economic concern due to its persistence in the
environment On 18 June 2015 the Senate referred
the threat of marine plastic pollution in Australia for
parliamentary inquiry and report by 8 April 2016
The final report Toxic tide the threat of marine
plastic pollution in Australia was presented on 20
April 2016 (Commonwealth of Australia 2016) The
need for systematic data collection on the extent of
plastic pollution was stated in Recommendation 1
of the report
Blair Stafford conducting a microplastics trawl in the Bay with a manta net
2 I N T R O D U C T I O N
C O N T E N T S
| 17 |
2 httpsnicholasinstitutedukeeduplastics-policy-inventory
The committee recommends that any future
Australian Government policies on mitigating
the threat from marine plastic be underpinned
by sound peer-reviewed research
gt Victoria
Plastic pollution is relevant under a range of Victorian
policies and strategies to manage waste and protect
human health and biodiversity In some instances
plastic pollution is discussed explicitly as in the
plastic bag ban (Environment Protection
Amendment Act 2019) or Recycling Victoria lsquoKey
Commitment 3 Address plastics pollutionrsquo Managing
plastics can also fall under broader principles such as
the goal lsquoVictoriarsquos natural environment is healthyrsquo in
Biodiversity 2037 the lsquowastes hierarchyrsquo principle of
environmental protection in the Environmental
Protection Act Victoria (1970) and the introduction of
General Environmental Duty in the Environment
Protection Amendment Act 2018 The General
Environmental Duty requires all Victorians to manage
risks to human health and the environment that their
activities create and becomes active from July 2021
Studies that quantify the effects and extent of
microplastics are necessary to inform policy
frameworks that reduce plastic pollution establish
waterway management strategies and assess
biodiversity health Interim results of the Clean Bay
Blueprint study have helped inform government
documents including
raquo State of the Yarra and its Parklands (2018) ndash
Commissioner for Environmental Sustainability
Victoria
raquo Assessment of the Values of Victoriarsquos Marine
Environment (2019) ndash Victorian Environmental
Assessment Council
A written submission by the EcoCentre to the 2018
review of the State Environment Protection Policy
(Waters) using the results of EcoCentre
microplastics studies led to lsquoplastics and
microplasticsrsquo being added to the list of legally
defined waterway pollutants in Victoria
Prior to the EcoCentrersquos research plastic and
microplastic pollution were not reported in
Victorian State of the Environment reports nor
specifically included in legislated protections
gt Worldwide
The United Nations Sustainable Development Goals
(SDGs) are 17 interlinked goals to achieve lsquoa better and
more sustainable future for allrsquo The management of
plastic materials relates to several SDGs
raquo Goal 12
Responsible production and consumption
raquo Goal 13 Climate action
raquo Goal 14 Life below water
raquo Goal 15 Life on land
The United Nations Environment Programme
(UNEP) has produced numerous studies on plastic
pollution and prevention in the last five years
Assessing policy efforts in 60 countries around the
globe the UNEP reports Single-Use Plastics
Roadmap to Sustainability (2018) includes ten
recommendations including (1) target the most
problematic single-use plastics by collecting
baseline data (5) raise public awareness (7) provide
incentives to industry and (9) enforce new
measures effectively
In 2020 Duke University launched a Plastics Policy
Inventory2 as a searchable database of public policy
documents targeting plastic pollution This includes
the language year enacted location and
jurisdictional level This document is updated
quarterly due to the rapidly evolving nature of policy
responses to address the health economic and
amenity threats of plastic and microplastic pollution
Melbourne City over the Yarra River
3
C O N T E N T S
| 19 |
Microplastics in the Yarra and Maribyrnong RiversThe first ever litter trawls done in rivers in Australia were conducted by the EcoCentre in 2013 The resulting report Pilot study to identify the extent of
microplastics in the Maribyrnong and Yarra Rivers and Port Phillip Bay (July 2014) showed that microplastics were present in Melbournersquos two largest rivers As a result of this pilot study monthly trawls were continued through the Turn off the Tap project (2014ndash2017) funded by the Victorian Government The final samples of this study spiked in microplastic litter which seemed to show an upward trend over time indicating further investigation was warranted Subsequently the Port Phillip Bay Fund funded Clean Bay Blueprint (2017ndash2020) for another three years of continuous research This report presents analysis of the outputs from both these projects and uses the full 55 years of data collected
Aims of the microplastics study
Within Clean Bay Blueprint the quantification of
plastics and microplastics in Melbournersquos two largest
rivers was done as a contained research study
which continued from a previous dataset collected
between 2015 and 2017 Its aims were the following
gt Quantifying plastic pollution to inform
legislative reform and behaviour change
When trawls commenced in 2014 there was no
reported evidence of the ongoing presence of
microplastic pollution in the rivers and Bay apart
from personal observations As legislative reform
and management decisions around litter need to be
driven by scientific evidence the first aims of the
study were to confirm the presence and quantify
the extent of the pollution
gt Tracking changes in litter over time and
establishing a baseline
Once presence is established the next step is to
monitor litter loads over time in order to track if
volumes increase or decrease Continuous
monitoring measures a baseline state of the river
which can be used to measure the effectiveness of
anti-litter measures taken to reduce the loss of
certain items in the environment In addition
monitoring allows researchers to notice unusual
spikes in litter loads or items that may have been
the result of mass spills and one-off pollution
events and might otherwise go unnoticed
gt Identifying the source of litter items
By tracking and quantifying the different litter items
encountered (eg polystyrene balls plastic drinking
straws cigarette butts) it may be possible to identify
| 20 |
their potential source locations This evidence could
be used to inform localised source reduction plans to
prevent an item type from entering the environment
in the first place Anecdotally known problem items
were analysed as distinct categories to learn more
about their prevalence in the waterways
Study method
gt Study site
The Yarra River flows 242 km from its source in the
forested Yarra Ranges National Park through to
central Melbourne where it enters Port Phillip Bay
More than one-third of Victoriarsquos population lives in
the Yarra catchment which covers about 4000 km2
(Barua et al 2013) The catchment includes 40
rivers and creeks including the Maribyrnong River
which runs for 160 km from its source on the
slopes of Mount Macedon The Maribyrnong
catchment covers 1408 km2
The trawl sites were selected on the basis of being
close to the lower reaches of each river and
therefore indicative of the total pollution load of each
respective catchment (Figures 3 and 4) The
Maribyrnong trawls commenced at the Water
Canon Jetty extending from the west bank of Coode
Island 300 m upstream from the Yarra The Yarra
trawls commenced underneath Bolte Bridge 25 km
upstream of the Yarra and Maribyrnong confluence
Figure 3 The locations of the Maribyrnong and Yarra catchments relative to the centre of Melbourne Images courtesy of Melbourne Water
Figure 4 Approximate trawl location transects in the Maribyrnong and Yarra Rivers
gt River trawls
A manta net designed to collect floating debris off
the waterrsquos surface was deployed from the side of
the boat and positioned outside of the wake zone
(picture 4A) Trawling was done according to
internationally standardised methods by Galgani
et al (2013) in each river all trawls commenced at
the same place travelling upstream for 30 minutes
with the boat motor operated at a constant 1000
rpm to operate the net effectively and maintain a
consistent speed for all trawls After 30 minutes the
net was retrieved the collection net (cod end)
removed (picture 4B) and placed in a container to
be dried in preparation for sorting and categorising
the contents
Between January 2015 and February 2020 a total of
113 monthly trawls were conducted in the
Maribyrnong and Yarra Rivers Both rivers were
trawled on the same day The distance covered in
each trawl varied slightly due to the effects of
different tides and prevailing wind conditions
encountered at the time While trawls were generally
done in a straight line river boating involves
changing course to safely navigate around other
watercraft that may be encountered and the course
of the trawls in each river was not rigidly defined
The lsquomouthrsquo of the manta net measures 600 mm
wide x 200 mm deep The net is 3 m long tapering
down to a 30 x 10 cmsup2 cod end Both the tapering
net and cod end are made of a 330 nm mesh size
The manta net is of the same specifications used
3 M I C R O P L A S T I C S I N T H E Y A R R A A N D M A R I B Y R N O N G R I V E R S
F I G U R E 4
F I G U R E 3
C O N T E N T S
| 21 |
by the 5 Gyres Institute to measure microplastics in
international studies In a recent review of methods
that measure microplastics in aquatic
environments Mai et al (2018) confirmed that this
collection method is recommended for large-scale
surface water sampling
gt Sample analysis method
Sample sorting was performed by trained citizen
scientists (picture 5) Dried trawl samples were
analysed by separating litter items from organic
matter with the naked eye using tweezers and
supplemental lighting Litter items were next sorted
by item type and the diameter measured with a
ruler after which the item was placed in the
corresponding size category Litter categories
included hard plastic fragments lt 2 mm hard
plastic fragments 2 mmndash5 mm hard plastic
fragments 6ndash10 mm hard plastic fragments gt
10 mm polystyrene beads lt 4 mm polystyrene
beads ge 4 mm plastic bottle caps plastic straws
soft plastics lt 5 mm soft plastics ge 5 mm lolly
wrappers cellophane lt 5 mm cellophane ge 5 mm
plastic pre-production pellets (nurdles) cigarette
butts twine sponge (synthetic sponge-like
materials) and lsquootherrsquo items which included
unidentified non-organic looking items
Internationally accepted guidelines define plastic
pieces smaller than 5 mm in diameter as
microplastics (Thompson et al 2004) In this study
the categories of hard plastic fragments lt 2 mm
hard plastic fragments 2 mmndash5 mm soft plastics lt
5 mm cellophane lt 5 mm nurdles and polystyrene
beads lt 4 mm were grouped into the microplastic
category Plastic items not visible to the naked eye
including microfibres were excluded from this study
due to logistical technical and funding constraints
Picture 4 A Manta net deployed on side of Yarra Riverkeeper vessel B Removable cod end used to collect microplastic samples
Picture 5 Citizen scientists sorting trawl samples at the EcoCentre
P I C T U R E 5
P I C T U R E 4 A P I C T U R E 4 B
| 22 |
Trawl data analysis results
The results of the sample analysis show
substantial concentrations of plastic litter
present in the Yarra and Maribyrnong Rivers
across all months of the year A total of 40030
litter items were captured and analysed from
the Yarra and 13658 litter items from the
Maribyrnong between January 2015 and
February 2020 An average of 690 litter items
were collected from the Yarra per monthly
trawl while an average of 248 litter items
were collected from the Maribyrnong per
monthly trawl
Because the Yarrarsquos width in the trawl location
is more than 160 times wider than the net and
the Maribyrnongrsquos width in the trawl location
is 120 times wider the actual extrapolated
volume of litter in both rivers is astounding
For the Yarra the rough calculation is
690 litter items x 48 half-hour sessions
day x 365 days x 160 times net width
yielding 1934208000 litter items
entering the Bay from the Yarra
annually
For the Maribyrnong this calculation is
248 litter items x 48 half-hour sessions
day x 365 days x 120 times net width
yielding 521395200 litter items
entering the Bay from the
Maribyrnong annually
Figure 5 Relative litter composition of items flowing into Port Phillip Bay from the Maribyrnong and Yarra rivers combined
Figure 6 Litter composition in trawl samples obtained from the Maribyrnong River
Figure 7 Litter composition in trawl samples obtained from the Yarra River
F I G U R E 5
F I G U R E 7
F I G U R E 6
3 M I C R O P L A S T I C S I N T H E Y A R R A A N D M A R I B Y R N O N G R I V E R S
C O N T E N T S
| 23 |
These calculations suggest that an average total of
2455603200 litter items flow into Port Phillip
Bay annually from surfaces of the Yarra and
Maribyrnong Rivers combined
It should be noted that since these litter items are
only caught in the surface waters (upper 200 mm)
this number is likely to be an underestimation of the
overall plastic pollution loading in each river
Different types of plastic display different levels of
buoyancy characterised as either positively
buoyant (floating at the surface) negatively buoyant
(sinks to the bottom) or neutrally buoyant (in the
water column) It is unknown how many items are
present in the water column or the sediments of
Melbournersquos waterways
gt Litter reaching Port Phillip Bay
Based on the 53688 litter items caught and
analysed the composition of litter entering Port
Phillip Bay shows that hard plastic fragments are by
far the most prevalent litter item (75) followed by
polystyrene (13) and soft plastics (10) (Figure 5)
Trawl samples weighed an average of
approximately 266 g most of which was organic
plant matter On average litter comprised 184 of
the total sample weight highlighting the
pervasiveness of litter in our waterways Over time
this percentage has stayed quite constant (see
Appendix 1)
gt Comparing the rivers
Hard plastic fragments polystyrene and soft
plastics were the most common items found in
both the Yarra and Maribyrnong (Figures 6 amp 7)
Hard plastic fragments made up the bulk of the
captured litter items comprising 74 of capture for
the Yarra and 76 of items captured in the
Maribyrnong
Polystyrene was the second most captured item
with 15 of items in the Yarra and 8 of items in
the Maribyrnong being polystyrene
Soft plastics (consisting of
cellophane lolly wrappers and
unidentifiable soft plastics) made up
9 of total items captured in the
Yarra and 13 in the Maribyrnong
When comparing the total litter
counts between rivers we found a
significant difference between the
Maribyrnong and Yarra Rivers
(chi-squared = 12954 df = 1 P lt
0001) with plastic litter overall more
likely to be found in the Yarra than
the Maribyrnong (Figure 8)
F I G U R E 8
Figure 8 Comparison of number of litter items in Maribyrnong and Yarra rivers
| 24 |
There is also an overall significant effect of the
rivers on distribution of plastics by item category
(chi-squared = 74726 df = 9 P lt 0001 Figure 9)
There are no significant differences in
proportions of hard plastic fragments in the
Maribyrnong or Yarra rivers (P gt 005)
There are proportionally more soft plastics
nurdles plastic bottle caps plastic straws
twine and cigarette butts in the Maribyrnong
river Conversely proportionally less of the
same items are in the Yarra river (P lt 005)
meaning that these items make up a higher
proportion of total litter counts in the
Maribyrnong than they do in the Yarra (see
Appendix 2)
When comparing polystyrene loads to the
expected proportions of polystyrene (based
on the total counts for the rivers) the
proportion of polystyrene is significantly less
than expected (P lt 005) in the Maribyrnong
and significantly more than expected in the
Yarra (P lt 005) this means polystyrene is
more likely found in the Yarra than in the
Maribyrnong
The proportion of lsquootherrsquo items is
significantly above expected in the
Maribyrnong (P lt 005) but for the Yarra
the proportion of lsquootherrsquo items was
nonsignificant (P gt 005)
F I G U R E 9
F I G U R E 1 0
Figure 9 Comparison of mean monthly number (plusmnSE) of litter items captured by the manta net in the Maribyrnong and Yarra Rivers between January 2015 and February 2020 Note that values shown are means but statistical tests were conducted on frequency of counts using chi-squared analyses (ie the standard errors should not be used to infer anything about statistical significance They are rough indicators of variation around a mean only)
Figure 10 Comparison between rivers of the total number of microplastics captured during river trawls
3 M I C R O P L A S T I C S I N T H E Y A R R A A N D M A R I B Y R N O N G R I V E R S
C O N T E N T S
| 25 |
In both rivers microplastics formed the bulk of litter
and accounted for 85 (34013 pieces) of the total
load in the Yarra and 83 (11388 pieces) of the
Maribyrnong load (Figure 10) Hard plastic
fragments lt 2 mm in length dominated the
microplastics category and accounted for 45 and
51 of microplastics in the Yarra and Maribyrnong
respectively
Of the earlier mentioned total litter items entering the
Bay microplastics make up nearly 85 which means
more than 2 billion (2076458066) microplastics flow
from the two rivers into the Bay every year
gt Analysis of plastic polymer types
Sorted trawl samples from July 2016 to August 2019
were sent to the Plastics Lab at RMIT where they
were analysed for plastic polymer types using
Fourier Transform Infrared Spectroscopy (FTIR)3
There are many polymer types each of which has
varying qualities that align it to typical uses
products or applications Through FTIR analysis
microplastics or fragments may be grouped
according to probable source products
In both the Yarra and the Maribyrnong rivers
polyethylene (PE) was the most prevalent polymer
(48 and 49 respectively) followed by
polypropylene (PP) (22 and 24 respectively)
polystyrene (PS) (15 and 79 respectively)
The Yarra River saw small amounts of 11 other
polymers each of which contributed less than 1
and 067 of samples were of an unknown
material The Maribyrnong saw a small abundance
of other polymers ranging from 1 to 005 and
had 088 of unknown material (see Appendix 3)
The two rivers showed similar trends over the
months for all three of the most prevalent polymers
The abundance of PE and PP did not statistically
differ between the Yarra and Maribyrnong (P = 067
P = 056 respectively) however PS was statistically
lower in the Maribyrnong (P = 002)
Interestingly polyethylene terephthalate (PET) and
polyvinylchloride (PVC) are some of the most
commonly produced and used plastics yet were
some of the least recorded in both the Yarra and
Maribyrnong Rivers
gt Seasonal differences in litter
There are significant effects of the seasons and the
rivers on the total count of litter (chi-squared =
12429 df = 3 P lt 0001) A comparison of total litter
by trawl indicates that there is more total litter in the
Yarra than in the Maribyrnong in any season There
was more litter in summer in both rivers However
proportionally in the Maribyrnong has more litter
in spring and autumn than is expected by chance
whereas in the Yarra the clear peak seasons are
summer and winter (Figure 11)
In summer and winter plastic litter is proportionally
higher in the Yarra than the Maribyrnong (P lt 005
for both seasons) In autumn and spring plastic litter
is proportionally higher in the Maribyrnong than the
Yarra (P lt 005 for both seasons)
Figure 11 Seasonal variation in the number of captured litter items in the Maribyrnong and Yarra Rivers between January 2015 and February 2020
3 This summary of results was used with permission from an unpublished Honours dissertation by M Pattison (2020)
F I G U R E 1 1
| 26 |
gt Changes in litter over time
The five years of data collection reveal large
increases in litter over time (Figure 13) Note the
difference in numbers on the y-axes when
comparing the rivers
Both rivers are showing a significant increase in
plastics over the sampling period although the trend
is somewhat more pronounced in the Yarra (tau =
017 z = 745 P lt 0001) than in the Maribyrnong (tau
= 010 z = 416 P lt 0001) (Figure 14)
Note the differences in percentages on the y-axes of
the respective rivers in Figures 15 and 16 which
show how much faster the Yarrarsquos litter has been
increasing over the last five years When combining
the above litter numbers and percentages there is a
similar increasing trend in litter en route to Port
Phillip Bay (Figure 17) It is unclear why there was
such an extreme increase in litter in the Yarra in 2017
The above results warranted a closer examination
of the changes in litter item categories over time
In the Maribyrnong hard plastic fragments soft
plastics and lsquootherrsquo are increasing over time
(P lt 005) (Figure 18)
Figure 19 shows that in the Yarra hard plastic
fragments soft plastics polystyrene sponge and
lsquootherrsquo in the Yarra are increasing over time (P lt 005)
However plastic straws are significantly decreasing
over time (z = -234 tau = -025 P = 0019)
All other plastics are steady showing neither a
significant increase nor decrease See Appendix 4
for more details
F I G U R E 1 2
Figure 12 shows more detailed litter item
distributions over the seasons for the separate
rivers Hard plastic fragments remain the largest
category of items throughout all seasons in both
rivers followed by polystyrene and soft plastics
Figure 12 Seasonal variation in the total number of captured litter items in the Maribyrnong and Yarra Rivers between January 2015 and February 2020 Note the difference in total litter items captured on the y-axes
Figure 13 Total number of captured litter items in the Maribyrnong and Yarra Rivers presented by trawl between January 2015 and February 2020 The labels indicate year month and trawl number A total of 62 paired trawls were conducted during this time Several litter spikes were recorded
Figure 14 Litter trends over time Litter in both rivers is increasing with litter in the Yarra increasing faster than in the Maribyrnong
3 M I C R O P L A S T I C S I N T H E Y A R R A A N D M A R I B Y R N O N G R I V E R S
C O N T E N T S
| 27 |
F I G U R E 1 3
F I G U R E 1 4
| 28 |
Baykeeper and Riverkeeper trawling for microplastics
F I G U R E 1 5 F I G U R E 1 6 F I G U R E 1 7
3 M I C R O P L A S T I C S I N T H E Y A R R A A N D M A R I B Y R N O N G R I V E R S
C O N T E N T S
| 29 |
Figure 15 Above Actual numbers of microplastics in the Maribyrnong Below Percentage increase in microplastics year-on-year
Figure 16 Above Actual numbers of microplastics in Yarra Below Percentage increase in microplastics year-on-year
Figure 17 Above Actual numbers of microplastics flowing to Port Phillip Bay Below Percentage increase in microplastics year-on-year
Figure 18 The number of plastic items by category across time in the Maribyrnong River (measured by trawl number) Note that axis scales are different for each plastic category Significant relationships are marked by an asterisk ()
F I G U R E 1 8
C O N T E N T S
| 30 |
F I G U R E 1 9
Figure 19 The number of plastic items by category across time in the Yarra River (measured by consecutive trawl numbers) Note that y-axis scales are different for each plastic category Statistically significant relationships are marked by an asterisk ()
Figure 20 Plot of microplastic count in both Yarra and Maribyrnong between 2015 and 2019 as a function of Melbournersquos population
Figure 21 Regression analysis showing a positive correlation between litter items captured and rainfall data Note that microplastic count was square root transformed to meet assumptions of a regression analysis
3 M I C R O P L A S T I C S I N T H E Y A R R A A N D M A R I B Y R N O N G R I V E R S
C O N T E N T S
| 31 |
gt Factors driving litter increases and spikes
A series of regression analyses were performed to
see what environmental factors could be driving
the increases in litter and some of the unusually
high litter counts in some of the trawls
Worldwide plastic pollution is usually positively
correlated with increases in population This indeed
applied in the Yarra and Maribyrnong as well with a
significant association between population in the
Greater Melbourne area from 2015 to 2019 and
counts of microplastics (t = 54 P = 0012)
Approximately 876 of the variation in microplastic
counts was explained by population numbers over
this time (adjusted R2 = 0876 Figure 20) which
indicates a very strong correlation
A regression analysis shows that the count of
microplastics was positively associated with total
rainfall in the previous 48 hours (t = 41 P lt 0001
Figure 21) Approximately 122 of the variation in
microplastic counts in the rivers was explained by
rainfall (adjusted R2 = 0122)
Rainfall data for the Maribyrnong was taken from
the Bureau of Meteorologyrsquos (BOM) weather station
at Melbourne Airport Rainfall data for the Yarra was
taken from the BOMrsquos Eltham weather station
To explain some of the high spikes in litter in the
Yarra two potential factors were tested for
Bandalong litter traps
The method of emptying the floating Bandalong
litter traps is focused on removing larger litter items
(gross pollutants) and does not allow for the
containment of microplastics The 2015ndash2020 dates
of the emptying of the traps in the Yarra River were
sourced from Parks Victoria Although there were
preliminary indications of litter spikes potentially
being caused by litter trap maintenance there
seemed to be no evidence of a correlation with the
data available (see Appendix 5) However additional
information sourced from Melbourne Water just
before finalising this report indicates that a more
targeted approach to investigating microplastics
leakage from Bandalong traps is appropriate Please
refer to the Yarra and Maribyrnong microplastics
research discussion below
There are currently no Bandalong litter traps in the
Maribyrnong river
Environmental water flow releases In drier periods of the year environmental water
flows are released on a needs basis from the upper
Yarra catchment to maintain the ecosystem health
of the networks of billabongs and wetlands
connected to the Yarra As these flows have the
potential to flush out litter caught in various places
along the river data on environmental water flow
releases between 2015 and 2020 were sourced
from Melbourne Water However a regression
analysis showed that there was no significant
association between environmental flow events
and plastic counts in the Yarra See Appendix 6 for
more details
F I G U R E 2 0
F I G U R E 2 1
| 32 |
Yarra and Maribyrnong microplastics research discussion
Clean Bay Blueprint and the preceding EcoCentre
projects are the first studies to investigate
microplastic loads in the Yarra and Maribyrnong
Rivers and provide the first estimation of microplastic
loads entering Port Phillip Bay on an annual basis
Every one of the 113 trawl samples analysed
between January 2015 and February 2020 contained
plastic pollution mostly consisting of microplastics
Nearly 25 billion pieces of plastic flow into Port
Phillip Bay annually from the surface waters of the
two major rivers of which over 2 billion are
microplastics smaller than 5 mm in diameter
These results are expected to be underestimations
of the litter volume entering the Bay as it does not
take into account the depth of the river and the fact
that high-density particles with additives or other
attachments and larger items will sink below the
level of trawled surface area (Mai et al 2018
Pattison 2020) As the mesh size of the net was
330 nm and sorting and counting of microplastics
was done with the naked eye particles smaller than
what could be caught in the net or observed and
confirmed as plastics during sorting (including
microfibres and nanoparticles) were not included It
must therefore be emphasised that total plastic
pollution numbers in the rivers are likely to be
much higher than the numbers in this report and
preventative and mitigating actions to reduce
plastic pollution are urgently required
gt Litter increases
An alarming result of this study is that litter is
increasing in both the Maribyrnong and the Yarra
with plastic pollution in the Yarra increasing at a
much faster rate The rate at which plastic pollution
in both rivers is increasing is very high litter in the
Yarra increased by 400 in 2017 compared to 2016
and then in 2019 it again more than doubled
compared to 2018 levels The Maribyrnong saw a
more gradual increase over time but still increased
by around 57 to 83 year on year since 2017
The Yarra exceeded the Maribyrnong in terms of
expected plastic pollution loads in 2016 (Charko
et al 2018) These changes are mostly driven by
increases in hard and soft plastic fragments and
polystyrene rather than the other categories of litter
meaning these are the litter categories that should
be addressed immediately at their source
As this study shows a very strong positive
correlation of plastic pollution with population
growth in Melbourne and the population of Greater
Melbourne is projected to grow from 5 million to 9
million by 2056 (DELWP 2019) it is expected that
plastic pollution increases will continue until
effective source reduction measures are taken
Nearly 25 billion pieces of plastic flow into
Port Phillip Bay annually from the surface waters
of the two major rivers of which over 2 billion are
microplastics smaller than 5 mm in diameter
3 M I C R O P L A S T I C S I N T H E Y A R R A A N D M A R I B Y R N O N G R I V E R S
C O N T E N T S
| 33 |
gt Litter composition in the rivers
Sample analyses revealed that hard plastic fragments
polystyrene and soft plastics were the most
common items captured Despite the manta netrsquos
selectivity to small buoyant items the sample results
largely align with several other local litter audits
Litter audits along the Westgate Park foreshore and
along St Kilda beaches between 2015 and 2017
revealed polystyrene packaging and soft plastics
(bits of plastic bags wrap cellophane etc) are the
second and third most dominant litter categories
after cigarette butts4 Hard plastic fragments were
the most captured items in manta net trawls in the
Bay (see Chapter 4) and the second most prevalent
litter items found on beaches around the Bay using
the Baykeeper Beach Litter Audit method to
monitor for microplastics (see Chapter 5)
Polystyrene is the most captured litter item in the
Bandalong litter traps in the Yarra River (Kowalczyk
and Kelly 2020) As cigarette butts much like other
heavier items sink after a relatively short period in
water and pass under the manta net their numbers
in the Yarra and Maribyrnong River trawls do not
align with general beach clean-up data where
cigarettes often dominate In addition beach
clean-up efforts are typically geared towards the
collection of large litter items Consequently hard
plastic fragments and microplastics are not
systematically recorded in litter clean-ups
In general trawl findings provide a fairly robust
representation of the microplastic pollution issue
providing valuable information about the
composition and relative abundance of dominant
buoyant litter items entering Port Phillip Bay
It is worth noting that hard plastic fragments
polystyrene and soft plastics also dominate
microplastic pollution in other urbanised
catchments around the globe These items were
the most abundant litter types collected in trawls in
the New York-New Jersey Harbour estuary USA
one of the most urbanized estuaries on earth (S
Meola New YorkndashNew Jersey Baykeeper pers
comm 2015) Similarly hard plastic fragments
polystyrene and plastic foil dominated microplastic
loads along the length of the Rhine River in Europe
(Mani et al 2015) This is not surprising given that
worldwide the packaging industry the primary
material source of microplastics in this study is the
third largest after food and energy (Moore and
Phillips 2011) and around 11 of plastic waste
generated gets lost in the environment (Borelle
et al 2020) where it breaks up into smaller pieces
under the prevailing environmental conditions
It is clear that the Yarra has much higher total litter
counts than the Maribyrnong This is probably
because the Yarrarsquos catchment area (4046 km2) is
larger than the Maribyrnongrsquos (1408 km2) and land
use between the catchments differs apart from the
Upper Yarra region the Yarra River catchment
includes 43 times more of urbanised area than the
Maribyrnong The respective Catchment Region
documents from Melbourne Waterrsquos Healthy
Waterways Strategy state that in the Maribyrnong
catchment
raquo about 10 retains its natural vegetation
(1408 km2)
raquo 80 is used for agriculture (11264 km2)
raquo 10 is urban development Greater Melbourne
and larger townships (1408 km2)
In the Yarra catchment
raquo 55 of the area retains its natural vegetation
(22253 km2)
raquo 30 is used for agriculture (12138 km2)
raquo 15 is urban development (6069 km2)
When comparing the other types of litter between
the rivers it was found that the Maribyrnong
4 amditangaroablueorg
| 34 |
(proportionally) has higher counts of soft plastics
nurdles bottle caps straws twine cigarette butts
and lsquootherrsquo items than the Yarra whereas
polystyrene is more problematic in the Yarra
gt Investigating litter by item category
Hard plastic fragments remain the most
problematic items in both rivers and have been
significantly increasing over the last five years Due
to their small size it is nearly impossible to trace
them back to their individual sources of pollution
They originate from broken-up larger items that are
lost from overflowing commercial household and
public bins littering and illegal dumping of waste
are blown off trucks during transport or from
construction andor demolition sites
The plastic polymer analysis showed that most
items in the samples were polyethylene (PE)
polypropylene (PP) or polystyrene (PS) which are
some of the most commonly used plastics in the
world However other common plastics like
polyethylene terephthalate (PET) and
polyvinylchloride (PVC) were largely absent from
the results Notably as per Pattison (2020)
degradation of polymers is not uniform and
different polymers break up via a range of
processes at varying rates (Gewert et al 2015)
Polymer types such as PE PP and PS break up faster
when exposed to UV radiation than PET and PU
thus potentially increasing the prevalence of these
secondary microplastics The varying densities of
polymers may also influence what is collected with
equipment such as the manta net which sits on the
water surface
The lowest density polymers found in the river
samples are most likely to float were PP
(090 g cm3) and PE (from 092- 097 g cm3) (see
Appendix 3A) Some of the higher density polymers
included PET (138-139 g cm3) and PVC (129-
144 g cm3) which are commonly used worldwide
but were only present in study samples in trace
amounts (see Appendix 3B) It is therefore likely that
denser polymers may be in sub-surface waters
floating underneath the manta net or have sunken
into the sediments as there is a strong correlation
between the number of microplastics found in river
sediments and increasing polymer density (Klein
et al 2015)
Further investigation of the water column and the
sediments are logical next steps in the process of
investigating microplastics pollution in the rivers
Polystyrene is the second most prevalent litter item
in the Yarra and in third place in the Maribyrnong
These findings are supported by litter research
conducted between 2017 and 2019 by the Yarra
Riverkeeper Association which found that
polystyrene was the most found item on the
riverbanks during community clean-ups as well as
in the Bandalong litter traps (Kowalczyk and Kelly
2020) A subsequent polystyrene pollution research
project by Cleanwater Group and Yarra Riverkeeper
Association attempted to trace this litter back to the
source by surveying 64 manufacturing and
distribution facilities (Barmand et al 2020) Over
80 of surveyed sites were found to have some
sort of polystyrene leakage into the environment
even when all reasonable precautions had been
taken to prevent this In addition more evidence is
being collected revealing that building sites are a
potential source of polystyrene pollution when
using insulation waffle pods5 Polystyrene also gets
lost in transport on loading bays and at waste
transfer and recycling facilities The fact that
polystyrene loss still occurs even when all
reasonable precautions are taken indicates that the
problems lie with the material itself and how it is
handled It therefore needs to be questioned if this
material should still be used for its current
purposes meanwhile alternatives should be
sought
3 M I C R O P L A S T I C S I N T H E Y A R R A A N D M A R I B Y R N O N G R I V E R S
C O N T E N T S
| 35 |
as community-led advocacy has led to retailers
swapping plastic straws for paper ones or not
offering plastic straws unless specifically requested
by their customers In some instances entire retail
precincts have pledged to cease the distribution of
plastic straws such as the traders on Gertrude
Street in Fitzroy (The Everleigh pers comm 2017)
The fact that the results of these community
initiatives are reflected in the monitoring data
indicates two things
raquo 1) Individual behaviour change community-led
advocacy and community action to reduce
plastic pollution can make a significant positive
difference for the environment
raquo 2) Ongoing data collection and monitoring of
plastic pollution are necessary to evaluate which
litter reduction initiatives are effective
Sponge is a category that has been significantly
increasing in the Yarra and mostly captures artificial
lsquospongeyrsquo substances such as sponge-like
household items building insulation foam and soft
packaging material When speculating where this
material comes from and why it is more prevalent
and increasing in the Yarra the increased residential
construction projects in the Yarra catchment may
correlate Further source tracing may provide insight
Other is a category applied to record items that are
not readily identifiable as fitting into any of the
other categories but are obviously not organic In
both rivers this category is significantly increasing
especially in the Maribyrnong where the graphrsquos
J-curve in Figure 18 suggests an exponential
increase This warrants closer investigation of this
category in future research to see if there are
specific items that are trending and if another litter
item category should be added for specific
monitoring focus
Soft plastic fragments are steadily increasing over
time Much like hard plastic fragments soft plastics
are difficult to trace back to a single source Much of
it likely comes from plastic littered on the streets or
it blows out of bins and skips due to its light weight
and prevailing wind strength and direction in relation
to the bin Once in waterways soft plastics carried
on rapid flood flows commonly snag on woody
streamside vegetation causing them to shred
Nurdles are ubiquitous in waterways all over
Victoria as supported by evidence gathered by
Tangaroa Blue Foundation and the EcoCentre since
2014 (N Blake F Charko pers comm 2020)
Although nurdles have neither significantly
increased nor decreased over the life of this project
they are still making up a steady 1 of microplastics
flowing into the Bay over time Chapter 5 of this
report shows that nurdles are the number one
microplastic type found on beaches around the
Bay indicating that this type of pollution is an
ongoing issue
As nurdles are classed as an industrial pollutant
rather than litter it is relatively easy to identify their
source These pellets can be traced back to the
premises of plastic manufacturers where they are
spilled on the loading bays and driveways and are
often incompletely or not at all recovered after a
spill Some get lost in road transport on their way to
manufacturers and end up in the gutters Refer to
Chapter 7 for recommendations on this issue
Plastic straws are the only item category that has
significantly declined over time in the Yarra This is
notably going against the trend of all other items in
both rivers that are either increasing or staying
constant over time The most likely explanation for
this is that over the last several years community
and business-driven source reduction initiatives
such as lsquoThe Last Strawrsquo have gained great traction
in Melbourne Individual behaviour change as well
5 Although the Master Builders Association offers a waste minimisation guide that includes waffle pods it does not outline how this material should be handled onsite to prevent spillage
| 36 |
Bottle caps cigarette butts and twine have neither
increased nor decreased in both rivers Although
cigarette butts are in the top ten of most littered
items in Australia their plastic filters get
waterlogged and most likely pass under the manta
net explaining the low numbers found in this study
gt Seasonal variations
When examining the seasonal effects on the rivers
the Maribyrnong proportionally has its largest
surface litter output in spring and autumn while for
the Yarra litter numbers are highest during summer
and winter One likely reason for this difference
could be related to sports events that draw large
numbers of people to the vicinity of the rivers such
as football season for the Yarra in winter and horse
racing events at Flemington Race Course in spring
for the Maribyrnong In summer the Yarra parklands
are extensively used for recreation and tourism in
Melbourne CBD is at its peak in DecemberndashJanuary
However both rivers have different land uses
influencing them and there are vast differences in
the industrial usage and population density along
the rivers (Yonkos et al 2014) Litter hotspots may
also play a role For example Calder Park Raceway
is located near Jacksons Creek not far upstream
from where the creek joins the Maribyrnong River
Road verges in the vicinity of Calder Park are
heavily littered (N Blake pers comm 2020) with
plastic items potentially shredded when verges are
seasonally slashed Both rivers are subject to
different street cleaning and sweeping schedules
and practices by local councils
gt Other factors influencing litter
Rainfall There is a positive correlation between
rainfall and plastic pollution which is consistent
with research worldwide Littered items anywhere
in the catchment eventually make their way down
to the nearest waterway through the stormwater
drain system heavily polluting creeks and streams
that lead into the big rivers and the Bay (picture 6)
Litter traps Although no statistical correlation was
found between microplastics spikes and emptying of
the litter traps this conclusion was reached through a
Wilcoxon rank sum test comparing median litter
Picture 6 Litter in the Merri Creek which flows into the Yarra
P I C T U R E 6
3 M I C R O P L A S T I C S I N T H E Y A R R A A N D M A R I B Y R N O N G R I V E R S
C O N T E N T S
| 37 |
counts when the litter trap was emptied to when the
litter trap was not emptied (two days before trawl) See
Appendix 5 for more details Just before publication of
this report subsequent advice was received from
Melbourne Water that the average Yarra River current
speeds between Burnley and Bolte Bridge is 55 km
per hour (P Rasmussen Melbourne Water Team
Leader Flood Preparedness pers comm 2020)
The distance from Burnley to Bolte Bridge is
approximately 758 km therefore estimated travel time
is about 06 to 38 hours with the average
approximately 15 hours The shorter duration could
be applied during higher flows following rainfall runoff
The longer durations are generally normal conditions
With tides ebbing and flowing for all conditions the
average may be best applied Accordingly any spikes
in trawl contents attributable to emptying of
Bandalong traps could only apply to trawls conducted
within just a few hours of the traps being emptied
Apart from litter prevention measures gross
pollutant traps could be installed on the
problematic major drain outlets and catch items
before they make it into the creeks Once it reaches
the creeks plastic pollution mixes in with organic
materials and will be more onerous and costly to
remove from the waterways due to the much
higher volumes presented by these combined
materials To be effective gross pollutant traps
require adequate and proactive maintenance
schedules and resources to prevent them from
blocking or overflowing
However gross pollutant traps do not often catch
microplastics Although the data in this report do
not show a direct statistically significant correlation
between microplastic capture and the emptying of
the Bandalong litter traps in the Yarra personal
observation of the manner in which the traps are
emptied confirms that microplastics do escape
during this process More targeted research
specifically designed to test for the effectiveness of
microplastics captured by gross pollutant traps
during their operation and maintenance is
therefore necessary
Yarra environmental water flow releases No
correlation was found between microplastics
captured in the trawls and Melbourne Waterrsquos
regulated release of environmental water flows for
the Yarra There is no evidence that environmental
water flows exacerbate plastic pollution in
waterways This supports the result that litter
originates from the street making its way into the
rivers through stormwater drains
gt Implications for marine life in the Yarra estuary
and Port Phillip Bay
Port Phillip Bay is a relatively closed system due to
the distance between the Bellarine and Mornington
Peninsulas being only just under 35 km Due to
prevailing winds it is likely the Bay is a sink for a major
portion of the plastics that enter it from the rivers
This study found that microplastics form the bulk of
items entering the Bay from the surface waters of the
Maribyrnong and Yarra rivers The results of a pilot
project of nine Bay trawls showed the presences of
microplastics in eight of nine samples (see Chapter 4)
To date very few studies have assessed
microplastic ingestioninteraction rates for faunal
species in Port Phillip Bay However worldwide
freshwater and marine species at all trophic levels
possessing varied feeding strategies ingest
microplastics (Eerkes-Medrano et al 2015) In
lab-based studies ingestion has been associated
with the retention and accumulation of
microplastics in organisms including but not limited
to mussels (Browne et al 2008) lobsters (Murray
and Cowie 2011) scallops (Brillant and MacDonald
2000) injury and subsequent disrupted feeding
swimming activity in lugworms as well as stress
immune response altered metabolic function and
| 38 |
toxicity in lugworms (Browne et al 2013) and fish
and mussels (Rochman et al 2013) It is also related
to tumour formation in fish (Rochman et al 2013)
and brain damage in fish (Mattson et al 2017)
Smaller sizes of plastic can potentially be ingested by
a greater range of species Plastic ingestion by local
wildlife is highly likely because of Port Phillip Bayrsquos
potential for high microplastic concentrations and
because these waters are so biodiverse Faunal
ingestion rates and impacts of marine microplastics
at the individual population and community levels
need to be assessed to prevent biodiversity loss in
the Bay and to better understand the human health
implications of consuming seafood from the Bay
Investing in necessary research will likely require
collaboration between departments managing water
pollution controls and fish populations respectively
gt Further study on microplastics
The estimations in this study showed that the Yarra
and Maribyrnong can transport nearly 25 billion
plastic pieces ndash of which more than 2 billion are
microplastics ndash into Port Phillip Bay annually and
that this may be an underestimation Ling et al
(2017) noted that plastic filaments including highly
pervasive clothing microfibre pollution between
0038 mm and 0250 mm formed the dominant
categories of microplastic in coastal and estuarine
sediments around Australia including Port Phillip
Bay However we know little about the
downstream movement and deposition of
microplastics in rivers It is not known what
portions of riverine microplastics travel
downstream below the surface waters sampled by
the manta net to eventually be released to the Bay
or deposited to the river sediments In the North
Shore Channel (Illinois USA) for example
microplastic concentrations in sediments were up
to 15000 times higher than surface water samples
(Hoellein et al 2017) Some microplastics are likely
transported long distances as several studies report
high concentrations of microplastics in estuaries
with rivers implicated as major microplastic sources
to these coastal zones (Yonkos et al 2014 Lima
et al 2014 Sadri and Thompson 2014) An example
of this was revealed during a community clean-up
event organised by the Yarra Riverkeeper
Association in April 2018 where a vacuum suction
device deployed by Ocean Crusaders removed over
47 million polystyrene pieces from the Yarra River
and its vegetated banks (A Kelly pers comm 2018)
Consequently in order to accurately identify the
magnitude of microplastic pollution in Port Phillip
Bay it is necessary to better understand microplastic
depositional patterns and take into account the water
column below the top 20 cm and the sediments
To advance current microplastics research in this
area the EcoCentre engaged a team of interns from
Worcester Polytechnic Institute (WPI) in the USA to
design and build a low-cost microplastics sampling
device easily built from hardware store materials
called the lsquoMicroplastics Collector With A Pumprsquo
(MCWAP) The MCWAP is a portable battery-
powered pump that takes water samples at various
depths in the water column down to a depth of 2 m
and runs these through a removable mesh 300 nm
filter to capture microplastics (picture 7) The
EcoCentre is planning a first trial of depth-sampling
for waterway microplastics in 2021
Picture 7 The MCWAP EcoCentrersquos portable microplastics depth-sampling device
P I C T U R E 7
3 M I C R O P L A S T I C S I N T H E Y A R R A A N D M A R I B Y R N O N G R I V E R S
C O N T E N T S
| 39 |
Maribyrnong River
Fishing in Port Phillip Bay
4
C O N T E N T S
| 41 |
Bay trawls pilotTo gain insight into the relative quantities of microplastics entering the Bay from Bass Strait as compared to the major rivers a pilot project of nine manta net trawls was conducted at the entrance to Port Phillip Bay with support from the Blairgowrie Yacht Squadron and the Australasian Ambassador for the 5 Gyres Institute
Trawls were conducted between April 2018 and
February 2020 at Popersquos Eye in Port Phillip Bay
during incoming tides and south-westerly winds
Trawl time was 30 minutes during which the vessel
was anchored to the sea bed in the tidal flow
Sample sorting was done in the same manner as
the river trawls (see Chapter 3)
Of the nine trawl samples collected at Popersquos Eye in
Port Phillip Bay eight contained plastics (Table 1) Of
the total 55 items found 35 (64) were
microplastics The most prevalent items were hard
plastic fragments which were found in six of nine
samples Samples in which plastic was found
contained up to 16 items The last sample
contained a remnant of a party balloon with the
balloon string still attached
Although the sample size is too small to perform
meaningful statistical analysis the findings suggest
there may be a worrying amount of plastic floating
on the surface waters of the Bay Given the size of
Port Phillip Bay is 1930 km2 and plastics were found
in 89 of samples collected through 30-minute
trawls plastics are potentially quite ubiquitous
A proportion of 80 of hard plastic fragments
found seems relatively consistent with the 75
proportion that flows into the Bay from the Yarra
and Maribyrnong indicating a probability that many
of these items may have originated from the Bay
passed through The Heads into Bass Strait and
then been recirculated back to the Bay by tidal
currents and prevailing winds More samples will
need to be taken and analysed in order to further
investigate this probability
Hard Fragments lt5 Hard Fragments gt5 Soft Plastics TwineLine Sponge Non-Plastic
Apr 18 3 4 1
May 18 6 2
Jun 18 8 6 2
Sep 18
Oct 18 2 1 3
Dec 18 1
Jan 19 2 1
Feb 19 1 2
Feb 20 2 1 1
TOTAL 19 16 2 5 2 5
Table 1 Items caught in Bay entrance trawls lsquoNon-Plasticrsquo included paper and a rubber balloon
T A B L E 1
4
Microplastic beach litter 5
C O N T E N T S
| 43 || 43 |
Baykeeper Beach Litter AuditsDevelopment of the Port Phillip Baykeeper Beach Litter Audit method commenced in 2014 in response to international studies confirming the environmental threat of plastic pollution At that time and to date there remains no international standard survey method with various existing data collection methods used by different leading bodies
While each method provided valuable information
their capacity to accurately record volumes of litter
over time ndash particularly microplastics ndash was seen to
be limited by one or more of the following factors
raquo lack of a clearly defined data collection area
raquo clean-up andor data collection methods
conducted on a scale that was unlikely to be
systematically repeated
raquo data collection recorded in a single area on a beach
(as opposed to a set of locations that represented
samples of all conditions on the beach)
raquo data recording conducted from a standing
position reducing the likelihood of recording
hard-to-spot microplastics
raquo data collection without removing litter
eliminating the possibility of clearly measuring
change in volumes occurring between surveys
The Baykeeper Beach Litter Audit methodology
was designed to focus on microplastic pollution
that poses an immediate threat to aquatic
organisms Key considerations in the design of this
method were the need to
raquo capture a representative sample of the conditions
on the beach
raquo establish an easily replicated method that can be
cost-effectively and consistently applied by
different groups around the Bay
raquo use data field terminology that was consistent
with terms used in the Australian Marine Debris
Initiative database
The Clean Bay Blueprint project provided an
opportunity to test the survey methodology over
several years with a range of user groups
| 44 |
Methodology
The survey method requires the combined search
time of the number of auditors to equate to at least
five minutes per quadrat Noting that some
quadrats will have very few if any microplastics
this requirement is designed to ensure consistency
of search effort and to enable a small team of two
people to comprehensively complete an audit in
less than an hour or two hours on more heavily
littered beaches This relatively small time
commitment facilitates regular conduct of audits
over the course of a year to achieve the statistical
rigour required to confirm trends in litter volumes
and type over time
gt Transect and quadrat placement
In order to capture a representative sample of all
beach conditions data is collected from three
transects across the beach In this context lsquoall beach
conditionsrsquo is referring to the structure of the beach
ndash shaped by the locally prevailing winds waves and
tidal currents ndash which transport sand debris and
litter to and from the beach To capture the
influence of these coastal processes over time and
to provide a basis for consistent search effort
transects are located at the widest central and
narrowest sections of beach
In each transect data is collected from three
quadrats at the top of the beach mid-beach and
on the last high tide line (Figure 22) The lsquotoprsquo
(inland edge) of the beach quadrats are in the same
place for each survey as locational reference points
Due to changing tidal conditions on the day the
distance between the top of the beach and last
high tide line (ie transect length) will vary Hence
the location of the mid-beach and quadrats at the
last high tide line differ for each survey Importantly
the quadrats located at the last high tide line
provide a sample of litter arriving on that day
Each transect starts at the lsquopermanent landmarkrsquo at
the top of the beach to ensure transects are in the
same place each time a survey is conducted
Transects run roughly at a right angle from the top of
the beach towards the closest point at the waterline
gt Selection of reference beach survey locations
With a view to gaining insights into catchment
sources of microplastics to the Bay beaches
surveyed for Clean Bay Blueprint in various regions
of Port Phillip Bay are generally associated with a
river or a creek that flows into the Bay Those that
are not directly associated with rivers or creeks (Rye
and Geelong Eastern Beach) are included to provide
insights into the mobility of litter due to tidal
currents and seasonal winds
5 B A Y K E E P E R B E A C H L I T T E R A U D I T S
Figure 22 Location of Baykeeper Beach Litter Audit data collection quadrats along the widest (1) central (2) and narrowest (3) beach transects
F I G U R E 2 2
C O N T E N T S
| 45 |
Plastics that float in the upper water column are
carried in the direction of wind-generated waves
and the direction of tidal currents during calm
(low-wind) conditions (N Blake pers obs 2020)
Due to the combined effects of tides and varying
wind directions some plastic objects may travel
widely in the Bay before eventually being cast upon
a beach A notable example was one of five
GPS-tracked PET bottles released in Elwood Canal
on 9 May 2019 by RMIT6 After remaining in the
Canal for almost two weeks they ultimately landed
on Dromana beach on 25 May due to a prevailing
northerly wind Therefore in the absence of data
collection conducted on a weekly basis it is
impossible to definitively conclude where beach
litter on any given day may have originally
come from However seasonal
data collection at multiple
(Bay-wide) reference sites does
provide some indication of the
likely source (the catchment)
and ultimately presents a
baseline dataset with which
to determine if microplastics
lsquoleakagersquo into the Bay is
increasing or decreasing
over time
gt Surveys conducted
Between July 2017 and March 2020 117 beach litter
audits were conducted in 12 locations around Port
Phillip Bay (Table 2) with the help of local
community group volunteers not-for-profits and
education institutes All citizen scientists involved
received multiple on-site training sessions by the
Port Phillip Baykeeper before independently
conducting audits Regular reference beaches were
surveyed every three months (in May August
November and February) with surveys of all
beaches generally conducted within the same
fortnight Only sites that were surveyed on at least
six occasions have been given more detailed
analysis in this report
LOCATION ASSOCIATED RIVER
OR CREEK AUDITS
COMPLETED
Eastern Beach Geelong na 11
Moorpanyal Beach Geelong na 2
Werribee River Jetty Werribee River 6
South Beach Werribee Werribee River 7
West Beach St Kilda Yarra River 15
Point Ormond Elwood Elwood Canal 3
Mordialloc Beach Mordialloc Creek 4
Keast Park Seaford Patterson River 10
Frankston Beach Kananook Creek 12
Mothers Beach Mornington NA 4
Mount Martha Beach Balcombe Creek 30
Rye Beach na 13
Total surveys 117
Table 2 Beach litter audit sites and number of audits done between July 2017 and March 2020 Beach names in bold are the regularly surveyed reference beaches the other beaches were opportunistically surveyed
T A B L E 2
6 RMIT Litter Tracker project httpswwwrmiteduauaboutschools-collegesscienceresearchresearch-centres-groupsaquatic-environmental-stresslitter-trackers
| 46 |
Results and discussion
Figures 23 and 24 show beaches along Port Phillip
Bayrsquos eastern shores recorded much higher
concentrations of litter than Geelong Werribee and
Rye The lower counts at Geelong and Rye can be
attributed to the fact there is no major waterway
entering the Bay in their general vicinity and
raquo as Geelong Eastern beach is located near the
westernmost end of Corio Bay it has very limited
exposure to litter dispersed by wind and tides
from wider Port Phillip Bay
raquo Rye beach is the southernmost survey location in
the Bay relatively removed from major streams
and urban catchment
The much lower (near negligible) counts at
Werribee South and Werribee River jetty are likely
attributable to the fact that the Werribee River
catchment is much less urbanised (around 20)
than the catchments associated with most of the
eastern sites of the Bay These results suggest that
litter makes its way to the Bay from the catchments
via the waterways
The high average counts at Keast Park (Seaford)
equate to 42 of total litter collected at all survey
locations Field observations and anecdotal reports
of industrial sites in the Mordialloc Creek and
Patterson River catchments have identified two
particular sites that may be significant contributors
to the overall plastic pollution recorded at Keast
Park This result warrants more detailed analysis
and investigation
A total of 11248 items were recorded in this study
A breakdown of items collected in Figure 25 shows
very few gross pollutants (eg intact plastic bottles
and bags) were recorded while nurdles (pre-
production pellets) and plastic fragments combined
comprised 77 of the total records The volume of
microplastics observed in 9 m2 compared to
microplastics reported in typical beach cleans
confirms the effectiveness of the methodology in
systematically recording microplastics at reference
sites around the Bay
Of all litter recorded the quadrats within the lsquolast
high tide linersquo recorded the greatest percentage of
items (45) followed by the lsquotop beach zone (38)
then the lsquomid-beach zonersquo (18) However this
order did not apply to all beaches with several of
the less littered beaches recording the greater
amount in the top beach zone (Figure 26) Mt
Martha is notable in this regard among the more
heavily littered beaches in that the lsquotop beachrsquo
quadrats had the highest amounts in all three
transects However this result was skewed
significantly by the top beach of the central beach
transect which averaged 278 items per survey ndash
almost as much as the totalled averages for all other
quadrats combined (338 items)
Keast Park has the distinction of having the
highest percentage of nurdles (59 of items
recorded) compared to St Kilda West beach (47)
Frankston (34) Rye (22) and Mt Martha (17)
Nurdles were virtually absent from beaches on the
west side of the Bay
Examination of plastic fragments by type and size
also found Keast Park distinguished from other
beaches with 53 of fragments being hard
fragments lt 5 mm Frankston ranked next highest
for hard plastic fragments with 37 followed by Mt
Martha with 34
The significantly higher counts of nurdles and hard
plastic fragments lt 5 mm may be due to a
combination of factors such as
raquo the broader range of wind directions that might
affect the site prevailing winds are acknowledged
as a primary agent for litter dispersal and Keast
Park is located at the easternmost point of Port
5 B A Y K E E P E R B E A C H L I T T E R A U D I T S
C O N T E N T S
| 47 |
Figure 23 Average litter per survey for all beaches surveyed
Figure 24 Visualisation of total litter counts on sampled beaches around Port Phillip Bay larger circles represent higher counts Image source Port Phillip Sea Pilots
F I G U R E 2 4
F I G U R E 2 3
| 48 |
Figure 25 Litter category percentages of total litter recorded across all sites The numbers above the percentages are the total items collected
Figure 26 Comparison of results for tide line mid-beach and top beach zones
Phillip Bay and subject to winds from south to
north (the widest range of all sites surveyed)
raquo orientation of the beach (near North-South at
Keast Park)
raquo physical infrastructure impeding wave action on
this particular beach (the Riviera stormwater
outfall projects into the Bay at a point around
20 m south of the survey area)
raquo presence of plastics manufacturing and re-grind
industries within the catchments
raquo proximity to industrial sites in local river and
stream catchments (Mordialloc Creek and
Patterson River) to the north of the survey beach
(tidal currents that run clockwise around the Bay
would carry plastics generated by these streams
towards Keast Park)
The Frankston beach survey site is oriented NNE to
SSW which is not dissimilar to the orientation of
Keast Park (NNW-SSE) The two sites are just seven
kilometres apart Despite this proximity the
Frankston site (located just to the south of
Kananook Creek mouth) recorded considerably
fewer nurdles and hard plastic fragments than Keast
Park (which is to the south of Mordialloc Creek and
Patterson River) These findings suggest that close
scrutiny of the Mordialloc Creek and Patterson River
catchments for nurdles and hard plastic fragments
is warranted
F I G U R E 2 5
5 B A Y K E E P E R B E A C H L I T T E R A U D I T S
C O N T E N T S
| 49 |
F I G U R E 2 5
| 51 |
Port Phillip Bay on a windy day
6
| 51 |C O N T E N T S
Related litter investigations Over the life of Clean Bay Blueprint the EcoCentre collaborated with many other organisations Other investigative litter projects enabled by the Port Phillip Bay Fund with the primary aim of data collection for pollution prevention include
raquo Yarra Riverkeeper Associationrsquos Litter and Flows and polystyrene projects - analysing
litter in the Yarra
raquo RMIT Universityrsquos Plastics Lab project ndash analysing
plastic fragment samples to identify polymers and
adsorbed contaminants
raquo Tangaroa Blue Foundationrsquos Letrsquos Strain the Drains7 ndash trialling stormwater pit filtration devices
to document the captured contents in a range of
municipalities and for four different street usages
raquo Scouts Victoriarsquos Street2Bay8 project ndash auditing
litter in six different street usages in all catchments
around the Bay
raquo RMIT Universityrsquos Litter Tracker4 project ndash GPS
tracking and on-line reporting of the mobility of
plastic bottles released into streams in
catchments leading to Port Phillip Bay
raquo Beach Patrol Australia and Love Our Street have
also compiled considerable data with the mobile
Litter Stopper phone app9
Interactive litter maps
It is essential to provide data access and report back
on research results to citizen scientists and those
advocating for and designing change Data collected
from the beach audit sites have been entered into
an interactive Tableau data visualisation platform
and is hosted on the EcoCentre website with
potential for visualising street litter data collected by
other groups Consequently the Tableau platform
appears to be a useful means of engaging with
schools and the wider community in relation to the
high mobility of microplastic pollution
The EcoCentre was also part of the community
reference group that helped design and test the State
Governmentrsquos LitterWatch10 database which collects
and collates litter data from all over Victoria visualises
this on a map and makes it publicly accessible This
is the first attempt to gather all litter data no matter
which data-collection methods were used and bring
this together in one accessible repository
Incident reporting
During the course of the study several materials that
have been noted as of ongoing concern were
reported to relevant authorities These included Telco
wire offcuts discarded at telecom sites on streets
polystyrene waffle pod waste leaking from a building
site and AstroTurf fragments leaking from a
sportsground demolition
All of the complementary initiatives represent major
advances in our understanding of plastic pollution
and warrant careful consideration as a whole body
of information as opposed to in isolation particularly
with a view to adopting the optimum suite of data
collection methods for the future and to set targets
for local source reduction plans
7 tangaroablueorglets-strain-the-drains-port-phillip-bay-region-vic 8 httpsscoutsvictoriacomauactivities-eventsactivitiesenvironmentstreet2bay-project 9 httpswwwbeachpatrolcomau 10 httpslitterwatchvictoriaorgau
Sunset over Port Phillip Bay
RecommendationsOver the life of the Clean Bay Blueprint project microplastic pollution has stopped being an lsquoemerging issuersquo The irrefutable evidence of its unacceptable impact on the environment is well-documented all over the world
7
C O N T E N T S
| 53 |
Many governments are acting on the
recommendation from the science community that
society should not wait for any more quantification
of damage before taking action to reduce marine
plastic pollution impacts (Lavers and Bond 2017
Gall and Thompson 2015) In their report Marine
Plastics Debris and Microplastics the United Nations
stated there is a moral argument that we should not
allow the ocean to become further polluted with
plastic waste and that marine littering should be
considered a lsquocommon concern for humankindrsquo
(UNEP 2016)
The high quantities of litter and microplastics in the
Yarra and Maribyrnong rivers highlight the large
contribution of these rivers to marine plastic
pollution in Port Phillip Bay Recent research by
Borelle et al (2020) projected the future of plastic
pollution in our oceans and concluded that the
predicted growth in plastic waste in the next 10
years far exceeds the impacts of mitigation efforts
currently deployed Therefore significant changes
and investments need to be made to counter the
rising tide of plastic pollution in the oceans
| 54 |
Recommendation 1
gt Improve product stewardship
Plastic and microplastic pollution are everybodyrsquos
problem Over the lsquolifecyclersquo of a plastic item it
travels through the fossil fuel and petrochemical
industries transport and shipping plastic product
manufacturers retailers community local councils
waste contractors and the recycling industry
However whereas every link in this user chain has
some level of responsibility not everyone should be
expected to have the same level of accountability
for plastic waste The current responsibilities for the
fate of plastic products are not well-defined and are
often passed on to the next group down the line
putting a disproportionately large strain on
communities and local councils There is very little
meaningful manufacturing industry accountability
for the end-of-life destination of plastic whether for
waste management or pollution of the environment
The plastics industry is set to grow 40 by 203011
yet hardly any producer responsibility is taken for
the waste and problems its products cause Only
94 of manufactured plastic is being recycled in
Australia (OrsquoFarrell 2019) which is consistent with
9 world-wide9 An astonishing 11 enters the
oceans (Borelle et al 2020) Currently local councils
and the community are expected to deal with the
consequences of unregulated production of a
material that lasts in the environment forever
As Victoria is moving from a linear to a circular
economy model this is the perfect time to change
and define the responsibilities of the plastics
industry and their accountability Federal and state
governments play a key role in leading and
managing this change Some of the changes that
the EcoCentre believes should be made in the short
and long term are
11 Transition to a circular economy model
Product recovery schemes (such as the
container deposit legislation) that are part of a
circular economy model should be funded by
the industries which produce the product
and managed by an independent government
agency to prevent perversion of the initiative
12 Invest in implementing alternatives to
plastic Plastic is not the right material for
the majority of functions it performs eg
using a material that lasts forever for single-
use packaging The ever-increasing
monetary and environmental costs of
dealing with plasticrsquos end-of-life stage are too
high Many alternative truly biodegradable
materials have already been invented but
have not been taken up for large-scale use
Industry needs to be given incentives to
transition towards producing large-scale
alternative packaging solutions eg through
new legislation or stimulus measures such
as innovation grants or tax incentives
13 Set limits on virgin plastic production
This includes avoiding investments in
waste-to-energy schemes that burn plastic
as it perpetuates our reliance on a product
that should not be burned in the first place
14 Ban broad-scale groups of problematic
single-use plastics12 Examples such as South
Australiarsquos ban on single-use plastic items
will provide some of the incentives driving
innovation and transformation Bans may be
premised on design qualities rather than
product type for example banning oxo-
11 httpswwwplasticsoupfoundationorg 12 The Australian National Waste Policy Action Plan commits to banning lsquoproblematic and unnecessary single-use plasticsrsquo by 2025 and delegated the Australian Packaging Covenant Organisation to lead all governments to lsquoIdentify problematic and unnecessary single-use plastic packaging to provide an evidence base for industry to take coordinated actionrsquo by 2019 The resulting report identified four priority categories (including expanded polystyrene and non-certified compostable packaging such as oxo-degradable) and three materials for further investigation httpswwwpackagingcovenantorgaudocumentsitem3183
7 R E C O M M E N D A T I O N S
C O N T E N T S
| 55 |
13 Operation CleanSweep is a best-practice manual for plastic manufacturers that employs cost-effective ways of preventing nurdles leaking into the environment
degradable plastics (that merely break into
microplastics faster rather than biodegrade to
natural component materials) or non-
recyclablenon-compostable packaging
15 Make the Operation CleanSweep13
program mandatory instead of voluntary
for any manufacturer using nurdles and have
this enforced by EPA Victoria
Recommendation 2
gt Cultivate effective partnerships
It is critical that conversations and true working
partnerships are forged and maintained with a
long-term vision of collaboration and tangible
positive outcomes In the case of an issue as big as
plastic pollution cross-sectoral collaborations are
essential to ensure effective changes Industry local
government state government agencies (such as
EPA Victoria the Catchment Management
Authorities and Melbourne Water and others)
research institutes community organisations and
businesses all need to engage in ongoing dialogue
about responsibilities and most importantly to
reach clear agreement on which group is
accountable for delivery of each defined outcome
that is necessary to the success of the overall
enterprise This might be achieved through
stakeholder working forums similar to the Victorian
Department of Environment Land Water and
Planningrsquos Integrated Water Management Forums
Recommendation 3
gt Support local councils in waste management
Until larger systemic changes in waste
management are made the end-of-line
responsibilities councils have for plastic waste need
to be adequately supported and resourced The
costs of this should not be transferred to the
community via rate increases nor by reliance on ad
hoc manual volunteer clean-ups
Measures should include effectively resourcing
councils to
31 Install and maintain pollutant traps in
drain outlets that discharge into creeks
and rivers This could be a collaboration
with Melbourne Water Care should be taken
to not just install gross pollutant traps but
also traps that catch microplastics such as
Drain Buddies
32 Enforce litter and illegal dumping law
33 Run effective litter prevention and
education programs in the community and
especially with local businesses and industry
This may be best done by partnership with
trusted business or community
organisations supporting the outreach
34 Review and improve current street
sweeping schedules and where necessary
adapt these to be more effective at the
occurrence of large sporting events and
seasons when litter peaks occur
| 56 |
Recommendation 4
gt Continue monitoring (micro)plastic pollution
Existing waste management and anti-litter
initiatives are not effective enough to stop plastic
and microplastic pollution from reaching Port Phillip
Bay The research in this report has established a
baseline data set that shows that the problem is
getting worse over time
The river trawls and beach litter audit methods
described in this report are both demonstrated to
be scientifically valid means of ongoing data
collection and the multiple years of data gathered
represent a benchmark of plastic pollution in the
major rivers and Port Phillip Bay The street litter
audit method applied by Scouts Victoria in the
Street2Bay project has also proven to be an
effective and replicable means of monitoring plastic
pollution on streets in Port Phillip Bay catchments
Continued data collection using these methods can
provide a means of evaluating any future strategies
to reduce plastic pollution in waterways
Recommendation 5
gt Increase education and lsquoplastic literacyrsquo of all
plastic users
As part of cultivating a shared responsibility for
plastic use and disposal education of plastic users
is essential The general public has become much
more aware of the issues of plastic pollution in the
environment thanks to a boom in scientific
research followed by mainstream film
documentaries and social media and community
campaigns over recent years
However there is still much confusion about how
plastic can be avoided or what plastics are more
preferable to others An example of this is the actual
meanings of the words lsquobiodegradablersquo lsquodegradablersquo
lsquooxo-degradablersquo and lsquocompostablersquo for plastic bags
People generally try to do the right thing and want
to invest in better products but industry uses the
terms in misleading ways (picture 8)
Recommendations are therefore
51 Set standard legal definitions for
degradability labels
Not-for-profit organisations as well as local councils
play a key role in educating the community and
implementing education programs in schools
Organisations that specialise in this should be
adequately resourced It is likely the reduction in
plastic straws in the Yarra can be attributed to
education efforts and community behaviour change
projects showing that these approaches work The
community and NGOs are not significantly
mentioned in Recycle Victoria (February 2020)
whereas community and cross-sector
collaborations are mentioned in the Port Phillip Bay
EMP but funding for joint activities is unclear after
the conclusion of the Port Phillip Bay Fund in 2020Picture 8
Industry messaging on plastic bag
7 R E C O M M E N D A T I O N S
C O N T E N T S
| 57 |
52 Develop project grants forums and
strategic ongoing partnerships that
integrate community government research
and industry efforts
53 Adequately resource groups who
educate and facilitate action on plastic
pollution
Recommendation 6
gt Conduct further research
As highlighted in the study discussions above
additional research is needed to adequately monitor
microplastics in Melbournersquos waterways and Port
Phillip Bay Ongoing monitoring of surface waters is
necessary to track the quantities and movements of
microplastics and can serve as a baseline for source
reduction action Given the high numbers of
microplastics reaching the Bay from surface waters
it is also important to conduct further research into
the water column and the sediments
Recommendations for further research are
61 Conduct depth-sampling studies The
EcoCentre will pilot the MCWAP to start
monitoring microplastics in the water
column If successful the device and
methodology could be rolled out for use
across creeks and rivers of Victoria
62 Conduct sediment studies Sediment
research is necessary to identify where the
heavier polymers end up according to
Schwarz (2019) river sediments act as a plastic
sink and CSIRO estimated that based on their
samples taken in the South Australian Bight
144 million tonnes of microplastics reside on
the seafloor worldwide (Barrett et al 2020)
63 Prioritise understanding the
contaminants carried by plastic in
waterways and associated human health
risks Continued analysis of plastic polymer
types and chemical contaminants carried by
plastics in waterways is necessary to
strengthen our understanding of the
potential ecological and human health
impacts of plastic pollution
64 Conduct on-ground investigations for
major sources of hard plastics fragments
and nurdles within the Mordialloc Creek and
Patterson River catchments
Plastics Lab Dr Mayumi Allinson
View of St Kilda Beach
8
C O N T E N T S
| 59 |
A note on citizen scienceThe research conducted in this study strongly relied on the collaborations with volunteer citizen scientists Citizen science has received increasing recognition over the last decade and rightly so without more than 8800 hours contributed by volunteers for data collection sample sorting and analysis Clean Bay Blueprint could not have produced such robust results
This project is hardly an exception these days as
volunteers both individually and via community
groups put countless hours of their time and
expertise towards environmental projects that rely
on large datasets and labour-intensive analyses
It needs to be recognised that the contributions of
citizen scientists to science and environmental
change-making are both invaluable and essential
and that collaborations between research
institutions and community provide a powerful
opportunity to build understanding of complex
issues of Victorian Australian and global
significance Resourcing the professional
coordination of such collaborative studies often
provides funders with a multifold return on the
investment through generating new knowledge
inspiring extensive in-kind contributions and
activating community-led conversations and action
on topics that might otherwise be uncommon
around dinner tables classrooms and clubs
9
Little Penguin in Port Phillip Bay
C O N T E N T S
| 61 || 61 |
AcknowledgementsOne of Clean Bay Blueprintrsquos main goals was to build partnerships with other organisations that target litter and improve Bay health
raquo Khadija Muhanna Saif Al
Nabhani - RMIT University
raquo Hilda Poloso - RMIT University
raquo Minh Tu - Deakin University
raquo Daniel Cox - RMIT University
raquo Nick Bergstrom - Worcester
Polytechnic Institute
raquo Sarah Duquette - Worcester
Polytechnic Institute
raquo Madison Healy - Worcester Polytechnic Institute
raquo Nick Sorensen - Worcester Polytechnic Institute
raquo Cameron Collins - Worcester Polytechnic Institute
raquo Samantha Comeau - Worcester Polytechnic Institute
raquo Brendan Gallagher - Worcester Polytechnic Institute
raquo Gina Visser - Worcester Polytechnic Institute
raquo Katie Donovan - Worcester Polytechnic Institute
raquo Spencer Hoagland - Worcester Polytechnic Institute
raquo Thomas Lipkin - Worcester Polytechnic Institute
raquo Eric Stultz - Worcester Polytechnic Institute
We recognise the extensive and energetic contributions of many interns
Many new collaborations and ongoing partnerships were formed and many existing relationships were
leveraged during this project This was made possible by the funding from the Port Phillip Bay Fund of
EcoCentre projects as well as those of other organisations We therefore thank the State Government of
Victoria for its support
Our sincere thanks goes out to the many volunteers including work placement students and interns who
have donated hours of their time and expertise to the project to make it a success We acknowledge your
great passion for the environment and deep dedication to making positive change for the future of our
waterways This project would not have been possible without your support
raquo Balcombe Estuary Reserves
Group Mt Martha
raquo Beach Patrol Mt Martha
raquo Frankston Beach Patrol
raquo Rye Beach Patrol
raquo Beach Patrol Australia
raquo Seaford Beach Patrol
raquo Werribee Beach Patrol
raquo Werribee River Association
raquo Yarra Riverkeeper Association
raquo David Flew
(Karringal boat skipper)
raquo Blair Stafford Australasian
Ambassador of the 5 Gyres
Institute
raquo Blairgowrie Yacht Squadron
raquo Metropolitan Waste and Resource Recovery Group
raquo Melbourne Water
raquo Parks Victoria
raquo 3CR Community Radio
raquo 3RRR Community Radio
raquo Sacred Heart Mission
raquo Bellarine Catchment Network
raquo RMIT Plastics Lab Prof Graeme Allinson Dr Mayumi Allinson Marinda Pattison and students
raquo Scouts Victoria
raquo Worcester Polytechnic Institute
raquo Dolphin Research Institute
raquo Sustainability Victoria
raquo Victorian Litter Action Alliance
raquo Gordon TAFE
raquo Dr Christopher Johnstone and Emma Barnett of Monash University
raquo Victorian National Parks Association
raquo Federation University
raquo Australian Citizen Science Association
raquo The Age
raquo Department of Environment Land Water and Planning
raquo Ying Quek
raquo Port Phillip Menrsquos Shed
We thank the following organisations groups and individuals for their contribution and collaboration (in no particular order)
Appendicesgt Appendix 1
| 62 |
Figure 28 Percentage of microplastics in samples per trawl in the Yarra (blue) and Maribyrnong (red) rivers with 95 confidence intervals shaded grey The average percentage of microplastics per sample was 184 This number has stayed constant over time
F I G U R E 2 8
Appendices
Microplastic Image Josie Jones
C O N T E N T S
| 63 || 63 |
gt Appendix 2
MARIBYRNONG YARRA
Hard plastic fragments 174 -102
Soft plastics 959 -560
Polystyrene -1688 986
Nurdles 803 -469
Plastic bottle caps 542 -317
Plastic straws 529 -309
Sponge -167 097
Twine 412 -241
Other 004 002
Cigarette butts 596 -348
F I G U R E 2 9
Figure 29 Mosaic plot showing the Chi-Square test results (in Table 3 below) The statistical test looks at whether proportions are different than what is expected by chance considering both the Yarrarsquos and Maribyrnongrsquos total litter The width of the boxes show the proportion of litter in the Maribyrnong compared to the Yarra The height of the boxes shows the proportion of litter for each litter item The colours represent significance Boxes coloured red have lower proportions than expected by chance and those in blue have higher proportion than expected by chance The boxes for hard plastic are grey meaning there are no significant differences in proportions of expected hard plastic fragments in the Maribyrnong or Yarra rivers (P gt 005) The boxes for nurdles bottle caps straws and soft plastics are blue for the Maribyrnong and red for the Yarra meaning there are proportionally more nurdles bottle caps plastic straws and soft plastics than expected in the Maribyrnong river and fewer than expected in the Yarra (P lt 005)
Table 3 Residuals from Chi-square test for plastics count as a function of waterway and plastics category Significant values are in bold red
T A B L E 3
| 64 |
gt Appendix 3
Plastic polymer analysis
A
B The below Table 7 is used with
permission from the unpublished
Honours dissertation Analysis of
Microplastic Polymers in the Yarra and
Maribyrnong Rivers (May 2020) by
Marinda Pattison under supervision of
Associate Professor Graeme Allinson
Table 6 Plastic polymer density (Stelray Plastic Products 2020)
T A B L E 6
YARRA RIVER MARIBYRNONG RIVERPercentage () Std Dev Percentage () Std Dev
Total PE 4750 1113 4916 1562
PP 2204 1024 2361 867
PS 1530 1195 791 871
PU 088 217 035 067
Nylons 027 064 104 241
EVA 043 062 049 101
PVC 021 065 008 023
Latex 002 008 005 019
PE amp PP mix 023 039 021 055
PET 002 008 000 000
Nitrile 000 001 000 000
PMMA 002 009 000 000
PTFE FEP 000 000 000 000
CA 001 005 000 000
PC 001 006 007 027
ABS 012 046 000 000
Unknown 067 096 088 113
T A B L E 7
Table 7 Mean abundance (percentage) of polymers in Yarra and Maribyrnong Rivers
A P P E N D I C E S
C O N T E N T S
| 65 |
gt Appendix 4
Changes in individual litter items over time
YARRA RIVER
Plastic Kendallrsquos tau Z P-value
Hard Plastic Fragments 033 741 lt0001
Nurdles 008 086 0391
Other 023 229 0022
Plastic Bottle Caps 016 146 0146
Plastic Straws -025 -234 0019
Polystyrene 022 346 0001
Soft Plastics 027 578 lt0001
Sponge 025 248 0013
Twine 007 072 0470
Cigarette butts 017 164 0102
MARIBYRNONG RIVER
Plastic Kendallrsquos tau Z P-value
Hard Plastic Fragments 026 552 lt0001
Nurdles -004 -044 0657
Other 043 416 lt0001
Plastic Bottle Caps -013 -125 021
Plastic Straws -021 -195 0051
Polystyrene 009 14 0161
Soft Plastics 013 279 0005
Sponge 007 064 0524
Twine 004 042 0671
Cigarette butts -003 -031 0755
Table 4 Kendallrsquos tau test results Change in counts of plastic over time by category for the Yarra and Maribyrnong rivers Kendallrsquos tau the Z value and P-values are presented Significant values are in red These results are important for interpreting the scatterplots in Figures 18 and 19 A positive tau indicates an increase in litter over time A negative tau indicates a decrease over time Kendallrsquos tau is a non-parametric correlation value
T A B L E 4
| 66 |
gt Appendix 5
Bandalong litter traps
In the Yarra River multiple outliers were recorded for the total litter items captured per trawl date Litter traps
were emptied over 24 of the trawl days Six of those days showed higher than average litter counts On 35
trawl days litter traps were not emptied and we saw five higher than average total litter counts
Figure 30 A Wilcoxon rank sum test compared median litter counts when litter trap was emptied to when litter trap was not emptied (two days before trawl) We did not find any effect of litter trap emptying on the total number of litter items captured (W = 289 P = 0162)
F I G U R E 3 0
A P P E N D I C E S
C O N T E N T S
| 67 |
gt Appendix 6
Yarra Environmental flows
There was no significant association between environmental flow events and plastic counts in the Yarra (t =
-03 P = 0768) The amount of variation in microplastic counts explained by environmental flows was close
to zero (adjusted R2 lt 0001) Note that microplastic count was square root transformed to meet
assumptions of a regression analysis
Figure 31 Count of microplastics per trawl as a function of environmental flows in the Yarra River
F I G U R E 3 1
raquo Andrady A L (2006) Assessment of
environmental biodegradation of synthetic
polymers Polym Rev 1994 3425ndash76
raquo Andrady A L (2011) Microplastics in the marine
environment Marine pollution bulletin 62
1596-1605
raquo Barua S Muttil N Ng A amp Perera B (2013) Rainfall
trend and its implications for water resource
management within the Yarra River catchment
Australia Hydrological Processes 27 1727-1738
raquo Barmand S Goodsell K Yardley D Kowalczyk N
(2020) Polystyrene pollution in the Yarra river
sources and solutions Yarra Riverkeeper
Association
raquo Barnes D K Galgani F Thompson R C amp Barlaz
M (2009) Accumulation and fragmentation of
plastic debris in global environments
Philosophical Transactions of the Royal Society of
London B Biological Sciences 364 1985-1998
raquo Barrett J Chase Z Zhang J Banaszak Holl M M
Willis K Williams A Hardesty B D Wilcox C
(2020) Microplastics pollution in deep-sea
sediments from the Great Australian Bight
Frontiers in Marine Science October 2020
Volume 7 Article 576170
raquo Blake N amp Charko F (2014) Pilot study to identify
the extent of microplastics in the Maribyrnong
and Yarra Rivers and Port Phillip Bay Port Phillip
EcoCentre report
raquo Borelle S B Ringma J Law K L Monnahan C C
Lebreton L McGivern A Murphy E Jambeck J
Leonard G H Hilleary M A Eriksen M
Possingham H P De Frond H Gerber L H
Polidoro B Tahir A Bernard M Mallos N Barnes
M Rochman C M (2020) Predicted growth in
plastic waste exceeds efforts to mitigate plastic
pollution Science 369 (6510) 1515-1518
raquo Brillant M amp Macdonald B (2000) Postingestive
selection in the sea scallop Placopecten
magellanicus (Gmelin) the role of particle size
and density Journal of Experimental Marine
Biology and Ecology 253 211-227
raquo Browne M A Dissanayake A Galloway T S
Lowe D M amp Thompson R C (2008) Ingested
microscopic plastic translocates to the circulatory
system of the mussel Mytilus edulis (L)
Environmental science amp technology 42
5026-5031
raquo Browne M A Niven S J Galloway T S Rowland
S J amp Thompson R C (2013) Microplastic moves
pollutants and additives to worms reducing
functions linked to health and biodiversity
Current Biology 23 2388-2392
raquo Charko F Blake N Kowalczyk N Johnstone C
Seymore A Quek Y (2018) Microplastics in the
Maribyrnong and Yarra Rivers Melbourne
Australia Port Phillip EcoCentre report
raquo CIEL (2019) Plastic amp climate the hidden costs
of a plastic planet Center for International
Environmental Law
httpswwwcielorgplasticandclimate
raquo Chidambarampadmavathy (2017) Sustainable
bio-plastic production through landfill methane
recycling Renewable and Sustainable Energy
Reviews Volume 71 May 2017 Pages 555-562
raquo Cole M Lindeque P Halsband C amp Galloway T S
References
| 68 |
R E F E R E N C E S
C O N T E N T S
| 69 || 69 |
(2011) Microplastics as contaminants in the
marine environment a review Marine pollution
bulletin 62 2588-2597
raquo Commonwealth of Australia (2016) Toxic tide the
threat of marine plastic pollution in Australia
Environment and Communications Reference
Committee
raquo DAWE (2018) National Waste Policy - less waste
more resources Department of Agriculture Water
and the Environment
raquo DAWE (2019) National Waste Policy - Action plan
Department of Agriculture Water and the
Environment
raquo DELWP (2017) Port Phillip Bay Environmental
Management Plan The State of Victoria
Department of Environment Land Water
and Planning
raquo DELWP (2019) Victoria in Future 2019 ndash
Population Projections 2016 to 2056 The State of
Victoria Department of Environment Land Water
and Planning
raquo Depledge M Galgani F Panti C Caliani I Casini
S amp Fossi M (2013) Plastic litter in the sea Marine
environmental research 92 279-281
raquo Eerkes-Meedrano D Thompson R C amp Aldridge
D C (2015) Microplastics in freshwater systems a
review of the emerging threats identification of
knowledge gaps and prioritisation of research
needs Water research 75 63-82
raquo Galgani F Hanke G Werner S Oosterbaan
Nilsson P Fleet D (2013) Guidance on monitoring
of marine litter in European seas European
Commission
raquo Gall S amp Thompson R (2015) The impact of debris
on marine life Marine Pollution Bulletin 92 170-179
raquo Gasperi J Wright S L Dris R Collard F Mandin
C Guerrouache M Langlois V Kelly F J Tassing
B (2018) Microplastics in air are we breathing it
in Current Opinion in Envi Sci amp Health vol 1 1-5
raquo Gewert B Plassmann M M MacLeod M (2015)
Pathways for degradation of plastic polymers
floating in the marine environment
Environmental Science Processes amp Impacts vol
17 no 9 pp 1513-1521
raquo Hoellein T J McCormick A R Hittie J London
M G Scott J W amp Kelly J J (2017) Longitudinal
patterns of microplastic concentration and
bacterial assemblages in surface and benthic
habitats of an urban river Freshwater science
35(3) 000-000
raquo Jambeck J R Geyer R Wilcox C Siegler T R
Perryman M Andrady A Narayan R amp Law K L
(2015) Plastic waste inputs from land into the
ocean Science 347 768-771
raquo Jepson P D Deaville R Barber J L Aguilar A
Borrell A Murphy S Barry J Brownlow A
Barnett J Berrow S Cunningham A A Davidson
N J Ten Doeschate M Esteban R Ferreira M
Foote A D Genov T Gimenez J Loveridge J
Llvona A Martin V Maxwell D L Papachlimitzou
A Penrose R Perkins MW Smith B De Stephanis
R Tregenza N Verborg P Fernandez A Law R J
(2016) PCB pollution continues to impact
populations of orcas and other dolphins in
European Waters Nature Science Reports 6 18573
raquo Kim JS Lee HJ Kim SK Kim HJ (2018) Global
Pattern of Microplastics (MPs) in Commercial
| 70 |
Food-Grade Salts Sea Salt as an Indicator of
Seawater MP Pollution Environ Sci Technol
2018 52 21 12819-12828
raquo Klein S Worch E Knepper T P (2015) Occurrence
and spatial distribution of microplastics in river
shore sediments of the Rhine-Main area in
Germany Environmental Science amp Technology
vol 49 no 10 pp 6070-6076
raquo Kowalczyk N Kelly A (2020) Litter and Flows
Connecting the Yarra and Bay Yarra Riverkeeper
Association
raquo Lamb JB Willis BL Fiorenza EA Couch CS
Howard R Rader DN True JD Kelly LA Ahmad
A Jompa J Harvell CD (2018) Plastic waste
associated with disease on coral reefs Science
359 460-462 (2018)
raquo Lavers J L Bond A L (2017) Exceptional and
rapid accumulation of anthropogenic debris on
one of the worldrsquos most remote and pristine
islands Proceedings of the National Academy of
Sciences 201619818
raquo Lavers J L Bond A L amp Hutton I (2014) Plastic
ingestion by Flesh-footed Shearwaters (Puffinus
carneipes) Implications for fledgling body
condition and the accumulation of plastic-derived
chemicals Environmental Pollution 187 124-129
raquo Lima A Costa M amp Barletta M (2014) Distribution
patterns of microplastics within the plankton of a
tropical estuary Environmental Research 132
146-155
raquo Ling S Sinclair M Levi C Reeves S amp Edgar G
(2017) Ubiquity of microplastics in coastal seafloor
sediments Marine Pollution Bulletin 121(1-2)
raquo Lusher A Hollman P Mendoza-Hill J (2017)
Microplastics in Fisheries and Aquaculture ndash
status of knowledge on their occurrence and
implications for aquatic organisms and food
safety Food amp Agriculture Organisation of the
United Nations Technical paper 615 Abstract V
raquo Mai L Bao LJ Shi L Wong CS Zeng EY (2018)
A review of methods for measuring microplastics
in aquatic environments Environ Sci Pollut Res
25 11319-11332 (2018)
raquo Mani T Hauk A Walter U amp Burkhardt-Holm P
(2015) Microplastics profile along the Rhine River
Scientific Reports 5 17988
raquo Mattson K Johnson E V Malmendal A Linse S
Hansson L-A Cedervall T (2017) Brain damage
and behavioural disorders in fish induced by
plastic nanoparticles delivered through the food
chain Scientific Reports volume 7 Article
number 11452 (2017)
raquo Melbourne Water (2018) Co-Designed Catchment
Program for the Maribyrnong Catchment Region
(including Moonee Ponds Creek) ndash October 2018 |
Version 1
raquo Melbourne Water (2018) Co-Designed Catchment
Program for the Yarra Catchment ndash October 2018
| Version 1
raquo Moore C amp Phillips C (2011) Plastic Ocean How a
sea captainrsquos chance discovery launched a
determined quest to save the oceans Avery
New York
raquo Murray F amp Cowie P R (2011) Plastic
contamination in the decapod crustacean
Nephrops norvegicus (Linnaeus 1758) Marine
pollution bulletin 62 1207-1217
References (cont)
R E F E R E N C E S
C O N T E N T S
| 71 |
raquo OrsquoFarrell K (2019) 2017-2018 Australian Plastics
Recycling Survey ndash National Report Envisage
Works Australian Government Department of the
Environment and Energy EPA NSW Sustainability
Victoria Government of Western Australia ndash
Department of Water and Environmental Regulation
raquo Orb Media (2017) Invisibles the plastics inside us
Orbmediaorgstoriesinvisibles_plastics
raquo Pattison M (2020) Analysis of microplastic
polymers in the Yarra and Maribyrnong Rivers
Unpublished Honours dissertation
raquo Rochman C M Hoh E Kurobe T amp Teh S J
(2013) Ingested plastic transfers hazardous
chemicals to fish and induces hepatic stress
Scientific reports 3
raquo Royer S-J Ferroacuten S Wilson S T Karl D M (2018)
Production of methane and ethylene from plastic
in the environment PLOS One 13(8) e0200574
raquo Sadri S S amp Thompson R C (2014) On the
quantity and composition of floating plastic debris
entering and leaving the Tamar Estuary Southwest
England Marine pollution bulletin 81 55-60
raquo Schwartz A E Ligthart T N Boukris E Van
Harmelen T (2019) Sources transport and
accumulation of different types of plastic litter in
aquatic environments A review study Marine
Pollution Bulletin 143 (2019) 92-100
raquo Sustainability Victoria (2019) Microplastics and
Port Phillip Bay - Citizen science study finds
significant amounts of microplastics on Port
Phillip Bay beaches Summary report
raquo Teuten E L Saquing J M Knappe D R Barlaz M
A Jonsson S Bjoumlrn A Rowland S J Thompson
R C Galloway T S amp Yamashita R (2009)
Transport and release of chemicals from plastics
to the environment and to wildlife Philosophical
Transactions of the Royal Society of London B
Biological Sciences 364 2027-2045
raquo Thompson R C Olsen Y Mitchell R P Davis A
Rowland S J John A W McGonigle D amp Russell
A E (2004) Lost at sea where is all the plastic
Science 304 838-838
raquo UNEP (2016) Marine plastic debris and
microplastics ndash Global lessons and research to
inspire action and guide policy change United
Nations Environment Programme Nairobi
raquo World Health Organisation (2019) Microplastics in
drinking water WHO Technical report
raquo Zeynep A Basak G (2019) Microplastics in the
environment A critical review of current
understanding and identification of future
research needs Environmental Pollution 254
(2019) 113011
raquo Yonkos L T Friedel E A Perez-Reyes A C
Ghosal S amp Arthur C D (2014) Microplastics in
four estuarine rivers in the Chesapeake Bay
USA Environmental science amp technology 48
14195-14202
raquo ZonMW (2019) httpswwwzonmwnlen
research-and-resultslife-sciences-health
programmasprogramme-detail
microplastics-health
Imag
e J
osi
e Jo
ne
s
Imag
e J
osi
e Jo
ne
s
Imag
e N
at S
ald
um
bid
e
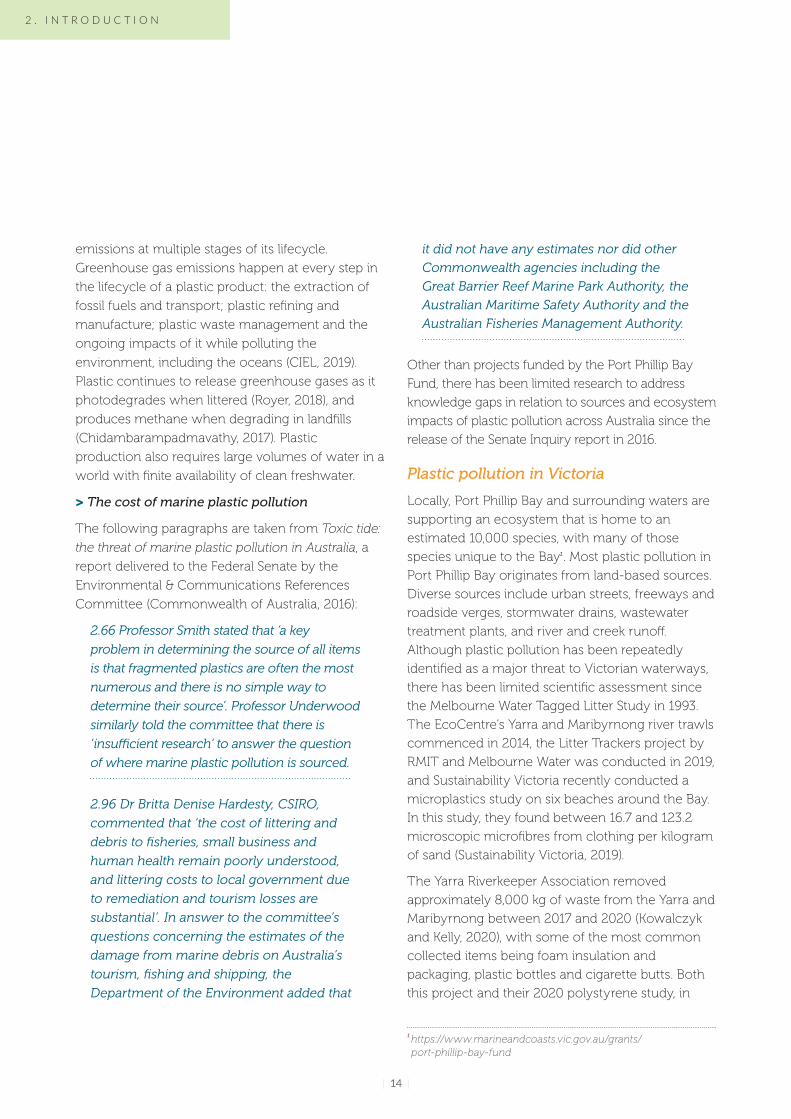
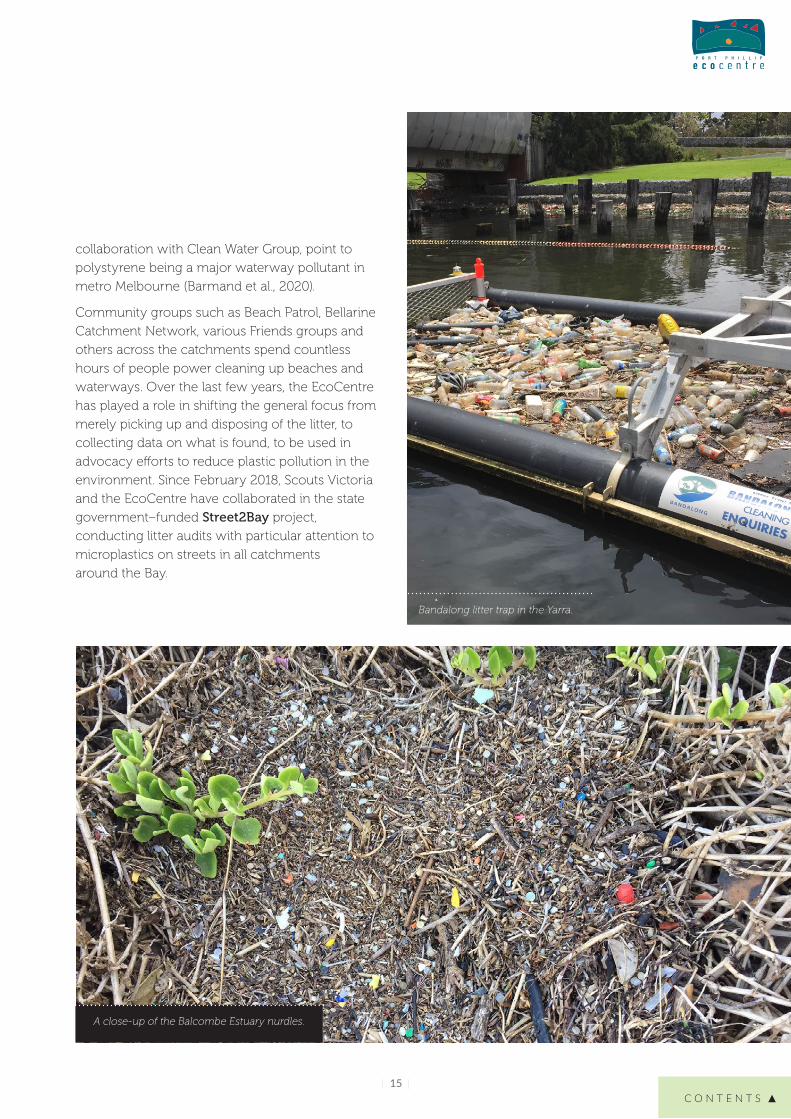
C O N T E N T S
| 15 |
A close-up of the Balcombe Estuary nurdles
collaboration with Clean Water Group point to
polystyrene being a major waterway pollutant in
metro Melbourne (Barmand et al 2020)
Community groups such as Beach Patrol Bellarine
Catchment Network various Friends groups and
others across the catchments spend countless
hours of people power cleaning up beaches and
waterways Over the last few years the EcoCentre
has played a role in shifting the general focus from
merely picking up and disposing of the litter to
collecting data on what is found to be used in
advocacy efforts to reduce plastic pollution in the
environment Since February 2018 Scouts Victoria
and the EcoCentre have collaborated in the state
governmentndashfunded Street2Bay project
conducting litter audits with particular attention to
microplastics on streets in all catchments
around the Bay
Bandalong litter trap in the Yarra
| 16 |
Policy context
gt Australia
From 2018 Chinarsquos new bans and 995 purity
standards for uncontaminated recyclables left
Australia with large stockpiles of items now needing
onshore processing Extensive ripple impacts of this
challenge ndash from facility fires to paying fees to send
recyclable plastics to landfill ndash have compelled
significant rethinking of Australian waste
management systems including materials redesign
reduction re-use and recycling Industry bodies
and the Australian Government considered plastics
and other materials in a range of commitments and
aspirations towards an Australian circular economy
in which lsquowastersquo and pollution are designed out
and products and materials are kept in use through
principles such as repair and maximising use of
recycled materials over virgin resources
Australiarsquos National Waste Policy Less waste more
resources (Commonwealth of Australia 2018) and
National Waste Policy Action Plan (2019) apply the
lsquoprinciples of a circular economy to waste
management to support better and repeated use of
our resourcesrsquo The targets include reducing
Australian waste by 10 per capita by 2030 and to
lsquophase out problematic and unnecessary plastics by
2025rsquo Waste policies focus on plastic diversion from
landfill however plastic uncontained by
management systems (eg lost as litter dumping or
spillage) becomes pollution of ecological and
economic concern due to its persistence in the
environment On 18 June 2015 the Senate referred
the threat of marine plastic pollution in Australia for
parliamentary inquiry and report by 8 April 2016
The final report Toxic tide the threat of marine
plastic pollution in Australia was presented on 20
April 2016 (Commonwealth of Australia 2016) The
need for systematic data collection on the extent of
plastic pollution was stated in Recommendation 1
of the report
Blair Stafford conducting a microplastics trawl in the Bay with a manta net
2 I N T R O D U C T I O N
C O N T E N T S
| 17 |
2 httpsnicholasinstitutedukeeduplastics-policy-inventory
The committee recommends that any future
Australian Government policies on mitigating
the threat from marine plastic be underpinned
by sound peer-reviewed research
gt Victoria
Plastic pollution is relevant under a range of Victorian
policies and strategies to manage waste and protect
human health and biodiversity In some instances
plastic pollution is discussed explicitly as in the
plastic bag ban (Environment Protection
Amendment Act 2019) or Recycling Victoria lsquoKey
Commitment 3 Address plastics pollutionrsquo Managing
plastics can also fall under broader principles such as
the goal lsquoVictoriarsquos natural environment is healthyrsquo in
Biodiversity 2037 the lsquowastes hierarchyrsquo principle of
environmental protection in the Environmental
Protection Act Victoria (1970) and the introduction of
General Environmental Duty in the Environment
Protection Amendment Act 2018 The General
Environmental Duty requires all Victorians to manage
risks to human health and the environment that their
activities create and becomes active from July 2021
Studies that quantify the effects and extent of
microplastics are necessary to inform policy
frameworks that reduce plastic pollution establish
waterway management strategies and assess
biodiversity health Interim results of the Clean Bay
Blueprint study have helped inform government
documents including
raquo State of the Yarra and its Parklands (2018) ndash
Commissioner for Environmental Sustainability
Victoria
raquo Assessment of the Values of Victoriarsquos Marine
Environment (2019) ndash Victorian Environmental
Assessment Council
A written submission by the EcoCentre to the 2018
review of the State Environment Protection Policy
(Waters) using the results of EcoCentre
microplastics studies led to lsquoplastics and
microplasticsrsquo being added to the list of legally
defined waterway pollutants in Victoria
Prior to the EcoCentrersquos research plastic and
microplastic pollution were not reported in
Victorian State of the Environment reports nor
specifically included in legislated protections
gt Worldwide
The United Nations Sustainable Development Goals
(SDGs) are 17 interlinked goals to achieve lsquoa better and
more sustainable future for allrsquo The management of
plastic materials relates to several SDGs
raquo Goal 12
Responsible production and consumption
raquo Goal 13 Climate action
raquo Goal 14 Life below water
raquo Goal 15 Life on land
The United Nations Environment Programme
(UNEP) has produced numerous studies on plastic
pollution and prevention in the last five years
Assessing policy efforts in 60 countries around the
globe the UNEP reports Single-Use Plastics
Roadmap to Sustainability (2018) includes ten
recommendations including (1) target the most
problematic single-use plastics by collecting
baseline data (5) raise public awareness (7) provide
incentives to industry and (9) enforce new
measures effectively
In 2020 Duke University launched a Plastics Policy
Inventory2 as a searchable database of public policy
documents targeting plastic pollution This includes
the language year enacted location and
jurisdictional level This document is updated
quarterly due to the rapidly evolving nature of policy
responses to address the health economic and
amenity threats of plastic and microplastic pollution
Melbourne City over the Yarra River
3
C O N T E N T S
| 19 |
Microplastics in the Yarra and Maribyrnong RiversThe first ever litter trawls done in rivers in Australia were conducted by the EcoCentre in 2013 The resulting report Pilot study to identify the extent of
microplastics in the Maribyrnong and Yarra Rivers and Port Phillip Bay (July 2014) showed that microplastics were present in Melbournersquos two largest rivers As a result of this pilot study monthly trawls were continued through the Turn off the Tap project (2014ndash2017) funded by the Victorian Government The final samples of this study spiked in microplastic litter which seemed to show an upward trend over time indicating further investigation was warranted Subsequently the Port Phillip Bay Fund funded Clean Bay Blueprint (2017ndash2020) for another three years of continuous research This report presents analysis of the outputs from both these projects and uses the full 55 years of data collected
Aims of the microplastics study
Within Clean Bay Blueprint the quantification of
plastics and microplastics in Melbournersquos two largest
rivers was done as a contained research study
which continued from a previous dataset collected
between 2015 and 2017 Its aims were the following
gt Quantifying plastic pollution to inform
legislative reform and behaviour change
When trawls commenced in 2014 there was no
reported evidence of the ongoing presence of
microplastic pollution in the rivers and Bay apart
from personal observations As legislative reform
and management decisions around litter need to be
driven by scientific evidence the first aims of the
study were to confirm the presence and quantify
the extent of the pollution
gt Tracking changes in litter over time and
establishing a baseline
Once presence is established the next step is to
monitor litter loads over time in order to track if
volumes increase or decrease Continuous
monitoring measures a baseline state of the river
which can be used to measure the effectiveness of
anti-litter measures taken to reduce the loss of
certain items in the environment In addition
monitoring allows researchers to notice unusual
spikes in litter loads or items that may have been
the result of mass spills and one-off pollution
events and might otherwise go unnoticed
gt Identifying the source of litter items
By tracking and quantifying the different litter items
encountered (eg polystyrene balls plastic drinking
straws cigarette butts) it may be possible to identify
| 20 |
their potential source locations This evidence could
be used to inform localised source reduction plans to
prevent an item type from entering the environment
in the first place Anecdotally known problem items
were analysed as distinct categories to learn more
about their prevalence in the waterways
Study method
gt Study site
The Yarra River flows 242 km from its source in the
forested Yarra Ranges National Park through to
central Melbourne where it enters Port Phillip Bay
More than one-third of Victoriarsquos population lives in
the Yarra catchment which covers about 4000 km2
(Barua et al 2013) The catchment includes 40
rivers and creeks including the Maribyrnong River
which runs for 160 km from its source on the
slopes of Mount Macedon The Maribyrnong
catchment covers 1408 km2
The trawl sites were selected on the basis of being
close to the lower reaches of each river and
therefore indicative of the total pollution load of each
respective catchment (Figures 3 and 4) The
Maribyrnong trawls commenced at the Water
Canon Jetty extending from the west bank of Coode
Island 300 m upstream from the Yarra The Yarra
trawls commenced underneath Bolte Bridge 25 km
upstream of the Yarra and Maribyrnong confluence
Figure 3 The locations of the Maribyrnong and Yarra catchments relative to the centre of Melbourne Images courtesy of Melbourne Water
Figure 4 Approximate trawl location transects in the Maribyrnong and Yarra Rivers
gt River trawls
A manta net designed to collect floating debris off
the waterrsquos surface was deployed from the side of
the boat and positioned outside of the wake zone
(picture 4A) Trawling was done according to
internationally standardised methods by Galgani
et al (2013) in each river all trawls commenced at
the same place travelling upstream for 30 minutes
with the boat motor operated at a constant 1000
rpm to operate the net effectively and maintain a
consistent speed for all trawls After 30 minutes the
net was retrieved the collection net (cod end)
removed (picture 4B) and placed in a container to
be dried in preparation for sorting and categorising
the contents
Between January 2015 and February 2020 a total of
113 monthly trawls were conducted in the
Maribyrnong and Yarra Rivers Both rivers were
trawled on the same day The distance covered in
each trawl varied slightly due to the effects of
different tides and prevailing wind conditions
encountered at the time While trawls were generally
done in a straight line river boating involves
changing course to safely navigate around other
watercraft that may be encountered and the course
of the trawls in each river was not rigidly defined
The lsquomouthrsquo of the manta net measures 600 mm
wide x 200 mm deep The net is 3 m long tapering
down to a 30 x 10 cmsup2 cod end Both the tapering
net and cod end are made of a 330 nm mesh size
The manta net is of the same specifications used
3 M I C R O P L A S T I C S I N T H E Y A R R A A N D M A R I B Y R N O N G R I V E R S
F I G U R E 4
F I G U R E 3
C O N T E N T S
| 21 |
by the 5 Gyres Institute to measure microplastics in
international studies In a recent review of methods
that measure microplastics in aquatic
environments Mai et al (2018) confirmed that this
collection method is recommended for large-scale
surface water sampling
gt Sample analysis method
Sample sorting was performed by trained citizen
scientists (picture 5) Dried trawl samples were
analysed by separating litter items from organic
matter with the naked eye using tweezers and
supplemental lighting Litter items were next sorted
by item type and the diameter measured with a
ruler after which the item was placed in the
corresponding size category Litter categories
included hard plastic fragments lt 2 mm hard
plastic fragments 2 mmndash5 mm hard plastic
fragments 6ndash10 mm hard plastic fragments gt
10 mm polystyrene beads lt 4 mm polystyrene
beads ge 4 mm plastic bottle caps plastic straws
soft plastics lt 5 mm soft plastics ge 5 mm lolly
wrappers cellophane lt 5 mm cellophane ge 5 mm
plastic pre-production pellets (nurdles) cigarette
butts twine sponge (synthetic sponge-like
materials) and lsquootherrsquo items which included
unidentified non-organic looking items
Internationally accepted guidelines define plastic
pieces smaller than 5 mm in diameter as
microplastics (Thompson et al 2004) In this study
the categories of hard plastic fragments lt 2 mm
hard plastic fragments 2 mmndash5 mm soft plastics lt
5 mm cellophane lt 5 mm nurdles and polystyrene
beads lt 4 mm were grouped into the microplastic
category Plastic items not visible to the naked eye
including microfibres were excluded from this study
due to logistical technical and funding constraints
Picture 4 A Manta net deployed on side of Yarra Riverkeeper vessel B Removable cod end used to collect microplastic samples
Picture 5 Citizen scientists sorting trawl samples at the EcoCentre
P I C T U R E 5
P I C T U R E 4 A P I C T U R E 4 B
| 22 |
Trawl data analysis results
The results of the sample analysis show
substantial concentrations of plastic litter
present in the Yarra and Maribyrnong Rivers
across all months of the year A total of 40030
litter items were captured and analysed from
the Yarra and 13658 litter items from the
Maribyrnong between January 2015 and
February 2020 An average of 690 litter items
were collected from the Yarra per monthly
trawl while an average of 248 litter items
were collected from the Maribyrnong per
monthly trawl
Because the Yarrarsquos width in the trawl location
is more than 160 times wider than the net and
the Maribyrnongrsquos width in the trawl location
is 120 times wider the actual extrapolated
volume of litter in both rivers is astounding
For the Yarra the rough calculation is
690 litter items x 48 half-hour sessions
day x 365 days x 160 times net width
yielding 1934208000 litter items
entering the Bay from the Yarra
annually
For the Maribyrnong this calculation is
248 litter items x 48 half-hour sessions
day x 365 days x 120 times net width
yielding 521395200 litter items
entering the Bay from the
Maribyrnong annually
Figure 5 Relative litter composition of items flowing into Port Phillip Bay from the Maribyrnong and Yarra rivers combined
Figure 6 Litter composition in trawl samples obtained from the Maribyrnong River
Figure 7 Litter composition in trawl samples obtained from the Yarra River
F I G U R E 5
F I G U R E 7
F I G U R E 6
3 M I C R O P L A S T I C S I N T H E Y A R R A A N D M A R I B Y R N O N G R I V E R S
C O N T E N T S
| 23 |
These calculations suggest that an average total of
2455603200 litter items flow into Port Phillip
Bay annually from surfaces of the Yarra and
Maribyrnong Rivers combined
It should be noted that since these litter items are
only caught in the surface waters (upper 200 mm)
this number is likely to be an underestimation of the
overall plastic pollution loading in each river
Different types of plastic display different levels of
buoyancy characterised as either positively
buoyant (floating at the surface) negatively buoyant
(sinks to the bottom) or neutrally buoyant (in the
water column) It is unknown how many items are
present in the water column or the sediments of
Melbournersquos waterways
gt Litter reaching Port Phillip Bay
Based on the 53688 litter items caught and
analysed the composition of litter entering Port
Phillip Bay shows that hard plastic fragments are by
far the most prevalent litter item (75) followed by
polystyrene (13) and soft plastics (10) (Figure 5)
Trawl samples weighed an average of
approximately 266 g most of which was organic
plant matter On average litter comprised 184 of
the total sample weight highlighting the
pervasiveness of litter in our waterways Over time
this percentage has stayed quite constant (see
Appendix 1)
gt Comparing the rivers
Hard plastic fragments polystyrene and soft
plastics were the most common items found in
both the Yarra and Maribyrnong (Figures 6 amp 7)
Hard plastic fragments made up the bulk of the
captured litter items comprising 74 of capture for
the Yarra and 76 of items captured in the
Maribyrnong
Polystyrene was the second most captured item
with 15 of items in the Yarra and 8 of items in
the Maribyrnong being polystyrene
Soft plastics (consisting of
cellophane lolly wrappers and
unidentifiable soft plastics) made up
9 of total items captured in the
Yarra and 13 in the Maribyrnong
When comparing the total litter
counts between rivers we found a
significant difference between the
Maribyrnong and Yarra Rivers
(chi-squared = 12954 df = 1 P lt
0001) with plastic litter overall more
likely to be found in the Yarra than
the Maribyrnong (Figure 8)
F I G U R E 8
Figure 8 Comparison of number of litter items in Maribyrnong and Yarra rivers
| 24 |
There is also an overall significant effect of the
rivers on distribution of plastics by item category
(chi-squared = 74726 df = 9 P lt 0001 Figure 9)
There are no significant differences in
proportions of hard plastic fragments in the
Maribyrnong or Yarra rivers (P gt 005)
There are proportionally more soft plastics
nurdles plastic bottle caps plastic straws
twine and cigarette butts in the Maribyrnong
river Conversely proportionally less of the
same items are in the Yarra river (P lt 005)
meaning that these items make up a higher
proportion of total litter counts in the
Maribyrnong than they do in the Yarra (see
Appendix 2)
When comparing polystyrene loads to the
expected proportions of polystyrene (based
on the total counts for the rivers) the
proportion of polystyrene is significantly less
than expected (P lt 005) in the Maribyrnong
and significantly more than expected in the
Yarra (P lt 005) this means polystyrene is
more likely found in the Yarra than in the
Maribyrnong
The proportion of lsquootherrsquo items is
significantly above expected in the
Maribyrnong (P lt 005) but for the Yarra
the proportion of lsquootherrsquo items was
nonsignificant (P gt 005)
F I G U R E 9
F I G U R E 1 0
Figure 9 Comparison of mean monthly number (plusmnSE) of litter items captured by the manta net in the Maribyrnong and Yarra Rivers between January 2015 and February 2020 Note that values shown are means but statistical tests were conducted on frequency of counts using chi-squared analyses (ie the standard errors should not be used to infer anything about statistical significance They are rough indicators of variation around a mean only)
Figure 10 Comparison between rivers of the total number of microplastics captured during river trawls
3 M I C R O P L A S T I C S I N T H E Y A R R A A N D M A R I B Y R N O N G R I V E R S
C O N T E N T S
| 25 |
In both rivers microplastics formed the bulk of litter
and accounted for 85 (34013 pieces) of the total
load in the Yarra and 83 (11388 pieces) of the
Maribyrnong load (Figure 10) Hard plastic
fragments lt 2 mm in length dominated the
microplastics category and accounted for 45 and
51 of microplastics in the Yarra and Maribyrnong
respectively
Of the earlier mentioned total litter items entering the
Bay microplastics make up nearly 85 which means
more than 2 billion (2076458066) microplastics flow
from the two rivers into the Bay every year
gt Analysis of plastic polymer types
Sorted trawl samples from July 2016 to August 2019
were sent to the Plastics Lab at RMIT where they
were analysed for plastic polymer types using
Fourier Transform Infrared Spectroscopy (FTIR)3
There are many polymer types each of which has
varying qualities that align it to typical uses
products or applications Through FTIR analysis
microplastics or fragments may be grouped
according to probable source products
In both the Yarra and the Maribyrnong rivers
polyethylene (PE) was the most prevalent polymer
(48 and 49 respectively) followed by
polypropylene (PP) (22 and 24 respectively)
polystyrene (PS) (15 and 79 respectively)
The Yarra River saw small amounts of 11 other
polymers each of which contributed less than 1
and 067 of samples were of an unknown
material The Maribyrnong saw a small abundance
of other polymers ranging from 1 to 005 and
had 088 of unknown material (see Appendix 3)
The two rivers showed similar trends over the
months for all three of the most prevalent polymers
The abundance of PE and PP did not statistically
differ between the Yarra and Maribyrnong (P = 067
P = 056 respectively) however PS was statistically
lower in the Maribyrnong (P = 002)
Interestingly polyethylene terephthalate (PET) and
polyvinylchloride (PVC) are some of the most
commonly produced and used plastics yet were
some of the least recorded in both the Yarra and
Maribyrnong Rivers
gt Seasonal differences in litter
There are significant effects of the seasons and the
rivers on the total count of litter (chi-squared =
12429 df = 3 P lt 0001) A comparison of total litter
by trawl indicates that there is more total litter in the
Yarra than in the Maribyrnong in any season There
was more litter in summer in both rivers However
proportionally in the Maribyrnong has more litter
in spring and autumn than is expected by chance
whereas in the Yarra the clear peak seasons are
summer and winter (Figure 11)
In summer and winter plastic litter is proportionally
higher in the Yarra than the Maribyrnong (P lt 005
for both seasons) In autumn and spring plastic litter
is proportionally higher in the Maribyrnong than the
Yarra (P lt 005 for both seasons)
Figure 11 Seasonal variation in the number of captured litter items in the Maribyrnong and Yarra Rivers between January 2015 and February 2020
3 This summary of results was used with permission from an unpublished Honours dissertation by M Pattison (2020)
F I G U R E 1 1
| 26 |
gt Changes in litter over time
The five years of data collection reveal large
increases in litter over time (Figure 13) Note the
difference in numbers on the y-axes when
comparing the rivers
Both rivers are showing a significant increase in
plastics over the sampling period although the trend
is somewhat more pronounced in the Yarra (tau =
017 z = 745 P lt 0001) than in the Maribyrnong (tau
= 010 z = 416 P lt 0001) (Figure 14)
Note the differences in percentages on the y-axes of
the respective rivers in Figures 15 and 16 which
show how much faster the Yarrarsquos litter has been
increasing over the last five years When combining
the above litter numbers and percentages there is a
similar increasing trend in litter en route to Port
Phillip Bay (Figure 17) It is unclear why there was
such an extreme increase in litter in the Yarra in 2017
The above results warranted a closer examination
of the changes in litter item categories over time
In the Maribyrnong hard plastic fragments soft
plastics and lsquootherrsquo are increasing over time
(P lt 005) (Figure 18)
Figure 19 shows that in the Yarra hard plastic
fragments soft plastics polystyrene sponge and
lsquootherrsquo in the Yarra are increasing over time (P lt 005)
However plastic straws are significantly decreasing
over time (z = -234 tau = -025 P = 0019)
All other plastics are steady showing neither a
significant increase nor decrease See Appendix 4
for more details
F I G U R E 1 2
Figure 12 shows more detailed litter item
distributions over the seasons for the separate
rivers Hard plastic fragments remain the largest
category of items throughout all seasons in both
rivers followed by polystyrene and soft plastics
Figure 12 Seasonal variation in the total number of captured litter items in the Maribyrnong and Yarra Rivers between January 2015 and February 2020 Note the difference in total litter items captured on the y-axes
Figure 13 Total number of captured litter items in the Maribyrnong and Yarra Rivers presented by trawl between January 2015 and February 2020 The labels indicate year month and trawl number A total of 62 paired trawls were conducted during this time Several litter spikes were recorded
Figure 14 Litter trends over time Litter in both rivers is increasing with litter in the Yarra increasing faster than in the Maribyrnong
3 M I C R O P L A S T I C S I N T H E Y A R R A A N D M A R I B Y R N O N G R I V E R S
C O N T E N T S
| 27 |
F I G U R E 1 3
F I G U R E 1 4
| 28 |
Baykeeper and Riverkeeper trawling for microplastics
F I G U R E 1 5 F I G U R E 1 6 F I G U R E 1 7
3 M I C R O P L A S T I C S I N T H E Y A R R A A N D M A R I B Y R N O N G R I V E R S
C O N T E N T S
| 29 |
Figure 15 Above Actual numbers of microplastics in the Maribyrnong Below Percentage increase in microplastics year-on-year
Figure 16 Above Actual numbers of microplastics in Yarra Below Percentage increase in microplastics year-on-year
Figure 17 Above Actual numbers of microplastics flowing to Port Phillip Bay Below Percentage increase in microplastics year-on-year
Figure 18 The number of plastic items by category across time in the Maribyrnong River (measured by trawl number) Note that axis scales are different for each plastic category Significant relationships are marked by an asterisk ()
F I G U R E 1 8
C O N T E N T S
| 30 |
F I G U R E 1 9
Figure 19 The number of plastic items by category across time in the Yarra River (measured by consecutive trawl numbers) Note that y-axis scales are different for each plastic category Statistically significant relationships are marked by an asterisk ()
Figure 20 Plot of microplastic count in both Yarra and Maribyrnong between 2015 and 2019 as a function of Melbournersquos population
Figure 21 Regression analysis showing a positive correlation between litter items captured and rainfall data Note that microplastic count was square root transformed to meet assumptions of a regression analysis
3 M I C R O P L A S T I C S I N T H E Y A R R A A N D M A R I B Y R N O N G R I V E R S
C O N T E N T S
| 31 |
gt Factors driving litter increases and spikes
A series of regression analyses were performed to
see what environmental factors could be driving
the increases in litter and some of the unusually
high litter counts in some of the trawls
Worldwide plastic pollution is usually positively
correlated with increases in population This indeed
applied in the Yarra and Maribyrnong as well with a
significant association between population in the
Greater Melbourne area from 2015 to 2019 and
counts of microplastics (t = 54 P = 0012)
Approximately 876 of the variation in microplastic
counts was explained by population numbers over
this time (adjusted R2 = 0876 Figure 20) which
indicates a very strong correlation
A regression analysis shows that the count of
microplastics was positively associated with total
rainfall in the previous 48 hours (t = 41 P lt 0001
Figure 21) Approximately 122 of the variation in
microplastic counts in the rivers was explained by
rainfall (adjusted R2 = 0122)
Rainfall data for the Maribyrnong was taken from
the Bureau of Meteorologyrsquos (BOM) weather station
at Melbourne Airport Rainfall data for the Yarra was
taken from the BOMrsquos Eltham weather station
To explain some of the high spikes in litter in the
Yarra two potential factors were tested for
Bandalong litter traps
The method of emptying the floating Bandalong
litter traps is focused on removing larger litter items
(gross pollutants) and does not allow for the
containment of microplastics The 2015ndash2020 dates
of the emptying of the traps in the Yarra River were
sourced from Parks Victoria Although there were
preliminary indications of litter spikes potentially
being caused by litter trap maintenance there
seemed to be no evidence of a correlation with the
data available (see Appendix 5) However additional
information sourced from Melbourne Water just
before finalising this report indicates that a more
targeted approach to investigating microplastics
leakage from Bandalong traps is appropriate Please
refer to the Yarra and Maribyrnong microplastics
research discussion below
There are currently no Bandalong litter traps in the
Maribyrnong river
Environmental water flow releases In drier periods of the year environmental water
flows are released on a needs basis from the upper
Yarra catchment to maintain the ecosystem health
of the networks of billabongs and wetlands
connected to the Yarra As these flows have the
potential to flush out litter caught in various places
along the river data on environmental water flow
releases between 2015 and 2020 were sourced
from Melbourne Water However a regression
analysis showed that there was no significant
association between environmental flow events
and plastic counts in the Yarra See Appendix 6 for
more details
F I G U R E 2 0
F I G U R E 2 1
| 32 |
Yarra and Maribyrnong microplastics research discussion
Clean Bay Blueprint and the preceding EcoCentre
projects are the first studies to investigate
microplastic loads in the Yarra and Maribyrnong
Rivers and provide the first estimation of microplastic
loads entering Port Phillip Bay on an annual basis
Every one of the 113 trawl samples analysed
between January 2015 and February 2020 contained
plastic pollution mostly consisting of microplastics
Nearly 25 billion pieces of plastic flow into Port
Phillip Bay annually from the surface waters of the
two major rivers of which over 2 billion are
microplastics smaller than 5 mm in diameter
These results are expected to be underestimations
of the litter volume entering the Bay as it does not
take into account the depth of the river and the fact
that high-density particles with additives or other
attachments and larger items will sink below the
level of trawled surface area (Mai et al 2018
Pattison 2020) As the mesh size of the net was
330 nm and sorting and counting of microplastics
was done with the naked eye particles smaller than
what could be caught in the net or observed and
confirmed as plastics during sorting (including
microfibres and nanoparticles) were not included It
must therefore be emphasised that total plastic
pollution numbers in the rivers are likely to be
much higher than the numbers in this report and
preventative and mitigating actions to reduce
plastic pollution are urgently required
gt Litter increases
An alarming result of this study is that litter is
increasing in both the Maribyrnong and the Yarra
with plastic pollution in the Yarra increasing at a
much faster rate The rate at which plastic pollution
in both rivers is increasing is very high litter in the
Yarra increased by 400 in 2017 compared to 2016
and then in 2019 it again more than doubled
compared to 2018 levels The Maribyrnong saw a
more gradual increase over time but still increased
by around 57 to 83 year on year since 2017
The Yarra exceeded the Maribyrnong in terms of
expected plastic pollution loads in 2016 (Charko
et al 2018) These changes are mostly driven by
increases in hard and soft plastic fragments and
polystyrene rather than the other categories of litter
meaning these are the litter categories that should
be addressed immediately at their source
As this study shows a very strong positive
correlation of plastic pollution with population
growth in Melbourne and the population of Greater
Melbourne is projected to grow from 5 million to 9
million by 2056 (DELWP 2019) it is expected that
plastic pollution increases will continue until
effective source reduction measures are taken
Nearly 25 billion pieces of plastic flow into
Port Phillip Bay annually from the surface waters
of the two major rivers of which over 2 billion are
microplastics smaller than 5 mm in diameter
3 M I C R O P L A S T I C S I N T H E Y A R R A A N D M A R I B Y R N O N G R I V E R S
C O N T E N T S
| 33 |
gt Litter composition in the rivers
Sample analyses revealed that hard plastic fragments
polystyrene and soft plastics were the most
common items captured Despite the manta netrsquos
selectivity to small buoyant items the sample results
largely align with several other local litter audits
Litter audits along the Westgate Park foreshore and
along St Kilda beaches between 2015 and 2017
revealed polystyrene packaging and soft plastics
(bits of plastic bags wrap cellophane etc) are the
second and third most dominant litter categories
after cigarette butts4 Hard plastic fragments were
the most captured items in manta net trawls in the
Bay (see Chapter 4) and the second most prevalent
litter items found on beaches around the Bay using
the Baykeeper Beach Litter Audit method to
monitor for microplastics (see Chapter 5)
Polystyrene is the most captured litter item in the
Bandalong litter traps in the Yarra River (Kowalczyk
and Kelly 2020) As cigarette butts much like other
heavier items sink after a relatively short period in
water and pass under the manta net their numbers
in the Yarra and Maribyrnong River trawls do not
align with general beach clean-up data where
cigarettes often dominate In addition beach
clean-up efforts are typically geared towards the
collection of large litter items Consequently hard
plastic fragments and microplastics are not
systematically recorded in litter clean-ups
In general trawl findings provide a fairly robust
representation of the microplastic pollution issue
providing valuable information about the
composition and relative abundance of dominant
buoyant litter items entering Port Phillip Bay
It is worth noting that hard plastic fragments
polystyrene and soft plastics also dominate
microplastic pollution in other urbanised
catchments around the globe These items were
the most abundant litter types collected in trawls in
the New York-New Jersey Harbour estuary USA
one of the most urbanized estuaries on earth (S
Meola New YorkndashNew Jersey Baykeeper pers
comm 2015) Similarly hard plastic fragments
polystyrene and plastic foil dominated microplastic
loads along the length of the Rhine River in Europe
(Mani et al 2015) This is not surprising given that
worldwide the packaging industry the primary
material source of microplastics in this study is the
third largest after food and energy (Moore and
Phillips 2011) and around 11 of plastic waste
generated gets lost in the environment (Borelle
et al 2020) where it breaks up into smaller pieces
under the prevailing environmental conditions
It is clear that the Yarra has much higher total litter
counts than the Maribyrnong This is probably
because the Yarrarsquos catchment area (4046 km2) is
larger than the Maribyrnongrsquos (1408 km2) and land
use between the catchments differs apart from the
Upper Yarra region the Yarra River catchment
includes 43 times more of urbanised area than the
Maribyrnong The respective Catchment Region
documents from Melbourne Waterrsquos Healthy
Waterways Strategy state that in the Maribyrnong
catchment
raquo about 10 retains its natural vegetation
(1408 km2)
raquo 80 is used for agriculture (11264 km2)
raquo 10 is urban development Greater Melbourne
and larger townships (1408 km2)
In the Yarra catchment
raquo 55 of the area retains its natural vegetation
(22253 km2)
raquo 30 is used for agriculture (12138 km2)
raquo 15 is urban development (6069 km2)
When comparing the other types of litter between
the rivers it was found that the Maribyrnong
4 amditangaroablueorg
| 34 |
(proportionally) has higher counts of soft plastics
nurdles bottle caps straws twine cigarette butts
and lsquootherrsquo items than the Yarra whereas
polystyrene is more problematic in the Yarra
gt Investigating litter by item category
Hard plastic fragments remain the most
problematic items in both rivers and have been
significantly increasing over the last five years Due
to their small size it is nearly impossible to trace
them back to their individual sources of pollution
They originate from broken-up larger items that are
lost from overflowing commercial household and
public bins littering and illegal dumping of waste
are blown off trucks during transport or from
construction andor demolition sites
The plastic polymer analysis showed that most
items in the samples were polyethylene (PE)
polypropylene (PP) or polystyrene (PS) which are
some of the most commonly used plastics in the
world However other common plastics like
polyethylene terephthalate (PET) and
polyvinylchloride (PVC) were largely absent from
the results Notably as per Pattison (2020)
degradation of polymers is not uniform and
different polymers break up via a range of
processes at varying rates (Gewert et al 2015)
Polymer types such as PE PP and PS break up faster
when exposed to UV radiation than PET and PU
thus potentially increasing the prevalence of these
secondary microplastics The varying densities of
polymers may also influence what is collected with
equipment such as the manta net which sits on the
water surface
The lowest density polymers found in the river
samples are most likely to float were PP
(090 g cm3) and PE (from 092- 097 g cm3) (see
Appendix 3A) Some of the higher density polymers
included PET (138-139 g cm3) and PVC (129-
144 g cm3) which are commonly used worldwide
but were only present in study samples in trace
amounts (see Appendix 3B) It is therefore likely that
denser polymers may be in sub-surface waters
floating underneath the manta net or have sunken
into the sediments as there is a strong correlation
between the number of microplastics found in river
sediments and increasing polymer density (Klein
et al 2015)
Further investigation of the water column and the
sediments are logical next steps in the process of
investigating microplastics pollution in the rivers
Polystyrene is the second most prevalent litter item
in the Yarra and in third place in the Maribyrnong
These findings are supported by litter research
conducted between 2017 and 2019 by the Yarra
Riverkeeper Association which found that
polystyrene was the most found item on the
riverbanks during community clean-ups as well as
in the Bandalong litter traps (Kowalczyk and Kelly
2020) A subsequent polystyrene pollution research
project by Cleanwater Group and Yarra Riverkeeper
Association attempted to trace this litter back to the
source by surveying 64 manufacturing and
distribution facilities (Barmand et al 2020) Over
80 of surveyed sites were found to have some
sort of polystyrene leakage into the environment
even when all reasonable precautions had been
taken to prevent this In addition more evidence is
being collected revealing that building sites are a
potential source of polystyrene pollution when
using insulation waffle pods5 Polystyrene also gets
lost in transport on loading bays and at waste
transfer and recycling facilities The fact that
polystyrene loss still occurs even when all
reasonable precautions are taken indicates that the
problems lie with the material itself and how it is
handled It therefore needs to be questioned if this
material should still be used for its current
purposes meanwhile alternatives should be
sought
3 M I C R O P L A S T I C S I N T H E Y A R R A A N D M A R I B Y R N O N G R I V E R S
C O N T E N T S
| 35 |
as community-led advocacy has led to retailers
swapping plastic straws for paper ones or not
offering plastic straws unless specifically requested
by their customers In some instances entire retail
precincts have pledged to cease the distribution of
plastic straws such as the traders on Gertrude
Street in Fitzroy (The Everleigh pers comm 2017)
The fact that the results of these community
initiatives are reflected in the monitoring data
indicates two things
raquo 1) Individual behaviour change community-led
advocacy and community action to reduce
plastic pollution can make a significant positive
difference for the environment
raquo 2) Ongoing data collection and monitoring of
plastic pollution are necessary to evaluate which
litter reduction initiatives are effective
Sponge is a category that has been significantly
increasing in the Yarra and mostly captures artificial
lsquospongeyrsquo substances such as sponge-like
household items building insulation foam and soft
packaging material When speculating where this
material comes from and why it is more prevalent
and increasing in the Yarra the increased residential
construction projects in the Yarra catchment may
correlate Further source tracing may provide insight
Other is a category applied to record items that are
not readily identifiable as fitting into any of the
other categories but are obviously not organic In
both rivers this category is significantly increasing
especially in the Maribyrnong where the graphrsquos
J-curve in Figure 18 suggests an exponential
increase This warrants closer investigation of this
category in future research to see if there are
specific items that are trending and if another litter
item category should be added for specific
monitoring focus
Soft plastic fragments are steadily increasing over
time Much like hard plastic fragments soft plastics
are difficult to trace back to a single source Much of
it likely comes from plastic littered on the streets or
it blows out of bins and skips due to its light weight
and prevailing wind strength and direction in relation
to the bin Once in waterways soft plastics carried
on rapid flood flows commonly snag on woody
streamside vegetation causing them to shred
Nurdles are ubiquitous in waterways all over
Victoria as supported by evidence gathered by
Tangaroa Blue Foundation and the EcoCentre since
2014 (N Blake F Charko pers comm 2020)
Although nurdles have neither significantly
increased nor decreased over the life of this project
they are still making up a steady 1 of microplastics
flowing into the Bay over time Chapter 5 of this
report shows that nurdles are the number one
microplastic type found on beaches around the
Bay indicating that this type of pollution is an
ongoing issue
As nurdles are classed as an industrial pollutant
rather than litter it is relatively easy to identify their
source These pellets can be traced back to the
premises of plastic manufacturers where they are
spilled on the loading bays and driveways and are
often incompletely or not at all recovered after a
spill Some get lost in road transport on their way to
manufacturers and end up in the gutters Refer to
Chapter 7 for recommendations on this issue
Plastic straws are the only item category that has
significantly declined over time in the Yarra This is
notably going against the trend of all other items in
both rivers that are either increasing or staying
constant over time The most likely explanation for
this is that over the last several years community
and business-driven source reduction initiatives
such as lsquoThe Last Strawrsquo have gained great traction
in Melbourne Individual behaviour change as well
5 Although the Master Builders Association offers a waste minimisation guide that includes waffle pods it does not outline how this material should be handled onsite to prevent spillage
| 36 |
Bottle caps cigarette butts and twine have neither
increased nor decreased in both rivers Although
cigarette butts are in the top ten of most littered
items in Australia their plastic filters get
waterlogged and most likely pass under the manta
net explaining the low numbers found in this study
gt Seasonal variations
When examining the seasonal effects on the rivers
the Maribyrnong proportionally has its largest
surface litter output in spring and autumn while for
the Yarra litter numbers are highest during summer
and winter One likely reason for this difference
could be related to sports events that draw large
numbers of people to the vicinity of the rivers such
as football season for the Yarra in winter and horse
racing events at Flemington Race Course in spring
for the Maribyrnong In summer the Yarra parklands
are extensively used for recreation and tourism in
Melbourne CBD is at its peak in DecemberndashJanuary
However both rivers have different land uses
influencing them and there are vast differences in
the industrial usage and population density along
the rivers (Yonkos et al 2014) Litter hotspots may
also play a role For example Calder Park Raceway
is located near Jacksons Creek not far upstream
from where the creek joins the Maribyrnong River
Road verges in the vicinity of Calder Park are
heavily littered (N Blake pers comm 2020) with
plastic items potentially shredded when verges are
seasonally slashed Both rivers are subject to
different street cleaning and sweeping schedules
and practices by local councils
gt Other factors influencing litter
Rainfall There is a positive correlation between
rainfall and plastic pollution which is consistent
with research worldwide Littered items anywhere
in the catchment eventually make their way down
to the nearest waterway through the stormwater
drain system heavily polluting creeks and streams
that lead into the big rivers and the Bay (picture 6)
Litter traps Although no statistical correlation was
found between microplastics spikes and emptying of
the litter traps this conclusion was reached through a
Wilcoxon rank sum test comparing median litter
Picture 6 Litter in the Merri Creek which flows into the Yarra
P I C T U R E 6
3 M I C R O P L A S T I C S I N T H E Y A R R A A N D M A R I B Y R N O N G R I V E R S
C O N T E N T S
| 37 |
counts when the litter trap was emptied to when the
litter trap was not emptied (two days before trawl) See
Appendix 5 for more details Just before publication of
this report subsequent advice was received from
Melbourne Water that the average Yarra River current
speeds between Burnley and Bolte Bridge is 55 km
per hour (P Rasmussen Melbourne Water Team
Leader Flood Preparedness pers comm 2020)
The distance from Burnley to Bolte Bridge is
approximately 758 km therefore estimated travel time
is about 06 to 38 hours with the average
approximately 15 hours The shorter duration could
be applied during higher flows following rainfall runoff
The longer durations are generally normal conditions
With tides ebbing and flowing for all conditions the
average may be best applied Accordingly any spikes
in trawl contents attributable to emptying of
Bandalong traps could only apply to trawls conducted
within just a few hours of the traps being emptied
Apart from litter prevention measures gross
pollutant traps could be installed on the
problematic major drain outlets and catch items
before they make it into the creeks Once it reaches
the creeks plastic pollution mixes in with organic
materials and will be more onerous and costly to
remove from the waterways due to the much
higher volumes presented by these combined
materials To be effective gross pollutant traps
require adequate and proactive maintenance
schedules and resources to prevent them from
blocking or overflowing
However gross pollutant traps do not often catch
microplastics Although the data in this report do
not show a direct statistically significant correlation
between microplastic capture and the emptying of
the Bandalong litter traps in the Yarra personal
observation of the manner in which the traps are
emptied confirms that microplastics do escape
during this process More targeted research
specifically designed to test for the effectiveness of
microplastics captured by gross pollutant traps
during their operation and maintenance is
therefore necessary
Yarra environmental water flow releases No
correlation was found between microplastics
captured in the trawls and Melbourne Waterrsquos
regulated release of environmental water flows for
the Yarra There is no evidence that environmental
water flows exacerbate plastic pollution in
waterways This supports the result that litter
originates from the street making its way into the
rivers through stormwater drains
gt Implications for marine life in the Yarra estuary
and Port Phillip Bay
Port Phillip Bay is a relatively closed system due to
the distance between the Bellarine and Mornington
Peninsulas being only just under 35 km Due to
prevailing winds it is likely the Bay is a sink for a major
portion of the plastics that enter it from the rivers
This study found that microplastics form the bulk of
items entering the Bay from the surface waters of the
Maribyrnong and Yarra rivers The results of a pilot
project of nine Bay trawls showed the presences of
microplastics in eight of nine samples (see Chapter 4)
To date very few studies have assessed
microplastic ingestioninteraction rates for faunal
species in Port Phillip Bay However worldwide
freshwater and marine species at all trophic levels
possessing varied feeding strategies ingest
microplastics (Eerkes-Medrano et al 2015) In
lab-based studies ingestion has been associated
with the retention and accumulation of
microplastics in organisms including but not limited
to mussels (Browne et al 2008) lobsters (Murray
and Cowie 2011) scallops (Brillant and MacDonald
2000) injury and subsequent disrupted feeding
swimming activity in lugworms as well as stress
immune response altered metabolic function and
| 38 |
toxicity in lugworms (Browne et al 2013) and fish
and mussels (Rochman et al 2013) It is also related
to tumour formation in fish (Rochman et al 2013)
and brain damage in fish (Mattson et al 2017)
Smaller sizes of plastic can potentially be ingested by
a greater range of species Plastic ingestion by local
wildlife is highly likely because of Port Phillip Bayrsquos
potential for high microplastic concentrations and
because these waters are so biodiverse Faunal
ingestion rates and impacts of marine microplastics
at the individual population and community levels
need to be assessed to prevent biodiversity loss in
the Bay and to better understand the human health
implications of consuming seafood from the Bay
Investing in necessary research will likely require
collaboration between departments managing water
pollution controls and fish populations respectively
gt Further study on microplastics
The estimations in this study showed that the Yarra
and Maribyrnong can transport nearly 25 billion
plastic pieces ndash of which more than 2 billion are
microplastics ndash into Port Phillip Bay annually and
that this may be an underestimation Ling et al
(2017) noted that plastic filaments including highly
pervasive clothing microfibre pollution between
0038 mm and 0250 mm formed the dominant
categories of microplastic in coastal and estuarine
sediments around Australia including Port Phillip
Bay However we know little about the
downstream movement and deposition of
microplastics in rivers It is not known what
portions of riverine microplastics travel
downstream below the surface waters sampled by
the manta net to eventually be released to the Bay
or deposited to the river sediments In the North
Shore Channel (Illinois USA) for example
microplastic concentrations in sediments were up
to 15000 times higher than surface water samples
(Hoellein et al 2017) Some microplastics are likely
transported long distances as several studies report
high concentrations of microplastics in estuaries
with rivers implicated as major microplastic sources
to these coastal zones (Yonkos et al 2014 Lima
et al 2014 Sadri and Thompson 2014) An example
of this was revealed during a community clean-up
event organised by the Yarra Riverkeeper
Association in April 2018 where a vacuum suction
device deployed by Ocean Crusaders removed over
47 million polystyrene pieces from the Yarra River
and its vegetated banks (A Kelly pers comm 2018)
Consequently in order to accurately identify the
magnitude of microplastic pollution in Port Phillip
Bay it is necessary to better understand microplastic
depositional patterns and take into account the water
column below the top 20 cm and the sediments
To advance current microplastics research in this
area the EcoCentre engaged a team of interns from
Worcester Polytechnic Institute (WPI) in the USA to
design and build a low-cost microplastics sampling
device easily built from hardware store materials
called the lsquoMicroplastics Collector With A Pumprsquo
(MCWAP) The MCWAP is a portable battery-
powered pump that takes water samples at various
depths in the water column down to a depth of 2 m
and runs these through a removable mesh 300 nm
filter to capture microplastics (picture 7) The
EcoCentre is planning a first trial of depth-sampling
for waterway microplastics in 2021
Picture 7 The MCWAP EcoCentrersquos portable microplastics depth-sampling device
P I C T U R E 7
3 M I C R O P L A S T I C S I N T H E Y A R R A A N D M A R I B Y R N O N G R I V E R S
C O N T E N T S
| 39 |
Maribyrnong River
Fishing in Port Phillip Bay
4
C O N T E N T S
| 41 |
Bay trawls pilotTo gain insight into the relative quantities of microplastics entering the Bay from Bass Strait as compared to the major rivers a pilot project of nine manta net trawls was conducted at the entrance to Port Phillip Bay with support from the Blairgowrie Yacht Squadron and the Australasian Ambassador for the 5 Gyres Institute
Trawls were conducted between April 2018 and
February 2020 at Popersquos Eye in Port Phillip Bay
during incoming tides and south-westerly winds
Trawl time was 30 minutes during which the vessel
was anchored to the sea bed in the tidal flow
Sample sorting was done in the same manner as
the river trawls (see Chapter 3)
Of the nine trawl samples collected at Popersquos Eye in
Port Phillip Bay eight contained plastics (Table 1) Of
the total 55 items found 35 (64) were
microplastics The most prevalent items were hard
plastic fragments which were found in six of nine
samples Samples in which plastic was found
contained up to 16 items The last sample
contained a remnant of a party balloon with the
balloon string still attached
Although the sample size is too small to perform
meaningful statistical analysis the findings suggest
there may be a worrying amount of plastic floating
on the surface waters of the Bay Given the size of
Port Phillip Bay is 1930 km2 and plastics were found
in 89 of samples collected through 30-minute
trawls plastics are potentially quite ubiquitous
A proportion of 80 of hard plastic fragments
found seems relatively consistent with the 75
proportion that flows into the Bay from the Yarra
and Maribyrnong indicating a probability that many
of these items may have originated from the Bay
passed through The Heads into Bass Strait and
then been recirculated back to the Bay by tidal
currents and prevailing winds More samples will
need to be taken and analysed in order to further
investigate this probability
Hard Fragments lt5 Hard Fragments gt5 Soft Plastics TwineLine Sponge Non-Plastic
Apr 18 3 4 1
May 18 6 2
Jun 18 8 6 2
Sep 18
Oct 18 2 1 3
Dec 18 1
Jan 19 2 1
Feb 19 1 2
Feb 20 2 1 1
TOTAL 19 16 2 5 2 5
Table 1 Items caught in Bay entrance trawls lsquoNon-Plasticrsquo included paper and a rubber balloon
T A B L E 1
4
Microplastic beach litter 5
C O N T E N T S
| 43 || 43 |
Baykeeper Beach Litter AuditsDevelopment of the Port Phillip Baykeeper Beach Litter Audit method commenced in 2014 in response to international studies confirming the environmental threat of plastic pollution At that time and to date there remains no international standard survey method with various existing data collection methods used by different leading bodies
While each method provided valuable information
their capacity to accurately record volumes of litter
over time ndash particularly microplastics ndash was seen to
be limited by one or more of the following factors
raquo lack of a clearly defined data collection area
raquo clean-up andor data collection methods
conducted on a scale that was unlikely to be
systematically repeated
raquo data collection recorded in a single area on a beach
(as opposed to a set of locations that represented
samples of all conditions on the beach)
raquo data recording conducted from a standing
position reducing the likelihood of recording
hard-to-spot microplastics
raquo data collection without removing litter
eliminating the possibility of clearly measuring
change in volumes occurring between surveys
The Baykeeper Beach Litter Audit methodology
was designed to focus on microplastic pollution
that poses an immediate threat to aquatic
organisms Key considerations in the design of this
method were the need to
raquo capture a representative sample of the conditions
on the beach
raquo establish an easily replicated method that can be
cost-effectively and consistently applied by
different groups around the Bay
raquo use data field terminology that was consistent
with terms used in the Australian Marine Debris
Initiative database
The Clean Bay Blueprint project provided an
opportunity to test the survey methodology over
several years with a range of user groups
| 44 |
Methodology
The survey method requires the combined search
time of the number of auditors to equate to at least
five minutes per quadrat Noting that some
quadrats will have very few if any microplastics
this requirement is designed to ensure consistency
of search effort and to enable a small team of two
people to comprehensively complete an audit in
less than an hour or two hours on more heavily
littered beaches This relatively small time
commitment facilitates regular conduct of audits
over the course of a year to achieve the statistical
rigour required to confirm trends in litter volumes
and type over time
gt Transect and quadrat placement
In order to capture a representative sample of all
beach conditions data is collected from three
transects across the beach In this context lsquoall beach
conditionsrsquo is referring to the structure of the beach
ndash shaped by the locally prevailing winds waves and
tidal currents ndash which transport sand debris and
litter to and from the beach To capture the
influence of these coastal processes over time and
to provide a basis for consistent search effort
transects are located at the widest central and
narrowest sections of beach
In each transect data is collected from three
quadrats at the top of the beach mid-beach and
on the last high tide line (Figure 22) The lsquotoprsquo
(inland edge) of the beach quadrats are in the same
place for each survey as locational reference points
Due to changing tidal conditions on the day the
distance between the top of the beach and last
high tide line (ie transect length) will vary Hence
the location of the mid-beach and quadrats at the
last high tide line differ for each survey Importantly
the quadrats located at the last high tide line
provide a sample of litter arriving on that day
Each transect starts at the lsquopermanent landmarkrsquo at
the top of the beach to ensure transects are in the
same place each time a survey is conducted
Transects run roughly at a right angle from the top of
the beach towards the closest point at the waterline
gt Selection of reference beach survey locations
With a view to gaining insights into catchment
sources of microplastics to the Bay beaches
surveyed for Clean Bay Blueprint in various regions
of Port Phillip Bay are generally associated with a
river or a creek that flows into the Bay Those that
are not directly associated with rivers or creeks (Rye
and Geelong Eastern Beach) are included to provide
insights into the mobility of litter due to tidal
currents and seasonal winds
5 B A Y K E E P E R B E A C H L I T T E R A U D I T S
Figure 22 Location of Baykeeper Beach Litter Audit data collection quadrats along the widest (1) central (2) and narrowest (3) beach transects
F I G U R E 2 2
C O N T E N T S
| 45 |
Plastics that float in the upper water column are
carried in the direction of wind-generated waves
and the direction of tidal currents during calm
(low-wind) conditions (N Blake pers obs 2020)
Due to the combined effects of tides and varying
wind directions some plastic objects may travel
widely in the Bay before eventually being cast upon
a beach A notable example was one of five
GPS-tracked PET bottles released in Elwood Canal
on 9 May 2019 by RMIT6 After remaining in the
Canal for almost two weeks they ultimately landed
on Dromana beach on 25 May due to a prevailing
northerly wind Therefore in the absence of data
collection conducted on a weekly basis it is
impossible to definitively conclude where beach
litter on any given day may have originally
come from However seasonal
data collection at multiple
(Bay-wide) reference sites does
provide some indication of the
likely source (the catchment)
and ultimately presents a
baseline dataset with which
to determine if microplastics
lsquoleakagersquo into the Bay is
increasing or decreasing
over time
gt Surveys conducted
Between July 2017 and March 2020 117 beach litter
audits were conducted in 12 locations around Port
Phillip Bay (Table 2) with the help of local
community group volunteers not-for-profits and
education institutes All citizen scientists involved
received multiple on-site training sessions by the
Port Phillip Baykeeper before independently
conducting audits Regular reference beaches were
surveyed every three months (in May August
November and February) with surveys of all
beaches generally conducted within the same
fortnight Only sites that were surveyed on at least
six occasions have been given more detailed
analysis in this report
LOCATION ASSOCIATED RIVER
OR CREEK AUDITS
COMPLETED
Eastern Beach Geelong na 11
Moorpanyal Beach Geelong na 2
Werribee River Jetty Werribee River 6
South Beach Werribee Werribee River 7
West Beach St Kilda Yarra River 15
Point Ormond Elwood Elwood Canal 3
Mordialloc Beach Mordialloc Creek 4
Keast Park Seaford Patterson River 10
Frankston Beach Kananook Creek 12
Mothers Beach Mornington NA 4
Mount Martha Beach Balcombe Creek 30
Rye Beach na 13
Total surveys 117
Table 2 Beach litter audit sites and number of audits done between July 2017 and March 2020 Beach names in bold are the regularly surveyed reference beaches the other beaches were opportunistically surveyed
T A B L E 2
6 RMIT Litter Tracker project httpswwwrmiteduauaboutschools-collegesscienceresearchresearch-centres-groupsaquatic-environmental-stresslitter-trackers
| 46 |
Results and discussion
Figures 23 and 24 show beaches along Port Phillip
Bayrsquos eastern shores recorded much higher
concentrations of litter than Geelong Werribee and
Rye The lower counts at Geelong and Rye can be
attributed to the fact there is no major waterway
entering the Bay in their general vicinity and
raquo as Geelong Eastern beach is located near the
westernmost end of Corio Bay it has very limited
exposure to litter dispersed by wind and tides
from wider Port Phillip Bay
raquo Rye beach is the southernmost survey location in
the Bay relatively removed from major streams
and urban catchment
The much lower (near negligible) counts at
Werribee South and Werribee River jetty are likely
attributable to the fact that the Werribee River
catchment is much less urbanised (around 20)
than the catchments associated with most of the
eastern sites of the Bay These results suggest that
litter makes its way to the Bay from the catchments
via the waterways
The high average counts at Keast Park (Seaford)
equate to 42 of total litter collected at all survey
locations Field observations and anecdotal reports
of industrial sites in the Mordialloc Creek and
Patterson River catchments have identified two
particular sites that may be significant contributors
to the overall plastic pollution recorded at Keast
Park This result warrants more detailed analysis
and investigation
A total of 11248 items were recorded in this study
A breakdown of items collected in Figure 25 shows
very few gross pollutants (eg intact plastic bottles
and bags) were recorded while nurdles (pre-
production pellets) and plastic fragments combined
comprised 77 of the total records The volume of
microplastics observed in 9 m2 compared to
microplastics reported in typical beach cleans
confirms the effectiveness of the methodology in
systematically recording microplastics at reference
sites around the Bay
Of all litter recorded the quadrats within the lsquolast
high tide linersquo recorded the greatest percentage of
items (45) followed by the lsquotop beach zone (38)
then the lsquomid-beach zonersquo (18) However this
order did not apply to all beaches with several of
the less littered beaches recording the greater
amount in the top beach zone (Figure 26) Mt
Martha is notable in this regard among the more
heavily littered beaches in that the lsquotop beachrsquo
quadrats had the highest amounts in all three
transects However this result was skewed
significantly by the top beach of the central beach
transect which averaged 278 items per survey ndash
almost as much as the totalled averages for all other
quadrats combined (338 items)
Keast Park has the distinction of having the
highest percentage of nurdles (59 of items
recorded) compared to St Kilda West beach (47)
Frankston (34) Rye (22) and Mt Martha (17)
Nurdles were virtually absent from beaches on the
west side of the Bay
Examination of plastic fragments by type and size
also found Keast Park distinguished from other
beaches with 53 of fragments being hard
fragments lt 5 mm Frankston ranked next highest
for hard plastic fragments with 37 followed by Mt
Martha with 34
The significantly higher counts of nurdles and hard
plastic fragments lt 5 mm may be due to a
combination of factors such as
raquo the broader range of wind directions that might
affect the site prevailing winds are acknowledged
as a primary agent for litter dispersal and Keast
Park is located at the easternmost point of Port
5 B A Y K E E P E R B E A C H L I T T E R A U D I T S
C O N T E N T S
| 47 |
Figure 23 Average litter per survey for all beaches surveyed
Figure 24 Visualisation of total litter counts on sampled beaches around Port Phillip Bay larger circles represent higher counts Image source Port Phillip Sea Pilots
F I G U R E 2 4
F I G U R E 2 3
| 48 |
Figure 25 Litter category percentages of total litter recorded across all sites The numbers above the percentages are the total items collected
Figure 26 Comparison of results for tide line mid-beach and top beach zones
Phillip Bay and subject to winds from south to
north (the widest range of all sites surveyed)
raquo orientation of the beach (near North-South at
Keast Park)
raquo physical infrastructure impeding wave action on
this particular beach (the Riviera stormwater
outfall projects into the Bay at a point around
20 m south of the survey area)
raquo presence of plastics manufacturing and re-grind
industries within the catchments
raquo proximity to industrial sites in local river and
stream catchments (Mordialloc Creek and
Patterson River) to the north of the survey beach
(tidal currents that run clockwise around the Bay
would carry plastics generated by these streams
towards Keast Park)
The Frankston beach survey site is oriented NNE to
SSW which is not dissimilar to the orientation of
Keast Park (NNW-SSE) The two sites are just seven
kilometres apart Despite this proximity the
Frankston site (located just to the south of
Kananook Creek mouth) recorded considerably
fewer nurdles and hard plastic fragments than Keast
Park (which is to the south of Mordialloc Creek and
Patterson River) These findings suggest that close
scrutiny of the Mordialloc Creek and Patterson River
catchments for nurdles and hard plastic fragments
is warranted
F I G U R E 2 5
5 B A Y K E E P E R B E A C H L I T T E R A U D I T S
C O N T E N T S
| 49 |
F I G U R E 2 5
| 51 |
Port Phillip Bay on a windy day
6
| 51 |C O N T E N T S
Related litter investigations Over the life of Clean Bay Blueprint the EcoCentre collaborated with many other organisations Other investigative litter projects enabled by the Port Phillip Bay Fund with the primary aim of data collection for pollution prevention include
raquo Yarra Riverkeeper Associationrsquos Litter and Flows and polystyrene projects - analysing
litter in the Yarra
raquo RMIT Universityrsquos Plastics Lab project ndash analysing
plastic fragment samples to identify polymers and
adsorbed contaminants
raquo Tangaroa Blue Foundationrsquos Letrsquos Strain the Drains7 ndash trialling stormwater pit filtration devices
to document the captured contents in a range of
municipalities and for four different street usages
raquo Scouts Victoriarsquos Street2Bay8 project ndash auditing
litter in six different street usages in all catchments
around the Bay
raquo RMIT Universityrsquos Litter Tracker4 project ndash GPS
tracking and on-line reporting of the mobility of
plastic bottles released into streams in
catchments leading to Port Phillip Bay
raquo Beach Patrol Australia and Love Our Street have
also compiled considerable data with the mobile
Litter Stopper phone app9
Interactive litter maps
It is essential to provide data access and report back
on research results to citizen scientists and those
advocating for and designing change Data collected
from the beach audit sites have been entered into
an interactive Tableau data visualisation platform
and is hosted on the EcoCentre website with
potential for visualising street litter data collected by
other groups Consequently the Tableau platform
appears to be a useful means of engaging with
schools and the wider community in relation to the
high mobility of microplastic pollution
The EcoCentre was also part of the community
reference group that helped design and test the State
Governmentrsquos LitterWatch10 database which collects
and collates litter data from all over Victoria visualises
this on a map and makes it publicly accessible This
is the first attempt to gather all litter data no matter
which data-collection methods were used and bring
this together in one accessible repository
Incident reporting
During the course of the study several materials that
have been noted as of ongoing concern were
reported to relevant authorities These included Telco
wire offcuts discarded at telecom sites on streets
polystyrene waffle pod waste leaking from a building
site and AstroTurf fragments leaking from a
sportsground demolition
All of the complementary initiatives represent major
advances in our understanding of plastic pollution
and warrant careful consideration as a whole body
of information as opposed to in isolation particularly
with a view to adopting the optimum suite of data
collection methods for the future and to set targets
for local source reduction plans
7 tangaroablueorglets-strain-the-drains-port-phillip-bay-region-vic 8 httpsscoutsvictoriacomauactivities-eventsactivitiesenvironmentstreet2bay-project 9 httpswwwbeachpatrolcomau 10 httpslitterwatchvictoriaorgau
Sunset over Port Phillip Bay
RecommendationsOver the life of the Clean Bay Blueprint project microplastic pollution has stopped being an lsquoemerging issuersquo The irrefutable evidence of its unacceptable impact on the environment is well-documented all over the world
7
C O N T E N T S
| 53 |
Many governments are acting on the
recommendation from the science community that
society should not wait for any more quantification
of damage before taking action to reduce marine
plastic pollution impacts (Lavers and Bond 2017
Gall and Thompson 2015) In their report Marine
Plastics Debris and Microplastics the United Nations
stated there is a moral argument that we should not
allow the ocean to become further polluted with
plastic waste and that marine littering should be
considered a lsquocommon concern for humankindrsquo
(UNEP 2016)
The high quantities of litter and microplastics in the
Yarra and Maribyrnong rivers highlight the large
contribution of these rivers to marine plastic
pollution in Port Phillip Bay Recent research by
Borelle et al (2020) projected the future of plastic
pollution in our oceans and concluded that the
predicted growth in plastic waste in the next 10
years far exceeds the impacts of mitigation efforts
currently deployed Therefore significant changes
and investments need to be made to counter the
rising tide of plastic pollution in the oceans
| 54 |
Recommendation 1
gt Improve product stewardship
Plastic and microplastic pollution are everybodyrsquos
problem Over the lsquolifecyclersquo of a plastic item it
travels through the fossil fuel and petrochemical
industries transport and shipping plastic product
manufacturers retailers community local councils
waste contractors and the recycling industry
However whereas every link in this user chain has
some level of responsibility not everyone should be
expected to have the same level of accountability
for plastic waste The current responsibilities for the
fate of plastic products are not well-defined and are
often passed on to the next group down the line
putting a disproportionately large strain on
communities and local councils There is very little
meaningful manufacturing industry accountability
for the end-of-life destination of plastic whether for
waste management or pollution of the environment
The plastics industry is set to grow 40 by 203011
yet hardly any producer responsibility is taken for
the waste and problems its products cause Only
94 of manufactured plastic is being recycled in
Australia (OrsquoFarrell 2019) which is consistent with
9 world-wide9 An astonishing 11 enters the
oceans (Borelle et al 2020) Currently local councils
and the community are expected to deal with the
consequences of unregulated production of a
material that lasts in the environment forever
As Victoria is moving from a linear to a circular
economy model this is the perfect time to change
and define the responsibilities of the plastics
industry and their accountability Federal and state
governments play a key role in leading and
managing this change Some of the changes that
the EcoCentre believes should be made in the short
and long term are
11 Transition to a circular economy model
Product recovery schemes (such as the
container deposit legislation) that are part of a
circular economy model should be funded by
the industries which produce the product
and managed by an independent government
agency to prevent perversion of the initiative
12 Invest in implementing alternatives to
plastic Plastic is not the right material for
the majority of functions it performs eg
using a material that lasts forever for single-
use packaging The ever-increasing
monetary and environmental costs of
dealing with plasticrsquos end-of-life stage are too
high Many alternative truly biodegradable
materials have already been invented but
have not been taken up for large-scale use
Industry needs to be given incentives to
transition towards producing large-scale
alternative packaging solutions eg through
new legislation or stimulus measures such
as innovation grants or tax incentives
13 Set limits on virgin plastic production
This includes avoiding investments in
waste-to-energy schemes that burn plastic
as it perpetuates our reliance on a product
that should not be burned in the first place
14 Ban broad-scale groups of problematic
single-use plastics12 Examples such as South
Australiarsquos ban on single-use plastic items
will provide some of the incentives driving
innovation and transformation Bans may be
premised on design qualities rather than
product type for example banning oxo-
11 httpswwwplasticsoupfoundationorg 12 The Australian National Waste Policy Action Plan commits to banning lsquoproblematic and unnecessary single-use plasticsrsquo by 2025 and delegated the Australian Packaging Covenant Organisation to lead all governments to lsquoIdentify problematic and unnecessary single-use plastic packaging to provide an evidence base for industry to take coordinated actionrsquo by 2019 The resulting report identified four priority categories (including expanded polystyrene and non-certified compostable packaging such as oxo-degradable) and three materials for further investigation httpswwwpackagingcovenantorgaudocumentsitem3183
7 R E C O M M E N D A T I O N S
C O N T E N T S
| 55 |
13 Operation CleanSweep is a best-practice manual for plastic manufacturers that employs cost-effective ways of preventing nurdles leaking into the environment
degradable plastics (that merely break into
microplastics faster rather than biodegrade to
natural component materials) or non-
recyclablenon-compostable packaging
15 Make the Operation CleanSweep13
program mandatory instead of voluntary
for any manufacturer using nurdles and have
this enforced by EPA Victoria
Recommendation 2
gt Cultivate effective partnerships
It is critical that conversations and true working
partnerships are forged and maintained with a
long-term vision of collaboration and tangible
positive outcomes In the case of an issue as big as
plastic pollution cross-sectoral collaborations are
essential to ensure effective changes Industry local
government state government agencies (such as
EPA Victoria the Catchment Management
Authorities and Melbourne Water and others)
research institutes community organisations and
businesses all need to engage in ongoing dialogue
about responsibilities and most importantly to
reach clear agreement on which group is
accountable for delivery of each defined outcome
that is necessary to the success of the overall
enterprise This might be achieved through
stakeholder working forums similar to the Victorian
Department of Environment Land Water and
Planningrsquos Integrated Water Management Forums
Recommendation 3
gt Support local councils in waste management
Until larger systemic changes in waste
management are made the end-of-line
responsibilities councils have for plastic waste need
to be adequately supported and resourced The
costs of this should not be transferred to the
community via rate increases nor by reliance on ad
hoc manual volunteer clean-ups
Measures should include effectively resourcing
councils to
31 Install and maintain pollutant traps in
drain outlets that discharge into creeks
and rivers This could be a collaboration
with Melbourne Water Care should be taken
to not just install gross pollutant traps but
also traps that catch microplastics such as
Drain Buddies
32 Enforce litter and illegal dumping law
33 Run effective litter prevention and
education programs in the community and
especially with local businesses and industry
This may be best done by partnership with
trusted business or community
organisations supporting the outreach
34 Review and improve current street
sweeping schedules and where necessary
adapt these to be more effective at the
occurrence of large sporting events and
seasons when litter peaks occur
| 56 |
Recommendation 4
gt Continue monitoring (micro)plastic pollution
Existing waste management and anti-litter
initiatives are not effective enough to stop plastic
and microplastic pollution from reaching Port Phillip
Bay The research in this report has established a
baseline data set that shows that the problem is
getting worse over time
The river trawls and beach litter audit methods
described in this report are both demonstrated to
be scientifically valid means of ongoing data
collection and the multiple years of data gathered
represent a benchmark of plastic pollution in the
major rivers and Port Phillip Bay The street litter
audit method applied by Scouts Victoria in the
Street2Bay project has also proven to be an
effective and replicable means of monitoring plastic
pollution on streets in Port Phillip Bay catchments
Continued data collection using these methods can
provide a means of evaluating any future strategies
to reduce plastic pollution in waterways
Recommendation 5
gt Increase education and lsquoplastic literacyrsquo of all
plastic users
As part of cultivating a shared responsibility for
plastic use and disposal education of plastic users
is essential The general public has become much
more aware of the issues of plastic pollution in the
environment thanks to a boom in scientific
research followed by mainstream film
documentaries and social media and community
campaigns over recent years
However there is still much confusion about how
plastic can be avoided or what plastics are more
preferable to others An example of this is the actual
meanings of the words lsquobiodegradablersquo lsquodegradablersquo
lsquooxo-degradablersquo and lsquocompostablersquo for plastic bags
People generally try to do the right thing and want
to invest in better products but industry uses the
terms in misleading ways (picture 8)
Recommendations are therefore
51 Set standard legal definitions for
degradability labels
Not-for-profit organisations as well as local councils
play a key role in educating the community and
implementing education programs in schools
Organisations that specialise in this should be
adequately resourced It is likely the reduction in
plastic straws in the Yarra can be attributed to
education efforts and community behaviour change
projects showing that these approaches work The
community and NGOs are not significantly
mentioned in Recycle Victoria (February 2020)
whereas community and cross-sector
collaborations are mentioned in the Port Phillip Bay
EMP but funding for joint activities is unclear after
the conclusion of the Port Phillip Bay Fund in 2020Picture 8
Industry messaging on plastic bag
7 R E C O M M E N D A T I O N S
C O N T E N T S
| 57 |
52 Develop project grants forums and
strategic ongoing partnerships that
integrate community government research
and industry efforts
53 Adequately resource groups who
educate and facilitate action on plastic
pollution
Recommendation 6
gt Conduct further research
As highlighted in the study discussions above
additional research is needed to adequately monitor
microplastics in Melbournersquos waterways and Port
Phillip Bay Ongoing monitoring of surface waters is
necessary to track the quantities and movements of
microplastics and can serve as a baseline for source
reduction action Given the high numbers of
microplastics reaching the Bay from surface waters
it is also important to conduct further research into
the water column and the sediments
Recommendations for further research are
61 Conduct depth-sampling studies The
EcoCentre will pilot the MCWAP to start
monitoring microplastics in the water
column If successful the device and
methodology could be rolled out for use
across creeks and rivers of Victoria
62 Conduct sediment studies Sediment
research is necessary to identify where the
heavier polymers end up according to
Schwarz (2019) river sediments act as a plastic
sink and CSIRO estimated that based on their
samples taken in the South Australian Bight
144 million tonnes of microplastics reside on
the seafloor worldwide (Barrett et al 2020)
63 Prioritise understanding the
contaminants carried by plastic in
waterways and associated human health
risks Continued analysis of plastic polymer
types and chemical contaminants carried by
plastics in waterways is necessary to
strengthen our understanding of the
potential ecological and human health
impacts of plastic pollution
64 Conduct on-ground investigations for
major sources of hard plastics fragments
and nurdles within the Mordialloc Creek and
Patterson River catchments
Plastics Lab Dr Mayumi Allinson
View of St Kilda Beach
8
C O N T E N T S
| 59 |
A note on citizen scienceThe research conducted in this study strongly relied on the collaborations with volunteer citizen scientists Citizen science has received increasing recognition over the last decade and rightly so without more than 8800 hours contributed by volunteers for data collection sample sorting and analysis Clean Bay Blueprint could not have produced such robust results
This project is hardly an exception these days as
volunteers both individually and via community
groups put countless hours of their time and
expertise towards environmental projects that rely
on large datasets and labour-intensive analyses
It needs to be recognised that the contributions of
citizen scientists to science and environmental
change-making are both invaluable and essential
and that collaborations between research
institutions and community provide a powerful
opportunity to build understanding of complex
issues of Victorian Australian and global
significance Resourcing the professional
coordination of such collaborative studies often
provides funders with a multifold return on the
investment through generating new knowledge
inspiring extensive in-kind contributions and
activating community-led conversations and action
on topics that might otherwise be uncommon
around dinner tables classrooms and clubs
9
Little Penguin in Port Phillip Bay
C O N T E N T S
| 61 || 61 |
AcknowledgementsOne of Clean Bay Blueprintrsquos main goals was to build partnerships with other organisations that target litter and improve Bay health
raquo Khadija Muhanna Saif Al
Nabhani - RMIT University
raquo Hilda Poloso - RMIT University
raquo Minh Tu - Deakin University
raquo Daniel Cox - RMIT University
raquo Nick Bergstrom - Worcester
Polytechnic Institute
raquo Sarah Duquette - Worcester
Polytechnic Institute
raquo Madison Healy - Worcester Polytechnic Institute
raquo Nick Sorensen - Worcester Polytechnic Institute
raquo Cameron Collins - Worcester Polytechnic Institute
raquo Samantha Comeau - Worcester Polytechnic Institute
raquo Brendan Gallagher - Worcester Polytechnic Institute
raquo Gina Visser - Worcester Polytechnic Institute
raquo Katie Donovan - Worcester Polytechnic Institute
raquo Spencer Hoagland - Worcester Polytechnic Institute
raquo Thomas Lipkin - Worcester Polytechnic Institute
raquo Eric Stultz - Worcester Polytechnic Institute
We recognise the extensive and energetic contributions of many interns
Many new collaborations and ongoing partnerships were formed and many existing relationships were
leveraged during this project This was made possible by the funding from the Port Phillip Bay Fund of
EcoCentre projects as well as those of other organisations We therefore thank the State Government of
Victoria for its support
Our sincere thanks goes out to the many volunteers including work placement students and interns who
have donated hours of their time and expertise to the project to make it a success We acknowledge your
great passion for the environment and deep dedication to making positive change for the future of our
waterways This project would not have been possible without your support
raquo Balcombe Estuary Reserves
Group Mt Martha
raquo Beach Patrol Mt Martha
raquo Frankston Beach Patrol
raquo Rye Beach Patrol
raquo Beach Patrol Australia
raquo Seaford Beach Patrol
raquo Werribee Beach Patrol
raquo Werribee River Association
raquo Yarra Riverkeeper Association
raquo David Flew
(Karringal boat skipper)
raquo Blair Stafford Australasian
Ambassador of the 5 Gyres
Institute
raquo Blairgowrie Yacht Squadron
raquo Metropolitan Waste and Resource Recovery Group
raquo Melbourne Water
raquo Parks Victoria
raquo 3CR Community Radio
raquo 3RRR Community Radio
raquo Sacred Heart Mission
raquo Bellarine Catchment Network
raquo RMIT Plastics Lab Prof Graeme Allinson Dr Mayumi Allinson Marinda Pattison and students
raquo Scouts Victoria
raquo Worcester Polytechnic Institute
raquo Dolphin Research Institute
raquo Sustainability Victoria
raquo Victorian Litter Action Alliance
raquo Gordon TAFE
raquo Dr Christopher Johnstone and Emma Barnett of Monash University
raquo Victorian National Parks Association
raquo Federation University
raquo Australian Citizen Science Association
raquo The Age
raquo Department of Environment Land Water and Planning
raquo Ying Quek
raquo Port Phillip Menrsquos Shed
We thank the following organisations groups and individuals for their contribution and collaboration (in no particular order)
Appendicesgt Appendix 1
| 62 |
Figure 28 Percentage of microplastics in samples per trawl in the Yarra (blue) and Maribyrnong (red) rivers with 95 confidence intervals shaded grey The average percentage of microplastics per sample was 184 This number has stayed constant over time
F I G U R E 2 8
Appendices
Microplastic Image Josie Jones
C O N T E N T S
| 63 || 63 |
gt Appendix 2
MARIBYRNONG YARRA
Hard plastic fragments 174 -102
Soft plastics 959 -560
Polystyrene -1688 986
Nurdles 803 -469
Plastic bottle caps 542 -317
Plastic straws 529 -309
Sponge -167 097
Twine 412 -241
Other 004 002
Cigarette butts 596 -348
F I G U R E 2 9
Figure 29 Mosaic plot showing the Chi-Square test results (in Table 3 below) The statistical test looks at whether proportions are different than what is expected by chance considering both the Yarrarsquos and Maribyrnongrsquos total litter The width of the boxes show the proportion of litter in the Maribyrnong compared to the Yarra The height of the boxes shows the proportion of litter for each litter item The colours represent significance Boxes coloured red have lower proportions than expected by chance and those in blue have higher proportion than expected by chance The boxes for hard plastic are grey meaning there are no significant differences in proportions of expected hard plastic fragments in the Maribyrnong or Yarra rivers (P gt 005) The boxes for nurdles bottle caps straws and soft plastics are blue for the Maribyrnong and red for the Yarra meaning there are proportionally more nurdles bottle caps plastic straws and soft plastics than expected in the Maribyrnong river and fewer than expected in the Yarra (P lt 005)
Table 3 Residuals from Chi-square test for plastics count as a function of waterway and plastics category Significant values are in bold red
T A B L E 3
| 64 |
gt Appendix 3
Plastic polymer analysis
A
B The below Table 7 is used with
permission from the unpublished
Honours dissertation Analysis of
Microplastic Polymers in the Yarra and
Maribyrnong Rivers (May 2020) by
Marinda Pattison under supervision of
Associate Professor Graeme Allinson
Table 6 Plastic polymer density (Stelray Plastic Products 2020)
T A B L E 6
YARRA RIVER MARIBYRNONG RIVERPercentage () Std Dev Percentage () Std Dev
Total PE 4750 1113 4916 1562
PP 2204 1024 2361 867
PS 1530 1195 791 871
PU 088 217 035 067
Nylons 027 064 104 241
EVA 043 062 049 101
PVC 021 065 008 023
Latex 002 008 005 019
PE amp PP mix 023 039 021 055
PET 002 008 000 000
Nitrile 000 001 000 000
PMMA 002 009 000 000
PTFE FEP 000 000 000 000
CA 001 005 000 000
PC 001 006 007 027
ABS 012 046 000 000
Unknown 067 096 088 113
T A B L E 7
Table 7 Mean abundance (percentage) of polymers in Yarra and Maribyrnong Rivers
A P P E N D I C E S
C O N T E N T S
| 65 |
gt Appendix 4
Changes in individual litter items over time
YARRA RIVER
Plastic Kendallrsquos tau Z P-value
Hard Plastic Fragments 033 741 lt0001
Nurdles 008 086 0391
Other 023 229 0022
Plastic Bottle Caps 016 146 0146
Plastic Straws -025 -234 0019
Polystyrene 022 346 0001
Soft Plastics 027 578 lt0001
Sponge 025 248 0013
Twine 007 072 0470
Cigarette butts 017 164 0102
MARIBYRNONG RIVER
Plastic Kendallrsquos tau Z P-value
Hard Plastic Fragments 026 552 lt0001
Nurdles -004 -044 0657
Other 043 416 lt0001
Plastic Bottle Caps -013 -125 021
Plastic Straws -021 -195 0051
Polystyrene 009 14 0161
Soft Plastics 013 279 0005
Sponge 007 064 0524
Twine 004 042 0671
Cigarette butts -003 -031 0755
Table 4 Kendallrsquos tau test results Change in counts of plastic over time by category for the Yarra and Maribyrnong rivers Kendallrsquos tau the Z value and P-values are presented Significant values are in red These results are important for interpreting the scatterplots in Figures 18 and 19 A positive tau indicates an increase in litter over time A negative tau indicates a decrease over time Kendallrsquos tau is a non-parametric correlation value
T A B L E 4
| 66 |
gt Appendix 5
Bandalong litter traps
In the Yarra River multiple outliers were recorded for the total litter items captured per trawl date Litter traps
were emptied over 24 of the trawl days Six of those days showed higher than average litter counts On 35
trawl days litter traps were not emptied and we saw five higher than average total litter counts
Figure 30 A Wilcoxon rank sum test compared median litter counts when litter trap was emptied to when litter trap was not emptied (two days before trawl) We did not find any effect of litter trap emptying on the total number of litter items captured (W = 289 P = 0162)
F I G U R E 3 0
A P P E N D I C E S
C O N T E N T S
| 67 |
gt Appendix 6
Yarra Environmental flows
There was no significant association between environmental flow events and plastic counts in the Yarra (t =
-03 P = 0768) The amount of variation in microplastic counts explained by environmental flows was close
to zero (adjusted R2 lt 0001) Note that microplastic count was square root transformed to meet
assumptions of a regression analysis
Figure 31 Count of microplastics per trawl as a function of environmental flows in the Yarra River
F I G U R E 3 1
raquo Andrady A L (2006) Assessment of
environmental biodegradation of synthetic
polymers Polym Rev 1994 3425ndash76
raquo Andrady A L (2011) Microplastics in the marine
environment Marine pollution bulletin 62
1596-1605
raquo Barua S Muttil N Ng A amp Perera B (2013) Rainfall
trend and its implications for water resource
management within the Yarra River catchment
Australia Hydrological Processes 27 1727-1738
raquo Barmand S Goodsell K Yardley D Kowalczyk N
(2020) Polystyrene pollution in the Yarra river
sources and solutions Yarra Riverkeeper
Association
raquo Barnes D K Galgani F Thompson R C amp Barlaz
M (2009) Accumulation and fragmentation of
plastic debris in global environments
Philosophical Transactions of the Royal Society of
London B Biological Sciences 364 1985-1998
raquo Barrett J Chase Z Zhang J Banaszak Holl M M
Willis K Williams A Hardesty B D Wilcox C
(2020) Microplastics pollution in deep-sea
sediments from the Great Australian Bight
Frontiers in Marine Science October 2020
Volume 7 Article 576170
raquo Blake N amp Charko F (2014) Pilot study to identify
the extent of microplastics in the Maribyrnong
and Yarra Rivers and Port Phillip Bay Port Phillip
EcoCentre report
raquo Borelle S B Ringma J Law K L Monnahan C C
Lebreton L McGivern A Murphy E Jambeck J
Leonard G H Hilleary M A Eriksen M
Possingham H P De Frond H Gerber L H
Polidoro B Tahir A Bernard M Mallos N Barnes
M Rochman C M (2020) Predicted growth in
plastic waste exceeds efforts to mitigate plastic
pollution Science 369 (6510) 1515-1518
raquo Brillant M amp Macdonald B (2000) Postingestive
selection in the sea scallop Placopecten
magellanicus (Gmelin) the role of particle size
and density Journal of Experimental Marine
Biology and Ecology 253 211-227
raquo Browne M A Dissanayake A Galloway T S
Lowe D M amp Thompson R C (2008) Ingested
microscopic plastic translocates to the circulatory
system of the mussel Mytilus edulis (L)
Environmental science amp technology 42
5026-5031
raquo Browne M A Niven S J Galloway T S Rowland
S J amp Thompson R C (2013) Microplastic moves
pollutants and additives to worms reducing
functions linked to health and biodiversity
Current Biology 23 2388-2392
raquo Charko F Blake N Kowalczyk N Johnstone C
Seymore A Quek Y (2018) Microplastics in the
Maribyrnong and Yarra Rivers Melbourne
Australia Port Phillip EcoCentre report
raquo CIEL (2019) Plastic amp climate the hidden costs
of a plastic planet Center for International
Environmental Law
httpswwwcielorgplasticandclimate
raquo Chidambarampadmavathy (2017) Sustainable
bio-plastic production through landfill methane
recycling Renewable and Sustainable Energy
Reviews Volume 71 May 2017 Pages 555-562
raquo Cole M Lindeque P Halsband C amp Galloway T S
References
| 68 |
R E F E R E N C E S
C O N T E N T S
| 69 || 69 |
(2011) Microplastics as contaminants in the
marine environment a review Marine pollution
bulletin 62 2588-2597
raquo Commonwealth of Australia (2016) Toxic tide the
threat of marine plastic pollution in Australia
Environment and Communications Reference
Committee
raquo DAWE (2018) National Waste Policy - less waste
more resources Department of Agriculture Water
and the Environment
raquo DAWE (2019) National Waste Policy - Action plan
Department of Agriculture Water and the
Environment
raquo DELWP (2017) Port Phillip Bay Environmental
Management Plan The State of Victoria
Department of Environment Land Water
and Planning
raquo DELWP (2019) Victoria in Future 2019 ndash
Population Projections 2016 to 2056 The State of
Victoria Department of Environment Land Water
and Planning
raquo Depledge M Galgani F Panti C Caliani I Casini
S amp Fossi M (2013) Plastic litter in the sea Marine
environmental research 92 279-281
raquo Eerkes-Meedrano D Thompson R C amp Aldridge
D C (2015) Microplastics in freshwater systems a
review of the emerging threats identification of
knowledge gaps and prioritisation of research
needs Water research 75 63-82
raquo Galgani F Hanke G Werner S Oosterbaan
Nilsson P Fleet D (2013) Guidance on monitoring
of marine litter in European seas European
Commission
raquo Gall S amp Thompson R (2015) The impact of debris
on marine life Marine Pollution Bulletin 92 170-179
raquo Gasperi J Wright S L Dris R Collard F Mandin
C Guerrouache M Langlois V Kelly F J Tassing
B (2018) Microplastics in air are we breathing it
in Current Opinion in Envi Sci amp Health vol 1 1-5
raquo Gewert B Plassmann M M MacLeod M (2015)
Pathways for degradation of plastic polymers
floating in the marine environment
Environmental Science Processes amp Impacts vol
17 no 9 pp 1513-1521
raquo Hoellein T J McCormick A R Hittie J London
M G Scott J W amp Kelly J J (2017) Longitudinal
patterns of microplastic concentration and
bacterial assemblages in surface and benthic
habitats of an urban river Freshwater science
35(3) 000-000
raquo Jambeck J R Geyer R Wilcox C Siegler T R
Perryman M Andrady A Narayan R amp Law K L
(2015) Plastic waste inputs from land into the
ocean Science 347 768-771
raquo Jepson P D Deaville R Barber J L Aguilar A
Borrell A Murphy S Barry J Brownlow A
Barnett J Berrow S Cunningham A A Davidson
N J Ten Doeschate M Esteban R Ferreira M
Foote A D Genov T Gimenez J Loveridge J
Llvona A Martin V Maxwell D L Papachlimitzou
A Penrose R Perkins MW Smith B De Stephanis
R Tregenza N Verborg P Fernandez A Law R J
(2016) PCB pollution continues to impact
populations of orcas and other dolphins in
European Waters Nature Science Reports 6 18573
raquo Kim JS Lee HJ Kim SK Kim HJ (2018) Global
Pattern of Microplastics (MPs) in Commercial
| 70 |
Food-Grade Salts Sea Salt as an Indicator of
Seawater MP Pollution Environ Sci Technol
2018 52 21 12819-12828
raquo Klein S Worch E Knepper T P (2015) Occurrence
and spatial distribution of microplastics in river
shore sediments of the Rhine-Main area in
Germany Environmental Science amp Technology
vol 49 no 10 pp 6070-6076
raquo Kowalczyk N Kelly A (2020) Litter and Flows
Connecting the Yarra and Bay Yarra Riverkeeper
Association
raquo Lamb JB Willis BL Fiorenza EA Couch CS
Howard R Rader DN True JD Kelly LA Ahmad
A Jompa J Harvell CD (2018) Plastic waste
associated with disease on coral reefs Science
359 460-462 (2018)
raquo Lavers J L Bond A L (2017) Exceptional and
rapid accumulation of anthropogenic debris on
one of the worldrsquos most remote and pristine
islands Proceedings of the National Academy of
Sciences 201619818
raquo Lavers J L Bond A L amp Hutton I (2014) Plastic
ingestion by Flesh-footed Shearwaters (Puffinus
carneipes) Implications for fledgling body
condition and the accumulation of plastic-derived
chemicals Environmental Pollution 187 124-129
raquo Lima A Costa M amp Barletta M (2014) Distribution
patterns of microplastics within the plankton of a
tropical estuary Environmental Research 132
146-155
raquo Ling S Sinclair M Levi C Reeves S amp Edgar G
(2017) Ubiquity of microplastics in coastal seafloor
sediments Marine Pollution Bulletin 121(1-2)
raquo Lusher A Hollman P Mendoza-Hill J (2017)
Microplastics in Fisheries and Aquaculture ndash
status of knowledge on their occurrence and
implications for aquatic organisms and food
safety Food amp Agriculture Organisation of the
United Nations Technical paper 615 Abstract V
raquo Mai L Bao LJ Shi L Wong CS Zeng EY (2018)
A review of methods for measuring microplastics
in aquatic environments Environ Sci Pollut Res
25 11319-11332 (2018)
raquo Mani T Hauk A Walter U amp Burkhardt-Holm P
(2015) Microplastics profile along the Rhine River
Scientific Reports 5 17988
raquo Mattson K Johnson E V Malmendal A Linse S
Hansson L-A Cedervall T (2017) Brain damage
and behavioural disorders in fish induced by
plastic nanoparticles delivered through the food
chain Scientific Reports volume 7 Article
number 11452 (2017)
raquo Melbourne Water (2018) Co-Designed Catchment
Program for the Maribyrnong Catchment Region
(including Moonee Ponds Creek) ndash October 2018 |
Version 1
raquo Melbourne Water (2018) Co-Designed Catchment
Program for the Yarra Catchment ndash October 2018
| Version 1
raquo Moore C amp Phillips C (2011) Plastic Ocean How a
sea captainrsquos chance discovery launched a
determined quest to save the oceans Avery
New York
raquo Murray F amp Cowie P R (2011) Plastic
contamination in the decapod crustacean
Nephrops norvegicus (Linnaeus 1758) Marine
pollution bulletin 62 1207-1217
References (cont)
R E F E R E N C E S
C O N T E N T S
| 71 |
raquo OrsquoFarrell K (2019) 2017-2018 Australian Plastics
Recycling Survey ndash National Report Envisage
Works Australian Government Department of the
Environment and Energy EPA NSW Sustainability
Victoria Government of Western Australia ndash
Department of Water and Environmental Regulation
raquo Orb Media (2017) Invisibles the plastics inside us
Orbmediaorgstoriesinvisibles_plastics
raquo Pattison M (2020) Analysis of microplastic
polymers in the Yarra and Maribyrnong Rivers
Unpublished Honours dissertation
raquo Rochman C M Hoh E Kurobe T amp Teh S J
(2013) Ingested plastic transfers hazardous
chemicals to fish and induces hepatic stress
Scientific reports 3
raquo Royer S-J Ferroacuten S Wilson S T Karl D M (2018)
Production of methane and ethylene from plastic
in the environment PLOS One 13(8) e0200574
raquo Sadri S S amp Thompson R C (2014) On the
quantity and composition of floating plastic debris
entering and leaving the Tamar Estuary Southwest
England Marine pollution bulletin 81 55-60
raquo Schwartz A E Ligthart T N Boukris E Van
Harmelen T (2019) Sources transport and
accumulation of different types of plastic litter in
aquatic environments A review study Marine
Pollution Bulletin 143 (2019) 92-100
raquo Sustainability Victoria (2019) Microplastics and
Port Phillip Bay - Citizen science study finds
significant amounts of microplastics on Port
Phillip Bay beaches Summary report
raquo Teuten E L Saquing J M Knappe D R Barlaz M
A Jonsson S Bjoumlrn A Rowland S J Thompson
R C Galloway T S amp Yamashita R (2009)
Transport and release of chemicals from plastics
to the environment and to wildlife Philosophical
Transactions of the Royal Society of London B
Biological Sciences 364 2027-2045
raquo Thompson R C Olsen Y Mitchell R P Davis A
Rowland S J John A W McGonigle D amp Russell
A E (2004) Lost at sea where is all the plastic
Science 304 838-838
raquo UNEP (2016) Marine plastic debris and
microplastics ndash Global lessons and research to
inspire action and guide policy change United
Nations Environment Programme Nairobi
raquo World Health Organisation (2019) Microplastics in
drinking water WHO Technical report
raquo Zeynep A Basak G (2019) Microplastics in the
environment A critical review of current
understanding and identification of future
research needs Environmental Pollution 254
(2019) 113011
raquo Yonkos L T Friedel E A Perez-Reyes A C
Ghosal S amp Arthur C D (2014) Microplastics in
four estuarine rivers in the Chesapeake Bay
USA Environmental science amp technology 48
14195-14202
raquo ZonMW (2019) httpswwwzonmwnlen
research-and-resultslife-sciences-health
programmasprogramme-detail
microplastics-health
Imag
e J
osi
e Jo
ne
s
Imag
e J
osi
e Jo
ne
s
Imag
e N
at S
ald
um
bid
e