clean development mechanism simplified project design ... · pdf filecdm-ssc-pdd (version 02)...
TRANSCRIPT
CDM-SSC-PDD (version 02) CDM – Executive Board page 1
CLEAN DEVELOPMENT MECHANISM
SIMPLIFIED PROJECT DESIGN DOCUMENT FOR SMALL-SCALE PROJECT ACTIVITIES (SSC-CDM-PDD)
Version 02
CONTENTS
A. General description of the small-scale project activity B. Baseline methodology C. Duration of the project activity / Crediting period D. Monitoring methodology and plan E. Calculation of GHG emission reductions by sources F. Environmental impacts G. Stakeholders comments Annexes Annex 1: Information on participants in the project activity Annex 2: Information regarding public funding
CDM-SSC-PDD (version 02) CDM – Executive Board page 2
Revision history of this document
Version Number
Date Description and reason of revision
01 21 January 2003
Initial adoption
02 8 July 2005 • The Board agreed to revise the CDM SSC PDD to reflect guidance and clarifications provided by the Board since version 01 of this document.
• As a consequence, the guidelines for completing CDM SSC PDD have been revised accordingly to version 2. The latest version can be found at <http://cdm.unfccc.int/Reference/Documents>.

CDM-SSC-PDD (version 02) CDM – Executive Board page 3 SECTION A. General description of the small-scale project activity A.1. Title of the small-scale project activity: >> 3.76 MW Electricity Generation Project from Poultry Litter , in Tamilnadu , India. Version 02 Date: Dec 15 , 2005 A.2. Description of the small-scale project activity: >> Poultry Litter to electricity generation is a pioneering environmentally friendly technique for waste management and power generation as well. This project activity is sponsored by Subhashri Bioenergies Pvt Ltd , Thiruchengode , Namakkal District , Tamil Nadu , India. The project involves following specific steps:
- Collection of Poultry Litter and recovery of methane from the litter using high rate biomethanation technology
- Generation of electricity using methane and connect to state owned grid - To produce manure from the residue of the digested litter
The first step in this technology is collecting poultry litter in primary collection tanks and wash and segregate non –digestible waste. The washed litter is then pumped to the digester for biomethanation. The bio-gas that is generated in the digester is washed and scrubbed and stored intermediately in a gas holder .From the gas holder it is drawn to 3.76 MW engine for generation of power. The schematic diagram of the technology employed is shown in section A 4.2 The conversion of Poultry –litter into power generation has following advantages:
- The current practice of uncontrolled storage of poultry litter , which will generate methane and Nitrous oxide , is brought under control. In the proposed system the litter is periodically removed and transported to power plant.
- The hygienic condition for the birds is improved. - The litter slurry that remains as a residue after the methane generation is converted into manure. - The biogas that is generated is substituted for power generation with a calorific value of 5100-
5300 kcals / CUM. This project activity is one of pioneering efforts with the following environment friendly considerations.
• Better and efficient Animal waste management . . • Control of dumping of animal waste..

CDM-SSC-PDD (version 02) CDM – Executive Board page 4
• Reduction in generation of anthropogenic emissions of GHG ( Methane and Nitrous Oxide) from dumping sites thereby developing it as a potential CDM project.
• Employment generation for the rural people. • Prevention of Contamination of soil due to volatilation of ammonia and NO3 • Prevention of Leachate polluting ground water resources. • Mitigation of Obnoxious odour in the surrounding areas. • Mitigation of Health hazards to people and birds causing respiratory diseases. • Saving the site from Breeding of pathogens, vermins and insects. • Reducing the Fly menace and insect production , that may cause several diseases. • Mitigating the increase in the level of Coliforms, Staphylococcus and Salmonella that will cause
diseases to people and birds. • Increases the immunity level of diseases in birds resulting in higher egg production leading to
economical gains The projects contribution toward sustainable Development in line with the countries policy , will be as follows: Social Well Being
- This project activity adds to the capacity of TNEB Grid ,which is a part of Southern Grid by generating power using renewable energy
- This project activity contributes generation of Power from animal waste which otherwise would have been a concern for the local community.
- The project activity provides additional sources of income , by providing direct and indirect employment for the rural population.
Economic Well Being
- The project activity provides employment to 100 people in the power plant operations. - The project activity provides employment to 800 people in the biomass collection and
transportation activity. - The project activity provides employment to 100 people in the manure manufacturing and
distribution activity. - The project activity contributes to increased Egg yield from the birds
Environmental Well Being
- The project activity Prevents water and land pollution by poultry litter - The project activity enables Organic Manure for the fertility of lands - The project activity Reduces health hazards for the birds - The project activity reduces methane and ammonia emission, - The using of biogas from the project activity to generate power does not result in any GHG
emission. - There is no significant environmental aspect generated by the project.
Technological Well Being

CDM-SSC-PDD (version 02) CDM – Executive Board page 5 A proven technology is used by the project to ensure efficient and safe operation of the plant. A.3. Project participants: >> Name of Party involved (*) ((host)indicates a host party)
Private and/or public entity (ies) Project Participants(*) (as applicable)
Kindly indicate if the party involved wishes to be considered as project participant (Yes/NO)
Government of India (Host Party)
Public NO
Subhashri Bio Energies Pvt Ltd (SBEL)
Private Yes
(*)In accordance with the CDM modalities and procedures, at the time of making the CDM-PDD public at the stage of validation, a Party involved may or may not have provided its approval. At the time of requesting registration, the approval by the party (ies) involved is required. Note: When the PDD is filled in support of a proposed new methodology(forms CDM-NBM and CDM-NMM), at least the host Party (ies) and any known project participant (e.g. those preparing a new methodology) shall be identified.
A.4. Technical description of the small-scale project activity: >> A.4.1. Location of the small-scale project activity: >> A.4.1.1. Host Party(ies): >> Host Party (ies): Government of India A.4.1.2. Region/State/Province etc.: >> Region: Southern India State: Tamil Nadu A.4.1.3. City/Town/Community etc: >> City: Namakkal District Town: Thiruchengodu Community: 67 , Goundampalayam - Village A.4.1.4. Detail of physical location, including information allowing the unique identification of this small-scale project activity(ies): >>
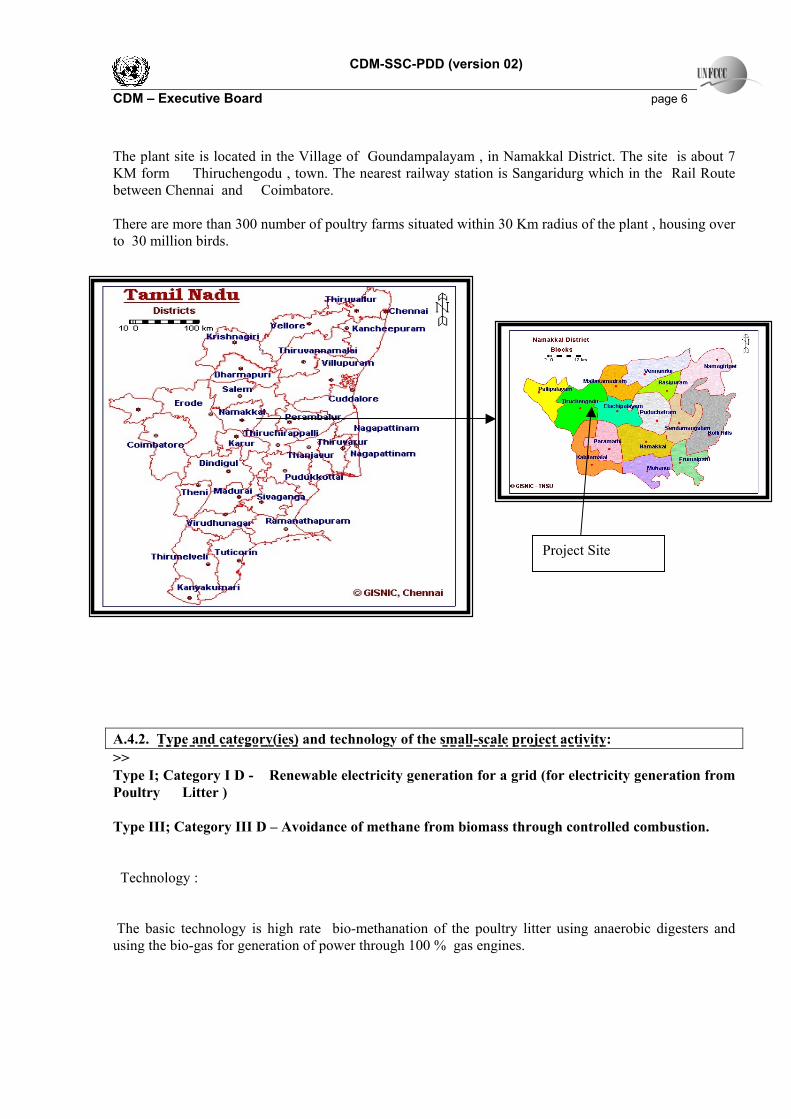
CDM-SSC-PDD (version 02) CDM – Executive Board page 6 The plant site is located in the Village of Goundampalayam , in Namakkal District. The site is about 7 KM form Thiruchengodu , town. The nearest railway station is Sangaridurg which in the Rail Route between Chennai and Coimbatore. There are more than 300 number of poultry farms situated within 30 Km radius of the plant , housing over to 30 million birds. A.4.2. Type and category(ies) and technology of the small-scale project activity: >> Type I; Category I D - Renewable electricity generation for a grid (for electricity generation from Poultry Litter ) Type III; Category III D – Avoidance of methane from biomass through controlled combustion. Technology : The basic technology is high rate bio-methanation of the poultry litter using anaerobic digesters and using the bio-gas for generation of power through 100 % gas engines.
Project Site

CDM-SSC-PDD (version 02) CDM – Executive Board page 7 The technology process is as given below:
Activity Key Specs Primary Collection 2 numbers of 5 M X 4.5 M X 11 M to hold 200 tons of poultry litter
Segregation Hydro Cyclone Separator and Spiral Separator
Digester Circular Steel Dome , 6000 Cum
Gas Cleaning Non Effluent Regenerating Scrubber
Engines Duetz make Gas engines of 1.275 KVA – 3 nos 12 Cylinder , 1500 RPM
The schematic diagram of the project is as shown below.
A.4.3. Brief explanation of how the anthropogenic emissions of anthropogenic greenhouse gas (GHGs) by sources are to be reduced by the proposed small-scale project activity, including why the emission reductions would not occur in the absence of the proposed small-scale project activity, taking into account national and/or sectoral policies and circumstances: >> The proposed project activity reduces anthropogenic emission of greenhouse gas (GHGs) by two means.
- By avoiding uncontrolled dumping and storage of poultry waste to the tune of 320 tonnes per day

CDM-SSC-PDD (version 02) CDM – Executive Board page 8
- By generating power using GHG neutral bio-gas resulting in the displacement of fossil-fuel generated power.
In the absence of the project activity , the poultry waste is kept in open dumping and removed once in six months. This is sold as a manure once in 6 months. This results in generation of methane and ammonia , due to uncontrolled anaerobic digestion. Refer figure Below
The absence of the project activity will also lead to additional load of power generation in the TNEB Grid,which is a part of Southern Grid, which is predominantly constituted by Coal and Gas based power stations. A.4.3.1 Estimated amount of emission reductions over the chosen crediting period: >>
S.NO.
Years
Annual estimation of emission Reduction in tones of CO2 e
1 2006 33,1592 2007 33,1593 2008 33,1594 2009 33,1595 2010 33,1596 2011 33,1597 2012 33,159

CDM-SSC-PDD (version 02) CDM – Executive Board page 9
Total estimated reductions (tons of CO2 e)
232,116
Total number of crediting years 7 Annual average over the crediting period of estimated reductions (tons of CO2 e)
33,159
A.4.4. Public funding of the small-scale project activity: >> There is no public funding used by the project. The Funding pattern for the project activity is as follows:
Total Project Cost Million INR 246.9 Subsidy From MNES Million INR 60.00 Promoters Contribution Million INR 56.72 Loan From Financial Institution Million INR 130.83
A.4.5. Confirmation that the small-scale project activity is not a debundled component of a larger project activity: >> According to paragraph 2 of Appendix C to the Simplified Modalities and Procedures for Small – Scale CDM project activities (FCCC/CP/2002/7/Add.3), a small-scale project is considered a debundled Component of a large project activity if there is a registered small-scale activity or an application to register another small- scale activity.
With the same project participants In the same project category and technology Registered within the previous two years; and Whose project boundary is within 1km of the project boundary of the proposed small scale
activity The project sponsor has not registered any projects, falling in any of the above category and it is confirmed that the proposed project activity is not a debundled component of a larger project activity. SECTION B. Application of a baseline methodology: B.1. Title and reference of the approved baseline methodology applied to the small-scale project activity: >> The Baseline methodologies applicable to the proposed project activity are as follows: Type I Category I D Renewable electricity generation for a grid Type III Category III D Methane Recovery Reference Appendix B of the simplified M&P for small scale CDM project activities: Indicative simplified baseline and monitoring methodologies for a selected small scale CDM project activity

CDM-SSC-PDD (version 02) CDM – Executive Board page 10 B.2 Project category applicable to the small-scale project activity: >> Justification of the choice of baseline methodology and its applicability to the project activity Type I – Category ID : The project activity is a renewable energy project which uses bio-gas generated from animal waste as a fuel and has a maximum output capacity of 3.76 MW Capacity which is less than 15 MW. The proposed output from the power plant is connected to the T.N.E.B grid, which is part of Southern Grid Type III – Category III D The project activity involves recovery of methane from poultry waste ( Agro Industry) and project emissions is less than 15 kilo tonnes of CO2e annually. The Baseline Scenario are as follows: The baseline scenario which points to generation of GHG in the absence of the project activity are as follows: Baseline
Description Information
Baseline 1
The GHG emissions by sources connected to Tamil Nadu Electricity Board Grid, which is part of Southern Grid (The Kwh Produced by the renewable generating unit multiplied by and emission coefficient)
Based on Emission Coefficient for TNEB Grid, which is part of Southern Grid
Baseline 2 Methane emissions from uncontrolled storage of animal waste
Based on the Methane Emission Factor for the Poultry Waste as per the guidelines of IPCC
The formulae for calculating the above baseline 1 and Baseline 2 are explained in section E. B.3. Description of how the anthropogenic emissions of GHG by sources are reduced below those that would have occurred in the absence of the registered small-scale CDM project activity: >> General Justification for application of small scale methodologies to the project activity:

CDM-SSC-PDD (version 02) CDM – Executive Board page 11 The installed capacity of the project is 3.76 MW, which is less than the limiting capacity of 15 MW and is thus eligible to use small-scale simplified methodologies. Further, the project activity is “generation of electricity for a grid system using biomass based on animal waste Hence, the type and category of the project activity matches with I.D. as specified in Appendix B of the indicative simplified baseline and monitoring methodologies for small-scale CDM project activities Project Additionality analysis Additionality of the of the Project presented in the following sections as per guidelines given Attachment A of appendix B Barrier Analysis
A) Investment Barriers:
Total Project Cost 246.9 INR Million Subsidy From MNES 60.00 INR Million Promoters Contribution 56.72 INR Million Loan From Financial 130.83 INR Million IRR 10.1% INR Million DSCR 1.2 INR Million
The acceptable IRR in the electrical industry is 16% where as the IRR from project activity is only 10.1% The acceptable DSCR for attractive investment proposal is 1.4 where as where as the IRR from project activity is only 1.2
** Note: The details of the Investment analysis will be provided to DOE B) Operational Barrier:
The smooth running of the power plant depends on continuous availability of the animal waste . This requires a complex logistics management system to transport the animal waste from different locations. More over operation and maintenance of the gas engine running on Bio Gas is expensive , as , compared to indigenous diesel generators.
C} Common Practice Analysis In Tamil Nadu generation of power from Bio-mass is either for grid connected use or captive use is very meagre percentage. The installed capacity of biomass plants will be less than 100 MW. Besides this , power generation from animal waste will be one of the first few of its kind in the state. There is no regulation or policy requirement for using a particular type of fuel. D) Technology Barrier:

CDM-SSC-PDD (version 02) CDM – Executive Board page 12 This is first project in India with indigenous technology of bio-methanation. This is accompanied by many technological uncertainties which will affect the profitability of the project. Impact of CDM Revenue:
- CDM revenues from C E R selling can be used for compensating the lower profitability of the project. - CDM revenues used better operation and maintenance of equipment. - CDM revenues will attract other players to put up power generation projects using renewable
energy sources. The project activity contributes to abetment of GHG emissions in two ways. 1. Management of poultry litter thereby avoiding the accumulation of poultry waste in poultry sites leading to generation of methane. Thus the project avoids generation of methane and GHG emission. 2. The poultry waste used for generation of power from a 3.76 MW installed capacity plant which is fed into the TNEB grid which is part of Southern Grid. The power generation is done through renewable sources (organic waste), which when fed into the grid replaces equivalent carbon dioxide generation from baseline scenario of the Southern grid. Therefore under business as usual circumstances both the generation of electricity (CO2 emissions) and Accumulation of poultry waste (CH4 emissions) would have continued. B.4. Description of how the definition of the project boundary related to the baseline methodology selected is applied to the small-scale project activity: >> The physical / geographical project boundary is schematically explained following diagram.

CDM-SSC-PDD (version 02) CDM – Executive Board page 13
Project Boundary
B.5. Details of the baseline and its development: >> The proposed baseline methodology is described below. Electricity Baseline: (Baseline-1) The 3.76 poultry -to-electricity power plant is supplying electricity to the grid, thus the grid average of the Southern grid is considered for calculating the baseline emissions. Poultry Waste Emissions Baseline: : (Baseline-1) Methane emissions from accumulation of poultry waste in the poultry site. Estimation of Greenhouse gas reduction
1. Generation of Electricity (CO2 emissions reduction)
Based the project’s category 1-D and in accordance with the approved methodology AMS-I-D for the project category; consolidated methodology is being applied. In following steps. Estimate Approximate Operating Margin Estimate Build Margin based on the data from 2003-2005 which will be fixed ex-ante for the first crediting period. The proposed baseline methodology is described below. Based the project’s category 1-D and in accordance with the approved methodology AMS-I-D for the project category; consolidated” methodology is being applied in the following steps. ( Source of Data : CEA – India - ) The proposed baseline methodology is described below.
Collection Tank Poultry
Transportation Diesel;
Manure Digester
Bio- Gas
Generator TNEB- Grid/ Southern Grid

CDM-SSC-PDD (version 02) CDM – Executive Board page 14 Annual Energy supplied to the Southern grid from the project activity from the installed capacity of 3.76 MW is 26 MU
Thus as per clause 7 under ID of Appendix B of the simplified modalities and procedures for small scale CDM projects:
A: The average Operating Margin (Excluding Low-cost & Must-run): Emissions: 43647716.15 t CO2 Thermal Generation: 37356 MU Thus OM: 1168.41 t CO2/MU Emissions: 115636739.97 t CO2 Thermal Generation: 113097.24 MU Thus OM: 1022.45 t CO2/MU
B: The average Build Margin (last 5 electricity units added to the grid and last 20% capacity units addition to the grid ): Emissions: 8173685 t CO2 Thermal Generation: 12389 MU Thus BM: 659.75 kg CO2/MU Emissions: 31021211.13 t CO2 Generation: 32450.7 MU Thus BM: 659.75 kg CO2/MU
Thus the average of A and B will be used for calculation of baseline
Average OM: 1022.45 tCO2/MU Average BM: 955.95 tCO2/MU Baseline Emission Factor: Average OM & BM 989.20 tCO2/MU Expected annual emission reduction = 33159.42 tCO2 during regular production Note: The details of above calculations are provided in Annex 3.
2. Poultry Waste Management (CH4 emissions reduction) Category III D Methane avoidance
CDM-SSC-PDD (version 02) CDM – Executive Board page 15 The baseline methane emissions are calculated as the methane emissions occurring if the poultry waste is allowed to accumulate , using IPCC guidelines.,. The emission factor for methane is = 0.05 tCO2 / t of Poultry waste Expected annual emission reduction = 7395.19 tCO2 Note : The details of the above calculations will be made available in Annex 3 SECTION C. Duration of the project activity / Crediting period: C.1. Duration of the small-scale project activity: >> Duration : 21 Years (First 7 years followed by 2 revisions for 7 years) C.1.1. Starting date of the small-scale project activity: >> The project is under commissioning. The generation of electricity is expected to start full load generation from January 2006. C.1.2. Expected operational lifetime of the small-scale project activity: >> The project is suitable for operation for 25 years. C.2. Choice of crediting period and related information: >> C.2.1. Renewable crediting period: >> C.2.1.1. Starting date of the first crediting period: >> January 2006 C.2.1.2. Length of the first crediting period: >> 7 years C.2.2. Fixed crediting period: >> C.2.2.1. Starting date: >> C.2.2.2. Length: >>

CDM-SSC-PDD (version 02) CDM – Executive Board page 16 SECTION D. Application of a monitoring methodology and plan: >> D.1. Name and reference of approved monitoring methodology applied to the small-scale project activity: >> The monitoring rules as defined in para 31 (Monitoring of component I.D.) and 95 (Monitoring of component III.D) of Appendix B of the simplified modalities and procedures for small-scale CDM project activities will be used. The project activity involves the following
• Avoiding Emission of methane from poultry waste • Power generation using renewable energy
Baseline :
A. Estimation of grid emissions for electricity baseline B. Estimation of methane emissions from poultry waste
CDM A. Monitoring of electricity produced from the power generating unit B. Amount of Poultry waste input in the plant. C. Monitoring the characteristics of Poultry waste
Leakage A)Logging of Lorry trips D.2. Justification of the choice of the methodology and why it is applicable to the small-scale project activity: >> The project has one component of the category I.D. and one component of the category III.D (see explanation under B.1.1). There are two sources of GHG emissions in the object project activity.
A. CO2 emissions from the grid from generation of power, the project activity replaces around 26 million KWh annually from the generation based on Bio gas which is a renewable source.
B. Generation of methane from accumulated poultry waste The project activity demands monitoring following two basic parameters :
A. Generation of electricity . – For CO2 emission reduction. B. Usage of Poultry waste – For Methane Emission Reduction
Thus monitoring plan according to Small scale approved methodology as per Appendix B (Methodology ID) and Approved Methodology III.D will be applicable in the project

CDM-SSC-PDD (version 02) CDM – Executive Board page 17 D.3 Data to be monitored: >> D 3.1 Data to be collected in order to monitor emissions from the project activity, and how this data will be archived :
ID Number (please use numbers to ease cross-referencing to D.3)
Data variable
Source of data
Data unit Measured (m) Calculated © Or estimated (e)
Recording frequency
Proportion of data to be monitored
How will the data be archived? (electronic/paper)
For How long is archived data to be kept
Comment
1.1 Truckloads to the feeders
Logbook KMs M Daily 100% electronic Till 2 years after crediting period
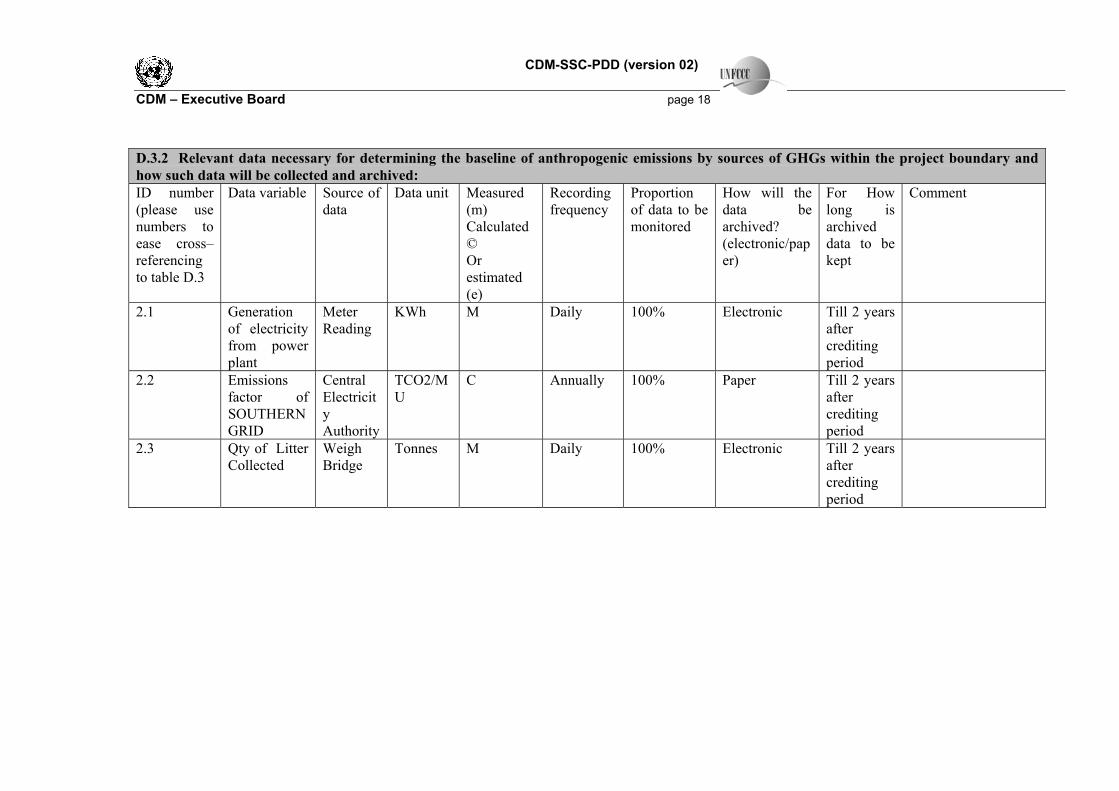
CDM-SSC-PDD (version 02) CDM – Executive Board page 18 D.3.2 Relevant data necessary for determining the baseline of anthropogenic emissions by sources of GHGs within the project boundary and how such data will be collected and archived: ID number (please use numbers to ease cross–referencing to table D.3
Data variable Source of data
Data unit Measured (m) Calculated © Or estimated (e)
Recording frequency
Proportion of data to be monitored
How will the data be archived? (electronic/paper)
For How long is archived data to be kept
Comment
2.1 Generation of electricity from power plant
Meter Reading
KWh M Daily 100% Electronic Till 2 years after crediting period
2.2 Emissions factor of SOUTHERN GRID
Central Electricity Authority
TCO2/MU
C Annually 100% Paper Till 2 years after crediting period
2.3 Qty of Litter Collected
Weigh Bridge
Tonnes M Daily 100% Electronic Till 2 years after crediting period

CDM-SSC-PDD (version 02) CDM – Executive Board page 19 D.4. Qualitative explanation of how quality control (QC) and quality assurance (QA) procedures are undertaken: >> D.4 Quality control (QC) and quality assurance (QA) procedures are being undertaken for data monitored : Data (Indicate table and ID number e.g. 3.-1; 3.2)
Uncertainty level of data (High/Medium/Low)
Explain QA/QC procedures planned for these data or why such procedures are not necessary.
1.1 Low Procedure For Logging the truck entry in the project Site 2.1 Low Calibration of Energy Meters Periodically 2.2 Low Data Provide BY TNEB 2.3 Low Calibration of Weighing Bridge Periodically D.5. Please describe briefly the operational and management structure that the project participant(s) will implement in order to monitor emission reductions and any leakage effects generated by the project activity: >>
Management Structure: - Operation and Maintenance - Maintenance of Meters and Calibration - Calculation of Emission Figures - Local Environmental Care - Changes in project boundary - Documents and Records - Periodic Review meetings -
The project activity will be operated and managed by project sponsors who are also the project proponent. They will ensure the safe operation and a project manager will be allocated with the responsibility for safe operation of the plant and employees . The CDM biomass power project will abide by all regulatory and statutory requirements as prescribed under the state and central laws and regulations. To ensure such performance, the project sponsor will monitor all its activities and performance related to emission, discharge and solid waste generation, if any. SBEL will install meters that meet the Indian and regional electricity authority’s standards (with set calibration schedules)and wherever possible online monitoring systems to be able to measure and calculate actual creditable emission reduction in most transparent and relevant manner installed meters will be calibrated according to the maintenance schedule programmed at the start of the operation and refresh according to the plants performance requirement. All the monitoring data will be recorded and kept under safe custody of the power plant site manager. Also any change within the project boundary, such as change in spare and or equipment will be recorded and any change in the emission reduction due to such alteration will also be studied and recorded. Any addition in electricity generated will be informed to the relevant authority , though these additions will not be considered as any part of the power project and thus no benefits will be claimed under the same project. Such project can be qualified as another CDM project. . Systems based on ISO 9001:2000 will be implemented

CDM-SSC-PDD (version 02) CDM – Executive Board page 20 D.6. Name of person/entity determining the monitoring methodology: >> M.Raja Chidambaram Director Urs Productively Chennai PH: (M) 00-91-9444003258 E-mail : [email protected] SECTION E.: Estimation of GHG emissions by sources: E.1. Formulae used: >> E.1.1 Selected formulae as provided in appendix B: >> Component I.D. Appendix B to the simplified Modalities and Procedures for Small - Scale CDM project activities . (FCCC/CP/20002/7/ADD.3) gives two options for calculating the baseline for a Type I D project:
(a) The average of the “approximate operating margin “ and the “build margin” OR
(b) The weighted average emissions For this project activity option (a) is considered. The grid system for the proposed activity would be TNEB Grid. , which is a part of Southern Grid The emission reductions (ERy) by the project activity during a given year y is ERy = EGy * EFy………………..(1) Where EGy is the electricity supplied to the grid, EFy is the CO2 emission factor of the grid as calculated below: The emission factor EFy of the grid is represented as a combination of the Operating Margin and the Build Margin. Considering the emission factors for these two margins as EFOM,y and EFBM,y then the EFy is given by

CDM-SSC-PDD (version 02) CDM – Executive Board page 21 EFy = WOM * EFOM,y + WBM * EFBM,y ………………..(2) The default values of equal weight for WOM and WBM has been considered, that is WOM = 0.5 WBM = 0.5 The Operating Margin emission factor EFOM,y is defined as the generation—weighted average emissions per electricity unit generated (tCO2/GWh) for all sources serving the TNEB grid, excluding zero- or low-operating cost power (hydro, wind and nuclear) , based on the average of the five years most recent data and using the following equation EFOM,y = [∑ Fi,j,y * COEFij] /∑GENi,j]……………………….(3) Where, EFOM,y =Total GHG emissions and electricity generation supplied to the grid by the power plants connected to the grid excluding zero- or low-operating cost sources. Fi,j,y = Fuel Consumption of it h Fuel and j th Plant in the year(s) y COEFi,j,y = carbon coefficient of the fossil fuel, (i) , (tCO2) / mass or volume unit of the fuel ) , taking into
account of the carbon contents of the fuels used by relevant power plant j , and the present oxidation
of the fuel in year(s) , y , and GENj,y electricity ( MWh ) delivered to the grid by power plant j. GENj.y =I the electricity generation at the plant/connected to the grid excluding zero- or low-cost operating sources. The CO2 emission coefficient COEF is obtained as : COEFi = NCVi * EFCO2,i * OXIDi ……………………………(4) Where : NCV is the net calorific value (energy content) per mass or volume unit of a fuel i, OXIDi is the oxidation factor of the fuel (see page 1.29 in the 1996 revised IPCC guidelines for default values). EFCO2,i in the CO2 emission factor per unit of energy of the fuel i : The Build Margin emission factor EMBM,y (tCO2/GWh) is given as the generation-weighted average emission factor of the selected representative set of recent power plants represented by the 5 most recent plants or the most 20% of the generating units built (summation is over such plants specified by K) : EFBM,y = [∑ Fi,m,y * COEFim] /∑GENm,y] The carbon emission reduction based on Baseline 1 is as follows:

CDM-SSC-PDD (version 02) CDM – Executive Board page 22 26060.229 t CO2 eq Per annum. . Component III D Calculation of Baseline 2 The methane emission factor is calculated using IPCC as guidelines. EF = VS * 365 * B0 * .67 Kg/m3 * MCF Where EF = Emission factor for methane per year Vs = Volatile Solids – Kg /day B0 = Maximum Methane Potential – M3/Kg Vs MCF = Methane Conversion factor The carbon emission reduction based on Baseline 2 is as follows: 7395.19 t CO2 eq Per annum E.1.2 Description of formulae when not provided in appendix B: >> E.1.2.1 Describe the formulae used to estimate anthropogenic emissions by sources of GHGs due to the project activity within the project boundary: >> This is not applicable as the renewable energy technology namely CO2 neutral Bio Gas is used for generation. E.1.2.2 Describe the formulae used to estimate leakage due to the project activity, where required, for the applicable project category in appendix B of the simplified modalities and procedures for small-scale CDM project activities >> Leakage is considered with respect to Transportation of Poultry Waste Distance of Power Plant from Poultry Sources : 30 km Average truck load : 15 tons Daily consumption poultry waste : 400 tons No. of trucks hauls required : 26.67 Annual distance covered (26.67 trucks /day)*(30*2km)*(335 days) =5,36,000 Km Diesel consumption : 0.2 liter/km
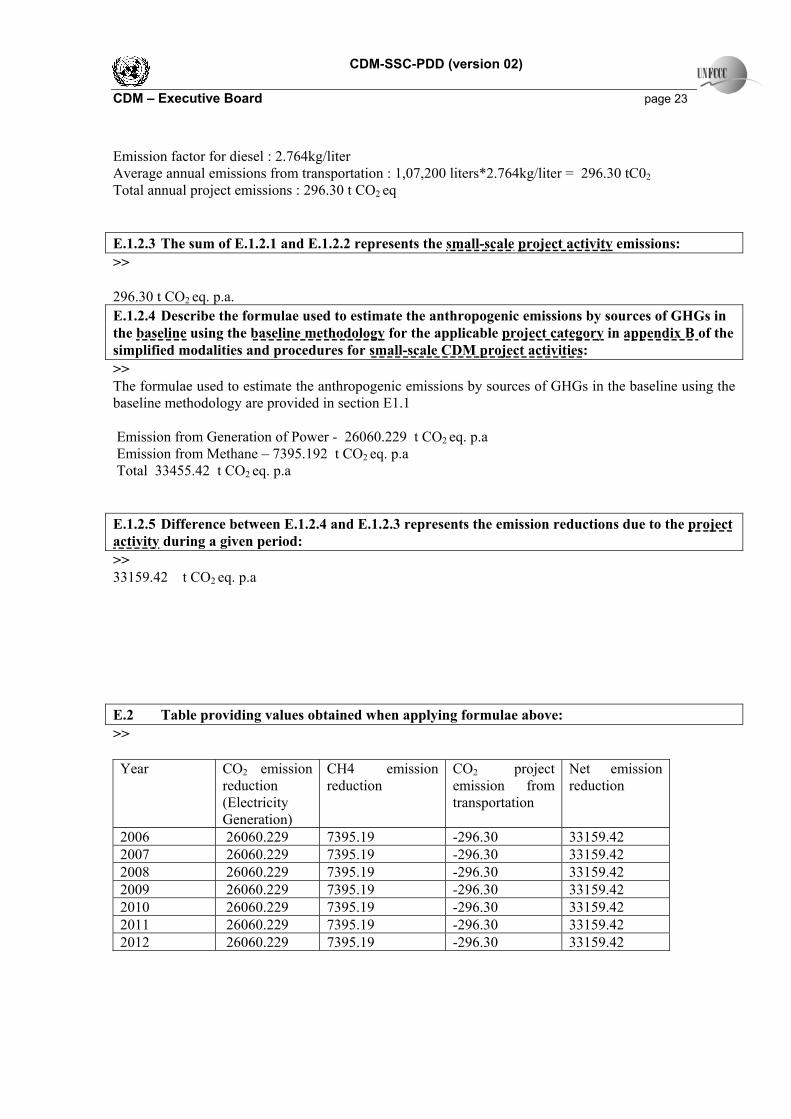
CDM-SSC-PDD (version 02) CDM – Executive Board page 23 Emission factor for diesel : 2.764kg/liter Average annual emissions from transportation : 1,07,200 liters*2.764kg/liter = 296.30 tC02 Total annual project emissions : 296.30 t CO2 eq E.1.2.3 The sum of E.1.2.1 and E.1.2.2 represents the small-scale project activity emissions: >> 296.30 t CO2 eq. p.a. E.1.2.4 Describe the formulae used to estimate the anthropogenic emissions by sources of GHGs in the baseline using the baseline methodology for the applicable project category in appendix B of the simplified modalities and procedures for small-scale CDM project activities: >> The formulae used to estimate the anthropogenic emissions by sources of GHGs in the baseline using the baseline methodology are provided in section E1.1 Emission from Generation of Power - 26060.229 t CO2 eq. p.a Emission from Methane – 7395.192 t CO2 eq. p.a Total 33455.42 t CO2 eq. p.a E.1.2.5 Difference between E.1.2.4 and E.1.2.3 represents the emission reductions due to the project activity during a given period: >> 33159.42 t CO2 eq. p.a E.2 Table providing values obtained when applying formulae above: >> Year CO2 emission
reduction (Electricity Generation)
CH4 emission reduction
CO2 project emission from transportation
Net emission reduction
2006 26060.229 7395.19 -296.30 33159.42 2007 26060.229 7395.19 -296.30 33159.42 2008 26060.229 7395.19 -296.30 33159.42 2009 26060.229 7395.19 -296.30 33159.42 2010 26060.229 7395.19 -296.30 33159.42 2011 26060.229 7395.19 -296.30 33159.42 2012 26060.229 7395.19 -296.30 33159.42
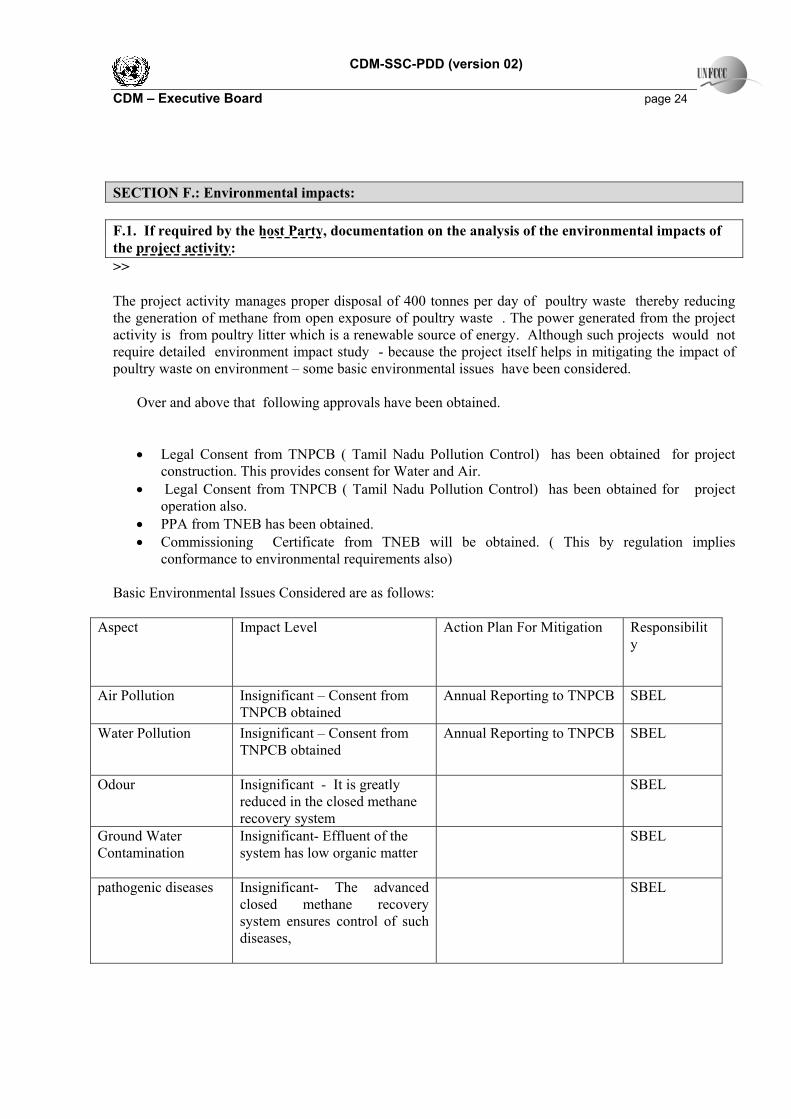
CDM-SSC-PDD (version 02) CDM – Executive Board page 24 SECTION F.: Environmental impacts: F.1. If required by the host Party, documentation on the analysis of the environmental impacts of the project activity: >> The project activity manages proper disposal of 400 tonnes per day of poultry waste thereby reducing the generation of methane from open exposure of poultry waste . The power generated from the project activity is from poultry litter which is a renewable source of energy. Although such projects would not require detailed environment impact study - because the project itself helps in mitigating the impact of poultry waste on environment – some basic environmental issues have been considered.
Over and above that following approvals have been obtained. • Legal Consent from TNPCB ( Tamil Nadu Pollution Control) has been obtained for project
construction. This provides consent for Water and Air. • Legal Consent from TNPCB ( Tamil Nadu Pollution Control) has been obtained for project
operation also. • PPA from TNEB has been obtained. • Commissioning Certificate from TNEB will be obtained. ( This by regulation implies
conformance to environmental requirements also)
Basic Environmental Issues Considered are as follows:
Aspect
Impact Level
Action Plan For Mitigation
Responsibility
Air Pollution Insignificant – Consent from TNPCB obtained
Annual Reporting to TNPCB
SBEL
Water Pollution
Insignificant – Consent from TNPCB obtained
Annual Reporting to TNPCB
SBEL
Odour
Insignificant - It is greatly reduced in the closed methane recovery system
SBEL
Ground Water Contamination
Insignificant- Effluent of the system has low organic matter
SBEL
pathogenic diseases
Insignificant- The advanced closed methane recovery system ensures control of such diseases,
SBEL
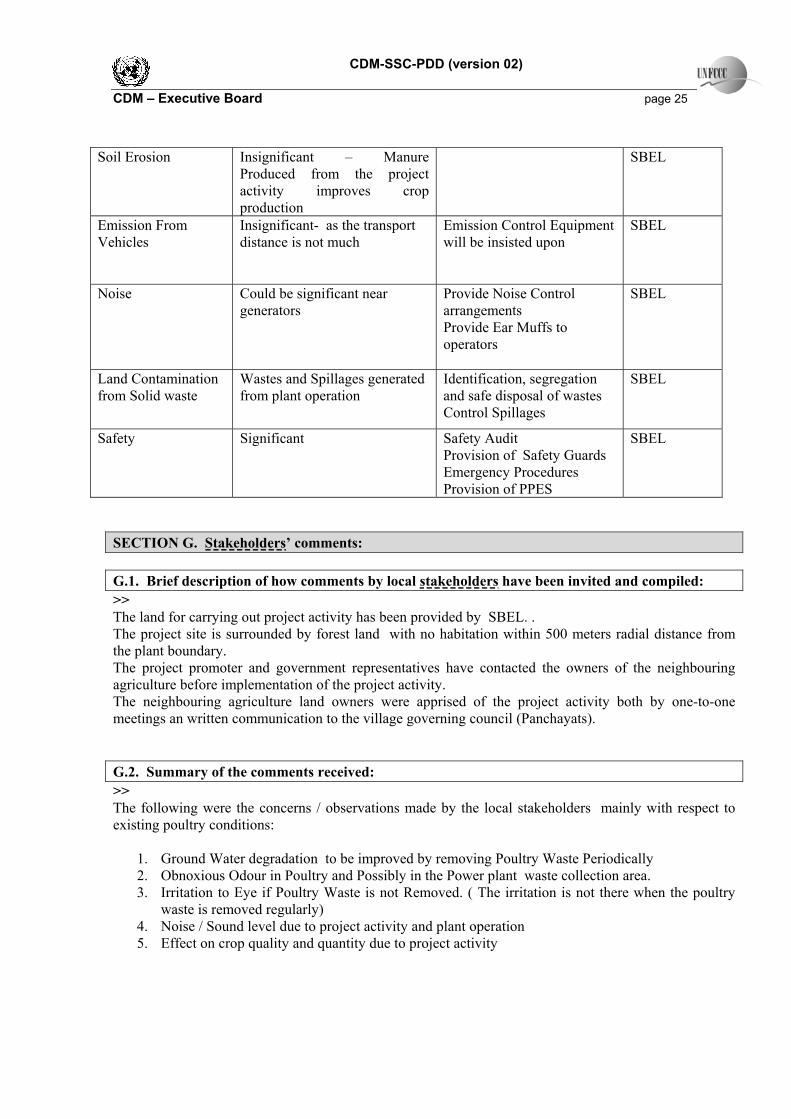
CDM-SSC-PDD (version 02) CDM – Executive Board page 25
Soil Erosion
Insignificant – Manure Produced from the project activity improves crop production
SBEL
Emission From Vehicles
Insignificant- as the transport distance is not much
Emission Control Equipment will be insisted upon
SBEL
Noise
Could be significant near generators
Provide Noise Control arrangements Provide Ear Muffs to operators
SBEL
Land Contamination from Solid waste
Wastes and Spillages generated from plant operation
Identification, segregation and safe disposal of wastes Control Spillages
SBEL
Safety Significant Safety Audit Provision of Safety Guards Emergency Procedures Provision of PPES
SBEL
SECTION G. Stakeholders’ comments: G.1. Brief description of how comments by local stakeholders have been invited and compiled: >> The land for carrying out project activity has been provided by SBEL. . The project site is surrounded by forest land with no habitation within 500 meters radial distance from the plant boundary. The project promoter and government representatives have contacted the owners of the neighbouring agriculture before implementation of the project activity. The neighbouring agriculture land owners were apprised of the project activity both by one-to-one meetings an written communication to the village governing council (Panchayats). G.2. Summary of the comments received: >> The following were the concerns / observations made by the local stakeholders mainly with respect to existing poultry conditions:
1. Ground Water degradation to be improved by removing Poultry Waste Periodically 2. Obnoxious Odour in Poultry and Possibly in the Power plant waste collection area. 3. Irritation to Eye if Poultry Waste is not Removed. ( The irritation is not there when the poultry
waste is removed regularly) 4. Noise / Sound level due to project activity and plant operation 5. Effect on crop quality and quantity due to project activity
CDM-SSC-PDD (version 02) CDM – Executive Board page 26 G.3. Report on how due account was taken of any comments received: >> The project promoter and government representatives assured them for following :
1. After the regular removal of waste is in practice , periodic testing of ground water quality will be done , and appropriate corrective actions will be taken.
2. Periodic removal of poultry waste will mitigate the effects of odour. In the power plant the waste collection area will be separated , provided enclosures wherever possible. Appropriate PPEs will be provided to the workers. Comments from the stake holders will be invited periodically on this matter and will be treated as external communications resolved
3. The poultry waste will be removed on a daily basis from the poultry farms. Periodic monitoring will be done on the health aspect of the employees through company appointed doctors.
4. The generators for production of power are based on latest state-of-art technology which will ensure that level of noise in the project vicinity will be under control. It will be ensured that no noise of power plant will be heard outside the project site and the same will be periodically monitored after commissioning.
5. Technically there will be no effect on the quality and quantity of the crop produced because of project activity, thus an assurance for the same is given.

CDM-SSC-PDD (version 02) CDM – Executive Board page 27 Annex 1 CONTACT INFORMATION ON PARTICIPANTS IN THE PROJECT ACTIVITY
Organization Subhashri Bioenergies Pvt Ltd
Street/ P.O Box Senguttaikadu , Munjanoor Post Building Gurusamy Playam , Thiruchengodu Talk City Namakkal
State/ Region Tamilnadu
Postfix / Zip 637 403
Telephone 00-91-4288- 233251
Fax 00-91-4288- 257367
E-Mail [email protected]
Represented by S Durai Raju
Title Executive Director
Salutation Mr
Last name
Middle Name
First Name S Durai Raju
Department Executive Director
Mobile 9443233398
Direct Fax 04288- 257367
Direct Tel 04288- 257267
Personal E Mail [email protected]

CDM-SSC-PDD (version 02) CDM – Executive Board page 28
Organization Urs Productively
Street/ P.O Box 51/3, Prasanth Castle
Building 10 th Avenue, Ashoknagar
City Chennai
State/ Region Tamilnadu
Postfix / Zip 600083
Telephone 044-23713258
Fax
E-Mail [email protected]
Represented by M.Raja Chidambaram
Title Director
Salutation Mr
Last name Chidambaram
Middle Name Raja
First Name MuthuKrishnan
Department
Mobile 9444003258
Direct Fax Direct Tel 044-23713258
Personal E Mail [email protected]

CDM-SSC-PDD (version 02) CDM – Executive Board page 29 Annex 2 INFORMATION REGARDING PUBLIC FUNDING
No public funding has been obtained for this project

CDM-SSC-PDD (version 02) CDM – Executive Board page 30
Annex 3 BASELINE INFORMATION OPERATING MARGIN
Annex 3 : Baseline Estimation Details SOUTHERN REGION – Operating Margin
Power Plant Agency Installed capacity (MW)
Fuel type
Net Heat rate4
(kCal/kWh)
2003 2004 2005 Average E-Factor Emission
Andhra Pradesh
K'DEM A-D5 APGENCO
1170.00 Coal 3E 3357.08 8729.00 8177.00 9504.30 8803.43 1335.80 11759639.15
VIJAYAWADA5 APGENCO
1260.00 Coal 3E 2639.01 10288.00
10104.00
9848.80 10080.27 1050.08 10585058.98
R'GUNDEM B5 APGENCO
62.50 Coal 3E 3239.81 390.00 471.00 496.00 452.33 1289.14 583120.5671
NELLORE5 APGENCO
30.00 Coal 3E 3761.70 147.00 146.00 153.90 148.97 1496.80 222973.6186
RAYALSSEEMA5 APGENCO
420.00 Coal 3E 2561.45 3488.00 3331.00 3353.60 3390.87 1019.22 3456024.566
R'GUNDEM NTPC 2100.00 Coal 3E 2662.92 16839.00
16332.00
17169.83
16780.28 1059.59 17780233.56
SIMHADRI NTPC 1000.00 Coal 2663.00 4974.00 7722.00 8122.10 6939.37 1059.62 7353112.78VIJ'SWARAM CCGT 272.00 Gas
HBJ 2062.00 2031.00 2147.00 1993.40 2057.13 449.74 925185.200
6 JEGURUPADU
CCGT PVT 235.00 Gas
HBJ 2062.00 1583.00 1505.00 1419.62 1502.54 449.74 675759.684
1 GODAVARI CCGT PVT 208.00 Gas
HBJ 2062.00 1460.00 1100.00 1372.96 1310.99 449.74 589609.551
6 KONDAPAALI
CCGT PVT 350.00 Gas
HBJ 2062.00 2477.00 2238.00 2246.34 2320.45 449.74 1043609.02
6 PEDDAPURAM
CCGT PVT 220.00 Gas
HBJ 2062.00 850.00 1249.00 1141.34 1080.11 449.74 485775.450
2 LVS POWER DG PVT 36.00 Gas
HBJ 2062.00 2.00 0.00 0.00 0.67 449.74 299.829925
3 Karnataka 0
RAICHUR 1260.00 Coal 3e 2730.74 8820.00 11400.00
10717.93
10312.64 1086.58 11205482.84
RAICHUR (UNIT 7) 210.00 Coal 3e 2730.74 1470.00 490.00 1086.58 532422.8147
YELHANKA DG 120.00 Diesel 2062.00 715.00 384.00 271.14 456.71 653.86 298628.4651
TORANGALLU IMPORT
120.00 Corex gas
2062.00 872.00 766.00 516.33 718.11 449.74 322966.3015
BELLARY DG 25.20 Diesel 2062.00 64.00 42.00 40.32 48.77 653.86 31891.13303
TANIR BHAVI CCGT
220.00 Naptha 2062.00 1280.00 1631.00 629.55 1180.18 449.74 530781.4211
BELGAUM DG 81.30 Diesel 2062.00 355.00 235.00 238.46 276.15 653.86 180566.758
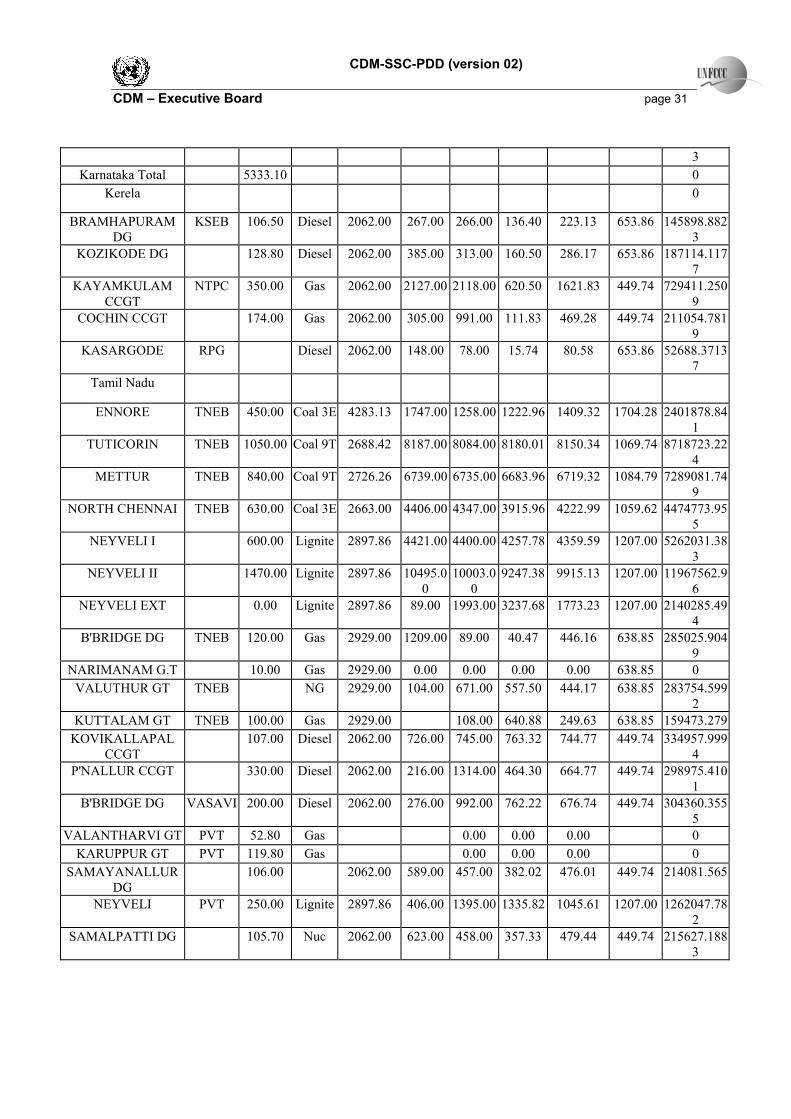
CDM-SSC-PDD (version 02) CDM – Executive Board page 31
3 Karnataka Total 5333.10 0
Kerela 0
BRAMHAPURAM DG
KSEB 106.50 Diesel 2062.00 267.00 266.00 136.40 223.13 653.86 145898.8823
KOZIKODE DG 128.80 Diesel 2062.00 385.00 313.00 160.50 286.17 653.86 187114.1177
KAYAMKULAM CCGT
NTPC 350.00 Gas 2062.00 2127.00 2118.00 620.50 1621.83 449.74 729411.2509
COCHIN CCGT 174.00 Gas 2062.00 305.00 991.00 111.83 469.28 449.74 211054.7819
KASARGODE RPG Diesel 2062.00 148.00 78.00 15.74 80.58 653.86 52688.37137
Tamil Nadu
ENNORE TNEB 450.00 Coal 3E 4283.13 1747.00 1258.00 1222.96 1409.32 1704.28 2401878.841
TUTICORIN TNEB 1050.00 Coal 9T 2688.42 8187.00 8084.00 8180.01 8150.34 1069.74 8718723.224
METTUR TNEB 840.00 Coal 9T 2726.26 6739.00 6735.00 6683.96 6719.32 1084.79 7289081.749
NORTH CHENNAI TNEB 630.00 Coal 3E 2663.00 4406.00 4347.00 3915.96 4222.99 1059.62 4474773.955
NEYVELI I 600.00 Lignite 2897.86 4421.00 4400.00 4257.78 4359.59 1207.00 5262031.383
NEYVELI II 1470.00 Lignite 2897.86 10495.00
10003.00
9247.38 9915.13 1207.00 11967562.96
NEYVELI EXT 0.00 Lignite 2897.86 89.00 1993.00 3237.68 1773.23 1207.00 2140285.494
B'BRIDGE DG TNEB 120.00 Gas 2929.00 1209.00 89.00 40.47 446.16 638.85 285025.9049
NARIMANAM G.T 10.00 Gas 2929.00 0.00 0.00 0.00 0.00 638.85 0 VALUTHUR GT TNEB NG 2929.00 104.00 671.00 557.50 444.17 638.85 283754.599
2 KUTTALAM GT TNEB 100.00 Gas 2929.00 108.00 640.88 249.63 638.85 159473.279
KOVIKALLAPAL CCGT
107.00 Diesel 2062.00 726.00 745.00 763.32 744.77 449.74 334957.9994
P'NALLUR CCGT 330.00 Diesel 2062.00 216.00 1314.00 464.30 664.77 449.74 298975.4101
B'BRIDGE DG VASAVI 200.00 Diesel 2062.00 276.00 992.00 762.22 676.74 449.74 304360.3555
VALANTHARVI GT PVT 52.80 Gas 0.00 0.00 0.00 0 KARUPPUR GT PVT 119.80 Gas 0.00 0.00 0.00 0
SAMAYANALLUR DG
106.00 2062.00 589.00 457.00 382.02 476.01 449.74 214081.565
NEYVELI PVT 250.00 Lignite 2897.86 406.00 1395.00 1335.82 1045.61 1207.00 1262047.782
SAMALPATTI DG 105.70 Nuc 2062.00 623.00 458.00 357.33 479.44 449.74 215627.1883

CDM-SSC-PDD (version 02) CDM – Executive Board page 32
Pondichary 0
KARIAKAL CCGT 32.50 2062.00 265.00 277.00 255.00 265.67 449.74 119482.2253
LAKSHADWEEP 0
MINICOY DG LAKSH 1.80 2062.00 0.00 4.51 4.51 653.86 2948.927214
KAVARATTI DG LAKSH 1.80 2062.00 0.00 5.29 5.29 653.86 3458.941233
AMINI DG LAKSH 1.00 2062.00 0.00 2.00 2.00 653.86 1307.728254
KALPENI DG LAKSH 1.10 2062.00 0.00 1.74 1.74 653.86 1137.723581
AGATTY DG LAKSH 1.10 2062.00 0.00 2.33 2.33 653.86 1523.503416
ANDROT DG LAKSH 1.30 2062.00 0.00 3.55 3.55 653.86 2321.217652
KADMAT DG LAKSH 0.80 2062.00 0.00 2.01 2.01 653.86 1314.266896
KILTAN DG LAKSH 0.50 2062.00 0.00 1.04 1.04 653.86 680.0186923
CHETLAT DG LAKSH 0.40 2062.00 0.00 0.65 0.65 653.86 425.0116827
BITRA DG LAKSH 0.10 2062.00 0.00 0.12 0.12 653.86 78.46369527
BANGARAM DG LAKSH 0.10 2062.00 0.00 0.17 0.17 653.86 111.1569016
Southern Region
Thermal 16000.50 110564.00
116072.00
112608.89
113097.24 115636739.97
Nuclear 780.00 1022.454159
Hydro 10102.00 Total 26882.50
1-Generation Report, 2003-04, Central Electricity Authority, Government of India. 2-General Review 2005, Central Electricity Authority, Ministry power, Government of
India
Annex 3 : Baseline Estimation Details

CDM-SSC-PDD (version 02) CDM – Executive Board page 33
SOUTHERN REGION – Build Margin
Power Plant Installation Agency
Installed capacity
(MW) Fuel type
Net Heat rate4
(kCal/kWh) 2005 Average E-Factor Emission
Andhra Pradesh K'DEM A-D5 1998 APGENCO 1170.00 Coal 3E 3357.08 9504.30 9504.30 1335.80 12695857.87SIMHADRI 2002 NTPC 1000.00 Coal 2663.00 8122.10 8122.10 1059.62 8606364.266PEDDAPURAM CCGT 2002 PVT 220.00 Gas HBJ 2062.00 1141.34 1141.34 449.74 513311.8305LVS POWER DG 2001 PVT 36.00 Gas HBJ 2062.00 0.00 0.00 449.74 0Srisailam LBPH 2003 450.00 Hydro 706.00 706.00
Karnataka 0.00 0RAICHUR (UNIT 7) 2002 210.00 Coal 3e 2730.74 1800.00 1800.00 1086.58 1955838.911TANIR BHAVI CCGT 2001 220.00 Naptha 2062.00 629.55 629.55 449.74 283136.8943KAIGA APS 2000 440.00 Nuc 2926.25 2926.25 Alamti Dam 125.00 Hydro 138.68 138.68 Karnataka Total 5333.10 0.00 0
Kerela 0.00 0KOZIKODE DG 1999 128.80 Diesel 2062.00 160.50 160.50 653.86 104945.1924KAYAMKULAM CCGT 1999 NTPC 350.00 Gas 2062.00 620.50 620.50 449.74 279066.703COCHIN CCGT 1999 174.00 Gas 2062.00 111.83 111.83 449.74 50294.97083
Tamil Nadu 0.00 NEYVELI EXT 2003 0.00 Lignite 2897.86 3237.68 3237.68 1207.00 3907881.416VALUTHUR GT 2003 TNEB NG 2929.00 557.50 557.50 638.85 356157.2736P'NALLUR CCGT 2001 330.00 Diesel 2062.00 464.30 464.30 449.74 208816.5515SAMAYANALLUR DG 2001 106.00 2062.00 382.02 382.02 449.74 171811.5421NEYVELI 2002 PVT 250.00 Lignite 2897.86 1335.82 1335.82 1207.00 1612335.423SAMALPATTI DG 2001 105.70 Nuc 2062.00 357.33 357.33 449.74 160707.3408
Pondichary 0.00 0KARIAKAL CCGT 1999 32.50 2062.00 255.00 255.00 449.74 114684.9464
Southern Region Thermal 16000.50 32450.70 32450.70 31021211.13Nuclear 780.00 OM 955.9489051Hydro 10102.00 Total 26882.50 1-Generation Report, 2003-04, Central Electricity Authority, Government of India. 2-General Review 2005, Central Electricity Authority, Ministry power, Government of India OM 1022.454159 BM 955.9489051 CM 989.2015319Total Generation 142295.4
20% 28459.08

CDM-SSC-PDD (version 02) CDM – Executive Board page 34 Calculation of Emission Factor
Operating Margin 1022.454159
Build Margin 955.9489051
Weighted average 989.2015319
Appendix –1

CDM-SSC-PDD (version 02) CDM – Executive Board page 35
ABBREVIATIONS ACM Approved Consolidated Methodology BAU Business As Usual BEF Baseline Emission Factor BM Build Margin CDM Clean Development Mechanism CEA Central Electricity Authority CER Certified Emission Reduction CII Confederation of Indian Industry CM Combined Margin CO2 Carbon Dioxide COP Conference of Parties DCS Distributed Control System DNA Designated National Authority DOE Designated Operational Entity DPR Detailed Project Report DSCR Debt Service Coverage Ratio EB Executive Board EIA Environmental Impact Assessment EMS Environmental Management System GHG Green House Gases INR Indian Rupees IPCC Inter Governmental Panel on Climatic Change IPP Independent Power Producers IRR Internal Rate of Return ISO International Standards Organization KW Kilowatt MNES Ministry of Non-Conventional Energy Sources NCDMA National CDM Authority ODA Official Development Assistant OM Operating Margin PPA Power Purchase Agreement QA Quality Assurance QC Quality Control TNEB Tamilnadu Electricity Board TNPCB Tamilnadu Pollution Control Board