clearance in the post-natal periodadc.bmj.com/content/archdischild/24/119/180.full.pdf ·...
TRANSCRIPT
UREA CLEARANCE IN THE IMMEDIATE POST-NATALPERIOD
BY
JOHN THOMSON, M.D., D.P.H., D.C.H.(From the Department of Child Life and Health, University of Edinburgh)
In the growing volume of leature concerngrenal function in the newbor infant there is as yetSittle mention of urea clarance in the immeiiatepost-natal period: that is in the first three or fourdays of life. Barett (1940) made observations onmulinc in infants of five to nine days old.The invettigations of McCance and Young (1941)ie made on infants of seven to fourteen days old.They also made observations on three infants agedsix to thirte days: these infants had meningo-coeles. Experimental studies wer made by Barett,Periley, and McGinnis (1942) on a twenty-four hourold infant who had an extoversion of the urinarybladder. The conditions of the experment wereabnormal. The work of Gordon, Harrison, andMcNamara (1942) deal with full-term infants ofeight to sixty-five days and premature infants ofsen to seventy-three days old. Dean and McCance(1947) have carried out some most intingexprmnental studies on infants of two, three, andfour days old In t m stance, the infantssuffered from inoperable meningomyelocoeks.They were studied under conditions which do notnormally pertain at this age period.The observations now recorded were made on
healthy spontaneously delivered full-term male andfenale infants. In each case the mother had anormal pregnancy and puerperium. No clinicalanmality was detected in these infants duringter stay in hospitaL The infants are divided intothree groups each of which, with the method usedand the data obtained, are described seriatim. Thegroups are referred to as groups I, II, and m.
Me&odGrmp L This group comprised nine male
infants. The details of age and weight at the timeof the co t of the observation period aregiven in table 1. The surface area, calculatedaccording to the recommendations of Howland andDana (1913), and the factor required for correctionto an adult standard of 1-73 sq. n are given in thesa table. The duration of the observation periodis given in each case. Five of the infants wereobserved for two periods, making a total of fourteen
observation periods, during which forty-onespecimens ofurine were coLlected.These specmen of urine were obtained by using
an apparatus previously described (Thomson,1944). The apparatus gives accurate tming andavoids the need for continual observation. Inorder to present a non-wettable surface to the urine,a coating of hard raffin is used as far as possible.Even so, a small quantity of urine is lost in wettingsurfaces. Experimental observation has shown thisquantity to be approximately 0 3 mL This amounthas, therefore, been added to the sured vohlmeof each spimen of urin and the resultng volumeis considered to be the true volume of urine passed.It is the figure used for all clulations.The apparatus was fixed in position about 9 am.,
and, after the first passage of urine had been timedand recorded, specimens of urine were collected.They were preserved under toluol and were analysedin the biochemistry laboratory of the RoyalInfirmary, Edinburgh, as soon afterwards as possible.The method ofVan Slyke was used for the estimationof urea.The specimens of blood were obtained by heel
stab and were taken during the observation period.The time at which they were taken is given intable 1. In one instance, owing to the long durationof the observation period, two spem ere taken.These specimes were analysed in the biochemistrylaboratory of the Royal Hospital for Sick Children,Edinburgh. Nessler's regnt was used to deter-mine the ammon liberated by urease and theresults read by electro-photometer.RsuLT&. The mean volume of the individual
specimens of urine was 12 25 mL and the standarddeviation 8-12 mL The mean minute volume was0-0682 mL and the standard deviation 0-0650 ml.The standard deviations are expressive of the greatrange of the total and the minute volumes. Thesefigures are in conformity with those publishedshowing the average daily volume of the urine, andthe average volume of urine passed at each voiding,in the first five days of life (Thomson, 1944).The mean blood urea nitrogen was 19 mg. per
100 ml., with a standard deviation of 7100 mg.This compares favourably with the published workof Lucas et aL (1921), Schultz and Pettibone (1915),and Sedgwick and Ziegler (1920).The urea clarances which have been calclatdd
180
by copyright. on 13 M
ay 2018 by guest. Protected
http://adc.bmj.com
/A
rch Dis C
hild: first published as 10.1136/adc.24.119.180 on 1 Septem
ber 1949. Dow
nloaded from

UREA CLEARANCE IN THE IMAEDIATE POST-NATAL PERIODTAKE 1
DATA OF GROUP I INFANTh
IAge at Total Tine atwhichCOW t Correction duration of: blood was taken
Ca>se fiment of Weight Surface factor oberva- after commence- Numberof Blooduno. obslrva- (g.) area (1- 73/sur- tion period ment of urine tronign
tifins (sq. n.) face area (houIrs) observations specimens (ng. perinsq. M.) 100 mL)
(hourbs) (hours)la 15-6 3,345 0-2346 7-37 22-25 7-66 4 23lb 41-8 3,289 0-2318 7-46 8-58 6-25 2 232 104-7 3,289 0-2318 7-46 52-11 10-83 4 27
47-00 193 34-2 3,515 0-2428 7-10 16-16 10-25 2 154a 23-0 3,232 0-2296 7-53 8-16 5-08 3 164b 51-0 3,090 0-2222 7-80 6-10 2-00 3 165a 53-4 2,523 0-1949 8-88 4-20 1-83 3 145b 123-5 2,523 0-1949 8-88 8-00 1-50 4 146a 31-1 2,892 0-2127 8-13 3-42 3-50 1 166b 102-3 2,807 0-2084 8-30 6-00 2-58 3 157 45-1 3,969 0-2647 6-54 11-05 9-58 2 168 50-1 3,232 0-2296 7-53 10-83 4-58 3 239a 19-3 3,402 0-2373 7-29 9-83 5-33 3 259b 29-1 3,260 0-2305 7-50 21-33 17-00 4 24
Totals. 188-02 41
Mean 51-75 13-43 7-58 19
are shown in fig. 1 where they are plotted againstthe minute volumes of the urin Clarans
alclated from data obtained during the same
observation period have been joined by staight
0iM
"I
i-
z
J-
UJ
JRIN
Lines. Averages can be struck by raising perpendicu-Lars at selected urine minute volumes to cut thelines. Rdings are taken at the point of inter-ection. The g al trend of the figure shows that
IL[ I in &U1- . t
increase with an increase in the mfhiutevolume of the urin There are threeexceptions. The mean volume of bloodcleared of urea is 1-0009 ml. per minuteequal to 0- 19 mg. urea nitrDgen.Grup i This group comprised
thirtn male infants. In table 2 thesame details are given as in the case ofthe infants in group L. In addition thefactor for correction for an adult stan-dard of 70 kg. body weight is given.Eight of the infants were observed fortwo periods making a total of twenty-one observation periods during whichsixy specimens of urine were obtainedAt the com nt of fifteen of theobservation periods the infant was givenby gavage 3 g. of urea dissolved in 30ml. of water prior to the fastening on ofthe apparatus for collecting urine. Theinfant was not upset by this procedure.When regurgitation did occur, it wasinfrequent and the amount was smalL.The remaining six observation periodswere in the case of infants who hadhel i
q1 nd had hemnF1-u:ddu n. given urea approximately twenty-two
181
FiG. I .-Group, 1: individml urea clearances.
by copyright. on 13 M
ay 2018 by guest. Protected
http://adc.bmj.com
/A
rch Dis C
hild: first published as 10.1136/adc.24.119.180 on 1 Septem
ber 1949. Dow
nloaded from
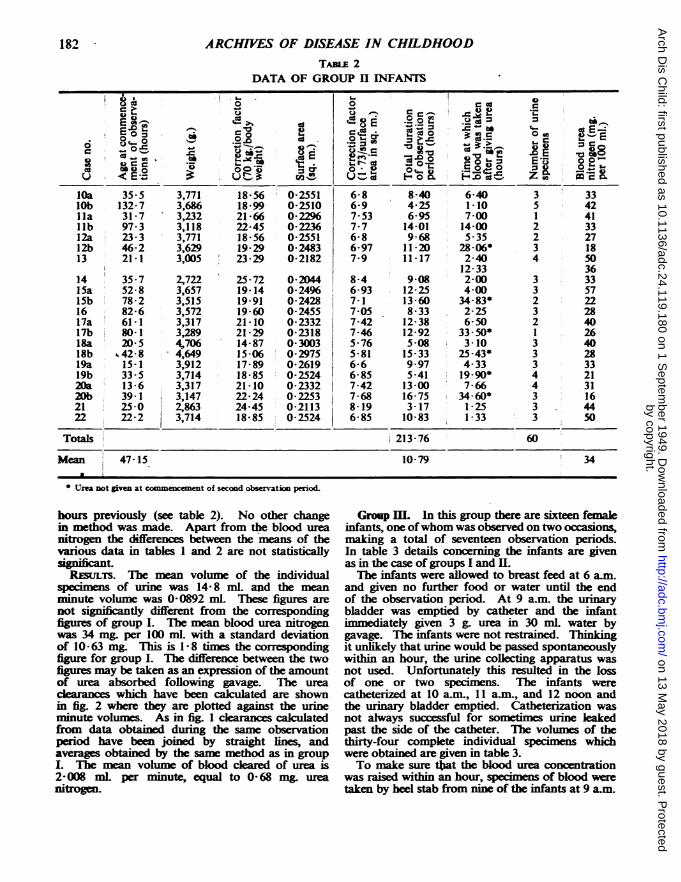
ARCHIVES OF DISEASE IN CHILDHOODTABLE 2
DATA OF GROUP II INFANTS
0 C~~~~~~04,
IOa35 5 3 771 18~-5 0-51 Ca40 6403 3
12a to233 371 1-6 02S 68 96-522
tooi. z
13 21-1 3'005 23-29 0 2182~~7-90111 'U 404514 t 35-7 2,722 25-72~~~~~~. r c Z-048- 9-0 2-0 3
15a 52-8 3,65 191 0-49 13! 12-2 O'400 35
16- ':~: Z U C 82 6 Z 50
17a 3565 3,771 18-56 0-2551 6-8 8-40 6-40 3 33lb 132-7 3,686 18-99 0-2510 6-9 4-25 1-10 5 42Ila 31-7 3,232 21-66 0-22% 7-53 6-95 7-00 1 41lib 97-3 3,118 22-45 0-2236 7-7 14-01 14-00 2 3312a 23-3 3,771 18-56 0-2551 76-8 9-68 5-35 2 2712b 46-2 3,629 19-29 0-2483 6-97 11-20 28 -06* 3 1813 21-1 3,005 23-29 0-2182 7-9 11-17 2-40 4 5022!22 2 3,714 18-85 0 2S24 6 85 10 83 12-33 36
14 32,722 25-72 0i244 8-4 9-08 2-00 3 3315a 52-8 3,657 19-14 0-24% 6-93 12-25 4-00 3 57e bn 78-2 3,515 19-91 0-2428 7-1 13-60 34.83* 2 2216 82-6 3,572 19-60 0-2455 7-05 - 8-33 2-25 3 2817a 61-1 3,317 21-10 0-2332 7-42 12-38 6-5 2 40ITh 80-1 3,28 21-29 0-2318 7-46 12-92 33.-50* 1 2618a 3)-S5 4,706 14-87 0-3003 5-76 5-08 3-10 3 4018b -42-8 4,649 15-06 0-2975 5-81 15-33 25.43* 3 2819a 15-1 3,912 17-89 0-2619 6-6 9-97 4-33 3 3319b 33-5 3,714 18-85 0-2524 6-85 5-41 19.-90* 4 212Ua 13-6 3,317 21-10 0-2332 f7-42 13-00 7-66 4 3120b 39-1 3,147 22-24 0-2253 7-68 167 46* 3121 25-0 2,863 24-45 0-2113 8-19 3-17 1-25 3 4422 22-2 3,714 18-85 0-2524 6-85 10-83 1-33 3 50
Totals 213-76 60
Mean 47-15 10-79 34
Urea Dot given at com el3met of second observation period.
hours previously (see table 2). No other changein method was made. Apart from the blood ureanitrogen the differences between the means of thevarious data in tables 1 and 2 are not statistically
RESULTS. The mean vohlme of the individualspecimens of urine was 14-8 ml. and the meanminute volume was 0-0892 mL These figures arenot significntly different from the correspondingfigures of group I. The mean blood urea nitrogenwas 34 mg. per 100 ml. with a standard deviationof 10-63 mg. This is 1 -8 times the correspondingfigure for group I. The difference between the twofigures may be taken as an expression of the amountof urea absorbed following gavage. The ureaclearances which have been caculated are shownin fig. 2 where they are plotted against the urineminute volumes. As in fig. 1 clearances cakulatedfrom data obtained during the same observationperiod have been joined by staight lines, andaverages obtained by the sa method as in group. The mean vohnne of blood cleared of urea is2-008 mL per minute, equal to 0-68 mg. ureanitroge.
Group II. In this group there are sixteen femaleinfants, one ofwhom was observed on two occasions,making a total of seventeen observation periods.In table 3 details concerning the infants are givenas in the case of groups I and II.The infants were allowed to breast feed at 6 am.
and given no further food or water until the endof the observation period. At 9 am. the urinarybladder was emptied by catheter and the infantimmeiately given 3 g. urea in 30 mL water bygavage. The infants were not restained. Thinkingit unlikely that urine would be passed spontaneouslywithin an hour, the urine colleting apparatus wasnot used. Unfortunately this resulted in the lossof one or two specimens. The infants werecatheterized at 10 am., 11 am., and 12 noon andthe urinary bladder emptied. Catheterization wasnot always successful for sometmes urine leakedpast the side of the catheter. The volumes of thethirty-four complete individual specimens whichwere obtained are given in table 3.To make sure that the blood urea concentration
was raised within an hour, specmens of blood weretaken by heel stab from nine of the infants at 9 am.
18'6.by copyright.
on 13 May 2018 by guest. P
rotectedhttp://adc.bm
j.com/
Arch D
is Child: first published as 10.1136/adc.24.119.180 on 1 S
eptember 1949. D
ownloaded from

UREA CLEARANCE IN THE IMMEDIATE POST-NATAL PERIODbefore giving the ura. At 10 a-m. blood was takenfr all the infants: at 11 am. blood was taken
55
4-51
z
a-3s5
J
zm 3-0-idJ
0 2-0uI.-cc
05j
tur infants. The blood urea concentrationese is given in table 3.
Rmun-S. The average of theindividual urine minutevolumes was 0-0705 mL Thedifference of this figure fromthe corresponding figure of0 0682 mL for group I and000892 mL for group II si notstatistically signiintThe mean blood urea nitro-
gen at 10 am. was 43 mg. per100mLThe urea clearances which
have been cakulated are shownin fig. 3 where they are plottedagainst the urie minute vol-umes As m figs. I and 2claranes calualated from dataobtained during the saobservation period have beenjoined by straight lines, andfrom these averages have beenestimated. The mean volumeof blood clared of urea isI 5514 mLper minute, equal to0 6665 mg. urea ni
Fig. 4 shows the urea con-centration of the indidualurine specimens plotted againstthe time at which they weretaken. Specimens from thesame infant are joined bysaight lines It is shown thatwith one exception, a day-oldinfant, there is always anincrease in the concentrationof urea. nIn the one exceptionit will be noted that the urineurea concentration at 9 a-mewas at a higher level than thatfound in any of the otherinfants in the group.
DiscassoThe results now recorded
maybe looked upon as comple-mentary to those of McCanceand Young (1941). It is impor-tant to note that their observa-tions were made on infantswho were in their second weekof life, for at this age the fluidintake of the infant who issolely breast fed is more thanfive times the intake of anentirely breast fed two-day-oldinfant and about three timesthat of a -three-day-old infant(Ihomson, 1944).
Tl" %f:nrfivrnuiw T
Fro. 2.-Group I: individulurea learnces.
183
.1 LEVI AA"U"&O WA ww"je &
of this serm of observauons
I
by copyright. on 13 M
ay 2018 by guest. Protected
http://adc.bmj.com
/A
rch Dis C
hild: first published as 10.1136/adc.24.119.180 on 1 Septem
ber 1949. Dow
nloaded from

1ARCHIVES OF DISEASE IN CHILDHOOD
TAB. 3
DATA OF GROUP m INFANTS
|E 24 E Blood uea nitrogen Number and volume of urineol- ); per 100 ml.o0 E0 O= E 0 1o specimens
0 0
O oO~ =° o c~ 9a.. 1d0am 11om'9am. 10 am. 11am.12noon 1pm.U`1<E o.', | 3 < u>~ U _g5 (mL) (ML) (mL) (ml) (mL)
23 75-3 3,345 20-92 0-2346 7-37 24 47 - + 6-8 4-2 3-5 N.C.*24 118-2 2,835 24-69 0-2099 8-20 21 57 - ± 5-6 7-4 part N.C.25 38-8 2,948 23-74 0-2154 8-00 - 38 - part part Nil N.C.26a 131-5 3,005 23-29 0-2181 7-90 33 33 Nil 5-9 Nil Nil N.C.26? 203-5 3,090 22-65 0-2222v 7-80 - 33 + 5-0 6-6 part N.C.V 146-1 4,167 16-82 0-2743 6-30 14 48 - em 6-4 part 4-1 N.C.28 44-4 3,374 20-75 0-2359 7-33 28 47 45 4- 1-9 1-7 1-1 0-629 53-2 2,948 23-74 0-2154 8-00 21 44 - 1-6 3-9 4-0 N.C.30 63-3 3,515 19-91 0-2428 7-10 22 48 - 5-3 6-0 3-6 N.C.31 106-0 2,722 25-72 0-2044 8-50 9 36 + part part 3-0 N.C.32 132-9 3,090 22-65 0-2222 7-80 - 52 - - 5-3 part 5-8 N.C.33 127-5 2,438 28-71 0-1908 9-10 - 34 + Nil 2-5 N.C. N.C.34 121-1 3,090 22-65 0-2222 7-80 - 33 - 3-6 Nil part N.C.35 153-1 2,693 25-99 0-2031 8-50 12 43 - Nil 4-7 3-4 part N.C.36 39-3 3,685 18-99 0-2510 6-90 22 68 - 3-1 1-8 Nil N.C.37 126-7 2,551 27-43 0-1962 8-80 38 40 6-1 4-2 5-3 N.C.38 212-8 2,608 26-84 0-1990 8-70 - 35 36 + 4-6 5-5 N.C. N.C.
Mean 111-58 j 19 43 4-238 mL
N5.C.= not catheterized.
received no fluid other than that which theycould obtan at the breast Because of this theminute volumes obtained are less than those recordedby McCance and Young. They recorded minutevolumes of the order of 0-1 to 0- 15 ml per minutewhich compares with a mean of 0- 0682 mL for thisgroup of observations. The blood urea concentra-tions recorded by McCance and Young were lower,the average being 16 -4 mg. urea per 100 ml.(7-66 mg. urea nitrogen per 100 mnL) compared witha mean of 19 mg. urea nitrogen per 100 ml. in thisseries. This difference in the two age periods is inconformity with the fidings of Sedgwick andZiegler (1920).
Despite these differences comparison may bemade if the data are ' corrected ' to an agreedstandard. If the agreed standard be an adultstandard, companison may be made with it at thesame time. The ratio between the body surfacearea, body weight, kidney weight, and the metabolicrate of the infant, and the corresponding data foran ideal theoretical adult have been suggested ascorrecting factors which might be used. McCanceand Young (1941) have investigated the applicationof these vanous factors and on the data before themshow that the body surface area factor is the mostreasonable one to use.
After correcting each observation in group I toa standard of 1 -73 sq. m. body surface the observa-tions were plotted after the manner of fig. 1 andaverages were struck. These averages in the formof a graph are given in fig. 5. In the same figure
ther is given for comparison the graph for atheoretical adult having a surface area of 1-73 sq. m.and a body weight of 70 kg. The graph presentedby McCance and Young (1941) representing thesimilarly corrected observations of their seres is alsogiven.Comparison of these three graphs shows that
judged by this standard the power of the kidney toclear urea from the blood in the immediate postnatal period is far below that of the adult kidneyand is also less than that of the two-week-old infant.In addition, the form of the graph representing thepresent observations differs from that representingthe infant in the second week of life. The change inthe form of the graph representing the observationsof group 1 is suffiiently marked and abrupt torequire some explanation.
Consideration of fig. 1 shows that the change inthe form of the graph occurs at about a urine minutevolume of 0-05 ml., that is, less than the meanminute volume. Also the impression is obtainedthat the scatter of the individual observations above0-05 ml. per minute is much wider than the scatterat lower minute volumes. This impression isconfirmed by the coefficient of correlation betweenthe blood urea clearance and the urine minutevolume which for the observations below 0-05 ml.urine per minute is 10-657 while for those above0-05 ml. urine per minute it is +0-130.
In a search for an explanation the followingpoints may be considered. (1) The graph mayrepresent all the kidney is required to do by way of
184by copyright.
on 13 May 2018 by guest. P
rotectedhttp://adc.bm
j.com/
Arch D
is Child: first published as 10.1136/adc.24.119.180 on 1 S
eptember 1949. D
ownloaded from

UREA CLEARANCE IN THE IMMEDIATE POST-NATAL PERIOD 185
4Sj1
4
3.
z 3-z
z
a-
cc
_a 2-0
I.
0-s
B.-Z
U.
URINE ML MMIN.-05 0 o is 0 2FiG. 3.-Group m: individual urea clearances.
urea clarance in the immediate post-natal period,and this, may not be the same as the maximumclaring power; (2) in those observations showingurine minute volumes over 0-05 mL per minute, therate of flow through the tubules may have been toofast to permit of adeate concentration; (3) thepossible effect upon the data of the failure of theinfant to empty the bladder when voiding urinespontaneously.The data obtained from group II gives some
information on the first two of these points. Theainh ipnrPepnting thp apr2o nf th- nh _rv-Fwp' L1 sswsW0 's---C - -
ts shows litde Chan in its form and is more TIME 9a.m. 10 12 Ips.ie a straight line, fg 2 The urea fed to thisgroup of infants has not produced a diuresis and EMk. 4.-Group MI: concentration of urea in urme.
by copyright. on 13 M
ay 2018 by guest. Protected
http://adc.bmj.com
/A
rch Dis C
hild: first published as 10.1136/adc.24.119.180 on 1 Septem
ber 1949. Dow
nloaded from

ARCHIVES OF DISEASE IN CHILDHOODthe difference between the urine minute volumes ofgroups I and II is not statiscally siifict. Thegroup II observations corrected for surface area
<
z
cx
zI.)
x
z4
4c1
00
have been averaged in the same manner as theobservations of group I, and are given as a graphin fig. 5. At urine minute vohlmes up to 0 4 mLcorrected the graphs for groups I and II virtuallycoincide. Above this point they diverge. It seersreasonable to infer from this that the urea clearancesin groups I and II up to a urine minute volume of0 05 ml. per minute are of the nature of maximumurea learances and at urine minute volumes overthis figure the maximum urea carance rate ismaintained by group II and not by group I. Thegroup II observations also show that at urineminute volme over 0 05 ml. the flow through thetubules is not too fast to permit of tubular resorp-tion.
It will be observed that in alculating theclran for group II it has been asmred thatthe blood urea nitrogen level remains constantthroughout the observation period. Since it maywell be doubted whether this is so, the blood ureanitrogen level was investigated several times in twoinfants. Fig. 6 shows the results obtained over aperiod of some forty-eight hours. In the sarfigure the blood urea nitrogen concentrations for allthe infants in group II are given. In the cas of thesix infants who were not given urea at the commence-ment of the second observation period the bloodurea nitrogen concentrations for the first and secondperiods have been joined by straight lines. Thetrnd of these lines shows a certain resemblance tothe graphs obtained from the two infants, A and B,whose blood urea nitrogen concentrations wereobserved more frequently. There is little doubt thatthe blood ureanin concentration remains at ahigh level initially and that it does so for periodscomparable with the mean average duration of theobservation peiod. Unforunately the high con-centrations are not necessarily stable, so that thedata obtained in respect of group II are not freefrom objection. Moreover, the possible effect uponthe data of the failure of an infant to empty thebladder is not considered in this group.
In group III, by shortening the period of observa-tion to an average of two hours per infant andemptying the bladder by catheter at hourly intervals,one removes as far as possible the objection that thebladder may not be emptied at the time of voidingurne. One also mitigates in very large measure theobjectionthat thebloodureanitrogen maynot remainat a stable level during the observation period. Thisis shown by a comparison of the four blood ureanitrogen levels at 11 a.m. with those taken at10 am. from the same infant (table 3).On five occasions no urine was obtained on
catheterizing, and no evidence could be found toshow that the infant had voided urine spontaneouslybefore being catheterized. Because of this it maybe questioned whether the kidney secretes urinecontinuously. Be that as it may, the fact that thereis no staisical sig in the differencesbetween the urine minute volumes of the threegroups suggests that from this point of view, at
URINE NL. PER MIN.FIG. 5.-Comparison of infant and adult clarans on
a basis of body surface area of 1 73 sq. m.
186by copyright.
on 13 May 2018 by guest. P
rotectedhttp://adc.bm
j.com/
Arch D
is Child: first published as 10.1136/adc.24.119.180 on 1 S
eptember 1949. D
ownloaded from

UREA CLEARANCE IN THE IMMEDIATE POST-NATAL PERIOD
least, the observations of the three groups arecomparable.
In group III as in group II urea did not produce adiuresis. The graph representing the averages ofthe observations in group Ill resembles the graphfor group H in as much as it is almost a straight line(fig 3).The observations obtaied from group III after
individual correction for surface area,have been averaged in the same manner-as the observations for groups I and II. X:This is shown in fig. 5. It is apparent 0from this representation that there is a ogreat similairity between the averages ofthe observations for groups II and HII S
so that the inference already drawn froma comparison of the graph represeting ogroups I and H appears to be confirmed.The inference was that normally in theim iate post-natal period at urine <minute volumes of 0 05 ml. or less g;(corrected 0-4 mL) the urea clerancemaybe considered to be a maximumone, 0but that at urine minute volumes over 8this figure it is less than maximum.
In fig. 5 a comparison may also Kbe made oetween mhe averages for tGivI NG4groups II and HI and the averages FK;. 6.-Lof the observations of McCance of wreand Young. It is shown that theurea clarance in relation to theurine minute volume for groups H and II is greaterthan that which normally obtained in the secondweek of life. This observation suggests that thedata of McCance and Young do not reflect themaximum clearing power of the kidney but rathera normal urea clarance for the age period. In thesame figure (no. 5) comparison of groups II and IIImay also be made with the urea clarance of astandard adult of 1-73 sq. m. body surface area.On this basis the urea cleaan for groups II andIll, though better than group I, shows that thekidney in the immate post-natal period is lessefficient than the adult kidney.
In their work on urea clarance McCance andYoung showed that a basis of body weight was theonly basis to which their observations could becorrected in order to reach a urea clearance com-parable with that of an adult. They rejected thisbasis because of the very high urine minute volumewhich it entailed (fig. 7.) In view of the greaterrenal efficency shown by groups H and HI it wasthought desirable to make a comparison betweentheir urea cleaances and those of a standard adulton a weight basis. After individual correction ofthe observations in each of groups H and II,averages were struck and graphs obtained. Thesegraphs are shown in fig. 7. It is apparent thaton this basis also an adult level of urea clear-ance has not been reached at any urine minutevolume.
Smq1. The urea claring power of the kidney in the
immediate post-natal period has been investigatedin three groups of infants.
2. Group I was a normal group comprising ninemale infants. Group H comsisted of thirteen maleinfants, and group HI consisted of sixteen female
UREAJrea nitroge concentration in blood following administatioa. Age: A, 44 hours at c t ; B, 54 hours.
infants. At the commencement of the observationperiod 3 g. of urea in 30 ml. of water were given bygavage to groups H and IH.
3. Urine specimens from groups I and H wereobtained by the use of a sigalling apparatus.Urine specimens from group mH were obtained bycatheterization.
4. The urea clearances in group I are consideredto be normal clearances, those from groups H andIH to be maximum clerances.
5. Comparison of urea clarance betweengroups I, IL, and IH suggests that normally at urineminute volumes of 0 05 ml. or less, urea cleranceis maximum, but at greater urine minute vohlmesthe urea clearance is normaUlly less than-maximum.
6. Comparison of urea cleance betweengroups 1,1, and IH and urea clarance in infantsover a week old shows that normally less urea isclared in the immediate post-natal period.
7. Comparison of maximum urea clearance inthe immdiate post-natal period with the ureaclearance of a standard adult having a surface areaof 1 73 sq. m. and a weight of 70 kg. shows that oneither basis of comparison urea clerance in theimmediate post-natal period is le efficient.
187by copyright.
on 13 May 2018 by guest. P
rotectedhttp://adc.bm
j.com/
Arch D
is Child: first published as 10.1136/adc.24.119.180 on 1 S
eptember 1949. D
ownloaded from

188 ARCHIVFS OF DISEASE IN CHLDHOOD90
so
THEORETICAL ADULT 70 Kg. ,
70 //IfMCC.& Y.
70 ,
GROUP/ GROUP ,
I
uJ~~~~~~~~~~~~~~~~~~~~~~~~~~~~~~~~~~~~~~~~J
z
ELI
030 J
0
URINE ML I 2 3 4 5 bPER MIN.
Fio. 7.-Comparison of infant and adult clearans on a basis of body weight of 70 kg.
It is a great pleasue to acInowleg the technsxvces90so willigy afforded me by Dr. C. P.Stewart, o n, Royal Infirmary, Edinburgh,and consuig b Royal Hospital for SickCbidr4 Edinbgh
REMMEOESBanstt, H. L. (1940). Pro. Soc. exp. Biol. N.Y., 44,
654., Piey, A. N, and McGinnis, H. G. (1942). Proc.
Soc. exp. EBil N. Y., 49 90.Dean, R. F. A, and McCale, R. A. (1947). J. Physiol.,
1W, 431.
Gordon, Ho H., Harison, H. E., and McNamara, H.(1942). J. Cfin. Lmest., 21, 499.
Hojv1and, J., and Dana, R. T. (1913). Amer. J. Dis.Ckid., 6, 33.
Luca,i W. P., Draing, B. F., Hoober, H. R., Cox, A,Jones, M. R., and Smyth, F. S. (1921). Ibid.,22,525. -
McCanc, R A.,andYoung,W.F.(1941). J.Physil,9,265.
Schutz, F. W., and Pettibone, C. J. V. (1915). Amw.J. Dis. Chl, 10, 2)6.
Sedgwick, J. P., and Ziegler, M. R. (192)). Id., 9,429.
Thomson, J. (1944). Arch. Dis. Child., 19,169.
by copyright. on 13 M
ay 2018 by guest. Protected
http://adc.bmj.com
/A
rch Dis C
hild: first published as 10.1136/adc.24.119.180 on 1 Septem
ber 1949. Dow
nloaded from