climate action in belgium - european parliament
TRANSCRIPT

BRIEFING EU progress on climate action – How are the Member States doing?
This briefing is one in a series covering all EU Member States.
EPRS | European Parliamentary Research Service Lead author: Henrique Morgado Simões
Climate Action Research and Tracking Service, Members' Research Service PE 690.578 – April 2021 EN
Climate action in Belgium Latest state of play
The EU's binding climate and energy legislation for 2030 requires Member States to adopt national energy and climate plans (NECPs) to cover the 2021-2030 period. In October 2020, the European Commission published an assessment for each NECP. Belgian climate and energy policy is a combined effort of the Flemish, Walloon and Brussels Capital regions. A high proportion of Belgians (60 %) expect national governments to tackle climate change.
Belgium accounts for 3.3 % of total EU greenhouse gas (GHG) emissions and has reduced emissions at a slower pace than the EU average since 2005. The carbon intensity of Belgium's economy is slightly lower than the EU average and has mirrored the decreasing EU trend closely since 2005.
Emissions from energy industries have fell by almost 30 % between 2005 and 2019, with a 2.9 percentage point reduction for total emissions. Waste management was the sector with the biggest percentage reduction (55 % or 1.7 MtCO2e) in emissions since 2005. Transport and agriculture were the sectors with the lowest reduction. Under EU effort-sharing legislation, Belgium was aiming to reduce its emissions by 15 % by 2020, compared with 2005, and in 2019 was on track to achieving the target. Belgium reached a 9.9 % share of renewable energy sources in 2019. Its ambition to reach its 2030 target of a 17.5 % share focused mainly on wind and photovoltaic energy, biofuels and the use of waste heat. Measures to achieve the energy efficiency targets are focused on the building and transport sectors.
Emissions and demographics In 2019, Belgium had 11.5 million inhabitants, accounting for 2.6 % of total EU27 population.
Emissions per capita for 2019 were the seventh highest in the Union. The Belgian per capita level decreased at a slightly faster rate than average EU27 per capita emissions between 2005 and 2014. Going against the EU27 trend, per capita emissions in Belgium did not decrease between 2016 and 2019. The difference has become smaller, however, from 3.6 tonnes CO2 equivalent (tCO2e) per capita above the EU27 average in 2005 to 2.4 tCO2e per capita above in 2019.
According to projections, the Belgian population will remain relatively stable and follow the EU27 overall decreasing trend from 2045.
Figure 1 – Total greenhouse gas emissions (tCO2e) per inhabitant in 2019
Data source: Eurostat demo_pjan and EEA (GHG trends, GHG estimates, UNFCCC reporting).

EPRS | European Parliamentary Research Service
2
Belgium's progress so far Belgium accounts for net emissions of 123 MtCO2e in 2019. Belgium's emissions make up 3.3 % of the EU27 total and have decreased by 17.2 % since 2005. This is below the EU-wide emissions reduction of 19 % in the same period. Land use, land use change and forestry (LULUCF) emissions have remained stable since 2005, enabling net emissions to follow the trend set by total emissions in the country. Belgium's LULUCF carbon sink functions have remained stable since 2015. Sink capacities are expected to grow by 3 % from 2015 values by 2030. The country aims to expand its LULUCF functions by means of the sustainable management of forests, afforestation, changes in forestry practices and through incentives directed at the long-term use of wood. Also in line with expected growth, the country intends to introduce changes to agricultural practices – increasing long-term carbon storage in soils – and to introduce biomass as a replacement for fossil fuels and fossil-fuel based raw material from sustainable management.
Figure 2 – Total, LULUCF and net greenhouse gas (GHG) emissions (MtCO2e)
Data source: EEA (GHG trends, GHG estimates, UNFCCC reporting).
Carbon intensity Between 2005 and 2019, industry reduced its share in the Belgium economy from 20.4 % to 16 %, with an impact on emission intensity. In 2019, Belgium's emission intensity was close to EU average GHG emissions per GDP. Taking into account both the change in GDP and GHG emissions, the already observed decoupling was steadily in place for the observed period and is expected to last.
Over the 14-year period from 2005, Belgium reduced its emissions intensity per GDP by close to 32 % mirroring the EU27 average reduction of 33 %. The GDP impacts of the 2009 financial crisis were accompanied by a reduction in total GHG emissions in the same year, while in 2010 GDP increased by 2.9 % and GHG emissions by 8 MtCO2e.
Figure 3 – Carbon intensity of the economy: GHG emissions (gCO2e) per GDP (euro in 2015 prices)
Data source: Eurostat Nama_10_gdp and EEA (GHG trends, GHG estimates, UNFCCC reporting).

Climate action in Belgium
3
Emissions across the economy In 2005, energy industries accounted for the largest share of Belgium's GHG emissions, with a 20 % share of the total. Emissions from energy industries fell by almost 30 % in the 2005-2019 period, reducing their share of total emissions by 3 percentage points. From 2025 onwards, it is expected that the electricity mix will be composed mostly of natural gas and renewable energy, after the closure of the remaining nuclear power plants. The Belgian Federal Government intends to phase out fossil fuels for electricity generation by 2050.
All sectors reduced their emissions over the 2005 to 2019 period. The waste management sector achieved the biggest emission reduction, reducing its share of total emissions over the period from 2.0 % to 1.1 %. This translates into a 55 % reduction in emissions (1.7 MtCO2e) since 2005.
Transport and agriculture were the sectors with the smallest emission reductions (-1.1 % and -3.9 % respectively) in the period. Emissions from manufacturing industries and construction fell by 22.9 %.
Figure 4 – Total GHG emissions by sector (MtCO2e) (rounded data)
Data source: EEA (GHG trends, GHG estimates, UNFCCC reporting).
The EU-wide emissions trading system (ETS) covers emissions from electricity generation and industry. As the country's nuclear reactors are shut down, it is expected that energy-related emissions will grow up until 2030, mostly on account of the use of gas-fired power stations. This goes against the previous set reduction trend where EU-ETS emissions dropped from 66.6 MtCO2e in 2005 to the 2020 value. This decrease is explained by the phasing out of coal in the country. In 2030, if current policies are maintained, total GHG emissions have the potential to rise in Belgium to 128 MtCO2e, this links to electricity generation pushing EU ETS-related emissions to 58 MtCO2e.
Over 50 % of the electricity generated in Belgium comes from its seven nuclear reactors, while the natural gas share in production is rising at a constant pace. Belgium is planning to close its nuclear power plants between 2022 and 2025 and will need to expand production from renewable sources, improve interconnections with neighbouring countries and expand the natural gas infrastructure.
Belgium's offshore wind farms are expected to play an important role in the electricity sector as a source of renewable energy.
EPRS | European Parliamentary Research Service
4
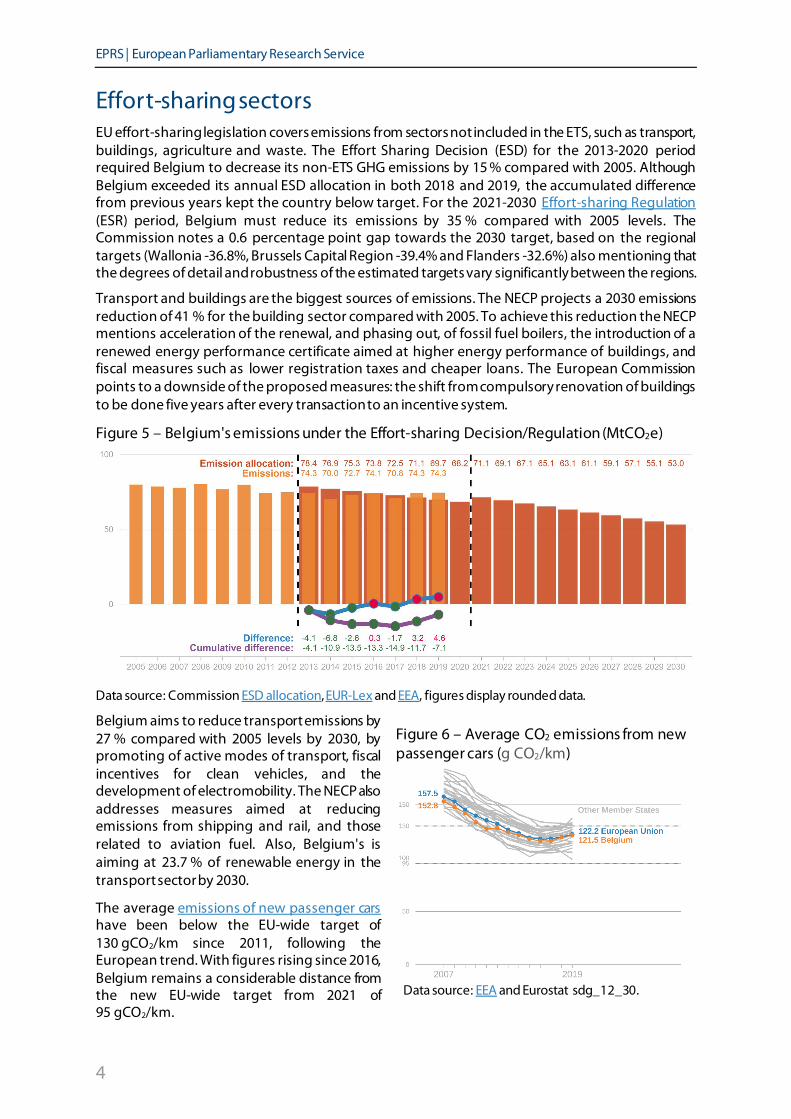
Effort-sharing sectors EU effort-sharing legislation covers emissions from sectors not included in the ETS, such as transport, buildings, agriculture and waste. The Effort Sharing Decision (ESD) for the 2013-2020 period required Belgium to decrease its non-ETS GHG emissions by 15 % compared with 2005. Although Belgium exceeded its annual ESD allocation in both 2018 and 2019, the accumulated difference from previous years kept the country below target. For the 2021-2030 Effort-sharing Regulation (ESR) period, Belgium must reduce its emissions by 35 % compared with 2005 levels. The Commission notes a 0.6 percentage point gap towards the 2030 target, based on the regional targets (Wallonia -36.8%, Brussels Capital Region -39.4% and Flanders -32.6%) also mentioning that the degrees of detail and robustness of the estimated targets vary significantly between the regions.
Transport and buildings are the biggest sources of emissions. The NECP projects a 2030 emissions reduction of 41 % for the building sector compared with 2005. To achieve this reduction the NECP mentions acceleration of the renewal, and phasing out, of fossil fuel boilers, the introduction of a renewed energy performance certificate aimed at higher energy performance of buildings, and fiscal measures such as lower registration taxes and cheaper loans. The European Commission points to a downside of the proposed measures: the shift from compulsory renovation of buildings to be done five years after every transaction to an incentive system.
Figure 5 – Belgium's emissions under the Effort-sharing Decision/Regulation (MtCO2e)
Data source: Commission ESD allocation, EUR-Lex and EEA, figures display rounded data.
Belgium aims to reduce transport emissions by 27 % compared with 2005 levels by 2030, by promoting of active modes of transport, fiscal incentives for clean vehicles, and the development of electromobility. The NECP also addresses measures aimed at reducing emissions from shipping and rail, and those related to aviation fuel. Also, Belgium's is aiming at 23.7 % of renewable energy in the transport sector by 2030.
The average emissions of new passenger cars have been below the EU-wide target of 130 gCO2/km since 2011, following the European trend. With figures rising since 2016, Belgium remains a considerable distance from the new EU-wide target from 2021 of 95 gCO2/km.
Figure 6 – Average CO2 emissions from new passenger cars (g CO2/km)
Data source: EEA and Eurostat sdg_12_30.

Climate action in Belgium
5
Energy transition Renewable energy Belgium increased its renewable energy share of total energy consumption by 7.6 percentage points between 2005 and 2019, aiming to raise it from 9.9 % to 17.5 % by 2030. The Commission finds Belgium's 2030 indicative target of 17.5 % renewable energy in the energy mix lacks ambition.
Figure 7 – Share of renewable energy of total energy consumption
Data source: Eurostat (shares tool), NECP 2030 targets and EEA.
By 2030, Belgium aims to raise the renewable energy share in electricity (37.4 %), transport (23.7 %) and heating and cooling (11.3 %). This is to be achieved through investment in wind and photovoltaic energy production, biofuels and the use of waste heat. Nevertheless, the European Commission points out that under the final NECP, renewable energy is expected to increase only by around 3 percentage points by 2030 compared with was put forward in the draft NECP.
Energy efficiency The European Commission has assessed Belgium's 2030 target as unambitious and points to a disconnection with the energy efficiency first principle.
The NECP focuses on measures to achieve energy savings mostly through the buildings and transport sectors. Here, a full set of new policies and measures are described. Nevertheless they are deemed to be inconclusive in terms of how they line up with the proposed targets, as the consistency of measures between federal and regional levels and between regions is either lacking or entirely absent.
Figure 8 – Energy efficiency: primary and final energy consumption (Mtoe)
Data source: Eurostat nrg_bal_s, NECP 2020 + 2030 targets and EEA.

EPRS | European Parliamentary Research Service
6
Outlook: Plans and policies The Commission's assessment of the final NECP submitted by Belgium states that the document still lacks coherence and points to the need for better national integration between the different regional authorities and the federal government so as to achieve a stronger combined effort. The various different regions (Wallonia, Flanders, Brussels capital) in the country currently have their own specific targets that as a whole do not allow the country to achieve the desired targets.
The Walloon Climate Decree of 2014 set GHG emissions reduction targets for 2020 at 30 % and for 2050 at 80 % to 95 % compared with 1990 levels. The Flemish Regional Government, through its 2021-2030 Climate and Energy Policy Plan supports a GHG emissions reduction of 35 % by 2030 and 80 % by 2050, compared with 1990 levels. The Air Climate Energy Regional Plan of the Brussels Capital Region commits to reducing GHG emissions by 32 % by 2030 compared with 1990.
Following the decision to phase-out all nuclear power plants between 2022 and 2025, the Federal Government introduced a capacity remuneration mechanism to prevent power shortages and secure a steady supply of energy.
MAIN REFERENCES Belgian Federal Government, National Energy and Climate Plan – Section A – National Plan – Context, objectives, policies and measures, December 2019. Belgian Federal Government, National Energy and Climate Plan – Section B – Analytical Basis Current data and projections, December 2019. Belgian Federal Government, Belgium's long-term strategy, February 2020.
European Commission, Assessment of the final national energy and climate plan of Belgium, SWD(2020) 900 final.
DISCLAIMER AND COPYRIGHT This document is prepared for, and addressed to, the Members and staff of the European Parliament as background material to assist them in their parliamentary work. The content of the document is the sole responsibility of its author(s) and any opinions expressed herein should not be taken to represent an official position of the Parliament. Reproduction and translation for non-commercial purposes are authorised, provided the source is acknowledged and the European Parliament is given prior notice and sent a copy. © European Union, 2021. Photo credits: © Kruwt / Adobe Stock. [email protected] (contact) www.eprs.ep.parl.union.eu (intranet) www.europarl.europa.eu/thinktank (internet) http://epthinktank.eu (blog)