climate algorithm theoretical basis document (c … · climate data record (cdr) program . climate...
TRANSCRIPT

Climate Data Record (CDR) Program
Climate Algorithm Theoretical Basis Document (C-ATBD)
HIRS Channel 12 Brightness Temperature
CDR Program Document Number: CDRP-ATBD-0309 Configuration Item Number: 01B-03 Revision 3 / June 19, 2015
CDR Program HIRS Brightness Temperature C-ATBD CDRP-ATBD-0309 Rev. 3 06/19/2015
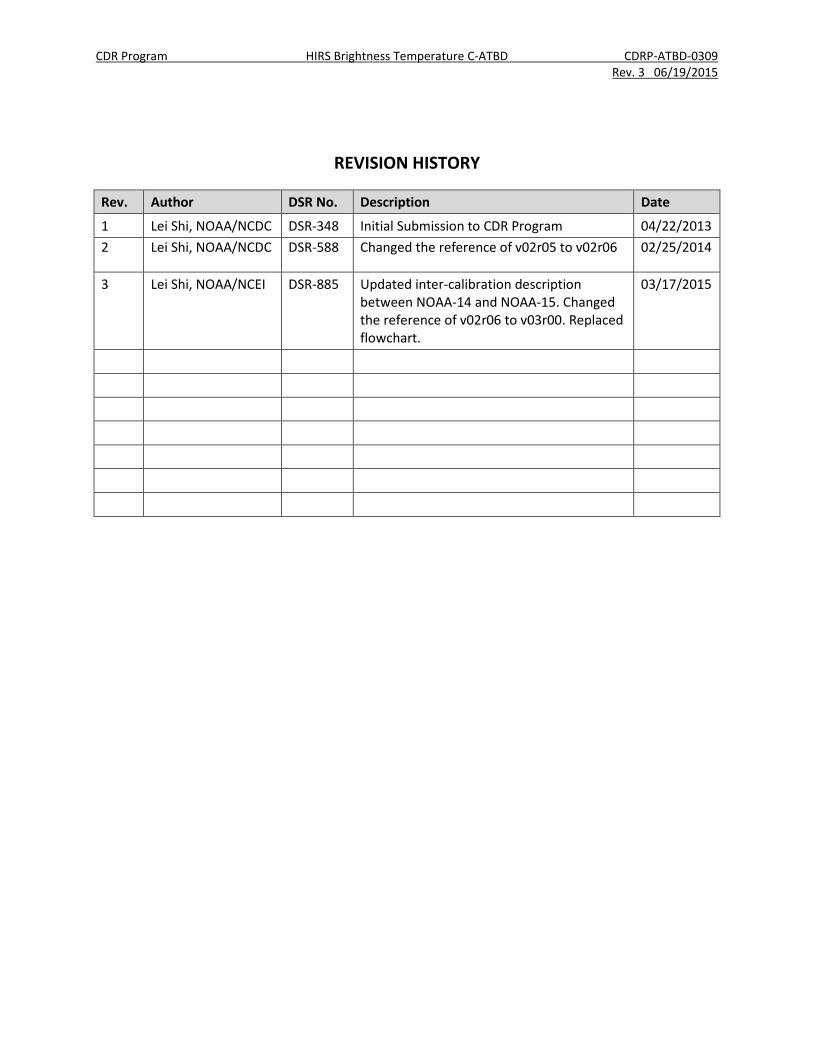
REVISION HISTORY
Rev. Author DSR No. Description Date
1 Lei Shi, NOAA/NCDC DSR-348 Initial Submission to CDR Program 04/22/2013 2 Lei Shi, NOAA/NCDC DSR-588 Changed the reference of v02r05 to v02r06 02/25/2014
3 Lei Shi, NOAA/NCEI DSR-885 Updated inter-calibration description between NOAA-14 and NOAA-15. Changed the reference of v02r06 to v03r00. Replaced flowchart.
03/17/2015

CDR Program HIRS Brightness Temperature C-ATBD CDRP-ATBD-0309 Rev. 3 06/19/2015
TABLE of CONTENTS
1. INTRODUCTION .............................................................................................................................. 6 1.1 Purpose ..................................................................................................................................................... 6 1.2 Definitions................................................................................................................................................. 6 1.3 Referencing this Document ....................................................................................................................... 6 1.4 Document Maintenance ............................................................................................................................ 6
2. OBSERVING SYSTEMS OVERVIEW ............................................................................................ 7 2.1 Products Generated .................................................................................................................................. 7 2.2 Instrument Characteristics ........................................................................................................................ 7
3. ALGORITHM DESCRIPTION ........................................................................................................ 9 3.1 Algorithm Overview .................................................................................................................................. 9 3.2 Processing Outline..................................................................................................................................... 9 3.3 Algorithm Input ....................................................................................................................................... 11
3.3.1 Primary Sensor Data .............................................................................................................................. 11 3.3.2 Ancillary Data ......................................................................................................................................... 11 3.3.3 Derived Data .......................................................................................................................................... 11 3.3.4 Forward Models ..................................................................................................................................... 11
3.4 Theoretical Description ........................................................................................................................... 11 3.4.1 Physical and Mathematical Description ................................................................................................. 11 3.4.2 Data Merging Strategy ........................................................................................................................... 13 3.4.3 Numerical Strategy ................................................................................................................................ 13 3.4.4 Calculations ............................................................................................................................................ 13 3.4.5 Look-Up Table Description ..................................................................................................................... 13 3.4.6 Parameterization ................................................................................................................................... 13 3.4.7 Algorithm Output ................................................................................................................................... 14
4. TEST DATASETS AND OUTPUTS ............................................................................................. 15 4.1 Test Input Datasets ................................................................................................................................. 15 4.2 Test Output Analysis ............................................................................................................................... 15
4.2.1 Reproducibility ....................................................................................................................................... 15 4.2.2 Precision and Accuracy .......................................................................................................................... 15 4.2.3 Error Budget ........................................................................................................................................... 15
5. PRACTICAL CONSIDERATIONS ................................................................................................ 16 5.1 Numerical Computation Considerations .................................................................................................. 16 5.2 Programming and Procedural Considerations ......................................................................................... 16 5.3 Quality Assessment and Diagnostics ....................................................................................................... 16 5.4 Exception Handling ................................................................................................................................. 16 5.5 Algorithm Validation ............................................................................................................................... 16 5.6 Processing Environment and Resources .................................................................................................. 16

CDR Program HIRS Brightness Temperature C-ATBD CDRP-ATBD-0309 Rev. 3 06/19/2015
6. ASSUMPTIONS AND LIMITATIONS ........................................................................................ 17 6.1 Algorithm Performance ........................................................................................................................... 17 6.2 Sensor Performance ................................................................................................................................ 17
7. FUTURE ENHANCEMENTS......................................................................................................... 18
8. REFERENCES .................................................................................................................................. 19
APPENDIX A. ACRONYMS AND ABBREVIATIONS ................................................................... 20

CDR Program HIRS Brightness Temperature C-ATBD CDRP-ATBD-0309 Rev. 3 06/19/2015
LIST of FIGURES
Figure 1: Spectral response functions of HIRS channel 12. As a reference, the atmospheric transmittance for a typical tropical clear-sky atmosphere is included (black line). The approximate spectral ranges for the HIRS/2 series and the HIRS/3 and HIRS/4 series are marked at the top. ............................................... 8
Figure 2: Flowchart of the intersatellite calibrated HIRS channel 12 processing. ...................................... 11
Figure 3: Sequential intersatellite biases of HIRS channel 12 brightness temperatures for 11 pairs of satellites as functions of the brightness temperature. ............................................................................... 12
LIST of TABLES
Table 1: Output of the intersatellite calibrated clear-sky HIRS channel 12 brightness temperature dataset, including its content, file format, unit, and estimated sizes......................................................... 14
Table 2: Averaged remaining differences (K) of intersatellite calibrated monthly mean brightness temperatures between individual satellites for 30S to 30N latitudes. ....................................................... 15
CDR Program HIRS Brightness Temperature C-ATBD CDRP-ATBD-0309 Rev. 3 06/19/2015
1. Introduction
1.1 Purpose The purpose of this document is to describe the algorithm submitted to the
National Centers for Environmental Information (NCEI) by Lei Shi from NOAA/NCEI that will be used to create the High-Resolution Infrared Radiation Sounder (HIRS) Channel 12 Brightness Temperature Climate Data Record (CDR), using HIRS data from National Oceanic and Atmospheric Administration (NOAA) polar orbiting satellites and the Meteorological Operational Satellite Program (Metop). The actual algorithm is defined by the computer program (code) that accompanies this document, and thus the intent here is to provide a guide to understanding that algorithm, from both a scientific perspective and in order to assist a software engineer or end-user performing an evaluation of the code.
1.2 Definitions Following is a summary of the symbols used to define the algorithm.
Atmospheric parameters:
Tb = HIRS channel 12 brightness temperature (1)
1.3 Referencing this Document This document should be referenced as follows:
HIRS Channel 12 Brightness Temperature - Climate Algorithm Theoretical Basis Document, NOAA Climate Data Record Program CDRP-ATBD-0309 Rev. 3 (2015). Available at http://www.ncdc.noaa.gov/cdr/operationalcdrs.html
1.4 Document Maintenance This document is under version control in the CDR Program library. The
information in this document applies to v03r00 of the archived data. Future versions of the product will be accompanied by an update to this C-ATBD and other documentation as needed.

CDR Program HIRS Brightness Temperature C-ATBD CDRP-ATBD-0309 Rev. 3 06/19/2015
2. Observing Systems Overview
2.1 Products Generated The objective of this algorithm is to derive intersatellite calibrated HIRS clear-
sky channel 12 brightness temperatures from measurements made by the NOAA and METOP satellite series. The data are in pixel resolution in cloud-free condition. Monthly files are also generated at 2.5x2.5 degree latitude/longitude.
2.2 Instrument Characteristics Since the launch of the Television Infrared Observation Satellite (TIROS‐N) in
1978, more than 30 years of observations have been made by the HIRS instruments on board the NOAA polar orbiting satellite series (hereafter abbreviated as N#, where # is the satellite number) and the METOP satellites. There are twenty channels in the HIRS instrument, in which channel 12 observes the upper tropospheric water vapor. Figure 1 displays the spectral response functions of HIRS channel 12 for the satellites included. The approximate spectral ranges for the HIRS/2 series and the HIRS/3 and HIRS/4 series are marked at the top of Figure 1. As a reference, the atmospheric transmittance for a typical tropical clear‐sky atmosphere is also included (see (Shi; Bates 2011)).

CDR Program HIRS Brightness Temperature C-ATBD CDRP-ATBD-0309 Rev. 3 06/19/2015
Figure 1: Spectral response functions of HIRS channel 12. As a reference, the atmospheric transmittance for a typical tropical clear-sky atmosphere is included (black line). The approximate spectral ranges for the HIRS/2 series and the HIRS/3 and HIRS/4 series are marked at the top.
CDR Program HIRS Brightness Temperature C-ATBD CDRP-ATBD-0309 Rev. 3 06/19/2015
3. Algorithm Description
3.1 Algorithm Overview There have been more than ten satellites carrying the HIRS instruments in the
NOAA polar orbiting satellite series. Due to the independence in the calibration based on individual HIRS instrument’s channel spectral response function along with other factors, biases exist from satellite to satellite. The measurement from HIRS channel 12 is a fundamental climate data record and is key to water vapor feedback. It is important that the intersatellite biases are corrected. Examination of the intersatellite biases shows that the biases are scene brightness temperature dependent. An algorithm is developed to account for this feature of varying biases with respect to brightness temperature. The bias correction data are derived from overlaps of monthly means of each 10-degree latitude belt from the equator to the poles. For the colder temperature range, data from the simultaneous nadir overpass (SNO) observations are incorporated. HIRS measurements from the NOAA series of polar orbiting satellites and Metop-A are calibrated to a baseline satellite (NOAA-12).
3.2 Processing Outline The processing outline of intersatellite calibrated HIRS channel 12 brightness
temperature is summarized in Figure 2. The algorithm for data processing is written in C, FORTRAN, and C Shell scripts. Input data are HIRS level-1B in binary format and output data are written in netCDF format.

CDR Program HIRS Brightness Temperature C-ATBD CDRP-ATBD-0309 Rev. 3 06/19/2015
CDR Program HIRS Brightness Temperature C-ATBD CDRP-ATBD-0309 Rev. 3 06/19/2015
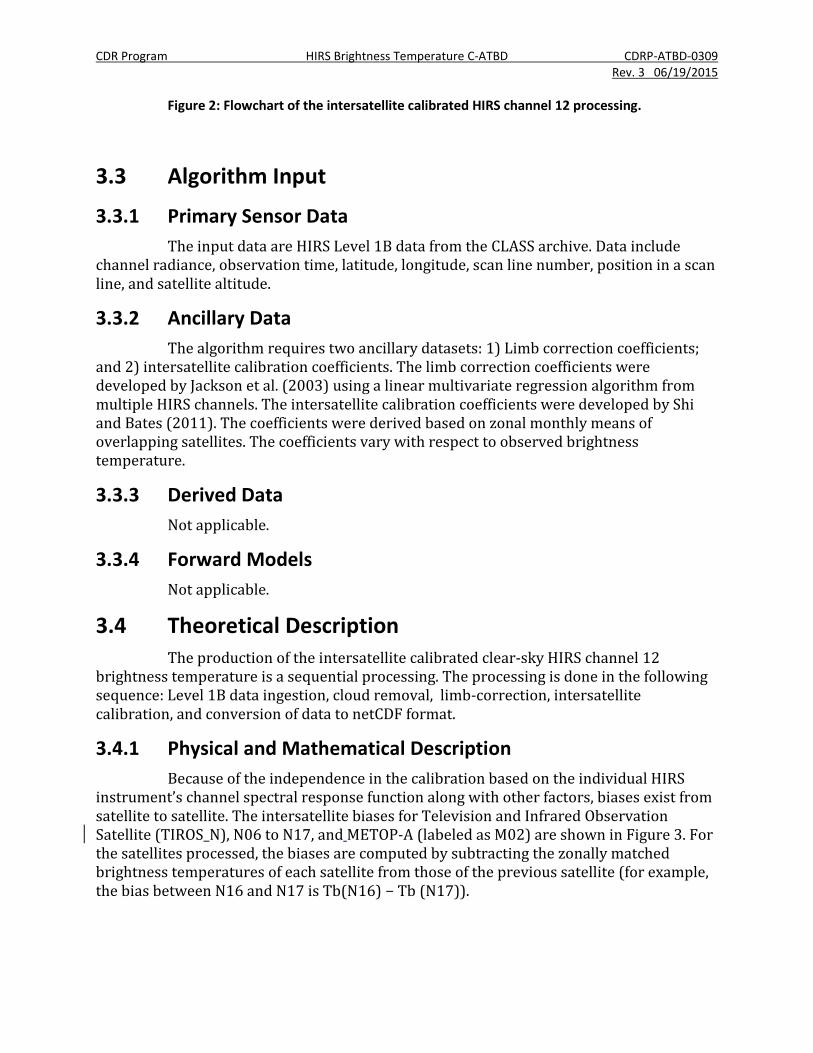
Figure 2: Flowchart of the intersatellite calibrated HIRS channel 12 processing.
3.3 Algorithm Input
3.3.1 Primary Sensor Data The input data are HIRS Level 1B data from the CLASS archive. Data include
channel radiance, observation time, latitude, longitude, scan line number, position in a scan line, and satellite altitude.
3.3.2 Ancillary Data The algorithm requires two ancillary datasets: 1) Limb correction coefficients;
and 2) intersatellite calibration coefficients. The limb correction coefficients were developed by Jackson et al. (2003) using a linear multivariate regression algorithm from multiple HIRS channels. The intersatellite calibration coefficients were developed by Shi and Bates (2011). The coefficients were derived based on zonal monthly means of overlapping satellites. The coefficients vary with respect to observed brightness temperature.
3.3.3 Derived Data Not applicable.
3.3.4 Forward Models Not applicable.
3.4 Theoretical Description The production of the intersatellite calibrated clear-sky HIRS channel 12
brightness temperature is a sequential processing. The processing is done in the following sequence: Level 1B data ingestion, cloud removal, limb-correction, intersatellite calibration, and conversion of data to netCDF format.
3.4.1 Physical and Mathematical Description Because of the independence in the calibration based on the individual HIRS
instrument’s channel spectral response function along with other factors, biases exist from satellite to satellite. The intersatellite biases for Television and Infrared Observation Satellite (TIROS_N), N06 to N17, and METOP‐A (labeled as M02) are shown in Figure 3. For the satellites processed, the biases are computed by subtracting the zonally matched brightness temperatures of each satellite from those of the previous satellite (for example, the bias between N16 and N17 is Tb(N16) − Tb (N17)).

CDR Program HIRS Brightness Temperature C-ATBD CDRP-ATBD-0309 Rev. 3 06/19/2015
Figure 3: Sequential intersatellite biases of HIRS channel 12 brightness temperatures for 11 pairs of satellites as functions of the brightness temperature.
As expected, bias values are very large between N14 and N15. This is caused by the channel frequency change from about 1480 cm−1 on N14 and earlier satellites to 1530 cm−1 on N15 and later satellites (as shown in Figure 1). Because of the frequency change, the sensors on N14 and N15 essentially observed water vapor at different heights, which lead to the large bias of more than 8 K at the warm temperature observations. Examinations showed that due to large channel frequency change the biases between N14 and N15 not only vary with brightness temperature values, but also vary along latitude zones. Therefore, one additional component, latitude, is added to the derivation of inter-calibration coefficients for N14 and N15.
For other satellite pairs with similar channel response functions, the biases are within the range of ±1.2 K. Many satellite pairs have bias variations of more than 0.5 K across the scene temperature ranges. Small bias values are found at the low brightness temperature range. The patterns of the temperature bias variations are very similar to the bias variations of SNO measurements as shown by Shi et al. [2008]. Basically, the temperature‐dependent biases shown in the low‐temperature range of SNO measurements are extended by the bias variation curves derived in the current study into the warm temperature range with the continued increasing or decreasing patterns. A comparison of the bias data set from current study with the SNO measurements reveals that at the

CDR Program HIRS Brightness Temperature C-ATBD CDRP-ATBD-0309 Rev. 3 06/19/2015
observation temperature of 220 K, the differences of biases between the two data sets are within 0.2 K for almost all satellite pairs (except for N14‐N15 because of large spectral change). However, the SNO measurements are limited to a much smaller temperature range over the polar regions, while the approach in the current study provides intersatellite bias data for the observations from 220 K to over 250 K.
3.4.2 Data Merging Strategy Not applicable for the pixel resolution dataset. For monthly mean data, data in
each grid area are averaged to form monthly means.
3.4.3 Numerical Strategy The limb correction and intersatellite calibration are performed to each
individual pixel. If there are missing data, the value for a grid point is designated as 999.
3.4.4 Calculations The HIRS channel 12 CDR production includes the following major steps:
1) Read Level 1B data
2) Perform cloud removal
3) Perform limb-correction on all longwave channels
4) Perform intersatellite calibration:
3.4.5 Look-Up Table Description The look-up tables for intersatellite calibration coefficients are included as part
of the source code package, developed based on the differences in zonal means of overlapping satellites (Shi and Bates, 2011). There is one look-up table for each pair of consecutive satellites. The inter-satellite biases are brightness temperature dependent. A look-up table contains a column of channel 12 brightness temperature at 2 K interval and the corresponding intersatellite bias at the ± 1 K range of the brightness temperature.
3.4.6 Parameterization None.

CDR Program HIRS Brightness Temperature C-ATBD CDRP-ATBD-0309 Rev. 3 06/19/2015
3.4.7 Algorithm Output
Table 1: Output of the intersatellite calibrated clear-sky HIRS channel 12 brightness temperature dataset, including its content, file format, unit, and estimated sizes.
Name Intersatellite calibrated clear-sky HIRS channel 12 brightness temperature
Content Global daily pixel resolution and monthly 2.5°x2.5° gridded time series from 1979 to the presently processed month.
File Format NetCDF4
Physical Unit Degrees K
Size Pixel resolution data are stored in daily files of individual satellites with a size of approximately 38MB each. Monthly data are stored in yearly files with a size of 0.5MB each.

CDR Program HIRS Brightness Temperature C-ATBD CDRP-ATBD-0309 Rev. 3 06/19/2015
4. Test Datasets and Outputs
4.1 Test Input Datasets There are no specific test data sets
4.2 Test Output Analysis
4.2.1 Reproducibility Running the processing codes to the input datasets, users should recover same
results except for rounding errors.
4.2.2 Precision and Accuracy The quality of data depends on instrument health. The HIRS sensor status is
recorded and provided online by NOAA Office of Satellite Operations at http://www.oso.noaa.gov/poesstatus/. When an HIRS instrument is having problems, the data from this instrument for the questionable time period are not processed.
4.2.3 Error Budget The goal of the intersatellite calibration is to minimize the intersatellite
differences. The remaining differences between each pair of overlapping satellites after the intersatellite calibration procedure are listed in Table 1. The list shows that the averaged differences are all near zero, and none of the averaged differences is larger than 0.1 K. It is important that the difference clusters of individual pairs of satellites are all closely grouped around 0 K. This ensures that the discontinuities among the uncorrected individual satellite series are minimized in the intercalibrated satellite series.
Table 2: Averaged remaining differences (K) of intersatellite calibrated monthly mean brightness temperatures between individual satellites for 30S to 30N latitudes.
Pairs T_N-N06
N06-N07
N07-N08
N09-N10
N10-N11
N11-N12
N12-N14
N14-N15
N15-N16
N16-N17
N17-M02
Ave. Diff. 0.076 -0.065 0.073 0.008 0.059 0.006 0.020 0.005 -0.024 0.050 0.020
CDR Program HIRS Brightness Temperature C-ATBD CDRP-ATBD-0309 Rev. 3 06/19/2015
5. Practical Considerations
5.1 Numerical Computation Considerations None.
5.2 Programming and Procedural Considerations None.
5.3 Quality Assessment and Diagnostics Quality assessment and diagnostics are based on
a. HIRS sensor status provided by NOAA Office of Satellite Operations, available at http://www.oso.noaa.gov/poesstatus/.
b. Comparison of output from overlapping satellites.
5.4 Exception Handling When problems are found based on the quality assessment and diagnostics of
5.3, affected data are removed from the time series.
5.5 Algorithm Validation The intersatellite calibration brings HIRS channel 12 brightness temperature
data to the level of a base satellite observation (NOAA-12 as the base satellite). Validation is done to check the homogeneity between overlapping satellites. Analyses show that the remaining differences between overlapping satellite are less than 0.1 K (Shi and Bates, 2011). Inter-comparisons with upper tropospheric water vapor channel data from other satellites, including METEOSAT and from AMSU-B are also performed (Yang 2014). For the comparisons the period from July 1983 – December 2009 and the region within ±20°N/S and ±45°E/W are used. High degree of yearly homogeneity is confirmed by the inter-comparisons.
5.6 Processing Environment and Resources HIRS data are processed on a Linux machine with ~16GB memory. Programming
languages include C, Fortran 77, and C Shell script. It takes about 20 hours to process one year of data. The processing needs ~15GB of disk space for one year’s input data per satellite and needs about the same amount of disk space for intermediate outputs.

CDR Program HIRS Brightness Temperature C-ATBD CDRP-ATBD-0309 Rev. 3 06/19/2015
6. Assumptions and Limitations The time series is based on clear-sky data only.
6.1 Algorithm Performance Not applicable.
6.2 Sensor Performance HIRS sensor status is provided by NOAA Office of Satellite Operations, available
at http://www.oso.noaa.gov/poesstatus/.

CDR Program HIRS Brightness Temperature C-ATBD CDRP-ATBD-0309 Rev. 3 06/19/2015
7. Future Enhancements When improved intersatellite calibration algorithm becomes available, the entire
time series will be re-processed.

CDR Program HIRS Brightness Temperature C-ATBD CDRP-ATBD-0309 Rev. 3 06/19/2015
8. References
Jackson, D.L., D.P. Wylie, and J.J.Bates (2003). The HIRS pathfinder radiance data set (1979-2001). 12th Conference on Satellite Meteorology and Oceanography, Am. Meteorol. Soc., Long Beach, Calif., 10-13 Feb.
Shi, L., and J. J. Bates (2011). Three decades of intersatellite-calibrated High-Resolution Infrared Radiation Sounder upper tropospheric water vapor. J Geophys Res-Atmos, 116.
Shi, L., J.J. Bates, and C. Cao (2008), Scene radiance dependent intersatellite biases of HIRS longwave channels. Journal of Atmospheric and Oceanic Technology, Volume 25, Issue 12 (December 2008) pp. 2219–2229 DOI: 10.1175/2008JTECHA1058.1
Yang, Q., (2014) Comparison of upper tropospheric humidity estimates from different instruments. EUMETSAT Satellite Application Facility on Climate Monitoring, CDOP2 VS Study: CM_AS13_02

CDR Program HIRS Brightness Temperature C-ATBD CDRP-ATBD-0309 Rev. 3 06/19/2015
Appendix A. Acronyms and Abbreviations
Acronym or Abbreviation
Meaning
C-ATBD Climate Algorithm Theoretical Basis Document
CDR Climate Data Record
HIRS High-Resolution Infrared Radiation Sounder
METOP-A Meteorological Operational Satellite Program
NCEI National Centers for Environmental Information
NOAA National Oceanic and Atmospheric Administration
SNO Simultaneous Nadir Overpass
TIROS-N Television Infrared Observation Satellite