climate change adaptation plan
TRANSCRIPT

CLIMATE CHANGE ADAPTATION AND RESILIENCY PLAN 2020 UPDATE
Executive Order 13834 Executive Order Regarding Efficient Federal Operations
DOE Partnership for Energy Sector Climate Resilience
Tennessee Valley Authority July 15, 2020

2
TVA Climate Change Adaptation and Resiliency Plan
Forward The Tennessee Valley Authority (TVA) was created in 1933 and charged with a unique mission to improve the quality of life in a seven-state region through the integrated management of the region’s resources. TVA is unique among power generators in that the Agency was created to both further economic development and protect the natural resources of the Tennessee Valley region. Today, the results of TVA’s efforts are apparent in the abundant natural resources in the region and the opportunities they afford.
TVA established its initial Climate Adaptation Statement in 2011, following the release of Executive Order (E.O.) 13514, Federal Leadership in Environmental, Energy and Economic Performance. The Statement was updated in 2014, following the release of EO 13693, Planning for Federal Sustainability in the Next Decade in 2013 and the Third National Climate Assessment (NCA3). Enhancing climate resilience means being able to plan and prepare for, absorb, recover from, and more successfully adapt to climate-related impacts. This updated 2020 Climate Change Adaptation and Resiliency Plan (Plan) includes the Fourth National Climate Assessment (NCA4). This plan provides TVA Planners with the analytical framework, references, tools and other guidance to understand how to consider climate change in their plans and projects and build resilience in the short and long term, including guidance on how to use climate projections that involve multiple future scenarios and different time periods in planning and project designs.
Adaptation and resilience planning reduces potential service interruptions, equipment damage, and associated costs. However, no standard method exists for climate adaptation and resiliency planning that meets all needs for all companies or agencies, each with a broad range of assets, climate- and weather-related risks, and levels of experience with climate change and extreme weather vulnerabilities. TVA continues to participate in research toward this goal. In the meantime, TVA;s individual assessments and plans will reflect this range and will vary in terms of detail and analytical depth in characterizing priority vulnerabilities and identifying cost-effective solutions. Ongoing efforts to address gaps in data, methodologies, tools and other resources are occurring at academic, government, and industry organizations. The continued communication of data sharing, coordination on research best practices, and resilience solutions and needs contained in this guidance helps TVA more effectively leverage its resources and strengthen knowledge and projections to improve Agency resilience.
TVA will continue to leverage actions that enhance resilience to climate change and extreme weather that also contribute to reduced GHG emissions. For example, measures that enhance energy efficiency and reduce energy demand improve resilience to increasing heat waves as well as reduce GHG emissions. Distributed generated clean energy sources also offer climate mitigation and resilience efforts, improving system resilience to reduced water availability for energy generation and increased occurrences of drought. Combined heat and power (CHP), which improves energy efficiency by reusing waste heat, can also improve resilience and reduce emissions. In addition, smart grid, micro grids, and distributed generation systems add resiliency within local distribution systems and may reduce the number of outages, the number of users affected by each outage, and the duration of outages. Locations with micro grids may also have key services, including places of refuge, up and running more quickly following an outage.
TVA has continued its efforts to ensure climate change adaptation and resiliency is integrated into both agency-wide and regional planning efforts, in coordination with other Federal agencies as well as state and local partners, tribal governments and private stakeholders. Examples include:
• The Climate Change Sentinel Monitoring (CCSM) program was started in April 2013 by TVA with partners Valley-wide. The goal of this program is to monitor readings taken at 18 stations throughout the Tennessee River watershed to assess potential biological, ecological and hydrological responses of aquatic ecosystems related to climate change.
• Participation in the Appalachian Landscape Conservation Cooperative (AppLCC) and communication of
the findings of the AppLCC climate resilience assessment for aquatic habitats through the Tennessee River Basin Biodiversity Network (TRBBN).

3
• Testing the resilience of our reservoir system in the face of extreme droughts. We are sponsoring the
University of Tennessee to create a ~600-year reconstruction of rainfall within our watershed based on tree ring analysis. This historical reconstruction will test the resilience of our policies and intake equipment against the largest historical doubts that we can find. TVA will use this information to help us increase the resilience of both our reservoir operations and the operations of the water utilities and industries that rely on us for water. Testing the system against extended droughts will help TVA prepare appropriately should climate change lead to such a drought.
• Utilization of a state-of-the-art stochastic flood event model to create thousands of realistic extreme
floods. These floods are routed through TVA’s reservoir operation model to determine the effect they would have on TVA’s infrastructure as well as other infrastructure built near the river. Statistical techniques built into the software allows us to understand the likelihood of these events, as well as the magnitude. This information is much richer than the information that TVA has utilized in the past, and is allowing TVA to improve decisions on where and how to invest to reduce flood risk the most. We are improving our flood resilience, which will be a valuable climate change adaptation, should floods increase in the future.
• In May 2017, the TVA Board approved a $300 million multi-year, strategic fiber initiative that will expand TVA’s fiber capacity and improve the reliability and resiliency of the transmission system. The network expansion is designed to meet the power system’s growing need for bandwidth as accommodate the integration of new, distributed energy resources.
• Included a climate change scenario to model the effects of increasing temperatures on the load forecast. They modelled assumptions from the RCP 8.5, the most extreme of the IPCC's scenarios, using data acquired through partnership with ORNL's Climate Change Science Institute. This data came from an ensemble of several supercomputer models from around the world. Under the RCP 8.5 scenario, TVA's region would see more warming at nighttime and in the winter. These increased temperatures would translate to about 1% higher annual energy, and about 2% lower annual peaks. Additionally, the models estimate the effects of climate change on precipitation, estimating wetter springs, but drier summers. Additional work will model how climate change impacts other parts of TVA's business.
While the scope, severity and pace of future climate change impacts are difficult to predict, the goal of TVA’s adaptation and resiliency planning is to ensure TVA continues to achieve its mission and program goals and to operate in a secure, effective and efficient manner in a changing climate. This Plan sets forth a flexible approach to climate adaption in preparing for a range of climate change impacts and extreme weather. While some progress has been made, the need for better data, metrics, and analytical frameworks to help build resilience, reliability, and security in the energy sector remains. The flexible framework presented in this Plan continues to pave the way for TVA to move forward in making TVA’s systems more resilient and can ultimately reduce costs.
Rebecca Tolene Vice President, Environment Chief Sustainability Officer Tennessee Valley Authority

4
TVA CLIMATE CHANGE ADAPTATION AND RESILIENCY PLAN
EXECUTIVE SUMMARY
The goal of TVA’s adaptation and resiliency planning process is “to ensure the Agency continues to achieve its mission and program goals and to operate in a secure, effective and efficient manner in a changing climate.”1 Weather effects associated with climate change represent budgetary risk. Adaptation and resilience planning can reduce potential service interruptions, equipment damage, and associated costs. While no individual weather event can be definitively linked to climate change, particular weather events can demonstrate the vulnerability of TVA facilities. TVA’s Climate Adaptation and Resiliency Plan is intended to provide its planners with the analytical framework, references, tools and other guidance to:
1. Understand how to consider climate change in their plans and projects--including guidance on how to use climate projections that involve multiple future scenarios and different time periods in planning and project designs, and
2. Consider both short-term and long-term vulnerabilities and balance tradeoffs. TVA established its initial Statement on Climate Adaptation in 2011. TVA continues to maintain its Adaptation and Resiliency Plan consistent with Executive Order 13834, Regarding Efficient Federal Operations, as well as its ongoing voluntary participation in the DOE Energy Sector Climate Resiliency Partnership. In accordance with its 2020 TVA Statement on Climate Change Adaptation, this Climate Change Adaptation and Resiliency Plan (Plan) has been updated to include the Fourth National Climate Assessment (NCA4). With each Plan update, TVA continues to improve its climate adaptation and resiliency planning efforts with more detailed and updated information on stakeholder concerns, management objectives, resource availability (natural, human and financial), science and technology and other dynamic factors. Ongoing efforts to address gaps in data, methodologies, tools and other resources are underway at TVA, and at academic, government, and industry organizations across the country. Continued communication, data sharing, and coordination on research best practices, resilience solutions and needs will continue to help leverage resources, strengthen knowledge and projections, and improve resilience.
TVA manages the effects of climate change on its mission, programs and operations within its environmental management processes. TVA’s Environmental Policy establishes a framework to guide its decision-making and future strategic development in meeting its environmental objectives, including climate change mitigation, adaptation and resiliency. Specific mitigation and adaptation analyses are incorporated in TVA’s primary planning processes; including TVA’s Integrated Resource Plan (IRP) and Natural Resource Plan (NRP). As a federal agency, TVA must also apply with the National Environmental Policy Act (NEPA). Adaptation and resiliency planning can be complex. Solutions will differ depending on context, local circumstance, and scale as well as on local culture and internal capacity. Where changing external conditions affect planning decisions, planners should seek to understand, monitor, and adapt to these changes--including changes in extreme weather and climatic conditions such as temperature, rainfall patterns, storm frequency and intensity, and water levels.
TVA continues its efforts to ensure climate change adaptation and resiliency is integrated into both agency-wide and regional planning efforts, in coordination with other Federal agencies as well as state and local partners, Tribal governments and private stakeholders.

5
Examples include:
1. Climate Change Sentinel Monitoring: Continuing TVA's Climate Change Sentinel Monitoring (CCSM) program started in April 2013, with 18 stations are being monitored by TVA and partners throughout the Tennessee River watershed. TVA worked with the Southeast Monitoring Network to select long-term monitoring stations and establish agreed upon monitoring protocols for the program. The goal of the program is to assess potential biological, ecological, and hydrological responses of aquatic ecosystems related to climate change. CCSM is a component of TVA’s Natural Resource Plan, which outlines TVA’s resource stewardship responsibilities for the future.
2. Appalachian Landscape Conservation Cooperative: TVA continues to participate in the Appalachian Landscape Conservation Cooperative (AppLCC) and communicates the findings of the AppLCC climate resilience assessment for aquatic habitats through the Tennessee River Basin Biodiversity Network (TRBBN).
3. Partnership for Energy Sector Climate Resilience: TVA is one of 18 electric utilities participating in DOE’s Partnership for Energy Sector Climate Resilience. This Partnership is an initiative to enhance U.S. energy security by improving the resilience of energy infrastructure to extreme weather and climate change impacts. As part of its participation with DOE’s Partnership for Energy Sector Climate Resilience, the Rhodium Group has supplied TVA with actionable, granular data specifically tailored to TVA’s assets and service territory on climate change impacts for planning purposes. TVA has made these climate projections available to all its employees through additional layers in its internal GIS application. Climate projections are derived from the results of Houser et al. (2015)2 which assess three potential future climate scenarios (RCP 2.6, RCP 4.5 and RCP 8.5).
4. Climate Projection Data: As part of its participation with DOE’s Partnership for Energy Sector Climate Resilience, the Rhodium Group supplied TVA with actionable, granular data specifically tailored to TVA’s assets and service territory on climate change impacts for planning purposes. TVA has made these climate projections available to all employees through its internal GIS application. Climate projections are derived from the results of Houser et. al. (2015)3 which assess three potential future climate scenarios (RCP 2.6, RCP 4.5 and RCP 8.5).
5. Water Reliability Study: TVA is testing the resilience of our reservoir system in the face of extreme droughts. We are sponsoring the University of Tennessee to create a ~600-year reconstruction of rainfall within our watershed based on tree ring analysis. This historical reconstruction will test the resilience of our policies and intake equipment against the largest historical doubts that we can find. TVA will use this information to help us increase the resilience of both our reservoir operations and the operations of the water utilities and industries that rely on us for water. Testing the system against extended droughts will help TVA prepare appropriately should climate change lead to such a drought.
6. Probabilistic Flood Hazard Analyses: In these studies, TVA is utilizing a state-of-the-art stochastic flood event model to create thousands of realistic extreme floods. These floods are routed through TVA’s reservoir operation model to determine the effect they would have on TVA’s infrastructure as well as other infrastructure built near the river. Statistical techniques built into the software allows us to understand the likelihood of these events, as well as the magnitude. This information is much richer than the information that TVA has utilized in the past, and is allowing TVA to improve decisions on where and how to invest to reduce flood risk the most. We are improving our flood resilience, which will be a valuable climate change adaptation, should floods increase in the future.
7. Climate Sensitive Demand Forecast. Load forecasting included a climate change scenario to model the effects of increasing temperatures on the load forecast. They modelled assumptions from the RCP 8.5, the most extreme of the IPCC's scenarios, using data acquired through partnership with ORNL's Climate Change Science Institute. This data came from an ensemble of several supercomputer models from around the world. Under the RCP 8.5 scenario, TVA's region would see more warming at nighttime and in the winter. These increased temperatures would translate to about 1% higher annual energy, and about 2% lower annual peaks. Additionally, the models estimate the effects of climate change on precipitation, estimating wetter springs, but drier summers. Additional work will model how climate change impacts other parts of TVA's business.

6
TVA’s Chief Sustainability Officer is responsible for this Plan. This update describes TVA’s activities to evaluate the most significant climate change related risks to, and vulnerabilities in, Agency operations and missions in both the short and long term, and outlines actions that TVA is taking to manage these risks and vulnerabilities. It describes the climate adaptation and resiliency programs, policies, processes and plans that TVA already has in place, as well as information about our progress on additional projects that help manage climate risks and build resilience in the short and long term. Section 3.0, Table 1 summarizes the key high-level adaptation risks and opportunities to TVA's mission, programs, and operations in the short- and long-term. The risks and opportunities analyzed are within the ranges considered by TVA's current planning and evaluation processes as discussed in Section 4.0 The assessment guidance presented in Section 5.0 in this Plan is consistent with applicable DOE Partnership for Energy Sector Climate Resilience guidance for electric utilities. The assessment guidance presented in this Plan is not determinative. It is designed to assist Agency planning processes relating to climate vulnerability assessment analysis. Any specific risks considered and further analysis required are determined by the applicable Agency planning process and will vary by location and asset mix.

7
Part 1. POLICY AND PLANNING 1.0 TVA'S CLIMATE CHANGE ADAPTATION POLICY FRAMEWORK
1.1 TVA’s Statement on Climate Change Adaptation and Resiliency TVA adopted its first internal statement on climate change adaptation in 2011 and last updated it in 2020. The purpose of TVA’s statement is to provide an adaptation and resiliency planning goal and to better understand the challenges and opportunities a changing climate may present to its mission and operations. The goal of TVA's adaptation and resiliency planning process is to ensure TVA continues "to achieve its mission and program goals and to operate in a secure, effective and efficient manner in a changing climate." 1.2 Electric Utility Climate Adaptation and Resiliency
The electric grid is essential to the operation of many infrastructures, as it exists at the center of failure modes that are borne of interdependencies between the grid and those infrastructures. TVA is exposed to a wide range of high-impact events. The Department of Homeland Security has identified 16 critical U.S. infrastructure sectors as highly dependent upon electricity. All 16 critical U.S. infrastructure sectors depend on electricity. These critical infrastructures are: • Chemical • Commercial facilities • Communications • Critical manufacturing • Dams • Defense industrial base • Emergency services • Energy • Financial services • Food and agriculture • Government facilities • Healthcare and public health • Information technology • Nuclear reactors, materials and waste • Transportation systems • Water and wastewater systems
Resilient utilities: • Coordinate with the operators of these infrastructures before and during extreme events to ensure that
as many infrastructure services as possible are provided to as many people as possible. • Operate in a manner that reduces risk, especially in immediate preparation for and response to disruption. • Shift the objective of operations during extreme events away from cost and reliability, and toward
response and recovery, in a manner that contributes to longer-term resilience. • Enable operators to work in tighter coordination with advanced technologies in order to improve
situational awareness and human decision making during major disruptions.

8
The standardization of metrics for other power system characteristics such as reliability has enabled streamlined and widespread adoption across the industry. Unlike reliability metrics, there are currently no established or agreed-upon resiliency metrics. Despite growing concern over the critical need to address resiliency, a 2018 EPRI study concluded current resiliency efforts and analytical frameworks are diverse and lack a unifying perspective—that is, there is currently no standardized framework for assessing resiliency levels or evaluating investment options.4 In January 2018, the Federal Energy Regulatory Commission (FERC) asked for comments on the definition of resiliency as part of Docket No. AD18-7-000, which seeks to evaluate the resilience of the bulk power system in regions operated by regional transmission organizations (RTOs) and independent system operations (IRSOs). The National Infrastructure Advisory Council (NIAC) definition of resiliency appears to have gained traction in the industry particularly among regulatory stakeholders. In the proceeding, FERC proposed that resilience means the “ability to withstand and reduce the magnitude and/or duration of disruptive events, which includes the capability to anticipate, absorb, adapt to, and/or rapidly recover from such an event.”
Figure 1 originates from the 2010 National Infrastructure Advisory Council (NIAC) report, A Framework for Establishing Critical Resilience Goals, where NIAC first presented its definition of resiliency.5 NIAC identified four features of a resilient system-- robustness, resourcefulness, rapid recovery, and adaptability-- and has adopted these features in its own resilience framework.
• Robustness refers to the ability of a system to absorb shocks and keep operating. • Resourcefulness refers to the ability to manage the disruption in a way that minimizes
impact. • Rapid recovery aims to return the system to normal operations as quickly as possible. • Adaptability acknowledges that systems may need to be modified over time to
incorporate lessons learned and respond to changing conditions
Figure 1. NAIC Resiliency Definition
The definitions presented above help clarify the target of emerging resiliency metrics. While reliability and resiliency are related, they are distinct in important ways:
• Reliability relates to high-probability, low-impact disruptions, whereas • Resiliency deals with high-impact, low-probability events. Fundamentally, resiliency is a
characteristic of a system, but as a multi-dimensional concept, must be defined within a particular concept.

9
1.3 TVA’s Climate Adaptation and Resiliency Plan
The assessment guidance presented in this Plan is intended to be consistent with applicable voluntary DOE Partnership for Energy Sector Climate Resilience guidance for electric utilities. This guidance is not determinative and is intended to assist Agency planning processes relating to climate vulnerability assessment analysis. Any specific risks considered and further analysis required will be determined by the applicable Agency planning process and will vary by location and asset mix.
1.4 Climate Adaptation and Resiliency Integrated Planning Hierarchy
TVA manages the effects of climate change on its mission, programs, and operations within its environmental management processes. TVA’s primary planning processes are its Integrated Resource Plan (IRP) and its Natural Resource Plan (NRP). As a Federal agency, TVA must also comply with the National Environmental Policy Act (NEPA) as well as applicable Executive Orders. Environmental goals are an integral part of how TVA does business and are tracked along with its other business objectives. Per its participation in the DOE Partnership for Energy Sector, Climate Resilience, TVA has completed a high-level climate change vulnerability assessment. TVA's adaptation planning activities are summarized in Figure 2. Figure 2: Climate Adaptation and Resiliency Planning Is Integrated Into TVA's Planning Hierarchy

10
1.5 Climate Adaptation and Resiliency Planning Analytical Framework TVA’s climate adaptation and resiliency planning analytical framework is a three-part process:
1. Defining the scope, of which the identification of goals is a critical process starting point; 2. Completing the vulnerability assessment, which involves determining where and under what conditions
the system is vulnerable; 3. Developing the resilience plan, to improve resilience based on information generated or assembled during
the vulnerability assessment, including the probability of adverse climate events, threshold conditions likely to affect important assets or overall system performance and the consequences or costs of climate impacts.
The three-part, eight-step DOE Climate Resilience Planning Framework, as shown in Figure 3, supports TVA’s commitment to resiliency and continuous improvement. To accommodate user needs and preference, a brief Framework checklist has been provided as Appendix A and a more detailed checklist as Appendix B. Conducting vulnerability assessments and developing resilience solutions within TVA planning processes are usually iterative. Information gathered on assets may inform climate information needs and vice versa. Users should follow the steps in the sequence presented, as each step builds on the previous one. However, as more information becomes available during this process, users may find it useful to repeat entire or individual parts of previous steps to more effectively inform the overall TVA planning process.
Figure 3. DOE Climate Resilience Planning Framework

11
1.6 Applicable Guidance, Science and Tools This Plan has been updated to reflect NCA4. Links to applicable science, data and tools are maintained on TVA’s internal Resiliency and Adaptation SharePoint site. As part of its participation with DOE’s Partnership for Energy Sector Climate Resilience, the Rhodium Group has supplied TVA with actionable, granular data specifically tailored to TVA’s assets and service territory on climate change impacts for planning purposes. TVA has made these climate projections available to all its employees through additional layers in its internal GIS application. Climate projections are derived from the results of Houser et al. (2015)6 which assess three potential future climate scenarios (RCP 2.6, RCP 4.5 and RCP 8.5). In a separate effort, TVA continues to collaborate with Oak Ridge National Lab (ORNL) on climate-related data sets appropriate for various planning activities.

12
2.0 CLIMATE CHANGE RISKS AND OPPORTUNITIES 2.1 Overview The Tennessee Valley Authority (TVA) was created in 1933 and charged with a unique mission to improve the quality of life in a seven state region through the integrated management of the region’s resources. As it helped lift the Tennessee Valley out of the Great Depression and improved the overall resilience of the region, TVA built dams for flood control, improved waterways for commercial shipping, pioneered development of the fertilizer industry, restored depleted lands, provided some of the lowest-cost power in the Nation, and raised the standard of living across the region.
The goal of TVA’s adaptation and resiliency planning is to ensure TVA continues to achieve its mission and program goals and to operate in a secure, effective and efficient manner in a changing climate. As times have changed, TVA has continued to advance, meeting new challenges and responding to new opportunities. Today, TVA continues to serve the people of the Tennessee Valley through its work in three areas: Energy, Environment, and Economic Development. • Energy: We power the Valley so it may grow and thrive. TVA supplies safe, clean, reliable, affordable power to the Tennessee Valley region’s homes and businesses, working with local power companies to deliver power at the lowest feasible cost. TVA strives to meet the changing needs of local power companies and directly served industrial and federal customers for electricity and related products and services in a dynamic marketplace. • Environment: We are stewards of the region’s waterways and surrounding lands. TVA’s mission of service includes the wise use and preservation of the region’s natural resources. It manages the Tennessee River system and associated public lands to reduce flood damage, maintain navigation, support power production and recreational uses, improve water supply and air quality and protect natural, cultural and historical resources. • Economic Development: We serve the Valley by attracting jobs and investment to our region. From the beginning, TVA was charged with improving the economic resiliency of the Tennessee Valley region and providing its people with a better opportunity to prosper. TVA works with local power companies; state, regional, and local economic development organizations; and federal agencies to build partnerships that help recruit capital and jobs to the Tennessee Valley and keep power bills lower for our homes, businesses and industries.
Initially, all TVA operations were funded by federal appropriations. Direct appropriations for the TVA power program ended in 1959, and appropriations for TVA's land and water, stewardship, management of the Tennessee River and watershed, economic development and multipurpose activities ended in 1999. Since 1999, TVA has funded all of its operations almost entirely from the sale of electricity and power system financings. The TVA Board also established a Regional Resource Stewardship Council (RRSC) under the Federal Advisory Council Act to advise TVA on its stewardship activities. In 2013, TVA also created a new Regional Energy Resource Council (RERC) under the Federal Advisory Council Act to advise TVA on its energy resources planning activities. More detailed information about TVA's programs can be found in the annual reports (10-Ks), quarterly reports (10-Qs) and current reports (8-Ks) TVA files with the Security Exchange Commission. View TVA Securities and Exchange Commission filings.

13
2.2 Governance TVA is governed by a nine-member Board of Directors appointed by the President of the United States with the advice and consent of the United States Senate. The Chair of the TVA Board is selected by the members of the TVA Board. As provided by the TVA Act and the TVA Bylaws, the principle responsibilities of the Board are to establish broad strategies, goals and objectives; to set long-range plans and policies; and to ensure their implementation by the TVA staff, which is led by the Chief Executive Officer.
2.3 Risk Governance The Enterprise Risk Council (“ERC”) is responsible for the highest level of risk oversight at TVA and is also responsible for communicating enterprise-wide risks with policy implications to the TVA Board or a designated TVA Board committee. The ERC is comprised of the Executive Management Committee (“EMC”) and the Chief Risk Officer (“CRO”) who acts as Chair.
TVA's Chief Sustainability Officer (CSO) is responsible for ensuring implementation of all aspects of TVA’s Climate Adaptation and Resiliency Statement, its periodic reviews and updates to confirm it remains relevant. TVA's CSO and Business Unit Leaders and Representatives are tasked with aligning adaptation planning goals and initiatives with their annual business planning process. Alignment with business planning ensures that resources are used most efficiently and opportunities to maximize sustainability benefits are identified and realized.
This Plan provides the analytical framework, references, tools and other guidance to help TVA planners understand how to consider climate change in their plans and projects and build resilience in the short and long term-- including guidance on how to use climate projections that involve multiple future scenarios and different time periods in planning and project designs.
Environmental goals are an integral part of how TVA does business and are tracked along with its other business objectives. TVA's major long-term environmental planning processes include its Integrated Resource Plan (IRP) and its Natural Resource Plan (NRP). Other applicable TVA planning processes include Reservoir Land Management Plans and the TVA Shoreline Management Policy. As a Federal agency, TVA must also comply with the National Environmental Policy Act (NEPA), as well as applicable Executive Orders.
These major long-term planning process must include:
1. an assessment of the risks from extreme weather and climate change effects that are specific to the plan as granular as practicable; and
2. plans to address those risks as appropriate. A discussion of TVA’s significant risks is presented in TVA’s 10-K, Item 1A, Risk Factors.

14
2.4 Presidential Directives
For the purpose of this document, resilience is broadly defined through two Presidential Directives:
• Presidential Policy Directive 8 on National Preparedness defines resilience as “the ability to adapt to changing conditions and withstand and rapidly recover from disruption due to emergencies.”
• Presidential Policy Directive 21 on Critical Infrastructure Security and Resilience expanded the definition to include the “ability to prepare for and adapt to changing conditions and to withstand and recover rapidly from disruptions.” Furthermore, it states, “resilience includes the ability to withstand and recover from deliberate attacks, accidents, or naturally occurring threats or incidents.”
More generally, electric utility resilience is focused on providing some level of power to the community, regardless of disruptions. Operations at pre-disruption levels may not be immediately possible, but impacts to the community can be reduced even when operating at reduced levels.7 A notional quantitative representation of system performance and recovery effort is shown in Figure 4. Figure 4. Graphical representation of system impact for a hypothetical system disruption. SP is system performance, TSP is targeted system performance, and RE is recovery effort. Figure from Vugrin, Warren and Ehlen, 2011.
2.5 Description of TVA's Programs
2.5.1 Low Cost, Reliable Power TVA is primarily a wholesaler of electricity. TVA provides electricity in a service area that is largely free of competition from other electric power providers. This service area is defined primarily by provisions of law and long-term contracts. The “TVA fence” limits the region in which TVA or LPCs which distribute TVA power may provide power. The anti-cherry picking provision limits the ability of others to use the TVA transmission system for the purpose of serving customers within TVA’s service area. State service territory laws limit unregulated third parties’ ability to sell electricity to customers.
All TVA wholesale power contracts and many contracts between LPCs and their customers are requirements contracts. However, other utilities may use their own transmission lines to serve customers within TVA’s service area, and third parties are able to avoid the restrictions on serving end-use customers by selling or leasing a customer generating assets rather than electricity. These threats underscore the need for TVA to strategically price its products and services and design rates to be competitive. There have also been some efforts in the past to erode the anti-cherry picking provision, and the protection of the anti-cherry picking provision could be limited and perhaps eliminated by congressional legislation at some time in the future.

15
Power generating facilities operated by TVA on September 30, 2019, included three nuclear sites, 17 natural gas and/or oil-fired sites, six coal-fired sites, 29 conventional hydroelectric sites, one pumped-storage hydroelectric site, one diesel generator site, and 14 solar energy sites, although certain of these facilities were out of service as of September 30, 2019. TVA also acquires power under power purchase agreements of varying durations including short-term contracts of less than 24-hours in duration.
TVA is scheduled to complete the Hydro Modernization Program in 2020 with the completion of South Holston Unit 1 and Pickwick Landing Dam Unit 2. The Hydro Modernization Program began in 1992 and focuses on units with potential to increase peaking capacity and improve reliability. As of September 30, 2019, modernization had been completed on 61 conventional hydroelectric units. The modernization projects resulted in 447 MW of increased capacity from the conventional hydroelectric units, with an average efficiency gain of approximately five percent. In 2019, TVA began its transition to a new program, the Hydro Major Maintenance Program, intended to focus on life extension and addressing reliability risks that will support the preservation of TVA’s hydroelectric fleet capacity. Hydroelectric generation will continue to be an important part of TVA’s energy mix.
Under federal law, TVA is required to purchase energy from qualifying facilities (cogenerators and small power producers) at TVA’s avoided cost of either generating this energy or purchasing this energy from another source. TVA fulfills this requirement through the Dispersed Power Production Program. As of September 30, 2019, there were 55 generation sources, with a combined qualifying capacity of 263 MW, whose power TVA purchases under this law.
TVA intends to balance production capabilities with power supply requirements by promoting the conservation and efficient use of electricity and, when necessary, buying, building, or leasing assets or entering into power purchase agreements. TVA also intends to employ a diverse mix of energy generating sources and is working toward obtaining greater amounts of its power supply from clean (low or zero carbon emitting) resources.
The TVA transmission system is one of the largest in North America. TVA's transmission system has 69 interconnections with 13 neighboring electric systems, and delivered nearly 158 billion kWh of electricity to TVA customers in FY2019. In carrying out its responsibility for grid reliability in the TVA service area, TVA has operated with 99.999 percent reliability since 2000 in delivering electricity to customers.
Transmission assets have been reviewed using FEMA flood data as layers in TVA’s internal GIS map. Multiple flood hazards considered include (100 year flood; regulatory floodway, special flood way, 500 year flood, future conditions 100 year flood; TVA’s zone A probable maximum flood for the Tennessee River. Assets are relocated as practicable to areas that will not flood.
Wood poles have been replaced with steel for new construction and preventative maintenance, including the use of robust alumoweld shield wire. Icing criteria is applied to minimize faults when reenergizing. A steel inventory plan has been developed for restoration using a limited number of standard TVA tower types to reduce inventory. TVA has collaborated with U.S. Army Cold Region Research and Engineering Laboratory to create the Region 2 Ice Maps as a basis for NESC 2050D-Extreme Ice.
TVA also faces competition in the form of emerging technologies. Improvements in energy efficiency technologies, smart technologies, and energy storage technologies may reduce the demand for centrally provided power. The growing interest by customers in generating their own power through distributed generation (including solar power) has the potential to lead to a reduction in the load served by TVA, as well as cause TVA to re-evaluate how it operates the overall grid system to continue to provide highly reliable power at affordable rates.
Finally, customers, TVA, and other utility companies are facing an evolving marketplace of increased competition driven by choice and behavior. As technology develops, customers’ demands for access to diverse products and services may increase, creating opportunities for growth with new products and services resulting from emerging technologies.
16
2.5.2 Environmental Stewardship TVA's mission includes managing the Tennessee River, its tributaries, and public lands along the shoreline to provide, among other things, year-round navigation, flood damage reduction, affordable and reliable electricity, and, consistent with these primary purposes, recreational opportunities, adequate water supply, improved water quality, and natural resource protection. TVA's Environmental Policy provides objectives for an integrated approach related to providing cleaner, reliable, and affordable energy, supporting sustainable economic growth and engaging in proactive environmental stewardship. The Environmental Policy and Natural Resource Plan provide additional direction in several environmental stewardship areas, including water resource protection and improvements, sustainable land use, and natural resource management. TVA also manages approximately 11,000 miles of shoreline, 650,000 surface acres of reservoir water, and 293,000 acres of reservoir lands for cultural and natural resource protection, recreation, and other purposes.
2.5.3 Economic Development Since its creation in 1933, TVA has promoted the development of the Tennessee Valley. Economic development, along with energy production and environmental stewardship, is one of the integrated purposes of TVA. TVA works with its LPCs, regional, state, and local agencies and communities to showcase the advantages available to businesses locating or expanding in TVA's service area. TVA's primary economic development goals are to recruit major industrial operations to locate in the Tennessee Valley, encourage the location and expansion of companies that provide quality jobs, prepare communities in the Tennessee Valley for economic growth, and offer support to help grow and sustain small businesses.
Economic development programs developed by TVA include those that focus on supporting all communities, including rural and economically distressed communities, across the Tennessee Valley by working in close partnership with other federal and state organizations. TVA also jointly offers incentive programs with participating LPCs. These programs offer competitive incentives to both existing and potential power customers in certain business sectors that make multi-year commitments to invest in the Tennessee Valley. In addition to financial support for these programs, TVA offers resources to communities and economic developers in the areas of recruitment, leadership development, industrial product preparedness (sites and buildings), planning, and project assistance. TVA seeks to meet these goals through a combination of initiatives and partnerships designed to provide financial assistance, technical services, industry expertise, and site-selection assistance to new and existing businesses.
TVA's economic development efforts helped recruit or expand over 215 companies into the TVA service area during FY2019. These companies announced capital investments of over $8.9 billion and the expected creation and/or retention of over 66,500 jobs.
2.5.4 River Management, Flood Control, and Drought Activities
TVA manages the Tennessee River, its tributaries, and public lands along the shoreline to provide, among other things, year-round navigation, flood damage reduction, affordable and reliable electricity and, consistent with these primary purposes, recreational opportunities, adequate water supply, improved water quality, and natural resource protection. TVA's integrated reservoir system provides 800 miles of commercially navigable waterways and significant flood reduction benefits both within the Tennessee River system and downstream on the lower Ohio and Mississippi Rivers. The reservoir system also provides a water supply for residential, municipal and industrial customers, as well as cooling water for some of TVA's coal-fired and nuclear power plants.
The Tennessee River watershed has one of the highest annual rainfall totals of any watershed in the United States, averaging 51 inches per year. During 2019, approximately 67 inches of rain fell in the Tennessee Valley. TVA manages the Tennessee Rivers system in an integrated manner, balancing hydroelectric generation with navigation, flood damage reduction, water quality and supply, and recreation. TVA spills or releases excess

17
water through its dams in order to reduce flood damage to the Tennessee Valley. TVA typically spills only when all available hydroelectric generating turbines are operating at full capacity and additional water still needs to be moved downstream.
Significant flooding occurred in portions of the Tennessee Valley in February 2019. During this time, the Tennessee Valley received 11.6 inches of rainfall, which was 269 percent of normal. Although many locations along the Tennessee River reached or exceeded flood stage, TVA’s efforts, including storing water in large tributary reservoirs, accounted for approximately $1.6 billion in avoided damages in areas such as Chattanooga, Tennessee.
In 2009, updates to the TVA analytical hydrology model completed indicated that under "probable maximum flood" conditions, some of TVA's dams might not have been capable of regulating the higher floodwaters. A "probable maximum flood" is an extremely unlikely event; however, TVA is obligated to provide protection for its nuclear plants against such events. As a result, TVA installed a series of modifications at four dams.
Since 2009, TVA has performed further hydrology modeling of portions of the TVA watershed using updated modeling tools. The revised hydrology models were reviewed and approved by the NRC for Watts Bar Units 1 and 2. However, TVA identified an error in the modeling that will require the models for Watts Bar Units 1 and 2 to be resubmitted. TVA resubmitted models for Watts Bar Units 1 and 2 during the first quarter of 2020. TVA also submitted models for Sequoyah Nuclear Plant ("Sequoyah") Units 1 and 2 during the first quarter of 2020. TVA will subsequently address conditions at Browns Ferry as needed. TVA is deferring the decision on the need for additional modifications until after the modeling work is complete. As of September 30, 2019, TVA had spent $153 million on the modifications and improvements related to extreme flooding preparedness and expects to spend up to an additional $27 million to complete the modifications.
TVA has an established dam safety program, which includes procedures based on the Federal Guidelines for Dam Safety, with the objective of reducing the risk of a dam safety event. The program is comprised of various engineering activities for all of TVA's dams including safety reassessments using modern industry criteria and the new probable maximum flood and site-specific seismic load cases. One aspect of the guidelines is that dam structures will be periodically assessed to assure that TVA's dams meet current design criteria. These assessments include material sampling of the dam and foundational structures and detailed engineering analysis. TVA will continue preventative and ongoing maintenance as a part of this safety program.
TVA tracks what might have happened had it never existed as a way of keeping track of how well its system is operating. TVA's sophisticated system of dams control flooding along the Tennessee River watershed, and each year it prevents about $280 million in flood damage in the TVA region and along the Ohio and Mississippi Rivers. To date, the operation of this system has prevented over $7.9 billion in flood losses across the Tennessee Valley, including about $7.2 billion in damage averted in Chattanooga—the Valley’s most flood-prone city. (The system has also prevented about $722 million in flood losses in the lower Ohio and Mississippi River drainage basins.)
2.5.6 Technological Innovation
Investments in TVA’s research portfolio are supported through partnership and collaboration with LPCs, EPRI, DOE, federal agencies, national labs, peer utilities, universities, industry vendors, participation in professional societies, and other research consortiums. Annual investments made in science and technological innovation help meet future business and operational challenges. Each year, TVA’s annual research portfolio is updated based on a broad range of operational and industry drivers to assess key technology gaps, performance issues, or other significant issues, addressed through research and development. Core research activities directly support optimization of TVA’s generation and transmission assets, air and water quality, energy utilization, and distributed/clean energy integration. TVA has launched a research program focused on evaluating the potential to deploy grid-scale battery storage technology to optimize the existing TVA generation assets and improve the resiliency of the transmission system. This research will guide future application of battery storage as part of the evolving bulk power system in the region.

18
TVA evaluates emerging energy efficiency and load management technologies for market program readiness. Efforts are directed towards demonstrating and validating the performance, reliability, and consumer acceptance of new efficiency technologies, as well as the value of energy efficiency and load management technologies for the consumer, LPCs, and TVA. TVA and LPCs engage in several initiatives related to grid modernization. Research includes technologies and applications advancement in intelligent transmission and distribution systems. Smart meter technology has the potential to shift usage patterns away from peek demand times that could change costs significantly. Additionally, intelligent transmission systems would give TVA the ability to nearly instantaneously diagnose problems, make corrections, and engage transmission and generation resources quickly so that power would keep flowing. This could promote reduced emissions, lower energy costs, and add greater flexibility to accommodate the new consumer-generated sources under TVA’s renewable energy programs. Finally, TVA is evaluating small clean power resources that can be aggregated to meet regular demand. Research efforts into clean DER seek to understand the scope and impact on operations and business economics and to develop strategies for adapting to the evolving electricity landscape in the Tennessee Valley. Battery storage and solar power models deployed in the Tennessee Valley are also being evaluated to better understand their impacts to the grid. Initial economic analysis have been conducted to identify the value of DER (particularly photovoltaic solar generation) to both TVA and the LPC system.

19
3.0 Planning for Climate Change Related Risk
3.1 Identification of Adaptation Risk and Opportunities
TVA is unique among power generators in that the Agency was created to both further economic development and protect and improve the natural resources of the Tennessee Valley region. Today the results of TVA’s efforts are apparent in the abundant natural resources in the region and the opportunities they afford.
All planning activities are conducted under conditions of uncertainty. Adaptation planning is no different. TVA manages the effects of climate change on its mission, programs, and operations within its environmental management processes. Specific mitigation and adaptation analyses are incorporated in TVA’s primary planning processes, including TVA’s Integrated Resource Plan (IRP) and Natural Resource Plan (NRP). As a federal agency, TVA must also comply with the National Environmental Policy Act (NEPA). While the scope, severity and pace of future climate change impacts are difficult to predict, climate change adaptation planning will help TVA to:
• Identify how climate change may impact TVA’s ability to achieve its mission, operate its facilities efficiently, and meet its policy and program objectives;
• Assess the potential consequences of climate change and the ability to mitigate negative impacts through adaptation and other opportunities;
• Develop, prioritize, implement and evaluate adaptation planning actions, as practicable, to moderate climate change risks and exploit new opportunities influenced by climate change;
• Ensure its resources are invested wisely and its services and operations remain effective in future conditions; and
• Contribute to the Federal government’s leadership role in sustainability and pursue the vision of a
resilient, healthy, and prosperous Nation, in the face of a changing climate.
Interagency efforts have been, and continue to be, underway to better understand the uncertainty associated with climate change. In the United States, the Global Change Research Act of 1990 mandates that an assessment of the impacts of global change in the U.S. be conducted by the U.S. Global Change Research Program (USGCRP) every four years. TVA, consistent with its Adaptation Statement, updates its Adaptation and Resiliency Plan within one year of the publication of each quadrennial National Climate Assessment (NCA) report.

20
Figure 5. Climate Adaptation and Resiliency Integrated into TVA’s Planning Processes
3.2 High-Level Adaptation Risk and Opportunities Analysis Table 1 summarizes the key high-level adaptation risks and opportunities to TVA's mission, programs, and operations in the short- and long-term. The risks and opportunities analyzed are within the ranges considered by TVA's current planning and evaluation processes as discussed in Section 4.0.

21
Table 1: Key High-Level Adaptation Risk and Opportunity Summary
Key Topic Key Issue Description Potential Short Term and Long Term Effects
Temperature Electricity Demand
Temperatures are rising in all regions, and these increases are expected to drive greater use of air conditioning. The increase in annual electricity demand across the country for cooling is offset only marginally by the relatively small decline in heating demand that is met with electric power.
Sixty-one percent of major Southeast cities are exhibiting some aspects of worsening heat waves, which is a higher percentage than any other region of the country.
Changes in winter air temperature patterns are one aspect of climate change that will play an especially important role in the Southeast. Investing in increased cooling is one likely form of adaptation.
Among U.S. regions, the Southeast is projected to experience the highest costs associated with meeting increased electricity demands in a warmer world. Under the higher scenario, nighttime minimum temperatures above 75°F and daytime maximum temperatures above 95°F become the summer norm and nights above 80°F and days above 100°F, now relatively rare occurrences, become commonplace.
Cooling degree days (a measure of the need for air conditioning [cooling] based on daily average temperatures rising above a standard temperature—often 65°F) nearly double, while heating degree days (a measure of the need for heating) decrease by over a third. The freeze-free season lengthens by more than a month, and the frequency of freezing temperatures decreases substantially.
The NCA4 reports Southeast region experienced high annual average temperatures in the 1920s and 1930s, followed by cooler temperatures until the 1970s.
Since then, annual average temperatures have warmed to levels above the 1930s; the decade of the 2010s through 2017 has been warmer than any previous decade both for average daily maximum and average daily minimum temperature. Seasonal warming has varied. The decade of the 2010s through 2017 is the warmest in all seasons for average daily minimum temperature and in winter and spring for average daily maximum temperature. However, for average daily maximum temperature, the summers of the 1930s and 1950s and the falls of the 1930s were warmer on average. The southeastern United States is one of the few regions in the world that has experienced little overall warming of daily maximum temperatures since 1900. The reasons for this have been the subject of much research, and hypothesized causes include both human and natural influences. However, since the early 1960s, the Southeast has been warming at a similar rate as the rest of the United States. During the 2010s, the number of nights with minimum temperatures greater than 75°F was nearly double the long-term average for 1901–1960, while the length of the freeze-free season was nearly 1.5 weeks greater than any other period in the historical record. These increases were widespread across the region and can have important effects on both humans and the natural
Thermoelectric Power Generation
Higher temperatures reduce the thermal efficiency and generating capacity of thermoelectric power plants and reduce the efficiency and current-carrying capacity of transmission and distribution lines.
Warmer air temperatures will result in warmer water. Warmer water holds less dissolved oxygen making instances of low oxygen levels more likely. TVA continually monitors and uses several methods to regulate and has ongoing programs to maintain Dissolved Oxygen and water temperatures to ensure minimal impacts to receiving streams and aquatic life.
Hydroelectric Power Generation
Warmer air temperatures will result in warmer water. Warmer water holds less dissolved oxygen making instances of low oxygen levels more likely. Higher temperatures reduce the efficiency and current-carrying capacity of transmission and distribution lines.
Warmer air temperatures will result in warmer water. Warmer water holds less dissolved oxygen making instances of low oxygen levels more likely.
The NCA4 concluded that while some hydropower facilities may face water-related limitations, these could be offset to some degree by the use of more efficient turbines as well as innovative new hydropower technologies. TVA continually monitors and uses several methods to regulate and has ongoing programs to maintain Dissolved Oxygen (DO).

22
environment. By contrast, the number of days above 95°F has been lower since 1960 compared to the pre-1960 period, with the highest numbers occurring in the 1930s and 1950s, both periods of severe drought. The differing trends in hot days and warm nights reflect the seasonal differences in average daily maximum and average daily minimum temperature trends. These risks vary in type and magnitude from place to place, and while some climate change impacts, such as sea level rise and extreme downpours, are being acutely felt now, others, like increasing exposure to dangerously high temperatures—often accompanied by high humidity—and new local diseases, are expected to become more significant in the coming decades. While all regional residents and communities are potentially at risk for some impacts, some communities or populations are at greater risk due to their locations, services available, and economic situations. In fact, a recent economic study using a higher scenario (RCP8.5)11 suggests that the southern and Midwestern populations are likely to suffer the largest losses from projected climate changes in the United States. The length of the freeze-free season has increased at most stations, particularly since the 1980s.
Decreased Dissolved Oxygen Levels
Warmer air temperatures will result in warmer water. Warmer water holds less dissolved oxygen making instances of low oxygen levels or “hypoxia” more likely; foster harmful algal blooms; and alter the toxicity of some pollutants.
The NCA4 observes that few studies have projected the impacts of climate change on nitrogen, phosphorus, sediment, or dissolved organic carbon (DOC) transport from land to rivers.
However, given the tight link between river discharge and all of these potential pollutants, areas of the U.S. that are projected to see increases in precipitation, and increases in intense rainfalls may see decreases in dissolved oxygen. Prolonged, heavy releases at Kentucky Dam can lead to supersaturation of desoloved oxygen (DO) impacting aquatic life in the tailwater.
TVA continually monitors and uses several methods to regulate and has ongoing programs to maintain DO below dams.

23
Key Topic Key Issue Description Potential Short Term and Long Term Direct and Indirect Effects
Precipitation Increased Flooding
Downpours can trigger sewage overflows and lead to contaminated drinking water.
The NCA4 reports that few studies have projected the impacts of climate change on nitrogen, phosphorus, sediment, or dissolved organic carbon (DOC) transport from land to rivers. However, given the tight link between river discharge and all of these potential pollutants, the NCA4 concludes areas of the U.S. that are projected to see increases in precipitation, and increases in intense rainfalls, may experience water quality challenges.
eavier precipitation can increase flood risk, expand flood hazard areas, increase the variability of stream flows (i.e., higher high flows and lower low flows) and increase the velocity of water during high flow periods, thereby increasing erosion. Precipitation changes can often be managed by the use of reservoirs, and can increase hydropower power production. Floods can also have adverse effects on water quality and aquatic ecosystem health. More frequent and intense extreme precipitation events are projected to increase the risk of floods for coastal and inland energy infrastructure, especially in the Northeast and Midwest. Climate impacts in this category are related to changes in rainfall, and also to changes in temperature, which affects evaporation and evapotranspiration. While water is currently abundant, climate stressors could change that abundance, either locally or region wide, leading to impacts and the need for adaptive measures.
Prolonged Drought
A changing climate, particularly in areas projected to be warmer and drier, is expected to lead to drought and stresses on water supply, affecting energy, water and land sectors in the United States.
Heat-related stresses are presently a major concern in the Southeast. Future temperature increases are projected to pose challenges for human health.
While recent regional temperature trends have not shown the same consistent rate of daytime maximum temperature increase as observed in other parts of the United States, climate model simulations strongly suggest that daytime maximum temperatures are likely to increase as humans continue to emit greenhouse gases into the atmosphere. The resulting temperature increases are expected to add to the heat health burden in rural, as well as urban, areas.
Projected temperature increases also pose challenges for crop production dependent on periods of lower temperatures to reach full productivity. Drought has been a recurrent issue in the Southeast affecting agriculture, forestry, and water resources. With rapid growth in population and overall demand, drought is increasingly a concern for water resource management sectors such as cities, ecosystems, and energy production.

24
Extreme Weather Events
The principal contributor to power outages, and their associated costs, in the United States is extreme weather. Severe weather can have a negative impact on energy infrastructure.
The NCA4 reported that, since 1980, the Southeast has had more billion-dollar weather disasters (hurricanes, floods, and tornadoes) than any other region in the United States. The frequency of extreme-precipitation-events has increased across the Southeast, particularly over the last two decades. The increase is pronounced across the lower Mississippi River Valley and along the northern Gulf Coast. Although the number of major tornadoes has increased over the last 50 years in the Southeast, there is no statistically significant trend.
Across the Southeast since 2014, there have been numerous examples of intense rainfall events—many approaching levels that would be expected to occur only once every 500 years—that have made state or national news due to the devastating impacts they had on inland communities. Of these events, four major inland flood events have occurred in just three years (2014–2016) in the Southeast, causing billions of dollars in damages and loss of life For the United States, 2017 was a historic year for weather and climate disasters, with widespread impacts and lingering costs. While 2017 tied the previous record year of 2011 for the total number of billion-dollar weather and climate disasters—16—the year broke the all-time previous record high costs by reaching $306.2 billion in damages (in 2017 dollars; $297 billion in 2015 dollars). The previous record year was 2005 with a total of $214.8 billion (in 2017 dollars; $208.4 billion in 2015 dollars), which included the impacts of Hurricanes Dennis, Katrina, Rita, and Wilma.
The number of extreme rainfall events is increasing. For example, the number of days with 3 or more inches of precipitation has been historically high over the past 25 years, with the 1990s, 2000s, and 2010s ranking as the decades with the 1st, 3rd, and 2nd highest number of events, respectively. More than 70% of precipitation recording locations show upward trends since 1950, although there are downward trends at many stations along and southeast of the Appalachian Mountains. The number of days with heavy precipitation has increased at most stations, particularly since the 1980s.
Temporal and Geographic Rainfall Variation
Warming temperatures affect human health and bring about temporal and geographic shifts in the natural environment, landscapes, and precipitation patterns. Change in extreme events, droughts, and daily and weekly flooding pose threats to the region’s infrastructure even when monthly and annual water supply does not change dramatically.
The EPRI Report concluded that while changes in runoff in the TVA region are likely to be modest, some impacts could result from highly localized changes in the temporal distribution of precipitation that may have major impacts on both water supply and power supply along with recreation in specific parts of the TVA region--even if the region as a whole does not experience a major impact.
The Southeast’s coastal plain and inland low-lying regions support a rapidly growing population, a tourism economy, critical industries, and important cultural resources that are highly vulnerable to climate change impacts (very likely, very high confidence). The combined effects of changing extreme rainfall events and sea level rise are already increasing flood frequencies, which impacts property values and infrastructure viability, particularly in coastal cities. Without significant adaptation measures, these regions are projected to experience daily high tide flooding by the end of the century (likely, high confidence). Many analyses have determined that extreme rainfall events have increased in the Southeast, and under higher scenarios, the frequency and intensity of these events are projected to increase.
25
Rainfall records have shown that since NCA3, many intense rainfall events (approaching 500-year events) have occurred in the Southeast, with some causing billions of dollars in damage and many deaths. Flooding events are highly variable in both space and time. Detection and attribution of flood events are difficult due to multiple variables that cause flooding. There is high confidence that flood risks will very likely increase in coastal and low-lying regions of the Southeast due to rising sea level and an increase in extreme rainfall events. There is high confidence that Southeast coastal cities are already experiencing record numbers of high tide flooding events, and without significant adaptation measures, it is likely they will be impacted by daily high tide flooding.
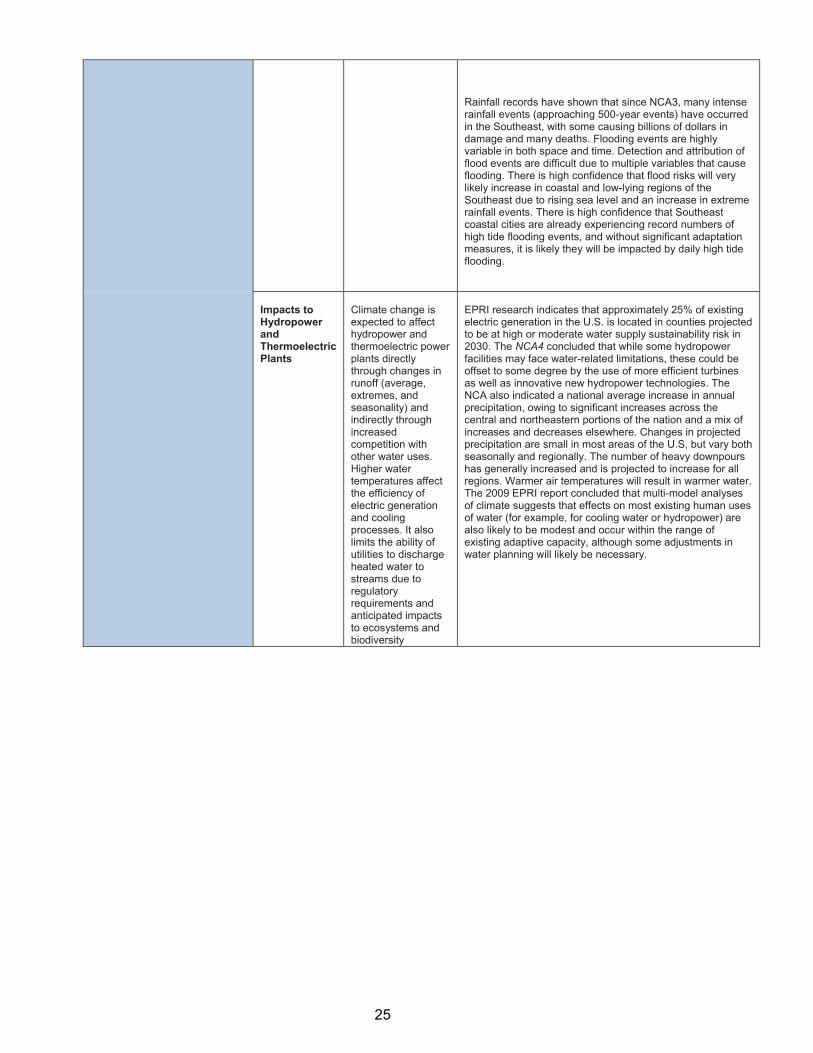
Impacts to Hydropower and Thermoelectric Plants
Climate change is expected to affect hydropower and thermoelectric power plants directly through changes in runoff (average, extremes, and seasonality) and indirectly through increased competition with other water uses. Higher water temperatures affect the efficiency of electric generation and cooling processes. It also limits the ability of utilities to discharge heated water to streams due to regulatory requirements and anticipated impacts to ecosystems and biodiversity
EPRI research indicates that approximately 25% of existing electric generation in the U.S. is located in counties projected to be at high or moderate water supply sustainability risk in 2030. The NCA4 concluded that while some hydropower facilities may face water-related limitations, these could be offset to some degree by the use of more efficient turbines as well as innovative new hydropower technologies. The NCA also indicated a national average increase in annual precipitation, owing to significant increases across the central and northeastern portions of the nation and a mix of increases and decreases elsewhere. Changes in projected precipitation are small in most areas of the U.S, but vary both seasonally and regionally. The number of heavy downpours has generally increased and is projected to increase for all regions. Warmer air temperatures will result in warmer water. The 2009 EPRI report concluded that multi-model analyses of climate suggests that effects on most existing human uses of water (for example, for cooling water or hydropower) are also likely to be modest and occur within the range of existing adaptive capacity, although some adjustments in water planning will likely be necessary.

26
Key Topic Key Issue Description Potential Short Term and Long Term Direct and Indirect Effects
Over-All Climate Air Quality Changes in meteorological conditions could affect future ozone and PM2.5 concentrations. Climate change can also affect air quality by increasing emissions from natural sources and wildfires.
The NCA4 reported that several studies project that climate change could increase troposphere ozone levels over broad areas of the country, especially on the highest-ozone days. Climate change also has the potential to lengthen the ozone seasons (the months of the year when weather conditions, along with pollutants in the air, can result in the formation of elevated levels of ground-level ozone in particular locations around the country), and may increase individuals’ vulnerability to air pollution.
The Southeast has more days with stagnant air masses than other regions of the country (40% of summer days) and higher levels of fine (small) particulate matter (PM2.5), Ozone concentrations would be expected to increase under higher temperatures. Increases in precipitation and shifts in wind trajectories may reduce future health impacts of ground level ozone in the Southeast, but warmer and drier autumns are expected to result in a lengthening of the period of ozone exposure.
Water Quality Warmer air temperatures will result in warmer water.
Warmer water holds less dissolved oxygen, making instances of low oxygen levels or “hypoxia” more likely, fostering harmful algal bloom, and altering the toxicity of some pollutants. This will be more pronounced on mainstream reservoirs, where brief periods of low DO can already be observed during the summer under drought conditions.
Biodiversity Impacts
The Southeast’s diverse natural systems, which provide many benefits to society, will be transformed by climate change. Changing winter temperature extremes, wildfire patterns, sea levels, hurricanes, floods, droughts, and warming ocean temperatures are expected to redistribute species and greatly modify ecosystems. Changes in winter air temperature patterns are one aspect of climate change that will play an especially important role in the Southeast.
The Tennessee Valley region supports a wide diversity of terrestrial and aquatic ecological habitats. This habitat diversity results in the area being one of the most species-diverse in North America and a center for unusually high levels of endemism (i.e. species confined to a particular geographic region). Potential climate impacts are related to changes in ecosystem type and acreage and measures of species diversity and can be attributed to changes in temperature, precipitation and atmospheric CO2 concentrations. At this time, it is uncertain where the greatest climate change-induced impacts to aquatic organisms and their ecosystems may occur. Predictions are further confounded by the probability that temperature change will likely not occur evenly across the Valley; as a result, it is difficult to predict how warm- and cold-water taxa will respond to changing water temperatures, since other environmental factors such as land-use changes also strongly influence species population densities and geographic distributions. Highly specialized species restricted to higher elevations are expected to be impacted initially.
The NCA concluded climate change impacts on biodiversity are already being observed in alteration of the timing of critical biological events such as spring bud burst and substantial range shifts of many species. In the longer term, there is an increased risk of species extinction. These changes have social, cultural, and economic effects. Events such as droughts, floods, wildfires, and pest outbreaks are already disrupting ecosystems. These changes limit the capacity of ecosystems, such as forests, barrier beaches, and wetlands, to continue to play important roles in reducing the impacts of these extreme events on infrastructure, human communities, and other valued resources. The Southeast’s diverse natural systems, which provide many benefits to society, will be transformed by climate change. Changing winter temperature extremes, wildfire patterns, sea levels, hurricanes, floods, droughts, and warming ocean temperatures are expected to redistribute species and greatly modify ecosystems.

27
Changes in winter air temperature patterns are one aspect of climate change that will play an especially important role in the Southeast. By the late 21st century under the higher scenario (RCP8.5), the freeze-free season is expected to lengthen by more than a month. Winter air temperature extremes (for example, freezing and chilling events) constrain the northern limit of many tropical and subtropical species. Certain ecosystems in the region are located near thresholds where small changes in winter air temperature regimes can trigger comparatively large and abrupt landscape-scale ecological changes (in other words, ecological regime shifts). Reductions in the frequency and intensity of cold winter air temperature extremes can allow tropical and subtropical species to move northward and replace more temperate species. Where climatic thresholds are crossed, certain ecosystem and landscapes will be transformed by changing winter air temperatures. In addition to plants, warmer winter air temperatures will also affect the movement and interactions between many different kinds of organisms. Warmer temperatures and insects have led to the loss of cold-adapted boreal communities, and flammable, fire-adapted tree species have been replaced by less flammable, fire-sensitive species—a process known as mesophication. However, intense fires, like those observed in 2016, can halt the mesophication process. High temperatures, increases in accumulated plant material on the forest floor, and a four-month seasonal drought in the fall of 2016 collectively produced the worst wildfires the region has seen in a century. Intra-annual droughts, like the one in 2016, are expected to become more frequent in the future. Thus, drought and greater fire activity are expected to continue to transform forest ecosystems in the region.
Habitat Migration
Climate change may have an impact on the spatial distribution of plant and animal species.
The NCA4 concluded the lengthening of the frost-free season has been somewhat greater in the western U.S. than the eastern U.S., increasing by 2 to 3 weeks in the Northwest and Southwest, 1 to 2 weeks in the Midwest, Great Plains, and Northeast, and slightly less than 1 week in the Southeast. These differences mirror the overall trend of more warming in the north and west and less warming in the Southeast.
In-stream Habitat Quality
Changes to in-stream flow levels may have substantial impacts on the habitats and biodiversity supported by rivers and other water bodies.
Changes to in-stream flow levels may have substantial impacts on the habitats and biodiversity supported by rivers and other water bodies.
3.2 TVA Resiliency Activities and Research 3.2.1 Climate Sentinel Monitoring
The goal of TVA’s Climate Sentinel Monitoring program is to assess potential biological, ecological, and hydrological responses of aquatic ecosystems to climate change leading to a better understanding of potential climate change effects on streams, including water quality and their unique biodiversity within the Tennessee River watershed. The program is part of TVA’s NRP and focuses on collecting biological, chemical and physical data in each of the five predominant eco-regions in the Tennessee River watershed. Monitoring began in FY2013 with eighteen sites a year. This program is part of TVA’s continued participation in U.S. EPA’s regional Monitoring Network (RMN) and continued participation in the Appalachian Landscape Conservation Cooperative (AppLCC).

28
3.2.2 Aquatic Ecology Management
The Tennessee River watershed is one of the most biologically rich watersheds in North America. This NRP program focuses on the enhancement of aquatic biological communities in TVA streams, reservoirs and tailwaters with the goal to identify and protect exceptionally diverse aquatic biological communities. TVA continues to build partnerships and collaborate to develop implementation plans, pool resources and works with partners to implement protection and improvement measures.
3.2.3 Probabilistic Flood Hazard Analysis
TVA continues to test the resilience of our reservoir system with probabilistic flood hazard analysis. TVA is utilizing a state-of-the-art stochastic flood event model to create thousands of realistic extreme floods. These floods are routed through TVA’s reservoir operation model to determine the effect they would have on TVA’s infrastructure as well as other infrastructure built near the river. Statistical techniques built into the software allow us to understand the likelihood of these events, as well as the magnitude. This information is much richer than the information that TVA has utilized in the past, and is allowing TVA to improve decisions on where and how to invest to reduce flood risk the most. We are improving our flood resilience, which will be a valuable climate change adaptation, should floods increase in the future.
3.2.4 Paleoflood Study
TVA is currently examining sediment deposits left by floods in the long-term past. These deposits are being studied to determine their age and the flow associated with the flood. This information is being used to better calibrate the stochastic analysis described above. Several thousand hears of paleo flood deposits lend additional weight to the evidence obtained using the stochastic techniques. Again, this analysis will be used to improve our resilience against floods, should flooding increase with climate change.
3.2.5 Water Reliability Study
TVA is also testing the resilience of our reservoir system in the face of extreme droughts. We are sponsoring the University of Tennessee to create a ~600-year reconstruction of rainfall within our watershed based on tree ring analysis. These rainfall reconstructions are being run through our rainfall-runoff models to determine historical inflows. The historical inflows are next being run through our reservoir-routing models to determine the impact to lake levels and releases. Finally, we are determining the reliability of the water supply at each water supply intake on our system. These historical reconstruction will test the resilience of our policies and intake equipment against the largest historical droughts we can find. TVA will use this information to help us increase the resilience of both our reservoir operations and the operations of the water utilities and industries that rely on us for water. Testing the system against extended doubts will help TVA prepare appropriately should climate change lead of such a drought.
3.2.6 CEATI Research Partnership TVA is part of the industry group CEATI (Center for Energy Advancement through Technological Innovation). Through CEATI, TVA will be sponsoring a project to help assess streamflow under changing climate. This work will provide additional tools for TVA to use for assessing whether streamflow patterns have changed and forecasting how they might change in the future. Both of these capabilities could be used by River Management to improve our climate adaptation strategies. 3.2.7 Appalachian LCC Participation TVA participates in the AppLCC and communicates the findings of the AppLLC climate resilience assessment for aquatic habitats through the Tennessee River Basin Biodiversity Network (TRBBN), a multi-agency effort to communicate across state and federal agencies and NGOs around the shared goals of preserving the world class biodiversity in the Tennessee River Watershed.

29
3.2.8 EPRI Participation In 2018 TVA, along with several other utilities, culminated a 2 year technical assessment of resiliency metrics and analytical frameworks resulting in a report which concluded it may be possible to organize the metric identification and development process around a consistent framework. The report synthesizes and analyzes current metrics and analytical frameworks used to measure power system resiliency.8 EPRI resiliency research is ongoing and TVA continues to participate across multiple EPRI programs.
3.3 External Partnership and Stakeholder Coordination Partnerships are a critical component of TVA's future implementation, education and operations success. TVA, along with other agencies, is tasked with finding new and creative ways to deal with funding and personnel challenges to effectively manage nonrenewable resources. TVA encourages collaboration to share the latest data and best practices on climate preparedness both across agencies as well as to support State, local, Tribal, and private sector efforts to build climate preparedness. TVA continues to develop its overarching public engagement programs to increase public awareness and promote opportunities for volunteer involvement, environmental education, financial/resource assistance and collaborative partnerships. The TVA Board established a Regional Resource Stewardship Council (RRSC) under the Federal Advisory Council Act to advise TVA on its stewardship activities. In 2013, TVA also created a new Regional Energy Resource Council (RERC) under the Federal Advisory Council Act to advise TVA on its energy resources decision making processes. In 2015, TVA joined the DOE Partnership for Energy Sector Climate Resilience and continues to participate and share best practices with 18 other electric utilities to develop and pursue strategies to reduce climate and weather related vulnerabilities. TVA continues to participate in the Partnership. 3.3 Existing Cross-Cutting Planning Efforts
3.3.1 TVA Resiliency Planning With over 16,200 miles of transmission lines and 500 substations throughout the Tennessee Valley, TVA maintains an active Resiliency Plan that focuses on three areas: • Ensuring constant equipment reliability • Monitoring, detecting and responding to physical or cybersecurity threats • Recovering from damage if an event occurs A resilience matrix format proposed by the North American Transmission Forum and EPRI has been adopted as a useful means of documenting high impact risks and how TVA develops resilience to them. The matrix services as a single point for analyses, emergency and operating plans, procedures, and associated publications and is a useful reference during emergency events as well as a guideline for further improvements and an education source for employees. 3.3.2 Strategic Sustainability Performance Plan (SSPP) TVA's Chief Sustainability Officer (CSO) is also responsible for its Climate Change Adaptation Action Plan. TVA's Strategic Sustainability Performance Plan (SSPP) goals and current performance can be found on its current OMB Scorecard on Sustainability/Energy.
3.3.3 Environmental Justice Strategy TVA will consider environmental justice impacts in a manner appropriate for the process utilized.

30
3.3.4 Applicable National Plans, Tools and Reports As the science continues to evolve in key areas, TVA will continue to evaluate and update its high-level vulnerability assessment guidance as needed. This Plan has been updated to reflect NCA4. Links to applicable science and tools are maintained on TVA’s Resiliency and Adaptation SharePoint site. In completing high-level vulnerability analysis, the following list of sources is available on TVA’s Resiliency and Adaptation SharePoint site and are intended to assist applicable planning processes with adaptation reference sources, including:
• Fourth National Climate Assessment, Vol I: The Climate Science Special Report (2017)
• Fourth National Climate Assessment, Vol. II: Impacts, Risks, and Adaptation in the United States (2018)
• State Climate Summaries (2017)
• U.S. Climate Resilience Toolkit
• Murphy, Caitlin, Eliza Hotchkiss, Kate Anderson, Clayton Barrows, Stuart Cohen, Sourabh Dalvi, Nick Laws, Jeff Maguire, Gord Stephen, and Eric Wilson. 2020. Adapting Existing Energy Planning, Simulation, and Operational Models for Resilience Analysis. Golden, CO: National Renewable Energy Laboratory. NREL/TP-6A20-74241. TP-6A20-74241.
• Climate Resilience: A Strategic Investment Approach for High-Priority Projects Could Help Target Federal Resources, Report to the Ranking Member, Subcommittee on Transportation and Infrastructure, Committee on Environment and Public Works, U.S. Senate, GAO-20-127.
• Disaster Resilience Framework: Principles for Analyzing Federal Efforts to Facilitate and Promote Resilience to Natural Disasters, GAO-20-100SP, Washington D.C., October 2019.
• Climate Resilience: DOD Needs to Assess Risk and Provide Guidance on Use of Climate Projections in Installation Master Plans and Facilities Designs, GAO-19-453, Washington, D.C. June 2019.
• Adapting to the Impacts of Climate Change, America’s Climate Choices: Panel to the Impacts of Climate Change: National Research Council, National Academy of Sciences, 2010.
• High-Risk Series: Substantial Efforts Needed to Achieve Greater Progress on High-Risk Areas,
GAO-19-157SP. Washington, DC: March 6, 2019.
• Climate Change: Analysis of Reported Federal Funding. GAO-18-223. Washington, D.C: April 30, 2018.
• Climate Change: Information on Potential Economic Effects Could Help Guide Federal Efforts to Reduce Fiscal Exposure. GAO-17-720. Washington, D.C.: September 28, 2017.
• Climate Change: Improved Federal Coordination Could Facilitate Use of Forward-Looking
Climate Information in Design Standards, Building Codes, and Certifications. GAO-17-3. Washington, D.C.: November 30, 2016.
• Budget Issues: Opportunities to Reduce Federal Fiscal Exposures Through Greater Resilience
to Climate Change and Extreme Weather. GAO-14-504T. Washington, D.C.: July 29, 2014.
• Extreme Weather Events: Limiting Federal Fiscal Exposure and Increasing the Nation’s Resilience. GAO-14-364T. Washington, D.C.: February 12, 2014.

31
• Climate Change: Energy Infrastructure Risks and Adaptation Efforts. GAO-14-74. Washington, D.C.: January 31, 2014.
• Climate Change: Federal Efforts Under Way to Assess Water Infrastructure Vulnerabilities and
Address Adaptation Challenges, GAO-14-23. Washington, DC: April 2013.
• Climate Change: Various Adaptation Efforts Are Under Way at Key Natural Resource Management Agencies. GAO-13-253. Washington, D.C.: May 31, 2013.
• Climate Change: Future Federal Adaptation Efforts Could Better Support Local Infrastructure
Decision Makers. GAO-13-242. Washington, D.C.: April 12, 2013.
• Distribution Grid Resiliency: Prioritization of Options, Report 3002006668, EPRI, 2015.
• Electric Power System Flexibility: Challenges and Opportunities, Report 3002007374, EPRI, 2016.
• Electric Power System Connectivity: Challenges and Opportunities, Report 3002007375,
EPRI, 2016.
• Electric Power System Resiliency: Challenges and Opportunities, Report 3002007376, EPRI, 2016.
• High-Wind Risk Assessment Guidelines, Report 3002003107, EPRI, 2015
• How the Transmission Resiliency Research Fits Together, Report 3002006429, EPRI, 2015. • Opportunities to Enhance the Nation’s Resilience to Climate Change, Council on
Climate Preparedness and Resilience, October 2016.
• Potential Impact of Climate Change on Natural Resources in the Tennessee Valley Authority Region, Report 1020420, EPRI, November 2009.
• Reference Guide for Obtaining Input Data for Application of EPRI’s Transmission
Resiliency Framework to Severe Weather: Prioritizing Resiliency Investments, Report 3002006416, EPRI, 2015.

32
4.0 Planning for Climate Change Related Risk
4.1 TVA's Adaptation Planning and Evaluation Process
4.1.1 TVA's Environmental Policy TVA’s overarching Environmental Policy is to produce increasingly clean, reliable and affordable power, support sustainable economic growth in the Tennessee Valley and promote proactive environmental sustainability in a balanced and ecologically sound manner.
As a good steward, it is TVA’s duty to promote the proper public use of the Tennessee River watershed and its natural resources. We are committed to sustainability and continuous improvement, proactive stewardship in managing our natural resources and environmental footprint and maintaining compliance with all applicable environmental and legal requirements.
TVA continues to integrate sustainable practices into its business operations by establishing goals, measuring progress and reporting performance.
.2 Guiding Principles for Climate Change Adaptation
TVA’s Guiding Principles for Climate Change Adaptation and Resiliency Planning:
• Adopt integrated approaches; • Prioritize the most vulnerable; • Use the best available science; • Build strong partnerships; • Apply risk management methods and tools; • Apply ecosystem-based approaches; • Maximize mutual benefits; and, • Continuously evaluate performance.
As resilience strategies and solutions are developed, costs and benefits of potential resilience improvements must be evaluated to prioritize and determine investment decisions. Total costs of potential resilience measures, which include up-front capital costs as well as operating and maintenance costs, and legal liability costs over the lifetime of the resilience measures should be considered. This could include job losses, sales and revenue losses, and penalties and litigation costs. A variety of benefits should also be considered, including direct benefits from avoided damages and costs (based on potential costs and impacts), avoided revenue losses due to interrupted service, as well as co-benefits (e.g. system reliability benefits, reduced utility bills, enhanced energy efficiency, reduced emissions, public safety, and societal benefits.

33
Economic and non-economic metrics appropriate for the decision context and requirements should also be considered. Primary direct benefits of resilience measures are the avoided costs of potential climate impacts. A diverse set of metrics can help inform the overall value (economic and non-economic) of investing in resilience measures. Critical supply chains should achieve resilience objectives comparable to those TVA has established for itself, including resilience procurement criteria, incentives for improved supplier performance, and the facilitation of the disclosure of suppliers’ resilience performance information. Several aspects of supply chain structure should be used for supply chain characterization, including:
• Prevalence of single source suppliers (at all supply chain tiers); • Redundancies (additional facilities, additional buffer inventories and stocks, additional capacity) • Flexibility (of sourcing, transport systems, etc.); • Responsiveness (how quickly can the supplier respond based on their governance, what business continuity plans
they have in place, etc.) and; • Proximity of distribution (in the event of physical disruptions such as storm damage limiting transportation
infrastructure).
Some customers may have a greater interest and support for resilience services than others. As TVA considers the mechanisms for incorporation of resilience into its business models, services will need to align with customer resilience needs. When working with stakeholders, a mutual understanding of the customers and loads that are most critical for community resilience is required. Working with stakeholders, business models will continue to evolve that will increase value both to critical customers and to the community as a whole.
4.2 TVA's Major Environmental Planning Processes TVA's major environmental planning processes are its Integrated Resource Plan (IRP) and its Natural Resource Plan (NRP). Other applicable TVA planning processes include Reservoir Land Management Plans and the TVA Shoreline Management Policy.
As a Federal agency, TVA must also comply with the National Environmental Policy Act (NEPA), as well as applicable Executive Orders, such as EO 13693, Planning for Sustainability in the Next Decade. Environmental goals are an integral part of how TVA does business and are tracked along with its other business objectives.

34
Each TVA major planning process shall identify any significant climate change risks. Significant climate change risks are those identified risks with the potential to substantially impair, obstruct, or prevent the success of agency mission activities, both in the near term and particularly in the long term, using the best available science and information. This identification should include: • a brief statement of the rationale for classifying the risk as significant; • factors considered in the review; • any actions the agency believes may decrease the threat of the potential risk; • the identification of any relevant milestones and responsible agency components or offices; and, • whether the action can be addressed exclusively by the agency or if stakeholders will need to be involved.
Adaptation is about managing change and climate change is not the only factor. In general, planners must routinely make complex decisions under uncertain conditions. Decisions made now and in the future will influence society’s resilience to impacts of future climate change. Replacement or restoration of assets to improve resilience can also be integrated into asset management, emergency management, hazard mitigation plans, planning project selection criteria, or environmental reviews.
In recognition of the significance of these decisions, the NCA4 presented information that is useful for a variety of decisions across regions and sectors, at multiple scales, and over multiple time periods. Other environmental and socioeconomic stressors interact with climate change and affect vulnerability and response strategies with respect to energy, water, and land systems. The availability and use of energy, water, and land resources and the ways in which they interact vary across the nation. Regions in the United States differ in: • energy mix (solar, wind, coal, geothermal, hydropower, nuclear, natural gas, petroleum, ethanol); • observed and projected precipitation and temperature patterns; • sources and quality of available water resources (for example, ground, surface, and recycled water); • technologies for storing, transporting, treating and using water; • land use and land cover; and • governance.
As a result, decision-making processes for each sector also differ, and decisions often transcend scales, from local to state to federal, meaning that mitigation and adaptation options can differ widely. Stakeholders should understand the interconnected nature of climate change impacts. There is broad consensus that the U.S. power system needs to be more resilient, flexible, and connected. The value of assessments can be improved if risks and vulnerabilities are examined from a cross-sector standpoint.
In the context of the power system, resiliency includes the ability to harden the system against high-impact, low-frequency events and quickly recovery from them. Power system outages pose large financial impacts to a community, ranging from residential units to small businesses and large corporations. Adaptation planning is complex. There is no perfect, one-size-fits-all adaptation solution to the challenges of adapting to climate change impacts, as solutions will differ depending on context, local circumstance, and scale as well as on local culture and internal capacity. For the power system, enhanced resiliency will be based on three critical elements, with the most cost-effective approach usually being a combination of those three.

35
These three elements are:
• damage prevention: hardening the power system to limit damage using the application of engineering designs and advanced technologies;
• system recovery: restoring service as soon as practicable using tools and techniques; and • survivability: the use of innovative technologies in continuing some level of normal function without
complete access to normal power sources.
Table 2. Resilience Strategy Examples
In October 2014, a resilience matrix format proposed by the North American Transmission Forum (NATF) and EPRI proposed a matrix to overcome the difficulties of discussing resiliency risks without a framework. TVA adopted the matrix, which evolved into an interactive transmission planning tool, as a useful means of documenting high-impact risks and how TVA develops resilience to them. The matrix has been complete for several years and is periodically reviewed an updated as needed. It serves as a single point for analyses, emergency and operating plans, procedures, and associated publications and is a useful reference during emergency events as well as a guideline for further improvements and an education source for employees.
Based on historic events, the vast majority of outage events arise at the distribution and transmission levels from weather events. The Rhodium Group found that the bulk of outage events are due to routine causes (local storms, vegetation, squirrels, equipment problems), and the Department of Energy (DOE) reported that 90% of electric power interruptions arise on the distribution system and are mostly weather-related. However, high-impact, low-frequency events such as hurricanes and winter storms cause about half of customer outage minutes. At the other end of the probability and causal spectrum, Rhodium determined that less than 0.1% of customer outage hours were caused by generation shortfalls or fuel supply over the 2012-2016 period it studied.
Grid resiliency activities are factored into TVA’s regional transmission planning studies and discussions are being held with our local power companies to enhance community resiliency. Outreach discussion and collaboration with State Emergency Services have been well-received and will improve how we work together in the event of real emergencies. TVA’s next step in the evolution of its plans will be the enhancement of communication with generating plants and load centers together with visibility of the grid during emergency operations.

36
4.2.1 TVA's Integrated Resource Plan (IRP) TVA publishes an Integrated Resource Plan (IRP) to provide direction for how TVA will meet the long-term energy needs of the Tennessee Valley region. TVA’s current IRP was approved by its Board of Directors in August 2019. The Record of Decision was issued in the September 17, 2019 Federal Register.9
This IRP and the associated Environmental Impact Statement evaluate scenarios that could unfold over the next 20 years. They discuss ways that TVA can meet future electricity demand economically while supporting mandates for environmental stewardship and economic development across the Valley. As in the 2015 version, TVA’s 2019 IRP indicated that a diverse portfolio continues to be the best way to deliver low-cost, reliable electricity for TVA ratepayers.
The 2019 IRP explored various scenarios and strategies in the Tennessee Valley. Scenarios are potential futures outside of TVA’s control, but that nonetheless represent possibilities in which TVA may find itself operating. Key uncertainties considered in the 2019 IRP are electricity demand, market power prices, natural gas prices, coal prices, solar prices, storage prices, regulations, CO2 regulation and prices, distributed generation penetration, energy efficiency adoption and economic outlook (national and regional).
The IRP then considered how selected potential strategies help TVA continue to provide affordable, reliable energy in any of those future scenarios. Strategies are business decisions or directions that TVA could employ to continue to meet electricity demand in a rapidly changing utility environment over the next 20 years.
The TVA Board of Directors approved the IRP and authorized staff to implement the preferred alternative at its August 22, 2019 meeting. This alternative, identified as the Target Power Supply Mix in the Final EIS, will guide TVA’s selection of energy resource options to meet the energy needs of the Tennessee Valley region over the next 20 years. The energy resource options include continued investment in TVA’s hydroelectric resources; license renewal for nuclear resources; expansion of solar and natural gas-fired generation; increased energy efficiency, demand response, and energy storage; and decreased coal-fired generation.
As part of the IRP decision-making process, in alignment with the National Environmental Policy Act (NEPA), TVA analyzed potential environmental implications associated with its 2019 IRP by also issuing an associated Environmental Impact Statement (EIS).
4.2.2 TVA's Natural Resource Plan (NRP)
TVA is unique among power generators in that it was created to not only empower the economic aspects of Southeast society but also to protect and improve the natural resources of the Tennessee Valley region. Today the results of TVA’s effects are apparent in the abundant natural resources in the region and the opportunities they afford. TVA completed its 2020 NRP to guide its natural resource stewardship efforts over the following twenty years, and would be reviewed and updated as needed. The 2020 NRP addresses TVA’s management of biological, cultural, and water resources; recreation; reservoir lands planning; and public engagement. The purpose of the plan is to integrate the goals of these resource areas, provide for the optimum public benefit, and balance sometimes conflicting resource uses. The 2020 NRP also guides TVA in achieving the objectives of its Environmental Policy for a more systematic and integrated approach to natural resources stewardship.

37
4.2.3. TVA Land Policy TVA manages 293,000 acres of public land to protect the integrated operation of the TVA reservoir and power systems, to provide for the appropriate use and enjoyment of the reservoir system and to promote the continuing economic development of our region. To that end, it has developed the TVA Land Policy, which helps balance these needs as well as others, including navigation and flood control.
4.2.4. Comprehensive Valleywide Land Plan (CVLP) TVA’s CLVP comprises the framework for its reservoir lands planning program. The CVLP provides a holistic approach to balancing shoreline development, recreational use, sensitive and natural resource management, and other uses by taking a regional look at resource demands and trends. The CVLP creates uniformity in the lands planning process by instituting one planning methodology (Single Use Parcel Allocation methodology) for all reservoirs across the Tennessee Valley and ensuring consistency in TVA Reservoir Land Management Plans. The percentage of land available for each zone is established by TVA’s overarching CVLP. TVA’s Reservoir Land Management Plans detail the tactics on a reservoir-by reservoir basis. These plans help TVA make decisions when it receives requests for the use of TVA public land. CVLP zones, individual parcels and land use allocations can be viewed using the TVA Land Planning Interactive Viewer.
4.2.5. TVA's Reservoir Land Management Plans (RLMPs) TVA develops comprehensive plans for the management of reservoir lands. Reservoir Land Management Plans are developed with participation by public agencies and officials, private organizations and individuals. By providing a clear vision for how TVA will manage public land, an RMP minimizes conflicting interests and guides decisions on land-use requests. Many of the land plans are available online.
4.2.6. TVA's Shoreline Management Policy In 1999, after extensive environmental review and public comment, TVA inaugurated its Shoreline Management Policy to improve the protection of shoreline and aquatic resources while continuing to allow reasonable public access to both.
4.2.7. Executive Orders TVA’s innovative environmental programs also incorporate pertinent Executive Orders (EO) as well as its ongoing voluntary participation in the DOE Energy Sector Climate Resiliency Partnership. TVA incorporates climate change adaptation and resiliency planning as part of its integrated resource management. The TVA budget for meeting the climate adaptation and resiliency planning provisions is based upon non-appropriated dollars and is subject to the availability of funding as TVA deems appropriate and practicable. 4.3 TVA's Priority Actions As part of its September 30, 2011 response to E.O. 13514, TVA identified 3-5 preliminary priority actions to improve its capability to assess and build resilience to climate impacts. These priorities remain relevant today, aligned with several portions of TVA's NRP. TVA intends to continue to focus on these priority actions as part of its NRP implementation.
38
Goal 1: Water Resources Management
• Provide sustainable, healthy water resources by collaborating to improve and protect water quality in the Tennessee River Watershed.
• Prioritize programs to provide opportunities to conduct water resource improvement efforts on TVA- managed lands and facilities.
• Ensure a comprehensive approach to assess biological conditions across the Valley.
• Encourage the reduction of “energy intensity” of water consumption. Goal 2: Reservoir Lands Planning
• Develop Reservoir Land Management Plans
• Provide a holistic approach to balancing shoreline development, recreational use, sensitive and natural resource management needs, and other uses in a way that maintains regional quality of life and economic growth.
• Systematically identify and evaluate the most suitable use of public lands under TVA stewardship.
Goal 3: Biological and Cultural Resources Management
• Protect and conserve natural resources while promoting recreational opportunities throughout the Valley.
• Biological Resources will focus on three distinct areas: habitat management, land conditions assessment and dispersed recreation.
• Cultural Resources will prioritize monitoring and protection of archaeological sites through shoreline stabilization, as well as through public education and outreach.
4.3.1 Performance Measures Monitoring and evaluation serve a very important function in providing cost-effective policy guidance. Monitoring and evaluation can identify advances in the underlying science, provide critical analysis of issues, and highlight key findings and key unknowns that can guide planners. Regular, iterative assessments also serve to improve resiliency planning related to climate change. TVA is adopting a phased approach that implements systematic indicators of progress and emphasizes peer-to-peer learning rather than using a top-down mandate.
As appropriate, TVA will identify criteria for deciding which programs to target and how those criteria are identified and necessary. Each applicable process should consider whether climate change would impact their ability to procure critical materials or inputs, and seek to address those challenges, including the risk mitigation strategy chosen, the identification of any relevant milestones and the enumeration of responsible agency components or offices.

39
4.3.2 The Role of Technology
Changes related to natural gas prices, load growth, energy policy, and the penetration of variable generation are transforming the power system to become more resilient, flexible, and connected. “Connectivity” refers to the increasingly widespread deployment of advanced communications and monitoring equipment, which provides access to data stream functionality that can inform decisions and behavior from the power plant to the end user. Power system flexibility is the ability to adapt to dynamic and changing conditions; for example, balancing supply and demand by the minute, or deploying new generation and transmission resources over a period of years.
Many of the emerging connectivity and flexibility technologies also address resiliency and can potentially reduce emissions, such as by providing ways to:
• Increase the efficiency of fossil energy use and facilitate a shift to low-carbon energy sources;
• Improve the cost and performance of renewable energy sources;
• Improve nuclear plant resiliency, specifically in the areas of damage prevention and system recovery;
• Reduce the cost of carbon capture and storage;
• Expand terrestrial sinks through management of forests and soils and increase agricultural productivity; and
• Phase-down HFCs.
4.3.3. The Role of Economic Assessment
As technologies evolve in market maturity, their costs and effectiveness will change. Continuing study of these technologies’ performance is important to understanding their role in future mitigation decisions. In addition, evaluation of broad policies and particular mitigation measures requires frameworks that combine information from a wide range of disciplines.
Study of mitigation in the near future can be done with energy-economic models that do not assume large changes in the mix of technologies or changes in the structure of the economy. Analysis over the timespans relevant to stabilization of greenhouse gas concentrations, however, requires Integrated Assessment Models, which consider all emission drivers and policy measures that affect them, and take account their relationships with the larger economy and features of the climate system. This type of analysis can also be useful for exploring the relations between mitigation and measures to adapt to a changing climate.
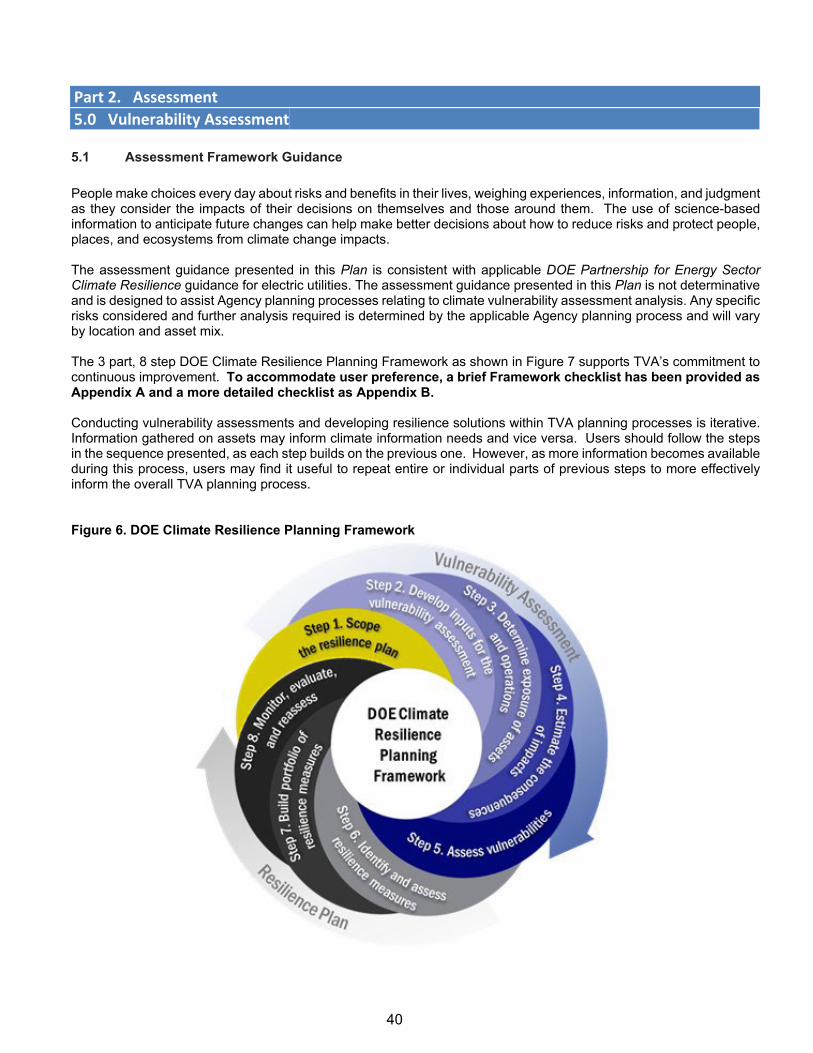
40
Part 2. Assessment 5.0 Vulnerability Assessment
5.1 Assessment Framework Guidance
People make choices every day about risks and benefits in their lives, weighing experiences, information, and judgment as they consider the impacts of their decisions on themselves and those around them. The use of science-based information to anticipate future changes can help make better decisions about how to reduce risks and protect people, places, and ecosystems from climate change impacts. The assessment guidance presented in this Plan is consistent with applicable DOE Partnership for Energy Sector Climate Resilience guidance for electric utilities. The assessment guidance presented in this Plan is not determinative and is designed to assist Agency planning processes relating to climate vulnerability assessment analysis. Any specific risks considered and further analysis required is determined by the applicable Agency planning process and will vary by location and asset mix. The 3 part, 8 step DOE Climate Resilience Planning Framework as shown in Figure 7 supports TVA’s commitment to continuous improvement. To accommodate user preference, a brief Framework checklist has been provided as Appendix A and a more detailed checklist as Appendix B. Conducting vulnerability assessments and developing resilience solutions within TVA planning processes is iterative. Information gathered on assets may inform climate information needs and vice versa. Users should follow the steps in the sequence presented, as each step builds on the previous one. However, as more information becomes available during this process, users may find it useful to repeat entire or individual parts of previous steps to more effectively inform the overall TVA planning process.
Figure 6. DOE Climate Resilience Planning Framework

41
Climate resilience planning is a three part process:
1. Defining the scope, of which the identification of goals is a critical process starting point; 2. Completing the vulnerability assessment, which involves determining where the system is vulnerable and
under what conditions 3. Developing the resilience plan, to improve resilience based on information generated or assembled during
the vulnerability assessment, including the probabilities of adverse climate events, threshold conditions likely to affect important assets or overall system performance and the consequences or costs of climate impacts.
5.2 Part 1: Defining the Scope 5.2.1 Step 1: Scope the Resilience Plan Defining the scope early in the planning process will focus the effort and avoid unnecessary costs or delays. Table 3 provides a Step 1 checklist. A short version worksheet is provided for convenience as Attachment A. A more detailed version of the worksheet is provided as Attachment B.
Table 3. Step 1 Checklist
Defining the Scope Identification of goals is a critical process starting point.
Step 1. Scope the Resilience Plan 1. Identify motivations for climate resiliency planning 2. Identify resilience plan goals 3. Define the scope in alignment with planning
motivations and goals 4. Identify cost constraints on plan deployment 5. Identify stakeholders according to context and goals
5.3 Part 2. Identify and Understand the Vulnerabilities Steps 2 and 3 assist TVA in understanding its exposure to climate change and extreme weather hazards. A short version worksheet is provided for convenience as Attachment A. A more detailed version of the worksheet is provided as Attachment B. These steps require gathering information on observed trends and future climate projections and taking inventory of potentially vulnerable assets and operations, including supply chains. Using this information and other suggested resources, TVA can more accurately identify relevant hazards and other factors (e.g. geography, region, and hydrology) that may affect the likelihood of potential impacts and the associated severity of any system damages or disruptions.
PAR
T 1

42
After reviewing the climate change resources available and identifying which assets and operations should be considered as part of a vulnerability assessment, it may be helpful to revisit the assessment scope defined in Step 1. If new resources, data, or tools are discovered during Step 2 and might expedite or provide further details for the analysis, it may be feasible to consider a wider or more comprehensive scope. Conversely, if reliable data necessary for a complete analysis is not available, it may be necessary to narrow the scope of the assessment.
5.3.1 Steps 2 and 3 Checklist Table 4. Steps 2 and 3 Checklist
Completing the Vulnerability Assessment Determining where the system is vulnerable and under what conditions
Step 2. Develop Inputs for the Vulnerability Assessment
1. Collect the necessary data on assets and operations 2. Identify climate change projections 3. Identify climate change 4. Consideration of a range 5. Consider bounded vs probabilistic climate parameters 6. Assessment products and analysis tools 7. Create new climate projections 8. Choose which climate scenarios, projections, data resources, and tools
to use
Step 3. Determine Exposure of Assets and Operations
1. Identify types of climate change hazards and associated electricity sector vulnerabilities
5.3.2 Identification of Potential Climate Change Threats and Infrastructure
Once potential threats are identified, the ways in which the assets of interest are sensitive to changes in the climate or to extreme weather events should be identified. Impacts can be direct, affecting energy infrastructure, and also indirect, impacting the supply chain or customers. Potential impacts include:
• Increased operational cost • Increased capital cost • Reduced demand for service • Reduction or disruption in generation capacity • Reduction in capital availability
A general template for identifying impacts is included as Table 5.
PAR
T 2

43
Table 5. General Template for Identifying Impacts
5.3.3 Regional and Local Differences
TVA provides electricity for business customers and local power distributors serving 10 million people in parts of seven southeastern states. TVA works in partnership with 153 individual local power companies. These local power companies, both municipal utilities and local cooperatives, purchase power from TVA and resell it to consumers in their designated service areas. TVA also manages the Tennessee River and its tributaries, which cross several counties in which TVA does not provide power. A combined map of TVA’s power service area and Tennessee River jurisdiction is included as Figure 6.

44
Figure 7. TVA Service Area
As part of its participation with DOE’s Partnership for Energy Sector Climate Resilience, the Rhodium Group has supplied TVA with actionable, granular data specifically tailored to TVA’s assets and service territory on climate change impacts for planning purposes. TVA has made these climate projections available to all its employees through its internal GIS application. Climate projections are derived from the results of Houser et al. (2015)10 which assess three potential future climate scenarios (RCP 2.6, RCP 4.5 and RCP 8.5). TVA also collaborates with ORNL to develop additional climate sensitivity datasets consistent with specific planning processes.
Detailed climate projection information can be obtained by county. Available climate projection variables include: Average Daily Temperature Data: • Average-temp: average of the daily mean temperature
o Annual- average annual temperature o Seasonal- average seasonal temperature
• Minimum-temp: annual average daily minimum temperature • Maximum-temp: annual average daily maximum temperature
HDD/CDD Data: • Heating degree days each year • Cooling degree days each year • Expected Temperature Threshold Exceedance Data • Expected number of days per year with a daily high temperature above 90° F • Expected number of days per year with a daily high temperature above 95° F • Expected number of days per year with a daily high temperature above 100° F

45
The NCA4 concludes that the exact location of future climate changes is not easy to identify because the continental United States straddles a transition zone between projected drier conditions in the sub-tropics (south) and wetter conditions at higher latitudes (north). However, projected precipitation changes in the northernmost states (which will get wetter) and southernmost states (which will get drier) are more certain than those for the central areas of the country.
Regional differences in climate change impacts provide opportunities as well as challenges. For example, warmer winters mean reductions in heating costs for those in the northern portions of the country. Well-designed adaptation and mitigation actions that take advantage of regional conditions can significantly enhance resilience in the face of multiple challenges, which include many factors in addition to climate change. 5.3.3.1 Historical Data and Projected Data Information TVA maintains multiple internal datasets of historical climate-related information. Additional data sources of historical climate data are also available, including:
• Comprehensive U.S. climate data • U.S. Historical Climate Network (USHCN) data • National Centers for Environmental Information (NCEI) Data and Products • National Climactic Data Center (NCDC) Climate Data Online
Downscaled projections from multiple models used in the NCA4 are also summarized by county in the NASA NEX DCP30 National Climate Change Viewer (NCCV). The full NEX-DCP30 dataset was produced by USGS in collaboration with the College of Earth, Oceanic and Atmospheric Sciences at Oregon State University. It includes 30 climate models and their respective downscaled data for historical (1950-2005) and 21st century simulations under four RCP emissions scenarios developed for the Intergovernmental Panel on Climate Change (IPCC) Fifth Assessment Report (AR5). Additional, more specific downscaled datasets, tools and information have been efficiently compiled in the “energy theme” of the White House Climate Resilience Toolkit and should be used by planners where appropriate. Other data sources that have projections of future climate change from many different models for various emissions scenarios include:
• Statistically downscaled data from the World Climate Research Programme’s Coupled Model Intercomparison Project phase 3 and phase 5 (CMIP3 and CMIP5)
• Dynamically downscaled data from the North American Regional Climate Change Assessment Program (NARCCAP)
• The American Association of State Climatologists Climate Services Catalog • Climate Model Projections
In addition to applicable TVA historical data, state climatologists may be able to provide additional information on past climate variability, current research projects and existing projections. University research centers may already be doing research on regional climate projections and may be able to provide available data or be interested in partnering in a research effort. State and local environmental or other federal agencies may also be able to provide or develop necessary data that could be useful. Opportunities to partner with other groups that have experience developing or using climate projections my present themselves.

46
5.3.4 Step 3. Determine exposure of assets and operations
Potential vulnerabilities of assets and operations from projected changes in climate and climate variability are diverse in both consequence and timing of impacts. While isolated extreme events may have only minimal and short-term impacts on operational requirements, the cumulative climate change impact of extremes of high temperature, storm-related events, and precipitation may each independently and in combination affect the ability of TVA to perform its mission. A checklist to determine the exposure of assets and operations is included as Table 4, above. 5.3.4.1 Identify types of climate change hazards and associated electricity sector vulnerabilities
Identifying the climate vulnerabilities of assets and operations requires knowledge of projected climate change hazards and of the factors affecting the likelihood of each potential impact (e.g., region, geography, and hydrology, among others). These potential impacts should then be evaluated in tiers of the defined scope. These key hazards or threats are summarized in Table 1. Summary of High-Level Climate Change Adaptation Risks and Opportunities.
5.3.5. Step 4. Estimate the consequences of climate change impacts
Step 4 describes methods for calculating the various costs of climate impacts. These costs vary according to the assets or operations affected, the location and severity of the impacts, and the duration of any service disruptions. Every climate impact carries potential direct costs, which apply to the affected electric utility (asset owner) and indirect costs, which apply to suppliers, customers, or society. The direct and indirect costs associated with impacts on vulnerable assets and operations will be useful in analyzing the costs and benefits of resilience measures.
A checklist for Steps, 2, 3, 4 and 5 is included as Table 6.
Table 6. Part 2, Steps 2, 3, 4 and 5

47
5.3.6 Step 5. Assess Vulnerabilities
Step 5, the final step in the vulnerability assessment, requires a synthesis of the assets and operations exposed to adverse climate events or threats, the likelihood and degree of damage or disruption from the climate events or threats, and the likely severity of impacts if the climate events or threats were to occur. Exposed assets or operations can be displayed in a likelihood-consequence matrix—a useful visualization tool to help decision makers screen and prioritize risks for the resilience plan. A checklist for Step 5 is shown as Table 6.

48
Part 3. Resiliency Planning 8.0 Plans, Policies and Strategies
8.1 The Use of Plans, Policies, and Strategies Adaptation analysis activities do not exist in isolation. For example, other federal agencies, states and cities may develop separate adaptation plans or integrate resiliency strategies into community or general plans. Impacts due to climate change cross community and regional lines, making solutions dependent upon meaningful participation of numerous stakeholders from federal, state, local, and tribal governments, science and academia, the private sector, non-profit organizations, and the general public. 8.1.1 Enterprise Risk Analysis TVA utilizes the Committee of Sponsoring Organizations of the Treadway Commission (COSO) Integrated Framework process to analyze enterprise risk. All entities face uncertainty, and so the challenge for management is to determine how much uncertainty to accept as it strives to achieve its mission. Uncertainty presents both risk and opportunity, and carries the potential to erode or to enhance value. Enterprise risk management enables management to effectively deal with uncertainty and its associated risk and opportunity, enhancing the capacity to build value.
Figure 8. COSO Enterprise Risk Management Framework Components

49
8.2 Step 6. Identify and Assess Resilience Measures
Knowing what options exist can help planners determine whether risk mitigation is likely to be worth the investment. The costs of resilience measures may be substantial. The high cost of some resilience measures and uncertainties regarding risk assessment complicate investment choices and highlight the importance of logically and systematically determining the costs and benefits of resilience solutions— and of proceeding with business as usual. While the costs of climate resilience actions may be significant, the costs of inaction may be even greater. Step 6 provides guidance on examining the range of resilience options, determining the costs and impacts of each, and narrowing the selection of actions or measures for inclusion in the plan.
Table 9. Part 3, Step 6, 7 and 8 Checklist
PART
3
Developing the Resilience Plan:
Includes analysis of the probabilities of adverse climate events, threshold conditions likely to affect important assets or overall system performance, and the consequences or costs of climate impacts.
Step 6. Identify and Assess Resilience Measures
1. Determine Potential Resilience Measures 2. Hardening Existing Assets 3. Planning and Operations 4. Scaling Considerations 5. Determining Costs of Resilience Measures 6. Determine the Potential Benefits of Resilience Measures 7. Determine Avoided Direct and Indirect Costs of Impacts 8. Determine the Co-Benefits of Resilience Measures
Step 7. Build Portfolio of Resilience Measures
1. Evaluate and Prioritize Resilience Measures 2. Develop a Resilience Action Plan 3. Integrate Resilience Action Plans into Agency Decision-Making
Step 8. Monitor, Evaluate, and Reassess 1. Monitor Progress 2. Evaluate Implementation

50
8.2.1 Step 7. Build a Portfolio of Resilience Measures Step 7 assists in determining the most appropriate measures to include in the resilience action plan. This selection process requires a comprehensive evaluation of the candidate measures, including a comparison of the refined cost/benefit estimates to specified criteria and an assessment of each measure’s feasibility, efficacy, co-benefits, and ability to withstand a range or combination of climate impacts. 8.2.2 Step 8. Monitor, Evaluate and Reassess Step 8 provides a framework for monitoring progress, evaluating implementation, and reassessing earlier steps as new information, resources, tools, or technologies become available. Resilience plans must be sufficiently flexible to incorporate new or improved information, including updates on climate change impacts, utility assets, or any other factors affecting system planning and operation.

51
LIST OF ABBREVIATIONS/TERMS
CO2 - Carbon Dioxide CSC - Southeast Climate Science Center DOE - Department of Energy EIS – Environmental Impact Statement EO - Executive Order
EP - Environmental Policy EPRI - Electric Power Research Institute
FACA- Federal Advisory Council Act FEMP - Federal Energy Management Program FWS - U.S. Fish and Wildlife Service GHG - Greenhouse Gas IRP - Integrated Resource Plan LCC - Appalachian Land Conservation Cooperative
LPC - Local Power Company OMB - Office of Management and Budget ORNL - Oak Ridge National Laboratory NCA - U. S. National Climate Assessment NEPA - National Environmental Policy Act NGO-Non-Governmental Organization NRP - Natural Resource Plan NPS - National Park Service RERC - Regional Energy Resource Council ROS - River Operations Study RRSC - Regional Resource Stewardship Council SMP - Shoreline Management Policy SMR - Small Modular Reactor Smart Grid - Grid Modernization SSPP- Strategic Sustainability Performance Plan TVA - Tennessee Valley Authority USGCRP - U.S. Global Change Research Program 8-K- Current Reports filed with Security Exchange Commission 10-K- Annual Report filed with Security Exchange Commission 10-Q- Quarterly Reports filed with Security Exchange Commission

52
End Notes
1 TVA Climate Adaptation and Resiliency Statement 2 Houser, T., S.M. Hsiang, R.E. Kopp, K Larsen, M. Delgado, A.S. Jina, M.D. Mastrandrea, S. Mohan, R. Muir-Woodd, D.J. Rasmussen, J.Rising, and P.Wilson (2015). Economic Risks of Climate Change: An American Prospectus. New York: Columbia University Press. 3 Houser, T., S.M. Hsiang, R.E. Kopp, K Larsen, M. Delgado, A.S. Jina, M.D. Mastrandrea, S. Mohan, R. Muir-Woodd, D.J. Rasmussen, J.Rising, and P.Wilson (2015). Economic Risks of Climate Change: An American Prospectus. New York: Columbia University Press. 4 Diaz, D., Fischer, L., Technical Assessment of Resiliency Metrics and Analytical Frameworks, EPRI, 2018. 3002014571. 5 NIAC, A Framework for Establishing Critical Infrastructure Resilience Goals, Final Report and Recommendations by the Council, October 29, 2010. https://www.dhs.gov/xlibrary/assets/niac/niac-a-framework-for-establishing-critical-infrastructure-resilience-goals-2010-10-19.pdf (accessed 1/16.2020). 6 Houser, T., S.M. Hsiang, R.E. Kopp, K Larsen, M. Delgado, A.S. Jina, M.D. Mastrandrea, S. Mohan, R. Muir-Woodd, D.J. Rasmussen, J.Rising, and P.Wilson (2015). Economic Risks of Climate Change: An American Prospectus. New York: Columbia University Press. 7 (Vugrin et al., 2017). 8 Diaz, D, Fioscher, L, Technical Assessment of Resiliency Metrics and Analytical Frameworks, EPRI, 2018, 3002014571. 9 84 FR 43987 10 Houser, T., S.M. Hsiang, R.E. Kopp, K Larsen, M. Delgado, A.S. Jina, M.D. Mastrandrea, S. Mohan, R. Muir-Woodd, D.J. Rasmussen, J.Rising, and P.Wilson (2015). Economic Risks of Climate Change: An American Prospectus. New York: Columbia University Press.