climate change and overfishing increase neurotoxicant in
TRANSCRIPT

Letterhttps://doi.org/10.1038/s41586-019-1468-9
Climate change and overfishing increase neurotoxicant in marine predatorsAmina t. Schartup1,2*, Colin P. thackray1, Asif Qureshi3, Clifton Dassuncao1,2, Kyle Gillespie4, Alex Hanke4 & elsie M. Sunderland1,2*
More than three billion people rely on seafood for nutrition. However, fish are the predominant source of human exposure to methylmercury (MeHg), a potent neurotoxic substance. In the United States, 82% of population-wide exposure to MeHg is from the consumption of marine seafood and almost 40% is from fresh and canned tuna alone1. Around 80% of the inorganic mercury (Hg) that is emitted to the atmosphere from natural and human sources is deposited in the ocean2, where some is converted by microorganisms to MeHg. In predatory fish, environmental MeHg concentrations are amplified by a million times or more. Human exposure to MeHg has been associated with long-term neurocognitive deficits in children that persist into adulthood, with global costs to society that exceed US$20 billion3. The first global treaty on reductions in anthropogenic Hg emissions (the Minamata Convention on Mercury) entered into force in 2017. However, effects of ongoing changes in marine ecosystems on bioaccumulation of MeHg in marine predators that are frequently consumed by humans (for example, tuna, cod and swordfish) have not been considered when setting global policy targets. Here we use more than 30 years of data and ecosystem modelling to show that MeHg concentrations in Atlantic cod (Gadus morhua) increased by up to 23% between the 1970s and 2000s as a result of dietary shifts initiated by overfishing. Our model also predicts an estimated 56% increase in tissue MeHg concentrations in Atlantic bluefin tuna (Thunnus thynnus) due to increases in seawater temperature between a low point in 1969 and recent peak levels—which is consistent with 2017 observations. This estimated increase in tissue MeHg exceeds the modelled 22% reduction that was achieved in the late 1990s and 2000s as a result of decreased seawater MeHg concentrations. The recently reported plateau in global anthropogenic Hg emissions4 suggests that ocean warming and fisheries management programmes will be major drivers of future MeHg concentrations in marine predators.
The exploitation of fisheries in the northwestern Atlantic Ocean for hundreds of years has led to large fluctuations in herring, lobster and cod stocks, which has altered the structure of food webs and the avail-ability of prey for remaining species5. We synthesized more than three decades of ecosystem data and MeHg concentrations in seawater, sed-iment and biological species that represent five trophic levels from the Gulf of Maine, a marginal sea in the northwestern Atlantic Ocean that has been exploited for commercial fisheries for more than 200 years. These data were used to develop and evaluate a mechanistic model for MeHg bioaccumulation that is based on bioenergetics and predator–prey interactions (see Methods), to better understand the effects of ecosystem changes and overfishing6.
A comparison of simulated MeHg concentrations based on extensive analysis of the stomach contents of two marine predators (Atlantic cod and spiny dogfish, Squalus acanthias) in the 1970s and 2000s reveals that the effects of shifts in trophic structures caused by overfishing differed between these two species (Fig. 1a, b). In the 1970s, cod con-sumed 8% more small clupeids than in the 2000s as a consequence
of the overharvesting and reduced abundance of herring7. Simulated tissue MeHg concentrations in cod (larger than 10 kg) in the 1970s were 6–20% lower than for cod consuming a diet typical of the 2000s that relied more heavily on larger herring, lobster and other macroinver-tebrates7. The 1970s diet for spiny dogfish when herring were limited included a higher proportion (around 20%) of squid and other ceph-alopods, which exhibit higher MeHg concentrations than many other prey fish. In contrast to cod, simulated MeHg concentrations in spiny dogfish were 33–61% higher in the 1970s than in the 2000s, when they consumed more herring and other clupeids7. These results illustrate that perturbations to the trophic structure of marine organisms from overfishing can have contrasting effects on MeHg concentrations across species. Such changes must therefore be assessed before concluding
1Harvard John A. Paulson School of Engineering & Applied Sciences, Harvard University, Cambridge, MA, USA. 2Department of Environmental Health, Harvard T. H. Chan School of Public Health, Harvard University, Boston, MA, USA. 3Department of Civil Engineering, Indian Institute of Technology Hyderabad, Kandi, India. 4Fisheries and Oceans Canada, St Andrews Biological Station, St Andrews, New Brunswick, Canada. *e-mail: [email protected]; [email protected]
–20
–10
0
10
20
30
40
Cha
nge
in M
eHg
cont
ent
(%)
+1 °C Changeof diet
–20%MeHg
–20%MeHg
+1 °C
Changeof diet
–20%MeHg
+1 °C +1 °C Changeof diet
–20%MeHg
–20%MeHg
+1 °C
Changeof diet
–20%MeHg
+1 °C
–20
0
20
40
60
80
Atlantic cod (15 kg) Spiny dog�sh (5 kg)
160
120
80
40
0250 50 50 10
Wet weight of whole �sh (kg)
Atlantic cod (Gadus morhua)
1970s diet
2000s diet
250
200
150
100
50
0
Wet weight of whole �sh (kg)
Spiny dog�sh (Squalus acanthias)
1970s diet2000s diet
a b
c d
Tiss
ue M
eHg
(ng
g–1)
Cha
nge
in M
eHg
cont
ent
(%)
Tiss
ue M
eHg
(ng
g–1)
Fig. 1 | Modelled effects of ecosystem change on MeHg concentrations in Atlantic cod and spiny dogfish. a, b, Differences in modelled MeHg concentrations in Atlantic cod (a) and spiny dogfish (b) based on a diet typical of the 1970s (dotted line) and the 2000s (solid line). Prey preferences for each time period were derived from the stomach contents of more than 2,000 fish7. c, d, Modelled changes in fish MeHg concentrations (relative to a diet typical of the 2000s) that result from a temperature increase of 1 °C; a shift in diet composition driven by overfishing of herring (represented by 1970s prey preferences when this last occurred); an assumed 20% decline in seawater MeHg concentration; the combination of both an increase in temperature and a decrease in seawater MeHg; and the simultaneous combination of all three factors.
N A t U r e | www.nature.com/nature

LetterreSeArCH
that temporal trends in biological MeHg concentrations reflect shifts in environmental Hg contamination.
Northward migration of the Gulf Stream and decadal oscillations in ocean circulation have led to unprecedented seawater warming in the Gulf of Maine between a low point in 1969 and 2015, which places this region in the top 1% of documented seawater temperature anomalies8. Both laboratory and field mesocosm data have demonstrated that rising temperatures lead to increases in MeHg concentrations in estuarine and freshwater fish9,10, but the magnitudes of potential changes in wild species are poorly understood. The effects of seawater warming are complicated by the narrow temperature niches of many marine fish species, which we account for in our food web model (see Methods). Seawater warming of greater than 1–2 °C can lead to shifts in preferred foraging territory to higher latitudes or deeper in the water column, which alters the availability of prey for remaining species11.
The effects of ecosystem changes on MeHg bioaccumulation vary across species and are not additive for predatory fish because of feeding relationships and bioenergetics at lower trophic levels. We modelled the changes in MeHg tissue concentrations in Atlantic cod and spiny dogfish that would result from increases in seawater temperature, declines in seawater MeHg concentrations and shifts in trophic struc-ture due to overfishing (Fig. 1c, d). Experimental data indicate that MeHg uptake by most marine algae is not sensitive to variability in seawater temperature6 and therefore our modelling analysis accounts for temperature-driven changes in MeHg at higher trophic levels, from zooplankton to predatory fish.
For a 15-kg Atlantic cod, our model predicts that an increase of 1 °C in seawater temperature relative to the year 2000 would lead to a 32% increase in simulated tissue MeHg concentrations. A shift in trophic structure characteristic of overexploited herring fisheries would result in a 12% decrease in fish MeHg. In the absence of ecosystem changes, simulated fish MeHg concentrations shift proportionally to seawater MeHg concentrations. If we assume that seawater MeHg concentra-tions decline by approximately 20% as a consequence of reductions in Hg loading, the combination of all three factors simultaneously results in a 10% decrease in tissue MeHg concentrations for Atlantic cod (Fig. 1c).
For a 5-kg spiny dogfish, our model estimates that a tempera-ture increase of 1 °C would result in a 70% increase in tissue MeHg
concentrations, and that switching to a diet that is characteristic of low herring abundance would lead to a 50% increase in fish MeHg. When combined with the assumed 20% decline in seawater MeHg concentrations, the model predicts a 70% increase in tissue MeHg concentrations for dogfish (Fig. 1d). Owing to a large reduction in Hg releases from wastewater and declines in atmospheric deposi-tion of Hg in North America12,13, seawater MeHg concentrations in the northwestern Atlantic Ocean are presumed to have declined since the 1970s (Fig. 2a). Our results help to explain why temporal changes in tissue MeHg concentrations in the Gulf of Maine have been mixed across species, despite declining inputs of Hg to the marine environ-ment since the 1970s12.
We used historical temperature records to further investigate the effects of recent temperature changes on MeHg bioaccumulation in Atlantic bluefin tuna (ABFT), another important marine predator (Fig. 2). No time-series data on seawater MeHg are available, so we extrapolated measured concentrations using information on emissions in North America and projected total Hg concentrations in seawater (see Methods). Increases in seawater temperature coincide with puta-tive declines in seawater MeHg concentrations (Fig. 2b).
The implications of changes in seawater MeHg concentrations (Fig. 2a) and seawater temperature (Fig. 2b) in the Gulf of Maine for tissue MeHg concentrations in 14-year-old ABFT (250 ± 23 cm length14 (mean ± s.d.)) are illustrated in Fig. 2. The dashed line in Fig. 2c shows the changes in MeHg in ABFT tissue that result from changing seawater MeHg only, and the solid line shows the combined influence of changes in seawater MeHg and temperature. Without including the effects of temperature, shifts in MeHg concentrations in ABFT lag peak seawater MeHg concentrations by five years, and the amplitude of the peak is dampened relative to seawater (Fig. 2c, dashed line). Historical temperature oscillations result in an additional lag of six years in maximum MeHg concentrations in ABFT (Fig. 2c, solid line), and reduce the standard error of the modelled tissue MeHg concentrations in ABFT compared to observations (Fig. 2c, symbols) from 120 ng g−1 (Fig. 2c, dashed line) to 95 ng g−1 (Fig. 2c, solid line).
Both the model and observations indicate that a large decline in MeHg concentrations in ABFT occurred after the late 1980s and early 1990s (Fig. 2c). The modelled decrease from peak to low concentrations is equivalent to a 23% decline in tissue MeHg concentrations (Fig. 2c).
–30
–10
10
30
1950 1970 1990 2010 2030
Cha
nge
in M
eHg
(%)
500
750
1,000
1,250
Tiss
ue M
eHg
(ng
g–1)
0.04
0.05
0.06
0.07
Sea
wat
er M
eHg
(pM
)
–2.0
–1.0
0
1.0
2.0
1950 1970 1990 2010 2030
Sea
wat
erte
mp
erat
ure
anom
aly
(ºC
)
Year
Change in seawater MeHgChange in seawater MeHg and temperature
a
Temperature-driven change
ABFT (Thunnus thynnus)
Year ABFT captured
b
c
d
Fig. 2 | Effects of seawater warming in the Gulf of Maine on tissue MeHg concentrations in ABFT. a, Modelled seawater MeHg concentrations over time. The model is based on measured MeHg concentrations between 2008 and 201017 and scaled by modelled temporal changes in seawater Hg12. b, Measured temperature anomaly in seawater in the Gulf of Maine8. The shaded grey area indicates the projected future change. c, Modelled MeHg tissue concentrations in 14-year-old ABFT based on changes in seawater MeHg concentrations (dashed line), and based on the
combined effect of changes in seawater MeHg concentrations and seawater temperature anomaly (solid line). The symbols indicate means of observed concentrations in multiple fish: new data for ABFT that were captured in 2017 (n = 33) are shown as a star; previously published data16,18–20 are shown as crosses16 (n = 83), a square18 (n = 14), a triangle19 (n = 3) and a circle20 (n = 5). Sample size (n) represents the number of independent fish; s.d. and statistics are provided in Extended Data Table 3. d, Changes in MeHg concentrations in ABFT that are due to temperature only.
N A t U r e | www.nature.com/nature

Letter reSeArCH
Observed concentrations in 14-year-old ABFT from the Gulf of Maine show a 31% decrease between 1990 and 2012. Our model results sug-gest that 25–40% of tissue MeHg decreases in the 1990s are attributable to temperature decreases over this decade (Fig. 2d).
Modelled effects of continued warming in the Gulf of Maine suggest a reversal of previous declines, and projected increases of almost 30% in 2015 that are sustained into 2030 (Fig. 2d). Between 2012 and 2017, observations are consistent with model trends and show a statistically significant increase in MeHg (Fig. 2) of more than 3.5% per year in ABFT (one-way ANOVA, P < 0.05). These results illustrate the large effects on bioaccumulative toxicants in marine food webs that are expected as a result of climate-driven changes in marine ecosystems.
Global anthropogenic emissions of Hg have been relatively stable since approximately 20114. In North America and Europe, aggressive Hg regulations that began in the 1970s have successfully reduced or phased out most large Hg sources, and global emissions are now driving atmospheric Hg trajectories in the Northern Hemisphere. This means that future changes in tissue concentrations of MeHg in pelagic marine predators such as ABFT and Atlantic cod in the Gulf of Maine will be strongly influenced by further shifts in seawater temperature and prey availability. Biotic MeHg concentrations in other marine regions are likely to be similarly affected by widespread shifts in trophic interactions and seawater temperature. A two-pronged regulatory effort that involves reductions in the emissions of both greenhouse gases and Hg is therefore needed to reduce MeHg concentrations in pelagic predators. Notably, regulations that aim to reduce air pollution caused by carbon-intensive fuel sources (such as coal-fired utilities) also have the co-benefit of bring-ing about large reductions in anthropogenic Hg releases13.
Atmospheric Hg concentrations in the Northern Hemisphere declined by approximately 30% between the mid-1990s and 2000s, as a result of successful reductions in emissions from coal-fired utilities, industry and waste incinerators, and the phasing out of Hg in many commercial products in the United States and Europe13. Previous studies have suggested that these and other regulations have led to corre-sponding declines in tissue Hg concentrations in ABFT and bluefish (Pomatomus saltatrix) in the Atlantic Ocean15,16. Despite these benefits, recent regulatory proposals in the United States threaten to overturn rules that regulate mercury releases from coal-fired utilities and pro-posals to curb carbon emissions. Climate change is likely to exacer-bate human exposure to MeHg through marine fish, suggesting that stronger rather than weaker regulations are needed to protect ecosystem and human health.
Online contentAny methods, additional references, Nature Research reporting summaries, source data, extended data, supplementary information, acknowledgements, peer review information; details of author contributions and competing interests; and statements of data and code availability are available at https://doi.org/10.1038/s41586-019-1468-9.
Received: 12 November 2018; Accepted: 3 July 2019; Published online xx xx xxxx.
1. Sunderland, E. M., Li, M. & Bullard, K. Decadal changes in the edible supply of seafood and methylmercury exposure in the United States. Environ. Health Perspect. 126, 017006 (2018).
2. Horowitz, H. M. et al. A new mechanism for atmospheric mercury redox chemistry: implications for the global mercury budget. Atmos. Chem. Phys. 17, 6353–6371 (2017).
3. Bellanger, M. et al. Economic benefits of methylmercury exposure control in Europe: monetary value of neurotoxicity prevention. Environ. Health 12, 3 (2013).
4. Streets, D. et al. Global and regional trends in mercury emissions and concentrations. Atmos. Environ. 201, 417–427 (2019).
5. Lotze, H. K. & Milewski, I. Two centuries of multiple human impacts and successive changes in a North Atlantic food web. Ecol. Appl. 14, 1428–1447 (2004).
6. Schartup, A. T. et al. A model for methylmercury uptake and trophic transfer by marine plankton. Environ. Sci. Technol. 52, 654–662 (2018).
7. Smith, B. E. & Link, J. S. The Trophic Dynamics of 50 Finfish and 2 Squid Species on the Northeast US Continental Shelf. NOAA Technical Memorandum NMFS-NE-21 (National Marine Fisheries Service, 2010).
8. Pershing, A. J. et al. Slow adaptation in the face of rapid warming leads to collapse of the Gulf of Maine cod fishery. Science 350, 809–812 (2015).
9. Dijkstra, J. A. et al. Experimental and natural warming elevates mercury concentrations in estuarine fish. PLoS ONE 8, e58401 (2013).
10. Maulvault, A. L. et al. Bioaccumulation and elimination of mercury in juvenile seabass (Dicentrarchus labrax) in a warmer environment. Environ. Res. 149, 77–85 (2016).
11. Cheung, W. W. L. et al. Projecting global marine biodiversity impacts under climate change scenarios. Fish Fish. 10, 235–251 (2009).
12. Sunderland, E. M. et al. Mercury sources and fate in the Gulf of Maine. Environ. Res. 119, 27–41 (2012).
13. Zhang, Y. et al. Observed decrease in atmospheric mercury explained by global decline in anthropogenic emissions. Proc. Natl Acad. Sci. USA 113, 526–531 (2016).
14. Restrepo, V. et al. Updated estimate of the growth curve of Western Atlantic bluefin tuna. Aquat. Living Resour. 23, 335–342 (2010).
15. Cross, F. A., Evans, D. W. & Barber, R. T. Decadal declines of mercury in adult bluefish (1972–2011) from the Mid-Atlantic coast of the U.S.A. Environ. Sci. Technol. 49, 9064–9072 (2015).
16. Lee, C.-S. et al. Declining mercury concentrations in bluefin tuna reflect reduced emissions to the North Atlantic Ocean. Environ. Sci. Technol. 50, 12825–12830 (2016).
17. Hammerschmidt, C. R., Finiguerra, M. B., Weller, R. L. & Fitzgerald, W. F. Methylmercury accumulation in plankton on the continental margin of the northwest Atlantic Ocean. Environ. Sci. Technol. 47, 3671–3677 (2013).
18. Hellou, J., Fancey, L. & Payne, J. Concentrations of twenty-four elements in bluefin tuna, Thunnus thynnus from the Northwest Atlantic. Chemosphere 24, 211–218 (1992).
19. Harding, G., Dalziel, J. & Vass, P. Bioaccumulation of methylmercury within the marine food web of the outer Bay of Fundy, Gulf of Maine. PLoS ONE 13, e0197220 (2018).
20. Peterson, C. L., Klawe, W. L. & Sharp, G. D. Mercury in tunas: a review. Fish Bull. 71, 603–613 (1973).
Publisher’s note: Springer Nature remains neutral with regard to jurisdictional claims in published maps and institutional affiliations.
© The Author(s), under exclusive licence to Springer Nature Limited 2019
N A t U r e | www.nature.com/nature
LetterreSeArCH
MethodsMercury concentration data in fish. Many studies report total Hg rather than MeHg in fish tissue. Extensive data on total Hg and MeHg concentrations in pelagic, demersal and benthic food webs of the Gulf of Maine were collected between 2000 and 200219. We used the measured MeHg fraction (90%) to scale total Hg values for ABFT. For lower trophic levels with variable MeHg concentra-tions we relied on direct MeHg measurements. Size-fractionated phytoplankton and zooplankton samples were obtained on research cruises and zooplankton spe-cies were identified and separated by a plankton ecologist. These data are shown in Extended Data Table 1. Fish and shellfish data are summarized in Extended Data Table 2. Trophic levels were determined from stable nitrogen isotopes (δ15N) measured in the same samples.
Mercury concentrations in apex predators were compiled from several sources. A previous study21 reported total Hg in swordfish (Xiphias gladius) from the west-ern Atlantic Ocean (n = 192) with corresponding weights. Another research team measured total Hg in n = 1,279 ABFT harvested from the Gulf of Maine16. Length (cm) and body weights (kg) were available for all tuna and used to estimate age, which ranged from 9 to 14 years. Data from this study16 were converted from dressed weight to whole weight by multiplying dressed weight by 1.25.
Temporal data on MeHg concentrations in ABFT harvested from the Gulf of Maine were compiled from several sources, for fish lengths (250 ± 23 cm (mean ± s.d.)) and ages that correspond to approximately 14-year-old fish (Extended Data Table 3). For 1971 (n = 5)20 and 2002 (n = 3)19, 14-year old fish were identified based on reported length. For 1990, reported fish ages (n = 14) ranged between 8 and 15 years18. For 2004–2012, MeHg concentrations in 14-year-old ABFT harvested from the Gulf of Maine were reported in a comprehensive study16. ABFT tissue from individual fish harvested in 2017 from the Gulf of Maine were analysed for Hg in this study and are reported in Extended Data Table 3.Food web bioaccumulation model. Measured MeHg concentrations in the north-western Atlantic Ocean (Extended Data Fig. 1a) show characteristic increases across more than five trophic levels (derived from δ15N)19. However, MeHg con-centrations in swordfish and ABFT are underpredicted by the linear relationship between log[MeHg] and δ15N. The slope of this relationship is known as the trophic magnification slope, and this parameter has been used to assess global patterns in biomagnification of MeHg in freshwater ecosystems22. However, the factors that govern variability in trophic magnification slopes across ecosystems are poorly understood, and their application to marine ecosystems is further complicated by potential shifts in baseline δ15N for migratory species such as ABFT and sword-fish23. We therefore developed a new mechanistic model for biomagnification of MeHg in marine food webs as a function of ecosystem properties6.
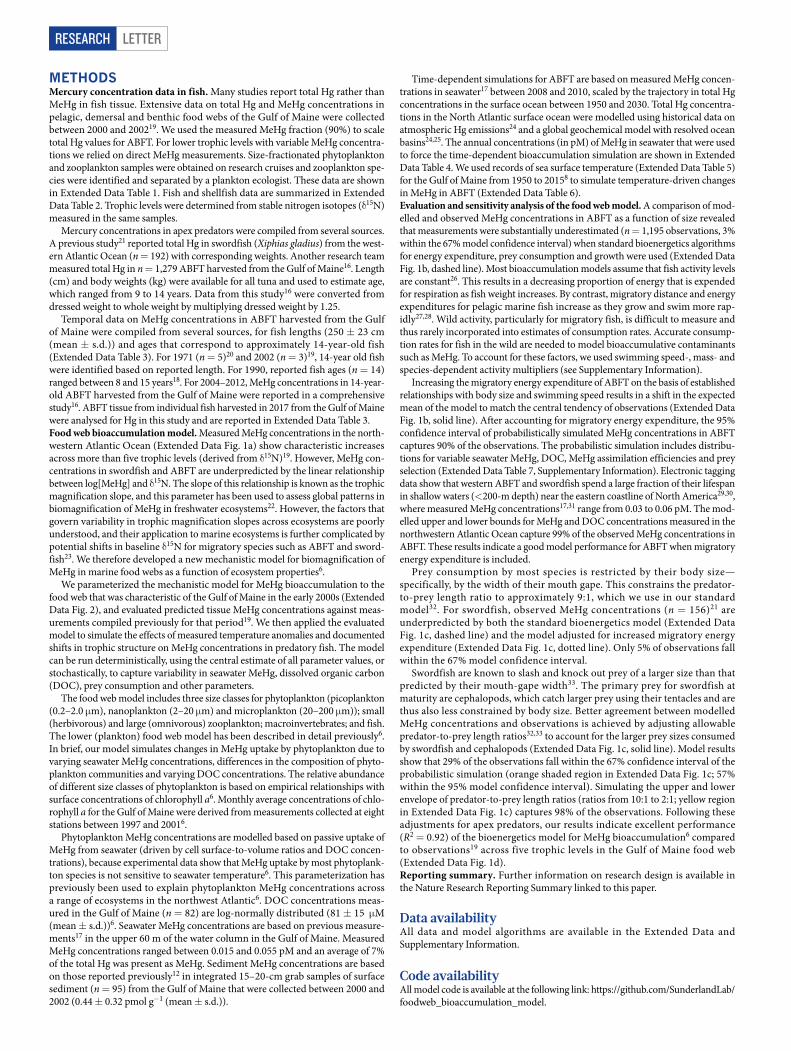
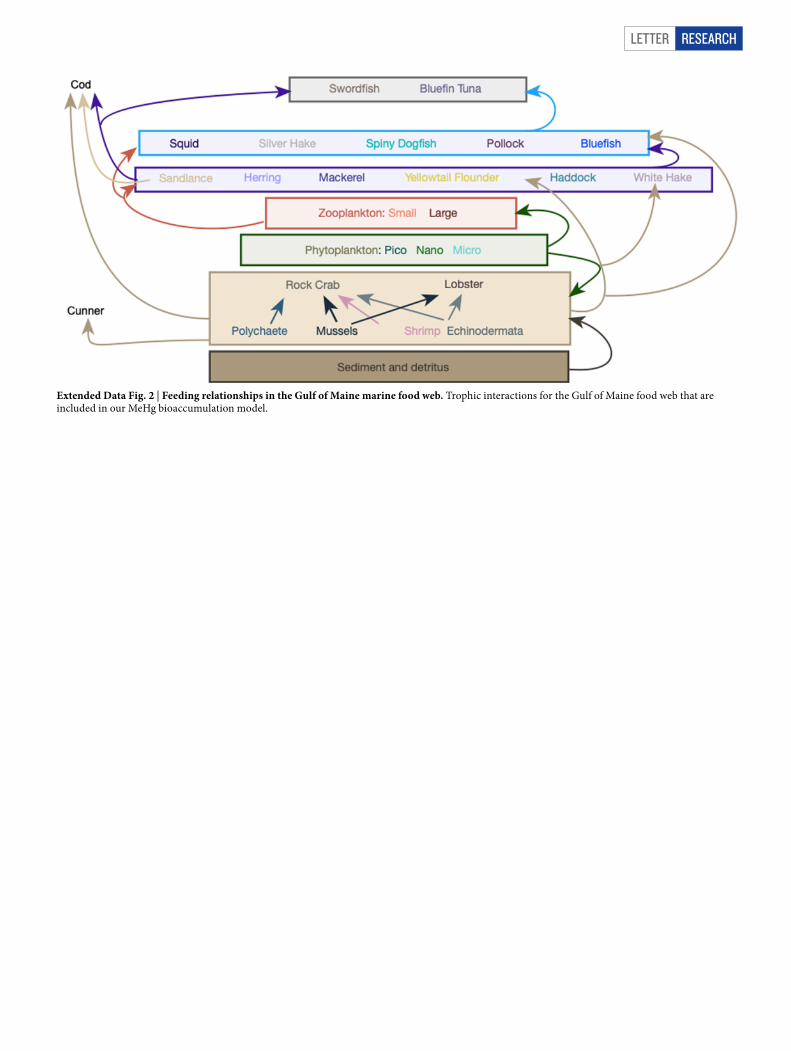
We parameterized the mechanistic model for MeHg bioaccumulation to the food web that was characteristic of the Gulf of Maine in the early 2000s (Extended Data Fig. 2), and evaluated predicted tissue MeHg concentrations against meas-urements compiled previously for that period19. We then applied the evaluated model to simulate the effects of measured temperature anomalies and documented shifts in trophic structure on MeHg concentrations in predatory fish. The model can be run deterministically, using the central estimate of all parameter values, or stochastically, to capture variability in seawater MeHg, dissolved organic carbon (DOC), prey consumption and other parameters.
The food web model includes three size classes for phytoplankton (picoplankton (0.2–2.0 μm), nanoplankton (2–20 μm) and microplankton (20–200 μm)); small (herbivorous) and large (omnivorous) zooplankton; macroinvertebrates; and fish. The lower (plankton) food web model has been described in detail previously6. In brief, our model simulates changes in MeHg uptake by phytoplankton due to varying seawater MeHg concentrations, differences in the composition of phyto-plankton communities and varying DOC concentrations. The relative abundance of different size classes of phytoplankton is based on empirical relationships with surface concentrations of chlorophyll a6. Monthly average concentrations of chlo-rophyll a for the Gulf of Maine were derived from measurements collected at eight stations between 1997 and 20016.
Phytoplankton MeHg concentrations are modelled based on passive uptake of MeHg from seawater (driven by cell surface-to-volume ratios and DOC concen-trations), because experimental data show that MeHg uptake by most phytoplank-ton species is not sensitive to seawater temperature6. This parameterization has previously been used to explain phytoplankton MeHg concentrations across a range of ecosystems in the northwest Atlantic6. DOC concentrations meas-ured in the Gulf of Maine (n = 82) are log-normally distributed (81 ± 15 μM (mean ± s.d.))6. Seawater MeHg concentrations are based on previous measure-ments17 in the upper 60 m of the water column in the Gulf of Maine. Measured MeHg concentrations ranged between 0.015 and 0.055 pM and an average of 7% of the total Hg was present as MeHg. Sediment MeHg concentrations are based on those reported previously12 in integrated 15–20-cm grab samples of surface sediment (n = 95) from the Gulf of Maine that were collected between 2000 and 2002 (0.44 ± 0.32 pmol g−1 (mean ± s.d.)).
Time-dependent simulations for ABFT are based on measured MeHg concen-trations in seawater17 between 2008 and 2010, scaled by the trajectory in total Hg concentrations in the surface ocean between 1950 and 2030. Total Hg concentra-tions in the North Atlantic surface ocean were modelled using historical data on atmospheric Hg emissions24 and a global geochemical model with resolved ocean basins24,25. The annual concentrations (in pM) of MeHg in seawater that were used to force the time-dependent bioaccumulation simulation are shown in Extended Data Table 4. We used records of sea surface temperature (Extended Data Table 5) for the Gulf of Maine from 1950 to 20158 to simulate temperature-driven changes in MeHg in ABFT (Extended Data Table 6).Evaluation and sensitivity analysis of the food web model. A comparison of mod-elled and observed MeHg concentrations in ABFT as a function of size revealed that measurements were substantially underestimated (n = 1,195 observations, 3% within the 67% model confidence interval) when standard bioenergetics algorithms for energy expenditure, prey consumption and growth were used (Extended Data Fig. 1b, dashed line). Most bioaccumulation models assume that fish activity levels are constant26. This results in a decreasing proportion of energy that is expended for respiration as fish weight increases. By contrast, migratory distance and energy expenditures for pelagic marine fish increase as they grow and swim more rap-idly27,28. Wild activity, particularly for migratory fish, is difficult to measure and thus rarely incorporated into estimates of consumption rates. Accurate consump-tion rates for fish in the wild are needed to model bioaccumulative contaminants such as MeHg. To account for these factors, we used swimming speed-, mass- and species-dependent activity multipliers (see Supplementary Information).
Increasing the migratory energy expenditure of ABFT on the basis of established relationships with body size and swimming speed results in a shift in the expected mean of the model to match the central tendency of observations (Extended Data Fig. 1b, solid line). After accounting for migratory energy expenditure, the 95% confidence interval of probabilistically simulated MeHg concentrations in ABFT captures 90% of the observations. The probabilistic simulation includes distribu-tions for variable seawater MeHg, DOC, MeHg assimilation efficiencies and prey selection (Extended Data Table 7, Supplementary Information). Electronic tagging data show that western ABFT and swordfish spend a large fraction of their lifespan in shallow waters (<200-m depth) near the eastern coastline of North America29,30, where measured MeHg concentrations17,31 range from 0.03 to 0.06 pM. The mod-elled upper and lower bounds for MeHg and DOC concentrations measured in the northwestern Atlantic Ocean capture 99% of the observed MeHg concentrations in ABFT. These results indicate a good model performance for ABFT when migratory energy expenditure is included.
Prey consumption by most species is restricted by their body size— specifically, by the width of their mouth gape. This constrains the predator- to-prey length ratio to approximately 9:1, which we use in our standard model32. For swordfish, observed MeHg concentrations (n = 156)21 are underpredicted by both the standard bioenergetics model (Extended Data Fig. 1c, dashed line) and the model adjusted for increased migratory energy expenditure (Extended Data Fig. 1c, dotted line). Only 5% of observations fall within the 67% model confidence interval.
Swordfish are known to slash and knock out prey of a larger size than that predicted by their mouth-gape width33. The primary prey for swordfish at maturity are cephalopods, which catch larger prey using their tentacles and are thus also less constrained by body size. Better agreement between modelled MeHg concentrations and observations is achieved by adjusting allowable predator-to-prey length ratios32,33 to account for the larger prey sizes consumed by swordfish and cephalopods (Extended Data Fig. 1c, solid line). Model results show that 29% of the observations fall within the 67% confidence interval of the probabilistic simulation (orange shaded region in Extended Data Fig. 1c; 57% within the 95% model confidence interval). Simulating the upper and lower envelope of predator-to-prey length ratios (ratios from 10:1 to 2:1; yellow region in Extended Data Fig. 1c) captures 98% of the observations. Following these adjustments for apex predators, our results indicate excellent performance (R2 = 0.92) of the bioenergetics model for MeHg bioaccumulation6 compared to observations19 across five trophic levels in the Gulf of Maine food web (Extended Data Fig. 1d).Reporting summary. Further information on research design is available in the Nature Research Reporting Summary linked to this paper.
Data availabilityAll data and model algorithms are available in the Extended Data and Supplementary Information.
Code availabilityAll model code is available at the following link: https://github.com/SunderlandLab/ foodweb_bioaccumulation_model.

Letter reSeArCH
21. Mendez, E., Giudice, H., Pereira, A., Inocente, G. & Medina, D. Total mercury content—fish weight relationship in swordfish (Xiphias gladius) caught in the Southwest Atlantic Ocean. J. Food Compos. Anal. 14, 453–460 (2001).
22. Lavoie, R. A., Jardine, T. D., Chumchal, M. M., Kidd, K. A. & Campbell, L. M. Biomagnification of mercury in aquatic food webs: a worldwide meta-analysis. Environ. Sci. Technol. 47, 13385–13394 (2013).
23. Hoen, D. K. et al. Amino acid 15N trophic enrichment factors of four large carnivorous fishes. J. Exp. Mar. Biol. Ecol. 453, 76–83 (2014).
24. Streets, D. G. et al. Total mercury released to the environment by human activities. Environ. Sci. Technol. 51, 5969–5977 (2017).
25. Sunderland, E. M. & Mason, R. P. Human impacts on open ocean mercury concentrations. Glob. Biogeochem. Cycles 21, GB4022 (2007).
26. Kitchell, J. F., Stewart, D. J. & Weininger, D. Applications of a bioenergetics model to yellow perch (Perca flavescens) and walleye (Stizostedion vitreum vitreum). J. Fish. Res. Board Can. 34, 1922–1935 (1977).
27. Nøttestad, L., Giske, J., Holst, J. C. & Huse, G. A length-based hypothesis for feeding migrations in pelagic fish. Can. J. Fish. Aquat. Sci. 56, 26–34 (1999).
28. Rudstam, L. G. Exploring the dynamics of herring consumption in the Baltic: applications of an energetics model of fish growth. Kieler Meeresforschungen Sonderheft 6, 312–322 (1988).
29. Block, B. A. et al. Migratory movements, depth preferences, and thermal biology of Atlantic bluefin tuna. Science 293, 1310–1314 (2001).
30. Neilson, J. D. et al. Seasonal distributions and migrations of Northwest Atlantic swordfish: inferences from integration of pop-up satellite archival tagging studies. PLoS ONE 9, e112736 (2014).
31. Bowman, K. L., Hammerschmidt, C. R., Lamborg, C. H. & Swarr, G. Mercury in the North Atlantic Ocean: the U.S. GEOTRACES zonal and meridional sections. Deep Sea Res. Part II Top. Stud. Oceanogr. 116, 251–261 (2015).
32. Scharf, F. S., Juanes, F. & Rountree, R. Predator size–prey size relationships of marine fish predators: interspecific variation and effects of ontogeny and body size on trophic-niche breadth. Mar. Ecol. Prog. Ser. 208, 229–248 (2000).
33. Young, J., Lansdell, M., Riddoch, S. & Revill, A. Feeding ecology of broadbill swordfish, Xiphias gladius, off eastern Australia in relation to physical and environmental variables. Bull. Mar. Sci. 79, 793–809 (2006).
Acknowledgements We thank S. Durkee at the US Environmental Protection Agency (EPA) for discussion of this work; P. Balcom and P. Béziat for assistance in analysing fish Hg samples; and C. S. Lee, N. Fisher and G. Harding for biological data. Financial support for this study was provided by the US EPA (contract EP-H-11-001346); the US National Science Foundation (OCE 1260464); and the Nereus Program sponsored by the Nippon Foundation. Statements in this publication represent the professional views of the authors and should not be construed to represent any determination or policy of the US EPA.
Author contributions E.M.S. initiated the study; A.T.S. synthesized data and performed research; A.T.S., C.P.T., A.Q. and C.D. developed the model; K.G. and A.H. provided new data on ABFT; and A.T.S. and E.M.S. wrote the manuscript. All authors helped to interpret the results and provided comments.
Competing interests The authors declare no competing interests.
Additional informationsupplementary information is available for this paper at https://doi.org/ 10.1038/s41586-019-1468-9.Correspondence and requests for materials should be addressed to A.T.S. or E.M.S.Peer review information Nature thanks Richard T. Barber and the other, anonymous, reviewer(s) for their contribution to the peer review of this work.Reprints and permissions information is available at http://www.nature.com/reprints.

LetterreSeArCH
Extended Data Fig. 1 | Comparison of observed and modelled MeHg concentrations from a marine food web in the Gulf of Maine. a, Measured MeHg concentrations in biota and trophic positions based on nitrogen isotopes19. b, Measured (symbols) MeHg concentrations16,19 in ABFT from the Gulf of Maine compared to modelled concentrations based on standard bioenergetics algorithms (dashed line) and based on bioenergetics algorithms adjusted for the energy consumption that is associated with migration and rapid swimming speeds (solid line). The blue shaded region shows the 67% confidence interval around the model and the grey shaded region represents the upper and lower bounds of modelled seawater MeHg and DOC concentrations. Each data point represents an individual fish; n = 1,284. c, Measured (symbols) MeHg concentrations21 in swordfish and modelled MeHg concentrations based
on standard bioenergetics algorithms (dashed line); algorithms adjusted for migratory energy expenditure and swimming speed (dotted line); and algorithms adjusted for energy expenditure and large prey consumption (solid line). The yellow shaded region indicates the upper and lower bounds of predator-to-prey length ratios (10:1 to 2:1), the orange shaded region shows the 67% confidence interval around the model and the grey shaded region represents the upper and lower bounds of modelled seawater MeHg and DOC. Each data point represents an individual fish; n = 203. d, Comparison of observed and modelled MeHg concentrations for the Gulf of Maine food web across five trophic levels19. The model is forced by seawater MeHg concentrations17 ranging from 0.015 to 0.055 pM. Each data point represents the mean MeHg concentration in fish of a similar weight (n = 119); error bars represent s.d.
Letter reSeArCH
Extended Data Fig. 2 | Feeding relationships in the Gulf of Maine marine food web. Trophic interactions for the Gulf of Maine food web that are included in our MeHg bioaccumulation model.

LetterreSeArCH
extended data table 1 | Mehg in Gulf of Maine plankton
MeHg concentrations (ng g−1; mean ± s.d.) measured in Gulf of Maine plankton between 2000 and 200219. Plankton were collected yearly with 3–5 tows and sieved for size fractions. Macroplankton, ichthyoplankton and nekton were collected yearly with 4–5 Vass–Tucker trawls19.*Trophic level (TL) was estimated previously19 as TL = 1 + (δ15N + 0.03)/3.4.

Letter reSeArCH
extended data table 2 | Mehg in Gulf of Maine fish and shellfish
MeHg concentrations (ng g−1; mean ± s.d.) measured in Gulf of Maine fish and shellfish between 2000 and 200219.*Trophic level (TL) was estimated previously19 as TL = 1 + (δ15N + 0.03)/3.4.

LetterreSeArCH
extended data table 3 | Mehg in Gulf of Maine ABFt
MeHg concentrations (ng g−1; mean ± s.d.) measured in ABFT that were captured in the Gulf of Maine between 1971 and 2017. All fish are approximately 14 years old or have a curved fork length of 250 ± 23 cm14 (mean ± s.d.).†MeHg was estimated as 90% of total Hg on the basis of previously published measurements19.‡A one-way ANOVA was used for each ABFT cohort to investigate the statistical significance of differences in fish MeHg concentrations between years (P < 0.05). Common letters indicate groups with no significant difference in between-group comparisons (post hoc analysis using Tukey’s test). Statistical analysis was performed in R (v.3.4.3).§Dorsal or cranial muscle tissue from ABFT that were captured in the Gulf of Maine in 2017 was freeze-dried and homogenized. Total Hg content was measured using a Nippon MA-3000 direct thermal decomposition Hg analyser at Harvard University. Average recoveries of certified reference materials were 104.0 ± 0.6% (mean ± s.d.) (TORT, n = 5) and 102.2 ± 1.7% (mean ± s.d.) (DORM-4, n = 8). The relative precision of duplicate samples (RPD) was 3.1%.

Letter reSeArCH
extended data table 4 | Modelled changes in seawater Mehg in the Gulf of Maine
Seawater MeHg concentrations that were used to force modelled changes in MeHg tissue concentrations in ABFT.*Time series is based on average measured concentrations17 in the upper 60 m of the Gulf of Maine between 2008 and 2010 (grey shaded cells) and scaled by the trajectory in modelled total Hg in seawater between 1950 and 203024,25.

LetterreSeArCH
extended data table 5 | Changes in seawater temperature in the Gulf of Maine
Deviation (δT) from average seawater temperature (T,°C) in the Gulf of Maine. Grey shading indicates projected temperatures. Data are from a previous study8.

Letter reSeArCH
extended data table 6 | Food web model algorithms
Model algorithms for MeHg accumulation in marine predators. Additional background information is provided in the Supplementary Information and in our previous study6.

LetterreSeArCH
extended data table 7 | trophic interactions in the food web model
Feeding preferences of predator species in the Gulf of Maine. All feeding preferences are based on a synthesis of stomach-contents data by the Northeast Fisheries Science Center (NEFSC)7.*Predator no. 25 is ABFT and predator no. 26 is swordfish.

1
nature research | reporting summ
aryApril 2018
Corresponding author(s): Elsie Sunderland
Reporting SummaryNature Research wishes to improve the reproducibility of the work that we publish. This form provides structure for consistency and transparency in reporting. For further information on Nature Research policies, see Authors & Referees and the Editorial Policy Checklist.
Statistical parametersWhen statistical analyses are reported, confirm that the following items are present in the relevant location (e.g. figure legend, table legend, main text, or Methods section).
n/a Confirmed
The exact sample size (n) for each experimental group/condition, given as a discrete number and unit of measurement
An indication of whether measurements were taken from distinct samples or whether the same sample was measured repeatedly
The statistical test(s) used AND whether they are one- or two-sided Only common tests should be described solely by name; describe more complex techniques in the Methods section.
A description of all covariates tested
A description of any assumptions or corrections, such as tests of normality and adjustment for multiple comparisons
A full description of the statistics including central tendency (e.g. means) or other basic estimates (e.g. regression coefficient) AND variation (e.g. standard deviation) or associated estimates of uncertainty (e.g. confidence intervals)
For null hypothesis testing, the test statistic (e.g. F, t, r) with confidence intervals, effect sizes, degrees of freedom and P value noted Give P values as exact values whenever suitable.
For Bayesian analysis, information on the choice of priors and Markov chain Monte Carlo settings
For hierarchical and complex designs, identification of the appropriate level for tests and full reporting of outcomes
Estimates of effect sizes (e.g. Cohen's d, Pearson's r), indicating how they were calculated
Clearly defined error bars State explicitly what error bars represent (e.g. SD, SE, CI)
Our web collection on statistics for biologists may be useful.
Software and codePolicy information about availability of computer code
Data collection We generated a new model for marine food web bioaccumulation of methylmercury in this study. All data and algorithms are provided in the SI and described in full.
Data analysis All algorithms used in our study are provided in the supporting information and the code will be made available on request.
For manuscripts utilizing custom algorithms or software that are central to the research but not yet described in published literature, software must be made available to editors/reviewers upon request. We strongly encourage code deposition in a community repository (e.g. GitHub). See the Nature Research guidelines for submitting code & software for further information.
DataPolicy information about availability of data
All manuscripts must include a data availability statement. This statement should provide the following information, where applicable: - Accession codes, unique identifiers, or web links for publicly available datasets - A list of figures that have associated raw data - A description of any restrictions on data availability
Data tables for data used in this study are provided in the extended and supporting information.

2
nature research | reporting summ
aryApril 2018
Field-specific reportingPlease select the best fit for your research. If you are not sure, read the appropriate sections before making your selection.
Life sciences Behavioural & social sciences Ecological, evolutionary & environmental sciences
For a reference copy of the document with all sections, see nature.com/authors/policies/ReportingSummary-flat.pdf
Ecological, evolutionary & environmental sciences study designAll studies must disclose on these points even when the disclosure is negative.
Study description
Research sample
Sampling strategy
This study presents a new model for the influence of ecosystem change on methylmercury bioaccumulation in marine food webs of the Northwestern Atlantic Ocean over the past 30 years. Empirical data were used to quantitatively evaluate a mechanistic simulation model for methylmercury bioaccumulation and evaluate changes over time.
Data include concentrations of methymercury measured in a variety of marine species from the Northwestern Atlantic Ocean, stomach contents data from government databases, previously published data on seawater temperature anomalies, and seawater concentrations of dissolved organic carbon and methylmercury, and sediment concentrations of methylmercury.
This study was based on all available data/samples over the last 30 years. No new sampling was conducted.
Data collection Data were collected from diverse sources in the peer-reviewed literature and government databases.
Timing and spatial scale
Data exclusions
Study focuses on model evaluation for the 2000-2003 period and patterns in temperature and methylmercury accumulation between the 1970s to present in the Northwestern Atlantic Ocean.
We present results for temporal changes in a single tuna age/length class of Atlantic bluefin tuna. Other ages/lengths would require additional simulations and are not included in this study.
Reproducibility All results are reproducible with code provided in this study.
Randomization
Blinding
Did the study involve field work? Yes No
Reporting for specific materials, systems and methods
Materials & experimental systemsn/a Involved in the study
Unique biological materials
Antibodies
Eukaryotic cell lines
Palaeontology
Animals and other organisms
Human research participants
Methodsn/a Involved in the study
ChIP-seq
Flow cytometry
MRI-based neuroimaging
Blinding was not relevant to this study because it involved a synthesis of data on fish Hg concentrations and ecological shifts.
Data on fish Hg concentrations were selected for similar length/age categories to ensure comparability. No randomization was needed.
This study does not include new experimental results. Code has been validated.