climate change and water resources management: a federal perspective
TRANSCRIPT

Brekke and others—Clim
ate Change and Water Resources M
anagement: A
Federal Perspective—Circular 1331
U.S. Department of the InteriorU.S. Geological Survey
US Army Corpsof Engineers®
Climate Change and Water Resources Management: A Federal Perspective
Circular 1331

Climate Change and Water Resources Management: A Federal Perspective
By Levi D. Brekke, Julie E. Kiang, J. Rolf Olsen, Roger S. Pulwarty, David A. Raff, D. Phil Turnipseed, Robert S. Webb, and Kathleen D. White
Circular 1331
U.S. Department of the InteriorU.S. Geological Survey
U.S. Department of the InteriorDIRK KEMPTHORNE, Secretary
U.S. Geological SurveyMark D. Myers, Director
U.S. Geological Survey, Reston, Virginia: 2009
For product and ordering information: World Wide Web: http://www.usgs.gov/pubprod Telephone: 1–888–ASK–USGS
For more information on the USGS—the Federal source for science about the Earth, its natural and living resources, natural hazards, and the environment: World Wide Web: http://www.usgs.gov Telephone: 1–888–ASK–USGS
Any use of trade, product, or firm names is for descriptive purposes only and does not imply endorsement by the U.S. Government.
Although this report is in the public domain, permission must be secured from the individual copyright owners to reproduce any copyrighted material contained within this report.
Cover: Photograph showing Parker Dam in Arizona and California. Photograph courtesy Bureau of Reclamation.
Back cover (clockwise from top left corner): U.S. Geological Survey suspended sediment sampling at Little Colorado River in Arizona; Salt-Gila project in Arizona (courtesy Bureau of Reclamation); U.S. Geological Survey discharge measurement at Goose River in North Dakota; U.S. Army Corps of Engineers pump and levee at Davenport, Iowa (courtesy U.S. Army Corps of Engineers); sandbags and a temporary floodwall in Hannibal, Mo. (courtesy U.S. Army Corps of Engineers); and Mark Twain Lake and Clarence Cannon Dam in Missouri (courtesy U.S. Army Corps of Engineers).
Suggested citation: Brekke, L.D., Kiang, J.E., Olsen, J.R., Pulwarty, R.S., Raff, D.A., Turnipseed, D.P., Webb, R.S., and White, K.D., 2009, Climate change and water resources management—A Federal perspective: U.S. Geological Survey Circular 1331, 65 p. (Also available online at http://pubs.usgs.gov/circ/1331/.)
ISBN 978–1–4113–2325–4

iii
Contents
Executive Summary ......................................................................................................................................1Chapter 1—Introduction ......................................................................................................................1Chapter 2—Tracking Climate Change Impacts ................................................................................1Chapter 3—Anticipating Climate Change: Available Climate Information for
Decisionmaking in Long-Range Planning ...........................................................................2Chapter 4—Anticipating Climate Change: Approaches for Decisionmaking .............................2Chapter 5—Responding to Climate Change: Adaptation Options ................................................2Chapter 6—Opportunities for Advancing Planning Capabilities ..................................................3
1 Introduction ...............................................................................................................................................51.1 Is Climate Changing? ....................................................................................................................51.2 What Climate Changes are of Most Concern to Water Resources Management? ...........61.3 How is Climate Information Used in Water Resources Management? ................................71.4 Other Changes Affecting Water Resources Management .....................................................81.5 Sector Impacts Due to Climate Change ....................................................................................9
2 Tracking Climate Change Impacts ........................................................................................................132.1 Tracking Hydrologic Change: Monitoring Networks .............................................................132.2 Tracking Hydrologic Change: Trend Analysis .........................................................................132.3 Improving Process Understanding and Modeling Capabilities ..........................................15
3 Anticipating Climate Change: Available Climate Information for Decisionmaking in Long-Range Planning ....................................................................................................................17
3.1 Use of Climate Information in General Long-Range Systems Evaluations ........................173.1.1 Establishing Assumptions and a Plausible Planning Future Through
Traditional Use of Instrumental Records ..................................................................173.1.2 Expanding the Set of Plausible Planning Futures Using Stochastic
Modeling and Paleoclimate Information .................................................................183.1.3 Defining Plausible Planning Futures Based on Climate Projection
Information ...................................................................................................................193.2 Use of Climate Information in Flood-Risk Evaluations ...........................................................20
3.2.1 Flood-Risk Evaluation Methods .....................................................................................203.2.2 Incorporating Climate Projection Information Into Flood-Risk Evaluations ..........203.2.3 Incorporating Paleoflood Information Into Flood-Risk Evaluations ........................21
3.3 Recent Reclamation and USACE Planning Applications Involving the Use of Expanded Climate Information Sets ...................................................................................21
3.4 Summary and Discussion ..........................................................................................................214 Anticipating Climate Change: Approaches for Decisionmaking .....................................................23
4.1 Decisions and Scales..................................................................................................................234.2 Describing Future Climate for Planning ...................................................................................234.3 Incorporating Uncertainties in Planning .................................................................................254.4 Other Methods for Choosing Alternatives ...............................................................................25
4.4.1 Robust Decision Criteria .................................................................................................254.4.2 Adaptive Management ...................................................................................................26
4.5 Summary .......................................................................................................................................26

iv
5 Responding to Climate Change: Adaptation Options .........................................................................295.1 Adaptation Options Involving Operational Changes ..............................................................295.2 Adaptation Options Involving Water-Demand Management ...............................................305.3 Adaptation Options Involving Infrastructure Modifications .................................................305.4 Challenges ....................................................................................................................................315.5 Summary .......................................................................................................................................31
6 Opportunities To Improve Planning Capabilities ...............................................................................336.1 Knowledge Gaps and Potential Research Priorities ............................................................336.2 Gaps in Existing Hydrologic and Meteorologic Data Networks .........................................356.3 Understanding and Incorporating Nonstationarity Concepts ..............................................356.4 Opportunities To Improve Planning ..........................................................................................366.5 Opportunities for Further Collaboration ...................................................................................366.6 Summary .......................................................................................................................................37
7 References Cited .....................................................................................................................................39Appendix A. Paleoclimate Reconstruction of Past Droughts and Floods .........................................47
A1 Drought Reconstruction .............................................................................................................47A2 Flood Reconstruction ..................................................................................................................48A3 References Cited .........................................................................................................................48
Appendix B. Downscaling General Circulation Model Results ...........................................................51B1 Downscaling Methods ................................................................................................................51B2 Downscaled Climate Projections Archive ...............................................................................52B3 References Cited .........................................................................................................................53
Appendix C. Recent Reclamation and USACE Planning Applications Involving the Use of Expanded Climate Information Sets ............................................................................................55
C1 Lake Ontario–St. Lawrence River Study ..................................................................................55C1.1 Process and Purpose ......................................................................................................55C1.2 Role of Climate Information ............................................................................................56
C2 Colorado River Basin Study ........................................................................................................57C2.1 Process and Purpose ......................................................................................................57C2.2 Role of Climate Information ............................................................................................57
C3 California Central Valley Study ..................................................................................................59C3.1 Process and Purpose ......................................................................................................59C3.2 Role of Climate Information ............................................................................................60
C4 References Cited ..........................................................................................................................62Appendix D. Glossary ..................................................................................................................................65
Figures 1. Smoothed reconstructions of large-scale surface temperature variations .......................6 2. Trends in yearly dates of spring snowmelt onset and centers of volume of yearly
streamflow hydrographs in western North America ..............................................................7 3. Change in 30-year mean annual precipitation .........................................................................7 4. Global mean sea level observed since 1870 and projected for the future ..........................7 5. Average frequency of western U.S. forest wildfires by elevation and early, mid-,
and late snowmelt years from 1970 to 2002 ............................................................................10

v
6. Mean seasonal precipitation changes over North America ...............................................10 7. Fractional area of the country affected by ice storms .........................................................11 8. Analytical framework for relating climate to water supplies, demands, and
constraints. ..................................................................................................................................17 9. Bottom-up and top-down scenario definitions in climate change assessments ............24 10. Age map indicating the last published regional-regression analysis for rural
peak flows ....................................................................................................................................35 C–1. Geographic setting for International Joint Commission ......................................................55 C–2. Projected 2050 climate change conditions ............................................................................56 C–3. Locations of the Colorado River Basin hydrologic input sites in the Colorado
River Simulation System ............................................................................................................58 C–4. Probabilistic projection of Lake Mead end-of-December elevations ................................59 C–5. Estimated natural flow of the Colorado River at the Lees Ferry gaging station,
Arizona ..........................................................................................................................................59 C–6. California Central Valley Project and State Water Project service areas. .......................60 C–7. “Above Folsom Lake” location .................................................................................................61 C–8. Evaluation of climate projections spread ...............................................................................61 C–9. Selected climate projections for framing the climate change sensitivity analysis .........62
Tables 1. Potential environmental and socioeconomic changes affecting water
resources management decisionmaking .................................................................................9 2. Knowledge gaps discussed and prioritized at a geographically focused
forum on climate change and western water management ...............................................34 B–1. General advantages and disadvantages associated with statistical and
dynamical classes of downscaling methods .........................................................................51
Conversion Factors
Multiply By To obtain
Lengthcentimeter (cm) 0.3937 inch (in.)millimeter (mm) 0.03937 inch (in.)kilometer (km) 0.6214 mile (mi)
Volumecubic meter (m3) 0.0008107 acre-foot (acre-ft)
Vertical Datums
Elevation, as used in this report, refers to distance above sea level. Because this report is based on a large number of previously published scientific investigations, “sea level” is not referenced to a single vertical datum. “Mean sea level” also is not used with reference to a single datum; where used, the phrase means the average surface of the ocean as determined by calibration of measurements at tidal stations.

vi
Acronyms
ACWI Advisory Committee on Water InformationBCSD Bias-Correction and Spatial DisaggregationBSR Biennial Science Report [to the California Governor’s Office]C–CAWWG Climate Change and Western Water GroupCA–DWR California Department of Water ResourcesCCSP U.S. Climate Change Science ProgramCMIP Coupled Model Intercomparison ProjectCOOP U.S. Cooperative Observer NetworkCPC Climate Prediction CenterCRSS Colorado River Simulation System CVP Central Valley ProjectDCP Downscaled Climate ProjectionsDP Direct PaleoEPA U.S. Environmental Protection AgencyFAA Federal Aviation AdministrationGCM General circulation modelGMSL Global mean sea levelHBN Hydrologic Benchmark NetworkHCDN Hydroclimatic Data NetworkIACWD Interagency Committee on Water DataICWP Interstate Council on Water PolicyIFRMC Intergovernmental Flood Risk Management CommitteeIJC International Joint CommissionIPCC Intergovernmental Panel on Climate ChangeISM Index Sequential MethodNASQAN National Stream Quality Accounting NetworkNCDC National Climatic Data CenterNCEP National Centers for Environmental PredictionNEPA National Environmental Policy ActNESDIS National Environmental Satellite Data and Information ServiceNOAA National Oceanic and Atmospheric AdministrationNOHRSC National Operational Hydrologic Remote Sensing CenterNOS National Oceanographic ServiceNPC Nonparametric Paleo-ConditionedNWS National Weather ServiceOCAP BA Operational Criteria and Plan Biological AssessmentOCE Office of the Chief EconomistOMB Office of Management and BudgetP&G Economic and Environmental Principles and Guidelines for Water and Related
Land Resources Implementation StudiesPMF Probable maximum floodPMP Probable maximum precipitationRCM Regional climate modelReclamation U.S. Bureau of ReclamationRISA [NOAA] Regional Integrated Sciences and AssessmentsSWP [California] State Water ProjectUSACE U.S. Army Corps of EngineersUSCRN U.S. Climate Reference NetworkUSDA U.S. Department of Agriculture

vii
USFWS U.S. Fish and Wildlife ServiceUSGS U.S. Geological SurveyWAOB World Agricultural Outlook BoardWCRP World Climate Research ProgrammeWest-FAST Western States Federal Agency Support TeamWRPS Water Resources Product SuiteWSWC Western States Water Coucil

Climate Change and Water Resources Management: A Federal Perspective
By Levi D. Brekke,1 Julie E. Kiang,2 J. Rolf Olsen,3 Roger S. Pulwarty,4 David A. Raff,1 D. Phil Turnipseed,2 Robert S. Webb,4 and Kathleen D. White3
Executive Summary Many challenges, including climate change, face the
Nation’s water managers. The Intergovernmental Panel on Climate Change (IPCC) has provided estimates of how climate may change, but more understanding of the processes driving the changes, the sequences of the changes, and the manifesta-tion of these global changes at different scales could be benefi-cial. Since the changes will likely affect fundamental drivers of the hydrological cycle, climate change may have a large impact on water resources and water resources managers.
The purpose of this interagency report prepared by the U.S. Geological Survey (USGS), U.S. Army Corps of Engi-neers (USACE), Bureau of Reclamation (Reclamation), and National Oceanic and Atmospheric Administration (NOAA) is to explore strategies to improve water management by track-ing, anticipating, and responding to climate change. The key points below briefly summarize the chapters in this report and represent underlying assumptions needed to address the many impacts of climate change.
Chapter 1—Introduction
Observational evidence shows that many natural systems are being affected by regional climate changes, particularly tem-perature increases. The Fourth Assessment Report by the IPCC (2007a, b, c), previous assessment reports, and related docu-ments present evidence of global climate change, with particular attention to issues facing water resources managers. The find-ings presented in IPCC’s 2007 report represent improvements over previous iterations because of improved data from new sensors, increased sophistication of analyses, improved under-standing of physical processes and process models, and better understanding of the uncertainty of model results.
Climate change is but one of many dynamic processes impacting water resources management. Other processes (for example, change in population size and location, economic
1U.S. Bureau of Reclamation.2U.S. Geological Survey.3U.S. Army Corps of Engineers.4National Oceanic and Atmospheric Administration.
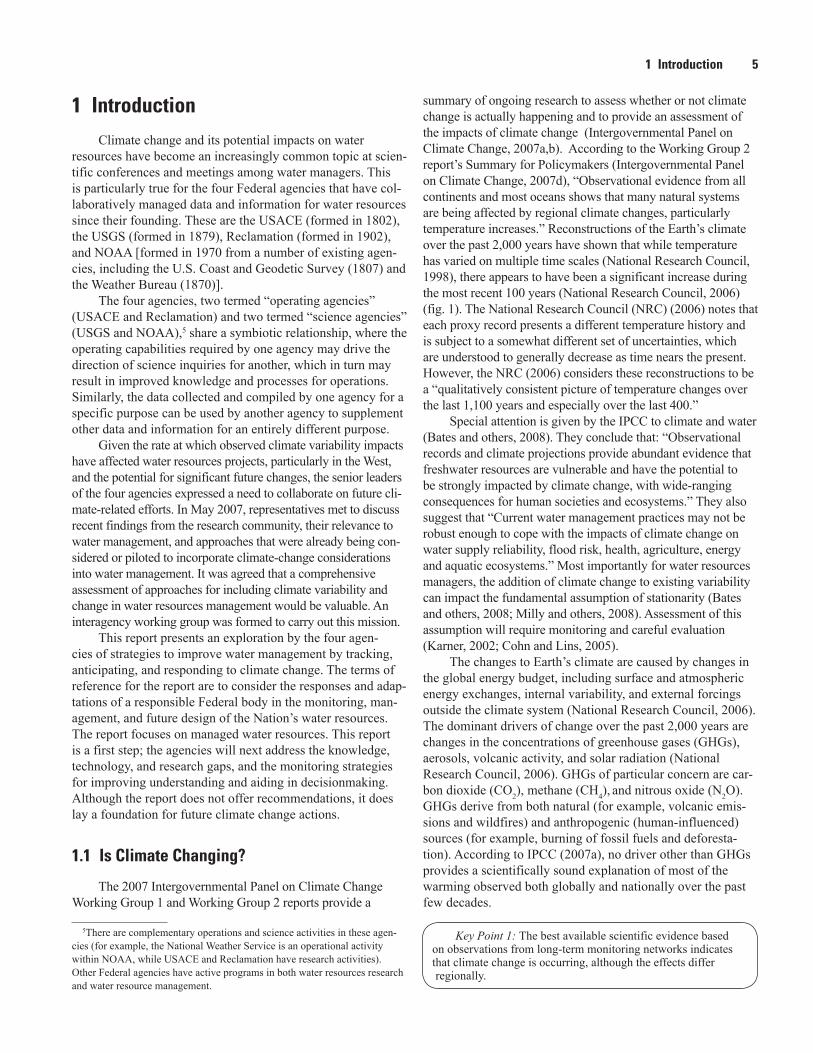
development and land use, aging infrastructure, ground-water development, and changing social values) also have major influences on water resources and must be considered along with climate change in a holistic approach to water resources management. Climate change has the potential to affect many sectors in which water resource managers play an active role, including water availability, water quality, flood risk reduc-tion, ecosystems, coastal areas, navigation, hydropower, and other energy sectors. These changes may have adverse or positive impacts on one or more sectors. Any or all of these changes could occur gradually or abruptly.
Key Point 1: The best available scientific evidence based on observations from long-term monitoring networks indicates that climate change is occurring, although the effects differ regionally.
Key Point 2: Climate change could affect all sectors of water resources management, since it may require changed design and operational assumptions about resource supplies, system demands or performance requirements, and operational con-straints. The assumption of temporal stationarity in hydro-climatic variables should be evaluated along with all other assumptions.
Key Point 3: Climate change is but one of many challenges facing water resource managers. A holistic approach to water resources management includes all significant drivers of change.
Chapter 2—Tracking Climate Change Impacts
Detecting hydrologic changes requires data from long-term monitoring networks to establish baseline conditions and then record any changes over time. Long-term monitoring net-works are critical for detecting and quantifying actual impacts, providing a basis for understanding hydrologic processes and trends, allowing calibration and validation of models used to project future conditions, and supporting design and evalu-ation of adaptation strategies. Trend detection can be used to help water managers recognize if the data upon which the design and operation of water resource systems were based are no longer consistent with current conditions.
Key Point 4: Long-term monitoring networks are critical for detecting and quantifying climate change and its impacts. Con-
tinued improvement in the understanding of climate change, its impacts, and the effectiveness of adaptation or mitigation actions requires continued operation of existing long-term monitoring networks and improved sensors deployed in space, in the atmosphere, in the oceans, and on the Earth’s surface.
Key Point 5: Monitoring needs to focus on locations that describe the climate signal (for example, upstream and down-stream from major water-management infrastructure or in vulnerable ecological reaches).
Chapter 3—Anticipating Climate Change: Available Climate Information for Decisionmaking in Long-Range Planning
Water resources planning involves making assumptions about future plausible hydroclimatic conditions (for example, temperature, precipitation, and river flows). The choice of information supporting these assumptions is affected by a changing climate. While science is not capable of predicting the exact magnitude of the changes, there are methods to char-acterize the range of possible changes. This chapter focuses on two types of decision processes: planning for long-term system operations and evaluations of flood risk.
The instrumental record has historically been vital in plan-ning for both norms and extremes, as it provides information on the conditions under which water resource systems may operate. Given a changing climate, it may be appropriate to evaluate the system response for a range of hydroclimatic variability wider than in the historical record. This can be accomplished by including paleoclimate information and stochastic methods. Climate projection information can also be incorporated into planning assumptions. Although a single best method has yet to be determined, incorporating climate projections generally involves surveying available climate projection information, deciding what portion to relate to planning assumptions, and conducting the intervening impact analysis on natural and social systems. These results are then related to planning assump-tions about supplies, demands, and operating constraints. In many planning studies, assumptions are developed relative to a stationary reference climate (referred to later as the Stationary System paradigm). Under this paradigm, planning assumptions can reflect climate from either the instrumental record or from a climate projection for a fixed period in the future. Alternatively, the System Projection paradigm frames long-range system evaluations using planning assumptions that change over time and that are consistent with climate projections.
Key Point 6: Paleoclimate information and stochastic modeling can be useful for developing climate scenarios that include a wide range of potential hydroclimatic conditions. The expanded variability may allow a more robust evaluation of planning alter-natives, particularly when there is concern that study outcomes and decisions may be sensitive to climate assumptions.
Key Point 7: Current expectations about future climate may indicate a need to supplement historical climate information.
Planning assumptions might instead be related to projections of future temperature and precipitation. This can be accom-plished using a multitude of approaches; a best approach has yet to be determined.
Key Point 8: A System Projection paradigm for adaptation planning, as opposed to a Stationary System paradigm, may offer a more appropriate context for characterizing planning assumptions, albeit at the potential cost of adding planning complexity.
Chapter 4—Anticipating Climate Change: Approaches for Decisionmaking
Water resource managers make decisions in the face of uncertainty associated with varying space and time scales, and they make assumptions about supplies, demands, weather, climate, and operational constraints at those scales. Water resources agencies are governed by multiple laws and regula-tions. Several studies have concluded that current water-man-agement planning regulations are flexible enough to accom-modate planning for climate change. However, current planning approaches have generally assumed that future climate condi-tions will be similar to the historical record—an assumption that may be suspect if climate is changing. A robust decision criterion supports selection of plans that will perform well over a wide range of possible future scenarios, although uncertain-ties will remain no matter how future scenarios are generated. A sequential decision process allows alternative courses of action, given different possible future conditions, and can be changed as new information becomes available. These approaches are not mutually incompatible and can be used in conjunction with current water-management planning methods that primarily employ cost-benefit analysis and sensitivity analysis. Incor-poration of adaptive management can build in flexibility and reevaluation of decisions that evolve over time in response to new information. The use of multiple scenarios in the context of robust/adaptive planning will enhance decisionmaking, particu-larly if the scenarios span a wide range of possible outcomes.
Key Point 9: Adopting alternatives that perform well over a wide range of future scenarios could improve system flexibility. Water resources planning and management requires an appre-ciation of existing and potential future uses of water resources, particularly when public health and safety are involved.
Key Point 10: Adaptive management is an approach where decisions are made sequentially over time and allows adjust-ments to be made as more information is known. This approach may be useful in dealing with the additional uncer-tainty introduced by potential climate change.
Chapter 5—Responding to Climate Change: Adaptation Options
Because climate has such a large effect on water resource system design and operations, it is apparent that climate
2 Climate Change and Water Resources Management: A Federal Perspective

change would translate into modified design and operational assumptions for determining resource supplies, system demands, system performance requirements, and operational constraints. Several water-management or system-develop-ment options might be considered to facilitate adaptation under climate change, including operational, demand manage-ment, and infrastructure changes. Options should be evaluated across appropriate spatial areas; specific options will vary from system to system, as will the preference among these options.
Key Point 11: Adaptation options include operational, demand management, and infrastructure changes.
Chapter 6—Opportunities for Advancing Planning Capabilities
There are significant gaps in knowledge, monitoring, and practice that limit incorporation of climate change con-siderations into water resources planning and management.
Climate change must be quantified with respect to the myriad of other natural and cultural issues that face the Nation’s water managers. Sound water management is built on long-term hydrological and meteorological monitoring networks that provide sound, accurate, timely, and consistent data that can be used readily to develop and assess decisionmaking tools needed to quantify uncertainty, forecast change, and create the multiphase, multilevel climate scenarios that will provide reasonable and relevant management. Changes to planning and analysis that better accommodate nonstationarity will improve water management. Collaboration in all of these activities may allow more rapid results and improved communication, both within the water resources community and to other stakehold-ers.
Key Point 12: Research and monitoring are both needed to fill knowledge gaps and set up advances in planning capabilities. Although neither will eliminate all uncertainties, they will provide significant improvements in understanding the effects of climate change on water resources, including quantity and quality, and in evaluating associated uncertainties and risks required for more informed decisionmaking.
Executive Summary 3

1 Introduction Climate change and its potential impacts on water
resources have become an increasingly common topic at scien-tific conferences and meetings among water managers. This is particularly true for the four Federal agencies that have col-laboratively managed data and information for water resources since their founding. These are the USACE (formed in 1802), the USGS (formed in 1879), Reclamation (formed in 1902), and NOAA [formed in 1970 from a number of existing agen-cies, including the U.S. Coast and Geodetic Survey (1807) and the Weather Bureau (1870)].
The four agencies, two termed “operating agencies” (USACE and Reclamation) and two termed “science agencies” (USGS and NOAA),� share a symbiotic relationship, where the operating capabilities required by one agency may drive the direction of science inquiries for another, which in turn may result in improved knowledge and processes for operations. Similarly, the data collected and compiled by one agency for a specific purpose can be used by another agency to supplement other data and information for an entirely different purpose.
Given the rate at which observed climate variability impacts have affected water resources projects, particularly in the West, and the potential for significant future changes, the senior leaders of the four agencies expressed a need to collaborate on future cli-mate-related efforts. In May 2007, representatives met to discuss recent findings from the research community, their relevance to water management, and approaches that were already being con-sidered or piloted to incorporate climate-change considerations into water management. It was agreed that a comprehensive assessment of approaches for including climate variability and change in water resources management would be valuable. An interagency working group was formed to carry out this mission.
This report presents an exploration by the four agen-cies of strategies to improve water management by tracking, anticipating, and responding to climate change. The terms of reference for the report are to consider the responses and adap-tations of a responsible Federal body in the monitoring, man-agement, and future design of the Nation’s water resources. The report focuses on managed water resources. This report is a first step; the agencies will next address the knowledge, technology, and research gaps, and the monitoring strategies for improving understanding and aiding in decisionmaking. Although the report does not offer recommendations, it does lay a foundation for future climate change actions.
1.1 Is Climate Changing?
The 2007 Intergovernmental Panel on Climate Change Working Group 1 and Working Group 2 reports provide a
�There are complementary operations and science activities in these agen-cies (for example, the National Weather Service is an operational activity within NOAA, while USACE and Reclamation have research activities). Other Federal agencies have active programs in both water resources research and water resource management.
summary of ongoing research to assess whether or not climate change is actually happening and to provide an assessment of the impacts of climate change (Intergovernmental Panel on Climate Change, 2007a,b). According to the Working Group 2 report’s Summary for Policymakers (Intergovernmental Panel on Climate Change, 2007d), “Observational evidence from all continents and most oceans shows that many natural systems are being affected by regional climate changes, particularly temperature increases.” Reconstructions of the Earth’s climate over the past 2,000 years have shown that while temperature has varied on multiple time scales (National Research Council, 1998), there appears to have been a significant increase during the most recent 100 years (National Research Council, 2006) (fig. 1). The National Research Council (NRC) (2006) notes that each proxy record presents a different temperature history and is subject to a somewhat different set of uncertainties, which are understood to generally decrease as time nears the present. However, the NRC (2006) considers these reconstructions to be a “qualitatively consistent picture of temperature changes over the last 1,100 years and especially over the last 400.”
Special attention is given by the IPCC to climate and water (Bates and others, 2008). They conclude that: “Observational records and climate projections provide abundant evidence that freshwater resources are vulnerable and have the potential to be strongly impacted by climate change, with wide-ranging consequences for human societies and ecosystems.” They also suggest that “Current water management practices may not be robust enough to cope with the impacts of climate change on water supply reliability, flood risk, health, agriculture, energy and aquatic ecosystems.” Most importantly for water resources managers, the addition of climate change to existing variability can impact the fundamental assumption of stationarity (Bates and others, 2008; Milly and others, 2008). Assessment of this assumption will require monitoring and careful evaluation (Karner, 2002; Cohn and Lins, 200�).
The changes to Earth’s climate are caused by changes in the global energy budget, including surface and atmospheric energy exchanges, internal variability, and external forcings outside the climate system (National Research Council, 2006). The dominant drivers of change over the past 2,000 years are changes in the concentrations of greenhouse gases (GHGs), aerosols, volcanic activity, and solar radiation (National Research Council, 2006). GHGs of particular concern are car-bon dioxide (CO2), methane (CH4), and nitrous oxide (N2O). GHGs derive from both natural (for example, volcanic emis-sions and wildfires) and anthropogenic (human-influenced) sources (for example, burning of fossil fuels and deforesta-tion). According to IPCC (2007a), no driver other than GHGs provides a scientifically sound explanation of most of the warming observed both globally and nationally over the past few decades.
Key Point 1: The best available scientific evidence based on observations from long-term monitoring networks indicates that climate change is occurring, although the effects differ regionally.
1 Introduction 5

General circulation models (GCMs) are used to make projections of future climate change. The GCMs are validated through comparison to observations, generally of the past 100 years, to assess the validity of the models. Increasing uncertain-ties going backward through time (fig. 1) limit the potential for older records to be used in validation. Recent results generally indicate improvements over previous generations of models, par-ticularly the ability to represent weather systems, climate vari-ability (for example, monsoons and El Niño), ocean processes (for example, the Gulf Stream), surface hydrology, and other Earth-system processes, components, and dynamics (Collins and others, 2006; Schmidt and others, 2006). One of the ways in which these models have advanced is through improvements in the representation of the processes responsible for key Earth-system feedbacks, such as those associated with water vapor, clouds, sea ice, and the carbon cycle (Delworth and others, 2006; Gnanadesikan and others, 2006; Wittenberg and others, 2006).
These improvements in GCMs have been possible in large part because of large amounts of new information derived from improved monitoring of space, atmospheric, ocean, and terrestrial processes, which have supplemented observations from long-term monitoring networks. The IPCC (2007a) also reports increased sophistication of analyses and improved understanding of physical processes, the resulting process models, and uncertainty related to model results. Yet, at the same time that our need for observa-tional data to support adaptive management in response to climate change is increasing, the observational networks crucial to increas-ing our understanding are shrinking (Bates and others, 2008).
1.2 What Climate Changes are of Most Concern to Water Resources Management?
Climate change has the potential to affect many sectors in which water resource managers play an active role. The major
drivers are changing temperature and precipitation regimes, and increasing global sea level and associated impacts.
Temperature increases are expected to change the mix of precipitation toward more rain and less snow. Such precipita-tion shifts would affect the origin and timing of runoff, lead-ing to less runoff from spring snowmelt and more runoff from winter rainfall, particularly in high-latitude or mountainous areas. These shifts have already been reported in northern New England, the Great Lakes region, and the Western United States (fig. 2) (Stewart and others, 200�; Hodgkins and Dudley, 2006a; Knowles and others, 2006; Hodgkins and others, 2007). Increas-ing temperature may also increase potential evapotranspiration from vegetation and land surfaces and may thereby decrease the amount of water that then reaches streams, lakes, and reservoirs. Changing water temperatures and ocean circulation may change the intensity and frequency of coastal storms under future climate conditions, but there is still much uncertainty as to what those changes may be. (See Knutson and Tuleya, 2004; Eman-uel and others, 2007; Shepherd and Knutson, 2007; Knutson and others, 2008.)
Precipitation changes are expected to differ across the country, with some areas receiving more and others receiving less, as suggested by the model simulations shown in figure 3. There may also be changes in seasonal patterns and extremes of precipitation. Depending on location, these possible changes have led to concerns that droughts and floods, defined relative to past experiences, will occur more frequently and (or) be more severe under future climate conditions (Intergov-ernmental Panel on Climate Change, 2007b).
Sea level varies over time, principally in response to global climate change (National Research Council, 1987; Intergovernmental Panel on Climate Change, 2007a). The IPCC (Bindoff and others, 2007) concluded that the global mean sea level rose at an average rate of about 1.7 ± 0.�
6 Climate Change and Water Resources Management: A Federal Perspective
Figure 1. Smoothed reconstructions of large-scale surface temperature variations (Northern Hemisphere mean or global mean) plus the instrumental record of global mean surface temperature. Darker gray shading indicates greater generalized uncertainty (National Research Council, 2006.)

45°
40°
35°
120°130°140°50°
45°
40°
35°
110°
140° 120°
B
A
>20 days earlier15–2010–155–10<105–10 days later10–1515–10>20
Figure 2. Trends in A, yearly dates of spring snowmelt onset; and B, centers of volume of yearly streamflow hydrographs in western North America, based on U.S. Geological Survey stream gages in the United States and an equivalent Canadian streamflow network. Large circles indicate sites with trends that differ significantly from zero at a 90-percent confidence level; small circles are not confidently identified. (From Dettinger, 2005a.)
mm/year during the twentieth century and that the rate has been slightly higher between 1961 and 2003. Recent climate research has documented global warming during the twenti-eth century and has predicted either continued or accelerated global warming for the twenty-first century and possibly beyond (Intergovernmental Panel on Climate Change, 2007a) (fig. 4). Changing sea level (mean and extreme high) will impact coastal and estuarine regions, with increased erosion of sandy beaches and saline intrusion in coastal and estuarine aquifers (National Research Council, 1987).
Any or all of these changes could occur gradually or abruptly (National Research Council, 2002, 2006; Climate Change Science Program, 2008e). The temporal onset of such change is relevant to future actions.
1.3 How is Climate Information Used in Water Resources Management?
Climate information is used by decisionmakers through-out water resources management. The effective use of climate information can be impacted by the degree of collaboration between climatologists, hydrologists, and the decisionmakers.
Figure 3. Change in 30-year mean annual precipitation, measured in centimeters per year (cm/year). The median difference between 1971–2000 and 2041–2070 is based on 112 projections obtained from “Statistically Downscaled WCRP CMIP3 Climate Projections” (http://gdo-dcp.ucllnl.org/downscaled_cmip3_projections).
Figure 4. Global mean sea level (GMSL) observed since 1870 and projected for the future (deviation from the 1980–1999 mean). [For illustrative purposes only, from U.S. Army Corps of Engineers (2008); Intergovernmental Panel on Climate Change (2007a, FAQ 5.1, fig. 1).]
The U.S. Climate Change Science Program (CCSP) (2008b) notes that “...mismatches between needs and information resources continue to occur at multiple levels and scales. Cur-rently there is substantial tension between providing tools at the space and time scales useful for water resources decisions that are also scientifically accurate, reliable and timely.”
Assumptions about future climate states have implicitly been represented in the planning, design, operation, and major rehabilitation of local and regional water resource systems. Traditionally, these systems have been designed to operate within an envelope of climate variability defined by observed (past) streamflow and weather variations on different time and space scales. By focusing on streamflow and weather variations
1 Introduction �

in a retrospective period, there is an inherent assumption that the envelope of these variations will remain unchanged in the future; that is, they will be stationary during the operation of the system.
Once water resource systems are constructed, the continued operation of these systems is affected by retro-spective, current, and near-term future climate information. Retrospective climate information comes into play when operating constraints and water-supply forecast models are updated to reflect recent trends in climate. For example, the redevelopment of water-supply forecast models would be based on an expanded or more recent retrospective record of streamflow and climate observations. Likewise, the redevelop-ment of flood control rules would conceivably be based on an expanded record of flood hydrology data. Current and near-term future climate information (for example, seasonal to 1-year forecasts) might be used to determine annual performance objectives. For example, annual water allocations to system water contractors (that is, the fraction of full-contract water entitlements that contractors can expect to receive during the coming year) are based on current water stocks and forecast water supplies, the latter being dependent on near-term climate forecast information.
Because of the importance of climate in system design and operations, it is apparent that climate change could translate into changed design and operational assumptions about resource supplies, system demands or performance requirements, and operational constraints, impacting all sec-tors of water resources management. The significance of such changes depends on the increment of climate change over the project life cycle and the operational outcome of concern. If an increment is sufficiently large, the assumed hydroclimatic variability underlying system design may no longer be valid.
1.4 Other Changes Affecting Water Resources Management
Many dynamic processes have and will continue to impact water resources management in addition to climate change (Climate Change Science Program, 2008a). Important changes in land cover and land use, water consumption, and water resources infrastructure will also affect water resources management.
Land cover and land use changes over time can result in changes to basin runoff patterns and sedimentation rates, which could change flood peaks, impact geomorphology, and alter reservoir storage for water supply, flood storage, and other uses. Land cover and land use changes include residen-
tial and commercial development, deforestation, reforesta-tion, and wildfires. These changes may also affect hydrologic stationarity and the uncertainty in flow-frequency estimates.
Withdrawal and consumption of water change as a result of changing economic activity (for example, industry and irrigation), changes in population, and changes in values. These changes can have a tremendous impact on water avail-ability (Lettenmaier and others, 1999; Vorosmarty and others, 2000) and can result in altered base flow to streams, changing temperature and chemistry of streamflow, saline water intru-sion in some coastal and inland settings, changes in ground-water levels, and land subsidence in certain hydrogeologic settings. Ground water is being depleted in many areas, with consequences for present and future ground-water availability and surface-water supplies. Fast population growth in the arid and semiarid regions of the United States is already stressing limited water supplies.
Water resources infrastructure, such as dams, levees, and locks, must be maintained to provide safe and functional operations. Deferred maintenance accelerates deterioration (American Society of Civil Engineers, 200�), and natural processes, such as subsidence, sedimentation, changes in sea level, and seismic events, can also reduce infrastructure per-formance over time.
These processes often occur concurrently and may have interactions. Climate change adds further complexity. In some cases, the combination of these many influences on water resources may exacerbate existing problems. In other cases, it is possible that the interactions between different processes will diminish impacts to water resources systems. For exam-ple, the aging and poorly maintained levee infrastructure, com-bined with the growth of residential, commercial, and indus-trial development in flood plains (with or without levees), has substantially increased flood risk on a national level. In some locations, climate impacts will exacerbate this problem due to increased precipitation intensity, higher peak runoff, or changes to the form of precipitation that increase runoff. However, in other locations, climate impacts may reduce this problem through decreases in precipitation.
Water managers have long recognized that these dynamic processes affect water resources. However, political and social institutions often implicitly assume that conditions are static or stationary. The engineering and economic approaches that underlie virtually all water planning in the United States assume that the underlying climate and hydrologic processes are stationary, even if their statistics are not perfectly known. Effective management of our existing water resources infra-structure depends on adaptation to current realities—realities of the physical infrastructure, the competing demands for water, public values, and climate. None of these are static and table 1 lists some potential changes to be included in water resources management decisions.
Key Point 2: Climate change could affect all sectors of water resources management, since it may require changed design and operational assumptions about resource sup-plies, system demands or performance requirements, and operational constraints. The assumption of temporal stationarity in hydroclimatic variables should be evaluated along with all other assumptions.
Key Point 3: Climate change is but one of many challenges facing water resource managers, and a holistic approach to water resources management includes all significant drivers of change.
� Climate Change and Water Resources Management: A Federal Perspective

Table 1. Potential environmental and socioeconomic changes affecting water resources management decisionmaking.
[After Nicholls and others, 2008]
Climate-induced Non-climate-inducedChanges in rain-snow partitioning Vertical land movementChanges in precipitation intensity Population growthAccelerated sea level rise Changes in land useChanges in sea-surface temperature Changes in societal valuesChanges in wind and wave patterns Changes in water useChanges in sediment budgets Changes in sediment budgetsAltered wildland fire conditions Changes in economic condi-
tionsChanges due to climate adaptation Infrastructure resourcing
measuresChanges due to mitigation measures
1.5 Sector Impacts Due to Climate Change
Potential water resources management sector impacts are briefly summarized below, but a full discussion is beyond the scope of this report. The sector impacts discussed here are based largely on the IPCC Fourth Assessment Working Group II Report (Intergovernmental Panel on Climate Change, 2007b) and the IPCC technical paper on climate and water (Intergovernmental Panel on Climate Change, 2008), to which the reader is directed for additional information. The Climate Change Science Program’s Synthesis and Assessment Product 4.3 (Climate Change Science Program, 2008a) and the Ameri-can Water Works Association Research Foundation’s primer (Miller and Yates, 2006) also provide useful summaries of potential climate change impacts on water resources.
Water availability for municipal and industrial use, irrigation, navigation support, hydropower, and environmental flows is a significant concern in regions throughout the United States. Potential climate change impacts affecting water avail-ability include changes in precipitation amount, intensity, timing, and form (rain or snow); changes in snowmelt tim-ing; and changes to evapotranspiration (Intergovernmental Panel on Climate Change, 2007a, b). The results from several general circulation models agree that the southwestern United States is likely to experience precipitation and evapotranspira-tion changes that result in less runoff and water availability (Milly and others, 200�; Intergovernmental Panel on Climate Change, 2007a). The prudent use of reservoir storage, as well as conjunctive surface-water and ground-water management, are strategies that water managers employ to optimize water availability. The existing water infrastructure may or may not be able to accommodate different amounts or temporal pat-terns of streamflow and still serve their intended purposes. In areas that experience a decrease in water availability, competi-tion for water among users will likely increase. Users with the lowest priority water rights are most likely to experience prob-lems. In these areas, decreased water supplies could adversely affect economic development, recreational opportunities, or habitat.
Water demand for irrigation may increase as transpira-tion increases in response to higher temperatures. However, more efficient water use by plants as a result of higher carbon dioxide concentrations may reduce this impact. Some areas may also experience an extended growing season, which could increase demand. The demand for water in thermal energy generation could either increase or decrease, depending on future trends in water use efficiency and the development of new power plants. Demand might decrease in areas receiv-ing increased precipitation, depending on agricultural and municipal adaptation strategies. These changes in demand may require water managers to reevaluate the effectiveness of cur-rent demand management strategies.
Water quality is impacted by changing precipitation and temperature resulting from climate change (Great Lakes Water Quality Board, 2003; Climate Change Science Program, 2008a). The resulting local and short-term impacts on ecologi-cal thresholds are of greatest concern, rather than the annual medians that are commonly reported (Murdoch and others, 2000). Increasing air temperatures may lead to increased water temperature, which can affect habitat suitability and the chemical properties of water. Altered water temperature in reservoirs and lakes influences the potential for algal blooms, which can further reduce oxygen levels (Poff and others, 2002; Intergovernmental Panel on Climate Change, 2007b). Changes in water availability may affect concentrations of suspended sediment, nutrients, and chemical contaminants in rivers and lakes. Changes to precipitation intensity and frequency influ-ence non-point-source pollution (that is, pollutants washed from agriculture fields, roads, and other land surfaces by run-off). In areas with melting glacial ice and permafrost, previ-ously frozen ground may become more susceptible to erosion, altering sediment transport.
Stormwater and wastewater infrastructure may need to include climate change effects in their design and evaluation to improve performance under changing water availability, water demand, and water-quality conditions. Likewise, the use of contemporary best management practices to control future non-point-source pollution situations may be most effective if system developments are planned in the context of possible future climate conditions.
Flood risk reduction structures, water-system operational strategies, and resource management decisions may face more intense rainstorms, more events of rain on snow, and greater portions of watersheds participating in winter rainfall-runoff generation (Intergovernmental Panel on Climate Change, 2007a, b). These changes may create more frequent and more severe flooding of some rivers and lakes. However, because of uncertainties in climate models and flood record analyses, the nature of changes in specific locations remains uncertain and will require detailed study. The design and evaluation of flood-risk-reduction infrastructure should use the most recent available data and consider possible future climate conditions, including shifts in the seasonal timing of typical high flows. Spring high flows in snow-dominated watersheds are already shifting earlier in the year because of earlier snowmelt associ-
1 Introduction �
ated with higher temperatures (fig. 2). Reservoir water control plans may need to be adjusted to reflect new flood regimes. Different melt and thaw patterns could alter the frequency and timing of ice-jam floods. Glacial outburst floods pose a threat in some western alpine mountain regions and in some areas of Alaska.
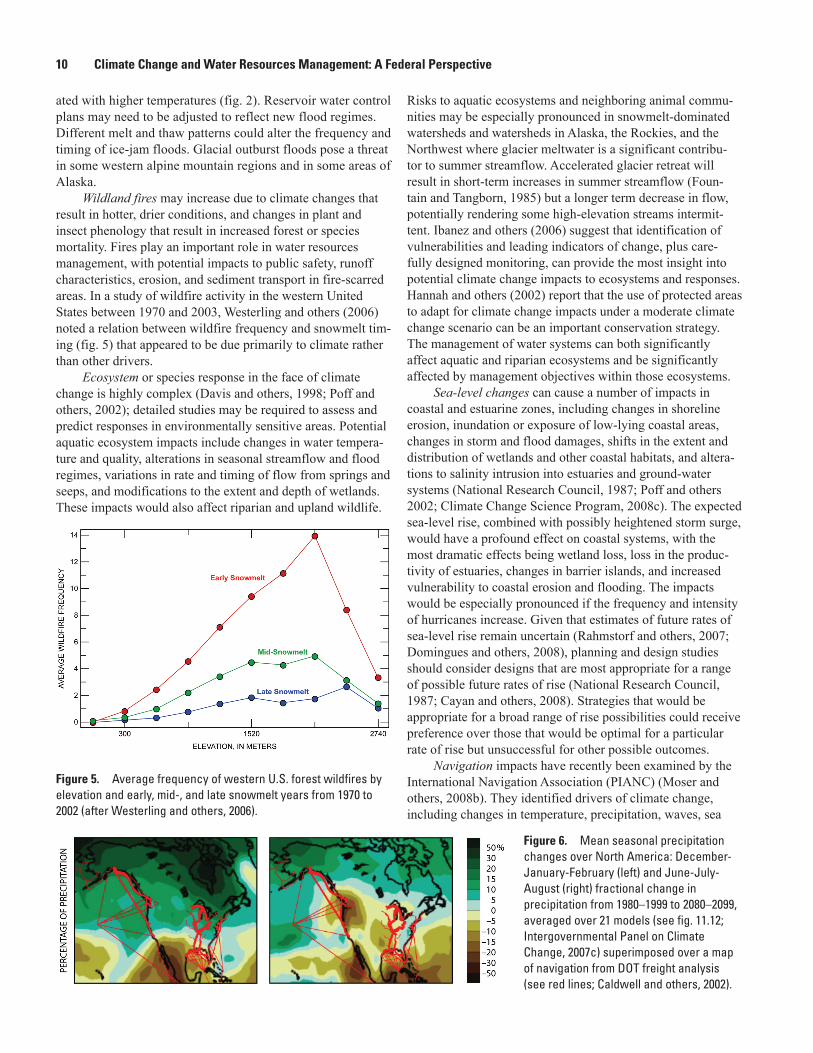
Wildland fires may increase due to climate changes that result in hotter, drier conditions, and changes in plant and insect phenology that result in increased forest or species mortality. Fires play an important role in water resources management, with potential impacts to public safety, runoff characteristics, erosion, and sediment transport in fire-scarred areas. In a study of wildfire activity in the western United States between 1970 and 2003, Westerling and others (2006) noted a relation between wildfire frequency and snowmelt tim-ing (fig. �) that appeared to be due primarily to climate rather than other drivers.
Ecosystem or species response in the face of climate change is highly complex (Davis and others, 1998; Poff and others, 2002); detailed studies may be required to assess and predict responses in environmentally sensitive areas. Potential aquatic ecosystem impacts include changes in water tempera-ture and quality, alterations in seasonal streamflow and flood regimes, variations in rate and timing of flow from springs and seeps, and modifications to the extent and depth of wetlands. These impacts would also affect riparian and upland wildlife.
Figure 5. Average frequency of western U.S. forest wildfires by elevation and early, mid-, and late snowmelt years from 1970 to 2002 (after Westerling and others, 2006).
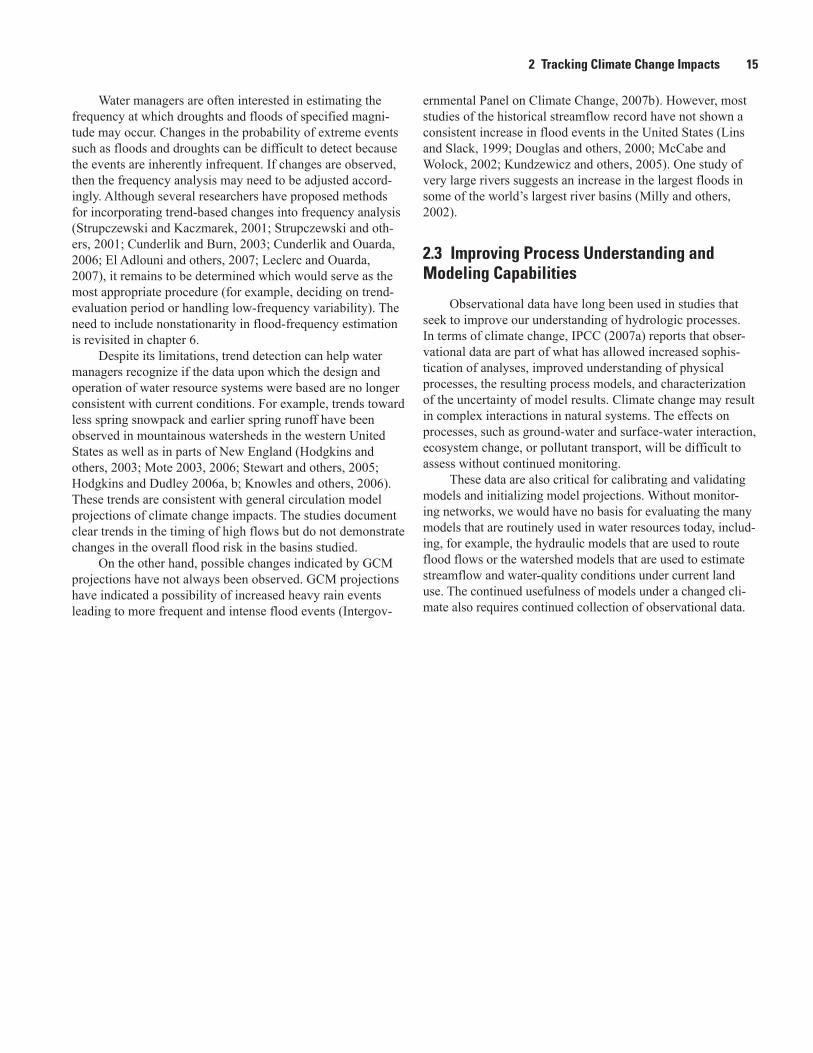
Figure 6. Mean seasonal precipitation changes over North America: December-January-February (left) and June-July-August (right) fractional change in precipitation from 1980–1999 to 2080–2099, averaged over 21 models (see fig. 11.12; Intergovernmental Panel on Climate Change, 2007c) superimposed over a map of navigation from DOT freight analysis (see red lines; Caldwell and others, 2002).
Risks to aquatic ecosystems and neighboring animal commu-nities may be especially pronounced in snowmelt-dominated watersheds and watersheds in Alaska, the Rockies, and the Northwest where glacier meltwater is a significant contribu-tor to summer streamflow. Accelerated glacier retreat will result in short-term increases in summer streamflow (Foun-tain and Tangborn, 198�) but a longer term decrease in flow, potentially rendering some high-elevation streams intermit-tent. Ibanez and others (2006) suggest that identification of vulnerabilities and leading indicators of change, plus care-fully designed monitoring, can provide the most insight into potential climate change impacts to ecosystems and responses. Hannah and others (2002) report that the use of protected areas to adapt for climate change impacts under a moderate climate change scenario can be an important conservation strategy. The management of water systems can both significantly affect aquatic and riparian ecosystems and be significantly affected by management objectives within those ecosystems.
Sea-level changes can cause a number of impacts in coastal and estuarine zones, including changes in shoreline erosion, inundation or exposure of low-lying coastal areas, changes in storm and flood damages, shifts in the extent and distribution of wetlands and other coastal habitats, and altera-tions to salinity intrusion into estuaries and ground-water systems (National Research Council, 1987; Poff and others 2002; Climate Change Science Program, 2008c). The expected sea-level rise, combined with possibly heightened storm surge, would have a profound effect on coastal systems, with the most dramatic effects being wetland loss, loss in the produc-tivity of estuaries, changes in barrier islands, and increased vulnerability to coastal erosion and flooding. The impacts would be especially pronounced if the frequency and intensity of hurricanes increase. Given that estimates of future rates of sea-level rise remain uncertain (Rahmstorf and others, 2007; Domingues and others, 2008), planning and design studies should consider designs that are most appropriate for a range of possible future rates of rise (National Research Council, 1987; Cayan and others, 2008). Strategies that would be appropriate for a broad range of rise possibilities could receive preference over those that would be optimal for a particular rate of rise but unsuccessful for other possible outcomes.
Navigation impacts have recently been examined by the International Navigation Association (PIANC) (Moser and others, 2008b). They identified drivers of climate change, including changes in temperature, precipitation, waves, sea
10 Climate Change and Water Resources Management: A Federal Perspective

level, ice, geomorphological variables, and socioeconomic and political conditions (ACIA, 2004; Bindoff and others, 2007; Lemke and others, 2007; Meehl and others, 2007; Trenberth and others, 2007; Nicholls and others, 2008). Maritime impacts identified by PIANC include altered infrastructure vulnerability to sea level, waves, and wind; changed condi-tions affecting vessel maneuvering; variations in ice cover impacting polar access (ACIA, 2004, 200�); and changes in sea spray, affecting icing. Changes in water availability and the resulting changes in channel depth and velocity will affect inland navigation, trafficability, and infrastructure operations (fig. 6) (Moser and others, 2008a; Intergovernmental Panel on Climate Change, 2007c). Compared to the maritime sector, the inland navigation sector may have more capacity to respond to climate drivers because the water resources infrastructure can modify runoff. Increased use of commercial inland navigation over land transportation may mitigate GHG emissions.
Energy production and demand are especially sensitive to climate change (Intergovernmental Panel on Climate Change, 2007b). These effects are magnified in regions with both heating and cooling needs. Ice-storm frequency or intensity, as well as permafrost extent, affects the energy infrastructure, including transmission lines and gas and oil pipelines (fig. 7). Hydropower generation will be affected by changes in water availability, particularly in snowmelt-dominated basins, where impacts have already been reported (Hamlet and others, 2002; California Energy Commission, 200�; Northwest Power and Conservation Council, 200�). Hydropower production at facili-ties that are operated to meet multiple objectives (for example, flood-risk reduction, irrigation, municipal and industrial water supply, navigation, in-stream flow augmentation, and water
quality) may be especially vulnerable to changes. Changes in water availability and water quality also affect thermal energy production. For example, power plants have had to limit genera-tion in some areas because of limited water availability for cool-ing water, leading some public officials and citizens to express concerns about the potential water use of proposed new plants (U.S. Department of Energy, 2006). Linkages between water and energy also exist because of water use in energy production and energy use in water treatment and distribution.
1 Introduction 11
Figure �. Fractional area of the country affected by ice storms. The plot shows the average 1947–2003 ice-storm trajectory (green line) and deviations (dashed gray lines) (Jones and others, 2004).


2 Tracking Climate Change ImpactsMonitoring data is essential for understanding and
tracking the impacts of climate change. This chapter seeks to address the following questions:
How are monitoring data used to track climate impacts?
How do data inform physical system understanding?
What monitoring networks currently exist?
2.1 Tracking Hydrologic Change: Monitoring Networks
Current projections of climate changes and their potential impacts harbor many uncertainties, and these uncertainties are unlikely to dissipate in the near term. Within these uncertainties are the possibility for surprises, which could be unpleasant and quick to appear. In this context, a strategy that balances detect-ing and adjusting to changes against extrapolating (including modeling) and anticipating changes will be most prudent. Thus, monitoring of climatic and hydrologic conditions plays an important role in addressing potential climate changes.
To detect hydrologic changes due to climate change or other causes, data from long-term monitoring networks are essential for establishing baseline conditions and tracking any changes over time. Monitoring networks are also essential for fully understanding the hydrologic processes that lead to changes in water resources and for calibrating and validating models used to project future conditions. In turn, information about possible or likely future changes to climate improves the effectiveness of planning studies and allows the development and implementation of reasonable strategies for adapting to a changing climate.
Key Point 4: Long-term monitoring networks are critical for detecting and quantifying climate change and its impacts. Continued improvement in the understanding of climate change, its impacts, and the effectiveness of adaptation or mitigation actions requires continued operation of existing long-term monitoring networks and improved sensors deployed in space, in the atmosphere, in the oceans, and on the Earth’s surface.
Monitoring networks include in situ methods as well as remote sensing technologies such as radar and satellites. Exist-ing data allow us to look at data retrospectively. However, monitoring networks must continue to operate into the future if we are to detect future changes in hydrologic systems due to climate change (or the lack thereof) and to craft effective responses.
To be useful for climate change studies, monitoring networks need to be in place in locations relevant to water managers. For example, monitoring stations should be located in watersheds important for water supply or vulnerable to
changes in water quality. In addition to monitoring of the natural system, data on human water use can be valuable in planning for climate change. The USGS periodically publishes estimates of water use in the United States by sector (for example, Hutson and others, 2004) compiled from data col-lected by State and local agencies. The periodic nature of these reports and the varying data-collection methods limit their utility for evaluating demand interactions with climate.
Climate change is easier to detect on global to regional scales. Monitoring networks for detecting change are espe-cially valuable when they are regional or involve local networks that are integrated to allow regional analyses. Also needed for planning and operational analysis is a compre-hensive set of parameters that characterize current and future climate conditions.
A number of Federal, State, and local agencies operate observation networks that are valuable for climate change analysis. The USGS operates the largest water-monitoring network in the United States, as well as biological-monitoring networks. These are briefly described in the inset box. NOAA operates the Nation’s largest meteorological network and provides data on oceans. The NOAA observational networks are also described in an inset box. Other Federal agencies also maintain important water-monitoring networks, such as the Natural Resources Conservation Service’s snow surveys and Snowtel network. State and local agencies are able to supplement these larger networks with needed local data. USACE and Reclamation also conduct project-specific water resources-monitoring activities.
Key Point 5: Monitoring needs to focus on locations that describe the climate signal (for example, upstream and downstream from major water-management infrastructure or in vulnerable ecological reaches).
2.2 Tracking Hydrologic Change: Trend Analysis
As discussed in chapter 1, climate change is expected to cause changes to streamflow, precipitation, and other hydro-climatic variables. The continuous long-term streamflow and meteorological records described in the preceding section are critical for detecting trends or shifts in the statistics of histori-cal streamflow or other hydroclimatic variables. Such nonsta-tionarity in hydroclimatic conditions would represent a change from the assumptions that have been used to design and man-age water resource systems. Consequently, it is important to know if and how trends manifest themselves.
Trend detection must be carried out with care, as trends may also be caused by land use changes, changes in water infrastructure, or other factors. Furthermore, while the magni-tude of a trend may be relatively easy to quantify, its statisti-cal significance may be more ambiguous because of natural climate variability and long-term persistence, which can cause oscillatory patterns in long-term hydroclimatic records (Cohn and Lins, 200�).
•
•
•
2 Tracking Climate Change Impacts 13

Box 2.1 Key USGS Monitoring Networks for Water Resources Management
Water
The USGS operates the National Water Information System to monitor the occurrence, quantity, quality, distribution, and movement of surface and underground waters. Specific streamflow, ground-water, and water-quality stations have been identified for use in studying long-term trends. The Hydroclimatic Data Network (HCDN) is a subset of the national network of streamgages that were screened against strictly defined criteria of measurement accuracy and natural conditions to provide a dataset for studying climate variations (Slack and Landwehr, 1992; Slack and others, 1993). Numerous watershed changes may have taken place since the HCDN sites were first identified, and the identification of a suitable network of streamgages is being revisited. Among the thousands of ground-water wells that the USGS monitors annually, about �00 wells have been identified for inclusion in the Ground-Water Climate Response Network (Cunningham and others, 2007). These wells are used to monitor the effects of droughts and other climate variability on ground-water levels. The USGS also collects and analyzes chemical, physical, and biological properties of water, sediment, and biological tissue samples from both surface- and ground-water sources. Some of these sites are included in two water-quality networks that were created to provide long-term measurements, the Hydrologic Benchmark Network (HBN) and the National Stream Quality Accounting Network (NASQAN) (Hooper and others, 1997; Murdoch and others, 200�). The USGS also operates a small program to monitor glaciers that includes the longest detailed observations of glacial change in North America.
Ecology
Through the Natural Resources Monitoring Partnership, the USGS is consolidating metadata on current monitoring efforts (by Federal, State, local, and nongovernmental entities) to make common monitoring protocols available and to allow researchers to discover current monitoring efforts by location. In addition, the USGS coordinates a Breeding Bird Survey, the Amphibian Research and Monitoring Initiative, and the Western Mountain Initiative. Water is intrinsic to the function of all ecosystems, and a Climate Effects Network is in development that will build on existing programs. The USGS is also helping to coordinate the development of a new USA National Phenology Network that is being designed to monitor periodic plant and animal life-cycle events. Examples include the timing of leafing and flowering, agricultural crop stages, insect emergence, and animal migration.
All of these monitoring efforts include data that can be used to track the effects of climate change on ecology.
Trend analysis should also be conducted over large areas affected by similar weather systems. However, the analysis must be done carefully to consider cross-correlation among the stations in a region. Douglas and others (2000) demonstrate that ignoring spatial correlation can lead to erroneous conclusions about the existence of regional trends in low flows and high flows. Vogel and others (2001) also note the importance of considering spatial correlation in an analysis of record-breaking floods.
It is important to try to understand the drivers behind the trends in order to understand whether the trend is likely to persist, plateau, or reverse. For example, a trend towards
Box 2.2 Key NOAA Monitoring Networks for Water Resources Management
Three of NOAA’s line offices, the National Weather Service (NWS), the National Environmental Satellite Data and Information Service (NESDIS), and the National Oceanographic Service (NOS), monitor, quality control, and archive data from several key climate and hydrologic systems. The National Climatic Data Center (NCDC) is the national archive for climate data and products (http://www.ncdc.noaa.gov/oa/ncdc.html).
The U.S. Cooperative Observer Network (COOP) consists of weather stations operated by State universities and State or Federal agencies; it also includes privately owned stations that are managed and maintained by the NWS. The network includes regular NWS offices, airports with weather stations operated by the NWS or the Federal Aviation Administration (FAA), and U.S. military bases. There are typically about 8,000 stations operating in any one year. The earliest data are from 1886 and are organized by month.
The National Operational Hydrologic Remote Sensing Center (NOHRSC) archives the National Snow Observation Database and conducts airborne snow surveys for satellite snow-cover mapping, snow modeling and data assimilation, and development of visualization tools and integrated snow datasets for geospatial applications. Other variables being monitored by satellite include water vapor/atmospheric precipitable water and the vegetation health index (at 1� km). Through the NOS/National Estuarine Research Reserves, NOAA tracks nearshore water-quality and nutrient loads. NOAA scientists are combining this information with other weather and climate data to assess the effects of human activities on ecosystems and the impact of onshore pollutants and runoff into the marine environment. Data are collected on water temperature, salinity, pH, dissolved oxygen, and turbidity.
The U.S. Climate Reference Network (USCRN) is a network of climate stations now being developed as part of a NOAA initiative. The primary goal of the USCRN is to provide future long-term homogeneous observations of temperature and precipitation that can be coupled to long-term historical observations for the detection and attribution of present and future climate change.
Several of these datasets are used to develop integrated products, indices, and outlooks (such as the U.S. Drought Monitor, crop moisture index, and so forth) with other agencies and partners. The U.S. Drought Monitor, which is produced on a weekly basis, is a collaborative effort between Federal and academic partners, including the National Drought Mitigation Center, the USDA/OCE/WAOB/Joint Agricultural Weather Facility, the NOAA/NWS/NCEP/CPC, and the NOAA/NESDIS/National Climatic Data Center. The NWS River Forecast Centers provide streamflow forecasts for the United States. Their Water Resources Product Suite (WRPS) includes a comprehensive suite of high-resolution (1–10 km), gridded hydrologic state variable
and flux datasets and derived variables.
higher runoff peaks that is driven by an increase in impervi-ous surfaces in an urbanizing area is likely to persist unless the driver changes (Dietz 2007). Understanding the cause of the trend can also allow modeling of future runoff peaks using future development plans as an input. Finally, as McCabe and Wolock (2002) point out, it can also be important to identify whether a trend occurs as a gradual change or as an abrupt shift.
14 Climate Change and Water Resources Management: A Federal Perspective
Water managers are often interested in estimating the frequency at which droughts and floods of specified magni-tude may occur. Changes in the probability of extreme events such as floods and droughts can be difficult to detect because the events are inherently infrequent. If changes are observed, then the frequency analysis may need to be adjusted accord-ingly. Although several researchers have proposed methods for incorporating trend-based changes into frequency analysis (Strupczewski and Kaczmarek, 2001; Strupczewski and oth-ers, 2001; Cunderlik and Burn, 2003; Cunderlik and Ouarda, 2006; El Adlouni and others, 2007; Leclerc and Ouarda, 2007), it remains to be determined which would serve as the most appropriate procedure (for example, deciding on trend-evaluation period or handling low-frequency variability). The need to include nonstationarity in flood-frequency estimation is revisited in chapter 6.
Despite its limitations, trend detection can help water managers recognize if the data upon which the design and operation of water resource systems were based are no longer consistent with current conditions. For example, trends toward less spring snowpack and earlier spring runoff have been observed in mountainous watersheds in the western United States as well as in parts of New England (Hodgkins and others, 2003; Mote 2003, 2006; Stewart and others, 200�; Hodgkins and Dudley 2006a, b; Knowles and others, 2006). These trends are consistent with general circulation model projections of climate change impacts. The studies document clear trends in the timing of high flows but do not demonstrate changes in the overall flood risk in the basins studied.
On the other hand, possible changes indicated by GCM projections have not always been observed. GCM projections have indicated a possibility of increased heavy rain events leading to more frequent and intense flood events (Intergov-
ernmental Panel on Climate Change, 2007b). However, most studies of the historical streamflow record have not shown a consistent increase in flood events in the United States (Lins and Slack, 1999; Douglas and others, 2000; McCabe and Wolock, 2002; Kundzewicz and others, 200�). One study of very large rivers suggests an increase in the largest floods in some of the world’s largest river basins (Milly and others, 2002).
2.3 Improving Process Understanding and Modeling Capabilities
Observational data have long been used in studies that seek to improve our understanding of hydrologic processes. In terms of climate change, IPCC (2007a) reports that obser-vational data are part of what has allowed increased sophis-tication of analyses, improved understanding of physical processes, the resulting process models, and characterization of the uncertainty of model results. Climate change may result in complex interactions in natural systems. The effects on processes, such as ground-water and surface-water interaction, ecosystem change, or pollutant transport, will be difficult to assess without continued monitoring.
These data are also critical for calibrating and validating models and initializing model projections. Without monitor-ing networks, we would have no basis for evaluating the many models that are routinely used in water resources today, includ-ing, for example, the hydraulic models that are used to route flood flows or the watershed models that are used to estimate streamflow and water-quality conditions under current land use. The continued usefulness of models under a changed cli-mate also requires continued collection of observational data.
2 Tracking Climate Change Impacts 15


3 Anticipating Climate Change: Available Climate Information for Decisionmaking in Long-Range Planning
This chapter focuses on several questions about how climate information can be related to long-term, long-range water management planning and decisions:
How has climate traditionally been represented in water management?
What motivates the use of an expanded set of climate information?
What are some issues and limitations in considering an expanded set of climate information?
To this end, two classes of long-range water-manage-ment decisions are discussed: general system evaluations and flood-risk evaluations. For the first class, a generalized planning framework is introduced (section 3.1) to describe how long-range evaluations are set up by assumptions for possible future supplies, demands, and operating constraints. The role of climate information in establishing these assumptions is then discussed, including the traditional use of instrumental records and the potential use of expanded climate information. Expanded climate information might include a mix of paleoclimatic evidence of hydroclimatic conditions, stochastic modeling to augment sequence possibilities, and (or) climate-projection informa-tion to define climate possibilities during the future planning horizon. For the second class, the probabilistic and deterministic approaches for flood-risk evaluation are discussed (section 3.2). The focus is placed on the underlying climate assumptions and the challenges introduced by a changing climate while conduct-ing such evaluations. Thereafter, several recent Reclamation and USACE studies featuring the expanded use of climate informa-tion are summarized (section 3.3) to highlight common themes and implications for planning processes. Finally, a summary discussion is offered on how these traditional and potential appli-cations of climate information call attention to system portrayal paradigms, particularly in adaptation planning, and research avenues to advance long-range decisionmaking capabilities.
3.1 Use of Climate Information in General Long-Range Systems Evaluations
Long-range planning studies for water resources man-agement typically focus on questions about proposed system changes (either physical or operational). Climate information is reflected in such studies through assumptions made about water supplies, demands, and operational constraints (fig. 8).
Water-supply assumptions are developed to portray an appropriate envelope of supply possibilities suitable for the planning horizon (that is, surface water and ground water;
•
•
•
Instrumental Records:observed weather (Tand P) and runoff (Q)
Climate Projections:modeled weather and
runoff
Enhanced InstrumentalRecord: reconstructedweather and/or runoff
statistical modeling watershed simulation
Q T, P, and Q T, P, and (or) Q
Supply Variability Demand Variability Operating Constraints
Operations and Uncertainties
Figure �. Analytical framework for relating climate to water supplies, demands, and constraints.
3 Anticipating Climate Change: Available Climate Information for Decisionmaking in Long-Range Planning 1�
statistical description of possibilities, including mean, vari-ance, sequences, and so forth). Water-supply assumptions are a direct reflection of the expected climate during the study’s planning horizon. As discussed in section 3.1.1, water-supply assumptions have traditionally been based on available histori-cal observations (for example, streamgages and ground-water well logs). These assumptions are based on the premise that the range of observed supply variability is a reasonable proxy for future supply possibilities.
Demand assumptions are characterized for each of the agricultural, municipal, in-stream, and other uses featured in the study. The focus of demand assumptions is often on identifying demand “upper limits.” However, for some studies, the objective might be to identify demand limits relative to available supplies, constraints, and required system perfor-mance. Demands are often characterized at a district level (for example, irrigation district and municipality). Physical assessments are used to estimate water demands relative to climate and other drivers (for example, district-level irrigation demands, given a scenario mix of cropping choices, tempera-ture, precipitation, and water-use efficiencies).
The final category of assumptions involves the vari-ous operational constraints affected by an underlying climate assumption. For example, hydrologic event possibilities are predicated on an underlying climate regime (section 3.2) and affect the required flood-control rules at surface-water reservoirs. In turn, flood-control rules affect the constraints on water-supply storage. Further, aquatic ecosystems and ripar-ian environments depend on air temperature and hydrologic regimes, which affect the assumed constraints on reservoir release patterns to support ecosystems.
3.1.1 Establishing Assumptions and a Plausible Planning Future Through Traditional Use of Instrumental Records
Long-range planning assumptions for supplies, demands, and constraints have typically been based on information from the recent historical and observed record (labeled here as the “instrumental record”). In this practice, assumed water supplies are based on naturalized flows, which are computed from historical streamgage data, ground-water well logs, and
impairment information. Water demands would be based on historical water use and land cover.
Reliance on the instrumental record to establish these assumptions implies that the past is a reasonable proxy for the future. In other words, it is assumed that the range of observa-tions from the instrumental record includes enough situations to represent a reasonable envelope of plausible future condi-tions appropriate for planning. It is possible, though, that the future may contain situations that have not already been observed (for example, more extreme months or seasons, and more severe and sustained droughts). However, this possibility has generally not been compelling enough to trigger planning assumptions other than those supported by the instrumen-tal record. This situation appears to be changing, however (see section 3.3), particularly as stakeholders become more informed about the scientific community’s improved knowl-edge on climate of the preinstrumental record, recent trends in climate, and the projected future climate, and they expect such knowledge to be factored into planning. The follow-ing sections discuss opportunities to affect how supply and demand assumptions are developed in order to incorporate this improved knowledge.
3.1.2 Expanding the Set of Plausible Planning Futures Using Stochastic Modeling and Paleoclimate Information
Variations and timing of extremes within a particular set of supply-and-demand assumptions may be very important in determining whether or not a system can perform satisfacto-rily. These variations reflect hydroclimatic variability (that is, variations in temperature, precipitation, and runoff over vari-ous time scales). To expand on the historical record basis for planning, one planning response is to preserve the statistics of the instrumental record, while allowing for possible changes in the sequencing of conditions. This gives rise to the plausi-bility of developing synthetic hydroclimatic time series using stochastic modeling. Doing so introduces an expanded set of planning assumptions about plausible droughts and other hydroclimatic extremes.
Generally speaking, stochastic development of hydrocli-matic scenarios involves the following steps: (1) choosing a reference period from which hydroclimatic statistics will be preserved; (2) collecting data from the reference period; (3) building a stochastic model, perhaps using parametric (Ste-dinger and Taylor, 1982a,b; Salas, 1993) or nonparametric techniques (Lall and Sharma, 1996); (4) verifying that the model preserves reference hydroclimate statistics and autocor-relation characteristics; and (�) applying the model to generate synthetic hydrologic sequences for planning purposes. For this discussion, the emphasis is on step (1). The reference period must portray a climate that is still relevant for the planning future. The instrumental record offers one reference period to support stochastic modeling. Other reference periods might be considered, including those from the paleoclimatic record
(for example, evidence found in tree rings, sediment deposits, and sand dunes). Other uses for the paleoclimatic record are discussed below.
A variety of techniques have been developed to trans-late paleoclimatic data into hydroclimatic reconstructions (appendix A). For example, tree ring records have been used to reconstruct annual streamflow in various western U.S. basins. In general, these reconstructions are less reliable as indicators of past hydroclimatic magnitudes in any specific year and are instead more reliable as relative state indicators (that is, whether a reconstructed year was wet or dry relative to the reconstructed period median). Such state information is particularly useful for planning when the affected decision is sensitive to system performance under drought or other sequence variation possibilities. This has motivated numerous water resource agencies to incorporate streamflow reconstruc-tions based on tree rings into their planning assumptions about supply variability (Woodhouse and Lukas, 2006; Bureau of Reclamation, 2007).
Paleoclimatic information may indicate a wider range of hydroclimatic variability prior to instrumental records. Deter-mining the relevance of paleoclimatic information to support planning in today’s changing climate remains a matter of research. Such context also depends on recent climate trends and projected climate change that may exist outside of the climate envelope indicated by paleoclimatic information.
Given a choice to incorporate paleoclimatic information into planning, there are several ways in which such informa-tion can be used. One approach is to directly use the infor-mation for both reference climate statistics and sequencing. This involves the assumption that the hydroclimatic statistics and sequence from the reconstructed record are valid for future planning. A second approach might build on the first to include stochastic modeling to expand the set of sequence possibilities. Each sequence would reflect the statistics of the reconstructed record but would offer different sequencing. A consequence of these approaches is that assumed runoff mag-nitudes (for example, monthly-to-annual volume possibilities) are a representation of the paleorecord. It may be preferred to have these magnitudes represent the instrumental record while retaining the sequence possibilities of the paleorecord. This gives rise to a third approach, where the stochastic model is first used to generate categorical sequences (for example, wet versus dry), and a second stage is used to associate runoff magnitudes from the instrumental record (Bureau of Reclama-tion, 2007).
Key Point 6: Paleoclimate information and stochastic modeling can be useful for developing climate scenarios that include a wide range of potential hydroclimatic conditions. The expanded variability may allow a more robust evaluation of planning alternatives, particularly when there is concern that study outcomes and decisions may be sensitive to climate assumptions.
1� Climate Change and Water Resources Management: A Federal Perspective

3.1.3 Defining Plausible Planning Futures Based on Climate Projection Information
Given the evidence of recent climate trends and projected future climate conditions, there may be motivation to rely less on the instrumental record or paleoclimatic record and instead to relate planning assumptions to projections of future temperature and precipitation. These climate projections are based on global climate modeling that represents our current understanding of cause and effect in the climate system. The decision to use such climate projections depends on the following:
Whether the planning horizon is relevant in a climate change context [that is, it spans at least several decades into the future, given that climate is generally not characterized for periods less than multiple decades, and climate change must be measured over multiple decades (Intergovernmental Panel on Climate Change, 2007a)];
Whether such information has been “regionalized” to a spatial resolution that is fine enough to support the devel-opment of planning assumptions (for example, using downscaling techniques described in appendix B); and
Whether such downscaled projections are viewed to contain information that is reliable enough for planning.
Given an affirmative determination on each of these factors, a general procedure might be used to connect climate information to planning assumptions:
Survey contemporary climate projections that have been regionalized to the planning area and span the future planning horizon.
Decide which projections, variables, and aspects to incorporate.
Relate the retained information to natural conditions (for example, hydrology and ecosystems) and social conditions (for example, water demand drivers) that set up planning assumptions for supplies, demands, and constraints.
A survey of climate projections might start with the global dataset developed through the World Climate Research Programme (WCRP) Coupled Model Inter-comparison Project (CMIP) [CMIP1 (Meehl and oth-ers, 2000), CMIP2 (Covey and others, 2003), and CMIP3 (http://www-pcmdi.llnl.gov/ipcc/about_ipcc.php)]. The WCRP CMIP3 efforts were fundamental to the completion of the IPCC Fourth Assessment Report (Intergovernmental Panel on Climate Change, 2007a). The CMIP3 dataset features simu-lation of future climates using multiple GCMs, considering multiple future pathways for greenhouse gas (GHG) emissions (Intergovernmental Panel on Climate Change, 2000).
Regionalization of climate projections is primarily focused on translating spatially coarse GCMs into basin-scale informa-tion (downscaling techniques are discussed in appendix B). For example, many CMIP3 projections have been downscaled
•
•
•
•
•
•
for the contiguous United States using a statistical technique (Wood and others, 2002) and have been made available at a public-access Web site.6 The downscaling technique underlying that archive development also features the subjective choice to compensate for climate model biases. Philosophically, it might be expected that a climate model’s simulation of the past should reflect chosen statistical aspects of the observed past. When this is not the case, a climate model “bias” is deemed to exist [that is, a tendency to simulate climates that are too wet or dry and (or) too warm or cool]. In that event, the regionalization proce-dure might be scoped to also address the issue of climate model bias. Whether and how this bias is accounted for in the use of climate projection information is a matter of subjective choice. Another issue with the use of climate projections is reconciling the time step of the projections with the temporal resolution required for the corresponding demand assumptions. Global cli-mate modeling groups often report monthly values for tempera-ture and precipitation. However, daily weather time series may be required to drive hydrologic simulations that reveal changes to runoff timing. Temporal disaggregation techniques are then required to provide the needed temporal resolution for tempera-ture and precipitation projections.
After obtaining regionalized climate projection information, the next step is to decide which projections, variables, and aspects of these variable projections are relevant for the given planning study. Several questions might be addressed in this process:
Should all projections be retained, or should the analyst apply some rationale to cull some projections from consideration?
Should retained projections be regarded equally or unequally (for example, based on perceived climate model skill)?
Which aspects of the projections should be related to the planning study (for example, which variables and what statistical or sequential aspects of these variables)?
These questions are currently a matter of research. Ulti-mately, answers to these questions reflect climate relevance to the planning study (for example, variables, statistics, and plan-ning horizon) and regard for the relative credibility of different projection variables and aspects.
Given a set of chosen, relevant climate projections, the next step is to relate that information to the planning assump-tions and ultimately to arrive at impacts. The multitude of approaches that accomplish this task have been summarized
6“Statistically Downscaled WCRP CMIP3 Climate Projections,” available at http://gdo-dcp.ucllnl.org/downscaled_cmip3_projections/.
•
•
•
Key Point 7: Current expectations about future climate may indicate a need to supplement historical climate information. Planning assumptions might instead be related to projections of future temperature and precipitation. This can be accomplished using a multitude of approaches; a best approach has yet to be determined.
3 Anticipating Climate Change: Available Climate Information for Decisionmaking in Long-Range Planning 1�

by Vicuna and Dracup (2007). There is not yet any clear “best” method to relate climate projection information through planning assumptions to arrive at impacts.
As there are opportunities to blend paleoclimatic and instrumental records while developing water-supply assump-tions, there are also opportunities to blend paleoclimatic and projected climate information. For example, the third approach described in section 3.1.2 might be modified for this task. The paleoclimate could remain as the source of wet-dry sequences (that is, interannual to interdecadal variability). Then, rather than use instrumental records as the source for runoff magnitude possibilities, these magnitudes could come from runoff projec-tions developed in association with climate projections (for example, change in runoff seasonality). Determining how to blend these sources of information remains a matter of research.
3.2 Use of Climate Information in Flood-Risk Evaluations
Evaluations of flood likelihood and consequences, and hence flood risk, can impact multiple decisions throughout water management. Infrastructure reliability is often evaluated relative to its ability to withstand unlikely flood events. Levee systems, canals, and dams are evaluated regularly with respect to their ability to endure events. Water-control plans for surface-water reservoirs often feature “flood space” requirements linked to hydrologic event hazards, varying throughout the year, and expectations for downstream societal protection against floods.
Climate assumptions are evident in flood-risk evaluations based on how hydrologic hazards are characterized. Funda-mentally, the climate regime underlying the hydrologic possi-bilities directly determines the portfolio of hydrologic hazards that could occur. For this reason, it is reasonable to question the appropriateness of any underlying climate assumption for a given flood-risk evaluation.
3.2.1 Flood-Risk Evaluation MethodsFlood risk might be estimated using probabilistic or deter-
ministic techniques. Probabilistic floods are estimated events associated with a probability of occurrence, typically derived from the observed record. The estimation procedure involves surveying historical hydrologic data, characterizing annual maxi-mum floods, fitting a distribution to these annual maximums, and using that distribution to infer events of rare reoccurrence (for example, 1-in-100-year or 1-in-�00-year floods). The most com-mon framework for establishing probabilistic extremes within the United States is Bulletin 17–B, which presents “Guidelines for Determining Flood Flow Frequency” (IACWD, 1982).
Deterministic floods include design floods and Probable Maximum Floods (PMFs) and are estimated without assump-tions about recurrence probability. For example, the PMF is the flood that may be expected from the most severe combi-nation of critical meteorological and hydrologic conditions that are reasonably possible in a particular drainage area. The
meteorological forcing for the PMF is the Probable Maximum Precipitation (PMP). The PMP is the greatest depth (amount) of precipitation for a given storm duration that is theoretically possible for a particular geographic location. To determine the PMP, the concepts of storm maximization and geographic storm translation are applied.
3.2.2 Incorporating Climate Projection Information Into Flood-Risk Evaluations
Properly evaluating future flood risk within a changing climate remains a goal of water-management decisionmakers. Changes in temperature and precipitation would conceptually affect the characterization of flood-frequency distributions in a given region. The previous section discussed how instru-mental records serve as the primary source of information to characterize flood risk. A key assumption underlying current probabilistic techniques is that the distribution of floods is regarded as stationary (chap. 1). A number of researchers have proposed alternative probabilistic techniques that allow for nonstationarity in flood event distributions. The most common adaptation approach is to allow the parameters of an assumed distribution to vary with time; nonparametric techniques have also been proposed. In general, additional research is required to establish the most suitable methods for treating nonstation-arity in flood-risk evaluations for the United States.
An alternative is that flood risk be evaluated using a more limited set of recent observations, but extrapolating the prob-ability of infrequent events from a short record is fraught with uncertainty. Furthermore, for long-term evaluations of flood risk, it might be questioned whether any of the instrumental record can be used to portray future flood risk. To that end, the climate projection information discussed earlier (sec. 3.1.3) might be surveyed for temperature and precipitation condi-tions relevant to flood-event estimation. However, if such an approach is pursued, careful examination of the relation between flood mechanisms and the reliability of the climate models to portray these mechanisms is warranted.
For probabilistic methods, the same hydrologic simulation techniques used to characterize water-supply assumptions under climate change (section 3.1.3) might be used to produce flood-event information. For example, simulated hydrologic projec-tions consistent with climate projections might be surveyed for annual series of maximum flood events (or other hydrologic extremes of interests). Such information might be generated relative to an ensemble of climate projections to incorporate projection uncertainty into the estimation of projected flood-frequency distributions, evolving through time.7 There are many uncertainties associated with such an approach, particularly those introduced by the limited abilities of climate models to sufficiently portray hydrometeorological extremes within cli-mate projections (Intergovernmental Panel on Climate Change,
7This framework is being explored through ongoing research supported jointly by Reclamation and USACE, with the focus on implications for hydro-logic hazard assessments in dam safety evaluations.
20 Climate Change and Water Resources Management: A Federal Perspective

2007a). However, to the extent that monthly to seasonal climate conditions affect regional flood potential, this use of climate projection information might offer insight into the implications of climate change for trends in flood risk during the coming decades. For deterministic methods, climate projections might be used to guide meteorological assumptions feeding into PMP estimation. Questions remain about how climate projections can be utilized to guide the PMP procedures involving storm “maximization” and “translation.”
3.2.3 Incorporating Paleoflood Information Into Flood-Risk Evaluations
The prospects of climate change might compel us to con-sider a range of potential flood events beyond those implied by the instrumental record. Paleofloods offer another way of characterizing such events. Paleoflood hydrology is the study of floods prior to the instrumental record or in ungaged basins (Costa, 1987; Baker, 2008). More information on paleoflood hydrology can be found in appendix A. The study of land-forms, sediments, and botanical evidence can be used to infer information about previous flooding. Flood reconstructions can be used to improve flood-frequency estimates, as well as to provide information on the magnitude and age of the largest flood(s) for a particular basin and for hydrologically homoge-neous geographical regions (Jarrett and England, 2002).
Paleoflood reconstructions can be used in a variety of ways. One use involves informal comparison of current floods to paleofloods, putting current floods into the context of events that appear to have occurred in the past. Also, paleoflood data might be referenced in flood-frequency analyses (see Baker and others, 2002; Baker, 2008). As with previously described uses of paleoclimate information, the use of paleoflood infor-mation requires an assumption that paleoflood magnitudes are relevant to the future.
3.3 Recent Reclamation and USACE Planning Applications Involving the Use of Expanded Climate Information Sets
In recent years, Reclamation, USACE, and other Federal and State agencies have explored the use of expanded climate information sets to support various water resources planning efforts. Three examples are listed below, where the planning focus involves evaluating proposed or anticipated plans for long-term operation (or water control):
Lake Ontario-St. Lawrence River Study, which used climate projection information and stochastic modeling to guide hydrologic variability assumptions in water control planning for the Lake Ontario-St. Lawrence River System (IJC, 2006).
Colorado River Basin Study, which used nonparametric stochastic modeling with paleoclimate information to
•
•
guide water-supply variability assumptions in opera-tions planning for the Colorado River Storage System (Bureau of Reclamation, 2007).
California Central Valley Study, which used climate projection and sea-level rise information to guide water-supply assumptions in a biological assessment on multiple fish species in the California Central Val-ley (Bureau of Reclamation, 2008).
Each study’s use of different climate information types is described further in appendix C. It is not possible to precisely say whether and how decision outcomes were affected by the use of expanded climate information sets. However, it can be said that the stakeholders in all of these studies made it clear that they wanted the analyses of these systems to relate system impact and study outcomes to projected climate informa-tion and (or) broader climate-variability assumptions. These pressures from stakeholders resulted in the agencies making changes in their traditional methods of analysis. To that end, each study process was completed, technical and communica-tion challenges were overcome, and each planning process ultimately benefited by addressing stakeholder expectations to incorporate a broader array of possible climate assumptions.
3.4 Summary and Discussion
The focus of this chapter was on how climate informa-tion has traditionally been used in two classes of long-range water-management decisions (general system evaluations and flood-risk evaluations). Motivations were discussed for using an expanded set of climate information to support both deci-sion processes. Expanded climate information might involve the use of paleoclimatic evidence on hydroclimatic conditions, stochastic modeling to augment sequence possibilities, and (or) the incorporation of climate-projection information.
Paleoclimatic evidence of supply variations and flood events may portray hydrologic possibilities that have not occurred in the instrumental record. This provides motivation to consider a range of hydrologic possibilities beyond those from the instrumental record. Evidence that we exist in a changing climate provides further motivation. Paleoclimatic evidence about hydrologic conditions offers an accessible source of information for planning. In addition, stochastic modeling tech-niques offer the opportunity to expand planning assumptions of hydrologic sequences with implications for supply variability (for example, drought possibilities). The use of such techniques requires the implicit belief that the reference period underlying the stochastic model is relevant to the planning future.
To date, more attention has been focused on the methods relating climate-projection information to water-supply and demand assumptions. Until uncertainty narrows considerably, or until enough time elapses to see which methods best charac-terize future conditions, there will continue to be an array of rea-sonable approaches. At this time, it seems safe to say that there
•
3 Anticipating Climate Change: Available Climate Information for Decisionmaking in Long-Range Planning 21
is no single “best” procedure for considering projected climate information in either class of long-range decisionmaking.
Questions to management agencies about adapting, physically or operationally, to climate change are likely to continue. In addressing questions on climate change adapta-tion through time, the establishment of planning assumptions becomes complicated within a context of climate nonstationar-ity. To review, using traditional planning approaches, planning assumptions are developed relative to a stationary reference climate (that is, the Stationary System paradigm) that typically reflects climate from the instrumental record. Now consider establishing planning assumptions to reflect future climate change while maintaining the Stationary System paradigm. The task involves adjusting planning assumptions based on the instrumental record to reflect the effects of incremental climate change [for example, approaches featured in International Joint Commission (IJC) (2006) and Bureau of Reclamation (2008)]. Detection and appropriate application of incremental climate change using climate projections (or instrumental records) may be challenging. For example, it may be clear that some regional hydroclimatic conditions are nonstationary and are evolving in a steady fashion (for example, air temperature), thereby making climate change detection and the selection of a station-ary regime generally straightforward. For other variables, such detection may be much more difficult because of natural variability within the model projections (or in instrumental
records). For example, detecting changes in precipitation cli-matology is difficult given the large amount of variability that exists at both interannual and multidecadal time scales.
To avoid such detection uncertainties, it may be clearer and more appropriate (albeit at the cost of complexity) to frame long-range system evaluations relative to projected planning assumptions consistent with climate projections (that is, the System Projection paradigm). In doing so, planning assumptions for water supplies, demands, and constraints would be projected through time, consistent with the tran-sient characteristics of climate projections. The development of such system projections would require the view that the transient aspects in climate projections are credible enough for planning purposes. It would also require the view that hydrologic sequences consistent with climate projections are suitable substitutes for those that might be taken from the instrumental record. If such views are held, then use of this paradigm could allow the questions of adaptation to manage-ment agencies to be more easily addressed.
For long-range planning practices to advance in incor-porating climate projection information, it is clear that further research is necessary to improve our understanding in many areas (chap. 6). Two areas are highlighted here: (1) establish-ing valid climate planning assumptions and assessing impacts in response to global climate change, and (2) determining the potential for precipitation extremes to change and adapting planning for extreme precipitation. The first area is crucial for improving our ability to characterize water-supply assump-tions under climate change. The latter is crucial for evaluating flood risk in relation to structural safety and operational flood protection.
Key Point 8. A System Projection paradigm for adaptation planning, as opposed to a Stationary System paradigm, may offer a more appropriate context for characterizing planning assumptions, albeit at the potential cost of adding planning complexity.
22 Climate Change and Water Resources Management: A Federal Perspective

4 Anticipating Climate Change: Approaches for Decisionmaking
This chapter reviews whether the existing planning frameworks used by water-management agencies are flex-ible enough to incorporate the uncertainties related to climate change. The chapter reviews how climate plays a role in system planning and operations, and introduces issues with incorporating climate information into planning approaches. The uncertainty of projections of future climate and of approaches to assigning probabilities to future conditions are discussed. Robust decisionmaking and adaptive management are presented as options to make decisions more flexible given uncertainty.
4.1 Decisions and Scales
Contemporary water-management decisions are made at a variety of space and time scales and are informed by assumptions about supplies, demands, weather, climate, and operational constraints at those scales. Generally, decisions apply spatially from stream corridors to multistate regions and temporally from days to decades. There are several analytical approaches that might be considered for incorporating climate change information into a planning process, ranging from no discussion to qualitative or quantitative analyses. Whether the information is used in any analysis may depend on the avail-ability of regional climate projections, their suitability (that is, whether projected variables and scales match those required in the planning analysis to drive management decisions), and whether such projections suggest significant changes in future climate relative to past climate.
Because climate changes are traditionally detected over a period that spans multiple decades (Intergovernmental Panel on Climate Change, 2007a), decisions with application horizons of greater than roughly 20 years might reasonably be informed by climate change information. A variety of deci-sions and planning analyses may involve looking ahead more than 20 years, including:
General planning studies exploring feasibility, eco-nomic benefits and costs, and estimation of risks (such as flood damage or water-supply shortages) to help decisionmakers decide among alternative proposed actions, including proposed infrastructure and (or) establishment of long-term operations criteria.
Proposal documentation on expected benefits and impacts of alternative proposed actions (for example, the National Environmental Policy Act).
Consultation with fish and wildlife agencies on how proposals may affect environmental conditions and species listed as threatened or endangered (for exam-ple, section 7 consultations under the Endangered Species Act).
•
•
•
Many decisions involve application horizons that range from days to years, such as daily release scheduling, monthly operations scheduling to determine annual water allocations, and hydropower marketing strategies. These decisions occur at time scales that are shorter than those required for detecting climate change (Intergovernmental Panel on Climate Change, 2007a). However, climate still plays a role in these decisions. Instead of being informed by future climate projections, they are informed by climate information from the past. This past information is used to calibrate water-supply forecast models and to provide a basis for assumed demands and operating constraints during upcoming months and seasons. If historical climate change has been observed, this can be incorporated into the decision to the extent that it affects supply, demand, or constraint assumptions (for example, updating water-supply forecast models to reflect more recent weather-runoff relations rather than those from the earlier period of record).
In many planning studies, it is necessary to conduct a multiobjective analysis that compares the economic costs with the benefits of alternative plans. The Economic and Environ-mental Principles and Guidelines (P&G) for Water and Related Land Resources Implementation Studies (U.S. Water Resources Council, 1983) are guidelines for water-management agencies to use for planning. The planning process is supposed to explic-itly consider future conditions during the planning horizon. While there is no discussion of stationarity in P&G, Frederick and others (1997) state that this step could include a forecast of climate-change impacts. Under the P&G, planners identify areas of risk and uncertainty and describe them clearly “so that deci-sions can be made with knowledge of the degree of reliability of the estimated benefits and costs” (U.S. Water Resources Coun-cil, 1983). P&G recommends the use of sensitivity analysis, which is described as varying assumptions and examining the effects on outcomes of benefits and costs. Frederick and others (1997) state that the P&G is flexible enough to accommodate planning for climate change. They note that sensitivity analysis and scenario planning are tools for understanding uncertainty that can be employed with the P&G.
4.2 Describing Future Climate for Planning
When defining potential future climate change, planners would primarily be informed by projections generated using atmosphere-ocean GCMs for the reasons discussed in section 3.1.3. These models simulate the climate-system response to an assumed scenario of future greenhouse gas emissions, or “climate forcings,” from an estimated “initial system condi-tion.” The models are complex deterministic models of nonlin-ear systems. Although their purpose is to project future climate conditions, there are many sources of uncertainties in the mod-els, including forcing uncertainty, initial condition uncertainty, and climate modeling uncertainties (Stainforth and others, 2007). Forcing uncertainty deals with future greenhouse gas emissions (that is, human behavior) and other natural fac-tors (for example, the occurrence and magnitude of future
4 Anticipating Climate Change: Approaches for Decisionmaking 23
volcanic events) (Rayner, 2000). Initial condition uncertainty is associated with an incomplete description of earth system conditions at the beginning of climate simulations. Climate modeling uncertainties are the knowledge limitations about the climate-system physics (for example, clouds formation, ocean processes, ice-sheet melt processes, and many others) and the limited ability to approximate the physics at space and time scales that are computationally feasible. Despite these uncer-tainties, each generation of climate models has gotten better at simulating past climate (Reichler and Kim, 2008), and we can expect that, with continued investment in the science, they will continue to improve in the coming years and decades.
Scenario analysis is one method to deal with complex, uncertain systems. Traditional scenario analysis uses a small number of scenarios (Schwartz, 1991). These scenarios could be defined relative to climate projections, demographic outlooks, and other planning drivers. Such scenarios might be cast as “top down” (Colorado Water Conservation Board, 2008) (fig. 9). These contrast with “bottom up” scenarios (Colorado Water Conservation Board, 2008) defined within a sensitivity analysis where thresholds of operations flexibility are revealed by incre-mentally adjusting planning drivers. These approaches are not necessarily exclusive (Miller and Yates, 2006).
One example of the traditional scenario approach is the Millennium Ecosystem Assessment framework to account for the future of ecosystem services (World Resources Institute, 2003). Because of the complexity of ecosystems, the assess-ment used four internally consistent scenarios to describe the range of plausible futures for Earth’s ecosystems. Likewise, the IPCC has been using the scenario paradigm (Intergovern-mental Panel on Climate Change, 2000) to describe future greenhouse gas emission possibilities associated with future human activity (that is, population growth, economic develop-ment, technological change, and ultimately energy use).
One question associated with the scenario approach is: What is an appropriate number of scenarios to use? In tradi-tional scenario analysis (Schwartz, 1991), there are often only two or three major future drivers that are uncertain and two or three possible states for each of the two or three drivers. A small number of scenarios may be insufficient to model a range of values for important input parameters. An alternative
approach is to use a large number of scenarios to describe a wide range of possible futures (Groves and Lempert, 2007). The set of scenarios should contain as diverse a set of plau-sible futures as possible and represent a wide range of differ-ent types of information about the future (Lempert and others, 2003). The aim is to test alternative policies against a variety of possible conditions.
Groves and others (2008) conducted workshops with the California Inland Empire Utilities Agency to describe climate change uncertainty for water management. They used three methods: a traditional scenario analysis with a small number of scenarios, a scenario-rich approach where relative prob-abilities were not assigned, and another scenario-rich approach where such probabilities were assigned. The stakeholders who reviewed the three approaches found that the traditional scenario approach was the easiest to understand and explain to decisionmakers, but they felt that it provided much less infor-mation than the other approaches (Groves and others, 2008).
Scenarios have been used in many studies to evaluate potential climate change impacts (Parson and others, 2007). These studies have employed different numbers of scenarios and different ways to handle scenario probabilities. One example is the New York City Department of Environmental Protection assessment of climate change impacts on New York City’s water supply and coastal vulnerability (Rosenzweig and others, 2007). The study task force selected five GCMs and three emission scenarios and developed model-based probabil-ity distributions for temperature increases and changes in pre-cipitation. Another example is an examination of the impact of sea-level rise on coastal flooding in the metropolitan Boston area (Kirshen and others, 2008). The study used two scenarios
Key Point 9: Adopting alternatives that perform well over a wide range of future scenarios could improve system flexibility. Water resources planning and management requires an appreciation of existing and potential future uses of water resources [Mr. Steven L. Stockton, PE, Director of Civil Works, USACE, in testimony before the Subcommittee on Water Resources and Environment, 24 June 2008 (http://www.usace.army.mil/cw/cecw-cp/news/stockton_testimony.pdf)], particularly when public health and safety are involved.
Impact and Adaptation
Options
1. Climate and socioeconomic scenarios
2. Global circularion model output
3. Regional downscaling4. Projected responses5. Identify vulnerabilities6. Develop adaptation options7. Alternatives assessment
6. Assess alternatives5. Projected responses4. Regional downscaling3. Develop adaptation
options2. Identify drivers1. Identify vulnerabilities
Figure �. Bottom-up and top-down scenario definitions in climate change assessments (after Colorado Water Conservation Board, 2008).
24 Climate Change and Water Resources Management: A Federal Perspective
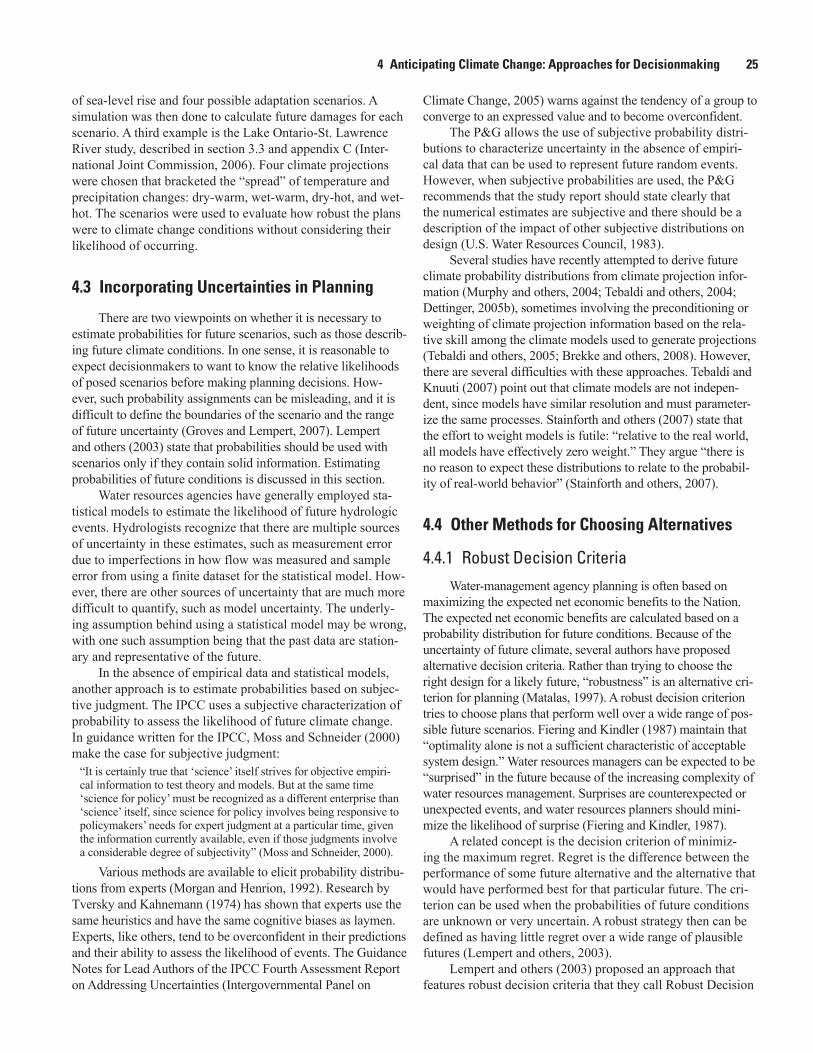
of sea-level rise and four possible adaptation scenarios. A simulation was then done to calculate future damages for each scenario. A third example is the Lake Ontario-St. Lawrence River study, described in section 3.3 and appendix C (Inter-national Joint Commission, 2006). Four climate projections were chosen that bracketed the “spread” of temperature and precipitation changes: dry-warm, wet-warm, dry-hot, and wet-hot. The scenarios were used to evaluate how robust the plans were to climate change conditions without considering their likelihood of occurring.
4.3 Incorporating Uncertainties in Planning
There are two viewpoints on whether it is necessary to estimate probabilities for future scenarios, such as those describ-ing future climate conditions. In one sense, it is reasonable to expect decisionmakers to want to know the relative likelihoods of posed scenarios before making planning decisions. How-ever, such probability assignments can be misleading, and it is difficult to define the boundaries of the scenario and the range of future uncertainty (Groves and Lempert, 2007). Lempert and others (2003) state that probabilities should be used with scenarios only if they contain solid information. Estimating probabilities of future conditions is discussed in this section.
Water resources agencies have generally employed sta-tistical models to estimate the likelihood of future hydrologic events. Hydrologists recognize that there are multiple sources of uncertainty in these estimates, such as measurement error due to imperfections in how flow was measured and sample error from using a finite dataset for the statistical model. How-ever, there are other sources of uncertainty that are much more difficult to quantify, such as model uncertainty. The underly-ing assumption behind using a statistical model may be wrong, with one such assumption being that the past data are station-ary and representative of the future.
In the absence of empirical data and statistical models, another approach is to estimate probabilities based on subjec-tive judgment. The IPCC uses a subjective characterization of probability to assess the likelihood of future climate change. In guidance written for the IPCC, Moss and Schneider (2000) make the case for subjective judgment:
“It is certainly true that ‘science’ itself strives for objective empiri-cal information to test theory and models. But at the same time ‘science for policy’ must be recognized as a different enterprise than ‘science’ itself, since science for policy involves being responsive to policymakers’ needs for expert judgment at a particular time, given the information currently available, even if those judgments involve a considerable degree of subjectivity” (Moss and Schneider, 2000).
Various methods are available to elicit probability distribu-tions from experts (Morgan and Henrion, 1992). Research by Tversky and Kahnemann (1974) has shown that experts use the same heuristics and have the same cognitive biases as laymen. Experts, like others, tend to be overconfident in their predictions and their ability to assess the likelihood of events. The Guidance Notes for Lead Authors of the IPCC Fourth Assessment Report on Addressing Uncertainties (Intergovernmental Panel on
Climate Change, 200�) warns against the tendency of a group to converge to an expressed value and to become overconfident.
The P&G allows the use of subjective probability distri-butions to characterize uncertainty in the absence of empiri-cal data that can be used to represent future random events. However, when subjective probabilities are used, the P&G recommends that the study report should state clearly that the numerical estimates are subjective and there should be a description of the impact of other subjective distributions on design (U.S. Water Resources Council, 1983).
Several studies have recently attempted to derive future climate probability distributions from climate projection infor-mation (Murphy and others, 2004; Tebaldi and others, 2004; Dettinger, 200�b), sometimes involving the preconditioning or weighting of climate projection information based on the rela-tive skill among the climate models used to generate projections (Tebaldi and others, 200�; Brekke and others, 2008). However, there are several difficulties with these approaches. Tebaldi and Knuuti (2007) point out that climate models are not indepen-dent, since models have similar resolution and must parameter-ize the same processes. Stainforth and others (2007) state that the effort to weight models is futile: “relative to the real world, all models have effectively zero weight.” They argue “there is no reason to expect these distributions to relate to the probabil-ity of real-world behavior” (Stainforth and others, 2007).
4.4 Other Methods for Choosing Alternatives
4.4.1 Robust Decision CriteriaWater-management agency planning is often based on
maximizing the expected net economic benefits to the Nation. The expected net economic benefits are calculated based on a probability distribution for future conditions. Because of the uncertainty of future climate, several authors have proposed alternative decision criteria. Rather than trying to choose the right design for a likely future, “robustness” is an alternative cri-terion for planning (Matalas, 1997). A robust decision criterion tries to choose plans that perform well over a wide range of pos-sible future scenarios. Fiering and Kindler (1987) maintain that “optimality alone is not a sufficient characteristic of acceptable system design.” Water resources managers can be expected to be “surprised” in the future because of the increasing complexity of water resources management. Surprises are counterexpected or unexpected events, and water resources planners should mini-mize the likelihood of surprise (Fiering and Kindler, 1987).
A related concept is the decision criterion of minimiz-ing the maximum regret. Regret is the difference between the performance of some future alternative and the alternative that would have performed best for that particular future. The cri-terion can be used when the probabilities of future conditions are unknown or very uncertain. A robust strategy then can be defined as having little regret over a wide range of plausible futures (Lempert and others, 2003).
Lempert and others (2003) proposed an approach that features robust decision criteria that they call Robust Decision
4 Anticipating Climate Change: Approaches for Decisionmaking 25
Making (RDM); it has four elements (Lempert and others, 2003; Dewar and Wachs, 2006):
Consider a large number of scenarios that contain a range of plausible futures that are as diverse as pos-sible.
Seek robust, rather than optimal, strategies that do well across a broad range of plausible futures.
Employ adaptive strategies to achieve robustness; adaptive strategies evolve over time in response to new information.
Use computer tools for interactive exploration of the multiplicity of plausible futures.
Dewar and Wachs (2006) argue that robustness methods are superior to sensitivity analysis. Robustness methods con-sider a wider range of possible situations, while a few sensitiv-ity studies may not include some important system responses for situations not included in the few cases considered. The primary difference of the approach of Lempert and others (2003) is the use of a large number of plausible future scenar-ios that can be generated by computer models. The scenarios that seem most closely associated with system vulnerabilities are first identified. An optimal policy does best for a fixed set of assumptions about the future. The robust policy performs well across a wide range of plausible futures. Robust decision criteria are compatible with other decision criteria and could be an additional piece in a multicriteria decision problem.
4.4.2 Adaptive ManagementMany planning situations require an emphasis on adapt-
ability and flexibility. Anticipatory management builds in the flexibility to anticipate future conditions. “Faced with a mul-tiplicity of plausible futures, a decisionmaker may settle on near-term actions but plan to adjust them in specific ways as new information renders some futures implausible and others more likely” (Lempert and others, 2003). The Second Assess-ment Report of the IPCC proposed using a sequential decision process for dealing with climate change (Intergovernmental Panel on Climate Change, 1996). Future decisions should “be able to respond to new information with mid course correc-tions” that allows time to learn and change course.
Adaptive management is one decision process that “pro-motes flexible decisionmaking that can be adjusted in the face of uncertainties as outcomes from management actions and other events become better understood” (National Research Council, 2004). Adaptive management offers a framework where robust decision criteria may be considered. Adaptive management is an iterative process of six steps: (1) assess the problem, (2) design, (3) implement, (4) monitor, (�) evaluate, and (6) adjust (Williams and others, 2007).
Water-management agencies have primarily associ-ated adaptive management with environmental management and ecosystem restoration. Adaptive management has been
•
•
•
•
used for evaluating alternative reservoir releases in order to improve downstream aquatic habitat (National Research Council, 2004). Adaptive management can actually be used for any dynamic system where there is uncertainty about the future. DeNeufville (2000) describes a similar process called dynamic strategic planning for planning various types of tech-nological projects.
Adaptive management is more suited to guiding opera-tional or institutional changes rather than construction of new water facilities. Structural solutions may be hard to reverse unless they are designed to anticipate alternative future conditions with planned upgrades. Adaptive management can be either “active” or “passive” (National Research Council, 2004). Active approaches include management actions that test hypotheses about how the system will respond to a particular course of action. Passive approaches focus on monitoring and evaluating conditions. The adaptive management approach toward climate uncertainty would follow a course of monitor-ing conditions and adjusting policies as changes are observed or scientific uncertainty is reduced. The monitoring need of adaptive management may require a change in authorities for Federal water-management agencies.8,9
4.5 Summary
Several studies have concluded that current water-man-agement planning regulations such as the P&G are flexible
8Since the Water Resources Development Act (WRDA) of 1986, the USACE must turn over post-construction, project-related responsibilities to a non-Federal sponsor for civil works projects with the exception of naviga-tion. These responsibilities include operations, maintenance, repair, and rehabilitation. If later modifications are needed for projects, a cost-shared feasibility study and authorization of project modification by Congress may be required. Exceptions to this rule include Section 113� authority from the 1986 WRDA, Section 216 authority from the 1970 Flood Control Act, and the Comprehensive Everglades Restoration Project authorized by the 2000 WRDA. Section 216 of the River and Harbor Act and Flood Control Act of 1970 gives the USACE authority to reevaluate projects that the USACE has constructed. These authorities allow modifications in response to significantly changed conditions without seeking additional congressional authorization (NRC, 2004). The USACE has limited funding for inspections of completed Flood Damage Reduction projects. The current USACE policy restricts cost-shared monitoring of ecosystem restoration projects to � years and 1% of the total project costs for most projects. This is being reconsidered in response to Section 2039, Monitoring Ecosystem Restoration, WRDA 2007 (PL 110-114). The current policy on cost-shared monitoring of ecosystem restoration projects is limited to 3% of the total project costs, excluding monitoring costs; however, variations can be requested.
9The Department of the Interior has developed guidance to its bureaus regarding adaptive management located in their Department Manual at ��2 DM 1 entitled “Adaptive Management Implementation Guidance,” dated January 1, 2008.
Key Point 10: Adaptive management is an approach that makes decisions sequentially over time and allows adjustments to be made as more information is known. This approach may be useful in dealing with the additional uncertainty introduced by potential climate change.
26 Climate Change and Water Resources Management: A Federal Perspective
enough to accommodate planning for climate change. How-ever, current planning approaches have generally assumed that past climate conditions will be similar to the recent past, an assumption that may be suspect given that climate is changing. In the absence of the stationarity assumption, other methods can be used to estimate the likelihood of future hydrologic conditions, including subjective probability methods and approaches that use climate models to derive a range of pos-sible future conditions. However, probability estimates using these approaches could give misleading results that do not consider the full range of uncertainty.
Other decisionmaking approaches can be used for dealing with uncertainty. A robust decision criterion tries to choose plans that perform well over a wide range of possible future scenarios. A sequential decision process plans for alternative courses of action, given different possible future conditions, and can be changed as new information is gained. Decision-making that aims for flexibility could be enhanced by using a framework that employs a wide range of plausible future conditions, seeks robust solutions that do well across a broad range of plausible futures, and employs adaptive strategies that
evolve over time in response to new information. Maximiz-ing flexibility across these scenarios, however, may come at a prohibitive cost. Evaluating this trade-off between flexibility and cost is part of the planning process.
These approaches are not mutually incompatible and can be used in conjunction with current water-manage-ment planning methods that primarily employ cost-benefit analysis and sensitivity analysis. All of these approaches present options and then try to assess their performance under a range of conditions. Approaches such as the method proposed by Lempert and others (2003) may do a better job of representing multiple plausible futures, but these approaches are more computationally intensive and are often difficult to explain to stakeholders. There is nothing about these approaches that guarantees they will discover and incorporate a greater range of options or futures than other approaches. The value of every approach lies in its applica-tion to a specific problem. Each approach can be helpful, but each approach can also lead us to think that we know more about the future than we do.
4 Anticipating Climate Change: Approaches for Decisionmaking 2�

5 Responding to Climate Change: Adaptation Options
There are several water-management options that might be considered to facilitate adaptation to climate change, including operational changes, demand management, and infrastructure changes. Climate change may translate into changed design and operational assumptions for determin-ing resource supplies, system demands, system performance requirements, and operational constraints. The strategy options available for consideration will vary from system to system, as will the preference among these options. The following sec-tion outlines some potential strategies that might be considered and also discusses some of the challenges in evaluating and implementing the adaptation options.
Adaptation options designed to ensure water supply during average and drought conditions require integrating demand-side and supply-side strategies and depend on the existence of an operational framework for adaptive manage-ment and planning to cope with uncertainty. Evaluation of such strategies would likely require a partnership between Federal, State, and local interests. This chapter does not go into the specific planning authorities; instead available options are presented for adapting to climate change as it occurs across various temporal and spatial scales. These options would include the incorporation of lessons from responses to climate variability into longer term vulnerability-reduction efforts and within governance mechanisms from communities and water-sheds to international agreements.
Integrated watershed management provides an important governing framework for anticipating and achieving success-ful adaptation measures across socioeconomic, environmen-tal, and administrative systems. To be effective, integrated approaches must occur at the appropriate scale or scales needed to facilitate effective actions for specific outcomes, and they must be based on strong linkages among monitoring, research, and management as climate varies and changes. A more comprehensive mode of operation that includes water-shed management (given interbasin transfers and so forth) is integrated water resources management. Integrated water-management strategies include capturing social and individual risk perception, reshaping planning processes, coordinating land and water resources management, recognizing water-quantity and water-quality linkages, increasing conjunctive use of surface water and ground water, improving techniques to manage demand and conserve water, protecting and restoring natural systems, and learning through adaptive management experiments, including consideration of climate change. In addition, integrated strategies explicitly address impediments to the flow of information across the nodes of action (agen-cies, States, tribes, communities, and the private sector) and focus on decision quality as well as acceptability (Pulwarty, 2003). Institutional efforts to reduce conflict can also help to achieve desired goals. A fully integrated approach is not always needed, but rather the appropriate scale for integration
will depend on the extent to which it facilitates effective action in response to specific needs (Moench and others, 2003).
In particular, an integrated approach to water manage-ment that is robust—that can produce socially acceptable options and inform decisionmaking as resource characteris-tics (quality, quantity, and reliability) change—could help to resolve conflicts among competing water users. In several places in the western United States, water managers and vari-ous interest groups have been experimenting with methods to promote consensus-based decisionmaking as new information arises. These efforts include local watershed initiatives and State-led or Federal-sponsored efforts to incorporate stake-holder involvement in planning processes (U.S. Department of the Interior, 200�). Such initiatives can facilitate negotiations between competing interest groups to achieve mutually satis-factory problem-solving that considers a wide range of factors.
Key Point 11: Adaptation options include operational, demand management, and infrastructure changes.
5.1 Adaptation Options Involving Operational Changes
One adaptation to climate change is to make better use of existing water resources by building more flexibility into oper-ating plans. Existing operating plans are based on the historical climate. For example, flood-control rules are based on evalu-ations of historical flood risk, which have a climate context as described in section 3.2. There may be benefits from revising reservoir storage rules and authorized purposes as climate changes. Changes in climate or other aspects of basin hydrol-ogy, as well as changes in social values, may result in new uses for reservoir storage that have a greater economic or social value than the current uses. Flood storage space could be evalu-ated based on updated hydrologic records and future projec-tions. Some projects may be operated more efficiently as part of an integrated system rather than as independent projects.
Updates may be rapid or time consuming and expensive, depending on the river system and the nature and extent of the proposed changes. Locations for which observed climate change to date have resulted in a call for operational changes (for example, snowpack-dominated watersheds) may benefit from a systematic revision of reservoir operating plans and drought contingency plans. Other locations for which climate change is not a major driver may not require an extensive review or revision. When contemplating the value of incorpo-rating climate projections into reservoir and river operations, managers must weigh potential benefits, given uncertainties in climate information, against the known and immediate costs of revision to operations.
On the short term, water managers could increase the adaptive capacity to climate change through increased opera-tional flexibility. One way could be through the use of intra-seasonal to interannual climate forecasts. Much of the seasonal
5 Responding to Climate Change: Adaptation Options 2�

forecast skill is due to predictions of El Niño or La Niña and correlated impacts in North America (Climate Change Science Program, 2008d). Reservoir operators could reduce flood stor-age during years that are forecast to be dry. In some areas of the country, such as California, there is also some limited skill at forecasting major rain events up to 2 weeks in advance. A forecast of such an event could allow for evacuation of reser-voirs in anticipation of a flood. Further research needs to be conducted on both developing better forecasts and incorporat-ing the forecasts into reservoir operations.
Reservoir operations that employ an adaptive manage-ment process can have the flexibility to adapt to observed cli-mate conditions on an annual basis. An annual operating plan (AOP) is developed based on current hydrologic conditions, the forecast, and likely runoff scenarios (U.S. Army Corps of Engineers, 2004). The draft AOP forecasts the regulation of the system for various runoff scenarios and includes public involvement in developing the plan.
Adaptations to climate change include making better use of existing water resources through integrated surface-water and ground-water management. Conjunctive use refers to the coordinated use of ground water and surface water to optimize the use of both sources (Galloway and others, 2003). The 200� update of the California Water Plan estimates that annual water deliveries could be increased by 0.�–2 million acre-feet statewide if conjunctive management were more fully utilized (California Department of Water Resources, 200�).
5.2 Adaptation Options Involving Water-Demand Management
Reducing the demand for water has been advocated as a way to reduce the vulnerability of managed water systems to climate change (Bates and others, 2008). Water-demand management is a strategy to make better use of water, reducing waste and increasing economic efficiency. However, water-demand management is largely a State and local responsibil-ity; the Federal role is constrained by Congressional authoriza-tion. Demand-side management balances water demands with limited available supplies by having a more efficient allocation of existing supplies. Water that is saved reduces the need for costly infrastructure.
One adaptation strategy is to enhance mechanisms for market-based transfers of water among uses. Climate change and shifting patterns of demand may increase market pres-sures that today are moving water from one use to another. Increased use of voluntary water leasing, water banks, and water markets can increase the opportunity for water rights holders to shift water among users. Transfers can either be permanent by purchasing water rights or temporary by having contracts to purchase water during dry years. Markets and higher prices provide an incentive to adopt water conservation, particularly during periods of limited supply and drought.
Another strategy is to reduce overall water consumption through conservation and efficiency improvements. Municipal
water utilities can encourage water conservation by individual metering and pricing. The agricultural sector can reduce water consumption by changing the selection of crops and irrigation methods and by adopting technological innovations such as drought-resistant plant varieties.
Most measures to reduce demand are implemented at the local level or by individual producers and households. The water-management agencies can continue to promote water-use efficiency in several sectors, as well in their own opera-tions and water delivery systems. The Federal Government can encourage water markets and water transfers by removing regulatory restrictions or by providing incentives. More effi-cient intergovernmental collaboration and coordination among Federal, State, regional, and local agencies will facilitate the flow of data and information and improve water resources planning. The Federal Government also has a lead role in research that produces technological advances that can reduce water use per capita.
As noted earlier, population growth in semiarid regions of the country has increased the demand for limited water sup-plies and has heightened vulnerability to drought. More popu-lation in flood plains and coastal areas has increased flood risk and has increased public demand for flood-risk-reduction measures. Land-use planning and zoning regulations can be used by State and local governments to limit development in vulnerable regions. The Federal Government can influence flood-plain requirements through the National Flood Insurance Program, but it generally has limited authority over land-use planning decisions.
5.3 Adaptation Options Involving Infrastructure Modifications
Management of existing, long-lived infrastructure includes up-to-date maintenance, rehabilitation, and upgrades to ensure flexibility to a wide range of potential climate variability. Much of the water resources infrastructure in the United States is aging and needs maintenance, rehabilitation, and repair (American Society of Civil Engineers, 200�). The infrastructure may not meet its design level of performance under the current climate and could be more vulnerable to failure under future climate scenarios. One important adapta-tion to a changing climate is to evaluate the potential risk to existing, long-lived infrastructure, such as dams and levees, caused by possible increases in the magnitude, frequency, and duration of large floods. Alternative strategies for meet-ing project goals may need to be evaluated and may result in modification to infrastructure.
One strategy to reduce the risk of an individual water supply is to create more diverse portfolios of water sup-ply. This approach could include new surface-water storage and (or) ground-water storage. Conjunctive management of surface and ground waters could help replenish ground-water supplies. Another source of freshwater supply is desalination. Desalination plants require both a large capital investment and
30 Climate Change and Water Resources Management: A Federal Perspective

large amounts of energy, but costs per unit of freshwater have been declining (National Research Council, 2008). Desalina-tion is an option for both seawater and brackish ground water. Other approaches to enhance water supplies include reusing high-quality water and treating sources of degraded water for use, and protecting the integrity of existing water supplies.
5.4 Challenges
There are several challenges in evaluating and imple-menting adaptation options. There is uncertainty about the hydrologic impacts of climate change. Resources are lim-ited and there are many competing requests for funding. For example, changes in reservoir operations and allocation can be time consuming and expensive. The process often requires an environmental impact statement (EIS), with public participa-tion by stakeholders who have different objectives.
There are also legislative and regulatory requirements that could limit adaptation options. For some Congressionally authorized projects, it may be necessary for Congress to pass legislation allowing changes in a project’s structure, authority, or purpose, including updates to operating plans. The Federal planning process requires that future benefits be discounted. Measures to adapt to climate change may provide benefits only in the distant future, so these future benefits may be con-sidered negligble in the current Federal planning process.
Agencies may also need to adopt a decisionmaking framework that encourages robust solutions that can be updated over time. The NRC (2004) made the following rec-ommendations that are relevant to Federal water agencies for adopting an adaptive management framework:
Post-construction evaluations should be a standard for the adaptive management of projects and systems.
Congress should provide a new study authority and direction that will increase the ability to monitor and evaluate post-construction changes and periodi-cally adjust operations of existing projects in order to increase overall project benefits.
Congress should allocate funding and personnel resources to help support and sustain an adaptive man-agement program within the water agencies.
•
•
•
The administration and Congress should consider revising cost-sharing formulas to promote the applica-tion of adaptive management principles.
Addressing these adaptation challenges is the focus of the next chapter.
5.5 Summary
Several water-management or system-development options might be considered to facilitate adaptive manage-ment in response to a changing climate, including operational changes, demand management, and infrastructure changes. Climate change may translate into changed design and opera-tional assumptions for determining resource supplies, system demands, system performance requirements, and operational constraints. Adaptations to climate change would make bet-ter use of existing water resources through integrated water resources management. Integrated water-management strate-gies include capturing social and individual risk perception, reshaping planning processes, coordinating land and water resources management, recognizing water-quantity and water-quality linkages, increasing conjunctive use of surface water and ground water, improving techniques to manage demand and conserve water, protecting and restoring natural systems, and learning through adaptive management experiments, including consideration of climate change.
Operating plans could build in flexibility to adapt to potential climate conditions. Management of existing, long-lived infrastructure includes up-to-date maintenance, rehabili-tation, and upgrades to ensure flexibility to a wide range of potential climate variability. Strategies for adaptation involve both water-supply and water-demand management. Most measures to reduce water demand are implemented at the local level or by individual producers and households. Local and State governments make decisions on land use that affect their community’s susceptibility to drought and floods. Therefore, effective adaptation to climate change will require collabora-tion and coordination among Federal, State, regional, and local agencies. The strategy options available for consideration will vary from system to system, as will the preference among these options.
•
5 Responding to Climate Change: Adaptation Options 31


6 Opportunities To Improve Planning Capabilities
This chapter addresses the following questions that agencies might consider as they strategize efforts to build adaptive capacity relative to the possibilities of future cli-mate change:
How might knowledge gaps be addressed in the near term through monitoring and research?
What can be done to improve planning and address state-of-practice gaps?
Where are there opportunities for interagency col-laboration and how can these interagency activities be leveraged to address knowledge gaps?
As discussed throughout this report, many uncertain-ties remain with respect to climate change and its potential impacts on water resources. This chapter identifies the major gaps that must be bridged to achieve success in addressing the effects of climate change. Additional research may narrow uncertainties, provide information in more useable forms, or develop more robust strategies for incorporating uncertainty into decisionmaking. However, additional research will not eliminate uncertainty entirely, and robust and flexible opera-tions and planning approaches can be used to help manage water resources effectively despite this uncertainty.
This chapter begins with a discussion of knowledge gaps and potential research priorities (section 6.1). The need for continued (and possibly expanded) monitoring is discussed in section 6.2. Section 6.3 recaps the need to develop methods to incorporate nonstationarity into planning and technical analyses. Section 6.4 describes other opportunities to advance planning, including possible changes to current methods for evaluating projects. Finally, section 6.� presents some advan-tages to increased collaboration and some examples of such ongoing activities.
6.1 Knowledge Gaps and Potential Research Priorities
Knowledge gaps and needs for additional research are identified throughout this report. Research needs and priori-ties will vary for different places and for different water-man-agement activities. For example, the research priorities and knowledge gaps recognized by coastal-resource managers in Florida will not likely match those recognized by surface-water managers in Washington State. For example, high-resolution digital elevation data such as Light Detection and Ranging (LiDAR) data exist for much of the coastline, but not for riverine floodplains. To this end, geographically focused discussions on research needs and priorities might be useful to help agencies steer and target efforts that would address regionally relevant knowledge gaps.
•
•
•
An example process involving a regionally focused gap assessment and scoping for interagency research coor-dination is the Climate Change and Western Water Group (C–CAWWG). This collaboration was formed during 2007–2008 by Reclamation’s Research and Development Office, NOAA’s Earth System Research Laboratory Physical Sci-ence Division (ESRL PSD) Climate Analysis Branch, and the USGS Central Region; the vision includes inviting involve-ment from other interested Federal and State agencies. On the matter of addressing regional knowledge gaps, C–CAWWG agencies convened a workshop in February 20–21, 200810 to discuss current capabilities for incorporating climate change into western U.S. water resources management and to dis-cuss potential research strategies and efforts to improve these capabilities. The workshop was attended by management and technical staff from the three convening C–CAWWG agencies and from other invited Federal agencies (USACE, U.S. Forest Service, U.S. Fish and Wildlife Service, and so forth).
The C–CAWWG workshop provides an example of a regionally focused discussion that generated insights on climate change planning issues, illuminated knowledge gaps, and revealed management input on which of these gaps might be prioritized. The gap topics and surveyed research priorities from the C–CAWWG workshop are listed in table 2. Such information is useful for senior management faced with deci-sions on how to allocate limited resources in order to improve their agency’s ability to plan for a changing climate.
Many of the gap topics listed in table 2 overlap with research questions raised in this report. For example, section 3.4 highlighted our need to be able to assess how regional precipita-tion extremes might respond to global climate change, which is similar to the C–CAWWG gaps 3.3 and 4.3 (table 2). Chapter 4 of this report discussed various issues associated with making decisions under uncertainty, which relates to gap 7.1.
In summary, table 2 offers a mix of prioritized gaps focused on one region (western United States) and generally one resource sector (mostly surface-water management). How-ever, many of the prioritized gaps address themes common to multiple-resource management issues, and they were broadly identified by a mix of interagency workshop attendees, sug-gesting that some of these gaps might be granted priority attention at the broader national level, including:
Developing region- and sector-specific literature sum-maries on the state of regional climate change science, observed trends, and projected impacts to the sector resources (for example, coastal resources in the Gulf
10See http://www.esrl.noaa.gov/psd/workshops/mwwcc/index.html.
•
6 Opportunities To Improve Planning Capabilities 33
Key Point 12: Research and monitoring are both needed to fill knowledge gaps and set up advances in planning capabilities. Although neither will eliminate all uncertainties, they will provide significant improvements in understanding the effects of climate change on water resources, including quantity and quality, and in evaluating associated uncertainties and risks required for more informed decisionmaking.

Table 2. Knowledge gaps discussed and prioritized at a geographically focused forum on Climate Change and Western Water Management1.
Knowledge gaps discussed, C-CAWWG, February 200� Location in this report2
1. Access to Literature Syntheses1.1 Clearinghouse on scientific literature relating climate change to water resources planning1.2 Region-specific literature summaries
2. Access to Climate Projection Data2.1 Downscaled data at finer spatial resolutions, for different variables Sec. 3.1.3; appendix B2.2 Downscaled data that isn’t based on “stationarity” Sec. 3.1.3 and 3.4
3. Ability to Translate Climate Projection Data into Planning Scenarios3.1 Basis for weighting climate projections Sec. 4.2 and 4.33.2 Ability to jointly consider paleoclimate, near-term climate variability, and projected climate information3.3 Assess extreme meteorological possibilities under climate change Sec. 3.2 and 3.4
4. Ability to Assess Natural Systems Response to Climate Change4.1 Assess impact on groundwater and its interaction with surface water Sec. 2.1 and 2.34.2 Assess impact on land cover and ecosystems Sec. 2.1 and 2.34.3 Assess extreme hydrologic possibilities relate to flood risk associated with structural safety, flood control rule
requirements at reservoirs, and so onSec. 2.2, 3.2, 3.4
4.4 Understand implications of hydrologic model choice for runoff impacts assessments5. Ability to Assess Social Systems Response to Climate Change
5.1 Anticipate social responses that constrain reservoir management (for example, surface water demands at the district level, flood protection values and expected service, environmental protection values and expected ser-vice)
5.2 Assess water use requirements for different crops under joint climate and atmospheric carbon dioxide changes6. Practices for Assessing Operations and Dependent Resources Response
6.1 Conduct policy search studies (optimization, perfect foresight)6.2 Ability to assess operations impacts based on realistic operator learning under climate change (for example,
by striking a balance between the reactive operator depiction featured in traditional scenario analyses and the perfect foresight aspects of the “policy search” analyses)
6.3 Assess operations impacts on climate7. Ability to Assess, Characterize and Communicate Uncertainties
7.1 Assess and characterize uncertaintes for each analytical stage (for example, climate projections, downscaling methods, natural and social system response analyses, operations analysis)
Sec. 4.3
7.2 Assess interrelation of uncertainties across analytical stages7.3 Ability to effectively communicate uncertainties and their relation to Reclamation planning processes
1Darker shading indicates greater priority, as assessed by a survey of the water managers at the forum.2If discussed in report.
Note: Workshop information is available at http://www.esrl.noaa.gov/psd/workshops/mwwcc/index.html.
Coast region and ground-water resources in the Great Plains).
Developing downscaled climate-projection informa-tion at finer spatial-temporal resolutions than what is already available (for example, submonthly and less than 1/8 degree resolution), for more variables (for example, diurnal temperature range, cloudiness, and solar radiation), and using methods that do not rely on “stationarity” between the relation of large-scale atmo-spheric circulation and local land-surface climate.
Improving our ability to assess the potential response of regional precipitation and hydrologic extremes to global climate change.
Improving our ability to assess and anticipate region-spe-cific impacts of climate change on land cover and ecosys-tems and potentially land-cover feedbacks on climate.
Improving our understanding of how social systems mediate climate change impacts and establish expecta-tions for water resource system performance and reli-ability, which would presumably need to be preserved under a changing climate.
Improving our ability to assess, characterize, and com-municate uncertainties as they are introduced at each analytical stage during the process of relating climate change information to water resources management implications.
•
•
•
•
•
34 Climate Change and Water Resources Management: A Federal Perspective

6.2 Gaps in Existing Hydrologic and Meteorologic Data Networks
Successful water-supply planning and water resources management require an accurate understanding of how much water is available under different hydrologic conditions, what the quality of that water is, and how both availability and quality are likely to change over time. Long-term earth science (hydrological, biological, geological, and so forth) monitor-ing networks are a fundamental tool for any water resources planning and management and are paramount in addressing climate change impacts. It is essential that data on compo-nents of the natural hydrologic system, such as precipitation, snowpack, streamflow, ground water, and water quality, be collected and developed through sustained long-term networks to understand long-term trends. It is also essential that rational standards for data collection be employed so that datasets maintain consistency and relevancy.
The USGS and other Department of the Interior agen-cies have suggested a framework for monitoring based on the Framework for Environmental Monitoring and Related Research strategy (Committee on Environmental and Natural Resources, 1997). This framework suggests a tiered approach to monitoring, starting with general inventories using remote sensing and progressing through several levels to intensive studies at select locations. Whether or not such an approach is employed, it will be important to determine if current net-works are sufficient for monitoring relevant changes at the range of scales needed or if gaps need to be filled with new monitoring efforts.
Currently, most long-term continuous earth-science data-collection networks are largely maintained and operated by Federal agencies such as the USGS, the NOAA National Weather Service, Reclamation, and the USACE. In recent decades, maintenance of these networks has declined because of lack of funding. The USGS alone has deactivated or dis-continued almost 1,700 surface-water streamgages in the U.S. Many other stream and river sites have never been monitored but could help increase our understanding of the myriad of issues facing the Nation’s water resources managers because of changes to the environment and to climate. To adequately address the effects of water-resources planning, design, and operation, a comprehensive network for earth-science data-collection is needed that is timely, accurate, consistent, and relevant.
6.3 Understanding and Incorporating Nonstationarity Concepts
Nonstationarity presents many challenges to the Nation’s water resource managers. The assumption of stationarity has been used throughout the development of infrastructure for managing water resources.
Under the Stationary System paradigm, which has tra-ditionally been employed in long-range planning (introduced
in section 3.4), planning scenarios are based on stationary climate conditions. The System Projection paradigm (intro-duced in section 3.4), which allows conditions to evolve over time, is a potentially more useful and appropriate option for long-range planning for a changing climate. However, for water-planning entities that currently use a Stationary Sys-tem paradigm to portray system possibilities, a transition to a System Projection paradigm may introduce technical and educational challenges.
Many other types of analyses are also integrally linked to stationary concepts (for example, hydrologic statistics such as flood frequency, low-flow frequency, and flow duration, and design criteria). Widely accepted methods for incorporat-ing nonstationarity do not yet exist. While research proceeds, efforts can be made to bring analyses up to date, so that they use the most recently available data.
Hydrologic frequency analysis is used to estimate the frequency and severity of floods and droughts and is used here as an example of a traditional analysis in need of updating. Research aimed at properly incorporating the likely effects of climate change on floods and low flows is crucial to prudent water-management decisions. This research might also address questions about the risks of assuming stationarity in water resources planning and management. The hydrologic com-munity continues to have substantial uncertainty about the magnitude of these future changes, and only limited research has been published that addresses incorporating nonstationar-ity into frequency analyses.
The consideration of climate change may make it more important that frequency analyses be updated to represent the most applicable data and methods. The USGS slowly con-tinues to improve and update flood-frequency and regional-regression analyses that expand frequency estimates to ungaged areas (fig. 10).
Figure 10 indicates there are 10 States whose flood-frequency regional-regression analysis is close to or greater than 1� years old. For example, although work is underway
1974-1985
1991-1995
1996-2000
1986-1990
2001-2007
Years Equations Published
Regional-regression equationsmay not be representative of
the entire State.
WA
IDMT MNND
ORWI NY
MISDWY
CA
PAIAUT
NE OHIL INCO WV MDVAMOKS KYAZ
NCNM
TNOK
TX
AR SCGAALMS
LAFL
AK
*NV
HI-AS
VTNH
ME
MACT RI
NJDE
PR-VI
Figure 10. Age map indicating when the last regional-regression analysis for rural peak flows was published by the U.S. Geological Survey.
6 Opportunities To Improve Planning Capabilities 35
to update the analysis, the most recently published analysis of flood frequency for California is greater than 20 years old. Flood insurance rate maps use these estimates to delineate Special Flood Hazard Areas for the National Flood Insurance Program. It is important that flood-frequency estimates be up to date so the public and planners have as accurate an assess-ment of their flood risk as possible. Active analysis of existing flood records, and critical evaluation of climate research, will require increased investment by the hydrologic science and engineering community (Federal, State, and local government; academia; and the private sector).
6.4 Opportunities To Improve Planning
Planning analysis involves economic as well as technical evaluation of potential projects. The discount rate used in the economic analysis of projects affects the valuation of benefits and costs that will be accrued in the future. As such, the choice of discount rate can affect decisionmaking. As discussed in chapter 4, the development of robust plans and adaptive man-agement are means of coping with increased uncertainty about the future.
Federal guidelines have generally favored plans based on economic optimization for expected conditions rather than plans that are robust for a range of uncertain conditions. An adaptive management approach may require changes in how projects are funded, since funding would need to be provided for monitoring conditions and updating plans over time.
Changes in the discount rate and guidelines for making economic decisions would require broad agreement among the entities of the executive branch. The Office of Manage-ment and Budget (OMB), the Office of Science and Technol-ogy Policy (OSTP), the Office of Information and Regulatory Affairs (OIRA), the Council on Environmental Quality (CEQ), and the Council of Economics Advisors (CEA) are groups that may have an interest in these changes and would need to concur on new approaches. An adaptive management approach that requires funding for monitoring conditions and making changes over time may be viewed favorably by OMB if it means less investment in the initial years of a project.
6.5 Opportunities for Further Collaboration
Gaps in climate change research abound. Collaborative interagency research that pools common resources is needed to further develop existing models that address climate change and spur new thought to create new methods and models. Increased climate monitoring is needed to track changes and to help develop and calibrate the models. Collaboration in these monitoring efforts can help to ensure that data-collec-tion procedures are consistent and that quality assurance is uniformly applied. Collaborative efforts can also improve the communication of climate change science to water managers and the public if a more consistent message is framed. Several examples of collaborative efforts follow.
The USACE has formed an interagency group on coastal climate change issues. This group consists of the USACE, USGS, NOAA, and the Federal Emergency Management Agency (FEMA). An initial task is to update the USACE guid-ance on sea-level change.
A Federal Climate Change/Water Work Group was formed that is composed of the Department of the Interior (USGS and Reclamation), Department of Agriculture (Forest Service and Natural Resources Conservation Service), NOAA, U.S. Environmental Protection Agency (EPA), and USACE. A memorandum was signed by principals of these departments that authorizes senior staff from the agencies to cooperate in work to adapt water program management to reflect changing climatic conditions.
As already mentioned in section 6.1, Reclamation’s Research and Development Office, NOAA’s ESRL PSD Climate Analysis Branch, and the USGS Central Region have convened the Climate Change and Western Water Group (C–CAWWG). This workgroup recognizes that western U.S. water supply and use is at the nexus of many Federal, State, and local agencies. Understanding climate variability and climate change trends, determining their current and potential future influence on water supply and water use, and identi-fying potential adaptation strategies are common emerging priorities across these entities. Collaboration between these entities is essential to ensure efficiency and full utilization of interdisciplinary expertise and to avoid duplication. To that end, C–CAWWG serves as an interagency workgroup meant to ensure efficient research and development (R&D) collabo-rations and information sharing across the Federal agencies, and to promote improved understanding of climate change impacts on western water supplies and water use. The vision of C–CAWWG is to eventually benefit Federal, State, and local water managers and, through time, incorporate their feedback to guide future research planning.
A Western States Federal Agency Support Team (West-FAST) has been created to facilitate collaboration with the Western States Water Council (WSWC). The initial participat-ing Federal agencies in the WestFAST include USGS, EPA, U.S. Forest Service, Reclamation, NRCS, USFWS, Bureau of Land Management, NOAA, Reclamation, and USACE. In addition, a WSWC Federal Liaison Officer position has been created, with the salary and expenses being funded by several Federal agencies.
Besides these examples, there are other intergovern-mental entities that could serve as vehicles to address these collaboration needs. Examples include the Interstate Council on Water Policy (ICWP), the Advisory Committee on Water Information (ACWI), and the Intergovernmental Flood Risk Management Committee (IFRMC).
There are also government programs that are designed to incorporate stakeholder input. For example, the NOAA Regional Integrated Sciences and Assessments (RISA) pro-gram supports research that addresses complex climate-sensi-tive issues of concern to decisionmakers and policy planners at a regional level. RISA teams comprise researchers from the
36 Climate Change and Water Resources Management: A Federal Perspective
physical, natural, engineering, and social sciences who work with stakeholders in a region to determine how climate impacts key resources and how climate information can best be commu-nicated to decisionmakers. These research-stakeholder efforts are critical in addressing a range of issues sensitive to climate and in need of socioeconomic impacts and public policy analy-sis. RISAs are focusing on issues of particular importance to the regions they cover, including agriculture and ranching, coastal impacts, drought, fisheries, forestry, human health, snowpack, transportation, water resource management, and wildfire.
6.6 Summary
There are significant gaps in knowledge, monitoring, and practice that limit incorporation of climate change consider-
ations into water resources planning and management. Climate change must be quantified with respect to the myriad of other natural and cultural issues that face the Nation’s water manag-ers. Sound water management is built on sound, accurate, timely, and long-term hydrological and meteorological moni-toring networks that are consistent and that can be used readily to assess and provide decisionmaking tools needed to quan-tify uncertainty, forecast change, and create the multiphase, multilevel climate scenarios that will provide reasonable and relevant management. Changes to planning and analysis that better accommodate nonstationarity will improve water man-agement. Collaboration in all these activities may allow more rapid results and improved communication both within the water resources community and to other stakeholders.
6 Opportunities To Improve Planning Capabilities 3�


� References Cited
Alcamo, Joseph, and Bennett, E.M., 2003, Ecosystems and human well-being—A framework for assessment: Washing-ton, D.C., Island Press, 24� p.
American Society of Civil Engineers, 200�, Report card for America’s infrastructure, available online at at http://www.asce.org/reportcard/2005/index.cfm.
Arctic Climate Impact Assessment (ACIA), 2004, Impacts of a warming Arctic: Arctic climate impact assessment: New York, Cambridge University Press. (Also available online at http://www.acia.uaf.edu.)
Arctic Climate Impact Assessment (ACIA), 200�, Arctic cli-mate impact assessment: New York, Cambridge University Press. (Also available online at http://www.acia.uaf.edu/.)
Baker, V., 2008, Paleoflood hydrology—Origin, progress, prospects: Geomorphology, v. 101, no. 1–2, p. 1–13.
Baker, V.R., Webb, R.W., and House, P.K., 2002, The scien-tific and societal value of paleoflood hydrology, in House, P.K., Webb, R.H., Baker, V.R., and Levish, D.R., eds., Ancient floods, modern hazards—Principles and applica-tions of paleoflood hydrology: Water Science and Applica-tion, American Geophysical Union, v. �, p. 1–19.
Bates, B.C., Kundzewicz, Z.W., Wu, S., and Palutikof, J.P., eds., 2008, Climate change and water: Technical Paper of the Intergovernmental Panel on Climate Change, IPCC Secretariat, Geneva, Switzerland.
Bindoff, N.L., Willebrand, J., Artale, V., Cazenave, A., Gregory, J., Gulev, S., Hanawa, K., Le Quéré, C., Levitus, S., Nojiri, Y., Shum, C.K., Talley, L.D., and Unnikrishnan, A., 2007, Observations— Oceanic climate change and sea level, in Solomon, S., Qin, D., Manning, M., Chen, Z., Marquis, M., Averyt, K.B., Tignor, M., and Miller, H.L., eds., Climate change 2007—The physical science basis: Contribution of Working Group I to the Fourth Assess-ment Report of the Intergovernmental Panel on Climate Change: New York, Cambridge University Press. (Also available online at http://ipcc-wg1.ucar.edu/wg1/Report/AR4WG1_Print_Ch05.pdf.)
Brekke, L.D., Dettinger, M.D., Maurer, E.P., and Ander-son, M., 2008, Significance of model credibility in estimating climate projection distributions for regional hydroclimatological risk assessments: Climatic Change, v. 89, nos. 3–4, p. 371–394. (Also available online at http://www.springerlink.com/content/1586u015g87v8754/.)
Bureau of Reclamation, 2007, Analysis of hydrologic variabil-ity sensitivity, Appendix N in Final EIS—Colorado River interim guidelines for lower basin shortages and coordi-nated operations for Lake Powell and Lake Mead: Bureau of Reclamation, U.S. Department of the Interior.
Bureau of Reclamation, 2008, Sensitivity of future CVP/SWP operations to potential climate change and associated sea level rise, Appendix R in CVP/SWP OCAP Biological Assessment: Bureau of Reclamation, U.S. Department of the Interior.
Caldwell, H., Quinn, K.A., Meunier, J., Suhrbier, J. and Grenzeback, L., 2002, Impacts of global climate change on freight, Proceedings, Federal Research Partnership Work-shop, The potential impacts of climate change on transporta-tion, U.S. Department of Transportation Center for Climate Change and Environmental Forecasting, p. 3–32.
California Department of Water Resources, 200�, California water plan update 200�, v. 2, chap. 4 of Conjunctive man-agement and ground-water storage: California Department of Water Resources Bulletin 160–0�.
California Energy Commission, 200�, Potential changes in hydropower production from global climate change in California and the western United States: California Energy Commission Report CEC–700–200�–010, avail-able online at http://www.energy.ca.gov/2005publications/CEC-700-2005-010/CEC-700-2005-010.PDF.
Cayan, D.R., Bromirski, P.D., Hayhoe, K., Tyree, M., Det-tinger, M.D., and Flick, R.E., 2008. Climate change projections of sea level extremes along the California coast: Climatic Change v. 87, suppl. 1, p. S�7–S73.
Climate Change Science Program, 2008a, The effects of climate change on agriculture, land resources, water resources, and biodiversity: Washington, D.C., U.S. Environmental Protec-tion Agency, U.S. Climate Change Science Program and Subcommittee on Global Change Research Report SAP 4.3.
Climate Change Science Program, 2008b, Our changing planet—The U.S. Climate Change Science Program for fiscal year 2008: Climate Change Science Program and Subcommittee on Global Change Research.
Climate Change Science Program, 2008c, Decision-support experiments and evaluations using seasonal to interan-nual forecasts and observational data—A focus on water resources. U.S. Climate Change Science Program and Sub-committee on Global Change Research Report SAP �.3.
Climate Change Science Program, 2008d, Uses and limita-tions of observations, data, forecasts, and other projections in decision support for selected sectors and regions. U.S. Climate Change Science Program and Subcommittee on Global Change Research Report SAP �.1.
Climate Change Science Program, 2008e, Abrupt climate change. U.S. Climate Change Science Program and Sub-committee on Global Change Research Report SAP 3.4.
Cohn, T.A., and Lins, H.F., 200�, Nature’s style: Naturally trendy: Geophysical Research Letters, v. 32, p. L23402.
� References Cited 3�

40 Climate Change and Water Resources Management: A Federal Perspective
Collins, W.D., and others, 2006, The Community Cli-mate System Model: CCSM3: Journal of Climate, v. 19, p. 2,122–2,143.
Colorado Water Conservation Board [CWCB], 2008, Colo-rado climate change: A synthesis to support water resource management and adaptation. NOAA Western Water Assess-ment and University of Colorado at Boulder, available online at http://cwcb.state.co.us/Home/ClimateChange/ClimateChangeCOReport.htm.
Committee on Environment and Natural Resource, 1997, Inte-grating the Nation’s environmental monitoring and research networks and programs: a proposed framework: Office of Science and Technology Policy, National Science and Tech-nology Council. 117 p.
Costa, J.E., 1987, A history of paleoflood hydrology in the United States, 1800–1970, in History of hydrology, Landa, E.R., and Ince, S., eds., History of Geophysics, v. 3, p. 49–�4.
Covey, C., AchutaRao, K.M., Cubasch, U., Jones, P.D., Lam-bert, S.J., Mann, M.E., Phillips, T.J., and Taylor, K.E., 2003, An overview of results from the Coupled Model Inter-comparison Project: Global and Planetary Change, v. 769, p. 1–31.
Cunderlik, J.M., and Burn, D.H., 2003, Non-stationary pooled flood frequency analysis: Journal of Hydrology, v. 276, p. 210–223.
Cunderlik, J.M., and Ouarda, T.B.M.J., 2006, Regional flood-duration-frequency modeling in the changing environment: Journal of Hydrology, v. 318, p. 276–291.
Cunningham, W.L., Geiger, L.H., and Karavitis, G.A., 2007, U.S. Geological Survey Ground-Water Cli-mate Response Network: U.S. Geological Survey Fact Sheet 2007–3003. (Also available online at http://pubs.usgs.gov/fs/2007/3003/.)
Davis, A.J., Lawton, J.H., Shorrocks, B., and Jenkinson, L.S., 1998, Individualistic species responses invalidate simple physi-ological models of community dynamics under global environ-mental change: Journal of Animal Ecology, v. 67, p. 600–612.
Delworth, T., and others, 2006, GFDL’s CM2 global coupled climate models—Part 1. Formulation and simulation char-acteristics: Journal of Climate, v. 19, p. 643–674.
DeNeufville, R., 2000, Dynamic strategic planning for tech-nology policy: International Journal of Technology Manage-ment, v. 19, nos. 3–�, p. 22�–24�.
Dettinger, M.D., 200�a, Changes in streamflow timing in the western United States in recent decades: U.S. Geological Survey Fact Sheet 200�–3018. (Also available online at http://pubs.usgs.gov/fs/2005/3018/.)
Dettinger, M.D., 200�b, From climate change spaghetti to climate change distributions for 21st century: San Francisco Estuary Watershed Science, v. 3, no. 1, p. 1–14.
Dewar, J.A., and Wachs, M., 2006, Transportation planning, climate change, and decisionmaking under uncertainty: Com-missioned paper for Committee on Climate Change and U.S. Department of Transportation, Transportation Research Board.
Dietz, M.E., 2007, Low impact development practices: A Review of Current Research and Recommendations for Future Directions, Water, Air, and Soil Pollution, v. 186, no. 1–4, p. 3�1–363.
Domingues, C.M., Church, J.A., White, N.J., Gleckler, P.J., Wijffels, S.E., Barker, P.M., and Dunn, J.R., 2008, Improved estimates of upper-ocean warming and multi-decadal sea-level rise: Nature, v. 4�3, no. 19, p. 1,090–1,093. Supple-mentary information available online at http://www.nature.com/nature/journal/v453/n7198/abs/nature07080.html.
Douglas, E.M., Vogel, R.M., and Kroll, C.N., 2000, Trends in floods and low flows in the United States—Impact of spa-tial correlation: Journal of Hydrology, v. 240, p. 90–10�.
El Adlouni, S., Ouarda, T.B.M.J., Zhang, X., Roy, R., and Bobee, B., 2007, Generalized maximum likelihood estima-tors for the nonstationary generalized extreme value model: Water Resources Research, v. 43, W03410.
Emanuel, K., Sundararajan, R., and Williams, J., 2007, Hur-ricanes and global warming: Bulletin of the American Meteorological Society, v. 89, no. 3, p. 347–367.
Fiering, M., and Kindler, J., 1987, Surprise in water resources design: International Journal of Water Resources Develop-ment, v. 2, no. 4, p. 1–10.
Fountain, A.G., and Tangborn, W.V., 198�, The effects of gla-ciers on streamflow variations: Water Resources Research, v. 21, p. �79–�86.
Frederick, K.D., Major, D.C., and Stakhiv, E.Z., 1997, Water resources planning principles and evaluation criteria for cli-mate change—Summary and conclusions: Climatic Change, v. 37, p. 291–313.
Galloway, D.L., Alley, W.M., Barlow, P.M., Reilly, T.E., and Tucci, P., 2003, Evolving issues and practices in managing ground-water resources—Case studies on the role of sci-ence: U.S. Geological Survey Circular 1247, 83 p., avail-able online at http://pubs.usgs.gov/circ/2003/circ1247/.
Gnanadesikan, A., and others, 2006, GFDL’s CM2 global coupled climate models—Part 2. The baseline ocean simu-lation: Journal of Climate, v. 19, p. 67�–697.
Great Lakes Water Quality Board, 2003, Climate change and water quality in the Great Lakes Basin: Report of the Great Lakes Water Quality Board to the International Joint
Commission, available online at http://www.ijc.org/php/publications/html/climate/index.html.
Groves, D.G., and Lempert, R.J., 2007, A new analytic method for finding policy-relevant scenarios: Global Environmental Change, v. 17, p. 73–8�.
Groves, D.G., Knopman, D., Lempert, R.J., and Berry, S.H., 2008, Presenting uncertainty about climate change to water-resource managers: Santa Monica, CA, RAND Corporation.
Hamlet, A.F., Huppert, D., and Lettenmaier, D.P., 2002, Eco-nomic value of long-lead streamflow forecasts for Columbia River hydropower: American Society of Civil Engineers Journal of Water Resources Planning and Management, v. 128, no. 2, p. 91–101.
Hannah, L., Midgley, G.F., Lovejoy, T., Bond, W.J., Bush, M., Lovett, J.C., Scott, D., and Woodward, F.I., 2002, Conser-vation of biodiversity in a changing climate: Conservation Biology, v. 16, no. 1, p. 264–268.
Hodgkins, G.A., and Dudley, R.W., 2006a, Changes in the tim-ing of winter-spring streamflows in eastern North America, 1913–2002: Geophysical Research Letters, v. 33.
Hodgkins, G.A., and Dudley, R.W., 2006b, Changes in late-win-ter snowpack depth, water equivalent, and density in Maine, 1926–2004: Hydrological Processes, v. 20, p. 741–7�1.
Hodgkins, G.A., Dudley, R.W., and Aichele, S.S., 2007, His-torical changes in precipitation and streamflow in the U.S. Great Lakes Basin, 191�–2004: U.S. Geological Survey Scientific Investigations Report 2007–�118, 31 p. (Also available online at http://pubs.usgs.gov/sir/2007/5118.)
Hodgkins, G.A., Dudley, R.W., and Huntington, T.G., 2003, Changes in the timing of high river flows in New Eng-land over the 20th century. Journal of Hydrology, v. 278, p. 242–2�0.
Hooper, R.P., Goolsby, D.A., Rickers, D.A., and McKen-zie, S.W., 1997, NASQAN—A program to monitor the water quality of the nation’s large rivers: U.S. Geological Survey Fact Sheet 0��–97, 6 p. (Also available online at http://pubs.er.usgs.gov/usgs/pubs/fs/fs05597.)
Hutson, S.S., Barber, N.L., Kenny, J.F., Linsey, K.S., Lumia, D.S., and Maupin, M.A., 2004, Estimated use of water in the United States in 2000: U.S. Geologi-cal Survey Circular 1268, 46 p. (Also available online at http://pubs.usgs.gov/circ/2004/circ1268/.)
Ibanez, I., Clark, J.S., Dietze, M.C., Feeley, K., Hersh, M., LaDeau, S., McBride, A., Welch, N.E., and Wolosin, M.S., 2006, Predicting biodiversity change—Outside the climate envelope, beyond the species-area curve: Ecology, v. 87, no. 8, p. 1,896–1,906.
Interagency Committee on Water Data [IACWD], 1982, Guidelines for determining flood flow frequency: U.S. Geo-
logical Survey, Office of Water Data Coordination, Hydrol-ogy Subcommittee, Bulletin 17B (revised and corrected).
International Joint Commission [IJC], 2006, Options for man-aging Lake Ontario and St. Lawrence River water levels and flows: Report to the International Joint Commission, prepared by the International Lake Ontario—St. Lawrence River Study Board.
Intergovernmental Panel on Climate Change, 1996, Climate change 199�—Economic and social dimensions of climate change—Contribution of Working Group III to the Sec-ond Assessment Report of the Intergovernmental Panel on Climate Change: Cambridge, United Kingdom, Cambridge University Press.
Intergovernmental Panel on Climate Change, 2000, Spe-cial report on emissions scenarios, Nakicenovic, N., and Swart, R., eds.: Cambridge, United Kingdom, Cambridge University Press. (Also available online at http://www.grida.no/climate/ipcc/emission/.)
Intergovernmental Panel on Climate Change, 200�, Guid-ance notes for lead authors of the IPCC fourth assessment report on addressing uncertainties: Cambridge, United Kingdom, Cambridge University Press, available online at http://www.ipcc.ch/pdf/assessment-report/ar4/wg1/ar4-uncertaintyguidancenote.pdf.
Intergovernmental Panel on Climate Change, 2007a, Climate change 2007—The physical science basis, in Solomon, S., Qin, D., Manning, M., Chen, Z., Marquis, M., Averyt, K.B., Tignor, M., and Miller, H.L., eds., Contribution of Working Group I to the Fourth Assessment Report of the Intergov-ernmental Panel on Climate Change: Cambridge, United Kingdom, Cambridge University Press. (Also available online at http://www.ipcc.ch/ipccreports/ar4-wg1.htm.)
Intergovernmental Panel on Climate Change, 2007b, Climate change 2007—Impacts, adaptation and vulnerability, in Parry, M.L., Canziani, O.F., Palutikof, J.P., van der Linden, P.J., and Hanson, C.E., eds., Contribution of Working Group II to the Fourth Assessment Report of the Intergovernmental Panel on Climate Change: Cambridge, United Kingdom, Cambridge University Press. (Also available online at http://www.ipcc.ch/ipccreports/ar4-wg2.htm.)
Intergovernmental Panel on Climate Change, 2007c, Sum-mary for policymakers, of Climate change 2007—The physical science basis, in Solomon, S., Qin, D., Manning, M., Chen, Z., Marquis, M., Averyt, K.B., Tignor, M., and Miller, H.L., eds., Contribution of Working Group I to the Fourth Assessment Report of the Intergovernmental Panel on Climate Change: Cambridge, United Kingdom, Cambridge University Press. (Also available online at http://www.ipcc.ch/ipccreports/ar4-wg1.htm.)
Intergovernmental Panel on Climate Change, 2007d, Sum-mary for Policymakers, of Climate Change 2007—Impacts,
� References Cited 41

adaptation and vulnerability, in M.L. Parry, O.F. Canziani, J.P. Palutikof, P.J. van der Linden and C.E. Hanson, eds., Contribution of Working Group II to the Fourth Assessment Report of the Intergovernmental Panel on Climate Change: Cambridge, United Kingdom, Cambridge University Press. (Also available online at http://www.ipcc.ch/ipccreports/ar4-wg2.htm.)
Intergovernmental Panel on Climate Change, 2008, Cli-mate Change and Water: Intergovernmental Panel on Climate Change, 28th Session, April 9–10, 2008, Budapest, Hungary, 244 p. (Also available online at http://www.ipcc.ch/meetings/session28/doc13.pdf.)
Jarrett, R.D., and England, Jr., J.F., 2002, Reliability of paleo-stage indicators for paleoflood studies, modern hazards—Principles and applications of paleoflood hydrology, House, P.K., Webb, R.H., Baker, V.R., and Levish, D.R., eds.: American Geophysical Union, Water Science and Applica-tion, v. �, p. 91–109.
Jones, K.F., Fridell, J.E., Daly, S.F., and Vuyovich, C.M., 2004, Severe winter weather in the continental U.S. and global climate cycles: Hanover, N.H., U.S. Army Corps of Engineers, Engineer Research and Development Cen-ter, Cold Regions Research and Engineering Laboratory, ERDC/CRREL TR–04–19.
Karner, O., 2002, On nonstationarity and antipersistency in global temperature series: Journal of Geophysical Research, v. 107, no. D20, p. 4,41�.
Kirshen, P., Knee, K., and Ruth, M., 2008, Climate change and coastal flooding in Metro Boston—Impacts and adaptation strategies: Climatic Change, v. 90, p. 4�3–473.
Knowles, N., Dettinger, M., and Cayan, D., 2006, Trends in snowfall versus rainfall for the western United States: Jour-nal of Climate, v. 19, no. 18, p. 4,�4�–4,��9.
Knutson, T.R., Sirutis, J.J., Garner, S.T., Vecchi, G.A., and Held, I.M., 2008, Simulated reduction in Atlantic hurricane frequency under twenty-first-century warming conditions: Nature Geoscience, v. 1, p. 3�9–364.
Knutson, T.R., and Tuleya, R.E., 2004, Impact of CO2-induced warming on simulated hurricane intensity and precipita-tion—Sensitivity to the choice of climate model and con-vective parameterization: Journal of Climate, v. 17, no. 18, p. 3,477–3,49�.
Kundzewicz, Z.W., Graczyk, D., Maurer, T., Pinskwar, I., Radziejewski, M., Svensson, C., and Szwed, M., 200�, Trend detection in river flow series—1. Annual maxi-mum flow: Hydrological Sciences Journal, v. �0, no. �, p. 797–810.
Lall, U., and Sharma, A., 1996, A nearest neighbor bootstrap for resampling hydrologic time series: Water Resources Research, v. 32, no. 3, p. 679–693.
Leclerc, M., and Ouarda, T.B.M.J., 2007, Non-stationary regional flood frequency analysis at ungaged sites: Journal of Hydrology, v. 343, p. 2�4–26�.
Lemke, P., Ren, J., Alley, R.B., Allison, I., Carrasco, J., Flato, G., Fujii, Y., Kaser, G., Mote, P., Thomas, R.H., and Zhang, T., 2007, Observations—Changes in snow, ice and frozen ground, of Climate change 2007—The physical science basis, in Solomon, S., Qin, D., Manning, M., Chen, Z., Marquis, M., Averyt, K.B., Tignor, M., and Miller, H.L., eds., Contribution of Working Group I to the Fourth Assessment Report of the Intergovernmental Panel on Climate Change: Cambridge, United Kingdom, Cambridge University Press. (Also avail-able online at http://www.ipcc.ch/ipccreports/ar4-wg1.htm.)
Lempert, R.J., Popper, S.W., and Bankes, S.C., 2003, Shaping the next one hundred years—New methods for quantita-tive long-term policy analysis: Santa Monica, Calif., Rand Corporation.
Lettenmaier, D.P., Wood, A.W., Palmer, R.N., Wood, E.F., and Stakhiv, E.Z., 1999, Water resources implications of global warming—A U.S. regional perspective: Climatic Change, v. 43, p. �37–�79.
Lins, H.F., and Slack, J.R., 1999, Streamflow trends in the United States: Geophysical Research Letters, v. 26, p. 227–230.
Matalas, N., 1997, Stochastic hydrology in the context of climate change: Climatic Change, v. 37.
McCabe, G.J., and Wolock, D.M., 2002, A step increase in streamflow in the conterminous United States: Geophysical Research Letters, v. 29, no. 4, p. 218�.
Meehl, G.A., Boer, G.J., Covey, C., Latif, M., and Stouffer, R.J., 2000, The Coupled Model Intercomparison Project [CMIP]: Bulletin of the American Meteorological Society, v. 81, no. 2, p. 313–318.
Meehl, G.A., Stocker, T.F., Collins, W.D., Friedlingstein, P., Gaye, A.T., Gregory, J.M., Kitoh, A., Knutti, R., Murphy, J.M., Noda, A., Raper, S.C.B., Watterson, I.G., Weaver, A.J., and Zhao, Z.-C., 2007, Global climate projections, in Climate change 2007—The physical science basis, of Solomon, S., Qin, D., Manning, M., Chen, Z., Marquis, M., Averyt, K.B., Tignor, M., and Miller, H.L., eds., Contribution of Working Group I to the Fourth Assessment Report of the Intergovern-mental Panel on Climate Change: Cambridge, United King-dom, Cambridge University Press. (Also available online at http://www.ipcc.ch/ipccreports/ar4-wg1.htm.)
Miller, K., and Yates, D., 2006, Climate change and water resources—A primer for municipal water providers: Denver, Colo., American Water Works Association, 83 p.
Milly, P.C.D., Bettencourt, J., Falkenmark, M., Hirsch, R.M., Kundezewicz, Z.W., Lettenmaier, D.P., and Stouffer, R.J.,
42 Climate Change and Water Resources Management: A Federal Perspective

2008, Stationarity is dead—Whither water management?: Science, v. 319, p. �73–�74.
Milly, P.C.D., Dunne, K.A., and Vecchia, A.V., 200�, Global pattern of trends in streamflow and water availability in a changing climate: Nature, v. 438, p. 347–3�0.
Milly, P.C.D., Wetherald, R.T., Dunne, K.A., and Delworth, T.L., 2002, Increasing risk of great floods in a changing climate: Nature, v. 41�, p. �14–�17.
Moench, M., Dixit, A., Janakarajan, S., Rathore, M.S., and Mudrakartha, S., 2003, The fluid mosaic—Water gover-nance in the context of variability, uncertainty and change—A synthesis paper: Kathmandu, Nepal Water Conservation Foundation.
Morgan, M.G., and Henrion, M., 1992, Uncertainty—A guide to dealing with uncertainty in quantitative risk and policy analysis: New York, Cambridge University Press.
Moser, D.A., Schultz, M.T., Bridges, T.S., and Harper, B.K., 2008a, Flood risk management and the U.S. Army Corps of Engineers Actions for Change, in International Symposium on Flood Defence—Managing Flood Risk, Reliability and Vulnerability, 4th, Toronto, May 6–8, 2008.
Moser, H., Hawkes, P.J., White, K.D., Mai, S., Arntsen, O.A., Gaufres, P., and Pauli, G., 2008b, Waterborne transport, ports and waterways—A review of climate change drivers, impacts, responses and mitigation: Brussels, PIANC, �8 p. (Also available online at http://www.pianc.org/downloads/publications/reports/envicom-free-tg3.pdf.)
Moss, R.H., and Schneider, S.H., 2000, Uncertainties in the IPCC TAR—Recommendations to lead authors for more consistent assessment and reporting, in Pachauri, R., Tani-guchi, T., and Tanaka, K., Guidance papers on the cross cutting issues of the third assessment report of the IPCC: Geneva, World Meteorological Organization, p. 33–�1.
Mote, P.W., 2003, Trends in snow water equivalent in the Pacific Northwest and their climatic causes: Geophysical Research Letters, v. 30, no. 12.
Mote, P.W., 2006, Climate-driven variability and trends in mountain snowpack in western North America: Journal of Climate, v. 19, p. 6,209–6,220.
Murdoch, P.S., Baron, J.S., and Miller, T.L., 2000, Potential effects of climate change on surface-water quality in North America: Journal of the American Water Resources Asso-ciation, v. 36, no. 2, p. 347–366.
Murdoch, P.S., McHale, M.R., Mast, M.A., and Clow, D.W., 200�, The U.S. Geological Survey Hydrologic Benchmark Network: U.S. Geological Survey Fact Sheet 200�–313�, 6 p. (Also available online at http://pubs.er.usgs.gov/usgspubs/fs/fs20053135.)
Murphy, J.M, Sexton, D.M., Barnett, D.N., Jones, G.S., Webb, M.J., Collins, M., and Stainforth, D.A., 2004, Quantifying uncertainties in climate change using a large ensemble of global climate model predictions: Nature, v. 430, p. 768–772.
National Research Council, 1987, Responding to changes in sea level—Engineering implications: Washington, D.C., National Academies Press, 160 p.
National Research Council, 1998, Decade-to-century-scale climate variability and change—A science strategy: Wash-ington, D.C., National Academies Press, 160 p.
National Research Council, 2002, Abrupt climate change—Inevitable surprises: Washington, D.C., National Academies Press, 244 p.
National Research Council, 2004, Adaptive management for water resources project planning: Washington, D.C., National Academies Press, 138 p.
National Research Council, 2006, Surface temperature reconstruction for the last 2,000 years: Washington, D.C., National Academies Press, 160 p.
National Research Council, Committee on Advancing Desali-nation Technology, 2008, Desalination—A national perspec-tive: Washington, D.C., National Academies Press, 312 p.
Nicholls, R.J., Wong, P.P., Burkett, V., Woodroffe, C.D., and Hay, J., 2008, Climate change and coastal vulnerability assessment—Scenarios for integrated assessment: Sustain-ability Science, v. 3, no. 1, p. 89–102.
Northwest Power and Conservation Council, 200�, Appendix N—Effects of climate change on the hydroelectric system, in The fifth northwest electric power and conservation plan—: Northwest Power and Conservation Council, v. III, Portland, Oreg., p. N–1—N–30. (Also available online at http://www.nwcouncil.org/energy/powerplan/5/Default.htm.)
Parson, E., Burkett, V., Fisher-Vanden, K., Keith, D., Mearns, L., Pitcher, H., Rosenzweig, C., and Webster, M., 2007, Global change scenarios—Their development and use, sub-report 2.1B of U.S. Climate Change Science Program and the Subcommittee on Global Change Research, Synthesis and assessment product 2.1—Senarios of greenhouse gas emissions and atmospheric concentrations: Washington, D.C., Department of Energy, Office of Biological and Envi-ronmental Research, 11 p.
Poff, N.L., Brinson, M.M., and Day, J.W, 2002, Aquatic ecosytems and global climate change—Potential impacts on inland freshwater and coastal wetland ecosystems in the United States: Arlington, Va., Pew Center on Global Climate Change, 4� p.
Pulwarty, R., 2003, Climate and water in the west—Science, information and decision making: Water Resources, v. 124, p. 4–12.
� References Cited 43

Rahmstorf, S., Cazenave, A., Church, J.A., Hansen, J.E., Keel-ing, R.F., Parker, D.E., and Somerville, R.C.J., 2007, Recent climate observations compared to projections: Science, v. 316, p. 709.
Rayner, Steve, 2000, Prediction and other approaches to climate change policy, in Sarewitz, D.R., Pielke, R.A., and Byerly, R., ed., Prediction—Science, decision making, and the future of nature: Washington, D.C., Island Press, p. 269–296.
Reichler, T., and Kim, J., 2008, How well do coupled models simulate today’s climate?: Bulletin of the American Meteo-rological Society, v. 89, no. 3, p. 303–311.
Rosenzweig, C., Major, D.C., Demong, K., Stanton, C., Horton, R., and Stults, M., 2007, Managing climate change risks in New York City’s water system: Assessment and adaptation planning, Mitigation and Adaptation Strategies for Global Change, v. 12, p. 1,391–1,409.
Salas, J.D., 1993, Analysis and modeling of hydrologic time series, chap. 19 of Handbook of hydrology, Maidment, D.R., ed.: New York, McGraw-Hill.
Schmidt, G.A., and others, 2006, Present day atmo-spheric simulations using GISS ModelE—Compari-son to in-situ, satellite and reanalysis data: Journal of Climate, v. 19, p. 1�3–192. (Also available online at http://www.giss.nasa.gov/tools/modelE/.)
Schwartz, Peter, 1991, The art of the long view: New York, Currency Doubleday, 272 p.
Shepherd, J.M., and Knutson, T., 2007, The current debate on the linkage between global warming and hurricanes: Geog-raphy Compass, v. 1, no. 1, p. 1–24.
Slack, J.R., and Landwehr, J.M., 1992, Hydro-Climatic Data Network—A U.S. Geological Survey streamflow data set for the United States for the study of climate variations, 1874–1988: U.S. Geological Survey Open-File Report 92–129, 193 p. plus 1 diskette. (Also available online at http://pubs.usgs.gov/of/1992/ofr92-129.)
Slack, J.R., Lumb, A.L., and Landwehr, J.M., 1993, Hydro-Climatic Data Network (HCDN)—Streamflow data set, 1874–1988: U.S. Geological Survey Water-Resources Investigations Report 93–4076, 1 CD–ROM. (Also avail-able online at http://pubs.usgs.gov/wri/wri934076/.)
Stainforth, D.A., Allen, M.R., Trdger, E.R., and Smith, L.A., 2007, Confidence, uncertainty and decision support rel-evance in climate predictions: Philosophical Transactions of the Royal Society A, v. 36�, p. 2,14�–2,161.
Stedinger, J.R., and Taylor, M.R., 1982a, Synthetic stream-flow generation 1. Model verification and validation: Water Resources Research, v. 18, no. 4, p. 909–918.
Stedinger, J.R., and Taylor, M.R., 1982b, Synthetic stream-flow generation 2. Effect of parameter uncertainty: Water Resources Research, v. 18, no. 4, p. 919–924.
Stewart, I.T., Cayan, D.R., and Dettinger, M.D., 200�, Changes toward earlier streamflow timing across western North America: Journal of Climate, v. 18, p. 1,136–1,1��.
Strupczewski, W.G., and Kaczmarek, Z., 2001, Non-stationary approach to at-site flood frequency modeling II. Weighted least squares estimation: Journal of Hydrology, v. 248, p. 143–1�1.
Strupczewski, W.G., Singh, V.P., and Feluch, W., 2001, Non-stationary approach to at-site flood frequency modeling I. Maximum likelihood estimation: Journal of Hydrology, v. 248, p. 123–142.
Tebaldi, C., Mearns, L.O., Nychka, D., and Smith, R.L., 2004, Regional probabilities of precipitation change—A bayesian analysis of multimodel simulations: Geophysical Research Letters, v. 31, p. L24213.
Tebaldi, C., and Knuuti, R., 2007, The use of the multi-model ensemble in probabilistic climate projections: Philosophical Transactions of the Royal Society A, v. 36�, p. 2,0�3–2,07�.
Tebaldi, C., Smith, R.L., Nychka, D., and Mearns, L.O., 200�, Quantifying uncertainty in projections of regional climate change—A bayesian approach to the analysis of multi-model ensembles: Journal of Climate, v. 18, p. 1,�24–1,�40.
Trenberth, K.E., and others, 2007, Observations—Surface and atmospheric climate change, in Climate change 2007—The physical science basis, of Solomon, S., Qin, D., Manning, M., Chen, Z., Marquis, M., Averyt, K.B., Tignor, M., and Miller, H.L., eds., Contribution of Working Group I to the Fourth Assessment Report of the Intergovernmental Panel on Climate Change: Cambridge, United Kingdom, Cambridge University Press. (Also available online at http://www.ipcc.ch/ipccreports/ar4-wg1.htm.)
Tversky, A., and Kahneman, D., 1974, Judgment under uncertainty—Heuristics and biases: Science, v. 18�, p. 1,124–1,131.
U.S. Army Corps of Engineers, 2004, Record of decision, Mis-souri River master water control manual review and update, available online at http://www.nwd-mr.usace.army.mil/ mmanual/mast-man.htm.
U.S. Army Corps of Engineers, 2008, Climate change and res-ervoir rule curves: U.S. Army Corps of Engineers, Western States Watershed Study draft final report, 38 p.
U.S. Department of Energy, 2006, Energy demands on water resources—Report to Congress on the Interdependency of Energy and Water: U.S. Department of Energy.
44 Climate Change and Water Resources Management: A Federal Perspective

U.S. Department of the Interior, 200�, Water 202�—Pre-venting crises and conflict in the west: Department of the Interior, 36 p., available online at http://www.usbr.gov/water2025/.
U.S. Water Resources Council, 1983, Economic and environmental principles and guidelines (P&G) for water and related land resources implementation stud-ies: U.S. Water Resources Council, available online at http://www.usace.army.mil/cw/cecw-cp/library/Principles_Guidelines.pdf.
Vicuna, S., and Dracup, J.A., 2007, The evolution of climate change impact studies on hydrology and water resources in California: Climatic Change, v. 82, no. 3–4, p. 327–3�0.
Vogel, R.M., Zafirakou-Koulouris, A., and Matalas, N.C., 2001, Frequency of record-breaking floods in the United States: Water Resources Research, v. 37, no. 6, p. 1,723–1,731.
Vorosmarty, C.J., Green, P., Salisbury, J., and Lammers, R.B., 2000, Global water resources—Vulnerability from climate change and population growth: Science, v. 289, p. 284–287.
Westerling, A.L., Hidalgo, H.G., Cayan, D.R., and Swetnam, T.W., 2006, Warming and earlier spring increase western U.S. forest wildfire activity: Science, v. 313, no. �789, p. 940–943.
Williams, B.K., Szaro, R.C., and Shapiro, C.D., 2007, Adaptive management—The U.S. Department of Inte-rior technical guide: U.S. Department of Interior, 86 p. (Also available online at http://www.doi.gov/initiatives/AdaptiveManagement/TechGuide.pdf.)
Wittenberg, A.T., Rosati, A., Lau, N.-C., and Ploshay, J.J., 2006, GFDL’s CM2 global coupled climate models, Part 3—Tropical Pacific climate and ENSO: Journal of Climate, v. 19, p. 698–722.
Wood, A.W., Maurer, E.P., Kumar, A., and Lettenmaier, D.P., 2002, Long-range experimental hydrologic forecasting for the eastern United States: Journal of Geophysical Research, Atmospheres, v. 107, no. D20, p. 4,429.
Woodhouse, C.A., and Lukas, J.J., 2006, Multi-century tree-ring reconstructions of Colorado streamflow for water resource planning: Climatic Change, v. 78, p. 293–31�.
� References Cited 45


Appendix A. Paleoclimate Reconstruction of Past Droughts and FloodsTo establish exact dates, a living tree is cored, and the
known years are matched with tree-ring records obtained from nonliving trees (Stahle and Cleaveland, 1992). Overlapping chronologies from different sets of trees can sometimes be used to extend the record back in time. In this way, tree rings can provide hundreds, and in some cases more than a thou-sand, years of tree-ring chronologies.
A statistical model describing the correlation between the instrumental record climate or streamflow record and the tree-ring chronologies can be developed using overlapping periods. For example, a regression model can be developed to estimate annual streamflow from tree-ring widths. This model is then applied to the preinstrumental record to estimate annual streamflow over the length of the tree-ring records. Ideally, tree-ring chronologies should be developed for sites in all of the major runoff-producing areas of a river basin, because this is likely to maximize the fit of the regression model (Meko and others, 199�). Principal components analysis and canoni-cal correlation analysis are sometimes used, particularly when multiple tree-ring sites and (or) multiple hydroclimatic records are used (Loaiciga and others, 1993).
The uncertainty in the reconstructed record can be estimated by the standard error of prediction. However, if the tree-ring chronology for the extended period includes values that were not observed in the calibration period, extrapolation of the regression model into this range of values will intro-duce additional uncertainty into the reconstructed time series. Another source of uncertainty that may affect the time series is the number of trees available to create different periods of the tree chronology. The number of trees typically decreases toward the beginning of a chronology, increasing the uncer-tainty in that part of the reconstructed record (Meko and oth-ers, 199�).
Cook and others (2007) and Stahle and others (2007) describe the use of tree-ring chronologies to reconstruct approximately 1,000 years of drought history over most of North America. They used tree rings to reconstruct the Palmer Drought Severity Index (PDSI), an index calculated from instrumental records of precipitation and temperature as a measure of available soil moisture. Their analysis shows that past “megadroughts” eclipse those in much of the instrumen-tal record in terms of duration and severity. This is consistent with Woodhouse and Overpeck’s (1998) analysis, which used historical documents, archaeological remains, lake sediments, and geomorphic data in addition to tree rings, to reconstruct 2,000 years of drought history in the central United States.
Eolian sediments (dunes), lake sediments, riverine cave sediments, and ocean sediments can also be used as prox-ies to reconstruct hydroclimatic information. While they do not allow the accuracy and resolution that is possible with tree-ring reconstructions, different inferences may be drawn from different proxies, giving a more complete picture of past drought events (Woodhouse, 2004).
Climate information for periods prior to the instrumental record can be reconstructed using historical information and proxy data from tree rings, sediment, and other sources. These reconstructed time series are generally less precise than the instrumental record, with varying uncertainties and time reso-lution, depending on the technique used; however, they can provide useful information on the range of variability that has been seen at a particular location. Paleorecords can provide a much better record of variability than is typically available from the instrumental record.
For some variables, paleoclimate reconstructions have been estimated millions of years into the past. Generally, the further back in time reconstructions are attempted, the less accurate they are. Water managers have varying planning horizons, but they are generally less than 30–40 years, and the large variations that may have occurred over the past millions of years have limited relevance. Water managers are primarily interested in scenarios that are consistent with current climate and natural variability. Holocene records (from approximately the last 10,000 years) provide a greater range of variability than observed in the instrumental record, as well as different sequencing of events, and they allow for reasonable estimates of uncertainty that can be incorporated into subsequent sensi-tivity analysis.
Historical documents, such as newspaper articles, diaries, and letters, sometimes contain useful information about notable climate events such as floods or prolonged droughts. In some cases, regular records of meteorological conditions can be found. For example, both Thomas Jefferson and James Madi-son kept meteorological diaries in the late eighteenth century (Druckenbrod and others, 2003). These historical records can be used to supplement the other techniques described below.
A1 Drought Reconstruction
Common proxies for drought reconstruction are annual tree rings, analyzed using dendrochronology techniques. Annual variations in a tree’s growth are recorded in the width of its annual growth rings. Under some conditions, the varia-tion in the growth of trees is primarily a response to climatic conditions, rather than factors such as competition or disease. For example, in the western United States, trees growing in arid and semiarid areas on open, dry, and rocky, south-fac-ing slopes are most suitable for use in climate reconstructions because their growth is most often limited by moisture stress (Woodhouse, 2004). The low precipitation and high evapo-transpiration rates that lead to moisture stress are the same conditions that lead to low streamflow or drought conditions. When the tree-ring patterns are similar in a number of trees (typically 10 or more), year-to-year differences can be attrib-uted to climatic differences rather than to stresses experienced by an individual tree. These tree-ring chronologies can then be used as a proxy for climatic conditions.
Appendix A 4�

A2 Flood Reconstruction
Paleoflood hydrology is the study of floods prior to the instrumental record or in ungaged basins (Costa, 1987; Baker, 2008). The study of landforms, sediments, and botani-cal evidence can be used to infer information about previ-ous flooding. Flood reconstructions can be used to improve flood-frequency estimates, but more importantly, to provide information on the magnitude and age of the largest flood(s) in a particular basin and for hydrologically homogeneous geographical regions (Jarrett and England, 2002).
For reconstructing individual flood events, paleostage indicators (PSIs) are used to estimate the maximum flood stage that has occurred on a river. Paleoflood hydrologists then translate the stage estimate to a flow estimate using standard hydraulic methods that are also used for recent floods (Webb and Jarrett, 2002) and date the event.
The most commonly used PSIs are slackwater deposits of coarse-grained sediments, deposited in areas of flood inunda-tion where velocities are minimal (Baker, 2008; Jarrett and England, 2002). Flood bars, eroded geologic features, and modifications of terraces and flood plains are also used as PSIs. Some of these PSIs can be preserved for tens of thou-sands of years, although most paleoflood reconstructions are made for the Holocene. Radiocarbon dating is commonly used to estimate the age of PSIs (for example, to within �0 to 100 years for a flood that occurred during the Holocene). A minimum age of the sediment deposit can also be estimated by the age of any trees growing on them. In some situations, the thickness of sediment layers and the particle size contained in them can also provide clues to previous flood magnitudes. The layering itself may provide information about the frequency of flood events.
The maximum flood stage estimated from PSIs is used to estimate the maximum flow using indirect-flow estimation techniques. These techniques are sometimes used to estimate flood flows in the systematic record, except that instead of PSIs, high water marks are taken from indicators such as disturbed grass, mud, silt, seed lines, and other flood-carried debris. Hydraulic principles are used to estimate flow rates based on the high water indicated by physical evidence and on estimated channel properties. To estimate channel properties for paleofloods, the river channel at the time of the paleoflood must be essentially the same as the modern river channel. Consequently, paleoflood reconstruction is most appropri-ate for bedrock channels that remain stable over time. These techniques are not suitable for unstable channels.
Using modern floods, Jarrett and England (2002) compared the maximum stage estimated from flood bars and slack water deposits to high water marks traditionally used by hydrologists to estimate flood stage. While there were some differences between the PSIs and the high water marks, Jarrett and England concluded that flood bars and slack water depos-its generally provide a reliable and accurate indication of the maximum height of the flood. As pointed out by Hirschboeck (2003), paleoflood indicators based on flood deposits provide
direct physical evidence of the occurrence of past floods. The evidence is not filtered through a biological response, such as tree-ring growth. Nevertheless, tree-growth responses to flood events can also be used to document flood stages. Common responses include the formation of scars, sprouting from tilted stems, and eccentric ring growth (Yanosky and Jarrett, 2002). The average maximum height of scars can provide an indica-tor of maximum flood stage. This evidence can be combined with dendrochronology techniques to date the flood events to a specific year. Interpretations of individual annual rings can sometimes identify the time of year a flood occurred to within a few months (Yanosky and Jarrett, 2002). However, require-ments for flood-scarred, living trees in the flood plain can limit the length of the paleoflood reconstruction using dendro-chronology (Yanosky and Jarrett, 2002).
A3 References Cited
Baker, V., 2008, Paleoflood hydrology—Origin, progress, prospects: Geomorphology, v. 101, no. 1–2, p. 1–13.
Cook, E.R., Seager, R., Cane, M.A., and Stahle, D.W., 2007, North American drought: Reconstructions, causes, and con-sequences: Earth-Science Reviews, v. 81, p. 93–134.
Costa, J.E., 1987, A history of paleoflood hydrology in the United States, 1800–1970, in Landa, E.R., and Ince, S., eds., History of hydrology: History of Geophysics, v. 3, p. 49–�4.
Druckenbrod, D.L., Mann, M.E., Stahle, D.W., Cleaveland, M.K., Therrell, M.D., and Shugart, H.H., 2003, Late-eigh-teenth-century precipitation reconstructions from James Madison’s Montepelier Plantation: Bulletin of the American Meteorological Society, v. 84, no. 1, p. �7–71.
Hirschboeck, K.K., 2003, Floods, paleofloods, and drought—Insights from the Upper Tails: CLIVAR/PAGES/IPCC Drought Workshop, November 18–21, Tucson, AZ.
Jarrett, R.D., and England, J.F., Jr., 2002, Reliability of paleo-stage indicators for paleoflood studies, Modern hazards, in House, P.K., Webb, R.H., Baker, V.R., and Levish, D.R., eds., Principles and applications of paleoflood hydrology: Water Science and Application, American Geophysical Union, v. 3, p. 91–109.
Loaiciga, H.A., Haston, L., and Michaelsen, J., 1993, Dendro-hydrology and long-term hydrologic phenomena: Reviews of Geophysics, v. 31, no. 2, p. 1�1–171.
Meko, D.M., Stockton, C.W., and Boggers, W.R., 199�, The tree-ring record of severe sustained drought: Water Resources Bulletin, v. 31, no. �, p. 789–801.
Meko, D.M, Woodhouse, C.A., Baisan, C.A., Knight, T., Lukas, J.J., Hughes, M.K., and Salzer, M.W., 2007, Medi-eval drought in the Upper Colorado River Basin: Geophysi-cal Research Letters, v. 34, p. L1070�.
4� Climate Change and Water Resources Management: A Federal Perspective

Stahle, D.W., and Cleaveland, M.K., 1992, Reconstruction and analysis of spring rainfall over the southeastern U.S. for the past 1000 years: Bulletin of the American Meteorological Society, v. 73, p. 1947–1961.
Stahle, D.W., Fye, F.K., Cook, E.R., and Griffin, R.D., 2007, Tree-ring reconstructed megadroughts over North America since A.D. 1300: Climatic Change, v. 83, p. 133–149.
Webb, R.H., and Jarrett, R.D., 2002, One-dimensional estima-tion techniques for discharges of paleofloods and historical floods, in Ancient floods, modern hazards: Principles and applications of paleoflood hydrology, American Geo-physical Union Water Science and Application Series, v. �, p. 111–12�.
Woodhouse, C.A., 2004, A paleo perspective on hydroclimatic variability in the western United States: Aquatic Sciences, v. 66, p. 346–3�6.
Woodhouse, C.A., and Overpeck, J.T., 1998, 2000 years of drought variability in the central United States: Bulletin of the American Meteorological Society, v. 79, no. 12, p. 2693–2714.
Yanosky, T.M., and Jarrett, R.D., 2002, Dendrochronologic evidence for the frequency and magnitude of paleofloods, in House, P.K., Webb, R.H., Baker, V.R., and Levish, D.R., eds., Ancient floods, modern hazards: Principles and applications of paleoflood hydrology: Water Science and Application, American Geophysical Union, v. �, p. 77–89.
Appendix A 4�


Appendix B. Downscaling General Circulation Model ResultsThe spatial scale of climate model output is too coarse for
regional studies on water resources response (Maurer and oth-ers, 2007). By definition, climate projection downscaling is the process of transferring general circulation model (GCM) output to a finer spatial scale that is more meaningful for analyzing local and regional climate conditions. Downscaling is justi-fied, at least in principle. Anthropogenic global climate change would lead to changes in large-scale atmospheric features, such as the tropical “Hadley Cell” atmospheric circulation and the wintertime climatological storm tracks in the middle latitudes. However, the effect of large-scale feature changes on local surface climate cannot be resolved in the current generation of GCMs, which introduces the need for downscaling.
B1 Downscaling Methods
Many downscaling methods have been developed, all of which have strengths and weaknesses. Several reports offer discussions on the various methodologies, notably the IPCC Fourth Assessment (Intergovernmental Panel on Climate Change, 2007, ch. 11) and Wigley (2004). Fowler and others (2007) offer an extensive review of downscaling methods that have been developed since the 1990s, method intercomparison studies, and discussion of the appropriate application of these methodologies for hydrologic impacts studies.
The various methodologies might be classified by two fun-damentally different approaches: dynamical, where a regional climate model (RCM) with finer spatial resolution is embedded within a GCM; and, statistical, where large-scale climate fea-tures are statistically related to fine-scale climate for the region. The RCMs used for dynamical downscaling are typically resolved at the ~0.�° latitude and longitude scale and feature parameterized physical atmospheric processes (Fowler and oth-ers, 2007). They are able to simulate regional climate features such as orographic precipitation, rain shadows in mountainous regions, extreme climate events, and regional-scale anomalies.
There are advantages and disadvantages associated with the available downscaling techniques (table B–1). In both
approaches, downscaling skill depends strongly on biases inherited from the driving GCM. It has been shown that application of either method using historical GCM-simulated climate produces more realistic hydrologic simulation if the GCM-simulated climate conditions are first bias-corrected relative to observations (Fowler and others, 2007).
Based on their review of available methods and method intercomparison studies, Fowler and others (2007) conclude that, generally speaking, temperature can be downscaled with more skill than precipitation, winter climate can be downscaled with more skill than summer because of stronger relations with large-scale circulation, and wetter climates can be downscaled with more skill than drier climates. However, it remains difficult to directly compare the skill of different methods because of the range of climate statistics that have been assessed in the literature, the large range of predictors used, and the different proposed methods for assessing model performance.
Although theoretical strengths and weaknesses of each downscaling method are generally established (for example, those listed in table B–1), no single best downscaling method is obviously identifiable (Fowler and others, 2007). Simple statistical downscaling methods seem to perform well and at low computational cost when the goal is to reproduce mean climate characteristics. If the goal is to reproduce extreme characteristics, a more sophisticated method may be war-ranted. Salathé and others (2007) note that in mountainous regions there may be important orographic controls on pre-cipitation, such as rain shadows affecting lee-side precipitation relative to mean storm patterns, or there may be important land-surface feedbacks potentially affecting local climate as regional temperatures increase (for example, warming leading to reduced snow-cover area, reduced land-surface albedo, increased land-surface absorption of solar radiation and emis-sion of long-wave radiation, and thus a positive reinforce-ment on local warming). In these geographic situations and for the purpose of capturing different climate qualities, it may be preferable to apply RCM-based, dynamical, downscaling techniques rather than statistical techniques.
Appendix B 51
Table B–1. General advantages and disadvantages associated with statistical and dynamical classes of downscaling methods.
Statistical DynamicalAdvantages • Comparatively cheap and computationally efficient
• Can provide point-scale climatic variables from GCM-scale output
• Able to directly incorporate observations into method
• Produces responses based on physically consistent processes• Produces finer-resolution information from GCM-scale
output that can resolve atmospheric processes on a smaller scale (for example, orographic and rain shadow effects in mountainous areas)
Disadvantages • Does not account for non-stationarity in the predictor-predictand relationship
• Climate system feedbacks not included• Dependent on GCM boundary forcing; affected by
biases in underlying GCM• Dependent on statistical or empirical model structure
and associated parameters; different models will give different results
• Computationally intensive• Limited number of scenario ensembles available• Dependent on GCM boundary forcing; affected by biases in
underlying GCM• Dependent on RCM parameterizations; different RCMs will
give different results

B2 Downscaled Climate Projections Archive
As noted, downscaling skill depends strongly on biases inherited from the driving GCM. Thus, it would seem appropriate to scope studies on prospective climate impacts on hydrology and water resource sectors so that they suf-ficiently represent the breadth and distribution of contempo-rary climate projections, independent of the method selected for downscaling. Fowler and others (2007) support this notion, suggesting that probabilistic methods for develop-ing scenarios of future climate and associated hydrology may offer a robust way of assessing climate change impacts. Furthermore, they assert that the inclusion of uncertainty estimates using a multi-GCM approach may offer the most potential for advancement within both the “downscaling for hydrological impacts” science community and for practi-tioners. Addressing this issue, a downscaled climate projec-tions (DCP) archive has been made available (“Statistically Downscaled WCRP CMIP3 Climate Projections” available at http://gdo-dcp.ucllnl.org/downscaled_cmip3_projections/), featuring spatially downscaled translations of 112 CMIP3 projections collectively produced by 16 CMIP3 models simulating 3 emissions paths [B1 (low), A1b (middle), A2 (high)] from different end-of-the-twentieth-century climate conditions. The DCP archive permits survey of climate projection information over locations or areas within the contiguous United States, southern Canada, and northern Mexico. The following considerations drove selection of the statistical approach supporting DCP archive develop-ment [Bias-Correction and Spatial Disaggregation (BCSD) described in Wood and others (2002, 2004), as reported at http://gdo-dcp.ucllnl.org/downscaled_cmip3_projections/ #Limitations]:
Well tested and documented, especially in applications in the United States.
Automated and efficient enough to feasibly permit downscaling of many twenty-first century climate projections, thereby permitting more comprehensive assessments of downscaled climate projection uncer-tainty.
Able to produce output that statistically matches obser-vations for a historical period.
Capable of producing spatially continuous, fine-scale gridded output of precipitation and temperature suit-able for water resources and other watershed-scale impacts analysis.
While there are many statistical techniques available (Wigley, 2004; Intergovernmental Panel on Climate Change, 2007; Fowler and others, 2007), only the BCSD met all of these criteria at the time of DCP archive development.
To date, there has not been a demonstration of using dynamical downscaling to produce a dataset as comprehensive as the DCP archive (in terms of geography, variables, projec-
•
•
•
•
tions, and projected years represented). The computational expense associated with RCM application to the DCP projec-tions scope was the primary reason why RCM application was viewed to be infeasible in DCP-archive development. While there are new efforts to downscale multiple climate projections using multiple RCMs, such as the North American Regional Climate Change Assessment Program (NARCCAP, http://www.narccap.ucar.edu/), the computational requirements of applying RCM-based downscaling for a few decades and a few GCM projections remain large compared to the DCP scope of downscaling 1�0 years from more than 100 GCM simulations.
Compared to dynamical downscaling approaches, the BCSD method has been shown to provide downscaling capa-bilities comparable to those of other statistical and dynami-cal methods in the context of hydrologic impacts (Wood and others, 2004). However, as already noted, dynamical down-scaling has also been shown to identify some local climate effects and land-surface feedbacks that BCSD cannot readily identify (Salathé and others, 2007). Another potential limita-tion of BCSD, like any statistical downscaling method, is the assumption of some stationarity, where it is assumed that the relation between large-scale precipitation and temperature and fine-scale precipitation and temperature in the future will be the same as in the past. For example, the processes deter-mining how precipitation and temperature anomalies for any 2°-grid box are distributed within that grid box are assumed to govern in the future as well. A second assumption included in the bias-correction step of the BCSD method is that any biases exhibited by a GCM for the historical period will also be exhibited in future simulations. Tests of these assumptions, using historic data, show that they appear to be reasonable, inasmuch as the BCSD method compares favorably to other downscaling methods (Wood and others, 2004).
BCSD has been frequently used to support climate change impacts assessments on western U.S. hydrology in recent years, such as the Columbia-Snake Basin (Payne and others, 2004), the California Central Valley (Van Rheenan and others, 2004; Maurer and Duffy, 200�; Anderson and others, 2008; Maurer, 2007), and the Colorado River Basin (Christensen and others, 2004; Christensen and Lettenmaier, 2007). The California Governor’s office receives a collection of studies every 2 years in a Biennial Science Report (BSR). In the 2008 BSR update, two techniques will be featured (http://meteora.ucsd.edu/cap/scen08_data.html): BCSD and “Constructed Analogues” (CA) (Hidalgo and others, 2008). Both methodologies satisfy the DCP-archive development criteria outlined above. A recent comparison of the methods (Maurer and Hidalgo, 2008) shows that the results are not significantly different when the methods are used to develop monthly time-series temperature and precipitation projections. However, for the goal of developing daily projected time series of temperature and precipitation information, the CA methodology was found to be preferable in some locations and during some times of the year. For both methods, however, the skill of the methodology was found to be significantly limited by the uncertainties of the input GCM information.
52 Climate Change and Water Resources Management: A Federal Perspective

B3 References Cited
Anderson, J., Chung, F., Anderson, M., Brekke, L., Easton, D., Ejeta, M., Peterson, R., and Snyder, R., 2008, Progress on Incorporating Climate Change into Management of California’s Water Resources, Climatic Change, v. 87, no.1, p. S91–S108.
Christensen, N., and Lettenmaier, D.P., 2007, A multimodel ensemble approach to assessment of climate change impacts on the hydrology and water resources of the Colorado River basin: Hydrology and Earth System Sciences, v. 3, p.1–44.
Christensen, N.S., Wood, A.W., Voisin, N., and Lettenmaier, D., 2004, The effects of climate change on the hydrology and water resources of the Colorado River basin: Climatic Change, v. 62, p. 337–363.
Fowler, H.J., Blenkinsop, S., and Tebaldi, C., 2007, Review: Linking climate change modeling to impacts studies—Recent advances in downscaling techniques for hydrologi-cal modelling: International Journal of Climatology, v. 27, p. 1�47–1�78.
Hidalgo, H.G., Dettinger, M.D., and Cayan, D.R., 2008, Downscaling with constructed analogues—Daily pre-cipitation and temperature fields over the United States: Sacramento, CA, California Energy Commission, Report No. CEC–�00–2007–123.
Intergovernment Panel on Climate Change, Climate change 2007—The physical science basis. Contribution of Work-ing Group I to Fourth Assessment Report of the Intergov-ernmental Panel on Climate Change, Solomon, S., Qin, D., Manning, M., Chen, Z., Marquis, M., Averyt, K.B., Tignor, M., and Miller, H.L., eds.: Cambridge, United Kingdom, Cambridge University Press. Available at http://www.ipcc.ch/ipccreports/ar4-wg1.htm.
Maurer, E.P., 2007, Uncertainty in hydrologic impacts of climate change in the Sierra Nevada, California under two emissions scenarios: Climatic Change, v. 82, p. 309–32�.
Maurer, E.P., Brekke, L., Pruitt, T., and Duffy, P.B., 2007, Fine-resolution climate projections enhance regional
climate change impact studies: Eos, Transactions of the American Geophysical Union, v. 88, no. 47, p. �04.
Maurer, E.P., and Duffy, P.B., 200�, Uncertainty in projections of streamflow changes due to climate change in California: Geophysical Research Letters, v. 32, no. 3, p. L03704.
Maurer, E.P., and Hidalgo, H.G., 2008, Utility of daily vs. monthly large-scale climate data—An intercomparison of two statistical downscaling methods: Hydrology and Earth System Sciences, v. 12, p. ��1–�63.
Payne, J.T., Wood, A.W., Hamlet, A.F., Palmer, R.N., and Lettenmaier, D.P., 2004, Mitigating the effects of climate change on the water resources of the Columbia River basin. Climatic Change: v. 62, no. 1–3, p. 233–2�6.
Salathé, E.P., Mote, P.W., and Wiley, M.W., 2007, Review of scenario selection and downscaling methods for the assess-ment of climate change impacts on hydrology in the United States Pacific Northwest: International Journal of Climatol-ogy, v. 27, p. 1611–1621.
Van Rheenen, N.T., Wood, A.W., Palmer, R.N., and Letten-maier, D.P., 2004, Potential implications of PCM climate change scenarios for Sacramento-San Joaquin River Basin hydrology and water resources: Climatic Change, v. 62, p. 2�7–281.
Wigley, T.M.L., 2004, Input needs for downscaling of climate data: Discussion paper prepared for California Energy Com-mission Public Interest Energy Research Program Report �00–04–027.
Wood, A.W., Maurer, E.P., Kumar, A., and Lettenmaier, D.P., 2002, Long-range experimental hydrologic forecasting for the eastern United States: Journal of Geophysical Research-Atmospheres, v. 107, no. D20, p. 4429.
Wood, A.W., Leung, L.R., Sridhar, V., and Lettenmaier, D.P., 2004, Hydrologic implications of dynamical and statistical approaches to downscaling climate model outputs: Climatic Change, v. 1�, p. 189–216.
Appendix B 53


Appendix C. Recent Reclamation and USACE Planning Applications Involving the Use of Expanded Climate Information Sets
As discussed in chapter 3, there have been several recent examples of Reclamation, USACE, and other Federal and State agencies exploring the use of expanded climate information sets to support various water resources planning efforts. In this context, an expanded set is defined to include instrumental record information plus any mix of the follow-ing: (1) synthetic hydrologic sequences developed through stochastic modeling, (2) additional reference climate and sequence indicated by paleoclimate evidence, and (3) pro-jected climate information consistent with future scenarios of greenhouse gas emissions (Intergovernmental Panel on Climate Change, 2007).
Three examples were mentioned in chapter 3, where the focus was on evaluating proposed or expected long-term plans of operation:
Lake Ontario–St Lawrence River Study, which used climate projection information and stochastic modeling to guide hydrologic variability assumptions in water control planning for the Lake Ontario–St. Lawrence River System (International Joint Commission, 2006).
Colorado River Basin Study, which used nonparametric stochastic modeling with paleoclimate information to guide water supply variability assumptions in opera-tions planning for the Colorado River Storage System (Bureau of Reclamation, 2007).
California Central Valley Study, which used climate projection and sea-level rise information to guide water supply assumptions in a biological assessment on multiple fish species in the California Central Valley (Bureau of Reclamation, 2008).
This appendix discusses the process and purposes of each study and how climate information was related to planning assumptions.
C1 Lake Ontario–St. Lawrence River Study
C1.1 Process and Purpose
The International Joint Commission (IJC) oversees operation of the St. Lawrence River Hydropower Project. Cur-rent operations of this water resources system are conducted according to Plan D–19�8, which consists of rules for making weekly releases from Lake Ontario that vary based on lake inflows and levels, time of year, ice conditions, Ottawa River flows, and other factors. Plan D–19�8 was developed relative to hydroclimate observations collected during 1860–19�4.
In response to interest in understanding whether the water control plan should be modernized (for example, to better accommodate changing social objectives related to environ-
mental management or recreational boating), the IJC called for the development of plan information on criteria and options for regulating Lake Ontario water levels and outflow to the St. Lawrence River (fig. C–1). The objective was to explore options that would benefit affected interests reliant on col-lective system resources and would conform to the require-ments of the Boundary Waters Treaty. The optional control plans were evaluated relative to three criteria: (1) support the ecological integrity of the system, (2) maximize net benefits including both economic and environmental benefits, and 3) minimize disproportionate losses.11
Within this decision framework, climate assumptions were one of the factors affecting plan viability. Specifically, there was the study guideline that regulation “of the Lake Ontario-St. Lawrence River system will be adaptable” and to the extent possible be designed to accommodate “potential for changes in water supply as a result of climate change and stochastic variability” (International Joint Commission, 2006).
Figure C–1. Geographic setting for International Joint Commission (2006) regarding the use of projected regional climate information and stochastic data enrichment to guide water control planning in the Lake Ontario-St. Lawrence River system.
11This last criterion has not generally been used in USACE planning studies. “Disproportionate loss” was a qualitative determination that included several factors including the duration and frequency of the impacts, an assessment of which plan minimizes the maximum losses, and an assessment of the robust-ness of the plans under extreme water supply conditions.
•
•
•
Appendix C 55
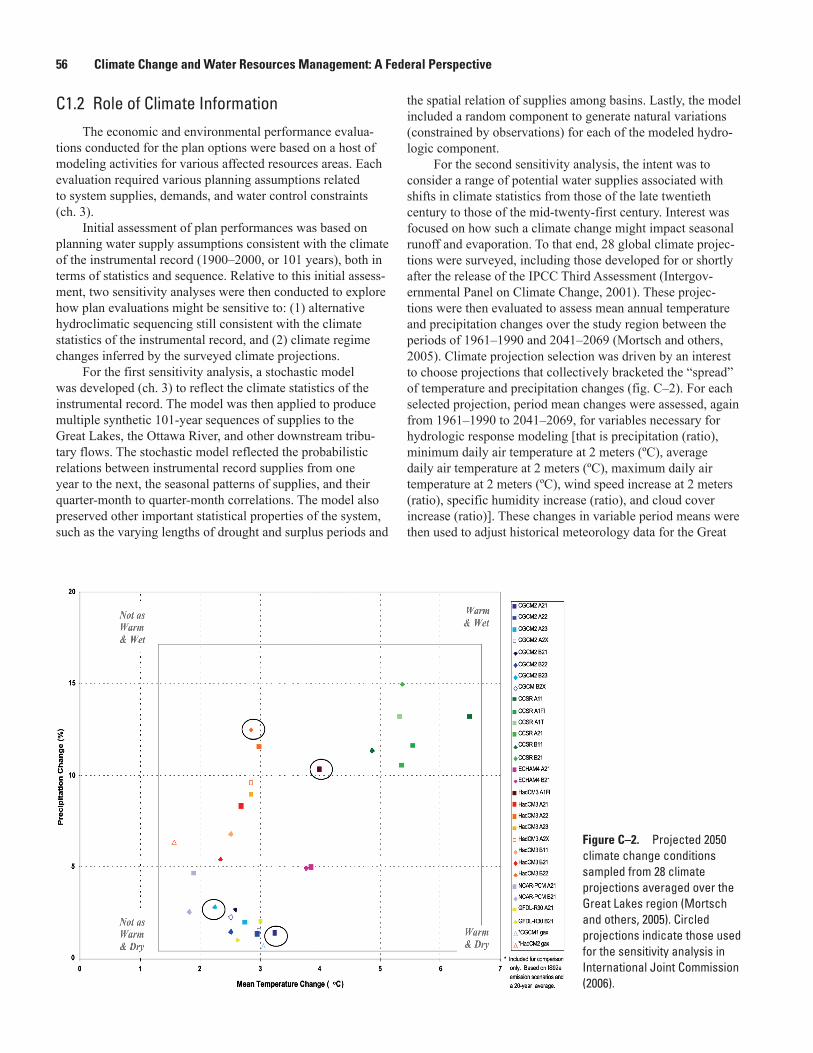
C1.2 Role of Climate InformationThe economic and environmental performance evalua-
tions conducted for the plan options were based on a host of modeling activities for various affected resources areas. Each evaluation required various planning assumptions related to system supplies, demands, and water control constraints (ch. 3).
Initial assessment of plan performances was based on planning water supply assumptions consistent with the climate of the instrumental record (1900–2000, or 101 years), both in terms of statistics and sequence. Relative to this initial assess-ment, two sensitivity analyses were then conducted to explore how plan evaluations might be sensitive to: (1) alternative hydroclimatic sequencing still consistent with the climate statistics of the instrumental record, and (2) climate regime changes inferred by the surveyed climate projections.
For the first sensitivity analysis, a stochastic model was developed (ch. 3) to reflect the climate statistics of the instrumental record. The model was then applied to produce multiple synthetic 101-year sequences of supplies to the Great Lakes, the Ottawa River, and other downstream tribu-tary flows. The stochastic model reflected the probabilistic relations between instrumental record supplies from one year to the next, the seasonal patterns of supplies, and their quarter-month to quarter-month correlations. The model also preserved other important statistical properties of the system, such as the varying lengths of drought and surplus periods and
the spatial relation of supplies among basins. Lastly, the model included a random component to generate natural variations (constrained by observations) for each of the modeled hydro-logic component.
For the second sensitivity analysis, the intent was to consider a range of potential water supplies associated with shifts in climate statistics from those of the late twentieth century to those of the mid-twenty-first century. Interest was focused on how such a climate change might impact seasonal runoff and evaporation. To that end, 28 global climate projec-tions were surveyed, including those developed for or shortly after the release of the IPCC Third Assessment (Intergov-ernmental Panel on Climate Change, 2001). These projec-tions were then evaluated to assess mean annual temperature and precipitation changes over the study region between the periods of 1961–1990 and 2041–2069 (Mortsch and others, 200�). Climate projection selection was driven by an interest to choose projections that collectively bracketed the “spread” of temperature and precipitation changes (fig. C–2). For each selected projection, period mean changes were assessed, again from 1961–1990 to 2041–2069, for variables necessary for hydrologic response modeling [that is precipitation (ratio), minimum daily air temperature at 2 meters (ºC), average daily air temperature at 2 meters (ºC), maximum daily air temperature at 2 meters (ºC), wind speed increase at 2 meters (ratio), specific humidity increase (ratio), and cloud cover increase (ratio)]. These changes in variable period means were then used to adjust historical meteorology data for the Great
Figure C–2. Projected 2050 climate change conditions sampled from 28 climate projections averaged over the Great Lakes region (Mortsch and others, 2005). Circled projections indicate those used for the sensitivity analysis in International Joint Commission (2006).
56 Climate Change and Water Resources Management: A Federal Perspective

Lakes and Ottawa River basins, relative to which hydrologic modeling was conducted to develop planning water supply sequences associated with the given climate change regime.
In summary, the economic and environmental evaluations of plan options in IJC (2006) were based on multiple model-ing analyses considering multiple unique “stationary climates” (instrumental record and projected climate) and using stochas-tic modeling to augment the sense of plausible climate vari-ability associated with the instrumental record climate.
C2 Colorado River Basin Study
C2.1 Process and Purpose
The Secretary of the Interior, acting through Reclamation, proposed adopting interim guidelines for allocating water in the Colorado River Lower Basin (Lower Basin) and coordi-nated operations for Lake Powell and Lake Mead, particularly under drought and low reservoir conditions (referred to as “shortage criteria”). Reclamation served as the lead Fed-eral agency for the purposes of compliance pursuant to the National Environmental Policy Act of 1969 and development of the final EIS on the proposed action (Bureau of Reclama-tion, 2007). Five Federal agencies assisted with environmental analysis and the preparation of the EIS: the Bureau of Indian Affairs (BIA), U.S. Fish and Wildlife Service (USFWS), National Park Service (NPS), Western Area Power Adminis-tration (Western), and the United States Section of the Interna-tional Boundary and Water Commission (USIBWC).
Prior to this effort, the Department of the Interior did not have specific operational guidelines in place to address the operations of Lake Powell and Lake Mead during drought and low reservoir conditions (Bureau of Reclamation, 2007). The purpose of the proposed action was to
Improve Reclamation’s management of the Colorado River by considering trade-offs between the frequency and magnitude of reductions of water deliveries, and considering the effects on water storage in Lake Powell and Lake Mead, and on water supply, power produc-tion, recreation, and other environmental resources;
Provide mainstream United States users of Colorado River water, particularly those in the Lower Division States, a greater degree of predictability with respect to the amount of annual water deliveries in future years, particularly under drought and low reservoir condi-tions; and
Provide additional mechanisms for the storage and delivery of water supplies in Lake Mead to increase the flexibility of meeting water use needs from Lake Mead, particularly under drought and low reservoir conditions (Bureau of Reclamation, 2007).
The adopted guidelines would remain in effect through 2026.
•
•
•
C2.2 Role of Climate InformationThe environmental effects analyses conducted for the
various proposed action alternatives (and no-action alterna-tive) were driven by assumptions of system water supplies, demands, and operational constraints feature in the Colorado River Simulation System (CRSS) (fig. C–3). CRSS was used to look at a range of future Colorado River system conditions under each action alternative. Initial planning assumptions were characterized on a monthly time step based on instru-mental records and served as “scenario” assumptions for a future period of 2008 through 2060 (admittedly extending beyond the proposed action’s application horizon of 2008 through 2026). The traditional use of CRSS involves block-resampling of instrumental records [that is, Index Sequential Method (ISM)] (Bureau of Reclamation, 2007), resulting in multiple input hydrologic sequences consistent with the instru-mental record, and setting up an ensemble of system simula-tions that are evaluated collectively (see fig. C–4).
In this study, no projected climate information was considered in the modeling analyses, in part because of the relatively short lookahead period associated with the study (that is, 19 years). However, there was interest in understand-ing the potential effects of future inflow sequences outside the range of historical flow sequences (for example, a future with different hydrologic variability and associated severity, frequency, and duration of droughts). As a result, a sensitivity analysis (Bureau of Reclamation, 2007, Appendix N) was con-ducted on the sensitivity of system conditions to an expanded range of hydrologic variability viewed to be plausible during the planning horizon.
In developing assumptions about hydrologic variability, two climate regimes were referenced in the study: (1) the climate of instrumental record (that is, natural runoff esti-mates based on Colorado River basin observations during 1906–200�) (fig. C–�); and (2) the climate from the recon-structed period of annual streamflow at Lees Ferry based on tree-ring records (Meko and others, 2007). Stochastic model-ing was used to develop synthetic hydrologic and water supply sequences consistent with either reference climate (Bureau of Reclamation, 2007, appendix N).
Paleoclimate-based reconstructions of Lees Ferry stream-flow were used in two ways for this study:
• Direct Paleo (DP), which involved basing supply sequences on both the state and magnitudes informa-tion from the reconstructed streamflows, and
• Nonparametric Paleo-Conditioned (NPC), which involved harvesting only the state information from the reconstructed flows and blending that information with magnitudes information from the instrumental record.
The DP technique involved developing hydrologic input sequences from a 1,244-year annual reconstruction of Colo-rado River streamflow at Lees Ferry (Meko and others, 2007). This sequence was of particular interest because it encapsu-lated the Medieval Climate Anomaly (900 to 1300), a period
Appendix C 5�
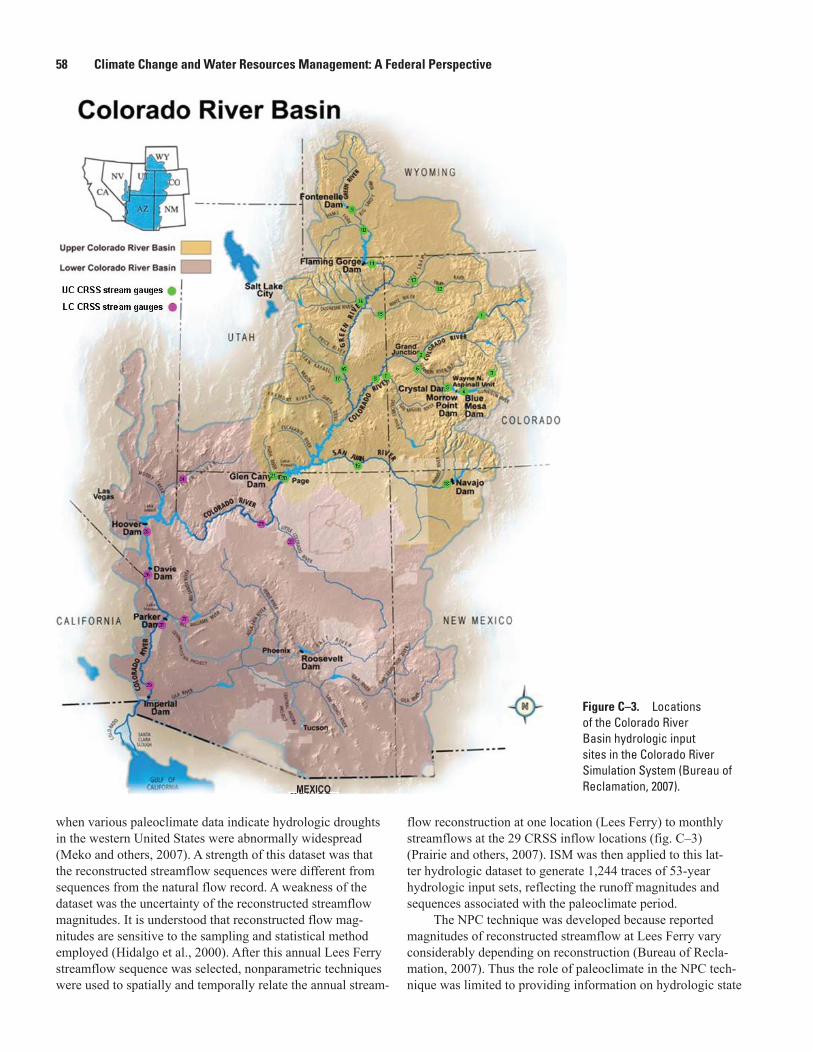
MEXICO
Figure C–3. Locations of the Colorado River Basin hydrologic input sites in the Colorado River Simulation System (Bureau of Reclamation, 2007).
flow reconstruction at one location (Lees Ferry) to monthly streamflows at the 29 CRSS inflow locations (fig. C–3) (Prairie and others, 2007). ISM was then applied to this lat-ter hydrologic dataset to generate 1,244 traces of �3-year hydrologic input sets, reflecting the runoff magnitudes and sequences associated with the paleoclimate period.
The NPC technique was developed because reported magnitudes of reconstructed streamflow at Lees Ferry vary considerably depending on reconstruction (Bureau of Recla-mation, 2007). Thus the role of paleoclimate in the NPC tech-nique was limited to providing information on hydrologic state
when various paleoclimate data indicate hydrologic droughts in the western United States were abnormally widespread (Meko and others, 2007). A strength of this dataset was that the reconstructed streamflow sequences were different from sequences from the natural flow record. A weakness of the dataset was the uncertainty of the reconstructed streamflow magnitudes. It is understood that reconstructed flow mag-nitudes are sensitive to the sampling and statistical method employed (Hidalgo et al., 2000). After this annual Lees Ferry streamflow sequence was selected, nonparametric techniques were used to spatially and temporally relate the annual stream-
5� Climate Change and Water Resources Management: A Federal Perspective
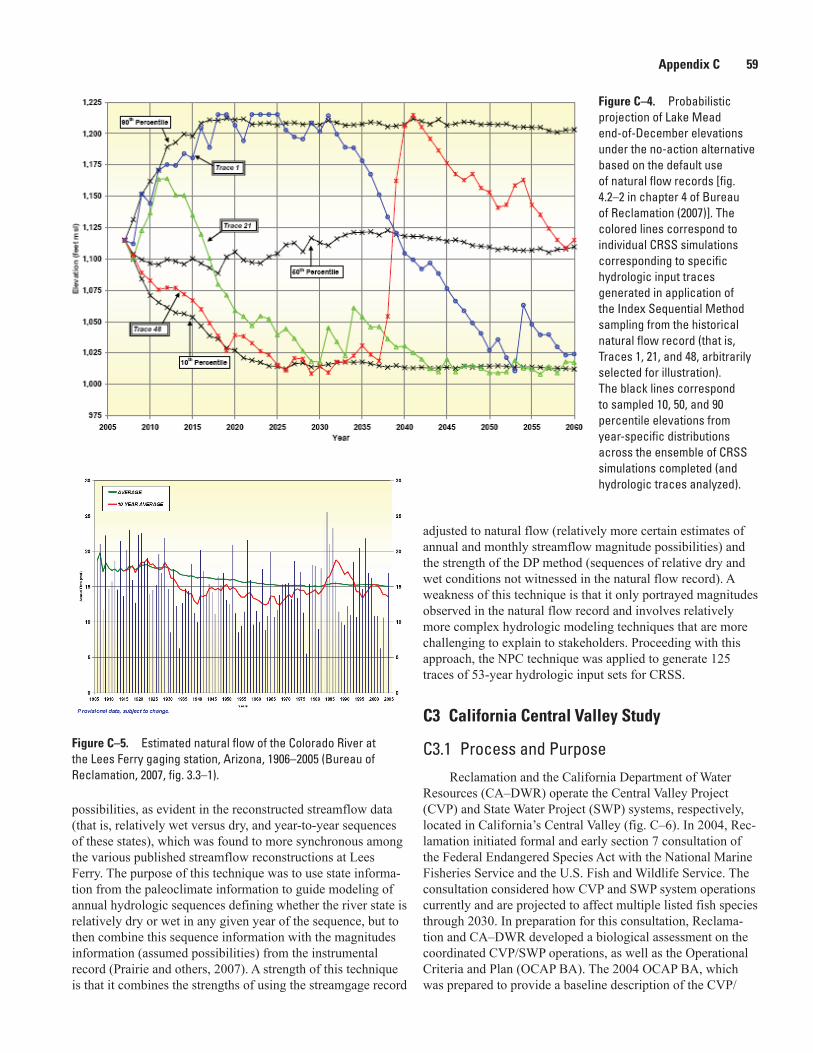
Figure C–4. Probabilistic projection of Lake Mead end-of-December elevations under the no-action alternative based on the default use of natural flow records [fig. 4.2–2 in chapter 4 of Bureau of Reclamation (2007)]. The colored lines correspond to individual CRSS simulations corresponding to specific hydrologic input traces generated in application of the Index Sequential Method sampling from the historical natural flow record (that is, Traces 1, 21, and 48, arbitrarily selected for illustration). The black lines correspond to sampled 10, 50, and 90 percentile elevations from year-specific distributions across the ensemble of CRSS simulations completed (and hydrologic traces analyzed).
Figure C–5. Estimated natural flow of the Colorado River at the Lees Ferry gaging station, Arizona, 1906–2005 (Bureau of Reclamation, 2007, fig. 3.3–1).
possibilities, as evident in the reconstructed streamflow data (that is, relatively wet versus dry, and year-to-year sequences of these states), which was found to more synchronous among the various published streamflow reconstructions at Lees Ferry. The purpose of this technique was to use state informa-tion from the paleoclimate information to guide modeling of annual hydrologic sequences defining whether the river state is relatively dry or wet in any given year of the sequence, but to then combine this sequence information with the magnitudes information (assumed possibilities) from the instrumental record (Prairie and others, 2007). A strength of this technique is that it combines the strengths of using the streamgage record
adjusted to natural flow (relatively more certain estimates of annual and monthly streamflow magnitude possibilities) and the strength of the DP method (sequences of relative dry and wet conditions not witnessed in the natural flow record). A weakness of this technique is that it only portrayed magnitudes observed in the natural flow record and involves relatively more complex hydrologic modeling techniques that are more challenging to explain to stakeholders. Proceeding with this approach, the NPC technique was applied to generate 12� traces of �3-year hydrologic input sets for CRSS.
C3 California Central Valley Study
C3.1 Process and PurposeReclamation and the California Department of Water
Resources (CA–DWR) operate the Central Valley Project (CVP) and State Water Project (SWP) systems, respectively, located in California’s Central Valley (fig. C–6). In 2004, Rec-lamation initiated formal and early section 7 consultation of the Federal Endangered Species Act with the National Marine Fisheries Service and the U.S. Fish and Wildlife Service. The consultation considered how CVP and SWP system operations currently and are projected to affect multiple listed fish species through 2030. In preparation for this consultation, Reclama-tion and CA–DWR developed a biological assessment on the coordinated CVP/SWP operations, as well as the Operational Criteria and Plan (OCAP BA). The 2004 OCAP BA, which was prepared to provide a baseline description of the CVP/
Appendix C 5�

SWP facilities and operating environment, identified the many factors influencing the physical and institutional conditions and decisionmaking process under which the projects then currently operated.
Subsequent to their release, the 2004 OCAP BA and asso-ciated biological opinions were challenged on several fronts, one of which was failure to consider the potential effects of climate change on the operating environment during the con-sultation horizon. A 2008 OCAP BA has been developed, with both instrumental record and projected climate information factored into the BA development. The report addressed how climate change might affect tributary streamflows and water temperatures, sea-level rise effects on the delta environment, and dependent operations during the consultation horizon.
Several levels of climate analysis were considered: Qualitative discussion of implications of climate change for future CVP and SWP operations.
Quantitative sensitivity analysis of implications for future CVP and SWP operations under a range of potential climates circa 2030 in order to illustrate the how the OCAP future operational baseline is sensitive to the future climate assumption.
Quantitative depiction of the OCAP future operational baseline with a more resolved probability distribution estimated for future climate circa 2030 and translated into associated changes in water supply, demand, and operational constraint assumptions.
The first approach was ruled out in favor of one of the quantitative approaches, given that regional climate projection
•
•
•
information was available and that a consultation horizon of 2030 (that is, greater than 20 years) would span a period where climate change and hydrologic impacts could be detected and assessed (Intergovernmental Panel on Climate Change, 2007; see climate and climate change period descriptions in section 1). Given the uncertainties associated with estimating climate change probability distributions, the second approach was cho-sen (“sensitivity analysis”) with the objective of illustrating how the OCAP BA’s future depiction of CVP/SWP operation is sensitive to a range of regional climate and sea level possi-bilities by the consultation horizon (that is, 2030) as indicated by projections available for each condition
C3.2 Role of Climate InformationThe future baseline depiction of CVP/SWP operations
depends on several climate-related assumptions, including water supplies, water demands, and operational constraints. In the default analysis, these assumptions are based on hydro-climate observations from the instrumental record, reflected by hydrologic observations and impairment information from 1922 to 2003. System water demands are evaluated relative to scenario climate and land cover conditions. These supply and demand assumptions are compatible if the view is held that climate of the instrumental record (underlying supply assump-tions) is still applicable to the future planning horizon and that the scenario definition underlying demand assumptions is applicable to the future planning horizon.
In this study the hydroclimatic sequencing and relative variability aspects of the instrumental record were preserved (for example, relative severity and timing of droughts). However, this full-period sequence was adjusted in the mean to reflect mean monthly natural runoff responses to regional climate change possibilities by the early twenty-first century relative to the late twentieth century.12 Further, the effects of coincidental sea-level rise on delta conditions were related to operations analyses (for example, they were allowed to affect the modeled delta salinity conditions constraining upstream release objectives to satisfy delta water quality or cross-delta water conveyance objectives).
To bracket ranges of temperature and precipitation change possibilities, four regional climate change scenarios were defined to represent a change range by roughly 2030, similar to the bracketing approach used in IJC (2006) but
12On the matter of relating regional climate change possibilities to water-supply assumptions, the study considered climate projection information developed for the IPCC Fourth Assessment (Intergovernmental Panel on Cli-mate Change, 2007) that had been statistically downscaled to basin-relevant resolution (that is, the Web archive “Statistically Downscaled WCRP CMIP3 Climate Projections” at http://gdo-dcp.ucllnl.org/downscaled_cmip3_projec-tions). The 112 climate projections included in this archive were considered to be equally plausible projections of the future, given available literature suggesting difficulty in culling projections based on model skill (Reichler and Kim, 2008; Brekke and others, 2008; Gleckler and others, 2008) and given studies showing that regional climate projection uncertainty may not be sig-nificantly reduced even if projection sets are restricted to only include those from skill-based “better models” (Brekke and others, 2008).
Figure C–6. California Central Valley Project and State Water Project service areas.
60 Climate Change and Water Resources Management: A Federal Perspective

surveying a larger collection of downscaled contemporary projections from the web archive mentioned above. The four climate projections were selected for how their paired pre-cipitation–temperature changes spanned projected climate possibilities, given four selection factors:
Choice of historical and future periods for assessing climate changes,
Metric of climate change,
Location of climate change, and
Change-range of interest in both projected conditions (dependent on periods, metric, and location).
In this study, the choices for the four selection factors were:
1971–2000 and 2011–2040,
Mean-annual temperature and mean-annual precipita-tion during each period given the interest in mean-annual water supply assumptions framing the study,
A central location relative to the combined origins of CVP/SWP surface-water supplies, ultimately selected as upstream from Folsom Lake (fig. C–7), and
The 10th and 90th rank-percentile changes in both pro-jected conditions among the 112 projections surveyed.
•
•
•
•
•
•
•
•
The spread and change range of interest among surveyed climate projections are shown on figure C–8, first indepen-dently for temperature and precipitation changes (upper left and lower right panels) and then for joint changes in both variables (upper right panel). The resultant projection selec-tions are shown on figure C–9. They were chosen because they most closely span the change range of interest (that is, the yellow region on fig. C–9). Qualitatively speaking, the selected projections were viewed to generally encapsulate available regional climate projection information describing 2030 climate possibilities for this study region and to suggest climate changes spanning “less warm” to “more warm” condi-tions and drier to wetter conditions.
On the matter of defining sea-level rise (SLR) possibili-ties for the delta by year 2030, ideally a range of scenarios would have been defined and combined with each operations study specific to the four regional climate change scenarios. However, due to limitations with delta simulation tool avail-ability, only one SLR scenario was selected. The scenario was defined to be consistent with SLR projection informa-tion provided in IPCC (2007) and also by the SLR implied
Figure C–�. “Above Folsom Lake” location (that is, Selection Factor #3) for assessing the spread of mean climate changes among surveyed climate projections in Bureau of Reclamation (2008). Projections data were obtained from the Web archive of “Statistically Downscaled WCRP CMIP3 Climate Projections” (http://gdo-dcp.ucllnl.org/downscaled_cmip3_projections).
Figure C–�. Evaluation of climate projections spread, given the selection factors from Bureau of Reclamation (2008). The upper left and lower right panels, respectively, show distributions of projected changes in mean annual temperature and precipitation across the 112 climate projections surveyed (black “x” symbols are used to show rank projection-specific changes). Change ranges spanning the 10 and 90 percentile changes are indicated on both plots using green lines. The upper right panel shows paired changes in both variables by projection (black circles). It also shows the change region spanned by the intersected 10-to-90 percentile change ranges assessed for each variable (yellow region).
Appendix C 61

using a projection methodology published subsequent to the finalization of IPCC (2007) (Rahmstorf, 2007a, b). The latter approach uses the observed linear relation between rates of change of global surface air temperature and sea level, along with projected changes in global surface air temperature, to predict the future SLR. To some degree, this approach accounts for the effects of ice melt in potential SLR, which was understood to not be fully or well represented in the climate simulations referenced in IPCC (2007). Further, it was understood that sea level data associated with direct CMIP3 output on SLR are potentially unreliable due to datum issues with sea-surface elevations.
Given scenarios for both regional climate change and sea-level rise, scenario-impacts assessment followed. Regional climate changes were translated into natural hydrologic response (that is, changes in surface-water runoff), which were subsequently related to CVP/SWP reservoir inflows. Next, the operations analysis was conducted based on hydrology repre-senting the four regional climate scenarios and was matched with the scenario-adjusted delta representation corresponding to the SLR scenario. Results from these analyses were used to indicate the sensitivity of CVP/SWP operations to climate (for example, mean annual water deliveries, carryover storage volumes) and also the sensitivity of dependent conditions to climate (that is, delta flows and velocities, reservoir and river water temperatures).
Note that CVP/SWP water demands were not modified with respect to regional climate change. This approach was based on the assumption that district-level demand-manage-ment flexibility existed for both CVP and SWP water contrac-tors (for example, shifts in cropping choices, irrigation tech-nology), enough so that district-level water demands would not necessarily have to change even though crop-specific water needs might be predictable relative to climate change.
C4 References Cited
Brekke, L.D., Dettinger, M.D., Maurer, E.P., and Anderson, M., 2008, Significance of model credibility in estimating climate projection distributions for regional hydroclimato-logical risk assessments: Climatic Change, v. 89, no. 3–4, p. 371–394. Available at http://www.springerlink.com/content/1586u015g87v8754/.
Bureau of Reclamation, 2007, Analysis of hydrologic variabil-ity sensitivity, Appendix N in Final EIS—Colorado River interim guidelines for lower basin shortages and coordi-nated operations for Lake Powell and Lake Mead: Bureau of Reclamation, U.S. Department of the Interior.
Bureau of Reclamation, 2008, Sensitivity of future CVP/SWP operations to potential climate change and associated sea level rise, Appendix R in CVP/SWP OCAP Biological Assessment: Bureau of Reclamation, U.S. Department of the Interior.
Gleckler, P.J., Taylor, K.E., and Doutriaux, C., 2008, Perfor-mance metrics for climate models, Journal of Geophysical Research, v. 113, D06104, doi:10.1029/2007JD008972.
Hidalgo, H.G., Piechota, T.C., and Dracup, J.A., 2000, Alter-native principal components regression procedures for den-drohydrologic reconstructions, Water Resources Research, v. 36, no. 11, p. 3241–3249.
International Joint Commission, 2006, Options for manag-ing Lake Ontario and St. Lawrence River water levels and flows: Report to the International Joint Commission, prepared by the International Lake Ontario—St. Lawrence River Study Board.
Intergovernmental Panel on Climate Change, 2001, Climate change 2001: The Scientific Basis, Cambridge University Press, 881 p.
Intergovernmental Panel on Climate Change, 2007, Climate change 2007—The physical science basis. Contribution of Working Group I to the Fourth Assessment Report of the Intergovernmental Panel on Climate Change, Solomon, S., Qin, D., Manning, M., Chen, Z., Marquis, M., Averyt, K.B., Tignor, M., and Miller, H.L., eds.: Cambridge, United Kingdom, Cambridge University Press. Available at http://www.ipcc.ch/ipccreports/ar4-wg1.htm.
Figure C–�. Selected climate projections (green diamonds) for framing the climate change sensitivity analysis in Bureau of Reclamation (2008). The selected projections were selected for how they encapsulate the spread of potential climate changes from 112 climate projections (fig.C–8) assessed relative to the four selection factor choices made for this study
62 Climate Change and Water Resources Management: A Federal Perspective

Meko, D.M, Woodhouse, C.A., Baisan, C.A., Knight, T., Lukas, J.J., Hughes, M.K., and Salzer, M.W., 2007, Medi-eval drought in the Upper Colorado River Basin: Geophysi-cal Research Letters, v. 34, p. L1070�.
Mortsch, L.D., Alden, M., Klaassen, J., 200�, Development of Climate Change Scenarios for Impact and Adaptation Stud-ies in the Great Lakes – St. Lawrence Basin, report prepared for the International Joint Commission—International Lake Ontario St. Lawrence River Study Board, 29 p.
Prairie, J., Rajagopalan, B., Lall, U., and Fulp, T., 2007, A stochastic nonparametric technique for space-time disag-
gregation of streamflows: Water Resources Research, v. 43, p. W03432.
Rahmstorf, S., 2007a, A semi-empirical approach to projecting future sea-level rise: Science, v. 31�, p. 368–370.
Rahmstorf, S., 2007b, Response to comments on “A Semi-Empirical Approach to Projecting Future Sea-Level Rise”: Science, v. 317, p. 1866d.
Reichler, T., and Kim, J., 2008, How Well Do Coupled Mod-els Simulate Today’s Climate?, Bulletin of the American Meteorological Society, v. 89, no. 3, p. 303–311.
Appendix C 63


Appendix D. Glossary[This glossary provides definitions for terms specific to climate change or water resources management, as they are used in this report.]
Abrupt climate change, sometimes called rapid climate change, results from the nonlinearity of the climate system, which may lead to abrupt events. The term “abrupt” often refers to time scales faster than the typical time scale of the responsible forcing (Intergovernmental Panel on Climate Change, 2007a).Climate in a narrow sense is usually defined as the average weather, or more rigorously, as the statistical description in terms of the mean and variability of relevant quantities over a period of time ranging from months to thousands or millions of years (Intergovernmental Panel on Climate Change, 2007a).Climate change refers to a change in the state of the climate that can be identified (for example, by using statistical tests) by changes in the mean and (or) the variability of its properties and that persists for an extended period, typically decades or longer. Climate change may be due to natural internal processes or external forcings or to persistent anthropogenic changes in the composition of the atmosphere or in land use (Intergovernmental Panel on Climate Change, 2007a).Climate variability refers to variations in the mean state and other statistics (such as standard deviations, the occurrence of extremes, and so forth) of the climate on all spatial and temporal scales beyond that of individual weather events (Intergovernmental Panel on Climate Change, 2007a).Operations is used in this report to refer generally to water resources operations. The term “reservoir regulation” is used to clarify operations related to dams and reservoirs. The term
“gate operations” is used specifically to reference the opening and closing of dam or reservoir gates.
Sea-level change is an increase or decrease in the mean level of the ocean. Sea level can change globally because of changes in the shape of the ocean basins, changes in the total mass of water, and changes in water density. Sea-level changes induced by changes in water density are called “steric.” Density changes induced by temperature changes only are called “thermosteric,” while density changes induced by salinity changes are called “halosteric” (Intergovernmental Panel on Climate Change, 2007b). Eustatic sea-level change is a change in the global average sea level brought about by an increase in the volume of the world ocean. Relative sea-level rise occurs where there is a local increase in the level of the ocean relative to the land, which might be due to ocean rise and (or) land subsidence. In areas subject to rapid land uplift, the relative sea level can fall (Intergovernmental Panel on Climate Change, 2007b).
Stationarity is the idea that while climate may exhibit variability, the underlying statistics that describe the climate (such as its mean and variance) do not change over time. Rather, these characteristics are stationary. This leads to an assumption that the past represents a reasonable proxy for the future. Water resource managers have traditionally relied on this assumption by using historical records of streamflow and weather variation to design and operate water resource systems. However, the assumption of stationarity is challenged by climate change, as well as by other changes to hydrologic systems, such as alterations of land use.
Appendix D 65

Manuscript approved for publication December 17, 2008.Prepared by the Reston Publishing Service Center.Edited by Marilyn A. Billone.Photocomposition by Anna N. Glover.For more information concerning this report, please contact Julie E. Kiang, U.S. Geological Survey, 415 National Center, Reston, VA 20192, [email protected].

Brekke and others—Clim
ate Change and Water Resources M
anagement: A
Federal Perspective—Circular 1331
U.S. Department of the InteriorU.S. Geological Survey
Circular 1331
Climate Change and Water Resources Management: A Federal Perspective
US Army Corpsof Engineers®