federal perspective report 2016
TRANSCRIPT
New priorities change the federal real estate landscape
Federal Perspective ReportUnited States • 2016

Welcome to the JLL GIS 2016 Federal Perspective
As the General Services Administration and user agencies continue to face pressure to reduce the federal footprint, the government is beginning to adapt to the concept of space reduction. While the number of executed leases incorporating square footage reduction increases, the GSA is slowly relinquishing the use of short-term extensions as a delay tactic. However, as with everything within the Federal Government, change comes slowly and the effects of these dynamics are still being played out across the country. Whether confronted with the possibility of a tenant relocation due to high space reconfiguration costs or the uncertainties presented by short-term extensions, owners and investors of federal real estate are struggling to find equilibrium within the volatility of today’s market.
The following pages outline our analysis of the current state of federal real estate. The 2016 Federal Perspective is divided into three parts: an overview of the political, budgetary and market forces currently at work within federal real estate; an analysis of the major themes shaping federally-leased commercial office space; and lastly, a prediction of the trends that will have significant impact on the market and your assets in 2016.

2016 Federal Perspective Report 3
Table of contents
National overview ................................................................................ 4
Budgetary and spending overview ....................................................... 6
Federal spending ........................................................................... 6
GSA spending ............................................................................... 7
Impacts of the Bipartisan Budget Act of 2015 ................................ 7
Metro DC overview .............................................................................. 8
Major themes in federal leasing ..........................................................10
Incumbents face potential erosion of renewal advantage .............10
Cost is king ― relocation map .....................................................12
Deciphering the decision to renew or relocate .............................14
Space design and teleworking .....................................................16
Flexibility comes at a cost ............................................................18
Major growth driver: cybersecurity .............................................. 20
Top 10 predictions for 2016 ................................................................ 22

4 National overview
National overview
The national economy continued to rebound throughout 2015—annual GDP grew 3.9 percent through the second quarter. After years of decline, federal government employment began to expand, with September 2015 recording an increase of 9,000 jobs year-over-year. Improving fiscal conditions allowed the cumulative U.S. annual deficit to fall to $439 billion in Fiscal Year 2015, a decrease of 8.7 percent from the previous year and the lowest deficit since 2008; the shortfall represents 2.5 percent of the gross domestic, the lowest level since before the economic crisis in 2007. As the Federal Government budget outlays continued to increase, the reduced annual deficit was mainly attributable to the percent increase in receipts.
Gridlock within Congress for the first half of this decade yielded a dramatic pullback in the rate of new federal leasing activity. As unprecedented scrutiny of the General Services Administration (GSA) and bipartisan support for reining in federal real estate expenditures handcuffed government decision- makers, agencies were left uncertain of their future space planning needs and capabilities. For example, NIH announced its master plan to consolidate 10,000 employees from leased space to their Bethesda campus over the next 20 years – however, the plan is entirely contingent on budget funding.
As detailed further in this report, despite the Bipartisan Budget Act of 2015, there is still no long-term clarity on agency budgets – or adequate funding to implement moves, consolidations and reconfigurations – federal tenants have been forced to delay space decisions and execute short-term renewals. With the government targeting utilization rates between 100 and 170 usable square feet per person, GSA tenants have struggled with implementing tactics to achieve
these benchmarks, which often require a costly, complete reconfiguration of the existing space. Other techniques include promoting teleworking, where the percentage of employees that telework on a regular basis increased from 29 percent in 2014 to 31 percent in 2015.
Inaction from 2011 to 2014 resulted in a significant increase in the number of federal leases in holdover. As lawmakers in both parties pushed GSA to avoid holdovers and extensions, GSA, across several different regions, held roundtables highlighting the high cost of current leasing behavior, pushing agency officials to make long-term decisions. In 2015, the ‘bow wave’ of pending GSA lease expirations forced federal officials to address the government’s precarious commercial real estate situation with a greater sense of urgency.
As a result, leasing velocity increased throughout 2015 - GSA renewed, leased or extended over 40 million square feet across the country. Despite the increase in leasing activity, The Office of Management and Budget’s (OMB) ‘freeze-the-footprint’, and subsequent ‘reduce-the-footprint’ mandates continued to leave their mark on the federally-leased real estate portfolio. Many long-term leases executed in involved 2015 included space reduction or reconfiguration to increase utilization. As a result, the total leased inventory decreased approximately 2.1 percent to 193.7 million s.f. between August 2014 and August 2015. Bellwether lease consolidations executed in 2015 include the Department of Justice’s 839,000 square feet lease in Washington, DC and the Transportation Security Administration’s 625,000-square-foot consolidation in Northern Virginia, which each highlighted the potential re-invigoration of the federal leasing landscape. Both leases have target office utilization rates at or below 130 usable square feet per person, highlighting the drive to efficiency for new leases.
National overview

2016 Federal Perspective Report 5
Austerity and congressional scrutiny
Despite the positive swing in leasing activity, there are still a number of political factors presenting challenges to leasing velocity. The renewed focus on government austerity stands in sharp contrast to much of the past decade, when accelerated levels of federal spending and unprecedented expansion of the federal workforce boosted demand for federally leased space. As a sense of “spending fatigue” swept over the nation, belt-tightening within the GSA was seen as a necessary first step to address the rising federal budget deficit. Since little has been done thus far to address the structural issues behind the deficit and mounting federal debt, government-leased real estate remains a prime target for expense reduction.
Executive orders reducing the size of transactions; new mandates requiring offsets of new leases with consolidations or disposals; and stipulations on decreasing the square foot per person suggest that the days of consistently strong federal real estate expansion are over – at least temporarily. Subsequently, congressional appropriators have stringently reviewed large space requirements that require congressional approval, forcing agencies to work to make the space more efficient by reducing the total square footage.
Looking ahead
Although the 2014 elections saw the House and Senate fall into alignment and the government operated under a full budget for Fiscal Year 2015, gridlock persisted on Capitol Hill as the 2016 election cycle loomed. Heading into fiscal year 2016, lawmakers have struggled to come to agreement on long term funding priorities. With almost 30 million square feet of GSA leases rolling in the next 12 months, it has become clear that federal officials must reach a compromise and stop deferring space decisions.
Recent trends in federal leasing activity indicate that pent-up demand is accumulating and leasing velocity should increase in 2016. However, a majority of the long term deals that enter the market will incorporate reductions and result in relocations. Therefore, the rate of actual growth of the federal real estate portfolio is expected to remain flat or even trend downward. Nevertheless, overall reduction of square footage levels the playing field between incumbent locations and challengers as detailed later in this report.
Despite the tempered outlook for the near term, the Federal Government remains a large and stable segment of the nation’s office market. As lawmakers establish a clear and decisive strategy in the years ahead to address the nation’s broader fiscal situation, federal agencies should once again receive the clarity they need to make long-term space decisions. Although uncertainty related to long term spending priorities and agency budgets will likely continue to present headwinds to the market until partisan gridlock has fully passed, market indicators are pointing to a uptick in federal deal flow as the government addresses lingering federal real estate decisions through the remainder of 2015 and into 2016.
GDP
6 Budgetary and spending overview
Spending
DeficitRevenues
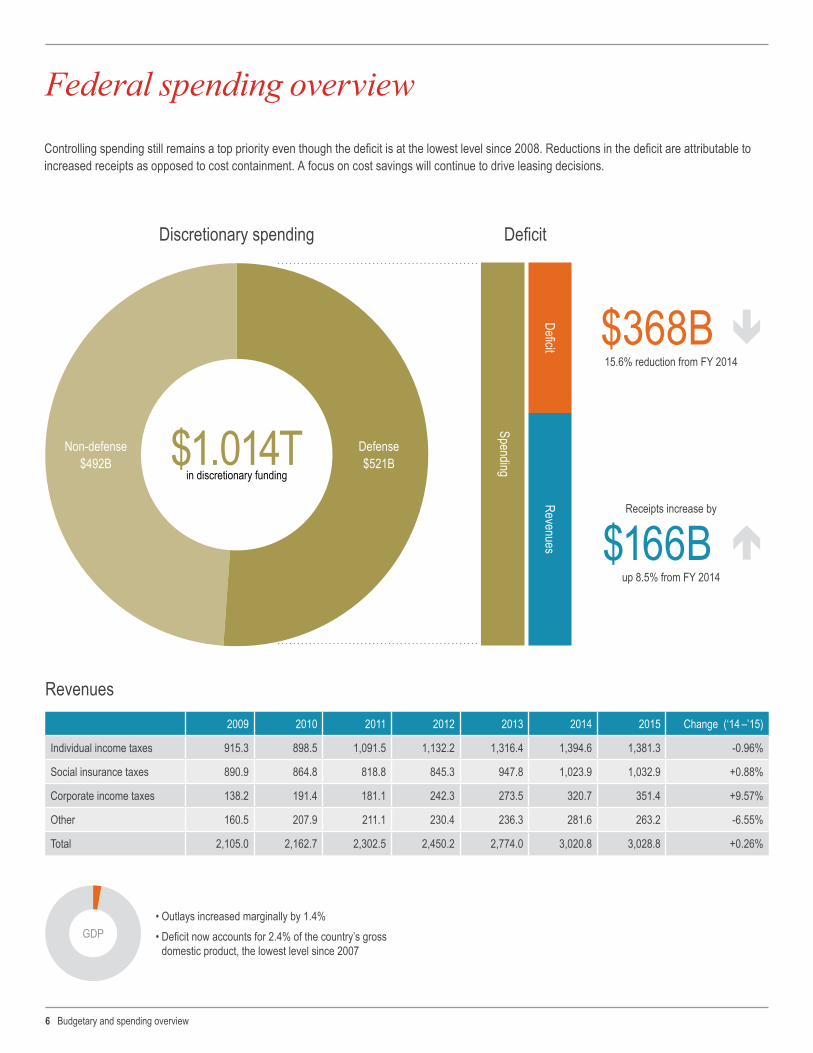
Federal spending overview
• Outlays increased marginally by 1.4% • Deficit now accounts for 2.4% of the country’s gross
domestic product, the lowest level since 2007
Discretionary spending
Revenues
Deficit
Non-defense$492B
Defense$521B
$368B15.6% reduction from FY 2014
$166Bup 8.5% from FY 2014
Receipts increase by
2009 2010 2011 2012 2013 2014 2015 Change (‘14 –’15)
Individual income taxes 915.3 898.5 1,091.5 1,132.2 1,316.4 1,394.6 1,381.3 -0.96%
Social insurance taxes 890.9 864.8 818.8 845.3 947.8 1,023.9 1,032.9 +0.88%
Corporate income taxes 138.2 191.4 181.1 242.3 273.5 320.7 351.4 +9.57%
Other 160.5 207.9 211.1 230.4 236.3 281.6 263.2 -6.55%
Total 2,105.0 2,162.7 2,302.5 2,450.2 2,774.0 3,020.8 3,028.8 +0.26%
$1.014T in discretionary funding
Controlling spending still remains a top priority even though the deficit is at the lowest level since 2008. Reductions in the deficit are attributable to increased receipts as opposed to cost containment. A focus on cost savings will continue to drive leasing decisions.

2016 Federal Perspective Report 7
• The “Bipartisan Budget Act of 2015” removes risk of government default and shutdown by extending federal borrowing authority through March 2017. By suspending the current $18.1 trillion debt limit through this time period, the deal pushes off a debt showdown until after the 2016 elections.
• The Act would raise spending by $80 billion over two years, not including a $32 billion increase included in the Overseas Contingency Operations budget.
• The Overseas Contingency Operations budget is the emergency war fund, but has very limited oversight and has recently been tapped into for other defense spending initiatives such as cybersecurity.
• The increase would be spread over two years (FY 2016 and FY 2017), providing $50 billion of supplement funding in FY 2016 and $30 billion in FY 2017.
• Increased funding would also be spread equally between defense and non-defense.
GSA spending overview
GSA Budget $ (in billions)
Enacted spending limit Rental of space Requested in budget
$10
$8
$6
$4
$2
FY06 FY07 FY08 FY09 FY10 FY11 FY12 FY13 FY14 FY15 FY16$0
The Financial Services and General Government Appropriations Bill for FY 2016 proposed authorizing the GSA to spend $10.4 billion out of the Federal Buildings Fund, a 12.3% increase from the FY 2015 Budget request.
In addition to fully-funding lease obligations, the bill also recommends $200 million for consolidation activities provided the consolidation reduces annual rent, does not exceed $20 million in costs and has a utilization rate of 130 usable square feet per person or less. Funding consolidations could allow agencies to evaluate space needs and make longer term leasing decisions.
Highlights of the Bipartisan Budget Act of 2015

8 Metro DC overview
Metro DC overviewGSA-leased space still represents a large and relatively stable segment of the Metro DC office market. Federal agencies under GSA leasing authority occupy over 50.6 million square feet in the Metro DC region. Of that total, 44.1 percent of GSA occupancy is concentrated in the District of Columbia, while 37.2 percent is concentrated in Northern Virginia and 18.7 percent in Suburban Maryland (see chart at right). Additionally, many federal agencies—particularly those in the intelligence and finance sectors—retain independent leasing authority, which provides another tranche of federally-leased space and enables those groups to pay higher rents and maintain more flexibility than agencies that operate under GSA control.
Comprising approximately 22.0 percent of the region’s overall office market, the federal government exerts a widespread influence over general market conditions in Metro DC.
Given recent GSA leasing tactics, which have emphasized short-term lease extensions, 55.8 percent of all regional GSA leases are set to expire within the next five years (see chart below). The lease expiration pipeline presents both opportunities and challenges to building owners as they aim to recruit and retain tenants. Renewal probabilities have alas shifted dramatically given GSA’s recent push to improve space utilization.
44.1%Washington, DC
18.7%Suburban Maryland
37.1%Northern Virginia
GSAleased spacein Metro DCby market
Market Inventory (s.f.) Share
Washington, DC 22,327,695 44.1%
Northern Virginia 18,783,617 37.1%
Suburban Maryland 9,467,753 18.7%
Metro DC overall 50,629,695 100%
Source: JLL Research
Source: JLL Research, data includes all GSA office leases.
2015 2016 2017 2018 2019 2020 2021 2022 2023 2024 2025 2026 2027 2028 20290
1M
2M
3M
4M
5M
6M
7M
8M
(s.f.)GSA lease expiration pipeline Washington, DC Northern Virginia Suburban Maryland

2016 Federal Perspective Report 9
The submarkets with the largest amount of lease rollover within the next five years include Southwest, Crystal City, Baileys Crossroads, NoMa, Springfield and the Rosslyn-Ballston Corridor (see chart below). These submarkets are well-established government enclaves. The presence of federal agencies acts not just as a source of stability, but also as a key driver of private sector activity, given the fact that many contractors are obligated to occupy space in close proximity to their federal customers.
Recent trends in federal leasing activity appear to indicate that pent-up demand is accumulating and large-scale leasing decisions will occur in upcoming years. Although the volume of signed leases should increase, the rate of growth in the federal government’s overall footprint is expected to remain flat or trend downward due to executive orders stipulating increased space utilization rates. This trend of increased employee density stands to benefit office assets that have been constructed with contemporary design attributes, such as wide column spacing, high ceilings and floor-to-ceiling glass. In keeping with GSA’s preference for newer, more efficient buildings, 98.7 percent of GSA leases in newly constructed assets remained in place at the 10-year mark following the initial lease commencement.
Of the 50.6 million square feet in the Metro DC region under GSA control, approximately 28 million square feet of leases are expected to expire over the next five years, which will present abundant opportunities for developers to seize upon this market potential. GSA’s common stipulation that buildings be
within a walkable half mile of a Metro station stands to benefit more urbanized and transit-oriented developments at the expense of legacy assets in outlying submarkets. Additionally, only 9.0 percent of GSA’s current leased inventory (4.6 million square feet) falls within assets constructed since 2005. The pileup of near-term lease expirations and aging federal inventory presents opportunities for developers in transit-oriented submarkets to obtain commitments as part of agency consolidations or space upgrades.
Source: JLL Research, data includes all GSA office leases over 20,000 s.f. expiring between 2016–2020 as a percentage of overall inventory.
0% 5% 10% 15% 20% 25% 30%
GSA lease expirations as a % of overall market inventory (2016–2020)
Submarket exposure to GSA lease expirations – Five-year horizon
Rock Spring Park
Alexandria
Herndon
Rockville Pike
East End
West End
RB Corridor
Springfield
NoMa
Balleys Crossroads
Crystal City
Southwest
6.4%
7.3%
8.4%
8.5%
9.9%
10.1%
10.7%
10.9%
17.5%
17.9%
21.6%
28%

10 Major themes in federal leasing
Major themes in federal leasing
As mentioned in previous sections, for decades market assumptions supported the supposition that owners/landlords with federal tenants would experience an exceedingly high rate of renewal. According to GSA’s own turnover analysis, in 2010, only 11 percent of every square foot the federal government leased had relocated to another building that fiscal year. In 2011, if a federal tenant leased space in a particular building, the government projected that that tenancy would remain an average of 32.3 years. In the 2012 Federal Perspective, GIS noted that the likelihood of federal tenancy renewal for a first generation lease was 96.9 percent.
In 2013, all of that changed.
On September 10, 2013, GSA announced the relocation lease for the Fish and Wildlife Service (FWS) from Arlington Square in Ballston to 5275 Leesburg Pike in Falls Church. The lease consolidated three expiring leases in the region and was heralded by GSA as saving taxpayers more than $3.8 million dollars annually for the next 15 years. While the new lease decreased the government’s rent by $6 a square foot—a 17 percent reduction—the rental rate was not the most notable aspect. The new lease reduced the agency’s footprint by 72,233 square feet—a utilization rate reduction of 22% usable square feet per person.
Feds focus on space utilization
The FWS lease would be the first of almost a dozen major federal relocations to occur in the DC region since 2013. The accompanying map on pages 12 and 13 outlines these relocations and provides detail. A major component of this wave of relocations can be attributed to a flight to value. Every one of these relocations saves the Federal Government between $2 million to $65 million over the life of the lease. Additionally, many of these deals feature rental rates almost 20 percent below prevailing market rates. The government market has depressed significantly since face rate highs of 2009 and 2010, and is only recently starting to recover. Given the remaining vacant supply in outlying markets such as NoMa, Southeast and Southwest, the desire by owners for large federal tenants remains strong.
Competition for federal tenancy has always been significant in Metro DC—so why the sudden wave of relocations? For the first time in 30 years, the Federal Government has focused on reducing its utilization rate, or usable square feet per employee. Historically, federal employee rank and status was tied to office size and location. Office size was part of the federal incentive and reward package to encourage performance and retention among federal employees. However, as workplace technology and design theories have evolved, large, single offices are increasingly seen as anachronistic and unduly costly. These trends have merged with politics as decreasing the “cost of government" has achieved bipartisan support. One of the few things that Democrats and Republicans can agree upon these days is that the federal government leases too much space.
Incumbents face potential erosion of renewal advantage
0%-5%-10%-15%-20% 5% 10% 15%
Change in total office and warehouse spaceFY 2012 – FY 2014, by agency
General ServicesAdministration
Treasury
Department ofDefense
Social SecurityAdministration
EnvironmentalProtection Agency
Department of theInterior
Department ofCommerce
NASA
Department ofTransportation
Department ofAgriculture
Department ofEnergy
Department ofJustice
Department ofLabor
Homeland Security
Health and HumanServices
Veterans Affairs
Department ofState
Nuclear Regulatory
Net change

2016 Federal Perspective Report 11
Instead of focusing on overall square foot reductions or rental rate cuts, the Federal Government has focused on utilization rate metrics to measure space efficiencies and set reduction targets. When viewed from this perspective, much of the legacy government space currently under lease and approaching expiration is now considered obsolete. The large corridors, spacious executive suites and closed-office footprints historically associated with government tenants are being replaced with open floorplans, benching and communal workspaces. This shift—aided by new mobile productivity technologies and teleworking—is beginning to disrupt the typical renewal process. Incumbents are being forced to reconfigure offered space when competing for the replacement lease of current federal tenants; federal tenants are being forced to account for swing space moves and work interruptions if they renew; GSA is forced to incorporate the costs of in-place renovations and agency downtime in renewal procurements. The costs ascribed to these scenarios is erasing any cost savings from which incumbents benefited in the past federal tenants renewed with little work or space reconfiguration.
In short, incumbent landlords have lost a significant portion of their price advantage in retaining federal tenants.
More relocations to come
It is unlikely that the recent surge of relocations is just a temporary market correction. As explored later in this report, the Federal Government has shifted to open floor plans and streamlined space utilization. It has taken years for the government to get to this point and even in the face of expected internal backlash (there will likely be sporadic reports from unions and employees over the next few years of drops in productivity and work satisfaction), it would take years to readjust the planning that is driving current procurement policy. Rather, it is far more likely that this efficiency trend will continue through the end of the decade and beyond—few large federal leases will be approved outside of the 130-170 usable square feet per person range seen in prospectus documents today.
Exceptions to the rule
As with any policy shift, exceptional circumstances will occur keeping some landlords unaffected by this emerging trend. High-security agencies or agencies with cyber-related missions, for example, preclude teleworking or sharing of desks with other employees. Agencies with expansion requirements, as some cyber-related agencies can expect, may be immune from reduction, as well.
Increasing space utilization is making renewals more difficult Proposed Current Target
400
170
0
50
100
150
200
250
300
350
DOS
DS
NLRB
DOI F
WS
HHS
SAMH
SA
HHS
AHRQ
FINC
EN
DHS
CBP
& NT
C
DOD
ARMY DO
D
VA V
BA &
OIT
DOJ
DHS
OIG
HHS
ACF
DOC
BEA
NIH
NIH
DOJ U
SMS
EOIR
DHS
TSA
DHS
NPPD
FERC
CNCS FB
I
DOJ
HUD
DHS
CBP
& HR
M
DOED
DOS
OBO
& AL
M
US AT
ORNE
YS’
DOJ C
IVIL
BOP
FBI
FCC
EPA
FEC
USAC
E
HHS
DHS
GSA
DOS
DOD
SSA
DOJ
2013 2014 2015 2016Target for 2017
and beyond
150130
150 150 150130

12 Major themes in federal leasing
Cost is king–high profile relocations have highlighted the cost saving achievable
Director of National IntelligenceThis intelligence oversight agency inclusive of a strong cyber component expanded 70,000 s.f. and committed to a 15-year term.
Fish and Wildlife ServiceMajor space reduction and consolidation that started a wave of relocations and the “flight to value” for GSA leasing in the region.
Transportation Security AdministrationLargest deal of 2015 in Northern Virginia with an estimated savings of over $95 million over the 15-year term of the lease.
National Science FoundationNSF’s move from Ballston to Hoffman Town Center was fueled by $65 million in savings over the life of the lease.
US Marshals ServiceReduced by 41,000 s.f. and consolidated several leased locations in Crystal City into one building.
Corporation for National and Community ServiceThis agency saved on estimated $135 per s.f. over 15 years in this move from the CBD to Southwest.
National Labor Relations BoardApproximately 50,000 s.f. reduction and relocation as this agency was forced to move from a CBD location to the outlying Capitol Riverfront area.
Department of JusticeThe wave of consolidation and reductions continues with a deal that included significant concessions that amount to an estimated 20% of the $500 million contract value.
Financial Crimes Enforcement Network15-year firm term renewal inclusive of a 45,000 s.f. reduction in place saves the government $21.2 million over the term.
National Protection and Programs DirectorateThis cyber-related agency executed a 5 year firm term renewal with a space increase at premium rates.
Department of Justice Executive Office for Immigration Review15 year renewal with significant incentives bringing the net effective rate to sub-$25 per RSF.
1
2
3
4
5
6
7
8
1
2
3

2016 Federal Perspective Report 13
Renewal ShrinkRelocation Expand

14 Major themes in federal leasing
Deciphering the decision to renew or relocate
The combination of the ‘freeze-the-footprint’ initiative and increased pressure to reduce costs has complicated the traditional end-of-lease behavior to renew. The decision to renew or relocate is now driven by factors such as utilization, timing, major consolidations and in-place infrastructure. The following chart details the rationale and competing forces behind the government’s ultimate decision to “stay or go” upon lease expiration of any major government deal.
Renew Relocate
Utilization rate – s.f. per employeeRecent initiatives to increase the density of worker in government office space has a large impact on the whether a tenant opts to renew or relocate. Significant space reconfiguration is required to increase utilization rates in legacy space, thus diminishing the incumbent’s advantage.
100 to 150 s.f. per person
Over 150 s.f. per person
Degree of specializationLocations with a high-degree of specialization, such as data centers, are expensive and difficult to replicate making it difficult to recover relocation and duplication costs through competition.
High specialization Low specialization
Current rentWith the rents still below peak pricing in many markets, current tenancies located in high-cost submarkets without a solid justification for the location will face pressure to move to more cost-effective solutions.
Lower-rent submarket
High-rent submarket
Competition – scope of the delineated areaThe delineated area for a new lease requirement directly impacts the potential competition, as the area widens more options become available and increasing competition drives rates down.
Small delineated area
Large delineated area
Consolidation and greater space planning If the tenant is part of a greater planned consolidation, short-term extensions are often required as the agency determines its long-term space needs.
Interim actions as long-term planning is completed
Long-term plan and consolidation

2016 Federal Perspective Report 15
FREEZE-THE-FOOTPRINT
ST. ELIZABETH'S
UTILIZATION RATESCONSOLIDATION
LOWEST-COST,TECHNICALLY ACCEPTABLE
CIVILIAN CYBERCAMPUS
What's driving the decision to "stay or go"?

Work is what you do, not where you do it.
16 Major themes in federal leasing
Achieving new target utilization rates
For the past several decades the General Services Administration (GSA) has led the government in rethinking the way that the Federal Government utilizes office space. From the dimly lit, closed, inefficient and dated offices of yesterday’s government to the bright, open layouts and alternative work strategies of today, GSA has changed the way that federal users interacts with workspaces; and in the process, altered the way private sector landlords view leasing space to the government.
In June 2010, President Obama issued a memorandum directing federal agencies to generate $3 billion in cost savings by 2012 through space consolidation and the disposal of excess real property. Since that declaration, which was solidified with the 2013 “freeze-the-footprint” mandate, GSA and its federal agency customers have been pushing to reduce the federal real property portfolio, all while operating under Continuing Resolutions (CRs) and budget uncertainty. Since the presidential directives in 2013 to “freeze-the-footprint” and 2015 to “reduce-the-footprint,” federal agencies achieved a 21.4 million square feet reduction in office space. In FY 2014 alone, the government disposed of 7,350 unutilized or underutilized buildings thereby eliminating 47 million square feet of overall space.
Big offices
— President Barack Obama

2016 Federal Perspective Report 17
Alternative work strategies and teleworkingNew and innovative workplace designs that are able to increase space utilization, and therefore reduce real estate costs, are becoming increasingly important to the Federal Government. New GSA space is designed with more unassigned workspaces, smaller cubicles with lower partitions, more central meeting spaces and common areas, and activity-based work environments. By assigning significantly more employees to a site than available workspaces (made possible by teleworking and Alternative Work Strategies), GSA has been able to significantly reduce the replacement lease size upon lease expiration. In practical terms, whereas historically Federal Government tenants have consistently renewed in place upon lease expiration, the size of every lease in the government’s portfolio now comes under strict scrutiny upon expiration.
Rising presence of teleworking in the Federal GovernmentImplementing alternative work strategies, including telework, hoteling stations and desk sharing, is a major trend in today’s real estate marketplace, and offer organizations flexibility and optimal workspace usage. Increasingly, federal employees are working on the go – working at home, regional offices, or with federal partners located across town or across the globe. Following the Telework Enhancement Act of 2010, there has been a significant shift towards a more mobile workforce, impacting the office workplace and the overall office workspace strategy. Conducting head-down work at one’s desk is no longer the primary way of working, in the both public and private sectors.
Then
Conference rooms Conference rooms
Private officesPrivate offices
Assigned workstations
Assigned workstations
Team roomsFocus rooms
Hoteling spaces
Informal meeting rooms
Now
Reduced space
Newspacetypes
Between 2009 and FY 2013 (the most recent data available) the number of teleworkers has
increased 164%, exceeding 300,000 federal workers.
164%

18 Major themes in federal leasing
One of the most significant challenges facing GSA—particularly in the National Capital Region—is the high volume of leases expiring over the next 3–5 years and the tendency of GSA in recent years to delay leasing decisions by executing short-term lease extensions or allowing leased to fall into holdover. GSA has taken steps to reduce the number of leases in holdover; however, short-term leasing activity has increased.
Short-term leasing activity benefits the Federal Government by preserving flexibility. The GSA’s tendency to rely on these stop gap leasing measures in the absence of long term solutions was highlighted in a recent Government Accountability Office (GAO) report that proclaimed a total of 54 percent of GSA leases set to expire between FY 2012 and 2014 experienced either a holdover or short term extension. In light of implementing the ‘freeze-the-footprint’ initiative and larger consolidations, short-term leasing gives the government flexibility by not requiring a long-term commitment.
Long-term leases create substantial value for owners, especially in a low-interest rate environment which allows landlords to aggressively compete for long-term deals. Based on empirical data, federal agencies pay a premium for short-term transactions of 33.1 percent above and beyond longer-term deals across GSA’s national portfolio as a result of owners factoring this risk premium into their pricing strategies. When comparing short-term extensions versus renewals, tenant improvement packages range from zero dollars per square foot for short term extensions to $50.00/usable square feet or more for long-term replacement leases. This trend has continued despite the fact that longer terms would provide lower rental rates and incentivize landlords to give concessions such as free rent and additional tenant improvements.
Not all short-term leasing activity is the same. Fitting between the 18-months to 3-year commitment for extensions and the 10–15 years of firm term for long-term deals, GSA has started requesting and executing short-term renewals. Short-term renewals typically have approximately five years of firm term with some amount of soft term. This leasing strategy creates the appearance of longer-term deals while preserving flexibility in light of future space needs or consolidation. For example, both DHS and FBI are undergoing major headquarter consolidations in the Washington Metro area. Although both projects are behind schedule, the agencies continue request lease terms that provide cancellation rights after five years.
Although long-term commitments can offer substantial savings, with unclear budget priorities, the government has consistently demonstrated that it values the flexibility afforded by short-term deals. With the intense price competition for long-term deals, short-term leasing provides incumbent locations with benefit of preserving effective rents with minimal capital investment.
Flexibility comes at a cost
54% of leases expiring between 2012–2014 involved holdoverand/or extension
46%No holdover or extension
(1,264)
54%Holdover and/or extension
(1,455)
Source: GAO analysis of GSA data. GAO-15-741
Holdover(281)
Holdover andextension(364)
Extension (810)
25%
56%
19%

2016 Federal Perspective Report 19
Short-term lease extensions provide premium rates
Source: JLL, GSA.gov, "Renewal" as labeled in GSA's Lease Inventory database
Source: JLL, GSA.gov, "Renewal" as labeled in GSA's Lease Inventory database
Source: JLL, GSA.gov, "Renewal" as labeled in GSA's Lease Inventory database
Weighted rent difference for extensions vs. renewals — National Capital RegionExtension (terms shorter than or equal to 3 years)
09/11 11/11 03/12 07/12 11/12 03/13 07/13 11/13 03/14 07/14 11/14 03/15 07/15
$20
$25
$30
$35
$40
$45
$50
$55
Renewal (terms longer than 3 years)
$42.51
$37.10$39.66
$31.55 $30.57 $31.53
Weighted rent difference for extensions vs. renewals — DCExtension (terms shorter than or equal to 3 years)
09/11 11/11 03/12 07/12 11/12 03/13 07/13 11/13 03/14 07/14 11/14 03/15 07/15
$20
$25
$30
$35
$40
$45
$50
$55
Renewal (terms longer than 3 years)
$47.64
$53.08
$47.92
$40.80$37.84 $37.18
Weighted rent difference for extensions vs. renewals — NationalExtension (terms shorter than or equal to 3 years)
09/11 11/11 03/12 07/12 11/12 03/13 07/13 11/13 03/14 07/14 11/14 03/15 07/15
$20
$25
$30
$35
$40
$45
$50
$55
Renewal (terms longer than 3 years)
$33.53$30.58 $29.35
$25.15$26.07 $25.20

20 Major themes in federal leasing
The global cybersecurity market is currently worth over $107 billion and is expected to grow to over $170 billion by 2020—an annual growth rate of almost 10 percent. The effects such a rate of growth upon the U.S. economy should be meaningful and, potentially, transformative. With over $32 billion spent in the past decade and billions more planned for decades to come, cybersecurity will renew federal leasing velocity in ways not seen since the stimulus package of 2009.
Cybersecurity, cyberwarfare and the ripple effects of cyber focused growth spending will be felt all over the Washington region and around the country. This new type of threat requires a new and creative response. As it has done so many times in the past when prevailed upon to respond to ever evolving threats and enemies, the U.S. Government has responded with vigor, ingenuity, and, most importantly, money. This response is still in its gestation period but the net result is typically federal: new agencies, increased funding, increased collaboration, increased scrutiny and a search for innovation.
For owners and investors of federally leased assets, the implications are broad. Owners should expect that cyber growth will be nationwide though with a disproportionate amount occurring in the Washington Metro Area. Moreover, owners should expect less reduction and higher renewal rates from tenants connected with cyber security. This high degree of as-is renewal is due to myriad reasons - from the strength of the mission funding, the bipartisan growth consensus, and the likelihood of specialized space that is expensive to replicate in another facility.
Another, equally powerful force driving cyber tenant renewal rates for tenants engaged in the civilian cyber realm (FBI, DHS, Secret Service) is the government’s belief in the potential for consolidation onto the “Civilian Cyber Campus” within the next several years. In the FY2015 “CRomibus” federal spending bill, GSA was allocated $35 million for designing and beginning development preparations for a new federally-owned campus that will “house federal employees and contractors dedicated to the civilian cyber security mission.” This earmark was the first mention of the civilian cyber campus in federal law. Since then, the civilian cyber campus has been a topic highly discussed in the media and is surrounded by intense speculation. Similar to the effect that the St. Elizabeths DHS Campus Consolidation and FBI Headquarters consolidations have had on the leasing behavior of those 2 agencies over the past several years (driving a series of “as-is” short term extension and de facto sole source renewals), user agencies that are part of the Civilian Cyber Campus housing plan will most likely remain in place over the short term.
For more information on cybersecurity and the potential effects it will have on the local and national federal leasing markets see GIS’ cyber security report entitled: “Defining Cybersecurity”
Major growth driver: cybersecurity

2016 Federal Perspective Report 21
Cyber growth catalystsFour major agencies are mandated and funded by Congress to protect the homeland and roll out new programs to other agencies. These agencies will continue to lead federal growth and expansion over the next decade.
Mililtary Civilian

22 Top 10 predictions for 2016
Top 10 predictions for federal real estate in 2016
1
2
3
4
5
6
7
8
9
10
GSA will become more comfortable operationalizing federally-imposed reduction mandates.
The market will see an increase in the number of large-scale tenant relocations as utilization rate compression and reconfigurations erode incumbent advantages in renewal negotiations.
Agencies in expensive CBD locations will relocate to outlying submarkets as incumbent landlords can't or won't meet the market for long term renewals.
GSA will continue to rely on short-term extensions to provide a stopgap solution as GSA and tenant agencies finalize consolidation or reduction plans.
Short-term extensions will garner a significant premium in rental rate and reduced tenant concessions when compared to long term lease commitments.
Across the country, relocation into federally-owned buildings will continue to be a primary focus of the government as a way reduce the footprint.
Agencies scheduled to move into federal consolidations such as St. Elizabeth's, the new FBI Headquarters or the Civilian Cyber Campus will not sign long-term leases regardless of the feasibility of the completion schedules of the projects.
Cybersecurity is an opportunity for growth and expansion both in the DC region and nationally within all agencies, but particularly within agencies with cyber related missions.
Agencies with cyber-related missions will be immune from the greater trend of space reduction.
The approaching 2016 election will delay decision making and stall any significant legislation that could lead to growth.
In today’s environment, owners and investors of federally leased real estate find themselves inundated with new challenges and risks. When contemplating any action involving a federally-leased asset—whether it is leasing, sales, acquisitions, or financing—it takes multi-disciplinary, specialized brokerage advisory services to translate the information, protect clients’ investments and find opportunities to create value. JLL’s GIS team is the premier provider of services at every stage of the life cycle of a federally-leased asset.
The Government Investor Services team at JLL is the premier provider for comprehensive federal real estate advisory
services. Combining deep market experience and political tradecraft with superior research and financial analysis, we
create certainty for our clients—driving value and confidence in an increasingly complex federal marketplace.
JLL Government Investor Services

jll.com/gis
About JLLJLL (NYSE: JLL) is a professional services and investment management firm offering specialized real estate services to clients seeking increased value by owning, occupying and investing in real estate. A Fortune 500 company with annual fee revenue of $4.7 billion and gross revenue of $5.4 billion, JLL has more than 230 corporate offices, operates in 80 countries and has a global workforce of approximately 58,000. On behalf of its clients, the firm provides management and real estate outsourcing services for a property portfolio of 3.4 billion s.f., or 316 million square meters, and completed $118 billion in sales, acquisitions and finance transactions in 2014. Its investment management business, LaSalle Investment Management, has $56.0 billion of real estate assets under management. JLL is the brand name, and a registered trademark, of Jones Lang LaSalle Incorporated. For further information, visit www.jll.com.
About JLL Government Investor ServicesThe Government Investor Services team at Jones Lang LaSalle is the premier provider for comprehensive federal real estate advisory services. Combining deep market experience and political tradecraft with superior research and financial analysis, we create certainty for our clients—driving value and confidence in an increasingly complex federal marketplace.
About JLL ResearchJLL’s research team delivers intelligence, analysis and insight through market-leading reports and services that illuminate today’s commercial real estate dynamics and identify tomorrow’s challenges and opportunities. Our 400 professional researchers track and analyze economic and property trends and forecast future conditions in over 60 countries, producing unrivalled local and global perspectives. Our research and expertise, fueled by real-time information and innovative thinking around the world, creates a competitive advantage for our clients and drives successful strategies and optimal real estate decisions.
Contact information
Government Investor Services Research
©2015 Jones Lang LaSalle IP, Inc. All rights reserved. No part of this publication may be reproduced by any means, whether graphically, electronically, mechanically or otherwise howsoever, including without limitation photocopying and recording on magnetic tape, or included in any information store and/or retrieval system without prior written permission of Jones Lang LaSalle. The information contained in this document has been compiled from sources believed to be reliable. Jones Lang LaSalle or any of their affiliates accept no liability or responsibility for the accuracy or completeness of the information contained herein and no reliance should be placed on the information contained in this document.
Joseph BrennanManaging Director+1 202 719 5606 [email protected]
Brian SullivanManaging Director+1 202 255 [email protected]
Lucy KitchinSenior Vice President+1 202 719 [email protected]
Art TurowskiSenior Vice President+1 202 719 [email protected]
Brian SaalVice President+1 202 719 [email protected]
Jeff HurvitzAssociate+1 202 719 [email protected]
Colleen HollowoodBrokerage Assistant+1 202 719 [email protected]
Scott HomaSenior Vice President, Mid-Atlantic Research+1 202 719 5732 [email protected]
Jake AndersonAssociate, Capital Markets Government Solutions+1 202 719 [email protected]