climate change water resources.pdf
TRANSCRIPT
7/25/2019 climate change water resources.pdf
http://slidepdf.com/reader/full/climate-change-water-resourcespdf 1/27
Climate change and water resources
Climate change and water resources
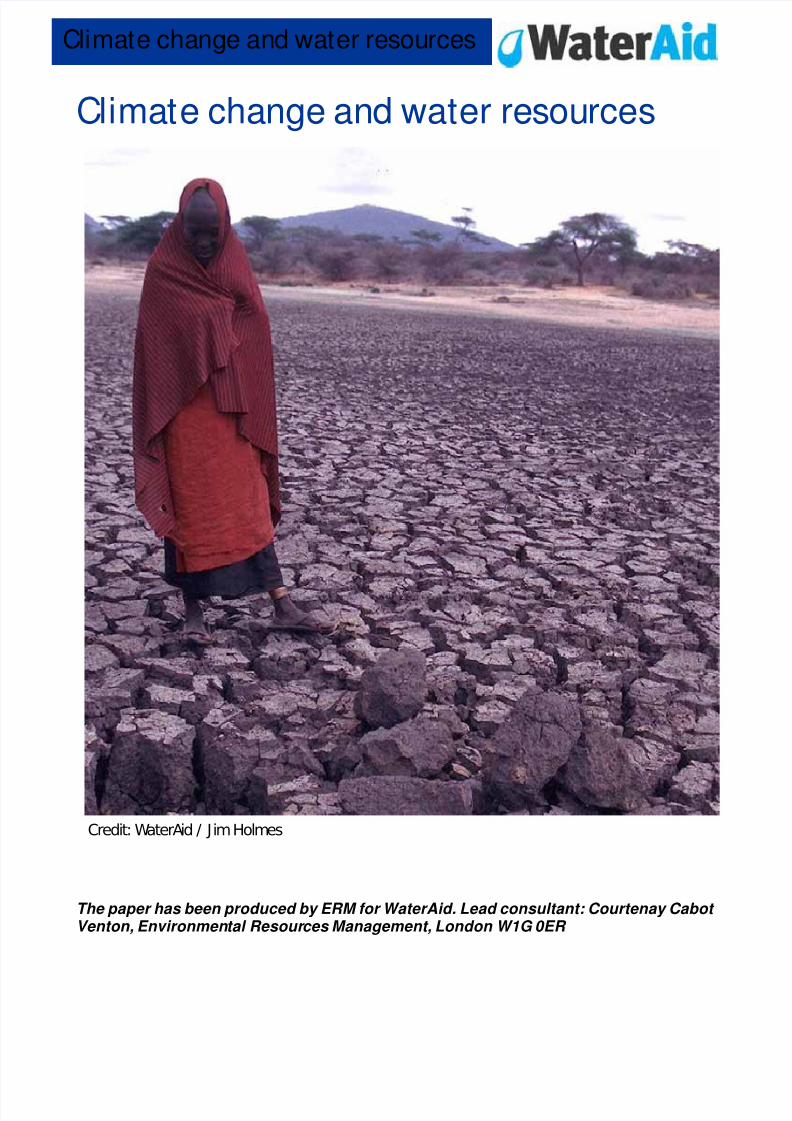
Credit: WaterAid / Jim Holmes
The paper has been produced by ERM for WaterAid. Lead consultant: Courtenay Cabot Venton, Environmental Resources Management, London W1G 0ER

7/25/2019 climate change water resources.pdf
http://slidepdf.com/reader/full/climate-change-water-resourcespdf 2/27
7/25/2019 climate change water resources.pdf
http://slidepdf.com/reader/full/climate-change-water-resourcespdf 3/27
Climate change and water resources
BoxBoxBoxBox 0 00 0 ....1 11 1 The internat ional p The international p The internat ional p The international process on rocess on rocess on rocess on c cc climatelimatelimatelimate c cc change hange hange hange
Climate change is caused by greenhouse gasses (GHGs), which enhance the “greenhouse”properties of the earth’s atmosphere. These gasses allow solar radiation from the sun to travelthrough the atmosphere but prevent the reflected heat from escaping back into space. Thiscauses the earth’s temperature to rise.
GHG emissions have been rising since industrialisation in the 1900s, due to increased burningof fossil fuels. Further significant increases in GHG levels are expected, particularly asdeveloping countries become more industrialised. Based on present trends, the IEA WorldEnergy Outlook predicts a 53 percent increase in global primary energy demand by 2030, with70 percent of that coming from developing countries. As emerging economies, such as Chinaand India, grow their contribution to energy demand will account for an increasing proportion ofthe total. Fossil fuels are expected to dominate this increase, and the subsequent GHGemissions will in turn lead to rising temperatures.
The EU has defined dangerous climate change as an increase in 2 degrees Celsius of averageglobal temperatures. Since 1900, global temperatures have risen by 0.7 degrees Celsius andare continuing to rise at an estimated rate of 0.2 degrees per decade. If left unchecked, this
implies global warming of at least 1.4 degrees Celsius.2
More recent scientific research finds that these temperature projections are actually muchhigher than previously thought. GHG emissions are not remaining stable – they are increasingdue to increased energy consumption as a result of population growth and industrialisation.From a pre-industrial concentration of 280 ppm, the current stock of greenhouse gases in theatmosphere is 430 ppm, and is increasing by approximately 2.5 ppm per year. Even if theworld’s GHG emissions stabilise at 550 ppm, it is estimated that, at a minimum , there is a 63
(2) IPCC, Climate Change 2001: The Scientific Basis
The United Nations Framework Convention on Climate Change (UNFCCC) was convened in 1992with an overarching framework to address the challenges of climate change throughintergovernmental efforts.
The objectives of the UNFCCC are:
1. To stabilise greenhouse gas concentrations to levels that prevent dangerous interference withthe global climate system; and
2. To achieve these reductions within a time frame that allows ecosystems to adapt naturally to
climate change, to ensure that food production is not threatened, and to enable economic
development to proceed in a sustainable manner.
The Kyoto Protocol was developed in 1997 to reinforce the emissions reduction commitments ofthe UNFCCC. The Protocol came into legal force in 2005 when it was ratified by 30 industrialised
nations, creating legally binding targets for a 5 percent reduction in emissions below 1990 levelsby 2012.

7/25/2019 climate change water resources.pdf
http://slidepdf.com/reader/full/climate-change-water-resourcespdf 4/27
percent chance of exceeding the declared ‘dangerous’ limit of 2 degrees Celsius temperature
increase.3
The effects of climate change on temperature are demonstrated by the “Hockey Stick” graph(see Figure 2.1). The graph, which measures temperature variation over the last 1,000 years,
indicates a sharp rise in temperatures post-1900. The graph has been used to illustrate theurgent need for action on reducing GHGs to policymakers.
FigureFigureFigureFigure 0 00 0 ....1 11 1 Hockey Stick g Hockey Stick g Hockey Stick g Hockey Stick graph raph raph raph
1.31.31.31.3 HHHHOW FAST IS CLIMATE COW FAST IS CLIMATE COW FAST IS CLIMATE COW FAST IS CLIMATE CHANGE OHANGE OHANGE OHANGE OCCURRINGCCURRINGCCURRINGCCURRING????
In 2005, the conference “Avoiding Dangerous Climate Change” 4 raised concern that climatechange is occurring more quickly than previously anticipated. Among the key findings of theconference were:
• Future emissions of greenhouse gases will raise temperatures by 1.4 to 5.8 degrees
Celsius during this century.• A change in ocean acidity is likely to reduce the ocean’s capacity to absorb CO2 from the
atmosphere, thus compounding the effects of climate change, and will affect the entiremarine food chain.
• Large-scale, irreversible system disruption and the destabilisation of the Antarctic icesheets are serious risks: changes to polar ice, glaciers and rainfall regimes have alreadyoccurred.
(3) The Stern Review on the Economics of Climate Change, HM Treasury. Available at: http://www.hm-
treasury.gov.uk/independent_reviews/stern_review_economics_climate_change/stern_review_report.cfm.
Chapter 8 (4) Defra, 2005. http://www.defra.gov.uk/environment/climatechange/internat/dangerous-cc.htm

7/25/2019 climate change water resources.pdf
http://slidepdf.com/reader/full/climate-change-water-resourcespdf 5/27
Climate change and water resources
Concerns over the pace of climate change are compounded by two mechanisms – known asnon-linear biophysical changes and positive feedback mechanisms – which could furtheraccelerate the damages caused by climate change.
Non-linear biophysical changes refer to the risk of sudden or extreme climate changes, causedby the physical and biological factors that influence the earth’s climate.
Similarly, climate change can be further accelerated by positive feedback mechanisms. Forexample, at a certain threshold, the ability of the ocean (as highlighted above), as well as soiland plants, to absorb CO2 (currently considered a carbon “sink”) may reduce or even reverse,thus removing an important source of carbon storage. Estimates suggest that by 2100, positivefeedback mechanisms could lead to an additional rise in temperatures 1 – 2 degrees higher
than what is already expected from the direct warming caused by greenhouse gas emissions.5
(5) The Stern Review on the Economics of Climate Change, HM Treasury. Available at: http://www.hm-
treasury.gov.uk/independent_reviews/stern_review_economics_climate_change/stern_review_report.cfm.

7/25/2019 climate change water resources.pdf
http://slidepdf.com/reader/full/climate-change-water-resourcespdf 6/27
2222 WHAT ARE THE PREDICTWHAT ARE THE PREDICTWHAT ARE THE PREDICTWHAT ARE THE PREDICTED IMPACTS OF CLIMATED IMPACTS OF CLIMATED IMPACTS OF CLIMATED IMPACTS OF CLIMATE CHANGE?E CHANGE?E CHANGE?E CHANGE?
2.12.12.12.1 OOOOVERVIEWVERVIEWVERVIEWVERVIEW
Estimates of the predicted impacts of climate change vary, with assessments of future globaltemperatures differing between 1.4 and 5.8 degrees Celsius. However, despite these variances,even the minimum predicted shifts in climate for the 21st century are likely to be significant anddisruptive, while changes at the higher end of the spectrum could be catastrophic.
2.22.22.22.2 T TT THE IMPACTS OF CLIMATHE IMPACTS OF CLIMATHE IMPACTS OF CLIMATHE IMPACTS OF CLIMATE CHANGE ON CRITICALE CHANGE ON CRITICALE CHANGE ON CRITICALE CHANGE ON CRITICAL AAAAREASREASREASREAS
The effects of minor levels of climate change are already being felt, with impacts across manyeconomic sectors. While there will clearly be some gains from climate change (for example,
agriculture in some northern regions should increase in productivity due to a rise intemperatures), most of the impacts will be negative, and gains and losses will not be evenlydistributed. For example:
• Water : Rising global temperatures will lead to an intensification of the hydrological cycle,resulting in dryer dry seasons and wetter rainy seasons, and subsequently heightened
risks of more extreme and frequent floods and drought. Changing climate will also have
significant impacts on the availability of water, as well as the quality and quantity of water
that is available and accessible. Melting glaciers will increase flood risk during the rainy
season, and strongly reduce dry-season water supplies to one-sixth of the World’s
population.
• Agriculture : Declining crop yields are likely to leave hundreds of millions without the
ability to produce or purchase sufficient food supplies, especially in Africa. At mid to highlatitudes, crop yields may increase for low levels of change in temperature, but will
decline at higher levels of temperature change.
• Ecosystems : Changing temperatures will cause ecosystems to shift – forests, land types
and plant species will dieback in some areas as temperatures rise, but increase in other
areas. However, in many cases, the pace of change in temperature may be too fast for
ecosystems to adjust, resulting in the loss of forests and species.
• Health : Higher temperatures expand the range of some dangerous vector-borne diseases,
such as malaria, which already kills one million people annually, most of whom are
children in the developing world. Further, heat waves associated with climate change,
and increases in water borne diseases, will result in increased health problems.
• Coastlines : Melting ice and thermal expansion of oceans are the key factors driving sealevel rise. In addition to exposing coastlines, where the majority of the human population
live, to greater erosion and flooding pressures, rising sea levels will also lead to salt water
contamination of groundwater supplies, threatening the quality and quantity of
7/25/2019 climate change water resources.pdf
http://slidepdf.com/reader/full/climate-change-water-resourcespdf 7/27
Climate change and water resources
freshwater access to large percentages of the population.6 For example, according to
some estimates a 1 metre rise in sea level will displace 80 percent of the population of
Guyana.7
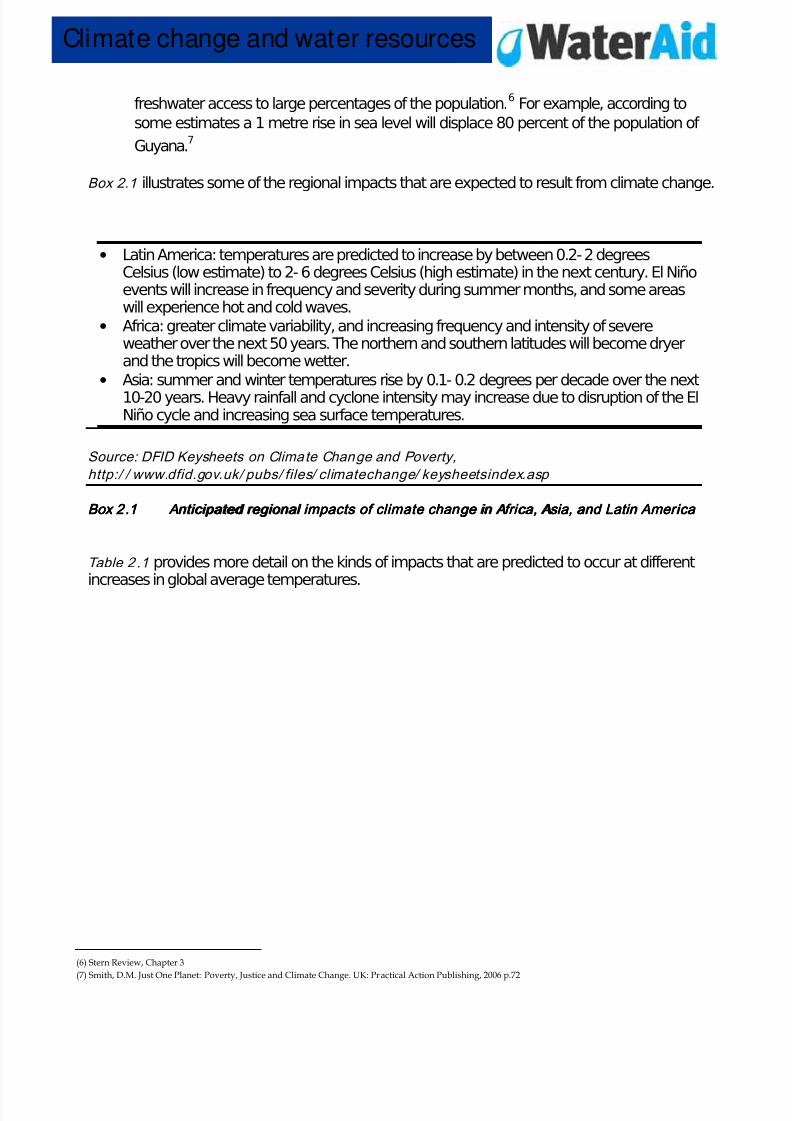
Box 2.1 illustrates some of the regional impacts that are expected to result from climate change.
BoxBoxBoxBox 2 22 2 ....1 11 1 AAAAnticipatednticipatednticipatednticipated regional i regional i regional i regional impacts ofmpacts ofmpacts ofmpacts of c cc climatelimatelimatelimate c cc change in Africa, Asia, and Latin America hange in Africa, Asia, and Latin America hange in Africa , Asia, and Latin America hange in Africa, Asia, and Latin America
Table 2 .1 provides more detail on the kinds of impacts that are predicted to occur at differentincreases in global average temperatures.
(6) Stern Review, Chapter 3 (7) Smith, D.M. Just One Planet: Poverty, Justice and Climate Change. UK: Practical Action Publishing, 2006 p.72
• Latin America: temperatures are predicted to increase by between 0.2- 2 degreesCelsius (low estimate) to 2- 6 degrees Celsius (high estimate) in the next century. El Niñoevents will increase in frequency and severity during summer months, and some areaswill experience hot and cold waves.
• Africa: greater climate variability, and increasing frequency and intensity of severeweather over the next 50 years. The northern and southern latitudes will become dryerand the tropics will become wetter.
• Asia: summer and winter temperatures rise by 0.1- 0.2 degrees per decade over the next
10-20 years. Heavy rainfall and cyclone intensity may increase due to disruption of the ElNiño cycle and increasing sea surface temperatures.
Source: DFID Keysheets on Climate Change and Poverty,
http:/ / www.dfid.gov.uk/ pubs/ files/ climatechange/ keysheetsindex.asp

7/25/2019 climate change water resources.pdf
http://slidepdf.com/reader/full/climate-change-water-resourcespdf 8/27
TableTableTableTable 2 22 2 ....1 11 1 Highlights ofHighlights ofHighlights ofHighlights of p pp possible ossible ossible ossible climate i climate i climate i climate impacts mpacts mpacts mpacts
Temprise (°C)
Water Food Health Land Environment Abrupt and Large-Scale Impacts
1°C Small glaciers inthe Andes
disappearcompletely,threatening watersupplies for 50million people
Modest increases incereal yields in
temperate regions
At least 300,000people each year
die from climaterelated diseases(predominantlydiarrhoea, malaria,and malnutrition)Reduction in wintermortality in higherlatitudes (NorthernEurope, USA)
Permafrostthawing damages
buildings androads in parts ofCanada andRussia
At least 10 percent ofland species facing
extinction (accordingto one estimate) 80percent bleaching ofcoral reefs, includingGreat Barrier Reef
Atlantic ThermohalineCirculation starts to
weaken
2°C Potentially 20 - 30percent decrease inwater availability insome vulnerableregions, e.g.Southern Africa andMediterranean
Sharp declines incrop yield in tropicalregions (5 - 10percent in Africa)
40 – 60 millionmore peopleexposed to malariain Africa
Up to 10 millionmore peopleaffected by coastalflooding each year
15 – 40 percent ofspecies facingextinction (accordingto one estimate).High risk of extinctionof Arctic species,including polar bear
and caribou3°C In SouthernEurope, seriousdroughts occuronce every 10years 1 – 4 billionmore people sufferwater shortages,while 1 – 5 billiongain water, whichmay increase floodrisk
150 - 550 additionalmillions at risk ofhunger (if carbonfertilisation weak)Agricultural yields inhigher latitudeslikely to peak
1 – 3 million more
people die from
malnutrition (if
carbon fertilisation
weak)
1 – 170 millionmore peopleaffected by coastalflooding each year
20 – 50 percent ofspecies facingextinction (accordingto one estimate),including 25 – 60percent mammals, 30 – 40 percent birdsand 15 – 70 percentbutterflies in SouthAfrica. Onset ofAmazon forestcollapse (somemodels only)
4°C Potentially 30 -50percent decrease inwater availability in
Southern Africa andMediterranean
Agricultural yieldsdecline by 15- 35percent in Africa,
and entire regionsout of production(e.g. parts ofAustralia)
Up to 80 millionmore peopleexposed to malaria
in Africa
7 – 300 millionmore peopleaffected by coastal
flooding each year
Loss of around halfArctic tundra. Aroundhalf of all the world’s
nature reservescannot fulfilobjectives
5°C Possibledisappearance oflarge glaciers inHimalayas,affecting one-quarter of China’spopulation andhundreds of millionsin India
Continued increasein ocean acidityseriously disruptingmarine ecosystemsand possibly fishstocks
Sea level risethreatens smallislands, low-lyingcoastal areas(Florida) and majorworld cities suchas New York,London, andTokyo
Potential for
Greenland ice sheet
to begin melting
irreversibly,
accelerating sea level
rise and committing
world to an eventual
7m sea level rise.Rising risk of abrupt
changes to
atmospheric
circulations, e.g. the
monsoon.
Morethan 5°C
The latest science suggests that the Earth’s average temperature will rise by even more than 5 or 6°C if emissions continue to growand positive feedbacks amplify the warming effect of greenhouse gases (e.g. release of carbon dioxide from soils or methane frompermafrost). This level of global temperature rise would be equivalent to the amount of warming that occurred between the last age
and today – and is likely to lead to major disruption and large-scale movement of population. Such “socially contingent” effects couldbe catastrophic, but are currently very hard to capture with current models as temperatures would be so far outside humanexperience.
Notes: As colours move from yellow to red, they indicate increasing severity of impacts.This table shows illustrative impacts at different degrees of warming. Some of the uncertainty is captured in the ranges shown, but there will be additional uncertainties about the exact size of impacts (more detail in Box 3.2). Temperatures represent increases relative to pre-industrial levels. At each temperature, the impacts are expressed for a 1°C band around the central temperature, e.g. 1°C represents the range 0.5 – 1.5°C etc. Numbers of people affected at different temperatures assume population and GDP scenarios for the 2080s from the Intergovernmental Panel on Climate Change (IPCC). Figures generally assume adaptation at the level of an individual or firm, but not economy- wide adaptations due to policy intervention (covered in Part V).Source: Stern Review, Chapter 3.

7/25/2019 climate change water resources.pdf
http://slidepdf.com/reader/full/climate-change-water-resourcespdf 9/27

7/25/2019 climate change water resources.pdf
http://slidepdf.com/reader/full/climate-change-water-resourcespdf 10/27

7/25/2019 climate change water resources.pdf
http://slidepdf.com/reader/full/climate-change-water-resourcespdf 11/27
Climate change and water resources
Haiti; the difference has been attributed to deforestation, and the destruction of mangroveforests that are essential to coastal defence. Moreover, in South East Asia, areas with healthymangrove and tree cover were significantly less likely to have experienced major damage as a
result of the 2004 tsunami.9
In drier regions, however, even a slight rise in temperatures will lead to greater loss of moisture,exacerbating drought and desertification. Drought will lead to decreased water availability andwater quality for populations in many water-scarce regions, particularly in southern Africa, north
Africa, Central America and central Asia.10
When less precipitation and higher temperaturesoccur simultaneously, the availability of water resources is reduced even further while
evaporation is increased, leading to a vicious cycle. 11
In Sub-Saharan Africa, for example, longperiods of drought are becoming more common and are predicted to become more widespread.While some farmers have been able to survive by selecting seed varieties based on changingconditions, poorer farmers have not been as able to adapt.
2.3.3 2.3.3 2.3.3 2.3 .3 Rising s Rising s Rising s Rising seaeaeaea l ll levels evels evels evels
Melting of ice (seeSection 2.3.4 ) and thermal expansion of oceans as a result of increasedaverage temperatures will result in rising sea levels. Sea levels have already risen between 10-20 cm over pre-industrial averages and are expected to rise further by up to one metre during
the 21 Century.12
Changes in sea level will increase coastal erosion, and flooding of wetlandsand lowlands. It will also have a significant impact on the availability of freshwater:
• groundwater resources in coastal plains are potentially vulnerable to salinisation from
rising sea levels, due to their low elevation and hydraulic gradient;
• salt water intrusion in the lower reaches of the deltas will be exacerbated by predicted
rises in sea levels; and
• reduced protective capacity from extreme storms and floods, as higher sea levels provide
a higher base for storm surges.13
2.3.4 2.3.4 2.3.4 2.3 .4 Melt ingMeltingMeltingMelting g gg glaciers laciers laciers laciers
Scientists are especially concerned about the Arctic, where the effects of climate change arebeing felt more quickly and severely than anywhere else on the planet. Arctic temperaturesincreased by about 5 degrees during the 20th Century – 10 times faster than the global average.Snow cover has declined by some 10 percent in the mid-high latitudes of the NorthernHemisphere since the late 1960s and, in the Russian Arctic, buildings are collapsing because of
thawing permafrost under the foundations.
The dramatic changes occurring in the Arctic are being felt around the world: melting glacierscontribute to rising sea levels, and also increased flash floods as river basins fill more quicklyand with a greater volume of water, with the resulting impacts on freshwater availability. Duringdry seasons, water supplies are dramatically reduced due to reduced availability of glacial meltto fill streams and rivers.
(9) Secretariat of the Convention on Biological Diversity, 2006 (10) Smith, D.M. Just One Planet: Poverty, Justice and Climate Change. UK: Practical Action Publishing, 2006 p.21 (11) “Climate Changes the Water Rules”, p. 23
(12) IPCC, "Climate Change 2001: Impacts, Adaptation and Vulnerability" (2001) www.ipcc.ch (13) “Climate Changes the Water Rules" p. 18-19

7/25/2019 climate change water resources.pdf
http://slidepdf.com/reader/full/climate-change-water-resourcespdf 12/27
Furthermore, thawing permafrost in the Arctic is releasing methane, a gas which has a very highglobal warming impact. This will act as a further feedback mechanism, accelerating ongoingclimate change.

7/25/2019 climate change water resources.pdf
http://slidepdf.com/reader/full/climate-change-water-resourcespdf 13/27
Climate change and water resources
3 33 3 CLIMATE CHANGE AND T CLIMATE CHANGE AND T CLIMATE CHANGE AND T CLIMATE CHANGE AND THE POOR HE POOR HE POOR HE POOR
3.13.13.13.1 O OO O VERVIEW VERVIEW VERVIEW VERVIEW
Climate change is having, and will continue to have, the greatest impact upon the lives of thepoor in developing countries. Most developing countries are in tropical or arid regions, which willexperience climate change sooner and on a greater magnitude than temperate regions.
Further, the poor tend to be more vulnerable to the impacts of climate change. The poor aregenerally forced to inhabit land (floodplains, steep unstable slopes or exposed coastlines) thatincreases their exposure to climate risks. Developing countries also tend to be very reliant onclimate-sensitive natural resources, such as agriculture, and have limited capacity to withstandand recover from the resulting storms, floods, droughts, disease outbreaks, and disruptions tofood and water supplies as a result of climate change.
3.23.23.23.2 I II I MPACT OF C MPACT OF C MPACT OF C MPACT OF CLIMATELIMATELIMATELIMATE C CC CHANGE ON THEHANGE ON THEHANGE ON THEHANGE ON THEMDG MDG MDG MDG S SS S
Climate change will compromise development spending, and hence effective progress towardsachievement of the Millennium Development Goals (MDGs, see Box 3.1 ). Official DevelopmentAssistance (ODA) is expected to increase by up to US $50 billion by 2010, as governments andinternational actors seek to reduce poverty in developing countries. The OECD estimates that insix countries alone, climate change could undermine US $1.5 billion in development
assistance.14
TableTableTableTable 3 33 3 ....1 11 1 ODA atODA atODA atODA at r rr risk fromisk fromisk fromisk from c cc climatelimatelimatelimate c cc change inhange inhange inhange in s ss six ix ix ix c cc countries ountries ountries ountries
CountryCountryCountryCountry ODA at risk from Climate ChangeODA at risk from Climate ChangeODA at risk from Climate ChangeODA at risk from Climate Change
Egypt 0.5 billion
Uruguay 3.8 – 5.6 million
Nepal 175 – 260 million
Fiji 6.9 – 10.8 million
Tanzania 0.12 – 0.25 billion
Bangladesh 0.22-0.53 billion
Source: OECD, see Footnote
(14) OECD statistics, http://www.oecd.org/dataoecd/0/41/35842562.pdf

7/25/2019 climate change water resources.pdf
http://slidepdf.com/reader/full/climate-change-water-resourcespdf 14/27
BoxBoxBoxBox 3 33 3 ....1 11 1 Examples of the i Examples of the i Examples of the i Examples of the impact ofmpact ofmpact ofmpact of c cc climatelimatelimatelimate c cc change on the MDGs hange on the MDGs hange on the MDGs hange on the MDGs
As explained in ‘Just One Planet’, “The nexus between climate change and poverty imperils theMDGs. In a warmer world, extreme poverty will be harder to beat, the incomes of the poorest willshrink not grow, education will fall further out of reach for poor families, disease will increase not
decline and investment in safe water and sanitation will get riskier.”15
A major factor in the reduced adaptive capacity of developing countries is the projected increasein the frequency and severity of extreme weather events and natural disasters. Over two thirds ofdisasters are already climate-related, and these have the greatest impact on the LDCs, with 94
percent of natural disaster-related deaths occurring in developing countries.16
Worldwide, 25
million people have already been displaced by natural disasters and environmental degradation,and this is estimated to increase to 50 million by 2010 and 200 million by the 2080s.
17 As these
events become more severe, they pose a substantial risk to ODA and effective poverty reduction.In the period between the 1970s and 1990s, economic losses reported as a result of naturaldisasters increased five-fold, from US $131 billion to $629 billion. During that same period, the
number of reported disasters also rose by three times, from 1 110 to 2 742.18
(15) Smith, D.M. Just One Planet: Poverty, Justice and Climate Change. UK: Practical Action Publishing, 2006 p.27 (16) "An Adaptation Mosaic: a sample of the emerging World Bank work in climate change adaptation", The World Bank (February 2004)
(17) Smith, D.M. Just One Planet: Poverty, Justice and Climate Change. UK: Practical Action Publishing, 2006 p.71 (18)"Up in Smoke: Threats from, and responses to, the impact of global warming on human development", Working Group on Climate Change and
Development reports (October 2004)
• MDG1 (Poverty): Increase in temperature in India could reduce farm net revenues by 9- 25percent;
• MDG2 (Education): In Bihar India, annual flooding shuts schools across the state for 3
months;• MDG3 (Gender): 90 percent of victims in the 1991 Bangladesh cyclone were women and
children;• MDG 4,5,6 (Health): Incidence of Cholera increased 6-fold in Nicaragua following flooding
as a result of Hurricane Mitch;• MDG7 (Environment, including water resources): Total available water in Africa’s large
catchment basins of Niger, Lake Chad and Senegal, has already decreased by 40-60percent.
Source: Adapted from Multi-donor repor t, “Poverty and Climate Change: Reducing the
vulnerability of the poor through adaptation”, http:/ / www.eldis.org/ static/ DOC11253.htm

7/25/2019 climate change water resources.pdf
http://slidepdf.com/reader/full/climate-change-water-resourcespdf 15/27
Climate change and water resources
BoxBoxBoxBox 3 33 3 ....2 22 2 Examples of the c Examples of the c Examples of the c Examples of the costs ofosts ofosts ofosts of d dd disasters isasters isasters isasters
3.33.33.33.3 IIIIMPACT OF CMPACT OF CMPACT OF CMPACT OF CLIMATELIMATELIMATELIMATE CHANGE ON WCHANGE ON WCHANGE ON WCHANGE ON WATERATERATERATER RRRRESOURCES FORESOURCES FORESOURCES FORESOURCES FOR HHHHUMANUMANUMANUMAN DDDDEVELOPMENTEVELOPMENTEVELOPMENTEVELOPMENT
Access to water plays a key role in development – it sustains human life, both through directconsumption and use in agriculture (for food security) and industrial activities. While wateravailability for drinking purposes is essential, it cannot be separated from wider water resourcemanagement issues. Its use for industrial purposes is important to fuel economic growth, andcompeting demands from households, agriculture and industry can cause conflict over wateravailability and use. Today, more than one billion people still lack access to safe water, while
over two billion lack safe sanitation.19
The changes to the hydrological cycle (Section 2 .3 ) will deteriorate the availability of water forhuman populations, in terms of quantity, quality and accessibility of water supplies. Theseconditions will be further exacerbated by increasing natural disasters and their impacts on waterfor human populations.
3.3.1 3.3.1 3.3.1 3 .3 .1 Chan Chan Chan Changes in the q ges in the q ges in the q ges in the quantity,uantity,uantity,uantit y, q qq quality anduality anduality anduality and a aa accessibility ofccessibility ofccessibility ofccessibility of water s water s water s water supplies upplies upplies upplies
Quantit y of water
Many of the world’s countries already struggle under existing water stress from pressures suchas irrigation demands, industrial pollution and water borne sewerage. These pressures will besignificantly exacerbated by climate change, which for many regions will result in reduced rainfalland increasing temperatures, further reducing the availability of water for drinking, householduse, agriculture and industry. As these competing demands intensify under climate change,
(19) “Climate Changes the Water Rules", p. 26
• Hurricane Mitch destroyed ¾ of Honduras’ GDP, and set back development by 20years
• 1998 flood in Bangladesh: losses of £3 billion, equivalent to 8 percent of country’sGDP
• 1991/92 drought in Africa contracted real income by amounts ranging from 2-8
percent• According to UNEP, economic losses due to natural disasters are doubling every 10
years
Source: NEF (2001), “The End of Development?”
http:/ / www.neweconomics.org/ gen/ uploads/ e_o_d.pdf
• Hurricane Mitch destroyed ¾ of Honduras’ GDP, and set back development by 20 years• 1998 flood in Bangladesh: losses of £3 billion, equivalent to 8 percent of country’s GDP
• 1991/92 drought in Africa contracted real income by amounts ranging from 2-8 percent• According to UNEP, economic losses due to natural disasters are doubling every 10 years
Source: NEF (2001), “The End of Development?”
http:/ / www.neweconomics.org/ gen/ uploads/ e_o_d.pdf

7/25/2019 climate change water resources.pdf
http://slidepdf.com/reader/full/climate-change-water-resourcespdf 16/27
effective governance for balancing water demands will become essential, particularly in the faceof strong pressures to prioritise industrial uses over other uses such as drinking supplies.
The Stockholm Environment Institute estimates that, based on only a moderate climate change,by 2025 the proportion of the world’s population living in countries of significant water stress will
increase from approximately 34 percent (in 1995) to 63 percent.
20
For example, in Africa’s large catchment basins of Niger, Lake Chad and Senegal, the totalavailable water has already decreased by 40-60 percent, and desertification has beenaggravated by lower than average annual rainfall, runoff and soil moisture, especially in
Northern, Southern and Western Africa.21
The consequences for water supply include smallerflows in springs and rivers, and decreasing groundwater levels.
Quality of water
The quality of existing water supplies will become a further concern in some regions of the globe.
Water acquires most of its geochemical and biochemical substance during its cycle from cloudsto rivers, through the biosphere, soils and geological layers. Changes in the amounts or patternsof precipitation will change the route/ residence time of water in the watershed, therebyaffecting its quality. As a result, regardless of quantity, water could become unsuitable as a
resource if newly-acquired qualities make it unfit for the required use.22
For example, in areaswith relatively high water tables, or under intensive irrigation, increased evaporation due tohigher temperatures will raise the concentration of dissolved salts. Further, increased floodingcould raise water tables to the point where agrochemicals/ industrial wastes from soil leach intothe groundwater supply.
Likewise, higher ocean levels will lead to salt water intrusion in coastal groundwater supplies,
threatening the quality and quantity of freshwater access to large populations. Exacerbated byover-abstraction of groundwater inland, this is already occurring in Israel and Thailand, in smallislands in the Pacific and Indian Oceans and the Caribbean Sea, as well as in some of theworld’s most productive deltas, such as China’s Yangtze Delta and Vietnam’s Mekong Delta.
Accessibility of water
As (seasonal) water quantities and quality decrease as a result of intensification of thehydrological cycle, competition for available resources will intensify. Demand for agricultural anddomestic water in particular increases significantly at hotter and drier times of the year.Agriculture has always been the dominant end-use of diverted water; this will only intensify withincreasing needs for irrigation brought on by higher temperatures and reduced precipitation,coupled with increasing populations. Meanwhile, demands of industry are expected to become agreater issue in the competition for dwindling resources; in the event of decreasing water tablesas a result of climate change, industrial needs will be forced to compete with agricultural anddomestic water supply sources, and could lead to conflict.
(20)"Up in Smoke: Threats from, and responses to, the impact of global warming on human development", Working Group on Climate Change and
Development reports (October 2004) (21) UNFCCC (22) “Climate Changes the Water Rules" p. 16-17

7/25/2019 climate change water resources.pdf
http://slidepdf.com/reader/full/climate-change-water-resourcespdf 17/27
Climate change and water resources
3.3.2 3.3.2 3.3.2 3.3 .2 NaturalNaturalNaturalNatural d dd disasters isasters isasters isasters
The increase in natural disasters, primarily floods and droughts, will further exacerbate issuesover water availability and water quality.
Of particular concern are increased risks from flooding. The Intergovernmental Panel on ClimateChange (IPCC) has projected that flooding and landslides pose the most widespread direct risk
to human settlements from climate change.23
The UNFCCC predicts that “a future of moresevere storms and floods along the world’s increasingly crowded coastlines is likely, and will be a
bad combination even under the minimum scenarios forecast”.24
Beyond the immediate andapparent devastation caused by flooding, including loss of life and livelihoods, flooding hasmajor impacts on water resources, and hence humans:
• overburdening of wastewater and sewer systems, leading to contamination of water
supplies with subsequent outbreaks of dysentery and cholera;
• disruption of safe water supplies through damage to infrastructure;
• flood water in low-lying areas creates breeding grounds for mosquitoes with increasedrisk of malaria, yellow fever and dengue;
• floods can increase the incidence of diseases such as skin diseases as a result ofconstant contact with water; and
• inadequate nutrition following disruption of income and food distribution systems.25
3.43.43.43.4 CCCCONSEQUENCES FOR HUMAONSEQUENCES FOR HUMAONSEQUENCES FOR HUMAONSEQUENCES FOR HUMAN PN PN PN POPULATIONSOPULATIONSOPULATIONSOPULATIONS
3.4.1 3.4.1 3.4.1 3.4.1 Introduct ion Introduction Introduction Introduction
The predicted changes in quantity, quality and accessibility to water will have importantconsequences for human populations, through impacts to agriculture and food security, health,economic activity, and conflict over water resources.
3.4.2 3.4.2 3.4.2 3.4.2 Impacts to a Impacts to a Impacts to a Impacts to agriculture a griculture a griculture a griculture andndndnd f ff foodoodoodood s ss security ecurity ecurity ecurity
Agriculture will be one of the hardest-hit sectors by climate change, reinforcing the unequaldistribution of impacts. In addition to pressures caused by population growth and intensifiedagriculture, warmertemperatures will lead to increased water evaporation, intensifying the need for irrigation
precisely as water becomes even less available. Shiklomonov (2003) predicts that waterwithdrawal for agriculture will rise from 2 600 km3 in 2000 to 3 200 km3 by 2025.
26
Increasing supply for irrigation will simply not be feasible in many regions, particularly whereirrigation capacity is not sufficiently developed to accommodate changing precipitation patterns.In sub-Saharan Africa, for example, where up to 90 percent of agriculture is rain fed, the sectoraccounts for 70 percent of employment and 35 percent of GNP, and changes in rainfall will have
(23) "Up In Smoke", p. 18 (24) UNFCCC (25) “Climate Changes the Water Rules", p.35 (26) “Climate Changes the Water Rules" p. 27

7/25/2019 climate change water resources.pdf
http://slidepdf.com/reader/full/climate-change-water-resourcespdf 18/27
a significant social and economic impact.27
Meanwhile, it is estimated that a temperatureincrease of 2-3.5 degrees Celsius in India could result in a decline in farm revenues of between
9 and 25 percent.28 The International Rice Research Institute, for example, estimates that for
every degree Celsius of night time temperature increase, there is at least a 10 percent decrease
in rice production for the African region.29
While some areas will benefit from longer growing
seasons (such as northern Asia), changes in water regimes will render other areas unsuitable fortraditionally-grown products, and others areas will become susceptible to new forms of crop andlivestock diseases. In regions already affected by food shortage and famine, this could causefurther disruptions in food supply.
3.4.3 3.4.3 3.4.3 3 .4 .3 Health i Health i Health i Health impacts mpacts mpacts mpacts
Clearly, the health implications of changes to water supply are far-reaching. Currently, more than
3 million people die each year from avoidable water-related disease,30
most of whom are indeveloping countries. The effects of climate change on water will exacerbate the existingimplications of water shortages on human health, as follows:
• Water-borne diseases: result from the contamination of water by human/ animal faeces, or
by urine infected with pathogenic viruses/ bacteria, both of which are more likely to occur
during periods of flood and therefore intensify with the projected increases in natural
disasters under climate change. Diseases are transmitted directly when the water is drunk
or used in food preparation.
• Water-washed diseases: those resulting from inadequate personal hygiene as a result of
scarcity or inaccessibility of water (including many water-borne diseases and typhus).
• Water-based diseases: those caused by parasites that use intermediate hosts living in/near water (e.g. guinea worm).
• Water-related diseases: borne by insect vectors that have habitats in/near water (such as
malaria). For example, malaria has recently appeared in Nairobi and the highlands of
Kenya, illustrating the expanding range of mosquitoes due to warmer temperatures.
• Water-dispersed diseases: infections for which the agents proliferate in fresh water and
enter the human body through the respiratory tract (e.g. legionella).31
Further indirect health challenges include malnutrition arising from agricultural disruption andfood insecurity.
(27) "Up In Smoke" p. 8 (28) "Up in Smoke" (29) "Up In Smoke" p. 8 (30) “Climate Changes the Water Rules", p.26 (31) “Climate Changes the Water Rules" p. 33. Because the extent and severity of climate change remains uncertain, it is not possible to quantify the anticipated
risks. This is one of the issues that makes climate change a particularly dangerous i ssue.
7/25/2019 climate change water resources.pdf
http://slidepdf.com/reader/full/climate-change-water-resourcespdf 19/27
Climate change and water resources
3.4.4 3.4.4 3.4.4 3.4.4 Decreases in e Decreases in e Decreases in e Decreases in economicconomicconomicconomic a aa activity ctivity ctivity ctivity
Water plays a key role in economic growth and hence development. Reductions in water quantityand quality will require people, particularly women and children, to spend increased timegathering water, detracting from employment and educational opportunities. A greater
proportion of household income may need to be spent on water delivered from private sources,such as tankers, to supplement lack of water locally. Further, water is a key input to industrialuses, and decreases in water availability will reduce the amount of industry and hence inputs tothe local economy.
3.4.5 3.4.5 3.4.5 3.4.5 Confl ict o Confl ict o Confl ict o Confl ict overververver w ww waterateraterater r rr resources esources esources esources
Changes to accessibility of water have the potential to increase conflict, as the competingdemands of private, agricultural, and industrial uses for water put pressure on resources. Thismay exacerbate conflict in existing water stressed areas competing locally for access to naturalsprings and rivers, as well as lead to conflicts on a larger international trans-boundary scale. Forexample, in northern Kenya, the Samburu are having to cope with changing patterns of rainfalland reductions in rainfall amount, which coupled with other pressures on the natural resources
are leading to increasing conflict among tribal groups over access to scarce water.32
Whereas inCentral Asia, reduced water availability for agriculture has increased tensions among the formerSoviet states.
(32) Smith, D.M. Just One Planet: Poverty, Justice and Climate Change. UK: Practical Action Publishing, 2006 p.73

7/25/2019 climate change water resources.pdf
http://slidepdf.com/reader/full/climate-change-water-resourcespdf 20/27
4444 WHAT CAN BE DONE?WHAT CAN BE DONE?WHAT CAN BE DONE?WHAT CAN BE DONE?
4.14.14.14.1 IIIINTRODUCTIONNTRODUCTIONNTRODUCTIONNTRODUCTION
There are two ways to manage the risks posed by climate change: mitigation of GHGs to slow orreverse the pace of climate change, and adaptation to climate impacts to minimise their effects.
4.24.24.24.2 MMMMITIGATIONITIGATIONITIGATIONITIGATION
Mitigation implies the human measures, structural and non-structural, undertaken to limit theadverse impacts of climate change by reducing the levels of GHGs in the atmosphere. This isaccomplished through the development of appropriate technology for reducing emissions and/or capturing them at their source. Examples of mitigation include measures such as energy
efficiency, promotion of renewable energy sources, and carbon trading.
Mitigation of GHGs is essential to slow and eventually reverse the impact of climate change. Byseeking to limit these impacts, the severity and extent of which remain largely unknown,mitigation is the most cost-effective and least risky strategy for reducing the future effects ofclimate change.
4.34.34.34.3 AAAADAPTATIONDAPTATIONDAPTATIONDAPTATION
4.3.1 4.3.1 4.3.1 4.3.1 Overview Overview Overview Overview
The reality, however, is that climate change is already occurring; even if mitigation efforts wereimmediately able to reduce global carbon emissions to zero, there will be certain and ongoingimpacts from climate change that need to be addressed. Adaptation describes a set ofresponses to the actual and potential impacts of climate change to moderate the harm or takeadvantage of the opportunities that climate change may bring.
This is a new, critical and urgent challenge. Climate change, as a subject, has been dominatedby the natural science community and has thus been debated at a high level with an emphasison national and international acceptance and, subsequently, mitigation. Now this top-downtechnical consideration of climate change needs to be met with a bottom-up community basedapproach. In fact the community based approach has to better inform policy and practice at the
higher levels.
4.3.2 4.3.2 4.3.2 4.3.2 Adaptation andAdaptat ion andAdaptat ion andAdaptat ion and d dd development evelopment evelopment evelopment
The poor prioritise risks associated with day-to-day survival, such as lack of income and poorhealth, over risks associated with future less familiar events. This focus on livelihoods thenprovides the natural entry point to engage with the poor and vulnerable to adapt to climate risk.Climate change adaptation can not simply be bolted on to development activities. It must beintegrated within the development priorities of local people. A “no regrets” approach wherebyadaptation provides short-term benefits, regardless of longer-term aims based on a changingclimate, helps ensure initiatives are owned locally and sustainable over time.

7/25/2019 climate change water resources.pdf
http://slidepdf.com/reader/full/climate-change-water-resourcespdf 21/27
Climate change and water resources
Development can, by its very nature, build adaptive capacity. It can help poor countries tobecome less vulnerable to the impacts of climate change, by diversifying their economies andlivelihoods, increasing access to markets, increasing access to education and healthcare andbuilding social and financial safety nets. This is why targeted development of natural, physicaland human capacity is essential, including, for example, investing in water catchmentinfrastructure, or tailoring farm management practices to projected climate variability.
Adaptive capacity is also about creating the local information and conditions that are needed tosupport adaptation. While public awareness of climate change is increasing in the North, in mostdeveloping countries public awareness is very low. Efforts to alert vulnerable people andcommunities to the dangers presented by climate change are necessary to establish anunderstanding of the risks involved, and to make use of local capacities to build adaptability.
Adaptation should therefore be based on an understanding of local livelihoods, over-laid with anunderstanding of climate risks and how they impact these livelihoods.
4.3.3 4.3.3 4.3.3 4.3.3 Mal Mal Mal Mal- -- -adaptation adaptation adaptation adaptation
Not all development activities will be beneficial for reducing vulnerability to climate change. Mal-adaptation refers to situations in which vulnerability to climate change is increased throughcurrent development paths. It is commonly caused by a lack of information, or awareness of thepotential effects of development policies on other development objectives or sectors, combinedwith political decision making which focuses on short term goals rather than long term planning.
BoxBoxBoxBox 4 44 4 ....1 11 1 Agric Agric Agric Agricultural mal ultural mal ultural mal ultural mal- -- -adaptation in t adaptation in t adaptation in t adaptat ion in tropical Asia ropical Asia ropical Asia ropical Asia
Sustainable water and sanitation projects are characterised by a demand responsive approachand cost recovery, and are delivered within a partnership framework that integrates waterresources management. However, in some situations it may be necessary to work outside of thatframework, such as in cases of informal settlements or refugee situations. In those instances,short-term work that is unlikely to provide long-term sustainability might be more suitable, ifsupported by advocacy on the causes of the situation
Agricultural interventions through research, extension or marketing policies can have
unintentionally negative impacts on poor farmers, particularly in areas that experienceopposing extremes in climate.
For example, agricultural production in tropical Asia is susceptible to both increasingtemperatures and changing monsoon patterns. Consequently, increasing leaf surfacetemperatures would have a significant impact on crop metabolism and yields; however, it mayalso make crops more sensitive to moisture stress.
Source: IPCC, Climate Change 2001: Impacts, Adaptation and Vulnerabilit y

7/25/2019 climate change water resources.pdf
http://slidepdf.com/reader/full/climate-change-water-resourcespdf 22/27
4.3.4 4.3.4 4.3.4 4 .3 .4 TheTheTheThe economic argument for a economic argument for a economic argument for a economic argument for adaptation daptation daptation daptation
Funding for adaptation initiatives in developing countries will continue to be a challenge.However, current evidence suggests that the benefits of many adaptation options validate theircosts. For example, practitioners of disaster management acknowledge that it is typically more
cost effective to invest in disaster risk reduction measures to reduce the impact of a disaster,than it is to provide emergency and recovery relief once the disaster has taken place (see Box
4.2 ).

7/25/2019 climate change water resources.pdf
http://slidepdf.com/reader/full/climate-change-water-resourcespdf 23/27
Climate change and water resources
BoxBoxBoxBox 4 44 4 ....2 22 2 Examples of c Examples of c Examples of c Examples of costostostost e ee effectiveness offfectiveness offfectiveness offfectiveness of d dd disasterisasterisasterisaster risk r risk r risk r risk reduction eduction eduction eduction
4.44.44.44.4 AAAAPPROACHES TO APPROACHES TO APPROACHES TO APPROACHES TO ADAPTATION DAPTATION DAPTATION DAPTATION
4.4.1 4.4.1 4.4.1 4.4.1 Overview Overview Overview Overview
Broadly speaking, the approach to adaptation requires a series of steps, all of which need to beintegrated into more general development planning, and include community participationthroughout:
• climate risk screening and assessment;• identification of risk reduction measures;• identification of priorities for action (using tools such as participatory community risk
assessment, and economic analysis of the costs and benefits of adaptation options);
• making the case for implementation of adaptation measures; and• associated awareness-raising and capacity building to support adaptation responses.
In particular, two approaches to strengthen adaptation are particularly relevant to aninternational development agency and its partners: community level adaptation, and advocacyon adaptation.
4.4.2 4.4.2 4.4.2 4.4.2 Community l Community l Community l Communit y levelevelevelevel a aa adaptation daptation daptation daptation
Part icipatory risk assessment can provide the ideal means by which adaptation measures canbe integrated within development activities such that lives and livelihoods are resilient andsustainable in the face of the range of risks they are exposed to, including risks associated withclimate change. The process of undertaking a well-facilitated risk assessment will raiseawareness of the implications of climate change, and provide an opportunity for these to bediscussed and debated. Ideas for developing means to adapt should emerge and, if the processis fully participatory in nature involving key local stakeholders, these ideas stand a strongerchance of being sustainable than external solutions. Local government officials andrepresentatives of the private sector should be among the local stakeholders involved in the riskassessment and adaptation planning process. Shared development goals need to bedetermined if adaptation is to be sustainable.
• China : $3.15billion spent on flood control between 1960 and 2000 is estimated to haveaverted losses of some $12billion.
•
Brazil : Rio flood reconstruction and prevention project yielded an internal rate of returnexceeding 50 percent.
• India : Disaster mitigation and preparedness programmes in Andhra Pradesh yielded abenefit/cost ratio of 13.38.
• Vietnam : Mangrove-planting project aimed at protecting coastal populations fromtyphoons and storms yielded an estimated benefit/cost ratio of 52 over the period 1994to 2001.
Source: The Stern Review

7/25/2019 climate change water resources.pdf
http://slidepdf.com/reader/full/climate-change-water-resourcespdf 24/27
Community level adaptation measures can be structural or non-structural .33
The raising of hand-pumps above expected flood levels is a structural example. Awareness-raising of the risksassociated with climate change is a non-structural example. However, the two methods are
connected. Adaptation strategies are only as strong as the weakest link in a chain.34
Forinstance, without awareness of the flood risks, the imperative for investing in building a raised
platform will be lost.
Historically, the focus has been on structural measures. For example, with regard to flooding,traditionally methods have been dominated by top-down structural methods that attempt tocontrol the flood, such as the building of embankments. In light of failures in this approach, inrecent years there has developed a growing consensus that the preferred approach should bebased on “living with floods”. These focus upon the positive benefits of the natural flood processand encourage more appropriate land-use planning in the vicinity of flood plains.
4.4.3 4.4.3 4.4.3 4.4.3 Advocacy on a Advocacy on a Advocacy on a Advocacy on adaptation daptation daptation daptation
While the effects of climate change are experienced most acutely at a local level and in thepoorest areas, the root causes of vulnerability to climate change are often far beyond localcommunity control. Advocacy on climate change risk and vulnerability reduction, at all levels of
government, is essential.35
Advocacy is necessary in the following areas:
• Integration of climate risk into development planning through Poverty Reduction Strategy
Papers (PRSPs) etc: Climate change has implications across the breadth of sectors
(health, education, agriculture etc) and levels (local, provincial, national and international)
and is not only an environment issue. It is thus a subject that must influence all
development decisions. Based on this understanding, work is required to ensure thatPoverty Reduction Strategy Papers (PRSPs) and other mechanisms and structures thatdictate paths of development take climate change into account. NGOs can play a key role
in this agenda.
• Integrating local perspectives into national plann ing on climate change: At a national
level, under the UNFCCC, government priorities for climate adaptation in many of the
world’s poorest countries are being outlined through theNational Adaptation
Programmes of Action (NAPA). The NAPA takes into account existing coping strategies at
the grassroots level, and builds upon that to identify priority activities, rather than
focusing on scenario-based modelling to assess future vulnerability and long-term policyat state level. In the NAPA process, prominence is given to community-level input as an
important source of information, recognising that grassroots communities are the main
(33) Structural measures refer to any physical construction to reduce or avoid possible impacts of hazards, which include engineering measures and construction
of hazard-resistant and protective structures and infrastructure.
Non-structural measures refer to policies, awareness, knowledge development, public commitment, and methods and operating practices, including participatory
mechanisms and the provision of information, which can reduce risk and related impacts .(UN/ISDR terminology on disaster risk reduction) (34) Personal Communication, Ian Davis, Cranfield University, 2006. (35) See, for example, Tearfund’s work Dried up, Drowned out: Perspectives from the developing world on a changing climate
(http://tilz.tearfund.org/Research/Climate+change+and+disasters+policy/) and WWF’s Climate Witness Programme
(www.panda.org/about_wwf/what_we_do/climate_change/news/witnesses/index.cfm)

7/25/2019 climate change water resources.pdf
http://slidepdf.com/reader/full/climate-change-water-resourcespdf 25/27
Climate change and water resources
stakeholders.36
There is therefore an opportunity to engage in this and ensure that plans
are appropriate for the needs of the poor.
• Supporting NGO Coalit ions for climate change: Isolated groups and organisations will
struggle to make their voice heard at a national and international level. Therefore, within
national boundaries, coalitions should be formed or joined, along the lines of the UKWorking Group on Climate Change and Development, so as to help deliver strong,
coherent and effective messages to decision-makers.
4.4.4 4.4.4 4.4.4 4.4.4 Approaches toApproaches toApproaches toApproaches to a aa adaptation anddaptation anddaptation anddaptation and w ww water ater ater ater
Overview
The adaptation measures appropriate at the community level for reducing vulnerability tochanging water regimes are, in essence, no different from good practice sustainabledevelopment and disaster risk reduction. The challenge lies in introducing such measures in
areas where people are currently unaccustomed to the new risks associated with climatechange, and on a scale that befits the problem. This calls for a change in perspective for allinvolved as traditional knowledge is only suitable for traditional problems.
It is necessary to consider what impact less predictable rainfall patterns, more frequentdroughts, and weather hazards of unprecedented intensity will have on the water quantity,quality and accessibility for communities. Community-based adaptation options will varydepending upon circumstances and need to be based on local decision-making.
Adaptation measures include some of the following institutional, educational and project designchanges.
Institutional
• Local watershed management . Support institutions that have the authority to manage the
local catchment in the interest of all stakeholders, including domestic water users; ensurethere is proper accountability in these institutions.
• Right to Water. Clarify the legal entitlement to access water resources for all users.
• Data & Information. Promote greater collaboration in data-collection, monitoring and
access to national information.
Educational
• Awareness-raising: Build local understanding on the links between predicted climate
change and the impacts that this will have on water resources at a local level.
• Health education : related to increases in climate/water related health issues
• Household water conservation to encourage people to use grey water for washing, bathing
and watering gardens and livestock to preserve safe drinking water supplies.
(36) http://unfccc.int/adaptation/napas/items/2679.php
7/25/2019 climate change water resources.pdf
http://slidepdf.com/reader/full/climate-change-water-resourcespdf 26/27
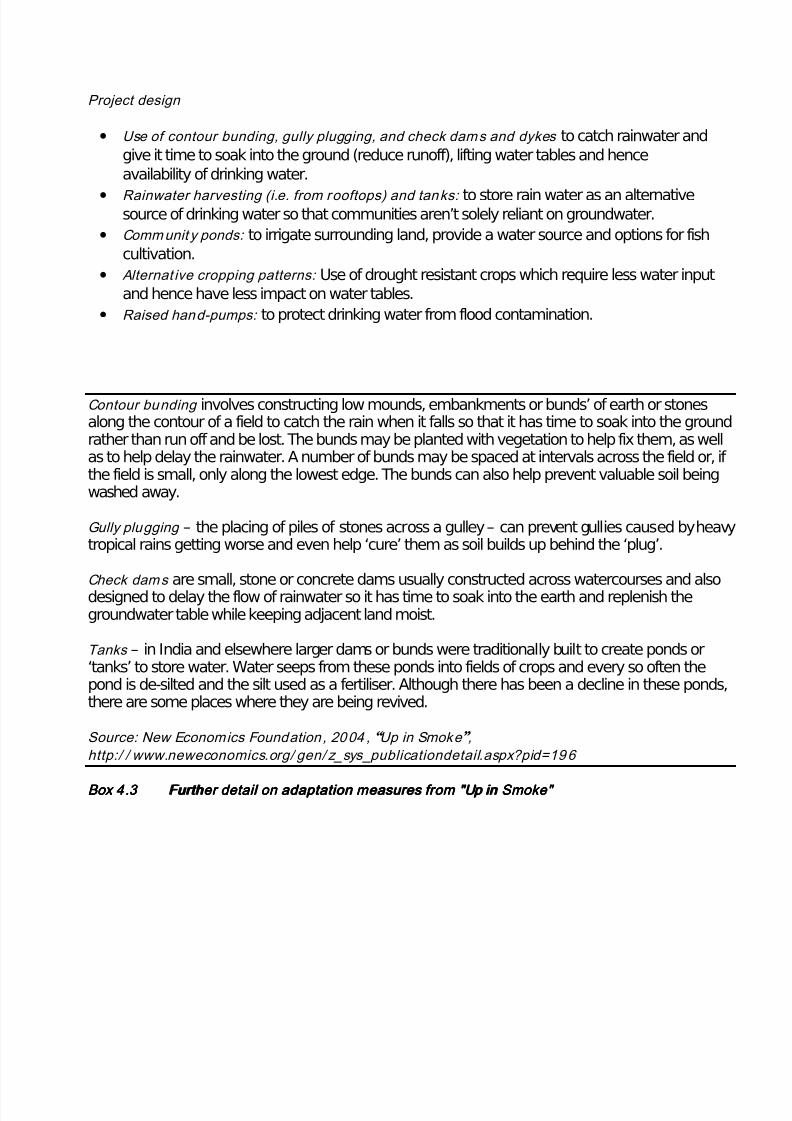
Project design
• Use of contour bunding, gully plugging, and check dams and dykes to catch rainwater and
give it time to soak into the ground (reduce runoff), lifting water tables and hence
availability of drinking water.
• Rainwater harvesting (i.e. from rooftops) and tanks: to store rain water as an alternativesource of drinking water so that communities aren’t solely reliant on groundwater.
• Communit y ponds: to irrigate surrounding land, provide a water source and options for fish
cultivation.
• Alternat ive cropping patterns: Use of drought resistant crops which require less water inputand hence have less impact on water tables.
• Raised hand-pumps: to protect drinking water from flood contamination.
BoxBoxBoxBox 4 44 4 ....3 33 3 FurtherFurtherFurtherFurther detail on a detail on a detail on a detail on adaptationdaptationdaptationdaptation m mm measures from "Up in Smoke" easures from "Up in Smoke" easures from "Up in Smoke" easures from "Up in Smoke"
Contour bunding involves constructing low mounds, embankments or bunds’ of earth or stonesalong the contour of a field to catch the rain when it falls so that it has time to soak into the groundrather than run off and be lost. The bunds may be planted with vegetation to help fix them, as wellas to help delay the rainwater. A number of bunds may be spaced at intervals across the field or, ifthe field is small, only along the lowest edge. The bunds can also help prevent valuable soil beingwashed away.
Gully plugging – the placing of piles of stones across a gulley – can prevent gullies caused by heavytropical rains getting worse and even help ‘cure’ them as soil builds up behind the ‘plug’.
Check dams are small, stone or concrete dams usually constructed across watercourses and alsodesigned to delay the flow of rainwater so it has time to soak into the earth and replenish thegroundwater table while keeping adjacent land moist.
Tanks – in India and elsewhere larger dams or bunds were traditionally built to create ponds or‘tanks’ to store water. Water seeps from these ponds into fields of crops and every so often thepond is de-silted and the silt used as a fertiliser. Although there has been a decline in these ponds,there are some places where they are being revived.
Source: New Economics Foundation , 2004 , “Up in Smoke”,
http:/ / www.neweconomics.org/ gen/ z_sys_publicationdetail.aspx?pid=196
7/25/2019 climate change water resources.pdf
http://slidepdf.com/reader/full/climate-change-water-resourcespdf 27/27
Climate change and water resources
4.54.54.54.5 CCCCAMPAIGNS ON CAMPAIGNS ON CAMPAIGNS ON CAMPAIGNS ON CLIMATELIMATELIMATELIMATE CCCCHANGEHANGEHANGEHANGE
A variety of campaigns to address the risks from climate change are active globally and in theUK. The following list provides brief details on some of these campaigns, with web links forfurther reference.
• UK Working Group on Climate Change and Development . The Group was initiated by IIEDand the New Economics Foundation, in recognition of the need to involve development
organisations in the climate debate. The Working Group’s unique selling point is that it
shows how climate change is of equal concern to both environment and development
agencies. Working Group members include ActionAid, Christian Aid, the Catholic Institute
for International Relations, Friends of the Earth, Greenpeace, IIED, ITDG, nef, Oxfam,
People and Planet, RSPB, Tearfund, Water Aid, World Vision and WWF.
(http:/ /www.iied.org/CC/projects/workinggroup.html)
• Stop Climate Chaos. A coalition of environmental and international development
organisations, as well as women’s organisations, activist groups and faith-basedcampaigns, which ‘aims to build irresistible popular pressure on politicians to act’
(www.stopclimatechaos.org.uk)
• The Climate Action Network. A global network of over 287 NGOs, working ‘to promotegovernment and individual action to limit human-induced climate change to ecologicallysustainable levels’ (www.climatenetwork.org)
• Linking Climate Adaptation Network. The objective of the Linking ClimateAdaptation (LCA) Network is to help communities, policy-makers, practitioners and
academics share experiences and knowledge about adaptation to climate change.(www.eldis.org/climate/adaptation/organisations/ index.htm)
WaterAid47-49 Durham StreetLondonSE11 7JD
Tel: 020 7793 4500Fax: 020 7793 4545www.wateraid.org
WaterAid’s mission is to overcome poverty by enabling the world’s poorest people to gain access
to water, sanitation and hygiene education.
UK charity registration number 288701May 2007