climate influences on the california current pelagic ecosystem · pdf fileclimate influences...
TRANSCRIPT

Climate influences on the California Currentpelagic ecosystem
Mark D. OhmanScripps Institution of Oceanography
California Current Ecosystem Long Term Ecological Research site
CCE LTER

M. KahruB.G. MitchellSIO
A coastal upwelling biome
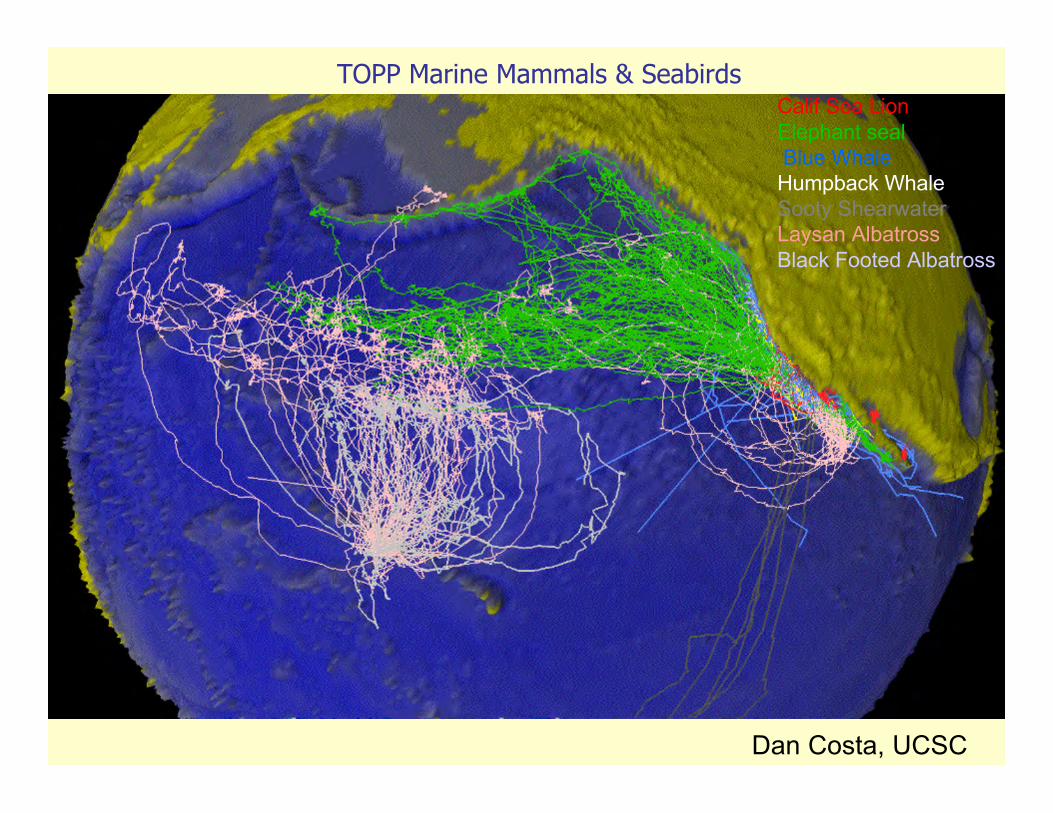
Calif Sea LionElephant seal Blue WhaleHumpback WhaleSooty ShearwaterLaysan AlbatrossBlack Footed Albatross
TOPP Marine Mammals & Seabirds
Dan Costa, UCSC

Pacific hake migration
Saunders and McFarlane. 1997. CalCOFI Reports 38:147

responses to
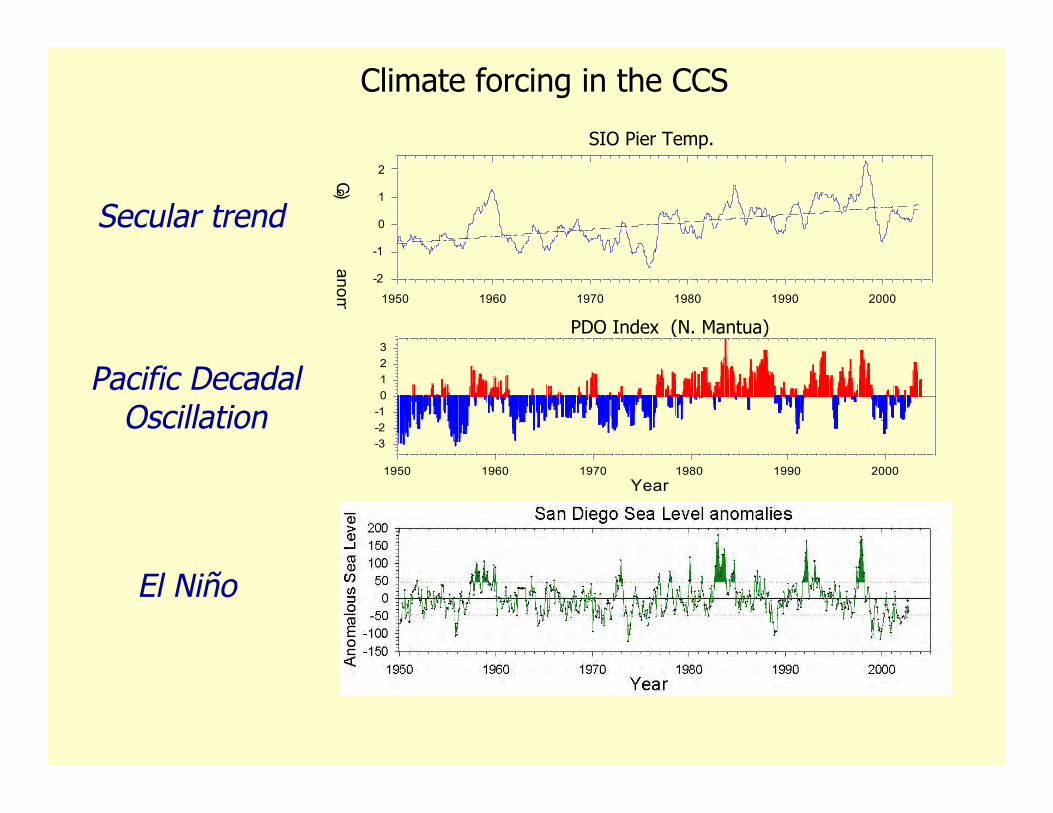
Climate Forcing in the California Current
Secular Changes

Year (A.D.)
Fluxes of subtropical foraminiferaPaleo-reconstructions from S.B. Basin sediments
David B. Field et al. 2006. Science 311:63
Kasten cores (black) + box cores (colors)
X-radiograph
Long-term warming of the NE Pacific Ocean
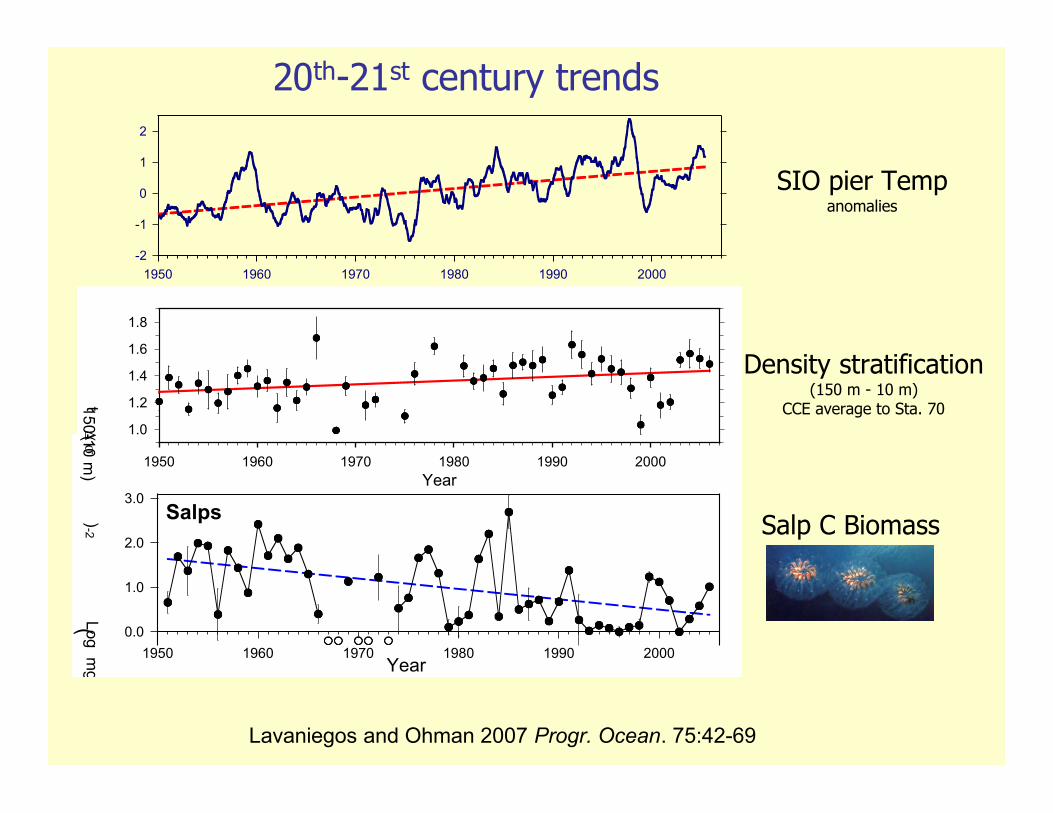
20th-21st century trends
Year1950 1960 1970 1980 1990 2000Tem
perature anomaly (º C
)
-2
-1
0
1
2
SIO pier Tempanomalies
Lavaniegos and Ohman 2007 Progr. Ocean. 75:42-69
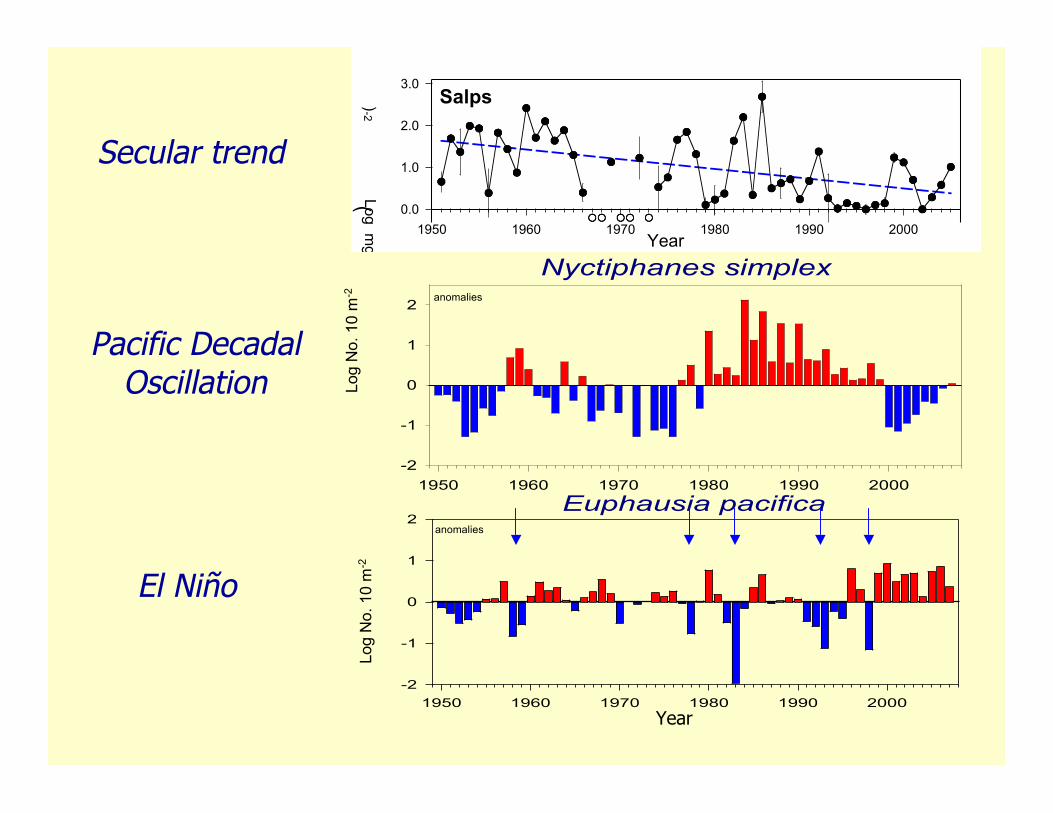
Salps
Year1950 1960 1970 1980 1990 2000
C B
iomass
( Log mg C
m-2
)
0.0
1.0
2.0
3.0
Salp C Biomass
Year1950 1960 1970 1980 1990 2000
Density stratification
( Δ σt 150-10 m
)
1.0
1.2
1.4
1.6
1.8
Density stratification(150 m - 10 m)
CCE average to Sta. 70

1949 1959 1969 1979 1989 1999
Year
0
10
20
30
40
50
Secchi depth (m
)
0
20
40
60
80
100N
itracline depth (m)
Secchi depth Nitracline depth
B
Aksnes and Ohman, unpubl.
Long-term changes in water column transparency

Multi-decadal Ecosystem Shifts
responses to
Climate Forcing in the California Current
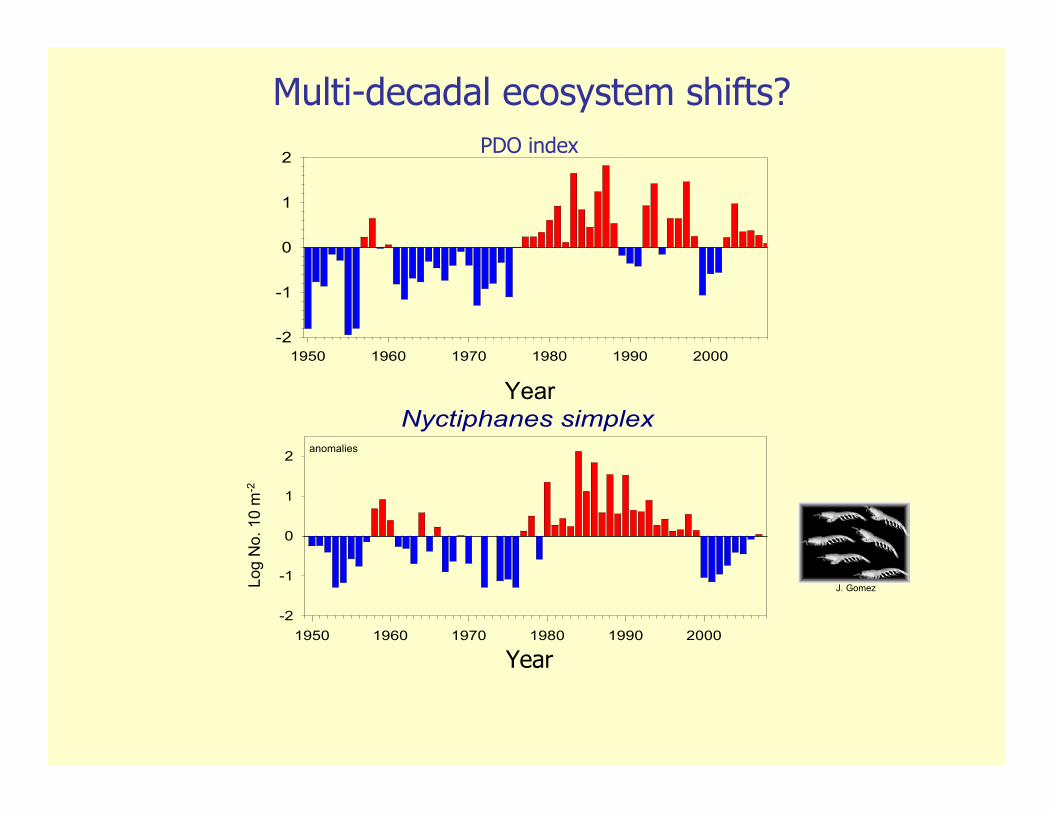
Multi-decadal ecosystem shifts?
Year1950 1960 1970 1980 1990 2000
PDO Index
-2
-1
0
1
2 PDO index
Log
No.
10
m-2
1950 1960 1970 1980 1990 2000-2
-1
0
1
2
Nyctiphanes simplexanomalies
J. Gomez
Year

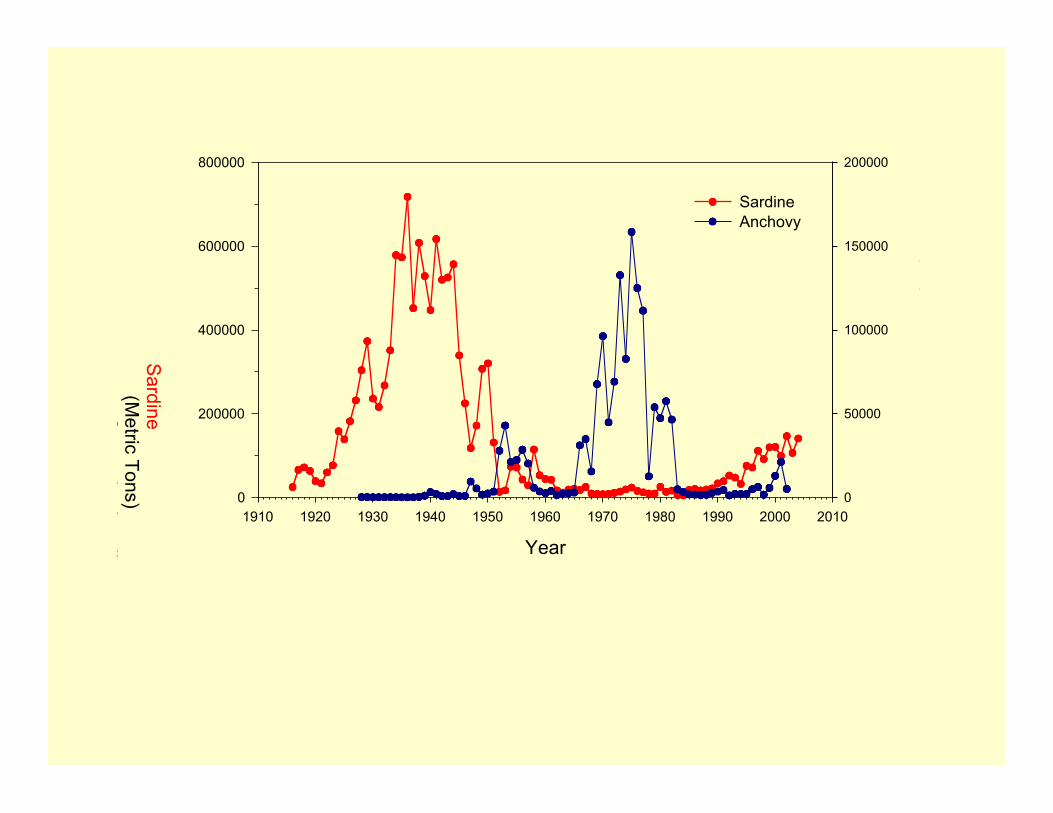
Decline of the California sardine in the early 1940’s:
Figure courtesy of D. Checkley & SWFSC

• 1949 → present
• Perhaps the most comprehensive biological- chemical-physical oceanographic time series in existence
Sampling pattern since 1984(today, quarterly cruises)
Partners: SIO, NMFS, Calif. DFGBasic station pattern
CalCOFI California Cooperative Oceanic Fisheries Investigations
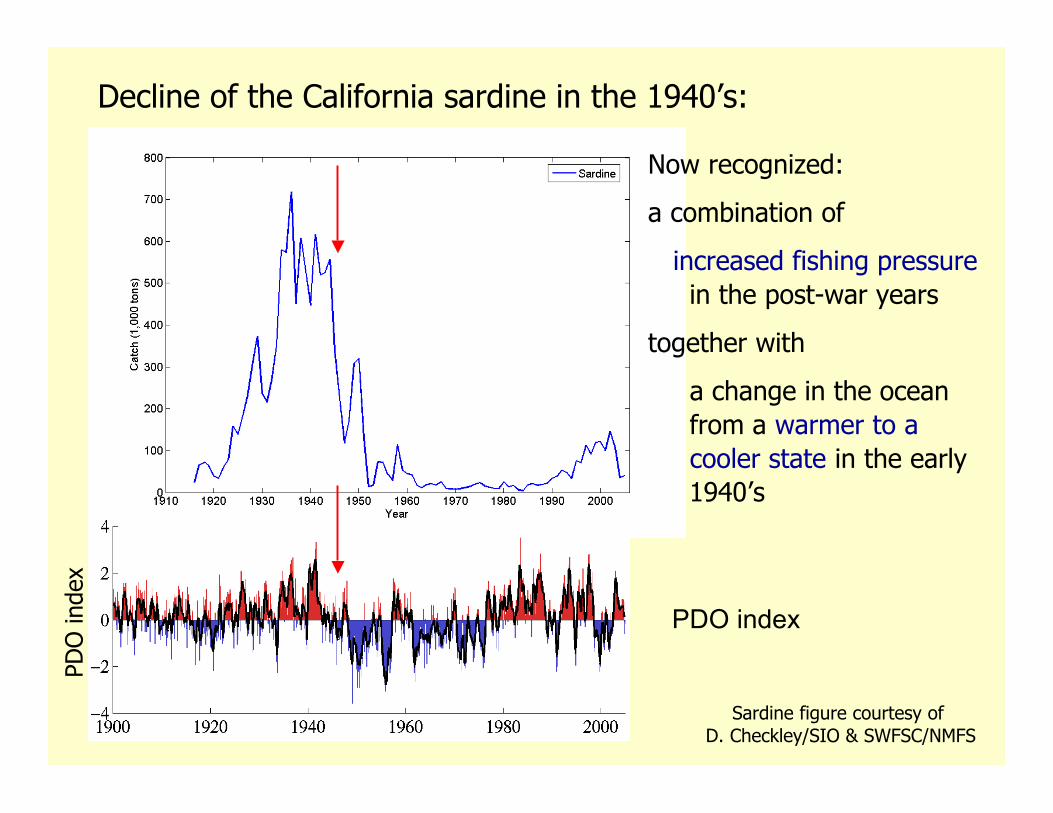
Decline of the California sardine in the 1940’s:
Sardine figure courtesy of D. Checkley/SIO & SWFSC/NMFS
Now recognized:
a combination of
increased fishing pressure in the post-war years
together with
a change in the ocean from a warmer to a cooler state in the early 1940’s
PDO
inde
x
PDO index

responses to
Climate Forcing in the California Current
El Niño
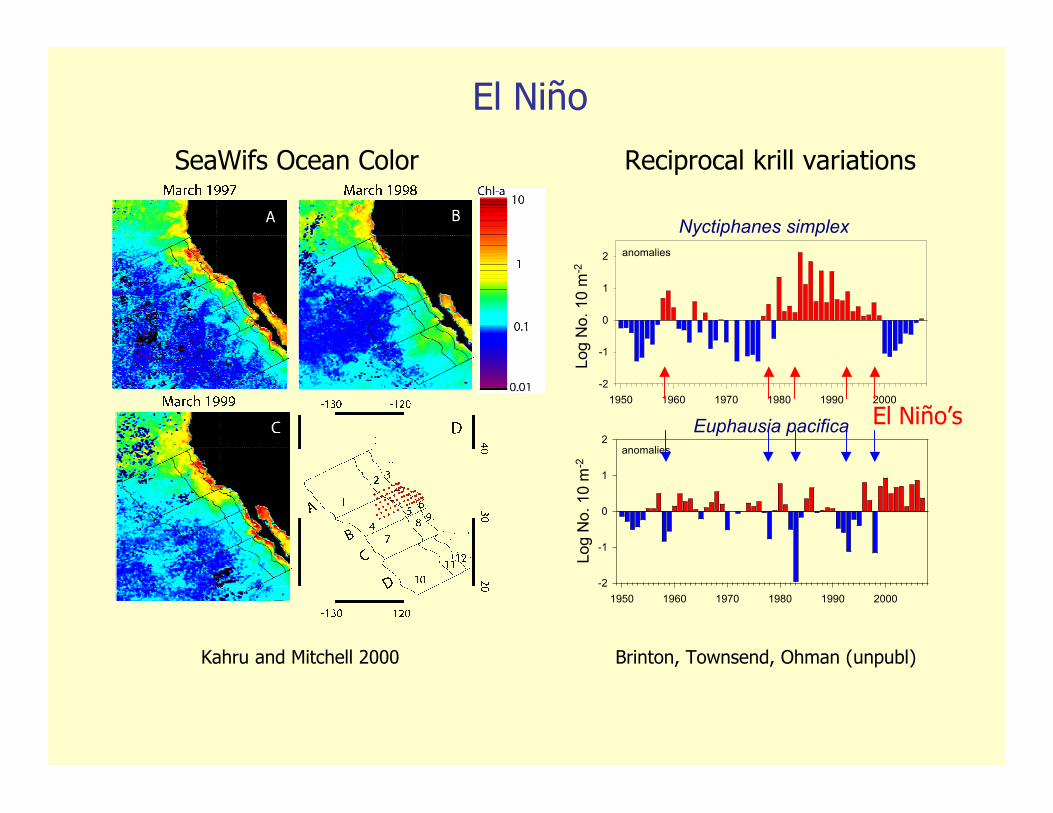
El Niño
Kahru and Mitchell 2000
SeaWifs Ocean Color
1950 1960 1970 1980 1990 2000-2
-1
0
1
2
Nyctiphanes simplex
1950 1960 1970 1980 1990 2000-2
-1
0
1
2Euphausia pacifica
Log
No.
10
m-2
Log
No.
10
m-2
anomalies
anomalies
Reciprocal krill variations
Brinton, Townsend, Ohman (unpubl)
El Niño’s

Butler 1989
El Niño effects on growth rate of juvenile N. anchovy
Engraulis mordax
- strong El Niño year
Salps
Year1950 1960 1970 1980 1990 2000
C B
iomass
( Log mg C
m-2
)
0.0
1.0
2.0
3.0
Log
No.
10
m-2
1950 1960 1970 1980 1990 2000-2
-1
0
1
2
Nyctiphanes simplexanomalies
1950 1960 1970 1980 1990 2000-2
-1
0
1
2Euphausia pacifica
Log
No.
10
m-2
anomalies
Secular trend
Pacific DecadalOscillation
El Niño
Year
Summary
• The California Current pelagic ecosystem is influenced by very large-scale changes in the ocean and atmosphere
• Food web effects of a warming trend, multi-decadal shifts, and El Niño have already been documented (esp. from the CalCOFI region)
• It is vitally important to build and sustain measurement programs that document biological changes in ocean ecosystems, and not to rely on surrogate measures of physical ocean variables alone

fin

Do biological systems “track” physical systems in a linear
manner, or do biological systems show characteristic
variations that cannot be predicted from ocean physics
alone?

Linear vs. Nonlinear Responses
Time
Mag
nitu
de
Time
Mag
nitu
deLinear
Nonlinear
Forcing
Response
Forcing Response
Nonlinear: commonly exhibit thresholds
courtesy of Peter Franks

Time scale Physical variable Best θ Δ r Nonlinear? N p-valueweekly Scripps Pier SST 0 0 NO 4226 1monthly Scripps Pier SST 0 0 NO 984 1monthly Pacific Grove SST 0 0 NO 945 1monthly Farallones SST 0 0 NO 764 1monthly PDO 0 0 NO 1248 1monthly NPI 0 0 NO 1260 1monthly SOI 0 0 NO 852 1quarterly Scripps Pier SST 0 0 NO 328 1quarterly PDO 0 0 NO 416 1quarterly NPI 0 0 NO 420 1quarterly SOI 0 0 NO 284 1annual Scripps Pier SST, composite 0 0 NO 984 1annual PDO, composite 0 0 NO 1248 1annual NPI, composite 0 0 NO 1260 1annual SOI, composite 0 0 NO 852 1
θ = nonlinear tuning parameter, Δ r = improvement in forecast skill (nonlinear - global linear model)
Physical time series from the North Pacific
Chih-hao Hsieh et al. (2005) Nature 435: 336
S-map method
Exhibit characteristics of linear red noise
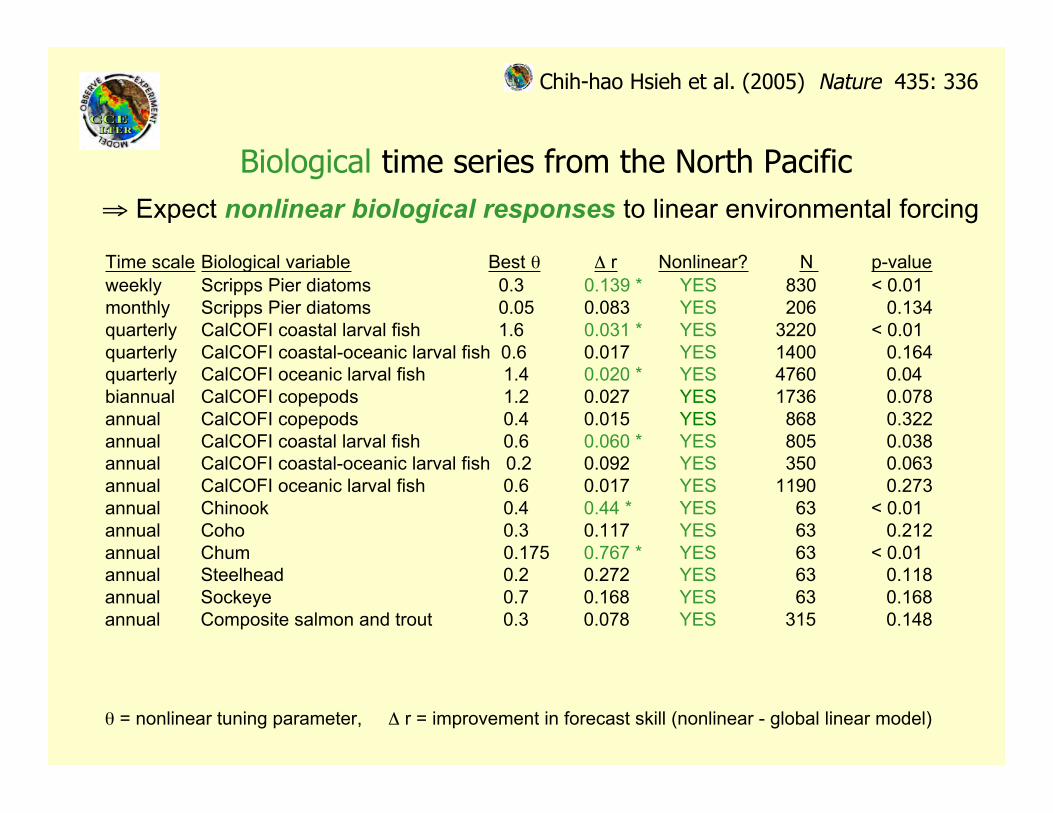
Time scale Biological variable Best θ Δ r Nonlinear? N p-valueweekly Scripps Pier diatoms 0.3 0.139 * YES 830 < 0.01monthly Scripps Pier diatoms 0.05 0.083 YES 206 0.134quarterly CalCOFI coastal larval fish 1.6 0.031 * YES 3220 < 0.01quarterly CalCOFI coastal-oceanic larval fish 0.6 0.017 YES 1400 0.164quarterly CalCOFI oceanic larval fish 1.4 0.020 * YES 4760 0.04biannual CalCOFI copepods 1.2 0.027 YES 1736 0.078annual CalCOFI copepods 0.4 0.015 YES 868 0.322annual CalCOFI coastal larval fish 0.6 0.060 * YES 805 0.038annual CalCOFI coastal-oceanic larval fish 0.2 0.092 YES 350 0.063annual CalCOFI oceanic larval fish 0.6 0.017 YES 1190 0.273annual Chinook 0.4 0.44 * YES 63 < 0.01annual Coho 0.3 0.117 YES 63 0.212annual Chum 0.175 0.767 * YES 63 < 0.01annual Steelhead 0.2 0.272 YES 63 0.118annual Sockeye 0.7 0.168 YES 63 0.168annual Composite salmon and trout 0.3 0.078 YES 315 0.148
θ = nonlinear tuning parameter, Δ r = improvement in forecast skill (nonlinear - global linear model)
Biological time series from the North Pacific ⇒ Expect nonlinear biological responses to linear environmental forcing
Chih-hao Hsieh et al. (2005) Nature 435: 336
Year
1910 1920 1930 1940 1950 1960 1970 1980 1990 2000 2010
Coastw
ise Landings (M
etric Tons)S
ardine
0
200000
400000
600000
800000
Anc
hovy
0
50000
100000
150000
200000
SardineAnchovy

• Experimental Process Cruises
CCE LTER Program Elements
- Focusing on altered stratification and nutrient supply
- Exploiting spatial differences as an analog oftemporal change
Stratified, deep nitracline Deep mixed layer Low vertical velocities Picoplankton dominated Microbial food web
Well mixed, shallow nitracline Shallow mixed layer Strong upwelling (coastal boundaryor wind stress curl) Microplankton dominated Metazoan food web
1950 1960 1970 1980 1990 2000
Temperature
anomaly (
oC)
-2
-1
0
1
2
Secular trend
Climate forcing in the CCS
SIO Pier Temp.
El Niño
PDO Index (N. Mantua)
Year1950 1960 1970 1980 1990 2000
PDO
Index
-3-2-10123
Pacific DecadalOscillation

Collier & Palenik (2003)
Changing phytoplankton biomass and community structure in relation to nitracline depth

Nitracline Depth vs. Time
0
20
40
60
80
1984 1986 1988 1990 1992 1994 1996 1998 2000 2002 2004Year
Nitr
aclin
e Dep
th (m
)CCE-average
from CalCOFI data
(Goericke, unpub.)
Spatial differences in nitracline depth : CCE site

http://ccelter.sio.ucsd.edu Scripps Institution of Oceanography/U.C.S.D.
CCE LTER Station Plan
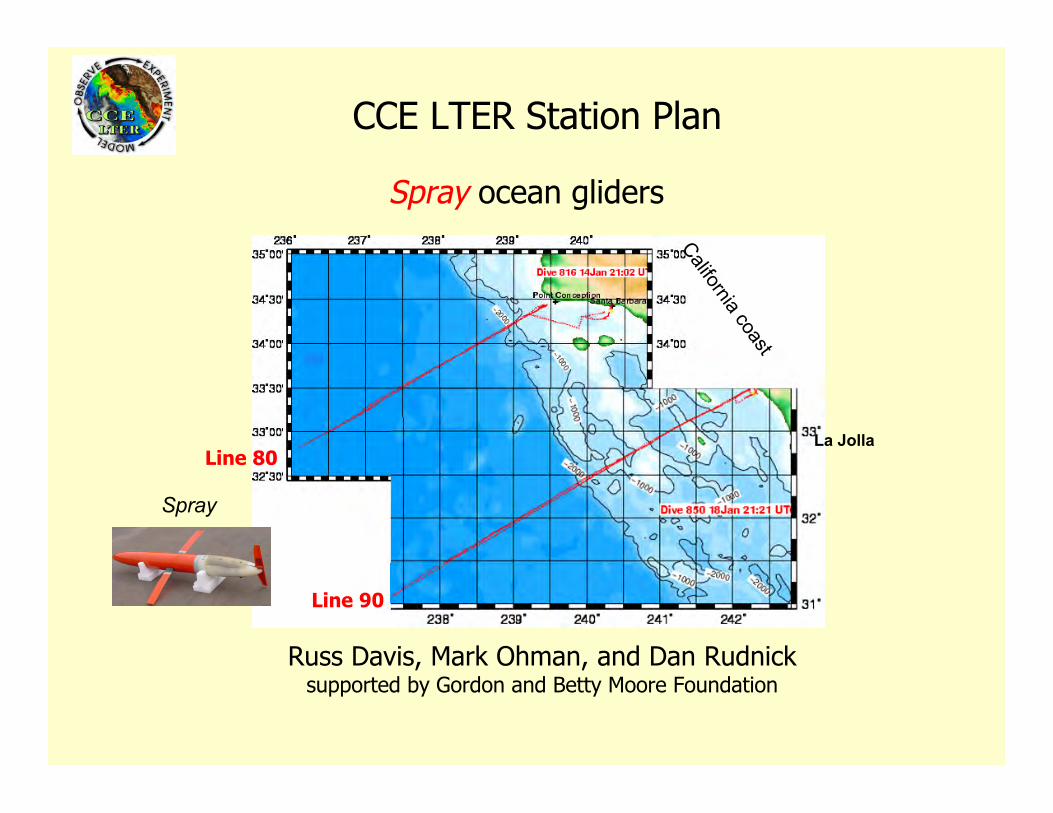
CCE LTER Station Plan
Line 80
Line 90
California coast
La Jolla
Russ Davis, Mark Ohman, and Dan Rudnicksupported by Gordon and Betty Moore Foundation
Spray ocean gliders
Spray
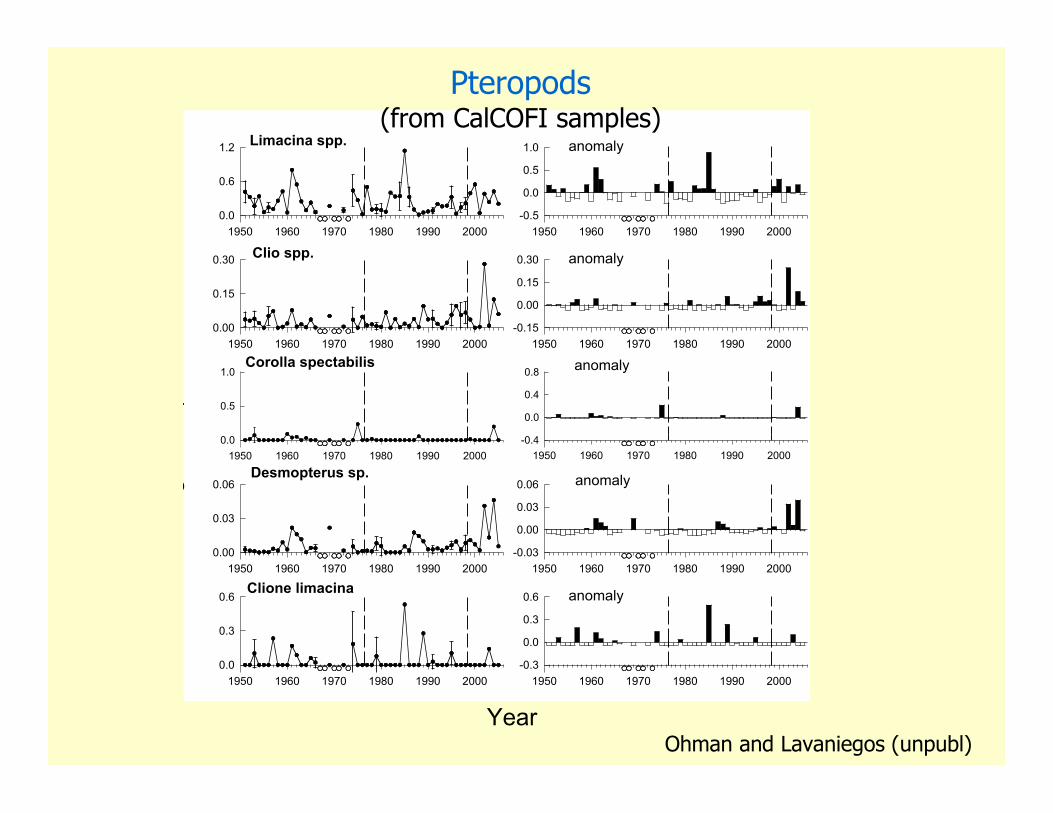
Log mg C
m-2
Limacina spp.
1950 1960 1970 1980 1990 20000.0
0.6
1.2 anomaly
1950 1960 1970 1980 1990 2000-0.5
0.0
0.5
1.0
Clio spp.
1950 1960 1970 1980 1990 20000.00
0.15
0.30 anomaly
1950 1960 1970 1980 1990 2000-0.15
0.00
0.15
0.30
Corolla spectabilis
1950 1960 1970 1980 1990 20000.0
0.5
1.0
Desmopterus sp.
1950 1960 1970 1980 1990 20000.00
0.03
0.06
Clione limacina
1950 1960 1970 1980 1990 20000.0
0.3
0.6
anomaly
1950 1960 1970 1980 1990 2000-0.4
0.0
0.4
0.8
anomaly
1950 1960 1970 1980 1990 2000-0.03
0.00
0.03
0.06
anomaly
1950 1960 1970 1980 1990 2000-0.3
0.0
0.3
0.6
d
e
f
g
Pteropods(from CalCOFI samples)
YearOhman and Lavaniegos (unpubl)
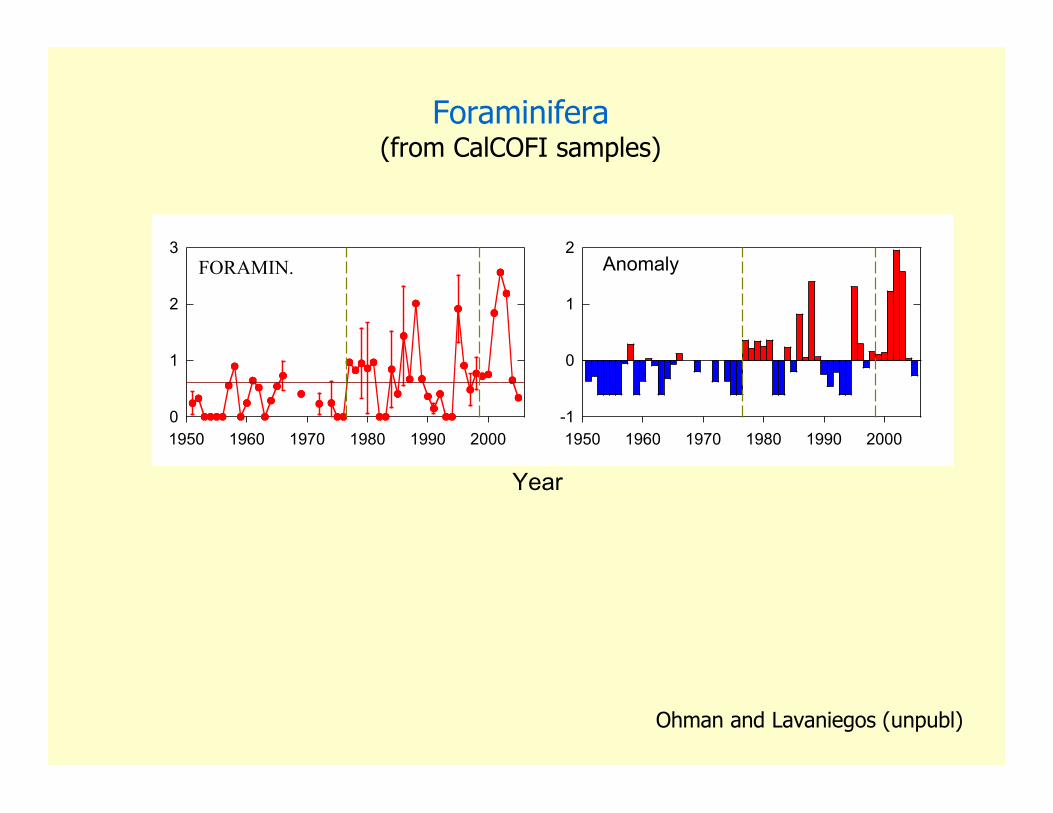
Anomaly
1950 1960 1970 1980 1990 2000-1
0
1
2FORAMIN.
1950 1960 1970 1980 1990 20000
1
2
3
Foraminifera(from CalCOFI samples)
Ohman and Lavaniegos (unpubl)
Year
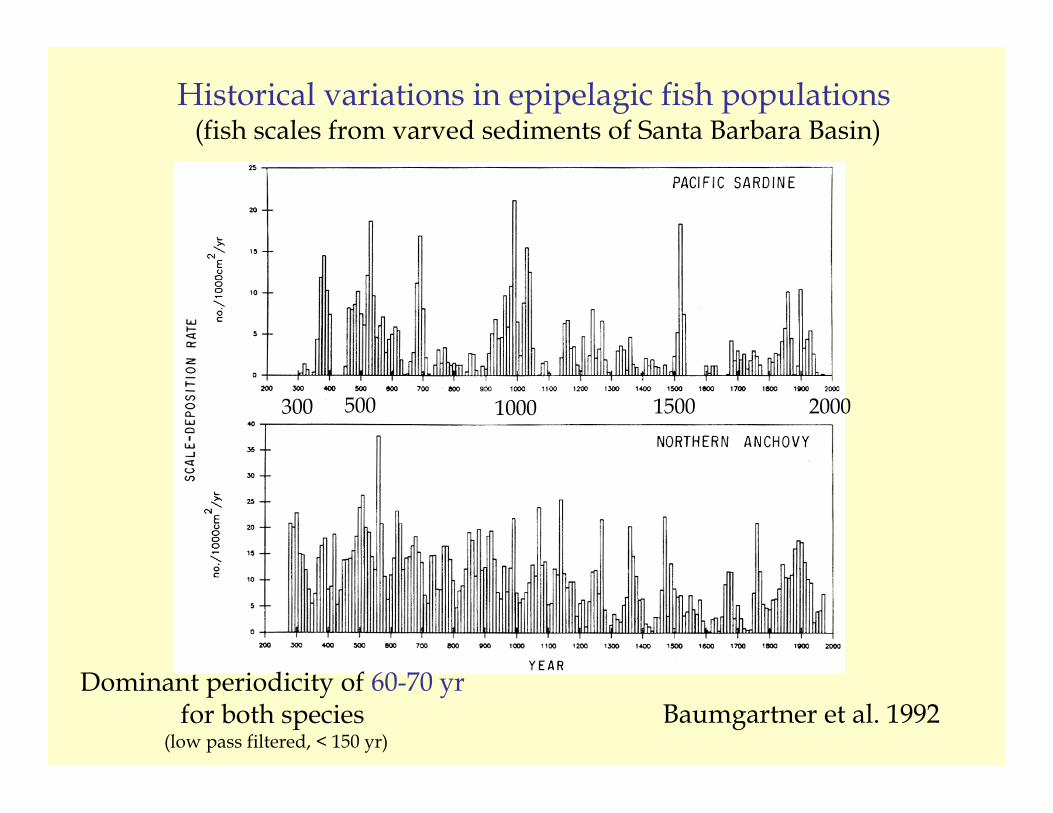
Baumgartner et al. 1992Dominant periodicity of 60-70 yr
for both species (low pass filtered, < 150 yr)
300 2000
Historical variations in epipelagic fish populations (fish scales from varved sediments of Santa Barbara Basin)
1000 1500500
Rebstock 2001
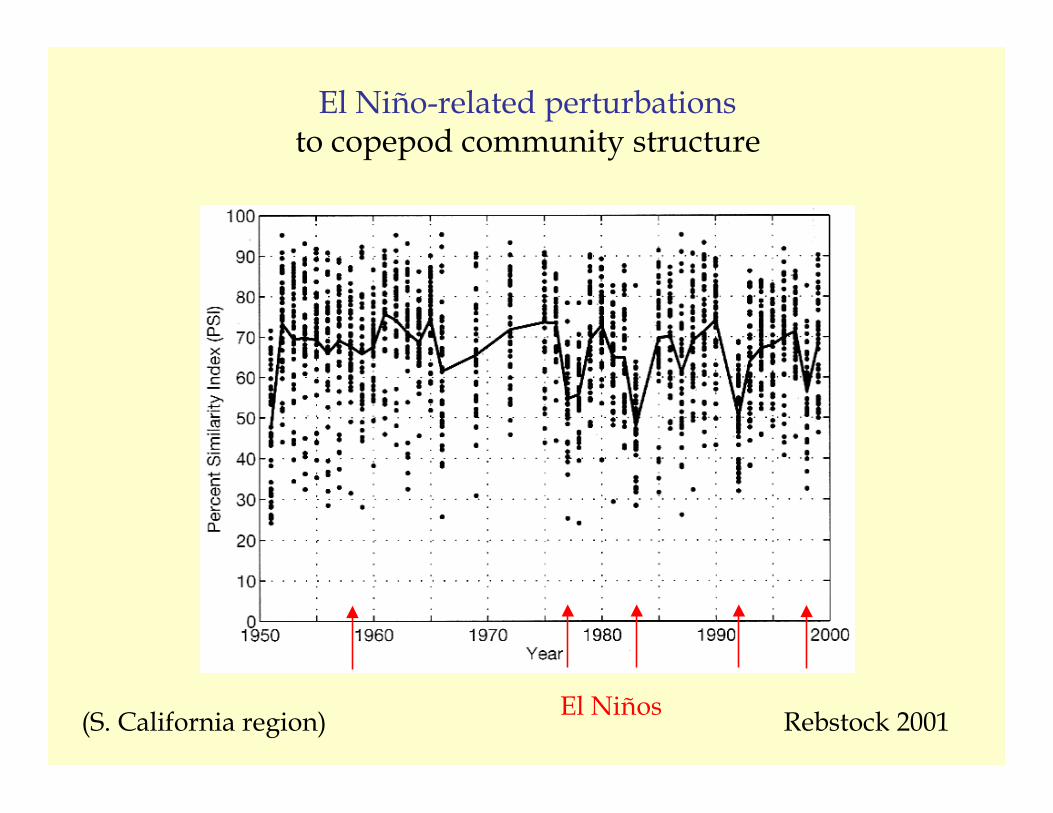
El Niño-related perturbationsto copepod community structure
El Niños(S. California region)

Multidecadal Variation
Ohman and Venrick 2003Lavaniegos and Ohman 2003Brinton and Townsend 2003
euphausiid
doliolid
salps
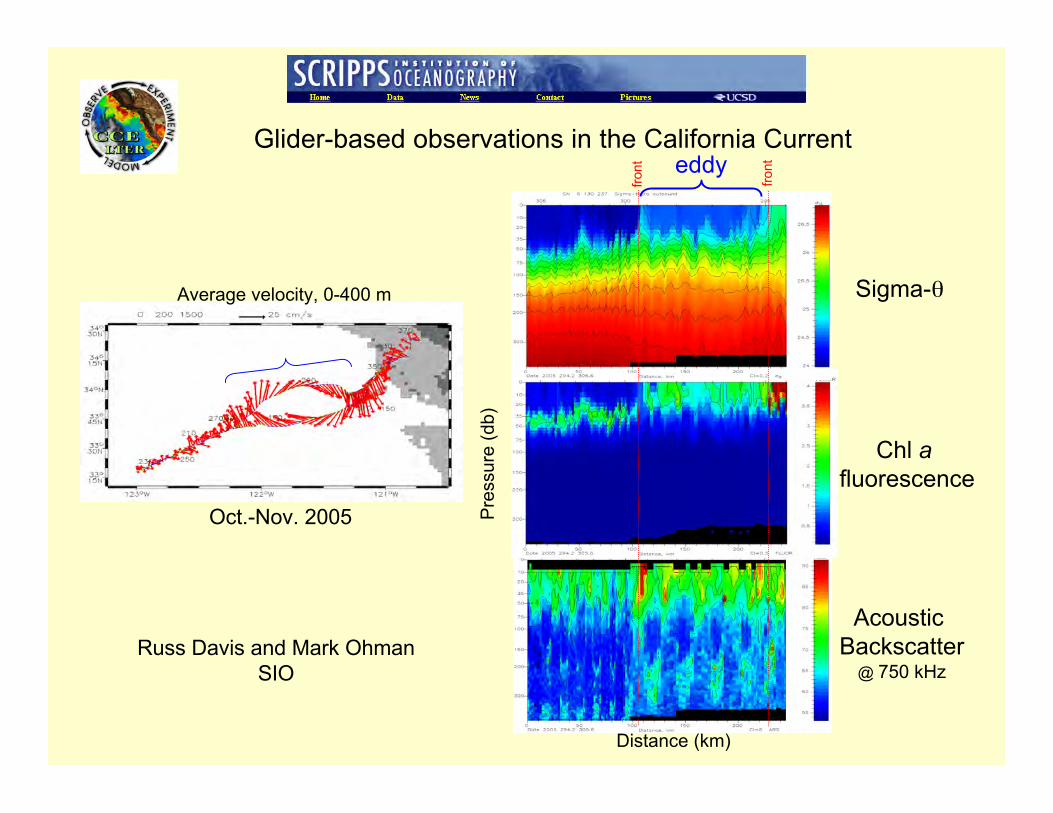
Average velocity, 0-400 m Sigma-θ
Chl a fluorescence
eddy
Acoustic Backscatter
@ 750 kHz
Pre
ssur
e (d
b)
Russ Davis and Mark OhmanSIO
Glider-based observations in the California Current
Distance (km)
Oct.-Nov. 2005
front
front
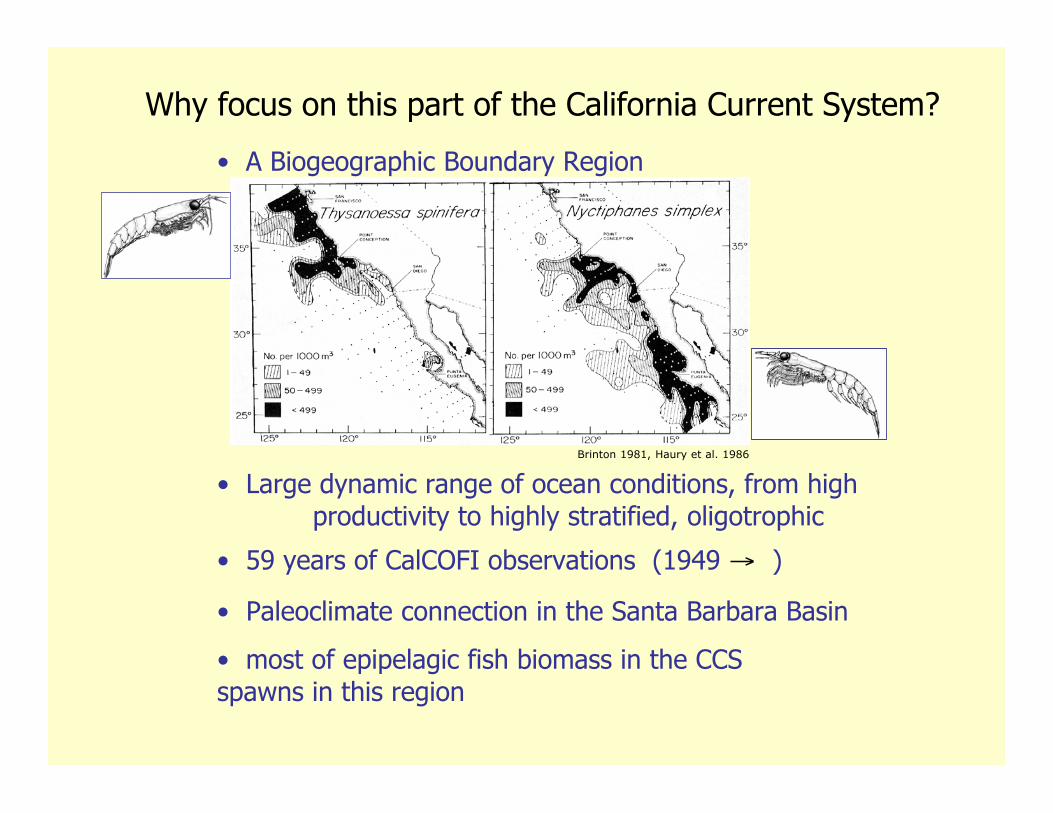
Why focus on this part of the California Current System?
• Large dynamic range of ocean conditions, from highproductivity to highly stratified, oligotrophic
• 59 years of CalCOFI observations (1949 → )
• most of epipelagic fish biomass in the CCS spawns in this region
• Paleoclimate connection in the Santa Barbara Basin
Brinton 1981, Haury et al. 1986
• A Biogeographic Boundary Region
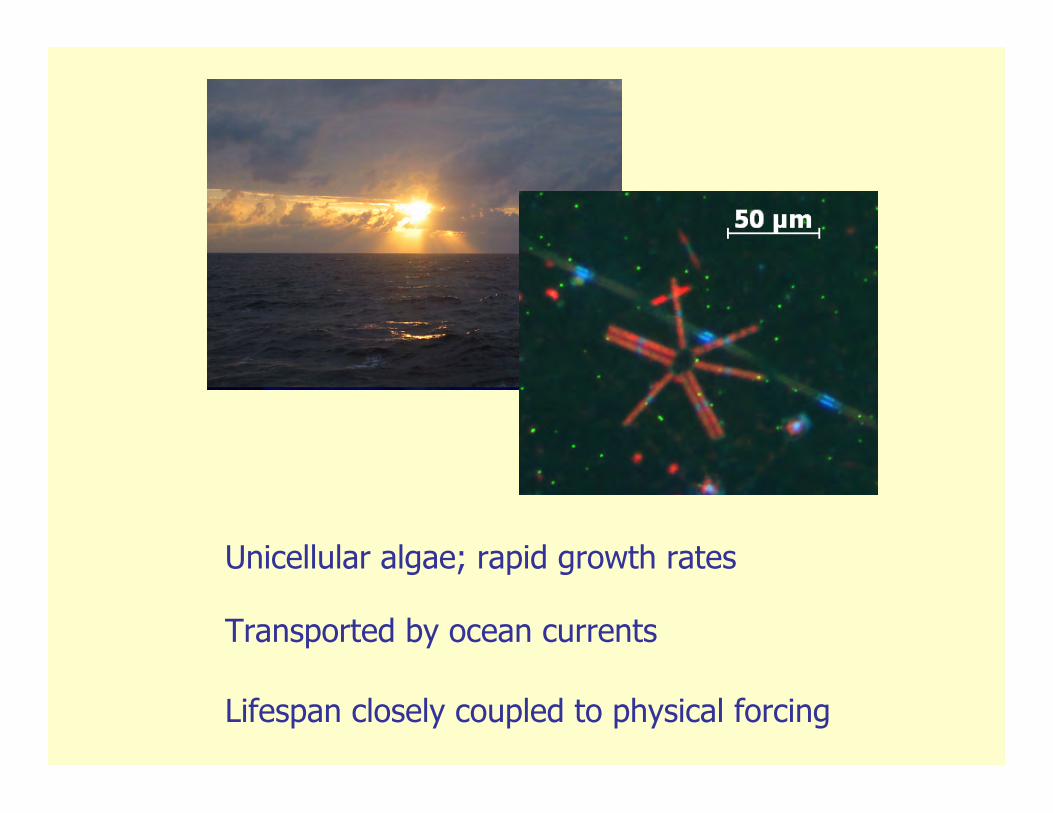
Transported by ocean currents
Lifespan closely coupled to physical forcing
Unicellular algae; rapid growth rates

• exploited species
Δ unexploited species
Chih-hao Hsieh et al. 2006 Nature 443:859
Fishing effects on population variability and extinction risk > 55 years of ichthyoplankton observations from CalCOFI
destabilizing effect of fishery-induced truncation ofpopulation age structure
Harvesting