climate monitoring bulletin australia
TRANSCRIPT
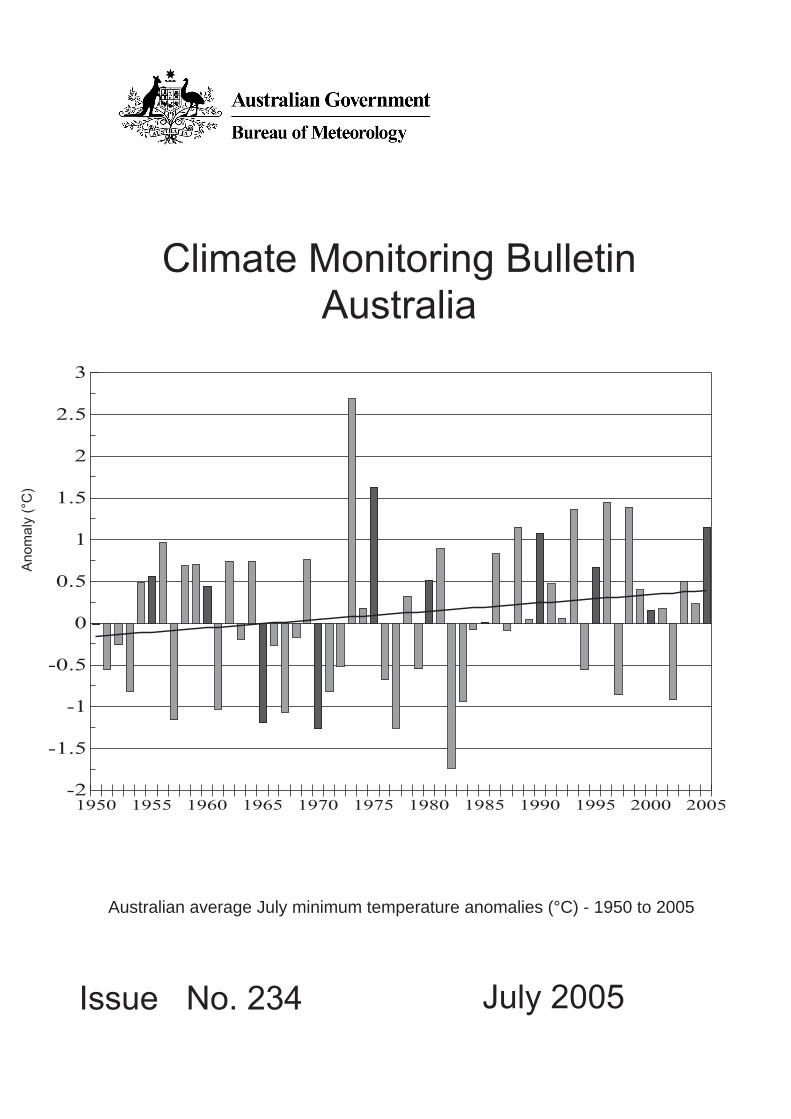
Climate Monitoring BulletinAustralia
Issue No. 234 July 2005
Australian average July minimum temperature anomalies (°C) - 1950 to 2005
-2
-1.5
-1
-0.5
0
0.5
1
1.5
2
2.5
3
1950 1955 1960 1965 1970 1975 1980 1985 1990 1995 2000 2005
Anom
aly
(°C
)
The Climate Monitoring Bulletin is prepared by the Australian Bureau of Meteorology's NationalClimate Centre. It is issued three to four weeks after the end of each month.
Correspondence relating to the bulletin April be directed to:
Climate Analysis SectionNational Climate CentreBureau of MeteorologyGPO Box 1289KMelbourne, VIC 3001Australia
Phone: 03 9669 4527FAX: 03 9669 4678 or+61 3 9669 4678 (international)
If you use any of the information from this Climate Monitoring Bulletin, please identify "National
Climate Centre, Bureau of Meteorology" as the source.
Figure on the front cover: Australian average minimum temperature anomalies for July (°C)- 1950 to 2005, with a linear trend line superimposed. The anomalies have been calculatedwith respect to the 1961-1990 base period, and have been obtained from a high qualitytemperature data set maintained by the National Climate Centre.
Note: The anomalies shown in Figures 5(b), 6(b), 7(b), 8(b), 11 and 12 have been calculatedusing a twenty-two year climatology covering the period 1979-2000 obtained from theUnited States of America’s National Centers for Environmental Prediction.
© Commonwealth of Australia 2005Published by the Australian Bureau of Meteorology, August 2005
1. General Circulation1.1 General1.2 Tropics1.3 Extra-tropics
2. Oceanography2.1 Surface2.2 Subsurface
3. Australian Region3.1 Overview3.2 Rainfall3.3 Rainfall Deficiencies3.4 Temperatures3.5 National and regional averages for recent months
4. Australian National Tidal Centre Contribution
Tables1. Southern Oscillation and related climatic indices2. National and regional averages for recent months3. Australian ozone network report
Figures1. Southern Oscillation Index2. Time series - 5 day running mean of equatorial 200 hPa velocity potential3. Time series - longitude plot of 200 hPa velocity potential4. 200 hPa velocity potential5a,b. Mean sea level pressure analysis and anomaly6a,b. 500 hPa geopotential height analysis and anomaly7a,b. Polar projection - mean sea level pressure analysis and anomaly8a,b. Polar projection - 500 hPa geopotential height analysis and anomaly9. Southern Hemisphere Blocking Index mean10. Southern Hemisphere Blocking Index - time longitude section11. 850 hPa Vector wind anomaly12. 200 hPa Vector wind anomaly13. Satellite derived sea surface temperature analysis14. Sea surface temperature anomaly15. Pacific depth averaged temperature to 150 m - Climatology16, 17. Pacific depth averaged temperature to 150 m - analysis and anomaly18. Pacific equatorial temperature section - Climatology19, 20. Pacific equatorial temperature section - analysis and anomaly21a,b. One month & three month rainfall deciles - Australia22a,b,c. Rainfall deficiencies - Australia23a,b. Maximum & minimum temperature anomaly - Australia24. Location of Australian Baseline Sea Level array25. Sea Level Anomalies26. Sea Level Residuals27. Hourly Wind Vectors
Contents
1.1 General
The July value of the Southern Oscillation Index (SOI) was +0.9, another neutral value following the June figureof +2.6
1(see Figure 1). Recent values of the SOI are listed in Table 1 (at the end of this bulletin), along with
related indices. Other ENSO indicators showed neutral conditions across the Pacific Basin.
1.2 Tropics
1.2.1 MSLPs - Darwin and Tahiti
Mean Sea Level Pressure (MSLP) averages for July were: Darwin 1013.2 hPa (normal 1013.1), Tahiti 1014.3hPa (normal 1014.1).
1.2.2 Winds and Walker Circulation
The Trade Winds during July were mostly close to average (Figure 11). The winds at upper levels were alsomainly near normal (Figure 12). Overall, the combination of winds indicated an average Walker Circulationacross the Pacific for July.
1.2.3 Centres of Convection - Outgoing Longwave Radiation (OLR) and Velocity Potential (VP)
The monthly index of Outgoing Longwave Radiation (OLR) in the region 160°E to 160°W and 5°S to 5°N (not
shown), obtained from the Climate Diagnostics Center in Washington, was −0.3 in July, indicating averagecloudiness, and hence average convection, in the vicinity of the equatorial dateline. High (low) index values areassociated with reduced (increased) cloudiness. This index decreased from June to July, indicating a slightincrease in convection over the two months.
Figure 2 shows a filtered time series of 200 hPa Velocity Potential (VP) averaged from 5°N to 5°S and 120°E to140°E. Decreasing values of VP are associated with increasing upper-level divergence. As part of a longertrend dating from early May, Figure 2 shows decreasing values of VP during July indicating increasingupper-level divergence. Negative OLR values in this area were consistent with the low VP values (seeAtmospheric Circulation Patterns at <http://www.bom.gov.au/cgi-bin/climate/cmb.cgi>). Positive OLR values wereobserved across the equatorial Pacific.
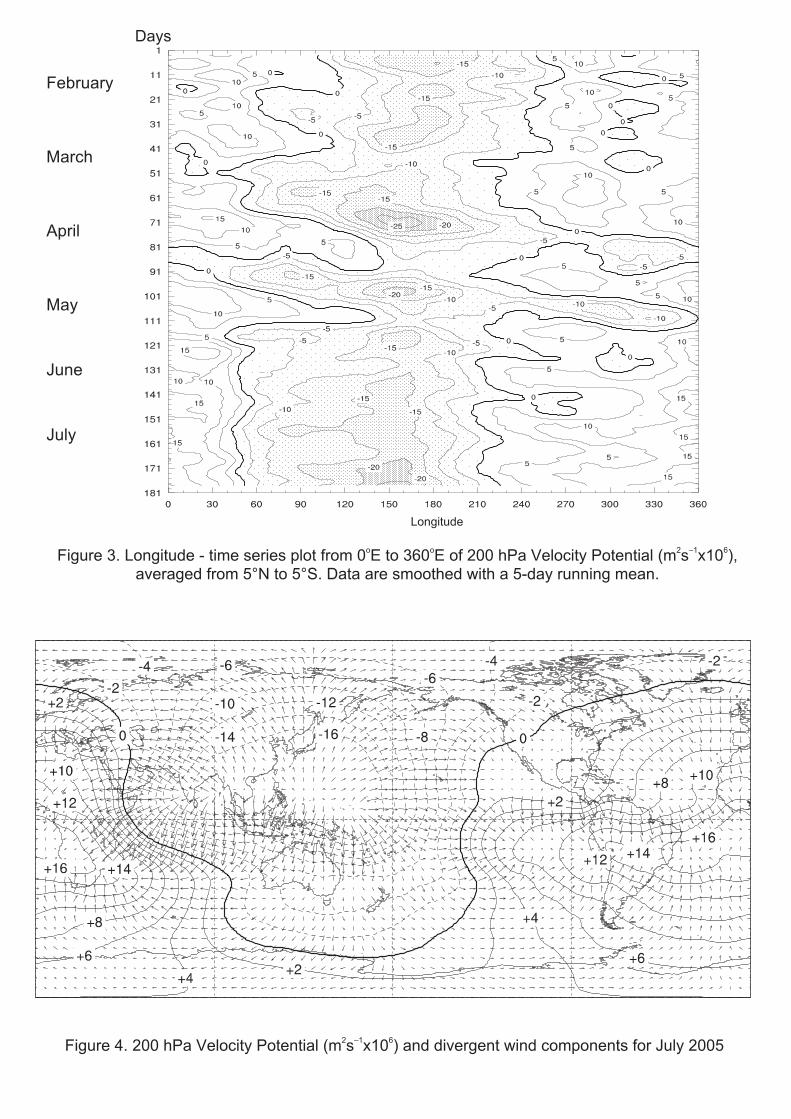
Figure 3 is a time-longitude cross-section of 200 hPa VP averaged across 5°N to 5°S for all longitudes. Thestrongest area of upper-level divergence was located near 150°E late in the month (Figure 3).
The global 200 hPa VP and divergent wind field for July is shown in Figure 4 (negative contours are dashed).The strongest minima in the western Pacific region were located near 5°N 160°E and 10°N to 140°E, the latterbeing close to its average July position. Minima indicate centres of enhanced upper-level divergence andtherefore increased convection in those regions, as can be seen from the OLR anomalies (see AtmosphericCirculation Patterns at <http://www.bom.gov.au/cgi-bin/climate/cmb.cgi>).
1. General Circulation Features
(1) The Troup SOI used here has a standard deviation of +10.
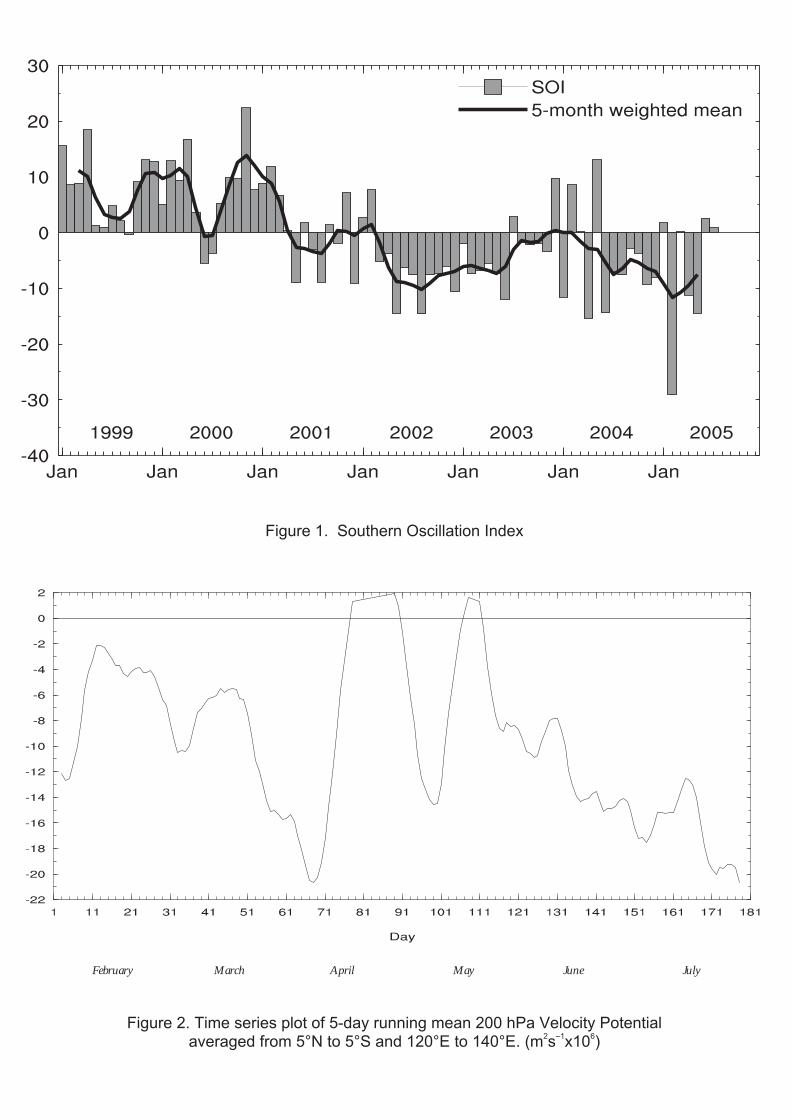
Figure 1. Southern Oscillation Index
Figure 2. Time series plot of 5-day running mean 200 hPa Velocity Potentialaveraged from 5°N to 5°S and 120°E to 140°E. (m
2s
–1x10
6)
February March April May June July
Days
February
March
April
May
June
July
Figure 3. Longitude - time series plot from 0oE to 360
oE of 200 hPa Velocity Potential (m
2s
–1x10
6),
averaged from 5°N to 5°S. Data are smoothed with a 5-day running mean.
Figure 4. 200 hPa Velocity Potential (m2s
–1x10
6) and divergent wind components for July 2005
1.3 Extra-tropics
1.3.1 Pressure and height fields
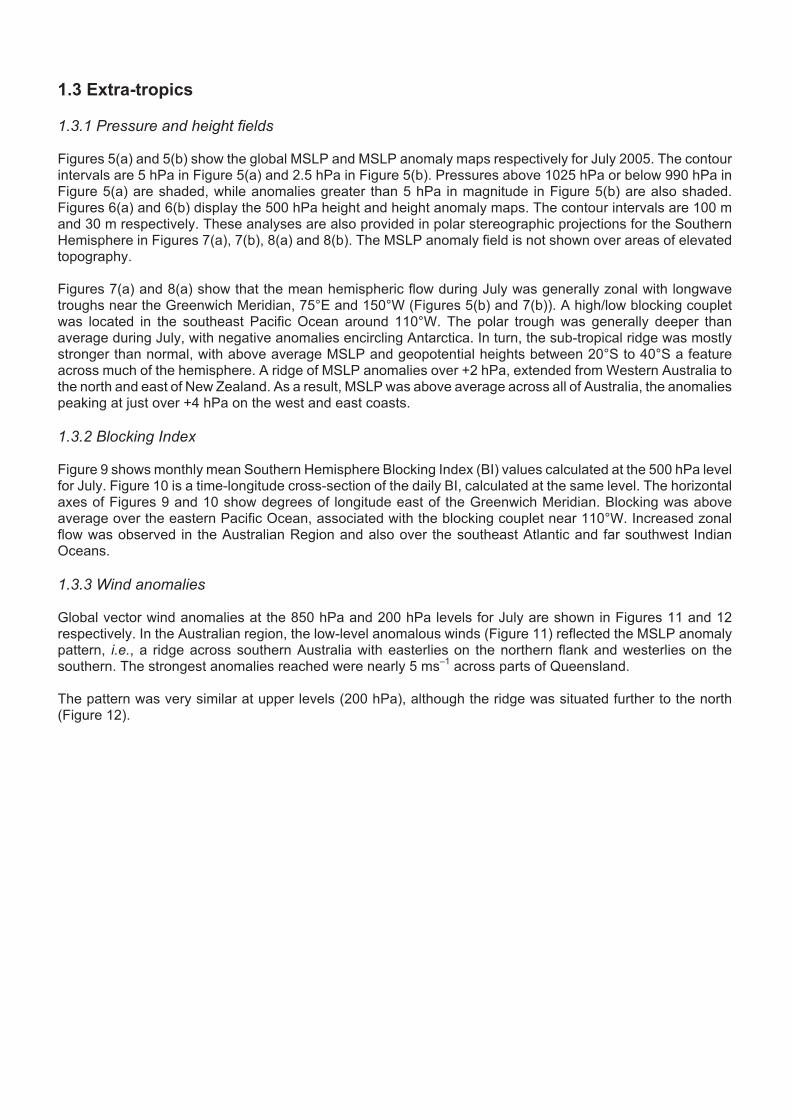
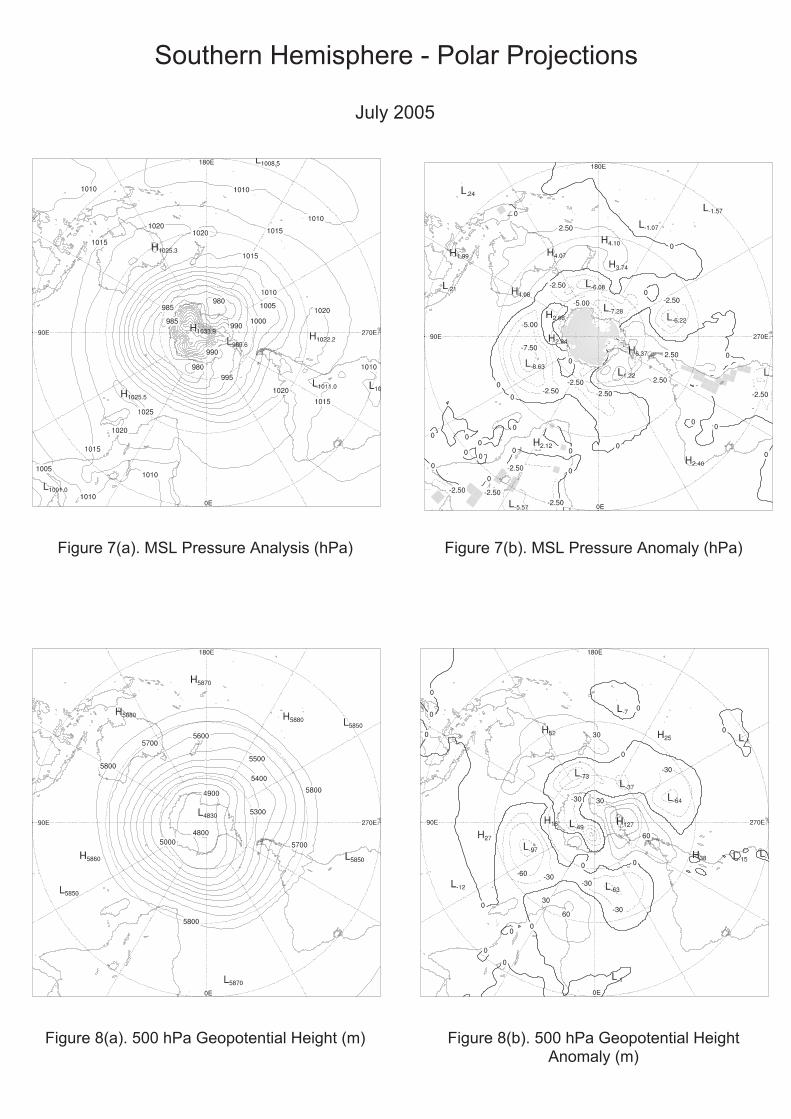
Figures 5(a) and 5(b) show the global MSLP and MSLP anomaly maps respectively for July 2005. The contourintervals are 5 hPa in Figure 5(a) and 2.5 hPa in Figure 5(b). Pressures above 1025 hPa or below 990 hPa inFigure 5(a) are shaded, while anomalies greater than 5 hPa in magnitude in Figure 5(b) are also shaded.Figures 6(a) and 6(b) display the 500 hPa height and height anomaly maps. The contour intervals are 100 mand 30 m respectively. These analyses are also provided in polar stereographic projections for the SouthernHemisphere in Figures 7(a), 7(b), 8(a) and 8(b). The MSLP anomaly field is not shown over areas of elevatedtopography.
Figures 7(a) and 8(a) show that the mean hemispheric flow during July was generally zonal with longwavetroughs near the Greenwich Meridian, 75°E and 150°W (Figures 5(b) and 7(b)). A high/low blocking coupletwas located in the southeast Pacific Ocean around 110°W. The polar trough was generally deeper thanaverage during July, with negative anomalies encircling Antarctica. In turn, the sub-tropical ridge was mostlystronger than normal, with above average MSLP and geopotential heights between 20°S to 40°S a featureacross much of the hemisphere. A ridge of MSLP anomalies over +2 hPa, extended from Western Australia tothe north and east of New Zealand. As a result, MSLP was above average across all of Australia, the anomaliespeaking at just over +4 hPa on the west and east coasts.
1.3.2 Blocking Index
Figure 9 shows monthly mean Southern Hemisphere Blocking Index (BI) values calculated at the 500 hPa levelfor July. Figure 10 is a time-longitude cross-section of the daily BI, calculated at the same level. The horizontalaxes of Figures 9 and 10 show degrees of longitude east of the Greenwich Meridian. Blocking was aboveaverage over the eastern Pacific Ocean, associated with the blocking couplet near 110°W. Increased zonalflow was observed in the Australian Region and also over the southeast Atlantic and far southwest IndianOceans.
1.3.3 Wind anomalies
Global vector wind anomalies at the 850 hPa and 200 hPa levels for July are shown in Figures 11 and 12respectively. In the Australian region, the low-level anomalous winds (Figure 11) reflected the MSLP anomalypattern, i.e., a ridge across southern Australia with easterlies on the northern flank and westerlies on thesouthern. The strongest anomalies reached were nearly 5 ms
–1across parts of Queensland.
The pattern was very similar at upper levels (200 hPa), although the ridge was situated further to the north(Figure 12).
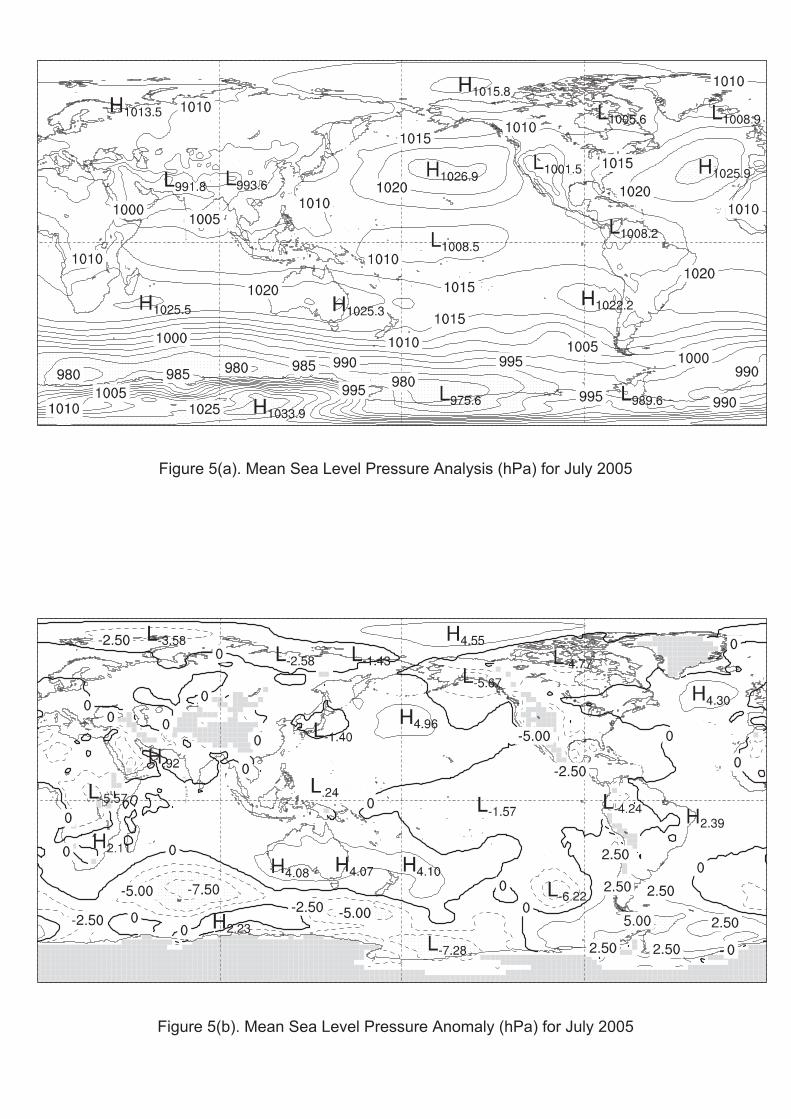
Figure 5(a). Mean Sea Level Pressure Analysis (hPa) for July 2005
Figure 5(b). Mean Sea Level Pressure Anomaly (hPa) for July 2005
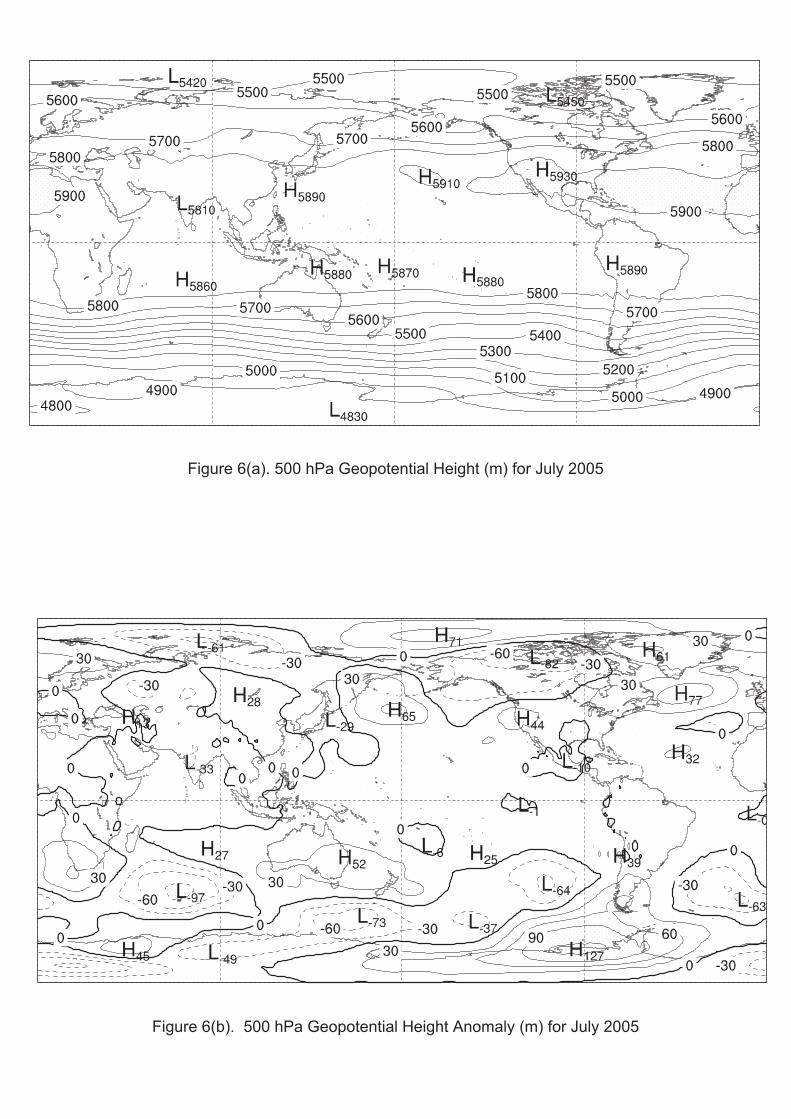
Figure 6(a). 500 hPa Geopotential Height (m) for July 2005
Figure 6(b). 500 hPa Geopotential Height Anomaly (m) for July 2005
Southern Hemisphere - Polar Projections
July 2005
Figure 7(a). MSL Pressure Analysis (hPa) Figure 7(b). MSL Pressure Anomaly (hPa)
Figure 8(a). 500 hPa Geopotential Height (m) Figure 8(b). 500 hPa Geopotential HeightAnomaly (m)
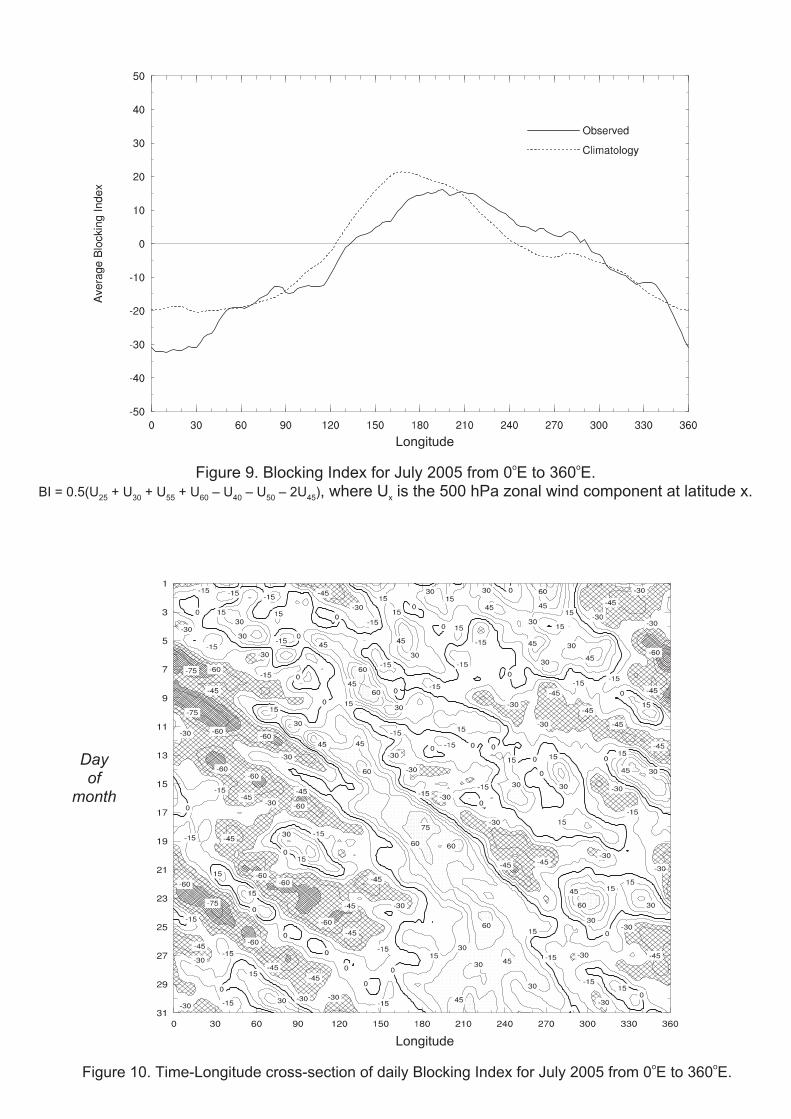
Figure 9. Blocking Index for July 2005 from 0oE to 360
oE.
BI = 0.5(U25
+ U30
+ U55
+ U60
– U40
– U50
– 2U45
), where Uxis the 500 hPa zonal wind component at latitude x.
Dayof
month
Figure 10. Time-Longitude cross-section of daily Blocking Index for July 2005 from 0oE to 360
oE.
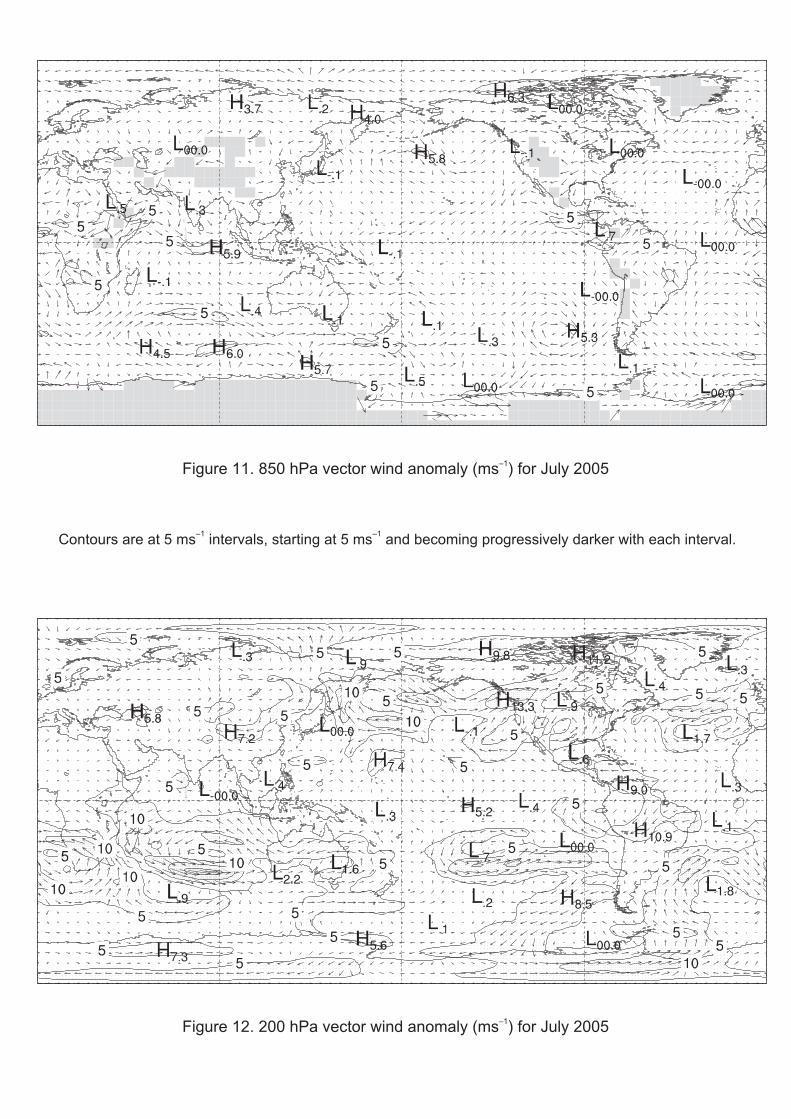
Figure 11. 850 hPa vector wind anomaly (ms–1
) for July 2005
Figure 12. 200 hPa vector wind anomaly (ms–1
) for July 2005
Contours are at 5 ms–1
intervals, starting at 5 ms–1
and becoming progressively darker with each interval.
2.1 Surface
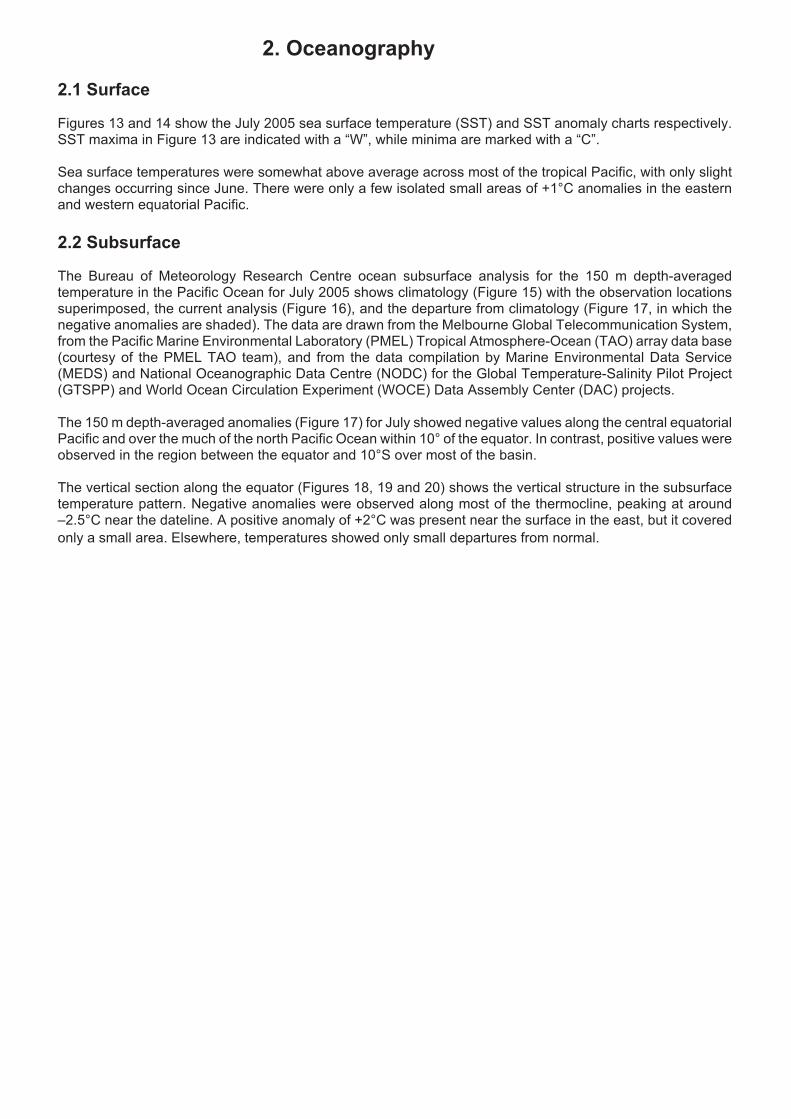
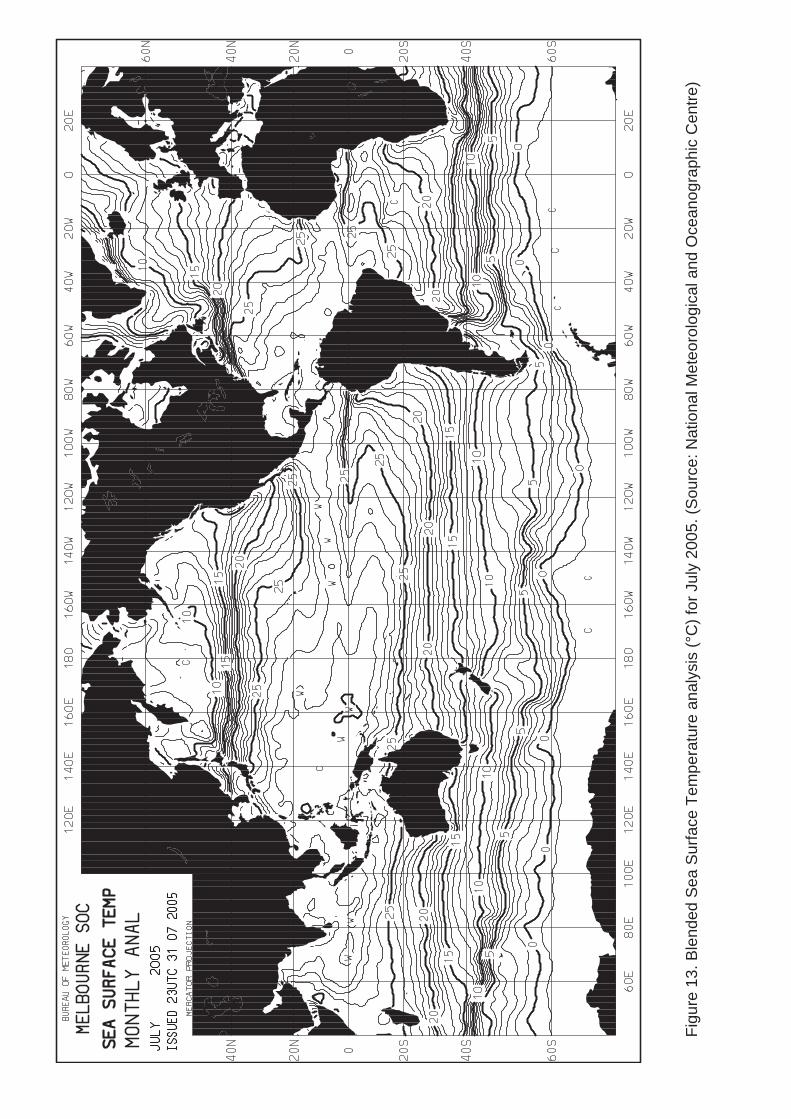
Figures 13 and 14 show the July 2005 sea surface temperature (SST) and SST anomaly charts respectively.SST maxima in Figure 13 are indicated with a “W”, while minima are marked with a “C”.
Sea surface temperatures were somewhat above average across most of the tropical Pacific, with only slightchanges occurring since June. There were only a few isolated small areas of +1°C anomalies in the easternand western equatorial Pacific.
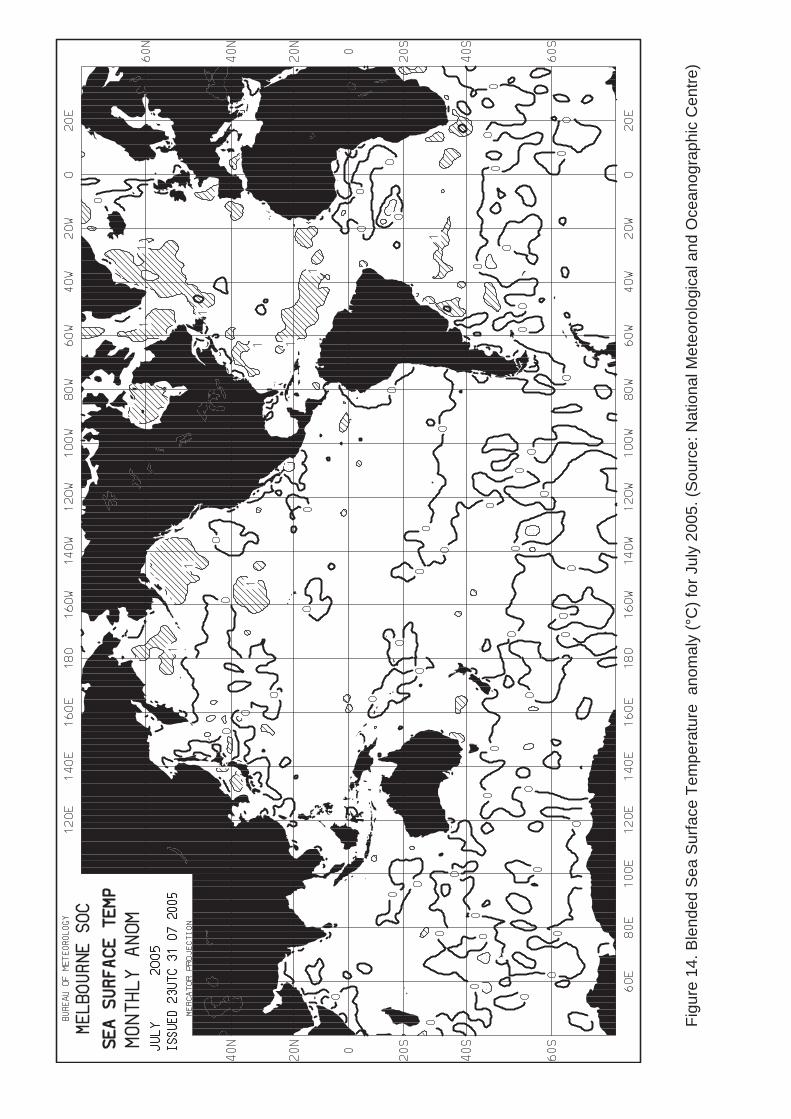
2.2 Subsurface
The Bureau of Meteorology Research Centre ocean subsurface analysis for the 150 m depth-averagedtemperature in the Pacific Ocean for July 2005 shows climatology (Figure 15) with the observation locationssuperimposed, the current analysis (Figure 16), and the departure from climatology (Figure 17, in which thenegative anomalies are shaded). The data are drawn from the Melbourne Global Telecommunication System,from the Pacific Marine Environmental Laboratory (PMEL) Tropical Atmosphere-Ocean (TAO) array data base(courtesy of the PMEL TAO team), and from the data compilation by Marine Environmental Data Service(MEDS) and National Oceanographic Data Centre (NODC) for the Global Temperature-Salinity Pilot Project(GTSPP) and World Ocean Circulation Experiment (WOCE) Data Assembly Center (DAC) projects.
The 150 m depth-averaged anomalies (Figure 17) for July showed negative values along the central equatorialPacific and over the much of the north Pacific Ocean within 10° of the equator. In contrast, positive values wereobserved in the region between the equator and 10°S over most of the basin.
The vertical section along the equator (Figures 18, 19 and 20) shows the vertical structure in the subsurfacetemperature pattern. Negative anomalies were observed along most of the thermocline, peaking at around–2.5°C near the dateline. A positive anomaly of +2°C was present near the surface in the east, but it covered
only a small area. Elsewhere, temperatures showed only small departures from normal.
2. Oceanography
Fig
ure
13.B
lend
edS
eaS
urfa
ceT
empe
ratu
rean
alys
is(°
C)
for
July
2005
.(S
ourc
e:N
atio
nalM
eteo
rolo
gica
land
Oce
anog
raph
icC
entr
e)
Fig
ure
14.B
lend
edS
eaS
urfa
ceT
empe
ratu
rean
omal
y(°
C)
for
July
2005
.(S
ourc
e:N
atio
nalM
eteo
rolo
gica
land
Oce
anog
raph
icC
entr
e)
Figure 15.
Figure 16.
Figure 17.
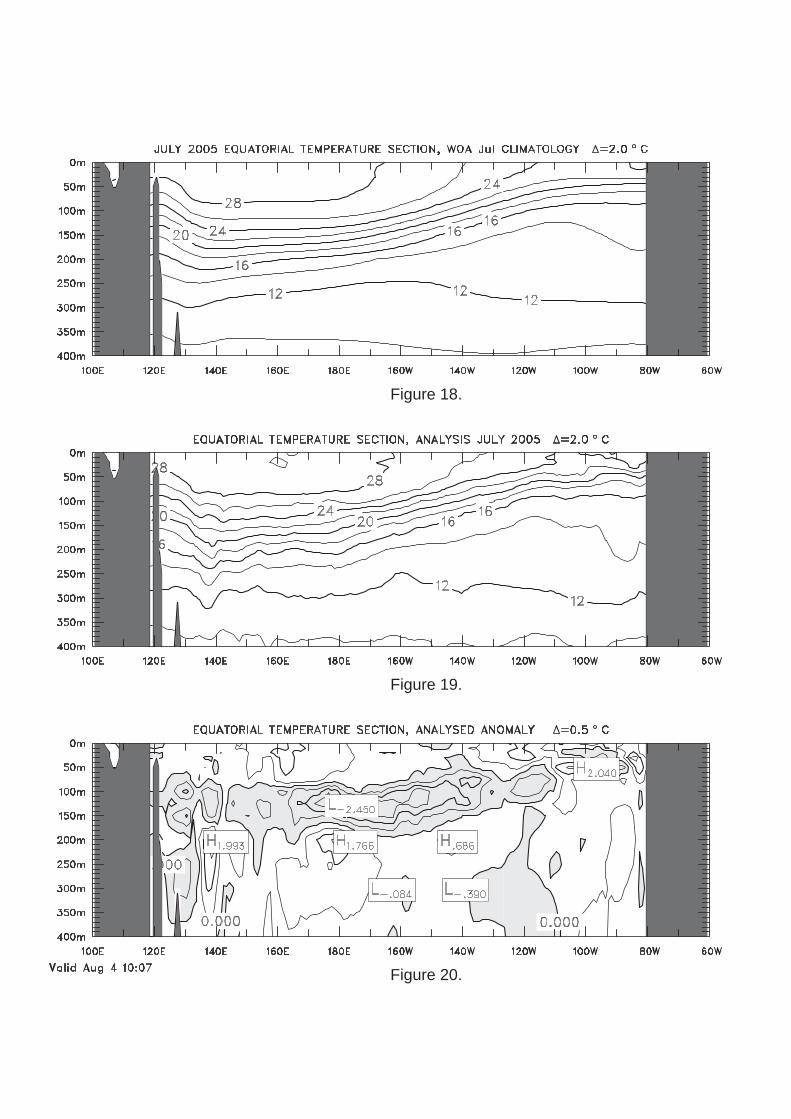
Figure 18.
Figure 19.
Figure 20.
3.1 Summary2
July 2005 was another warm month in Australia. Mean temperatures were 1.01°C above the 1961-90 normal,making it the fifth warmest July in the post-1950 period. Minimum temperatures (+1.14°C, 7th highest) wereslightly more anomalous than maximum temperatures (+0.89°C, 11th highest). For the second successivemonth, very much higher than average falls occurred over the northwest and interior of the continent. However,July was very dry in southwest WA.
3.2 Rainfall
The rainfall percentile analyses (deciles) use a reference period from 1900 to 2004 containing quality controlleddata from the climate data bank. The data used for the rainfall percentile analyses are based on preliminary realtime data which have not been verified and only limited quality control checks have been performed.
July
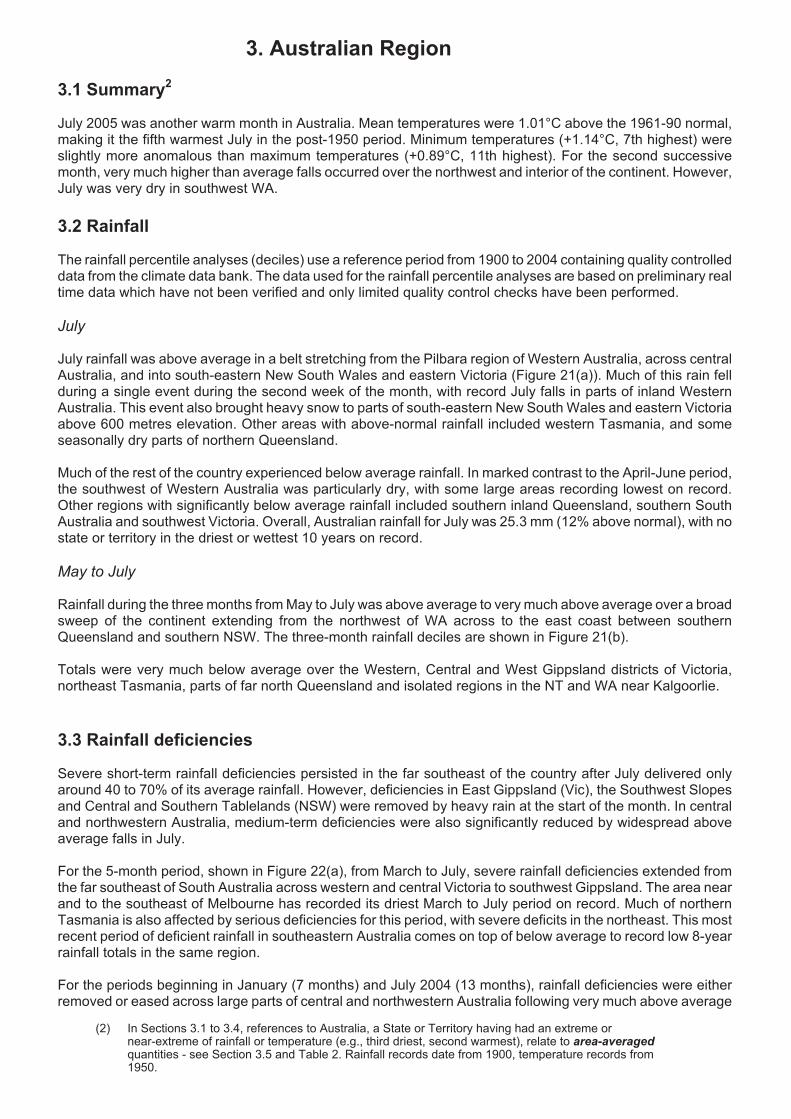
July rainfall was above average in a belt stretching from the Pilbara region of Western Australia, across centralAustralia, and into south-eastern New South Wales and eastern Victoria (Figure 21(a)). Much of this rain fellduring a single event during the second week of the month, with record July falls in parts of inland WesternAustralia. This event also brought heavy snow to parts of south-eastern New South Wales and eastern Victoriaabove 600 metres elevation. Other areas with above-normal rainfall included western Tasmania, and someseasonally dry parts of northern Queensland.
Much of the rest of the country experienced below average rainfall. In marked contrast to the April-June period,the southwest of Western Australia was particularly dry, with some large areas recording lowest on record.Other regions with significantly below average rainfall included southern inland Queensland, southern SouthAustralia and southwest Victoria. Overall, Australian rainfall for July was 25.3 mm (12% above normal), with nostate or territory in the driest or wettest 10 years on record.
May to July
Rainfall during the three months from May to July was above average to very much above average over a broadsweep of the continent extending from the northwest of WA across to the east coast between southernQueensland and southern NSW. The three-month rainfall deciles are shown in Figure 21(b).
Totals were very much below average over the Western, Central and West Gippsland districts of Victoria,northeast Tasmania, parts of far north Queensland and isolated regions in the NT and WA near Kalgoorlie.
3.3 Rainfall deficiencies
Severe short-term rainfall deficiencies persisted in the far southeast of the country after July delivered onlyaround 40 to 70% of its average rainfall. However, deficiencies in East Gippsland (Vic), the Southwest Slopesand Central and Southern Tablelands (NSW) were removed by heavy rain at the start of the month. In centraland northwestern Australia, medium-term deficiencies were also significantly reduced by widespread aboveaverage falls in July.
For the 5-month period, shown in Figure 22(a), from March to July, severe rainfall deficiencies extended fromthe far southeast of South Australia across western and central Victoria to southwest Gippsland. The area nearand to the southeast of Melbourne has recorded its driest March to July period on record. Much of northernTasmania is also affected by serious deficiencies for this period, with severe deficits in the northeast. This mostrecent period of deficient rainfall in southeastern Australia comes on top of below average to record low 8-yearrainfall totals in the same region.
For the periods beginning in January (7 months) and July 2004 (13 months), rainfall deficiencies were eitherremoved or eased across large parts of central and northwestern Australia following very much above average
3. Australian Region
(2) In Sections 3.1 to 3.4, references to Australia, a State or Territory having had an extreme ornear-extreme of rainfall or temperature (e.g., third driest, second warmest), relate to area-averagedquantities - see Section 3.5 and Table 2. Rainfall records date from 1900, temperature records from1950.
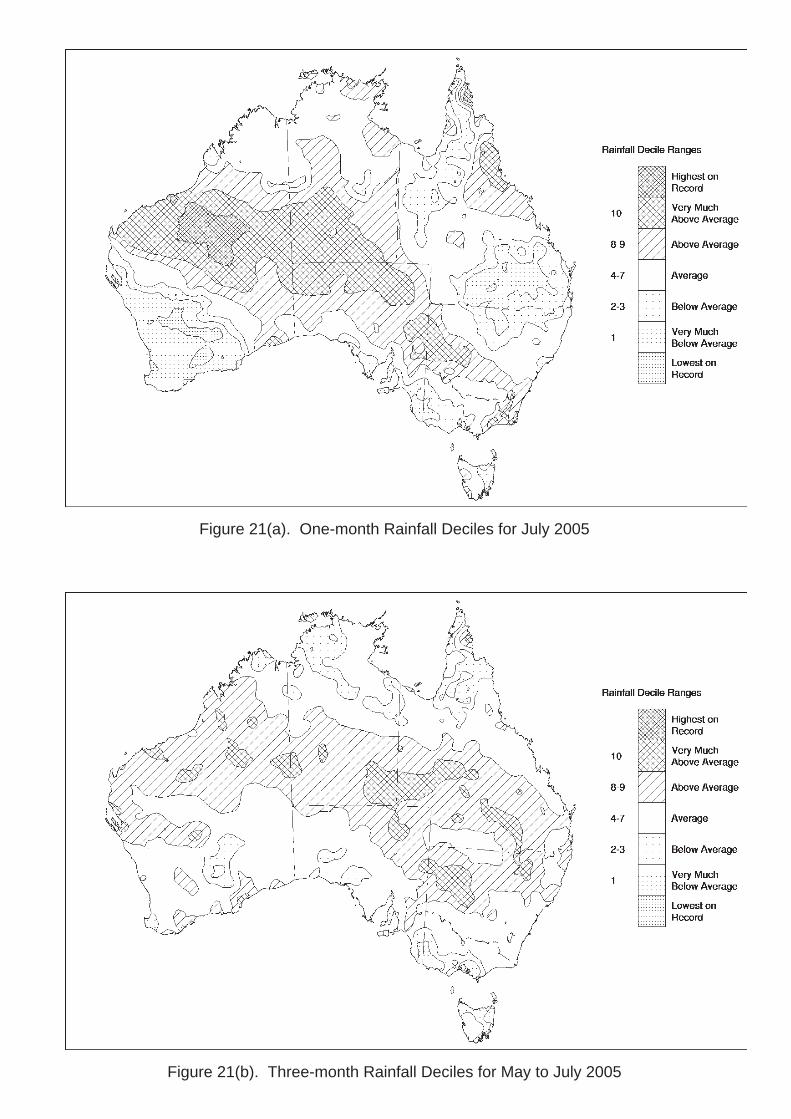
Figure 21(a). One-month Rainfall Deciles for July 2005
Figure 21(b). Three-month Rainfall Deciles for May to July 2005
Figure 22(a). 5-month Rainfall Deficiencies: March to July 2005
Figure 22(b). 7-month Rainfall Deficiencies: January to July 2005
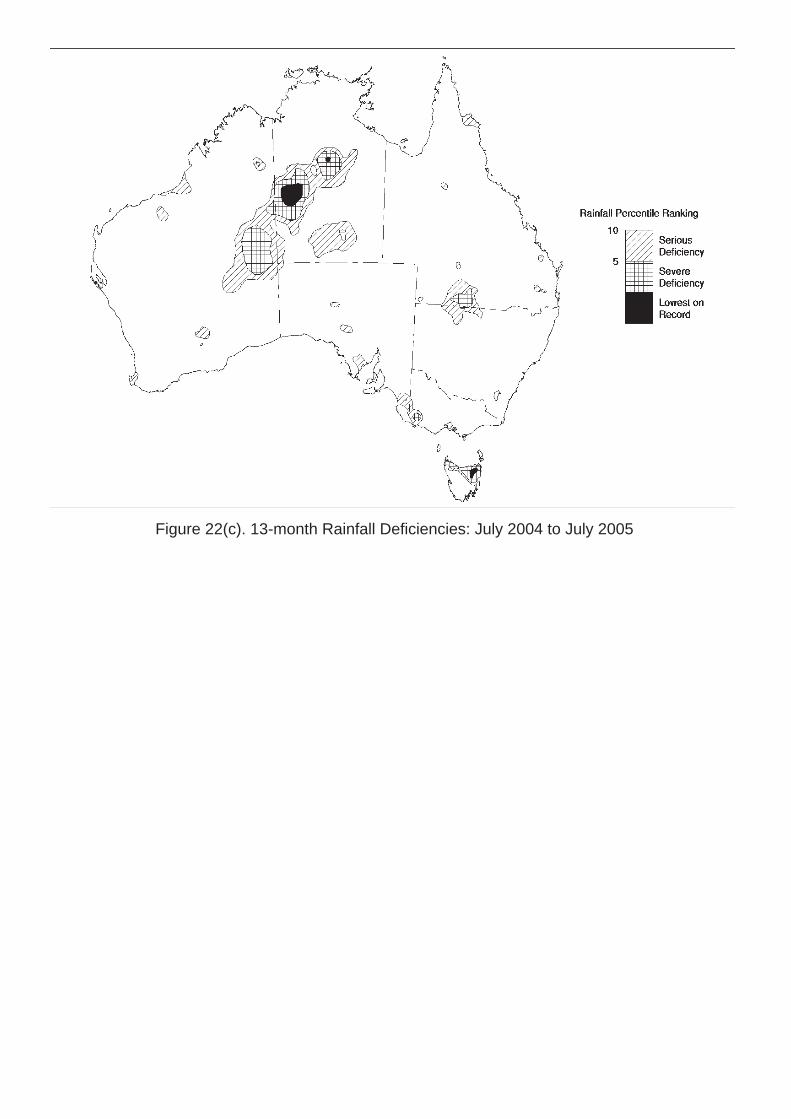
Figure 22(c). 13-month Rainfall Deficiencies: July 2004 to July 2005
to record July rainfall. Areas that continued to be affected for the 7-month period included an area just west ofBrisbane, a large patch between Bourke (NSW) and Charleville (Qld), parts of eastern WA and adjacentwestern SA, and patches across the NT and northern Queensland.
For the 13-month period, the main areas affected continued to be large parts of the southern NT and theneighbouring regions of eastern WA. The 7-month and 13-month rainfall deficiencies period are shown inFigures 22(b) and 22(c).
Northern Tasmania was also affected over both time-spans, with the area around Launceston having had itsdriest 13-month July to July period on record.
3.4 Temperatures
Australian mean temperatures for 2005 to date (anomaly +1.12°C) continue to run at record levels, being0.21°C above the previous record January-July period (1998). Mean July temperatures were above normal inall states and territories, with Tasmania experiencing its warmest July on record and Victoria its third warmest.
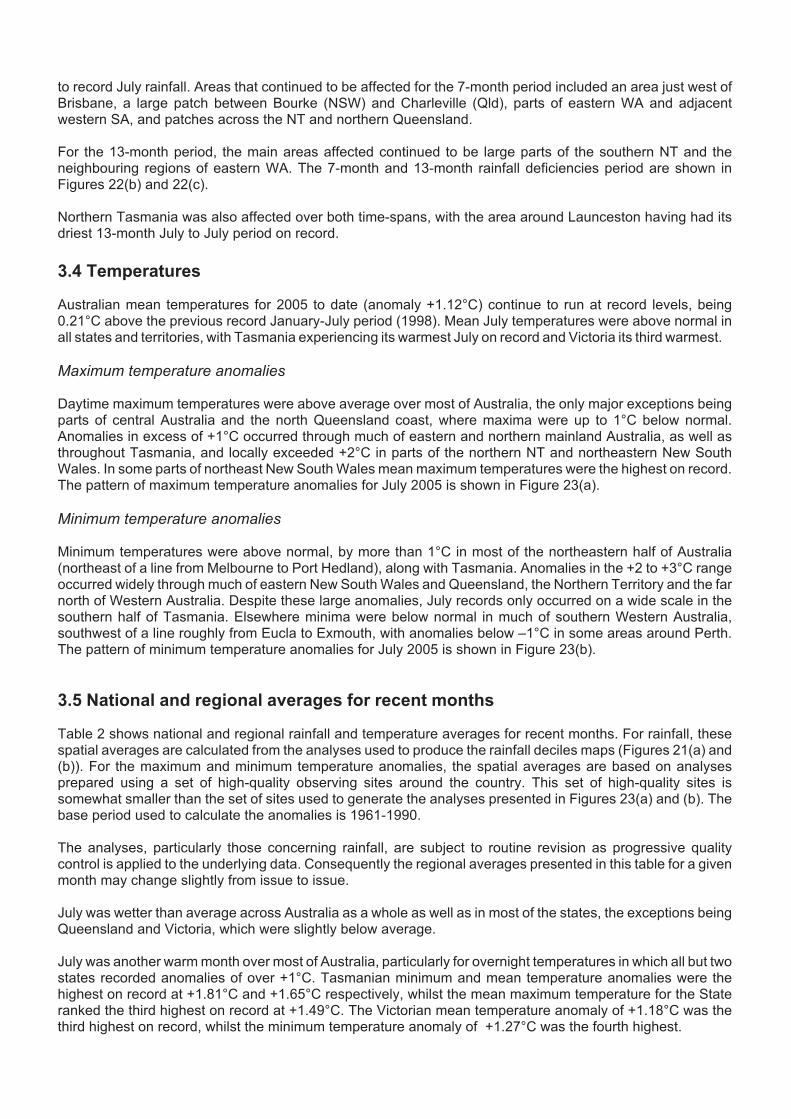
Maximum temperature anomalies
Daytime maximum temperatures were above average over most of Australia, the only major exceptions beingparts of central Australia and the north Queensland coast, where maxima were up to 1°C below normal.Anomalies in excess of +1°C occurred through much of eastern and northern mainland Australia, as well asthroughout Tasmania, and locally exceeded +2°C in parts of the northern NT and northeastern New SouthWales. In some parts of northeast New South Wales mean maximum temperatures were the highest on record.The pattern of maximum temperature anomalies for July 2005 is shown in Figure 23(a).
Minimum temperature anomalies
Minimum temperatures were above normal, by more than 1°C in most of the northeastern half of Australia(northeast of a line from Melbourne to Port Hedland), along with Tasmania. Anomalies in the +2 to +3°C rangeoccurred widely through much of eastern New South Wales and Queensland, the Northern Territory and the farnorth of Western Australia. Despite these large anomalies, July records only occurred on a wide scale in thesouthern half of Tasmania. Elsewhere minima were below normal in much of southern Western Australia,southwest of a line roughly from Eucla to Exmouth, with anomalies below –1°C in some areas around Perth.The pattern of minimum temperature anomalies for July 2005 is shown in Figure 23(b).
3.5 National and regional averages for recent months
Table 2 shows national and regional rainfall and temperature averages for recent months. For rainfall, thesespatial averages are calculated from the analyses used to produce the rainfall deciles maps (Figures 21(a) and(b)). For the maximum and minimum temperature anomalies, the spatial averages are based on analysesprepared using a set of high-quality observing sites around the country. This set of high-quality sites issomewhat smaller than the set of sites used to generate the analyses presented in Figures 23(a) and (b). Thebase period used to calculate the anomalies is 1961-1990.
The analyses, particularly those concerning rainfall, are subject to routine revision as progressive qualitycontrol is applied to the underlying data. Consequently the regional averages presented in this table for a givenmonth may change slightly from issue to issue.
July was wetter than average across Australia as a whole as well as in most of the states, the exceptions beingQueensland and Victoria, which were slightly below average.
July was another warm month over most of Australia, particularly for overnight temperatures in which all but twostates recorded anomalies of over +1°C. Tasmanian minimum and mean temperature anomalies were thehighest on record at +1.81°C and +1.65°C respectively, whilst the mean maximum temperature for the Stateranked the third highest on record at +1.49°C. The Victorian mean temperature anomaly of +1.18°C was thethird highest on record, whilst the minimum temperature anomaly of +1.27°C was the fourth highest.
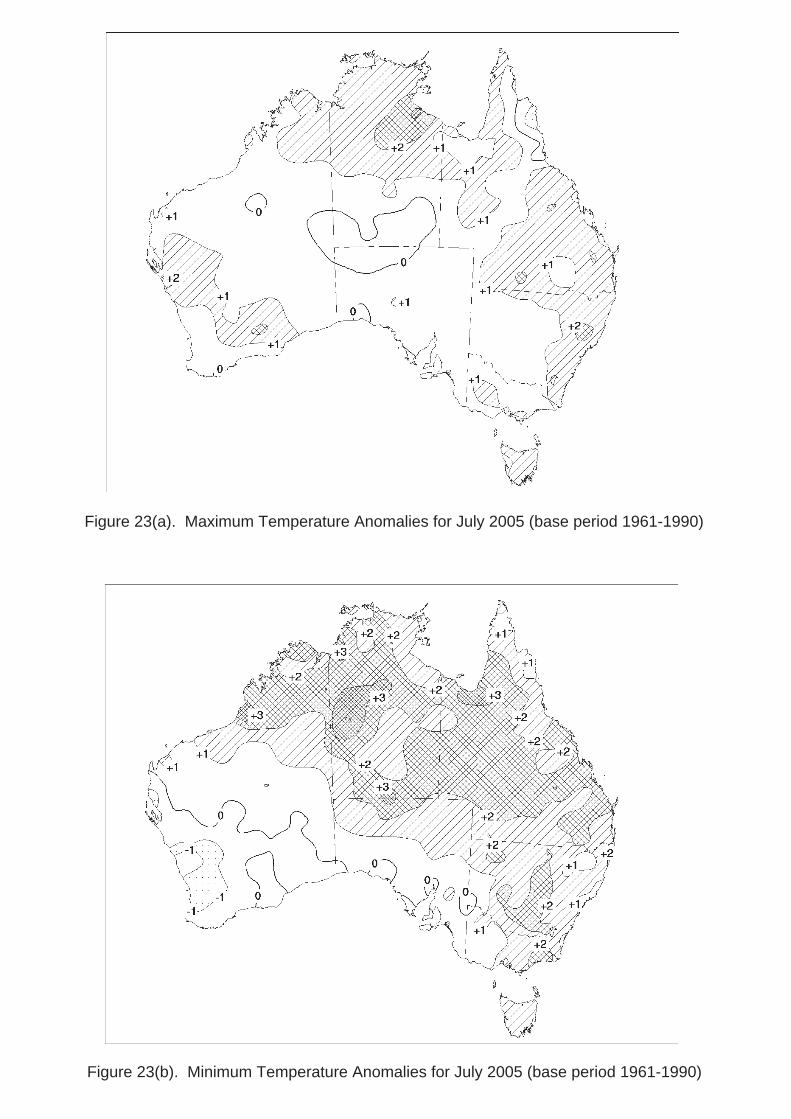
Figure 23(a). Maximum Temperature Anomalies for July 2005 (base period 1961-1990)
Figure 23(b). Minimum Temperature Anomalies for July 2005 (base period 1961-1990)
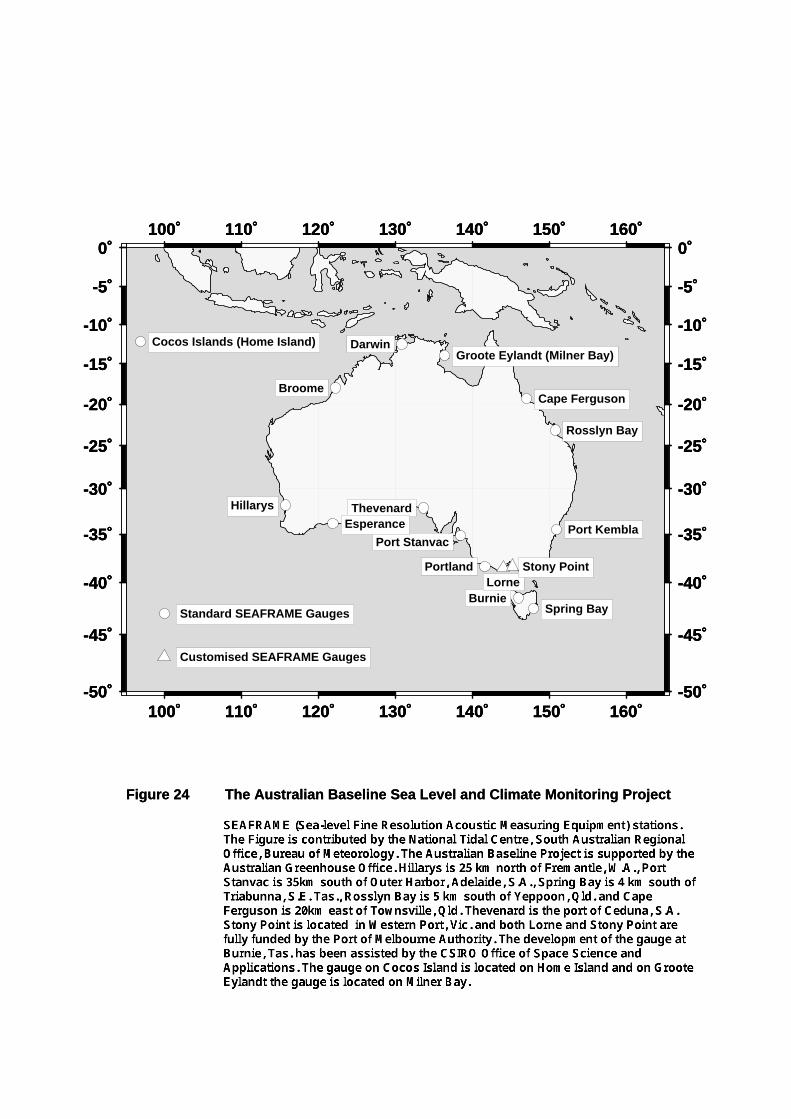
The National Tidal Centre (NTC), part of the Bureau of Meteorology’s South Australian Regional Office,supplies sea-level and wind data from its measuring sites located around the Australian coastline and at CocosIsland. The locations of the various measuring stations are shown in Figure 24, with data being displayed inFigures 25 to 27.
The following remarks are based largely on a commentary supplied by the NTC.
NOTES ON THE DATA FOR JULY 2005
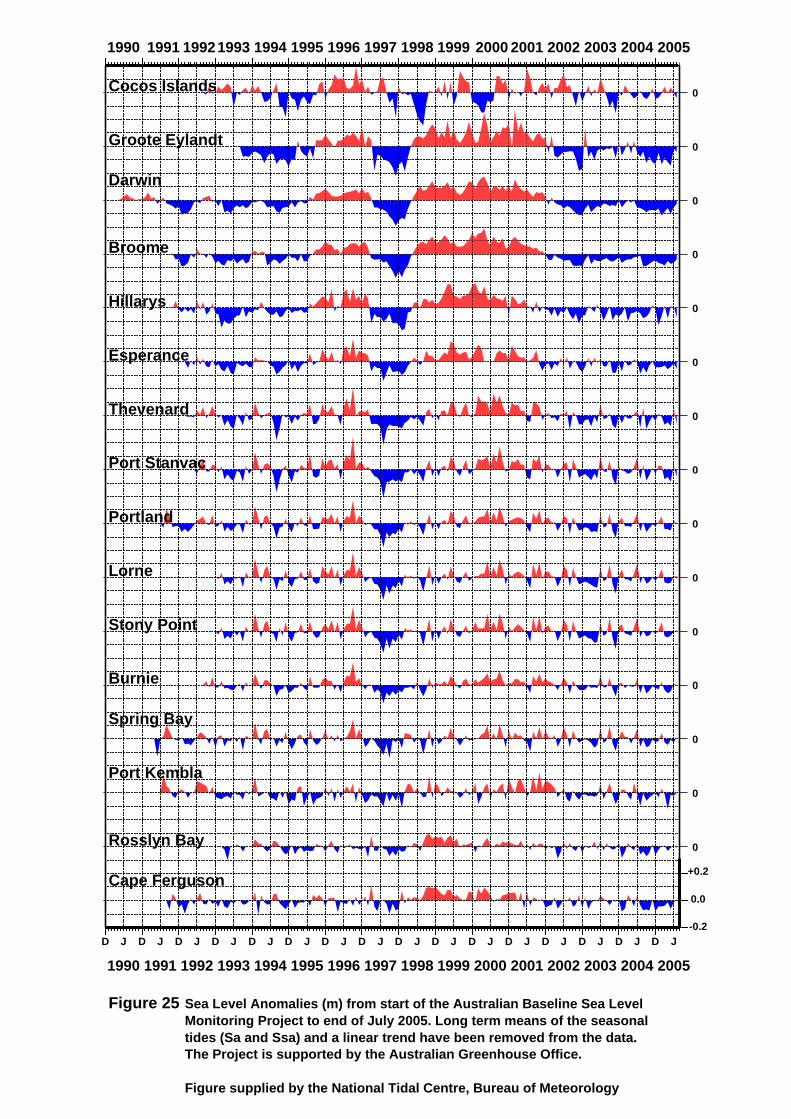
Sea level data return (Figures 25 and 26) in July was good for most stations. Three days of data from Broomewere lost due to technical problems. The sea level anomalies (Figure 25) were slightly negative from GrooteEylandt to Port Stanvac and near normal at the remaining sites.
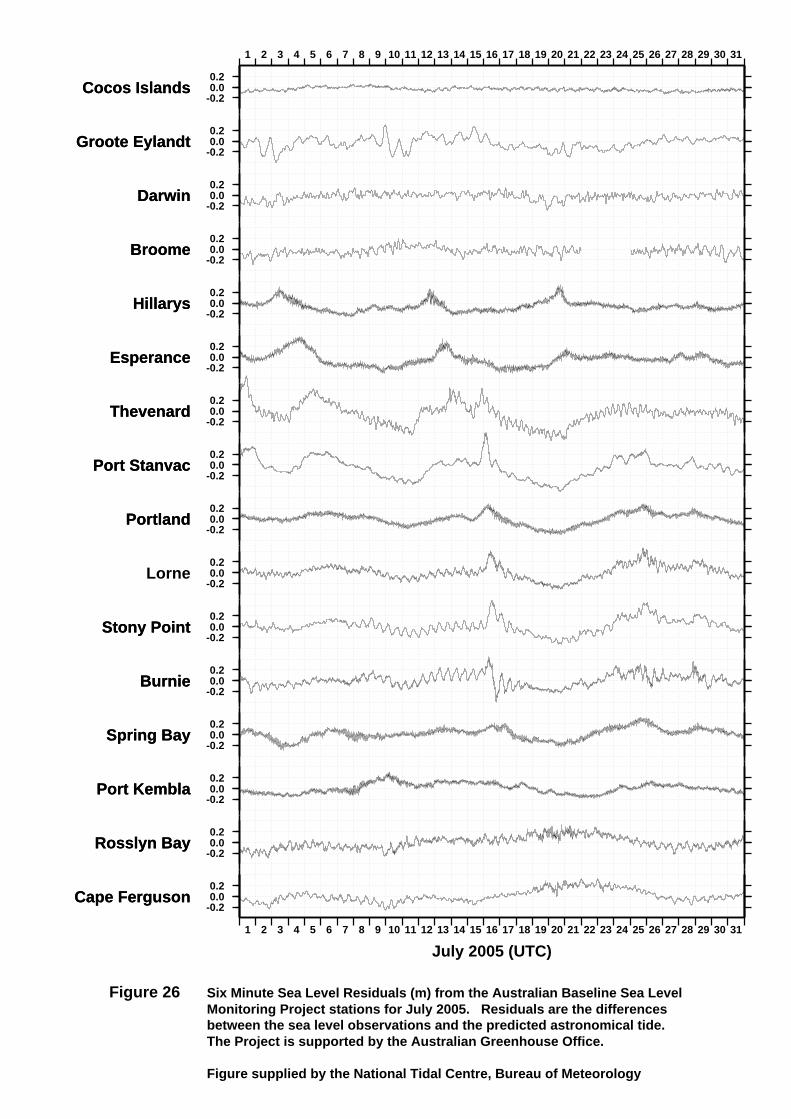
The residuals (Figure 26), the difference between the observations and the tidal predictions, are the non-tidalcomponents of the sea level observations. The residuals are primarily the consequence of short-termmeteorological effects.
Thevenard reported the most notable maximum for the month with a value of +0.7 m on the 1st. A strong coldfront on the 16th caused a maximum of +0.6 m at Port Stanvac and maxima of about +0.5 m at Lorne, StonyPoint and Burnie, with the latter having its monthly minimum of –0.4 m on the same day as the winds shiftedfrom strong on-shore to off-shore.
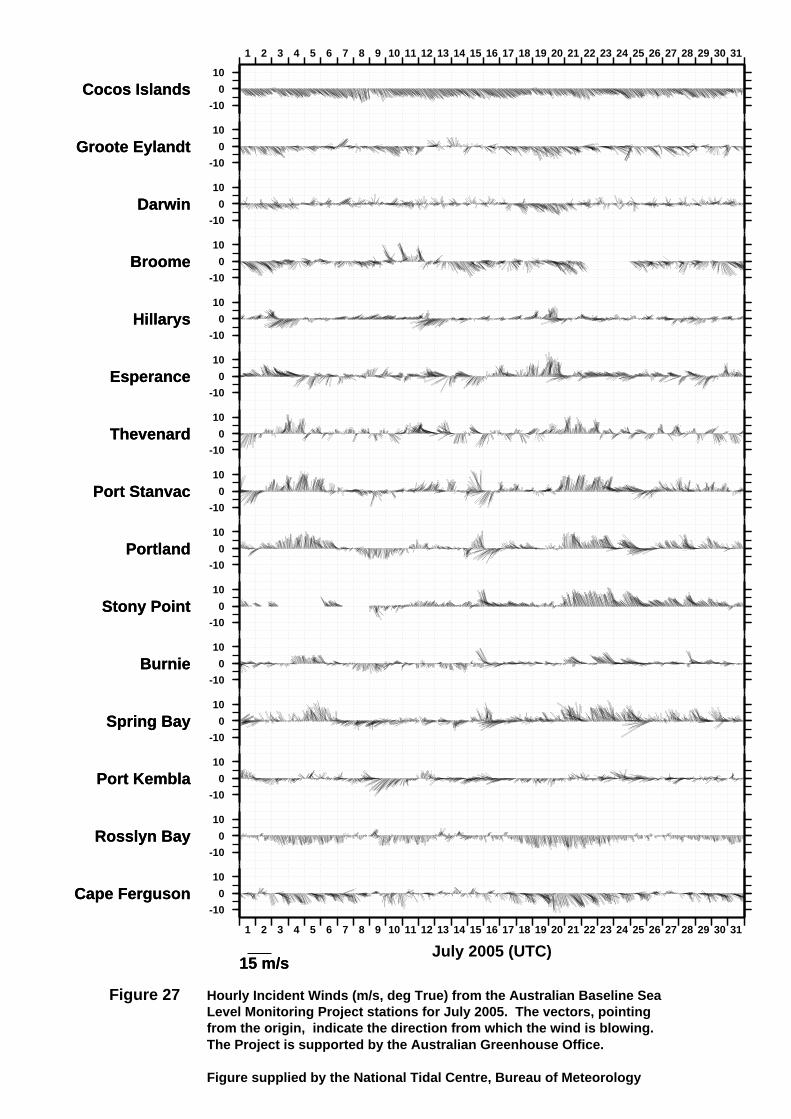
Wind speed and wind gust data from Stony Point continued to be intermittently erroneous up to the 11th of July.These values and the corresponding incident wind directions have been removed (Figure 27).
4. Australian National Tidal Centre Charts
100˚
100˚
110˚
110˚
120˚
120˚
130˚
130˚
140˚
140˚
150˚
150˚
160˚
160˚
-50˚ -50˚
-45˚ -45˚
-40˚ -40˚
-35˚ -35˚
-30˚ -30˚
-25˚ -25˚
-20˚ -20˚
-15˚ -15˚
-10˚ -10˚
-5˚ -5˚
0˚ 0˚
100˚
100˚
110˚
110˚
120˚
120˚
130˚
130˚
140˚
140˚
150˚
150˚
160˚
160˚
-50˚ -50˚
-45˚ -45˚
-40˚ -40˚
-35˚ -35˚
-30˚ -30˚
-25˚ -25˚
-20˚ -20˚
-15˚ -15˚
-10˚ -10˚
-5˚ -5˚
0˚ 0˚
100˚
100˚
110˚
110˚
120˚
120˚
130˚
130˚
140˚
140˚
150˚
150˚
160˚
160˚
-50˚ -50˚
-45˚ -45˚
-40˚ -40˚
-35˚ -35˚
-30˚ -30˚
-25˚ -25˚
-20˚ -20˚
-15˚ -15˚
-10˚ -10˚
-5˚ -5˚
0˚ 0˚
Port Kembla
Portland
Rosslyn Bay
Spring Bay
Port Stanvac
Thevenard
Burnie
BroomeCape Ferguson
Cocos Islands (Home Island) Darwin
Esperance
Hillarys
Standard SEAFRAME Gauges
Groote Eylandt (Milner Bay)
LorneStony Point
Customised SEAFRAME Gauges
Figure 24Figure 24 The Australian Baseline Sea Level and Climate Monitoring ProjectThe Australian Baseline Sea Level and Climate Monitoring Project
Cocos Islands
Groote Eylandt
Darwin
Broome
Hillarys
Esperance
Thevenard
Port Stanvac
Portland
Lorne
Stony Point
Burnie
Spring Bay
Port Kembla
Rosslyn Bay
Cape Ferguson
D J
1990
D J
1991
D J
1992
D J
1993
D J
1994
D J
1995
D J
1996
D J
1997
D J
1998
D J
1999
D J
2000
D J
2001
D J
2002
D J
2003
D J
2004
D J
2005
1990 1991 19921993 1994 1995 1996 1997 1998 1999 2000 2001 2002 2003 2004 2005
Figure 25 Sea Level Anomalies (m) from start of the Australian Baseline Sea LevelMonitoring Project to end of July 2005. Long term means of the seasonaltides (Sa and Ssa) and a linear trend have been removed from the data.The Project is supported by the Australian Greenhouse Office.
Figure supplied by the National Tidal Centre, Bureau of Meteorology
0.0
-0.2
+0.2
0
0
0
0
0
0
0
0
0
0
0
0
0
0
0
1 2 3 4 5 6 7 8 9 10 11 12 13 14 15 16 17 18 19 20 21 22 23 24 25 26 27 28 29 30 31
July 2005 (UTC)
-0.20.00.2
Cape FergusonCape Ferguson
-0.20.00.2
Rosslyn BayRosslyn Bay
-0.20.00.2
Port KemblaPort Kembla
-0.20.00.2
Spring BaySpring Bay
-0.20.00.2
BurnieBurnie
-0.20.00.2
Stony PointStony Point
-0.20.00.2
Lorne
-0.20.00.2
PortlandPortland
-0.20.00.2
Port StanvacPort Stanvac
-0.20.00.2
ThevenardThevenard
-0.20.00.2
EsperanceEsperance
-0.20.00.2
HillarysHillarys
-0.20.00.2
BroomeBroome
-0.20.00.2
DarwinDarwin
-0.20.00.2
Groote EylandtGroote Eylandt
1 2 3 4 5 6 7 8 9 10 11 12 13 14 15 16 17 18 19 20 21 22 23 24 25 26 27 28 29 30 31
-0.20.00.2
Cocos IslandsCocos Islands
Figure 26 Six Minute Sea Level Residuals (m) from the Australian Baseline Sea LevelMonitoring Project stations for July 2005. Residuals are the differencesbetween the sea level observations and the predicted astronomical tide.The Project is supported by the Australian Greenhouse Office.
Figure supplied by the National Tidal Centre, Bureau of Meteorology
1 2 3 4 5 6 7 8 9 10 11 12 13 14 15 16 17 18 19 20 21 22 23 24 25 26 27 28 29 30 31
July 2005 (UTC)
-10
0
10
15 m/s15 m/s
Cape FergusonCape Ferguson
-10
0
10
Rosslyn BayRosslyn Bay
-10
0
10
Port KemblaPort Kembla
-10
0
10
Spring BaySpring Bay
-10
0
10
BurnieBurnie
-10
0
10
Stony PointStony Point
-10
0
10
PortlandPortland
-10
0
10
Port StanvacPort Stanvac
-10
0
10
ThevenardThevenard
-10
0
10
EsperanceEsperance
-10
0
10
HillarysHillarys
-10
0
10
BroomeBroome
-10
0
10
DarwinDarwin
-10
0
10
Groote EylandtGroote Eylandt
1 2 3 4 5 6 7 8 9 10 11 12 13 14 15 16 17 18 19 20 21 22 23 24 25 26 27 28 29 30 31
-10
0
10
Cocos IslandsCocos Islands
Figure 27 Hourly Incident Winds (m/s, deg True) from the Australian Baseline SeaLevel Monitoring Project stations for July 2005. The vectors, pointingfrom the origin, indicate the direction from which the wind is blowing.The Project is supported by the Australian Greenhouse Office.
Figure supplied by the National Tidal Centre, Bureau of Meteorology
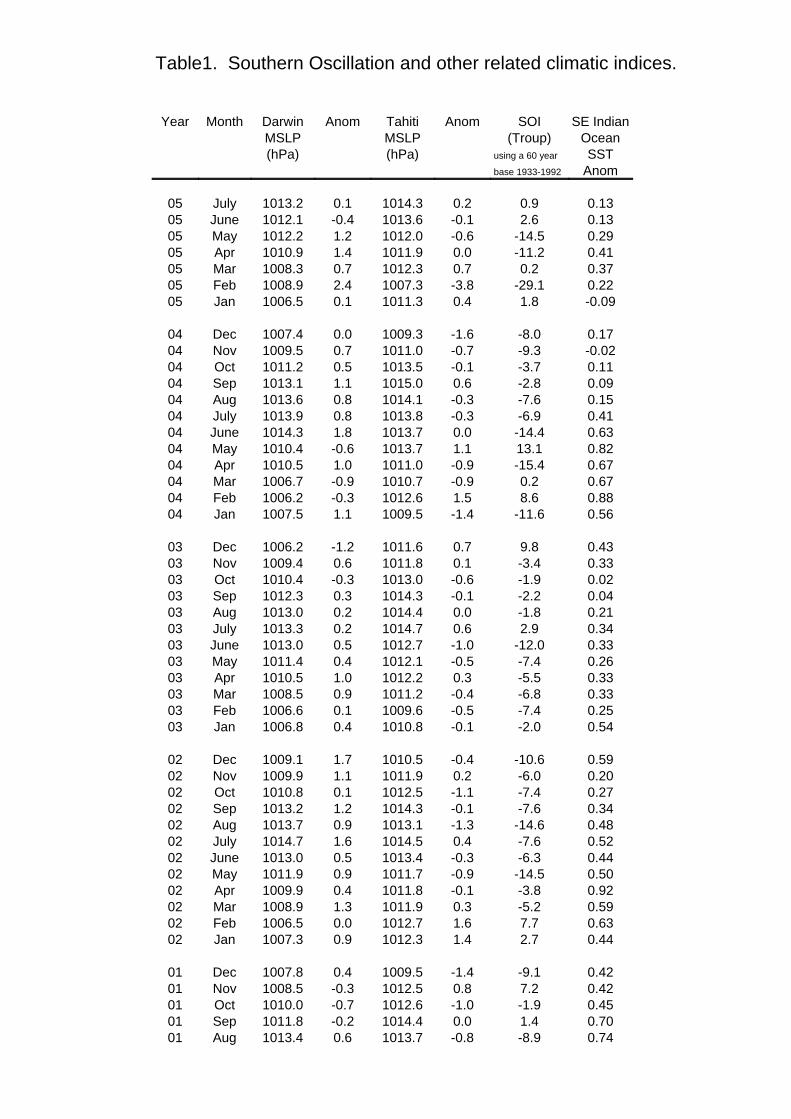
Table1. Southern Oscillation and other related climatic indices.
SE IndianSOIAnomTahitiAnomDarwinMonthYearOcean(Troup)MSLPMSLPSSTusing a 60 year(hPa)(hPa)
Anombase 1933-1992
0.130.90.21014.30.11013.2July050.132.6-0.11013.6-0.41012.1June050.29-14.5-0.61012.01.21012.2May050.41-11.20.01011.91.41010.9Apr050.370.20.71012.30.71008.3Mar050.22-29.1-3.81007.32.41008.9Feb05-0.091.80.41011.30.11006.5Jan05
0.17-8.0-1.61009.30.01007.4Dec04-0.02-9.3-0.71011.00.71009.5Nov040.11-3.7-0.11013.50.51011.2Oct040.09-2.80.61015.01.11013.1Sep040.15-7.6-0.31014.10.81013.6Aug040.41-6.9-0.31013.80.81013.9July040.63-14.40.01013.71.81014.3June040.8213.11.11013.7-0.61010.4May040.67-15.4-0.91011.01.01010.5Apr040.670.2-0.91010.7-0.91006.7Mar040.888.61.51012.6-0.31006.2Feb040.56-11.6-1.41009.51.11007.5Jan04
0.439.80.71011.6-1.21006.2Dec030.33-3.40.11011.80.61009.4Nov030.02-1.9-0.61013.0-0.31010.4Oct030.04-2.2-0.11014.30.31012.3Sep030.21-1.80.01014.40.21013.0Aug030.342.90.61014.70.21013.3July030.33-12.0-1.01012.70.51013.0June030.26-7.4-0.51012.10.41011.4May030.33-5.50.31012.21.01010.5Apr030.33-6.8-0.41011.20.91008.5Mar030.25-7.4-0.51009.60.11006.6Feb030.54-2.0-0.11010.80.41006.8Jan03
0.59-10.6-0.41010.51.71009.1Dec020.20-6.00.21011.91.11009.9Nov020.27-7.4-1.11012.50.11010.8Oct020.34-7.6-0.11014.31.21013.2Sep020.48-14.6-1.31013.10.91013.7Aug020.52-7.60.41014.51.61014.7July020.44-6.3-0.31013.40.51013.0June020.50-14.5-0.91011.70.91011.9May020.92-3.8-0.11011.80.41009.9Apr020.59-5.20.31011.91.31008.9Mar020.637.71.61012.70.01006.5Feb020.442.71.41012.30.91007.3Jan02
0.42-9.1-1.41009.50.41007.8Dec010.427.20.81012.5-0.31008.5Nov010.45-1.9-1.01012.6-0.71010.0Oct010.701.40.01014.4-0.21011.8Sep010.74-8.9-0.81013.70.61013.4Aug01
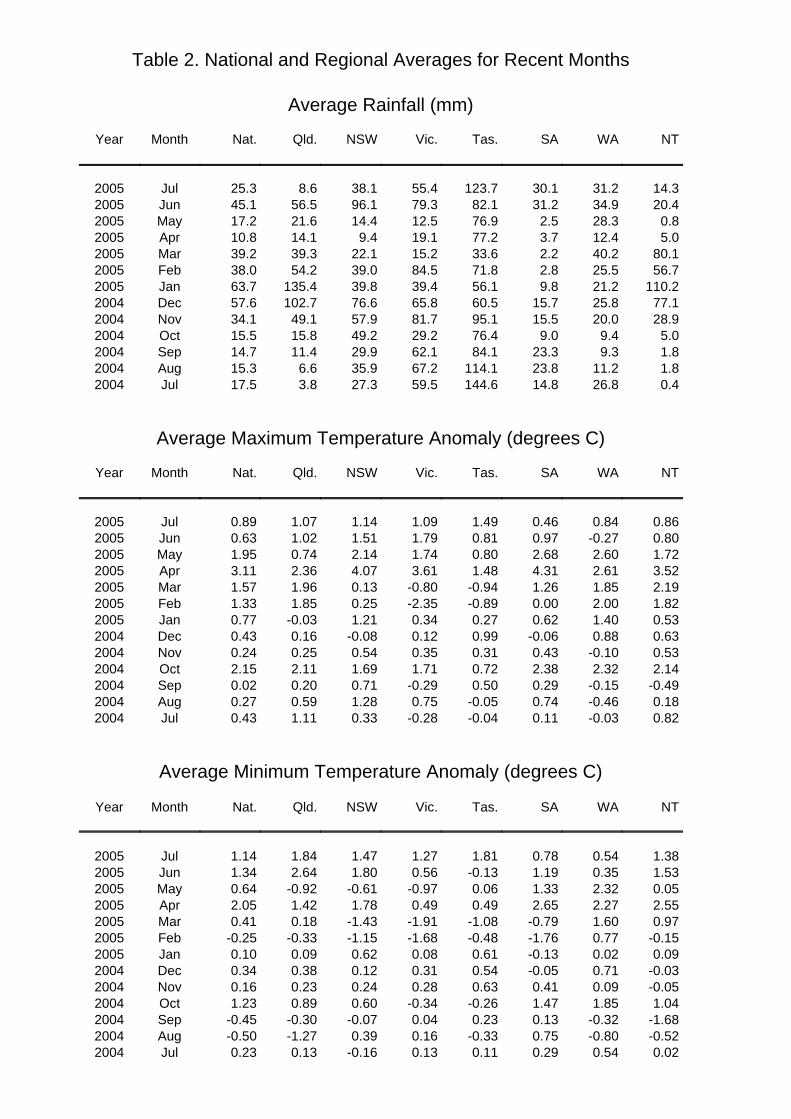
Table 2. National and Regional Averages for Recent Months
Average Rainfall (mm)
NTWASATas.Vic.NSWQld.Nat. Month Year
14.331.230.1123.755.438.18.625.3Jul200520.434.931.282.179.396.156.545.1Jun2005
0.828.32.576.912.514.421.617.2May20055.012.43.777.219.19.414.110.8Apr2005
80.140.22.233.615.222.139.339.2Mar200556.725.52.871.884.539.054.238.0Feb2005
110.221.29.856.139.439.8135.463.7Jan200577.125.815.760.565.876.6102.757.6Dec200428.920.015.595.181.757.949.134.1Nov2004
5.09.49.076.429.249.215.815.5Oct20041.89.323.384.162.129.911.414.7Sep20041.811.223.8114.167.235.96.615.3Aug20040.426.814.8144.659.527.33.817.5Jul2004
Average Maximum Temperature Anomaly (degrees C)
NTWASATas.Vic.NSWQld.Nat.MonthYear
0.860.840.461.491.091.141.070.89Jul20050.80-0.270.970.811.791.511.020.63Jun20051.722.602.680.801.742.140.741.95May20053.522.614.311.483.614.072.363.11Apr20052.191.851.26-0.94-0.800.131.961.57Mar20051.822.000.00-0.89-2.350.251.851.33Feb20050.531.400.620.270.341.21-0.030.77Jan20050.630.88-0.060.990.12-0.080.160.43Dec20040.53-0.100.430.310.350.540.250.24Nov20042.142.322.380.721.711.692.112.15Oct2004
-0.49-0.150.290.50-0.290.710.200.02Sep20040.18-0.460.74-0.050.751.280.590.27Aug20040.82-0.030.11-0.04-0.280.331.110.43Jul2004
Average Minimum Temperature Anomaly (degrees C)
NTWASATas.Vic.NSWQld.Nat.MonthYear
1.380.540.781.811.271.471.841.14Jul20051.530.351.19-0.130.561.802.641.34Jun20050.052.321.330.06-0.97-0.61-0.920.64May20052.552.272.650.490.491.781.422.05Apr20050.971.60-0.79-1.08-1.91-1.430.180.41Mar2005
-0.150.77-1.76-0.48-1.68-1.15-0.33-0.25Feb20050.090.02-0.130.610.080.620.090.10Jan2005
-0.030.71-0.050.540.310.120.380.34Dec2004-0.050.090.410.630.280.240.230.16Nov20041.041.851.47-0.26-0.340.600.891.23Oct2004
-1.68-0.320.130.230.04-0.07-0.30-0.45Sep2004-0.52-0.800.75-0.330.160.39-1.27-0.50Aug20040.020.540.290.110.13-0.160.130.23Jul2004
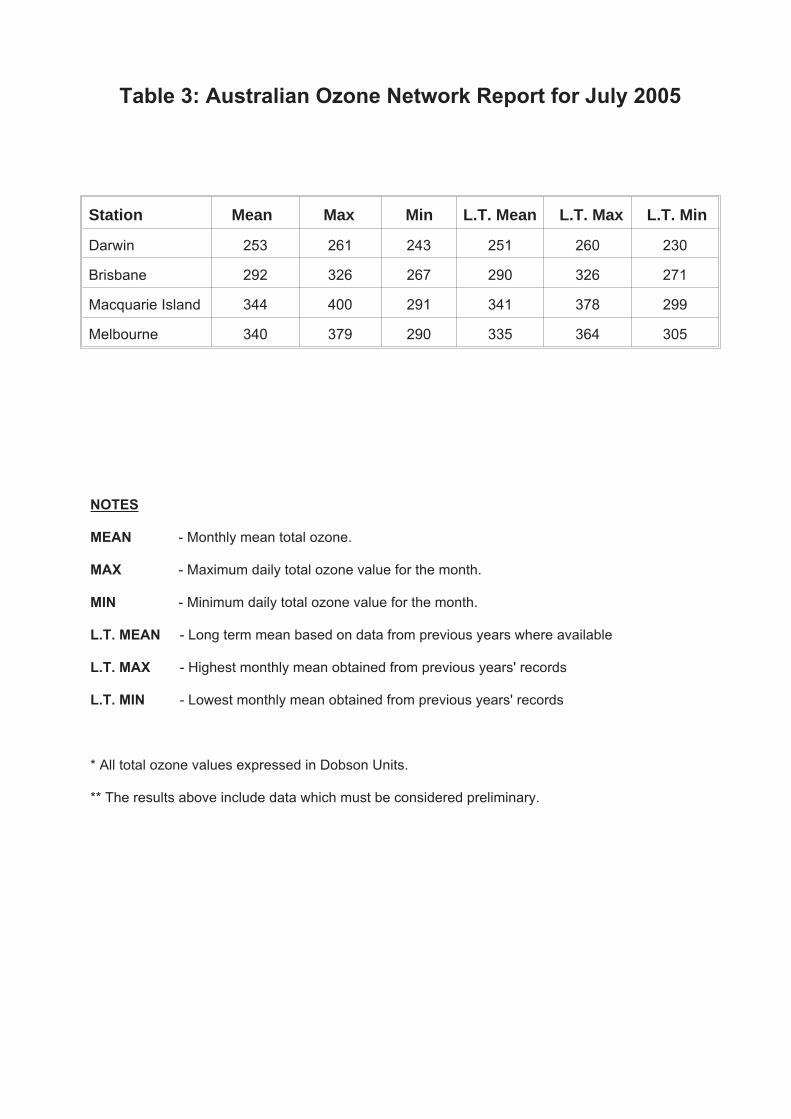
Table 3: Australian Ozone Network Report for July 2005
Station Mean Max Min L.T. Mean L.T. Max L.T. Min
Darwin 253 261 243 251 260 230
Brisbane 292 326 267 290 326 271
Macquarie Island 344 400 291 341 378 299
Melbourne 340 379 290 335 364 305
NOTES
MEAN - Monthly mean total ozone.
MAX - Maximum daily total ozone value for the month.
MIN - Minimum daily total ozone value for the month.
L.T. MEAN - Long term mean based on data from previous years where available
L.T. MAX - Highest monthly mean obtained from previous years' records
L.T. MIN - Lowest monthly mean obtained from previous years' records
* All total ozone values expressed in Dobson Units.
** The results above include data which must be considered preliminary.