climate survey report - university of chicago
TRANSCRIPT

APRIL 2017
Spring 2016 Campus Climate SurveyReligion and SpiritualitySURVEY RESULTS
THE UNIVERSITY OF CHICAGO Spring 2016 Campus Climate Survey: Religion 1
TABLE OF CONTENTS
Preface .............................................................................................................................................................................................................2
Introduction ...................................................................................................................................................................................................3Survey Development..........................................................................................................................................................................3Respondent Demographics and How to Interpret These Data .....................................................................................3
Broad Perceptions of Campus Climate ............................................................................................................................................6Description of the Data ....................................................................................................................................................................6Brief Summary of Results ................................................................................................................................................................6Results ......................................................................................................................................................................................................6
Experiences and Consequences of Discrimination and Harassment .................................................................................9Description of the Data ....................................................................................................................................................................9Brief Summary of Results ................................................................................................................................................................9Results ................................................................................................................................................................................................... 10
Deeper Institutional Experiences of Campus Climate ............................................................................................................29Description of the Data .................................................................................................................................................................29Brief Summary of Results .............................................................................................................................................................29Results ...................................................................................................................................................................................................29
Appendix 1: Participation Rates .........................................................................................................................................................31
Appendix 2: Survey Items Examined for This Report.............................................................................................................32
Appendix 3: Steering Committee and Working Group Membership ..............................................................................36

THE UNIVERSITY OF CHICAGO Spring 2016 Campus Climate Survey: Religion 2
PREFACEThe Spring 2016 Campus Climate Survey is the first University of Chicago survey to attempt to capture some of the experiences and perceptions of students, staff, and academics (defined as tenure track and non–tenure track academic appointees and postdoctoral researchers) on a broad range of issues related to diversity and inclusion. Administering the Climate Survey is intended to be a crucial step towards improving our campus climate. The survey will serve as one baseline against which to measure improvement; be a catalyst for communication and discussion; and contribute to thinking about the implementation of new programs, policies, and activities that will foster an inclusive climate.
THE UNIVERSITY OF CHICAGO Spring 2016 Campus Climate Survey: Religion 3
INTRODUCTIONThe Spring 2016 Campus Climate Survey provides data that will be enriched through further discussion. In this report, the terms “religious identity” and “religious identification” are intended as broadly construed, to include today’s diverse human experience of religious and spiritual affiliation and practice, including non-religious and secular approaches as well as individual experience that does not readily fit within traditional lines of definition. The findings from this survey compel us to contend with complex national and institutional issues. The campus climate around issues of religious identity is the aggregate of individual attitudes, interpersonal interactions, and institutionalized policies and practices. These factors and others collectively determine the extent to which individuals and groups feel welcomed, respected, and valued at the University. The University of Chicago has a foundational commitment to the idea that a culture of free and open inquiry requires empowering individuals of all backgrounds, experiences, identities, and perspectives to challenge conventional thinking in pursuit of original ideas. Such goals can only fully be realized within a climate that is inclusive.
SURVEY DEVELOPMENTDuring the fall of 2014, several groups of students, with the support of academics, raised issues about aspects of the climate on campus and called for a variety of actions to address climate issues and promote inclusion. To inform the University’s efforts on these issues, the Spring 2016 Campus Climate Survey focused on diversity and inclusion. Under the auspices of a broadly constituted Steering Committee chaired by Cathy Cohen, Mary Winton Green Professor in the Department of Political Science and the College (Appendix 3), students, academics, and staff provided feedback in the development and implementation of the Climate Survey through several channels, including 17 Climate Survey Forums that took place across campus, and through direct responses to [email protected].
A Working Group on Survey Development with expertise in survey construction and deployment, chaired by Micere Keels, Associate Professor in the Department of Comparative Human Development and the College (Appendix 3), was convened to construct the survey instrument based on this broad feedback and with guidance from the Steering Committee. The Working Group also drew on findings from a literature review and a review of several campus climate surveys developed by other institutions and national working groups, which were designed to measure discrimination and harassment regarding race/ethnicity, gender identification, sexual orientation, and religious identification.
The Spring 2016 Campus Climate Survey consisted of approximately 75 questions. Respondents were instructed to base their responses on experiences that occurred over the past two years. This report is a compilation of the responses that are amenable to quantitative summary. It has been compiled by Micere Keels, Melissa Gilliam, William Greenland, and Ronald Thisted on behalf of the Working Group.
There are significant limitations to this report. The survey asked about many religious identities and about religion broadly construed. As the table below (table 1) showing the number of responses for each religious identity indicates, some religious identities are represented in the survey by a very small number of respondents. In those cases, we suppress reporting of responses so as to preserve confidentiality.
RESPONDENT DEMOGRAPHICS AND HOW TO INTERPRET THESE DATAIt is important for the reader to recognize that the percentages contained in this report are percentages of those participating in the survey, and they may not be representative of the rest of the University population that was eligible but elected not to participate. The survey was neither a census nor a probability sample of groups in the University community. It is best described as having used voluntary sampling for which all members of the target population were recruited. Because all members of the community were invited to participate, but not all did, individuals with certain experiences or beliefs may have been more likely than others to participate as a result of those experiences or beliefs. Consequently, those who responded to the survey may differ in systematic ways from the University population as a whole.
The results in this document are reported according to three broad categories of respondents: students (undergraduate, graduate, and professional), academics (defined as tenure track and non–tenure track academic appointees and postdoctoral researchers), and staff (academic support and non-academic). It is important to recognize that each of these categories contains sub-categories whose responses may differ, perhaps in marked ways, from one another.
In April of 2016, the survey was sent to 14,658 students, 3,315 tenure track and non–tenure track academics and postdoctoral researchers, and 7,621 staff, and yielded a 29% campus-wide response rate. The response rate varied among the constituents: 26% among students, 28% among academics and postdoctoral researchers, and 35% percent among staff. More details on the participation rate are presented in Appendix 1.

THE UNIVERSITY OF CHICAGO Spring 2016 Campus Climate Survey: Religion 4
Our overall response rate of 29% is similar to that obtained by other institutions that have done combined climate surveys of students, academics, and staff. For example, the University of Illinois system had a 16% response (2011), the University of Toledo had an 11% student and 21% academics/staff response (2012), the University of California system had a 27% response (2013), and Marquette University had a 31% response (2015).
This report shows responses broken down by religious identity categories. The overall number of respondents in each religious identity category is shown in table 1. The table first shows respondents who identified with a single religious group or who checked multiple answers separately, and then shows the total count by category including multiple respondents in the second set of columns (i.e., the higher numbers double-count respondents who selected more than one option). Table 2 shows the responses broken down by religious identity and respondent categories.
Table 1: Detail of Religious Identity Responses
Unique responses only Responses in combination
Response Academics Students Staff Academics Students Staff
Agnostic 115 515 263 156 980 406
Atheist 162 583 228 216 925 327
Baha'i 1 4 1 2 8 3
Buddhist 16 41 23 24 101 62
Christian 209 1,007 1,134 249 1,264 1,267
Confucianism 1 8 1 1 23 4
Daoism 0 3 1 2 13 9
Hindu 19 74 17 25 117 25
Humanist 2 5 4 11 63 47
Jewish 98 239 88 138 417 124
Muslim 6 73 20 9 97 28
Native American Religion 1 1 0 2 8 6
Non-religious/secular 42 155 109 70 334 201
Sikh 1 2 0 1 5 1
Scientology 0 1 0 0 7 1
Unitarian Universalist 10 14 13 15 41 35
Wiccan/Pagan/Druid 1 4 6 6 18 19
Spiritual but not associated with a major religion
22 119 149 36 275 237
Self-identify (please specify) 9 52 36 15 89 61
Multiple responses 112 786 299
Prefer not to answer 85 176 335
Grand total 912 3,862 2,727

THE UNIVERSITY OF CHICAGO Spring 2016 Campus Climate Survey: Religion 5
Table 2: Religious Identity Groupings Use in Report
Status Category Students Academics Staff
Religious Affiliation Number Percent Number Percent Number Percent
Atheist 587 14% 163 16% 228 8%
Christian 1,070 25% 214 21% 1,154 38%
Jewish 238 6% 94 9% 87 3%
Muslim 73 2% 6 1% 20 1%
Secular/ non-religious
675 16% 163 16% 380 13%
Other 992 23% 180 18% 490 16%
No response 674 16% 203 20% 654 22%
Total 4,309 100% 1,023 100% 3,013 100%
The purpose of the Climate Survey was not to estimate the prevalence of particular experiences, attitudes, or beliefs. Instead, the goal of the survey was primarily descriptive—to describe group experiences, possibly account for observed relationships, and provide indicators of arenas in which improvements would be valued. For this reason, comparing responses across different groups or contexts is likely to be more informative than overall percentages might be. Reports such as this one can be particularly informative, for example, about the contexts in which particular attitudes have developed or persist and the consequences of particular experiences for individuals and the institution.

THE UNIVERSITY OF CHICAGO Spring 2016 Campus Climate Survey: Religion 6
BROAD PERCEPTIONS OF CAMPUS CLIMATEDESCRIPTION OF THE DATABroad perceptions of campus climate focus on responses to two sets of questions. One question measured proximal campus climate, by asking students/academics/staff to rate the climate in their classes/department/work unit respectively. Another question measured overall institutional climate, by asking respondents to rate the overall campus climate. Both of these questions used religiously intolerant and religiously tolerant as the poles of the 5-point rating scale. The wording of each question is detailed in Appendix 2 at the end of this report. In the summaries and figures below, we characterize answers to these questions with a 1 or 2 as a negative view of the climate, answers of 4 or 5 as positive, and answers of 3 as neutral.
BRIEF SUMMARY OF RESULTSAcross all categories of religious identity members of our campus community have a significantly more positive perception of their proximal climate than the overall institutional climate.
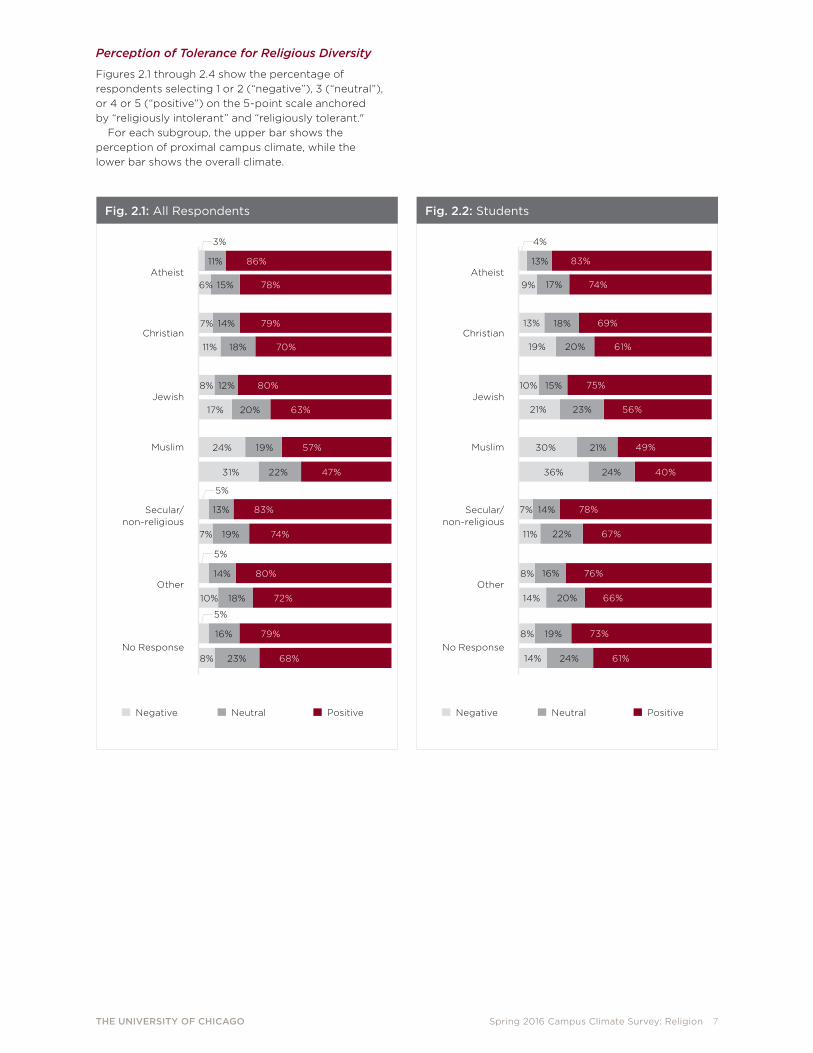
The majority of all respondents reported a positive climate regarding religious tolerance: 80% perceive their proximal climate as religiously tolerant, and 71% perceive the overall institutional climate as religiously tolerant. See Figure 1.
Perceptions of the climate varied based on religious identity.
• Respondents who identify as Muslim were the most likely to report a negative climate: 31% perceive the overall institutional climate as religiously intolerant; this number decreases to 24% regarding their proximal climate.
• In comparison, among respondents who identify as Jewish, 17% perceive the overall institutional climate as religiously intolerant; this number decreases to 8% regarding their proximal climate. Among respondents who identify as Christian,
11% perceive the overall institutional climate as religiously intolerant; this number decreases to 7% regarding their proximal climate.
• Respondents who identify as Atheist were the least likely to report a negative climate: 6% perceive the overall institutional climate as religiously intolerant; this number decreases to 3% regarding their proximal climate.
• See Figure 2.1.
RESULTSFigure 1 shows the percentage of respondents who selected 1 or 2 (“negative”), 3 ("neutral"), or 4 or 5 (“positive”) on a 5-point scale between the following anchor points:
Religiously intolerant … Religiously tolerant
The upper bar shows the response regarding proximal campus climate (climate in the respondent’s department, immediate work environment, or classes), while the lower bar shows the response regarding overall campus climate.
Figure 1: Proximal and Overall Perception of Tolerance for Religious Diversity
Percentage of Respondents
Proximal
Overall
Negative Neutral Positive
80%14%6%
71%19%10%
THE UNIVERSITY OF CHICAGO Spring 2016 Campus Climate Survey: Religion 7
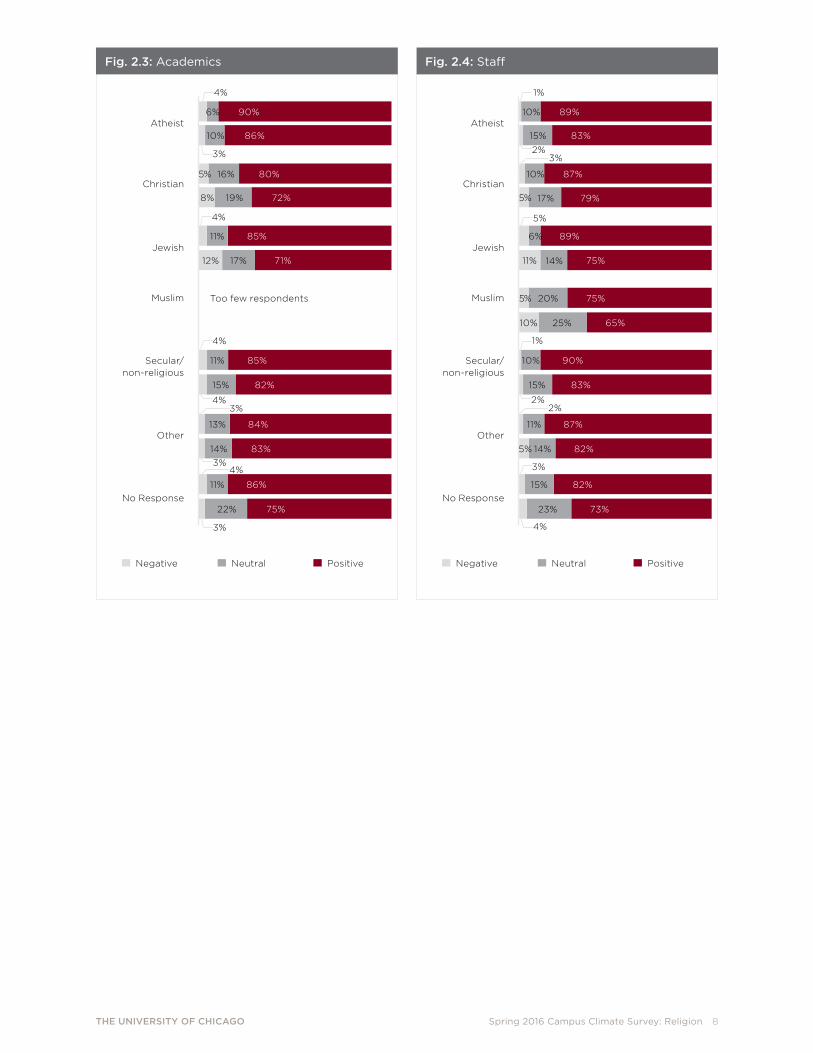
Perception of Tolerance for Religious Diversity
Figures 2.1 through 2.4 show the percentage of respondents selecting 1 or 2 (“negative”), 3 (“neutral”), or 4 or 5 (“positive”) on the 5-point scale anchored by “religiously intolerant” and “religiously tolerant."
For each subgroup, the upper bar shows the perception of proximal campus climate, while the lower bar shows the overall climate.
Atheist
Christian
Jewish
Muslim
Secular/ non-religious
Other
No Response
Negative Neutral Positive
Fig. 2.1: All Respondents
86%
78%
79%
70%
80%
63%
57%
47%
83%
74%
80%
72%
79%
68%
11%
15%
14%
18%
12%
20%
19%
22%
13%
19%
14%
18%
16%
23%
6%
7%
11%
8%
17%
24%
31%
7%
10%
8%
3%
5%
5%
5%
Atheist
Christian
Jewish
Muslim
Secular/ non-religious
Other
No Response
Negative Neutral Positive
Fig. 2.2: Students
83%
74%
69%
61%
75%
56%
49%
40%
78%
67%
76%
66%
73%
61%
13%
17%
18%
20%
15%
23%
21%
24%
14%
22%
16%
20%
19%
24%
4%
9%
13%
19%
10%
21%
30%
36%
7%
11%
8%
14%
8%
14%
THE UNIVERSITY OF CHICAGO Spring 2016 Campus Climate Survey: Religion 8
Atheist
Christian
Jewish
Muslim
Secular/ non-religious
Other
No Response
Negative Neutral Positive
Fig. 2.3: Academics
Atheist
Christian
Jewish
Muslim
Secular/ non-religious
Other
No Response
Negative Neutral Positive
Fig. 2.4: Staff
Too few respondents
4%
6%
3%
19%
10%
11%
15%
11%
11%
3%
4%3%
3%4%
4%
12%
4%
8%
5% 16%
17%
13%
14%
22%
80%
72%
90%
86%
85%
71%
85%
82%
84%
83%
86%
75%
90%
89%
83%
87%
79%
89%
83%
75%
75%
65%
87%
82%
82%
73%
11%
11%
10%
10%
10%
15%
15%
15%
17%
6%
14%
20%
25%
14%
23%
10%
5%
5%
5%
5%
1%
3%2%
1%
2%2%
3%
4%
THE UNIVERSITY OF CHICAGO Spring 2016 Campus Climate Survey: Religion 9
EXPERIENCES AND CONSEQUENCES OF DISCRIMINATION AND HARASSMENTDESCRIPTION OF THE DATAExperiences and consequences of discrimination and/or harassment focus on responses to six sets of questions. All questions were asked in relation to respondents' religious identity. The first question asked respondents, to report whether they have experienced any of 12 forms of discrimination and/or harassment. The second question asked respondents to report whether they have experienced any of three forms of online harassment. The third question asked respondents to report whether they have experienced any of three forms of physical harassment. The fourth question asked respondents to report whether they have considered doing any of the following things in response to their experience of discrimination and/or harassment on campus: (1) transferring/applying to another university; (2) dropping out/quitting; and (3) not recommending the University to prospective student/academics/staff member. The fifth question asked respondents to report whether they have avoided disclosing their religious identity due to fear of negative consequences, harassment, or discrimination from a peer/academic/supervisor. The sixth question asked respondents to report whether they have concealed their support for those of their religious identity due to fear of intimidation from a peer/academic/supervisor. The wording of each question is detailed in Appendix 2 at the end of this report.
BRIEF SUMMARY OF RESULTS Approximately 3% of all respondents reported
experiencing non-physical forms of discrimination and/or harassment (e.g., denied service or promotion, unfair grading, derogatory remark or graffiti, or unfair comment due to one’s status characteristic). See Figure 3.
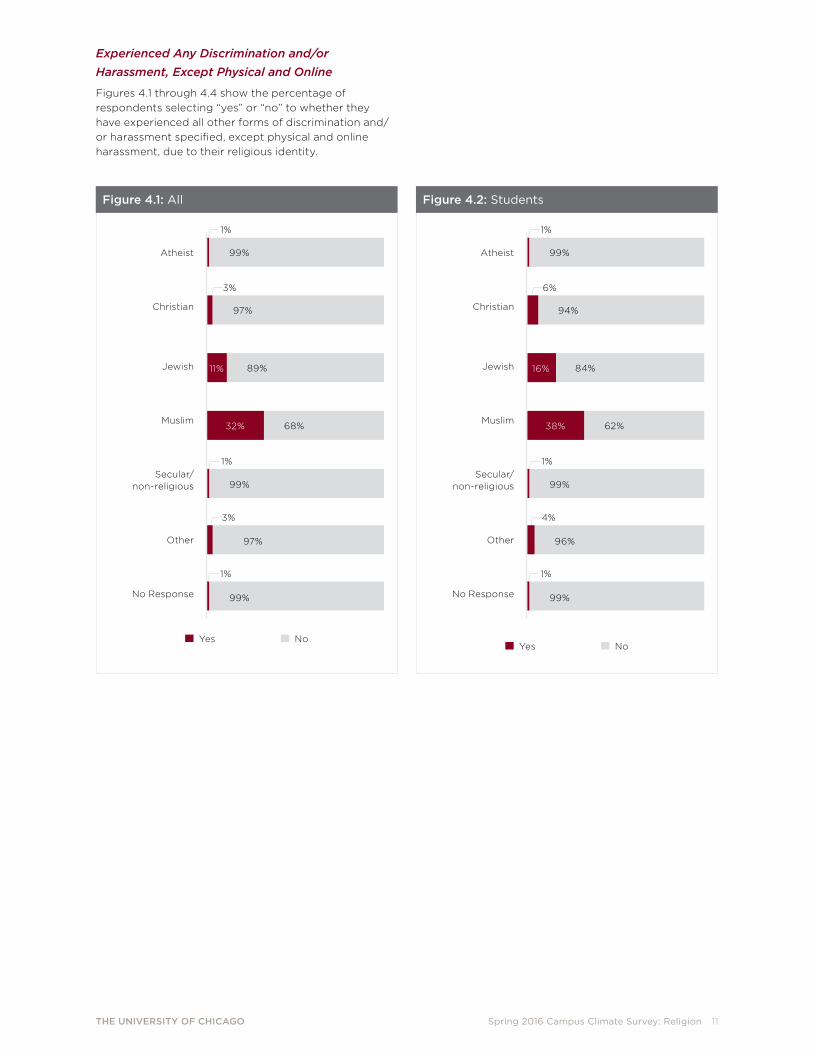
• Members of our campus community who identify as Muslim were the most likely to report non-physical discrimination and/or harassment (32%); the next likely were those who identify as Jewish (11%). Approximately 3% or less of the members of each of the other religious identity categories reported non-physical discrimination and/or harassment. See Figure 4.1.
Approximately 1% of all respondents reported experiencing online harassment. See Figure 3.
• Members of our campus community who identify as Muslim were the most likely to report online discrimination and/or harassment (14%), followed by those who identify as Jewish (4%). Approximately 1% or less of the members of each of the other religious identity categories reported online harassment. See Figure 5.1.
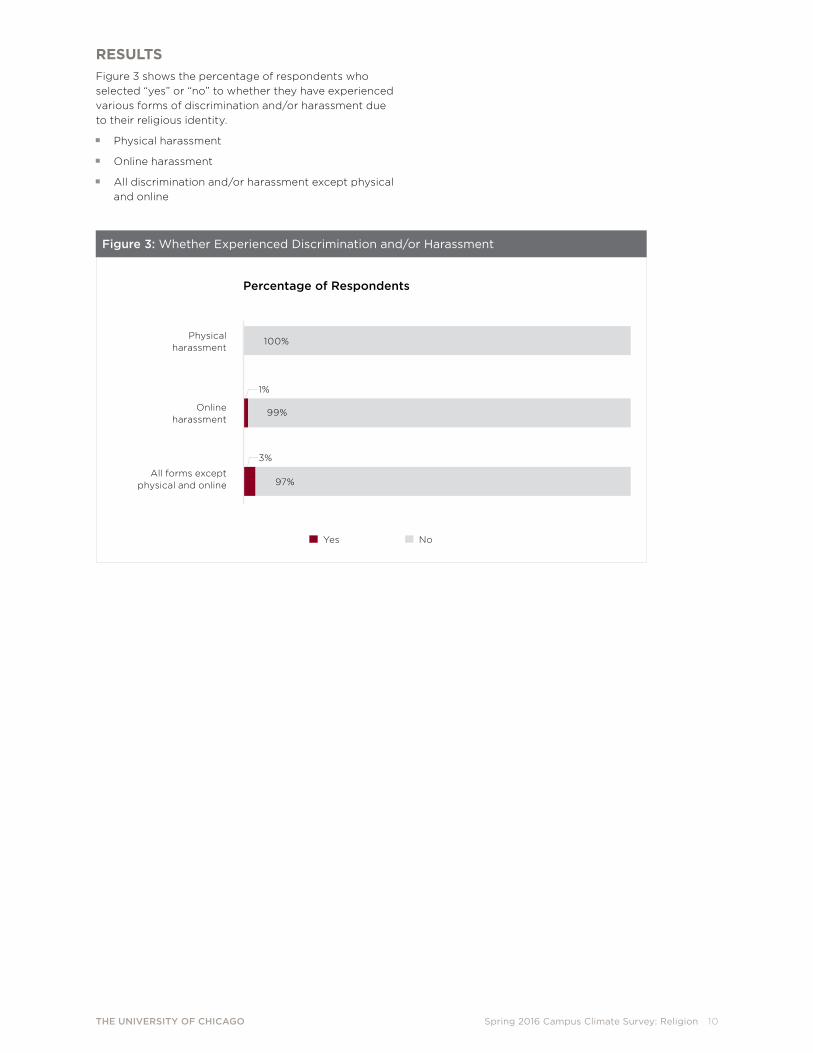
Less than 1% of all respondents reported experiencing physical harassment. Approximately 2% of respondents who identify as Jewish or Muslim reported experiencing physical harassment. See Figures 3 and 6.1.
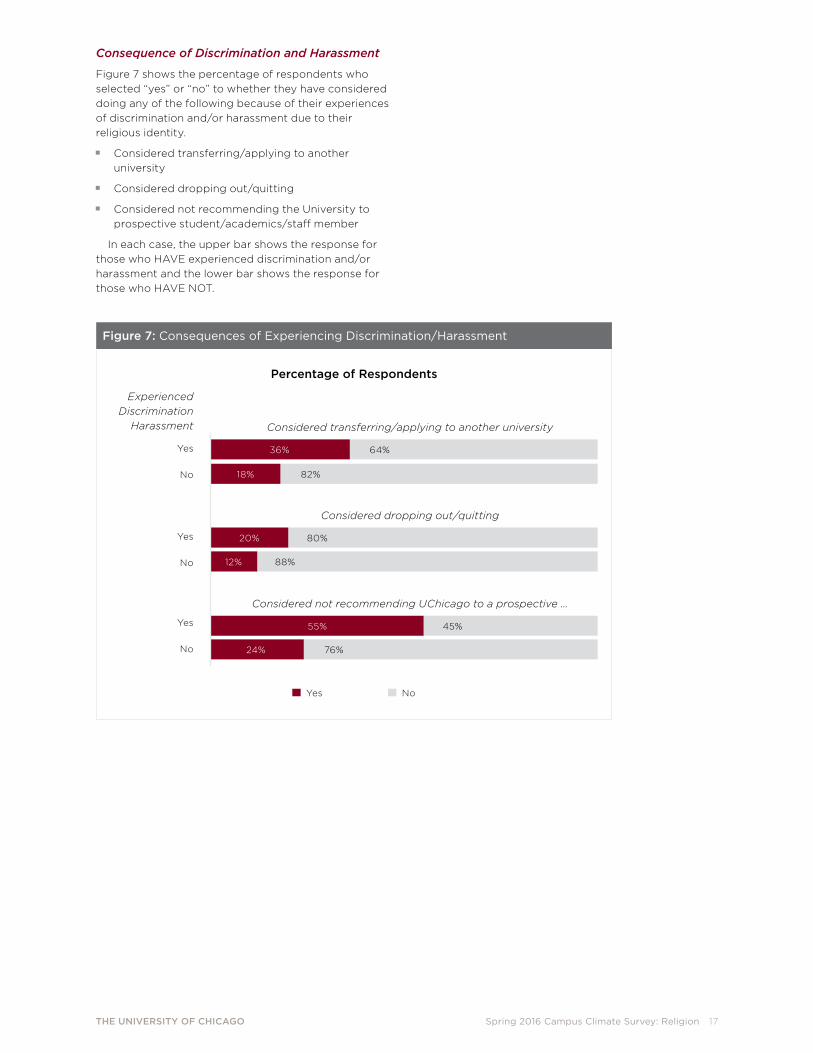
Among all of those who experienced discrimination and/or harassment, 36% considered transferring/applying to another university, and 20% considered dropping out/quitting. Discrimination and/or harassment also have meaningful consequences for the University’s reputation. Among those who have experienced discrimination and/or harassment, 55% considered not recommending the University to a prospective member of our community. See Figure 7. Figures 8.1 through 8.3 show these percentages disaggregated by religious identity.
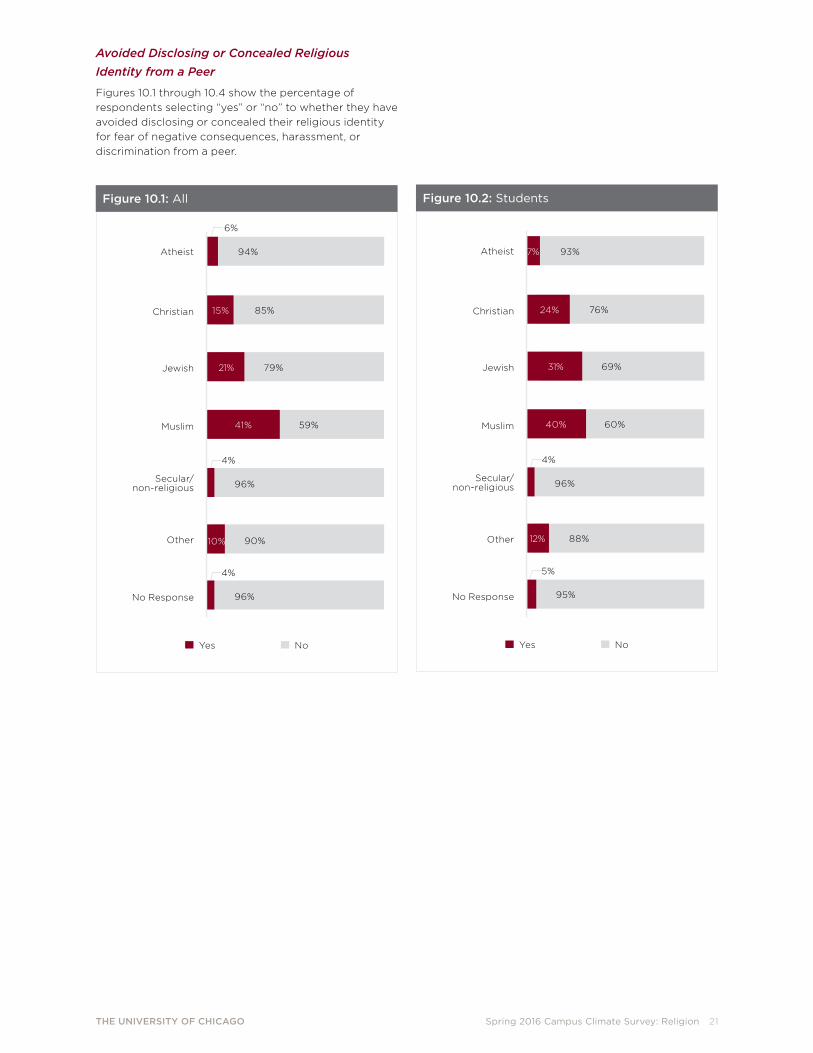
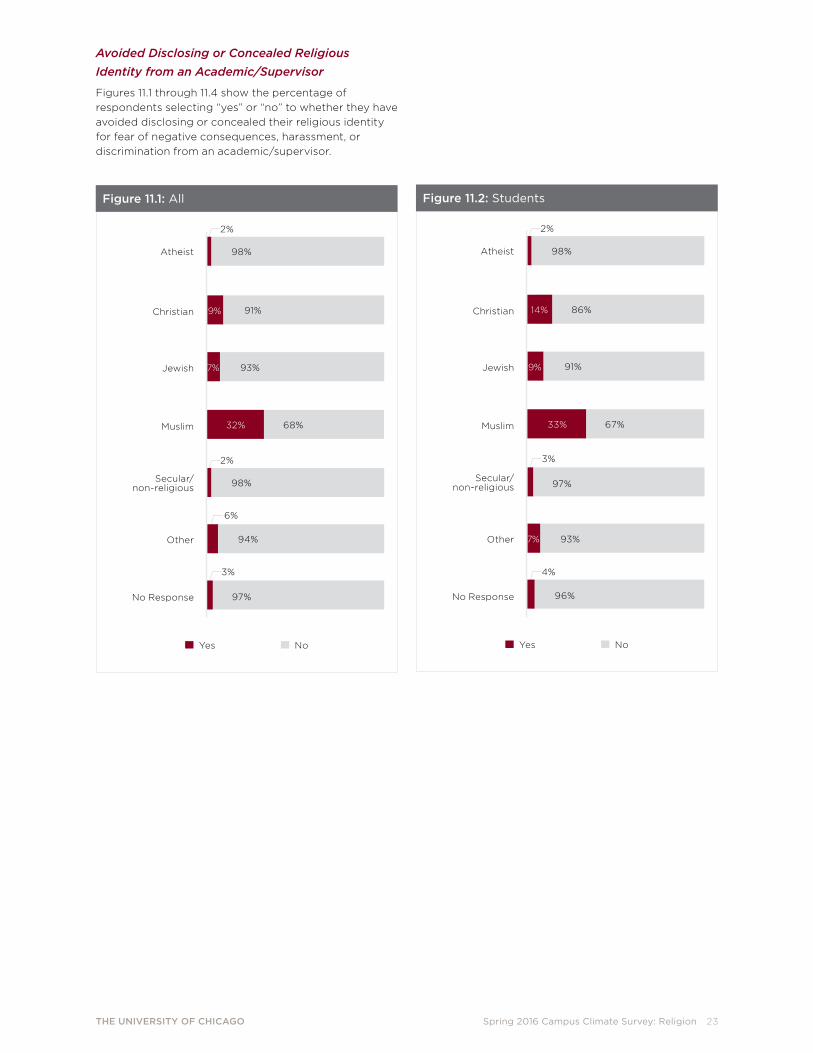
Approximately 10% of all respondents report having avoided disclosing or concealed their religious identity due to fear of negative consequences or harassment from a peer, and 6% having done so due to fear of negative consequences or harassment from an academic/supervisor. See Figure 9. This varies substantially based on the respondent's religious identity:
• For example, approximately 41% of respondents who identify as Muslim and 21% of respondents who identify as Jewish report having avoided disclosing or concealed their religious identity due to fear of negative consequences or harassment from a peer. In comparison, 15% of respondents who identify as Christian, 10% of those who identify with another religious identity, 6% who identify as Atheist, and 4% who identify as Secular report the same. See Figure 10.1.
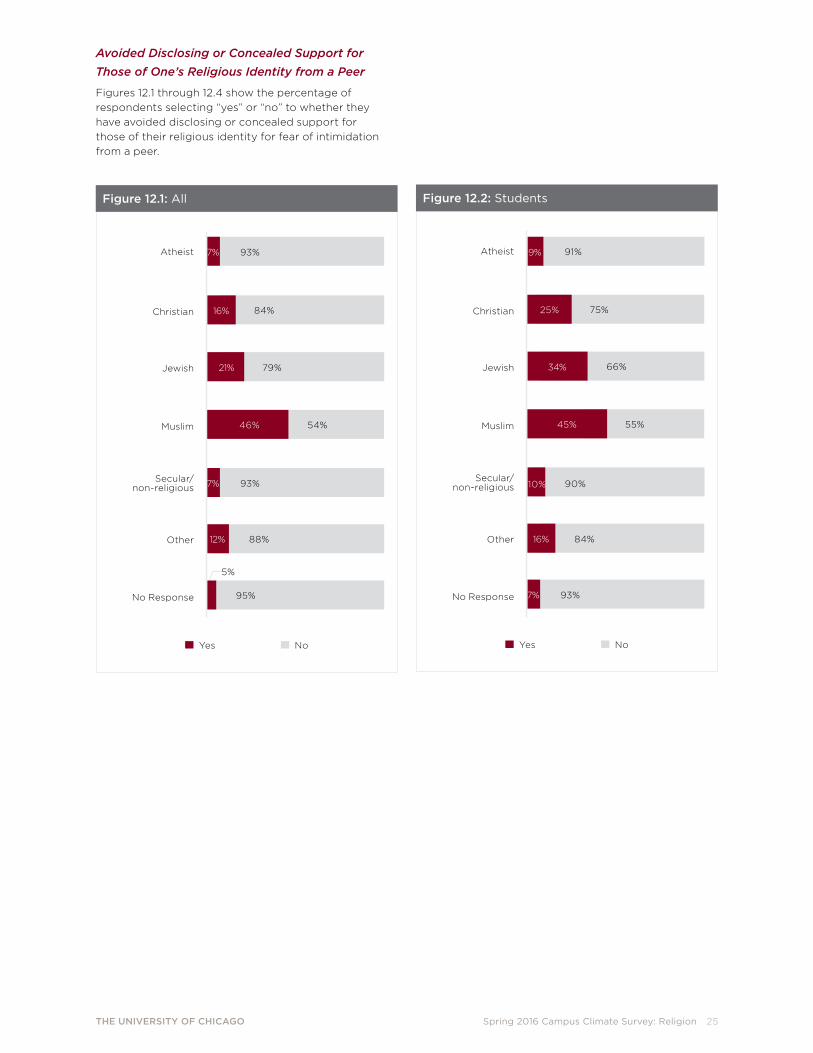
Approximately 11% of all respondents report having concealed their support for those of their religious identity due to fear of intimidation from a peer, and 6% report having done so due to fear of intimidation from an academic/supervisor. See Figure 9. This varied substantially based on the respondents religious identity:
• For example, approximately 46% of respondents who identify as Muslim and 21% of respondents who identify as Jewish report having concealed their support for those of their religious identity due to fear of intimidation from a peer. In comparison, 16% of respondents who identify as Christian, 12% of those who identify with another religious identity, 7% who identify as Atheist, and 7% who identify as Secular report the same. See Figure 12.1.
THE UNIVERSITY OF CHICAGO Spring 2016 Campus Climate Survey: Religion 10
RESULTSFigure 3 shows the percentage of respondents who selected “yes” or “no” to whether they have experienced various forms of discrimination and/or harassment due to their religious identity.
Physical harassment
Online harassment
All discrimination and/or harassment except physical and online
Figure 3: Whether Experienced Discrimination and/or Harassment
Percentage of Respondents
100%
99%
97%
Physical harassment
Online harassment
All forms except physical and online
Yes No
1%
3%
THE UNIVERSITY OF CHICAGO Spring 2016 Campus Climate Survey: Religion 11
1%
3%
1%
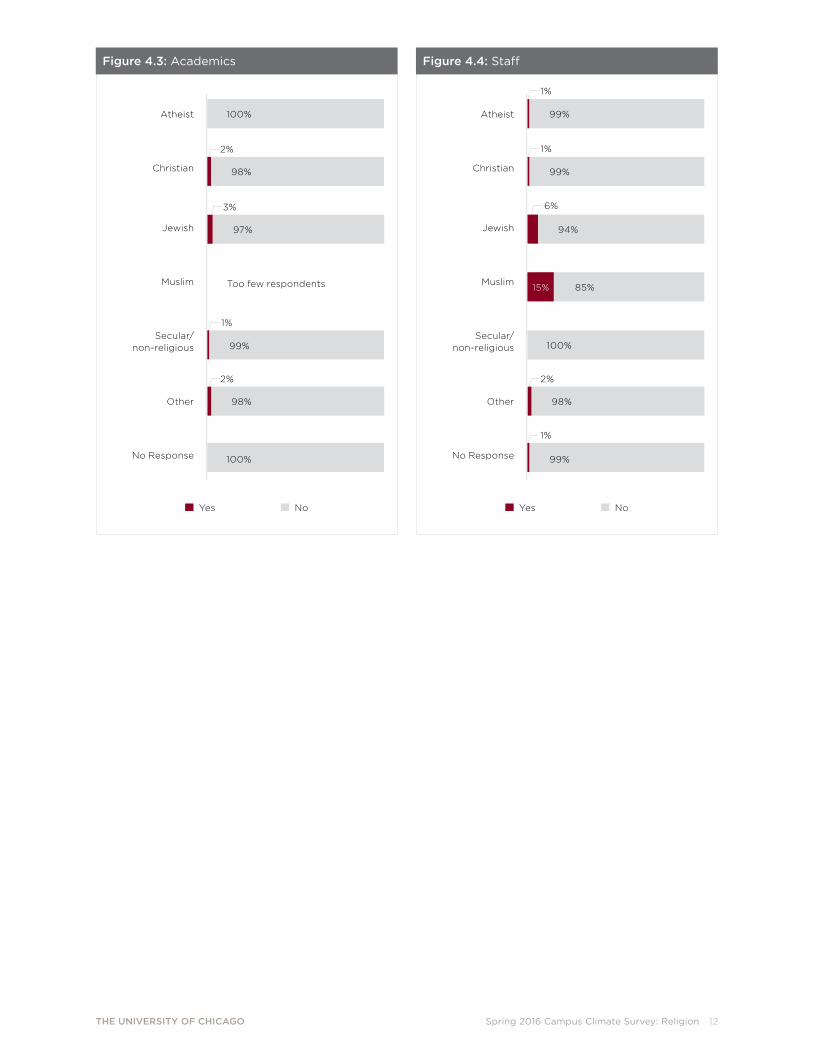
Experienced Any Discrimination and/or Harassment, Except Physical and Online
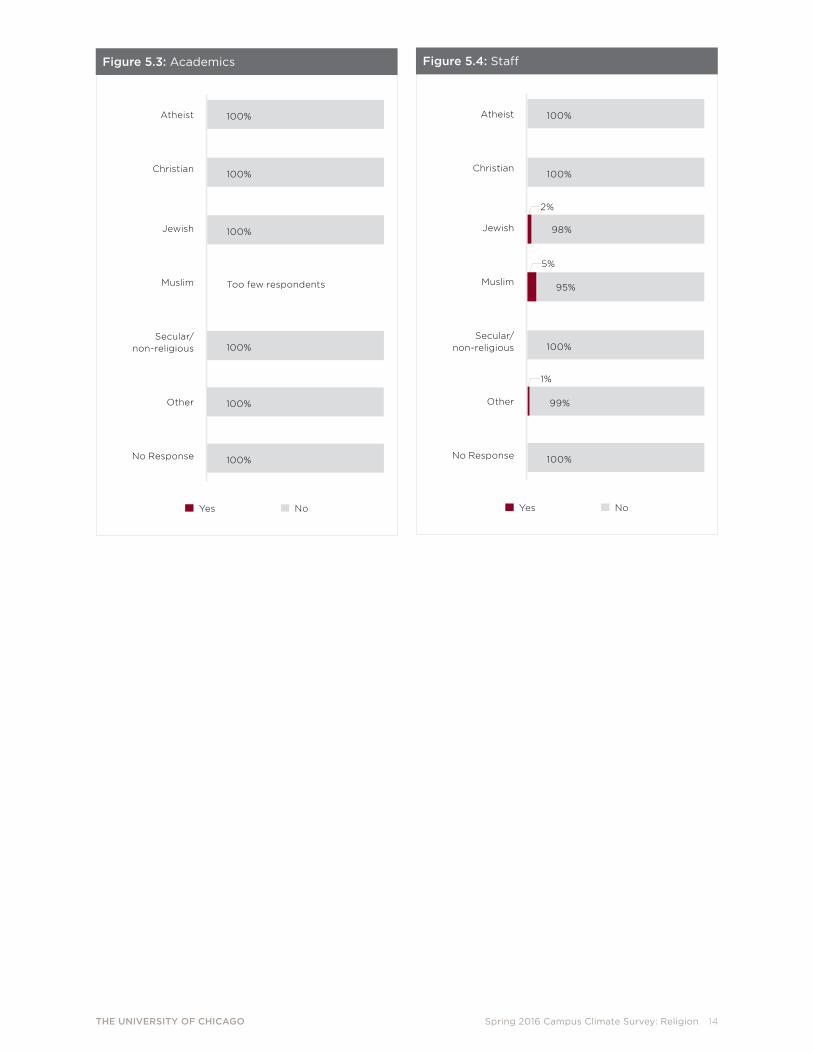
Figures 4.1 through 4.4 show the percentage of respondents selecting “yes” or “no” to whether they have experienced all other forms of discrimination and/or harassment specified, except physical and online harassment, due to their religious identity.
Figure 4.1: All
Yes No
Atheist
Christian
Jewish
Muslim
Secular/ non-religious
Other
No Response
3%
97%
1%
99%
97%
89%
68%
99%
99%
11%
32%
1%
6%
1%
Figure 4.2: Students
Yes No
Atheist
Christian
Jewish
Muslim
Secular/ non-religious
Other
No Response
4%
96%
1%
99%
94%
84%
62%
99%
99%
16%
38%
THE UNIVERSITY OF CHICAGO Spring 2016 Campus Climate Survey: Religion 12
2%
98%
100%
2%
98%
3%
97%
1%
99%
1%
2%
Figure 4.3: Academics
Yes No
Atheist
Christian
Jewish
Muslim
Secular/ non-religious
Other
No Response
100%
98%
99%
100%
1%
Figure 4.4: Staff
Yes No
Atheist
Christian
Jewish
Muslim
Secular/ non-religious
Other
No Response
1%
99%
94%
85%
99%
15%Too few respondents
6%

THE UNIVERSITY OF CHICAGO Spring 2016 Campus Climate Survey: Religion 13
1%
99%
1%
99%
100%
Experienced Online Harassment
Figures 5.1 through 5.4 show the percentage of respondents selecting “yes” or “no” to whether they have experienced online harassment due to their religious identity.
Figure 5.1: All
Yes No
Atheist
Christian
Jewish
Muslim
Secular/ non-religious
Other
No Response
86%14%
100%
100%
1%
99%
4%
96%
1%
99%
100%
Figure 5.2: Students
Yes No
Atheist
Christian
Jewish
Muslim
Secular/ non-religious
Other
No Response
82%18%
100%
1%
99%
94%
6%
THE UNIVERSITY OF CHICAGO Spring 2016 Campus Climate Survey: Religion 14
5%
100%
Figure 5.3: Academics
Yes No
Atheist
Christian
Jewish
Muslim
Secular/ non-religious
Other
No Response
100%
100%
1%
99%
100%
Figure 5.4: Staff
Yes No
Atheist
Christian
Jewish
Muslim
Secular/ non-religious
Other
No Response
95%
100%
Too few respondents
100%
100%
100% 100%
100%
2%
98%
THE UNIVERSITY OF CHICAGO Spring 2016 Campus Climate Survey: Religion 15
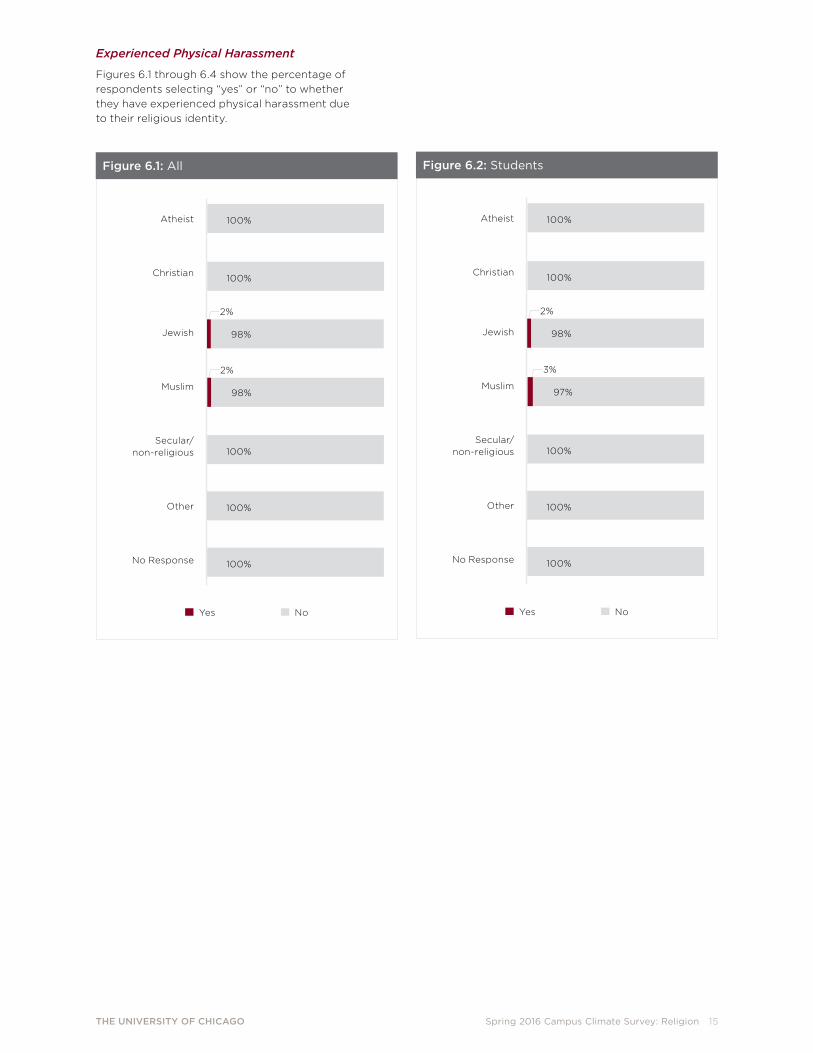
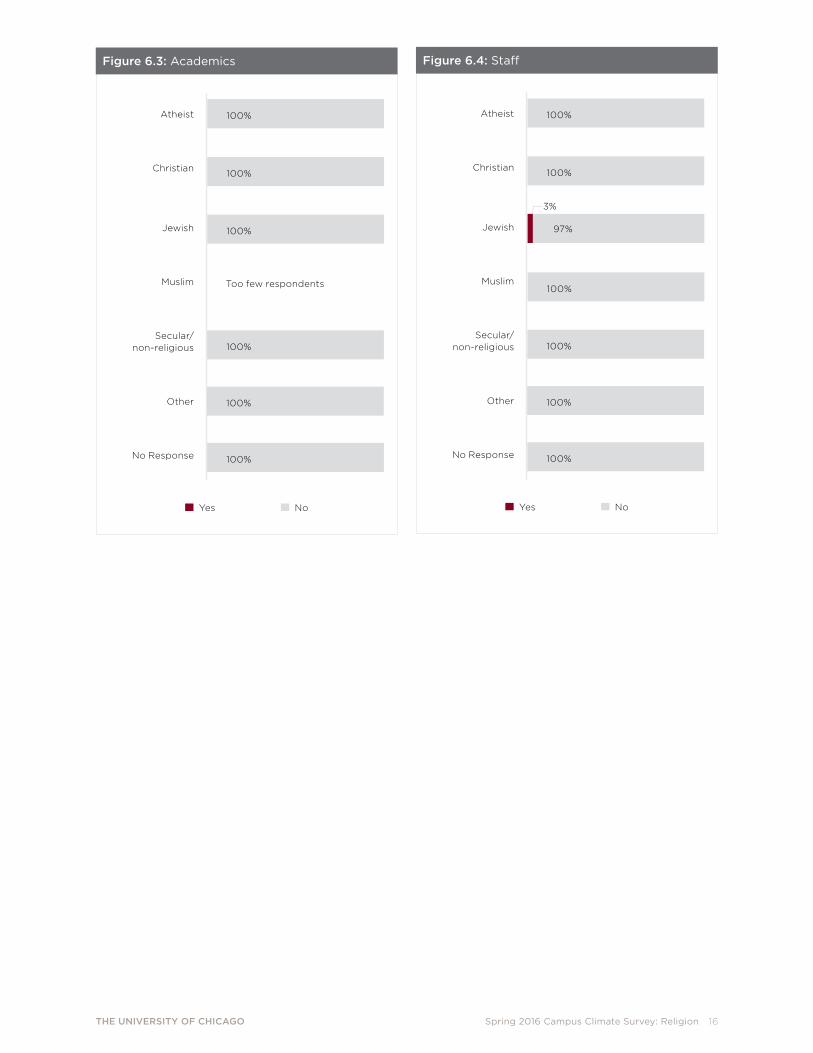
Experienced Physical Harassment
Figures 6.1 through 6.4 show the percentage of respondents selecting “yes” or “no” to whether they have experienced physical harassment due to their religious identity.
100%
Figure 6.1: All
Yes No
Atheist
Christian
Jewish
Muslim
Secular/ non-religious
Other
No Response
100%
100%
100%
100%
2%
98%
2%
98%
100%
Figure 6.2: Students
Yes No
Atheist
Christian
Jewish
Muslim
Secular/ non-religious
Other
No Response
100%
100%
100%
100%
2%
98%
3%
97%
THE UNIVERSITY OF CHICAGO Spring 2016 Campus Climate Survey: Religion 16
100%
Figure 6.3: Academics
Yes No
Atheist
Christian
Jewish
Muslim
Secular/ non-religious
Other
No Response
100%
100%
Too few respondents
100%
100%
100%
100%
Figure 6.4: Staff
Yes No
Atheist
Christian
Jewish
Muslim
Secular/ non-religious
Other
No Response
100%
100%
100%
100%
3%
97%
100%
THE UNIVERSITY OF CHICAGO Spring 2016 Campus Climate Survey: Religion 17
Consequence of Discrimination and Harassment
Figure 7 shows the percentage of respondents who selected “yes” or “no” to whether they have considered doing any of the following because of their experiences of discrimination and/or harassment due to their religious identity.
Considered transferring/applying to another university
Considered dropping out/quitting
Considered not recommending the University to prospective student/academics/staff member
In each case, the upper bar shows the response for those who HAVE experienced discrimination and/or harassment and the lower bar shows the response for those who HAVE NOT.
Yes No
Figure 7: Consequences of Experiencing Discrimination/Harassment
Percentage of Respondents
82%18%
80%20%
88%12%
45%55%
76%24%
Yes
No
Yes
No
Yes
No
Considered transferring/applying to another university
ExperiencedDiscrimination
Harassment
Considered dropping out/quitting
Considered not recommending UChicago to a prospective …
36% 64%
THE UNIVERSITY OF CHICAGO Spring 2016 Campus Climate Survey: Religion 18
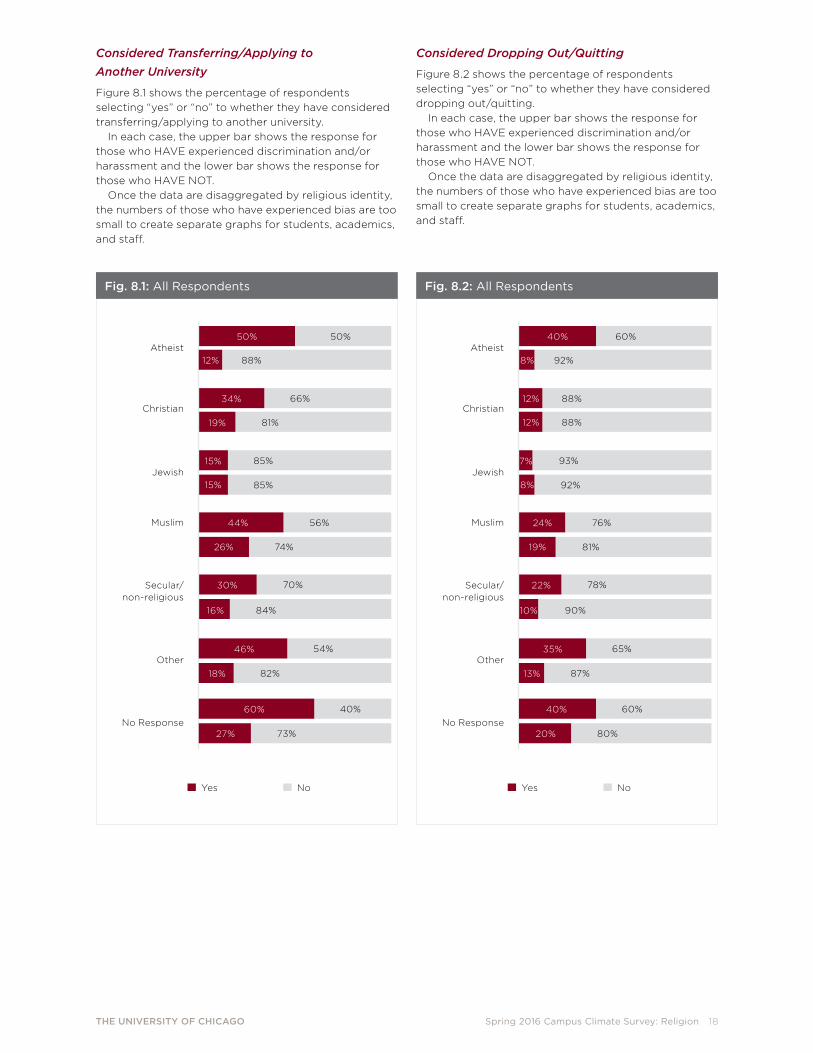
Considered Transferring/Applying to Another University
Figure 8.1 shows the percentage of respondents selecting “yes” or “no” to whether they have considered transferring/applying to another university.
In each case, the upper bar shows the response for those who HAVE experienced discrimination and/or harassment and the lower bar shows the response for those who HAVE NOT.
Once the data are disaggregated by religious identity, the numbers of those who have experienced bias are too small to create separate graphs for students, academics, and staff.
Atheist
Christian
Jewish
Muslim
Secular/ non-religious
Other
No Response
Fig. 8.1: All Respondents
Yes No
50%50%
66%
81%
85%
85%
56%
74%
70%
84%
54%
82%
40%
73%
88%12%
34%
19%
15%
15%
44%
26%
30%
16%
46%
18%
60%
27%
Considered Dropping Out/Quitting
Figure 8.2 shows the percentage of respondents selecting “yes” or “no” to whether they have considered dropping out/quitting.
In each case, the upper bar shows the response for those who HAVE experienced discrimination and/or harassment and the lower bar shows the response for those who HAVE NOT.
Once the data are disaggregated by religious identity, the numbers of those who have experienced bias are too small to create separate graphs for students, academics, and staff.
Atheist
Christian
Jewish
Muslim
Secular/ non-religious
Other
No Response
Fig. 8.2: All Respondents
Yes No
60%40%
92%
93%
92%
76%
81%
78%
90%
65%
87%
60%
80%
8%
7%
8%
24%
19%
22%
10%
35%
13%
40%
20%
88%12%
88%12%
THE UNIVERSITY OF CHICAGO Spring 2016 Campus Climate Survey: Religion 19
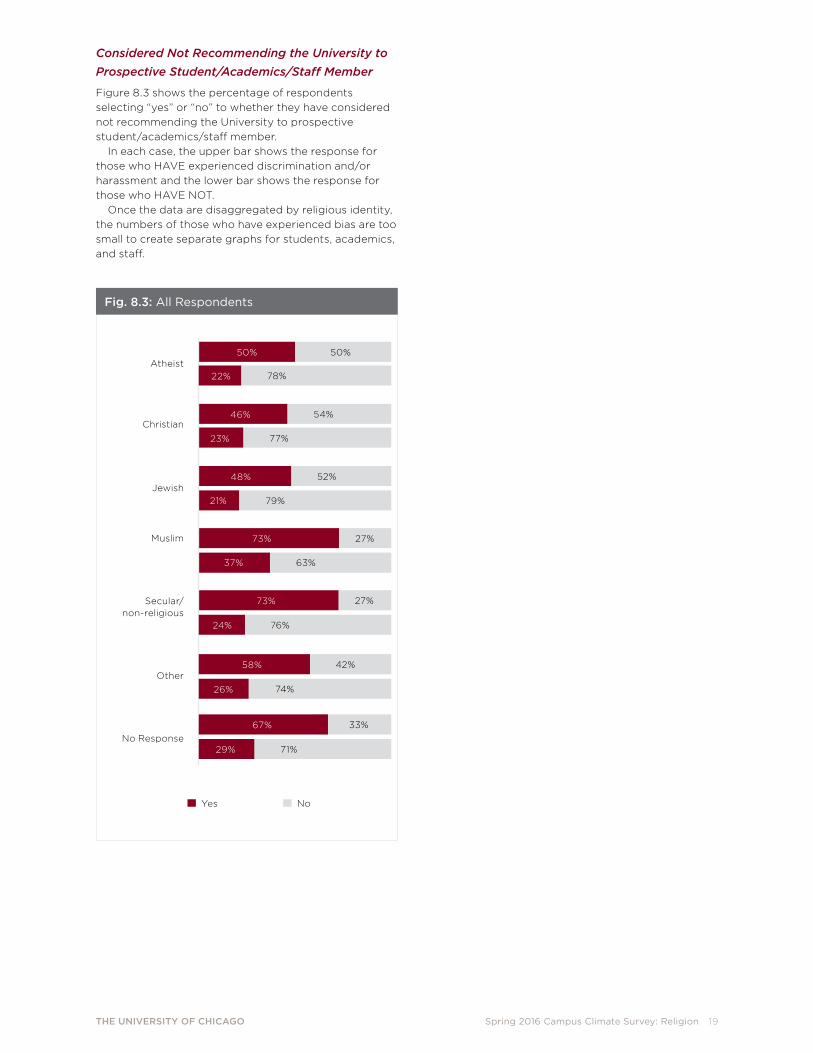
Considered Not Recommending the University to Prospective Student/Academics/Staff Member
Figure 8.3 shows the percentage of respondents selecting “yes” or “no” to whether they have considered not recommending the University to prospective student/academics/staff member.
In each case, the upper bar shows the response for those who HAVE experienced discrimination and/or harassment and the lower bar shows the response for those who HAVE NOT.
Once the data are disaggregated by religious identity, the numbers of those who have experienced bias are too small to create separate graphs for students, academics, and staff.
Atheist
Christian
Jewish
Muslim
Secular/ non-religious
Other
No Response
Fig. 8.3: All Respondents
Yes No
50%50%
54%
77%
52%
79%
27%
63%
27%
42%
74%
33%
71%
46%
23%
48%
21%
73%
37%
73%
58%
26%
67%
29%
78%22%
76%24%
THE UNIVERSITY OF CHICAGO Spring 2016 Campus Climate Survey: Religion 20
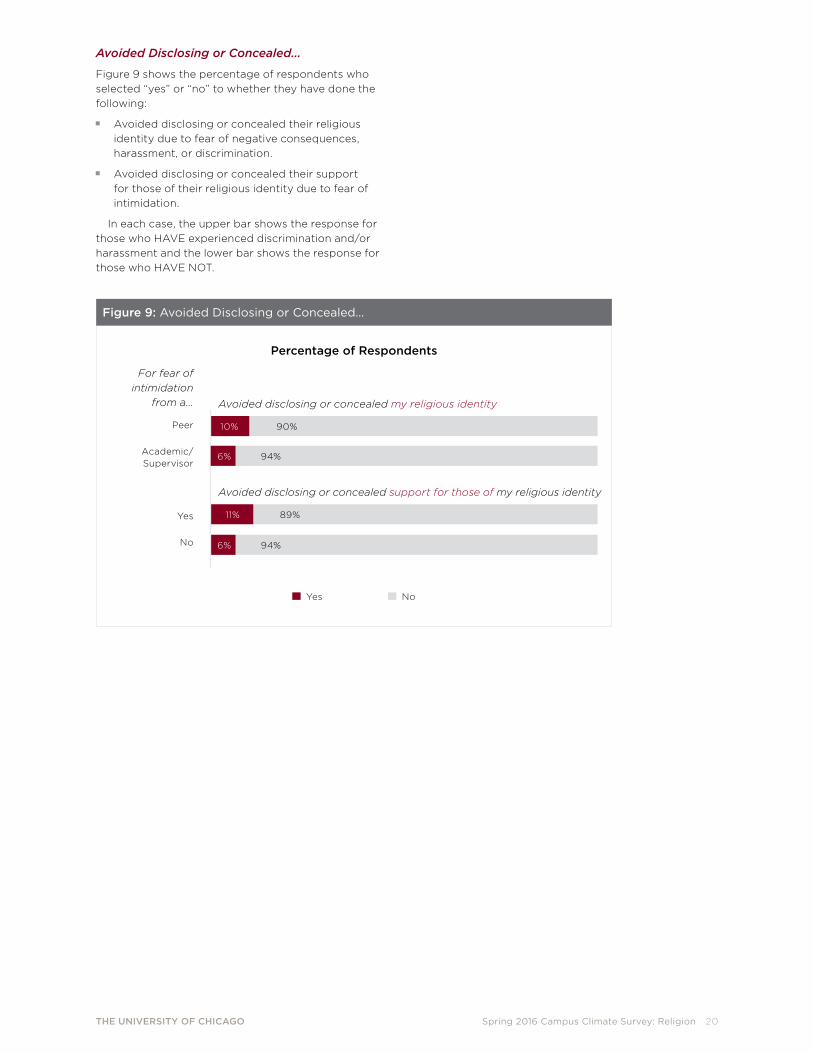
Avoided Disclosing or Concealed…
Figure 9 shows the percentage of respondents who selected “yes” or “no” to whether they have done the following:
Avoided disclosing or concealed their religious identity due to fear of negative consequences, harassment, or discrimination.
Avoided disclosing or concealed their support for those of their religious identity due to fear of intimidation.
In each case, the upper bar shows the response for those who HAVE experienced discrimination and/or harassment and the lower bar shows the response for those who HAVE NOT.
Yes No
Figure 9: Avoided Disclosing or Concealed…
Percentage of Respondents
89%11%
94%6%
Peer
Academic/ Supervisor
Yes
No
Avoided disclosing or concealed my religious identity
For fear of intimidation
from a…
Avoided disclosing or concealed support for those of my religious identity
10% 90%
94%6%
THE UNIVERSITY OF CHICAGO Spring 2016 Campus Climate Survey: Religion 21
Avoided Disclosing or Concealed Religious Identity from a Peer
Figures 10.1 through 10.4 show the percentage of respondents selecting “yes” or “no” to whether they have avoided disclosing or concealed their religious identity for fear of negative consequences, harassment, or discrimination from a peer.
Figure 10.1: All
Yes No
Atheist
Christian
Jewish
Muslim
Secular/ non-religious
Other
No Response
79%
59%41%
21%
Figure 10.2: Students
Yes No
Atheist
Christian
Jewish
Muslim
Secular/ non-religious
Other
No Response
60%40%
69%31%
76%24%
94%
6%
5%
95%
85%15%
4%
96%
4%
96%
90%10%
4%
96%
93%7%
88%12%

THE UNIVERSITY OF CHICAGO Spring 2016 Campus Climate Survey: Religion 22
Figure 10.3: Academics
Yes No
Atheist
Christian
Jewish
Muslim
Secular/ non-religious
Other
No Response
2%
98%
Figure 10.4: Staff
Yes No
Atheist
Christian
Jewish
Muslim
Secular/ non-religious
Other
No Response
Too few respondents
1%
99%
4%
96%
93%7%
88%12%
93%7%
94%
6%
100%
93%7%
92%8%
92%8%
97%
3%
55%45%
THE UNIVERSITY OF CHICAGO Spring 2016 Campus Climate Survey: Religion 23
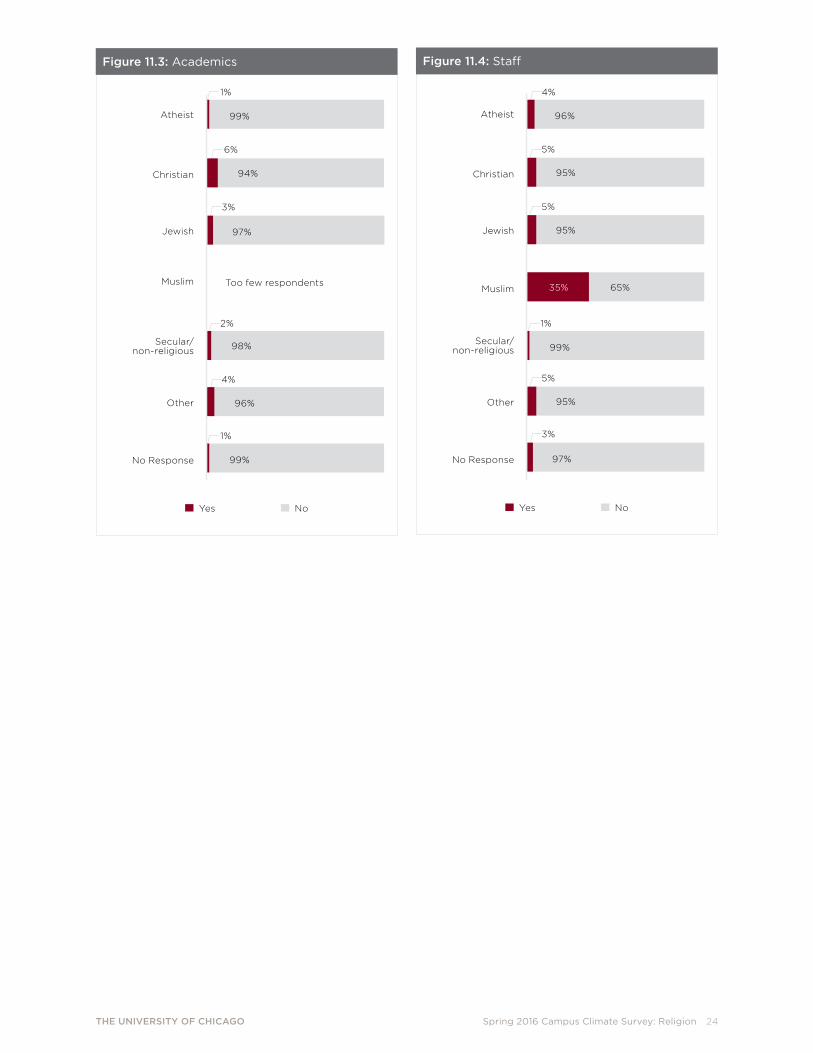
Avoided Disclosing or Concealed Religious Identity from an Academic/Supervisor
Figures 11.1 through 11.4 show the percentage of respondents selecting “yes” or “no” to whether they have avoided disclosing or concealed their religious identity for fear of negative consequences, harassment, or discrimination from an academic/supervisor.
Figure 11.1: All
Yes No
Atheist
Christian
Jewish
Muslim
Secular/ non-religious
Other
No Response
2%
98%
2%
98%
94%
6%
91%
93%
68%
97%
3%
32%
7%
9%
Figure 11.2: Students
Yes No
Atheist
Christian
Jewish
Muslim
Secular/ non-religious
Other
No Response
2%
98%
67%33%
91%9%
97%
3%
86%14%
4%
96%
93%7%
THE UNIVERSITY OF CHICAGO Spring 2016 Campus Climate Survey: Religion 24
Figure 11.3: Academics
Yes No
Atheist
Christian
Jewish
Muslim
Secular/ non-religious
Other
No Response
2%
98%
Figure 11.4: Staff
Yes No
Atheist
Christian
Jewish
Muslim
Secular/ non-religious
Other
No Response
65%35%Too few respondents
97%
3%
4%
96%
4%
96%
1%
99%
5%
95%
5%
95%
5%
95%
1%
99%
94%
6%
97%
3%
1%
99%
THE UNIVERSITY OF CHICAGO Spring 2016 Campus Climate Survey: Religion 25
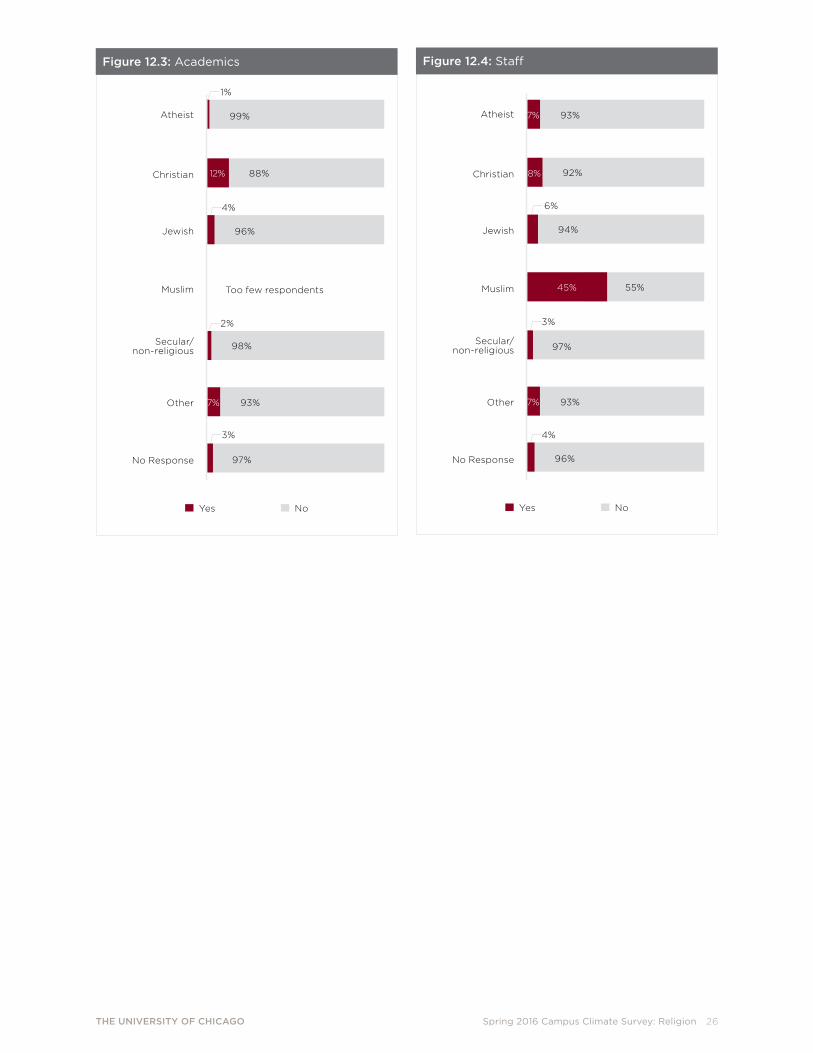
Avoided Disclosing or Concealed Support for Those of One’s Religious Identity from a Peer
Figures 12.1 through 12.4 show the percentage of respondents selecting “yes” or “no” to whether they have avoided disclosing or concealed support for those of their religious identity for fear of intimidation from a peer.
Figure 12.1: All
Yes No
Atheist
Christian
Jewish
Muslim
Secular/ non-religious
Other
No Response
84%
79%
54%46%
21%
16%
Figure 12.2: Students
Yes No
Atheist
Christian
Jewish
Muslim
Secular/ non-religious
Other
No Response
55%45%
66%34%
90%
75%25%
84%16%
93%7% 91%9%
93%7%
93%7%
88%12%
5%
95%
10%
THE UNIVERSITY OF CHICAGO Spring 2016 Campus Climate Survey: Religion 26
Figure 12.3: Academics
Yes No
Atheist
Christian
Jewish
Muslim
Secular/ non-religious
Other
No Response
Figure 12.4: Staff
Yes No
Atheist
Christian
Jewish
Muslim
Secular/ non-religious
Other
No Response
55%45%
92%
1%
99%
88%12%
4%
96%
93%7%
97%
3%
2%
98%
Too few respondents
93%7%
94%
6%
97%
3%
93%7%
4%
96%
8%
THE UNIVERSITY OF CHICAGO Spring 2016 Campus Climate Survey: Religion 27
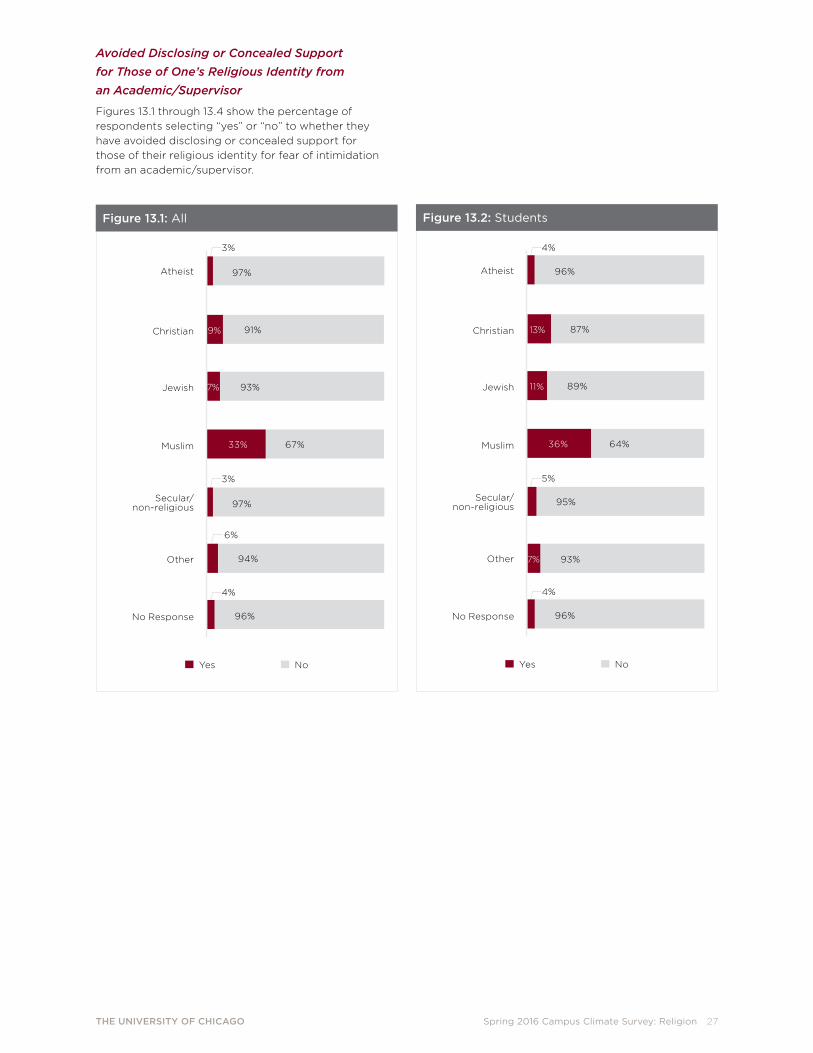
Avoided Disclosing or Concealed Support for Those of One’s Religious Identity from an Academic/Supervisor
Figures 13.1 through 13.4 show the percentage of respondents selecting “yes” or “no” to whether they have avoided disclosing or concealed support for those of their religious identity for fear of intimidation from an academic/supervisor.
Figure 13.1: All
Yes No
Atheist
Christian
Jewish
Muslim
Secular/ non-religious
Other
No Response
67%33%
97%
3%
91%9%
93%7%
97%
3%
94%
6%
4%
96%
Figure 13.2: Students
Yes No
Atheist
Christian
Jewish
Muslim
Secular/ non-religious
Other
No Response
64%36%
87%13%
4%
96%
4%
96%
93%7%
5%
95%
89%11%

THE UNIVERSITY OF CHICAGO Spring 2016 Campus Climate Survey: Religion 28
Figure 13.3: Academics
Yes No
Atheist
Christian
Jewish
Muslim
Secular/ non-religious
Other
No Response
Figure 13.4: Staff
Yes No
Atheist
Christian
Jewish
Muslim
Secular/ non-religious
Other
No Response
4%
96%
100%
1%
99%
1%
99%
4%
96%
92%8%
2%
98%
2%
98%
Too few respondents
5%
95%
1%
99%
75%25%
94%
6%
97%
3%
THE UNIVERSITY OF CHICAGO Spring 2016 Campus Climate Survey: Religion 29
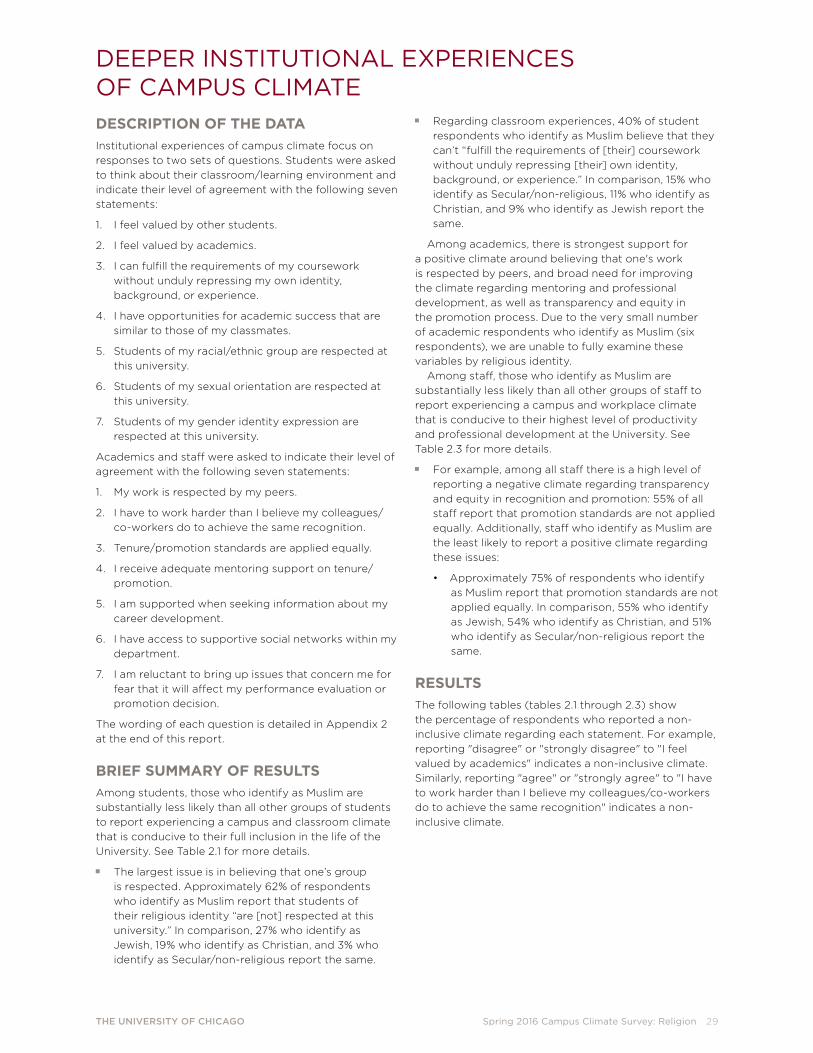
DEEPER INSTITUTIONAL EXPERIENCES OF CAMPUS CLIMATEDESCRIPTION OF THE DATAInstitutional experiences of campus climate focus on responses to two sets of questions. Students were asked to think about their classroom/learning environment and indicate their level of agreement with the following seven statements:
1. I feel valued by other students.
2. I feel valued by academics.
3. I can fulfill the requirements of my coursework without unduly repressing my own identity, background, or experience.
4. I have opportunities for academic success that are similar to those of my classmates.
5. Students of my racial/ethnic group are respected at this university.
6. Students of my sexual orientation are respected at this university.
7. Students of my gender identity expression are respected at this university.
Academics and staff were asked to indicate their level of agreement with the following seven statements:
1. My work is respected by my peers.
2. I have to work harder than I believe my colleagues/co-workers do to achieve the same recognition.
3. Tenure/promotion standards are applied equally.
4. I receive adequate mentoring support on tenure/promotion.
5. I am supported when seeking information about my career development.
6. I have access to supportive social networks within my department.
7. I am reluctant to bring up issues that concern me for fear that it will affect my performance evaluation or promotion decision.
The wording of each question is detailed in Appendix 2 at the end of this report.
BRIEF SUMMARY OF RESULTSAmong students, those who identify as Muslim are substantially less likely than all other groups of students to report experiencing a campus and classroom climate that is conducive to their full inclusion in the life of the University. See Table 2.1 for more details.
The largest issue is in believing that one’s group is respected. Approximately 62% of respondents who identify as Muslim report that students of their religious identity “are [not] respected at this university.” In comparison, 27% who identify as Jewish, 19% who identify as Christian, and 3% who identify as Secular/non-religious report the same.
Regarding classroom experiences, 40% of student respondents who identify as Muslim believe that they can’t “fulfill the requirements of [their] coursework without unduly repressing [their] own identity, background, or experience.” In comparison, 15% who identify as Secular/non-religious, 11% who identify as Christian, and 9% who identify as Jewish report the same.
Among academics, there is strongest support for a positive climate around believing that one's work is respected by peers, and broad need for improving the climate regarding mentoring and professional development, as well as transparency and equity in the promotion process. Due to the very small number of academic respondents who identify as Muslim (six respondents), we are unable to fully examine these variables by religious identity.
Among staff, those who identify as Muslim are substantially less likely than all other groups of staff to report experiencing a campus and workplace climate that is conducive to their highest level of productivity and professional development at the University. See Table 2.3 for more details.
For example, among all staff there is a high level of reporting a negative climate regarding transparency and equity in recognition and promotion: 55% of all staff report that promotion standards are not applied equally. Additionally, staff who identify as Muslim are the least likely to report a positive climate regarding these issues:
• Approximately 75% of respondents who identify as Muslim report that promotion standards are not applied equally. In comparison, 55% who identify as Jewish, 54% who identify as Christian, and 51% who identify as Secular/non-religious report the same.
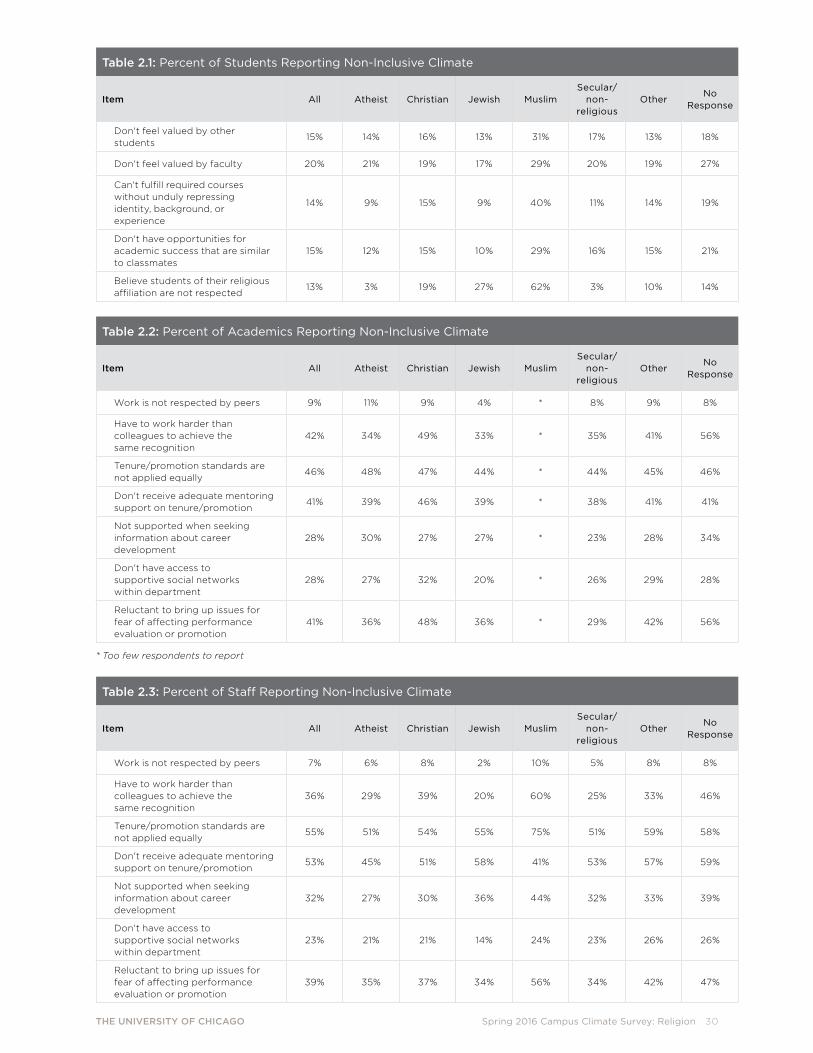
RESULTSThe following tables (tables 2.1 through 2.3) show the percentage of respondents who reported a non-inclusive climate regarding each statement. For example, reporting "disagree" or "strongly disagree" to "I feel valued by academics" indicates a non-inclusive climate. Similarly, reporting "agree" or "strongly agree" to "I have to work harder than I believe my colleagues/co-workers do to achieve the same recognition" indicates a non-inclusive climate.
THE UNIVERSITY OF CHICAGO Spring 2016 Campus Climate Survey: Religion 30
Table 2.1: Percent of Students Reporting Non-Inclusive Climate
Item All Atheist Christian Jewish MuslimSecular/
non- religious
OtherNo
Response
Don't feel valued by other students
15% 14% 16% 13% 31% 17% 13% 18%
Don't feel valued by faculty 20% 21% 19% 17% 29% 20% 19% 27%
Can't fulfill required courses without unduly repressing identity, background, or experience
14% 9% 15% 9% 40% 11% 14% 19%
Don't have opportunities for academic success that are similar to classmates
15% 12% 15% 10% 29% 16% 15% 21%
Believe students of their religious affiliation are not respected
13% 3% 19% 27% 62% 3% 10% 14%
Table 2.2: Percent of Academics Reporting Non-Inclusive Climate
Item All Atheist Christian Jewish MuslimSecular/
non- religious
OtherNo
Response
Work is not respected by peers 9% 11% 9% 4% * 8% 9% 8%
Have to work harder than colleagues to achieve the same recognition
42% 34% 49% 33% * 35% 41% 56%
Tenure/promotion standards are not applied equally
46% 48% 47% 44% * 44% 45% 46%
Don't receive adequate mentoring support on tenure/promotion
41% 39% 46% 39% * 38% 41% 41%
Not supported when seeking information about career development
28% 30% 27% 27% * 23% 28% 34%
Don't have access to supportive social networks within department
28% 27% 32% 20% * 26% 29% 28%
Reluctant to bring up issues for fear of affecting performance evaluation or promotion
41% 36% 48% 36% * 29% 42% 56%
* Too few respondents to report
Table 2.3: Percent of Staff Reporting Non-Inclusive Climate
Item All Atheist Christian Jewish MuslimSecular/
non- religious
OtherNo
Response
Work is not respected by peers 7% 6% 8% 2% 10% 5% 8% 8%
Have to work harder than colleagues to achieve the same recognition
36% 29% 39% 20% 60% 25% 33% 46%
Tenure/promotion standards are not applied equally
55% 51% 54% 55% 75% 51% 59% 58%
Don't receive adequate mentoring support on tenure/promotion
53% 45% 51% 58% 41% 53% 57% 59%
Not supported when seeking information about career development
32% 27% 30% 36% 44% 32% 33% 39%
Don't have access to supportive social networks within department
23% 21% 21% 14% 24% 23% 26% 26%
Reluctant to bring up issues for fear of affecting performance evaluation or promotion
39% 35% 37% 34% 56% 34% 42% 47%
THE UNIVERSITY OF CHICAGO Spring 2016 Campus Climate Survey: Religion 31
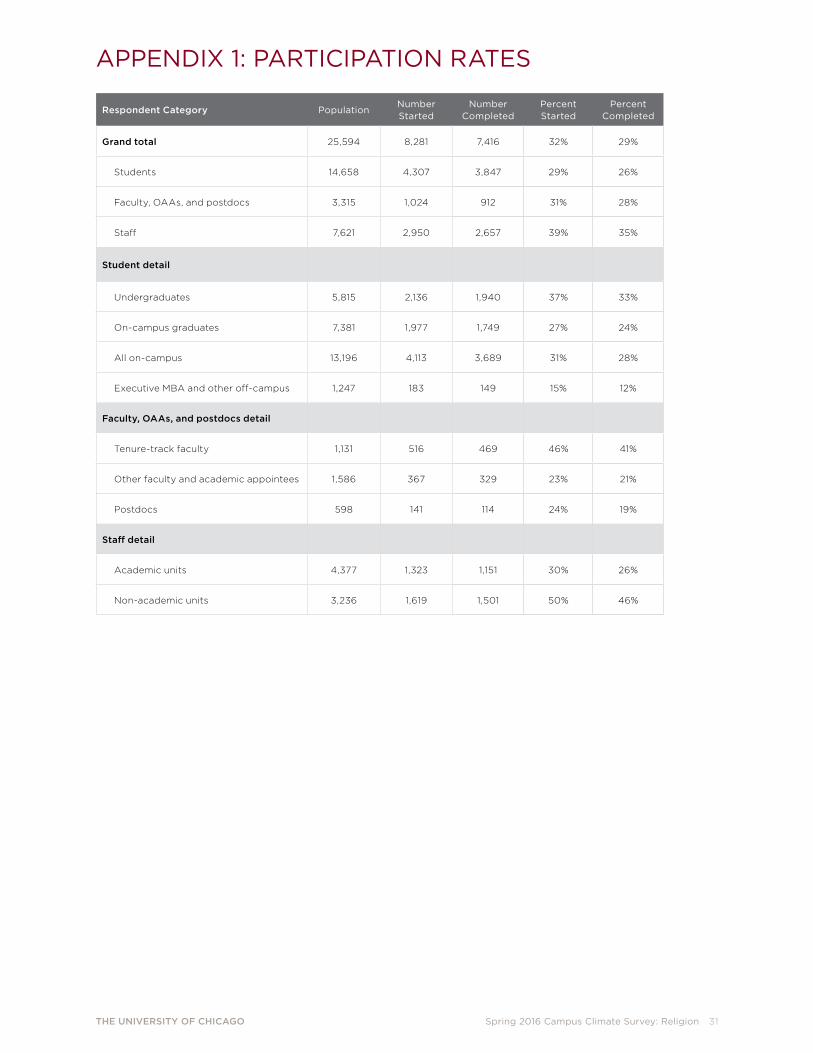
APPENDIX 1: PARTICIPATION RATES
Respondent Category PopulationNumber Started
Number Completed
Percent Started
Percent Completed
Grand total 25,594 8,281 7,416 32% 29%
Students 14,658 4,307 3,847 29% 26%
Faculty, OAAs, and postdocs 3,315 1,024 912 31% 28%
Staff 7,621 2,950 2,657 39% 35%
Student detail
Undergraduates 5,815 2,136 1,940 37% 33%
On-campus graduates 7,381 1,977 1,749 27% 24%
All on-campus 13,196 4,113 3,689 31% 28%
Executive MBA and other off-campus 1,247 183 149 15% 12%
Faculty, OAAs, and postdocs detail
Tenure-track faculty 1,131 516 469 46% 41%
Other faculty and academic appointees 1,586 367 329 23% 21%
Postdocs 598 141 114 24% 19%
Staff detail
Academic units 4,377 1,323 1,151 30% 26%
Non-academic units 3,236 1,619 1,501 50% 46%
THE UNIVERSITY OF CHICAGO Spring 2016 Campus Climate Survey: Religion 32
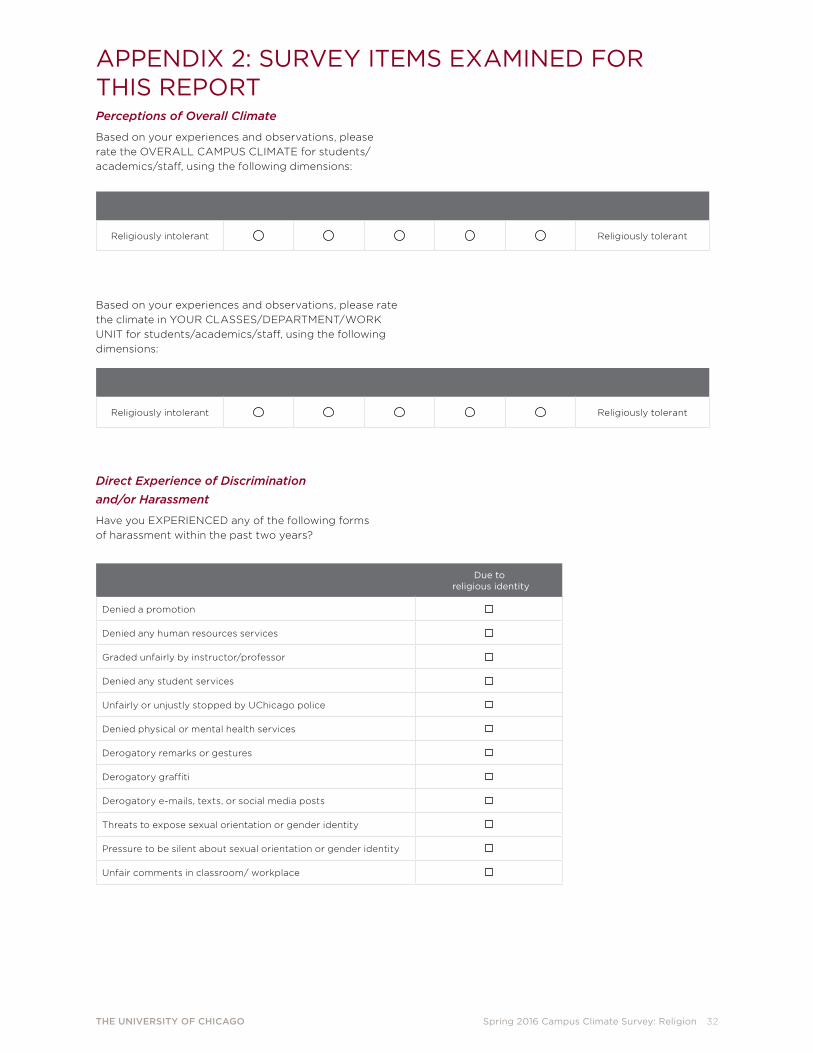
APPENDIX 2: SURVEY ITEMS EXAMINED FOR THIS REPORTPerceptions of Overall Climate
Based on your experiences and observations, please rate the OVERALL CAMPUS CLIMATE for students/academics/staff, using the following dimensions:
Religiously intolerant Religiously tolerant
Based on your experiences and observations, please rate the climate in YOUR CLASSES/DEPARTMENT/WORK UNIT for students/academics/staff, using the following dimensions:
Religiously intolerant Religiously tolerant
Direct Experience of Discrimination and/or Harassment
Have you EXPERIENCED any of the following forms of harassment within the past two years?
Due to religious identity
Denied a promotion
Denied any human resources services
Graded unfairly by instructor/professor
Denied any student services
Unfairly or unjustly stopped by UChicago police
Denied physical or mental health services
Derogatory remarks or gestures
Derogatory graffiti
Derogatory e-mails, texts, or social media posts
Threats to expose sexual orientation or gender identity
Pressure to be silent about sexual orientation or gender identity
Unfair comments in classroom/ workplace
THE UNIVERSITY OF CHICAGO Spring 2016 Campus Climate Survey: Religion 33
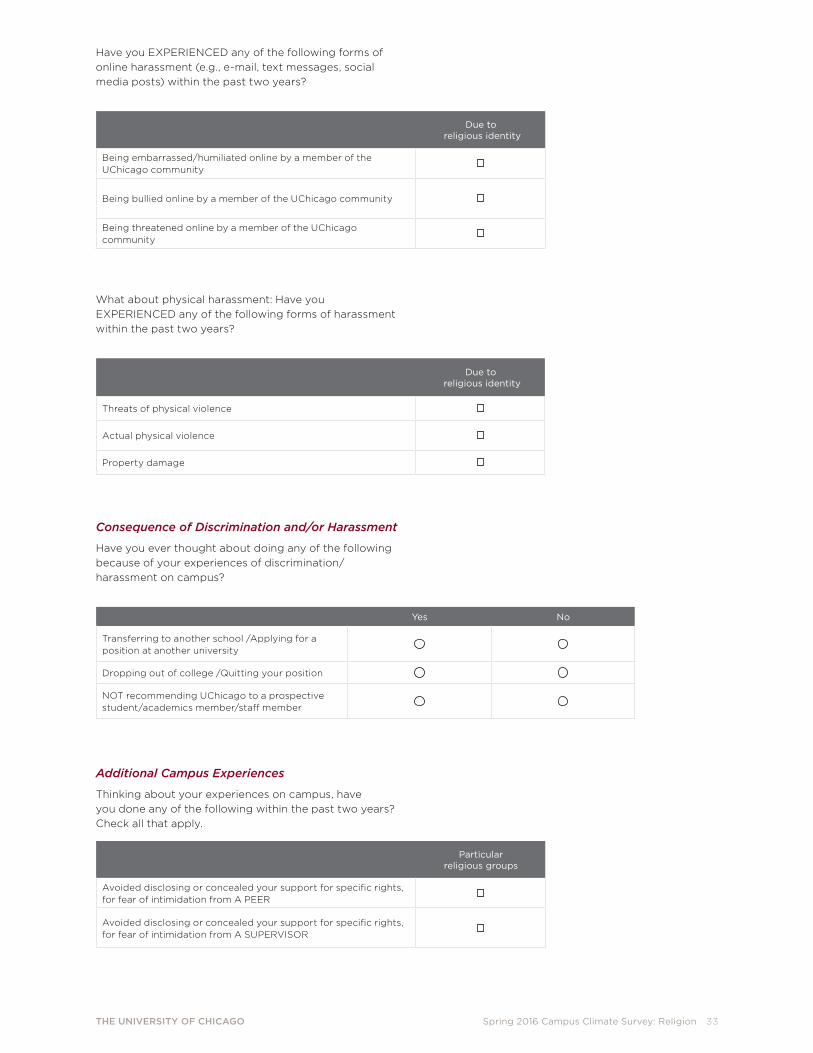
Have you EXPERIENCED any of the following forms of online harassment (e.g., e-mail, text messages, social media posts) within the past two years?
Due to religious identity
Being embarrassed/humiliated online by a member of the UChicago community
Being bullied online by a member of the UChicago community
Being threatened online by a member of the UChicago community
What about physical harassment: Have you EXPERIENCED any of the following forms of harassment within the past two years?
Due to religious identity
Threats of physical violence
Actual physical violence
Property damage
Consequence of Discrimination and/or Harassment
Have you ever thought about doing any of the following because of your experiences of discrimination/harassment on campus?
Yes No
Transferring to another school /Applying for a position at another university
Dropping out of college /Quitting your position
NOT recommending UChicago to a prospective student/academics member/staff member
Additional Campus Experiences
Thinking about your experiences on campus, have you done any of the following within the past two years? Check all that apply.
Particular religious groups
Avoided disclosing or concealed your support for specific rights, for fear of intimidation from A PEER
Avoided disclosing or concealed your support for specific rights, for fear of intimidation from A SUPERVISOR
THE UNIVERSITY OF CHICAGO Spring 2016 Campus Climate Survey: Religion 34
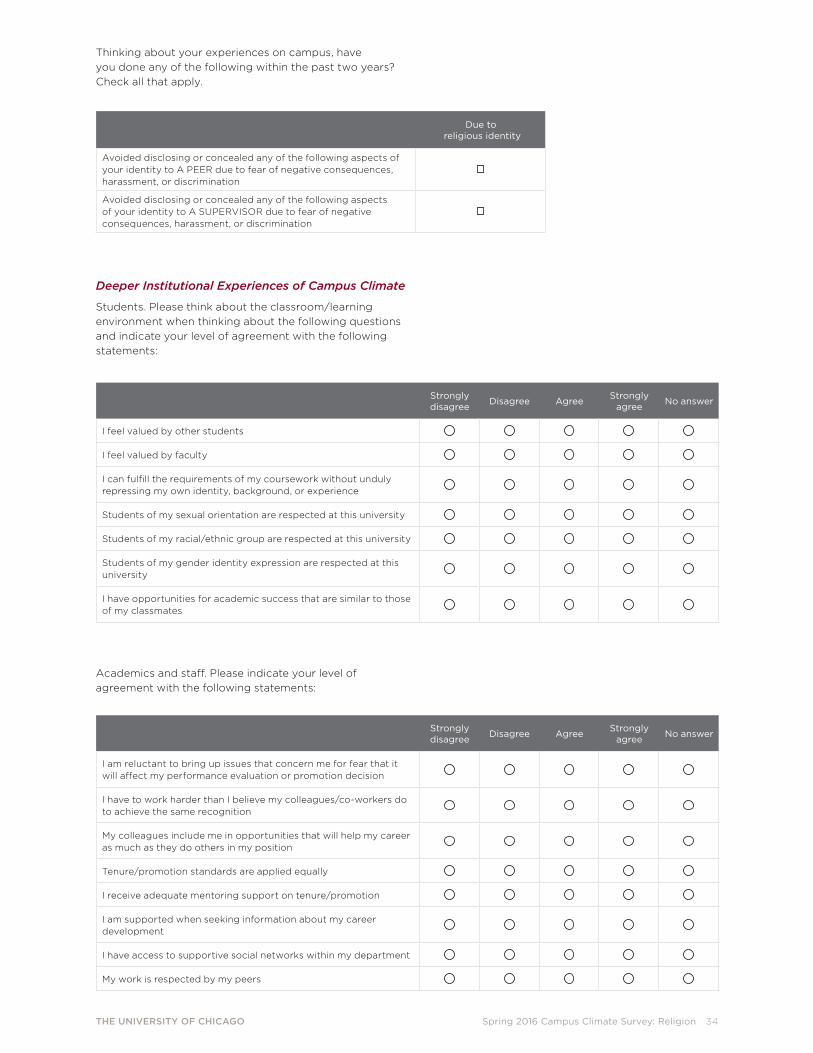
Thinking about your experiences on campus, have you done any of the following within the past two years? Check all that apply.
Due to religious identity
Avoided disclosing or concealed any of the following aspects of your identity to A PEER due to fear of negative consequences, harassment, or discrimination
Avoided disclosing or concealed any of the following aspects of your identity to A SUPERVISOR due to fear of negative consequences, harassment, or discrimination
Deeper Institutional Experiences of Campus Climate
Students. Please think about the classroom/learning environment when thinking about the following questions and indicate your level of agreement with the following statements:
Strongly disagree Disagree Agree Strongly
agree No answer
I feel valued by other students
I feel valued by faculty
I can fulfill the requirements of my coursework without unduly repressing my own identity, background, or experience
Students of my sexual orientation are respected at this university
Students of my racial/ethnic group are respected at this university
Students of my gender identity expression are respected at this university
I have opportunities for academic success that are similar to those of my classmates
Strongly disagree Disagree Agree Strongly
agree No answer
I am reluctant to bring up issues that concern me for fear that it will affect my performance evaluation or promotion decision
I have to work harder than I believe my colleagues/co-workers do to achieve the same recognition
My colleagues include me in opportunities that will help my career as much as they do others in my position
Tenure/promotion standards are applied equally
I receive adequate mentoring support on tenure/promotion
I am supported when seeking information about my career development
I have access to supportive social networks within my department
My work is respected by my peers
Academics and staff. Please indicate your level of agreement with the following statements:

THE UNIVERSITY OF CHICAGO Spring 2016 Campus Climate Survey: Religion 35
Demographics
What is your religious identity? Check all that apply:
Agnostic
Atheist
Baha'i
Buddhist
Christian
Confucianism
Daoism
Hindu
Humanist
Jewish
Muslim
Native American Religion
Nonreligious/secular
Sikh
Scientology
Unitarian Universalist
Wiccan/Pagan/Druid
Spiritual but not associated with a major religion
Self-identify (please specify): ____________________
Prefer not to answer

THE UNIVERSITY OF CHICAGO Spring 2016 Campus Climate Survey: Religion 36
Agnes Lugo-Ortiz
Associate Professor, Department of Romance Languages and Literatures
Ronald A. Thisted
Vice Provost for Academic Affairs and Professor, Departments of Public Health Sciences and Statistics, and the College
Adrienne Thomas
Local Business Center Manager, Social Sciences Division, and Director of Grant & Contract Administration
Ala Tineh
Third-Year Economics Major, The College
William Towns
Assistant Vice President, Neighborhood Initiatives
Renita Ward
Second-Year Student, Master of Arts in Divinity Program
WORKING GROUP ON SURVEY DEVELOPMENT
Micere Keels (Chair)
Associate Professor, Department of Comparative Human Development and the College
William Greenland
Director of Institutional Analysis
Ronald A. Thisted
Vice Provost for Academic Affairs and Professor, Departments of Public Health Sciences and Statistics, and the College
Matthew Christian
Associate Provost and Chief of Staff
PR
O-3
013
-17
APPENDIX 3: STEERING COMMITTEE AND WORKING GROUP MEMBERSHIP
CLIMATE SURVEY STEERING COMMITTEE
Cathy Cohen (Chair)
David and Mary Winton Green Professor, Department of Political Science and the College
Jonathan Acevedo
Third-Year Computer Science Major, The College
Aidan Ali-Sullivan
Second-Year Student, Chicago Booth Master of Business Administration/Harris Public Policy Master of Public Policy Program
Elise Covic
Deputy Dean, The College
Elizabeth Davenport
Dean, Rockefeller Chapel
Ruby Garrett
Student, Law School
Melissa Gilliam
Vice Provost for Academic Leadership, Advancement, and Diversity; and Ellen H. Block Professor in Health Justice, Departments of Obstetrics and Gynecology and Pediatrics
James Kiselik
Third-Year Mathematics Major, The College, and Master of Arts Program in the Humanities
Marlon Lynch
Associate Vice President for Safety, Security, and Civic Affairs
Thomas Miles
Dean, Law School, and Clifton R. Musser Professor of Law