clinical pediatric nutrition - nurse.com...
TRANSCRIPT
Clinical Pediatric Nutrition
6400 Arlington Blvd, Falls Church, VA 220421-888-781-5388 www.nutritiondimension.com
Clinical Pediatric Nutrition5th edition • Revised January 2009
by Liesje Nieman Carney, rd, cnsd, ldn
7950 Jones Branch Drive 7th Floor, McLean, VA 221071-800-866-0919 • www.continuingeducation.com

Copyright © 1996-2009 by OnCourse Learning CorporationNo portion of this course may be duplicated without the written consent of the copyright holders.
Edited by: Dales Ames Kline, MS, RD, CNSDCopyediting/proofreading: Rich Kline, Gwen Hulbert
Design/production by: Knotwork Graphic Design & Typesetting
About the Author: Liesje Nieman Carney, rd, cnsd, ldn, received her Bachelor's Degree in Applied Nutrition from The Pennsylvania State University. Liesje Nieman Carney is currently employed as a Clinical Dietitian IV and Publica-tion Specialist at The Children's Hospital of Philadelphia. Ms. Carney has 10 years of clinical experience, specializing in NICU, pediatric nutrition support and inborn errors of metabolism. She has extensive experience with publishing in roles ranging from editor to author to reviewer. Recent major publications include: co-editor for ASPEN Enteral Nutrition Handbook; co-author of Standards of Performance and Professional Practice in Pediatrics (JADA, 8/09); and co-editor for the Pediatric Manual of Clinical Dietetics, 2nd ed. (2007). She is frequently an invited presenter at regional and national conferences. Ms. Carney is an active Board member for the Philadelphia chapter of ASPEN. She is also active in the American Dietetic Association's Pediatric Nutrition Practice Group (PNPG), currently in the role of Communications Team Co-Chair.
Clinical PediatricNutrition
5th Edition • Revised January 2009
by Liesje Nieman Carney, rd, cnsd, ldn
EXPIRATION DATE: Students of all professions must submit this course for credit no later than October 31, 2015. Credit will not be awarded for this course after that date.
Course Code: RD71
This course approved for RD......................... 12.CPEU.DTR....................... 12.CPEUCDM...........12.Clock.Hours
7950.Jones.Branch.Drive.7th.Floor,.McLean,.VA.221071-800-866-0919.(US.&.Canada)..•..1-703-854-2531.(overseas).FAX:1-703-854-2531.•.e-mail:[email protected]

Clinical Pediatric Nutrition ii
How to Earn Continuing Education Credit
1. Read or watch the course material. Don’t forget to review the course objectives and take note of course tools available to you. The objectives provide specific learning goals and an overview of the course. Read the material in the order presented. If you need help with the material, please e-mail [email protected] with your specific question. We will forward your inquiry to the author, so allow adequate time for a reply.
2. CE credit will not be awarded for this course after October 31, 2015.
3. If you have an account on Nurse.com, TodayinPT.com, or TodayinOT.com, or NutritionDimension.com, please use that account username and password to sign in on ContinuingEduation.com. If you don’t already have one, please sign up for a user account. Click “sign up” or “login” in the upper right hand corner of any page on ContinuingEducation.com. If you have a CE Direct login ID and password (generally provided by your employer), please log in as you normally would at lms.nurse.com and search for this topic title.
4. Go to the “my courses” section of “my account.” Click on the title of the course you want to com-plete and then on “start course.”
5. Click “start test” to begin the exam. To earn contact hours, you must achieve a score of 75% on your multiple-choice exam for most courses. For webinar courses, you will need to achieve a score of 100%. You may retake the test as many times as necessary to pass. Clues are not provided on the exam. Certificates will be date/time stamped with the time and date of the day the user passes the test (Eastern Time, U.S.).
6. After successfully completing your exam click, “complete required survey.” In order to complete the test process and receive your certificate of completion, you must take a few moments to answer a brief survey about the course material.
7. After completing the survey, you will be taken to your transcript. Under Courses Completed, you can view, print, or e-mail your certificate.
8. Three months after you complete a course, you will receive an e-mail asking you to complete a follow-up survey. This is vital to our educational requirements so we can report our quality outcomes and effectiveness.
We report course completions to National Commission for Health Education Credentialing (NCHEC) quarterly and The Association of Nutrition & Foodservice (ANFP, formerly DMA) monthly. Other professions should follow their certifying organization’s reporting instructions. We keep a record of course completions for 7 years.
A Word About Copyrights: We encourage health professionals to use material from this course in their practice. Please follow these guidelines: (1) Credit the author, OnCourse Learning Corporation and any referenced source. (2) Course material may not be sold, published, or made part of any program for which a fee is charged, without written
permission from OnCourse Learning Corporation. (3) Inform OnCourse Learning Corporation by letter if you wish to make significant use of material from this course
(e.g. if you wish to duplicate Appendix pages for a training session or patient handout).

Clinical Pediatric Nutrition iii
Contents 1
3
15
29
37
49
61
73
85
99
111
131
143
153
161
169
179
183
Introduction
Chapter One: Nutrition Assessment: Anthropometry, Part IMeasurement of growth: weight, stature, armspan, tibial length and OFC
Chapter Two: Nutrition Assessment: Anthropometry, Part IIStandard growth grids • Specialized growth charts • Plotting the data • Weight • Length/stature • Alternative measurements • Parental height influence • Nutritional status indicators • Interpretation of growth data • Mea-surements of body composition • Interpretation of body composition
Chapter Three: Nutrition Assessment: Dietary & Feeding EvaluationDietary evaluation • Feeding evaluation
Chapter Four: Nutrition Assessment: Clinical, Physical & Biochemical FindingsDiagnosis and medical history • Biochemical indices • Tests of protein status, malabsorption, nutrient specificity, iron status and nutritional anemias, immune function • Drug-nutrient interactions
Chapter Five: Estimation of Nutritional NeedsEnergy • Calculating energy needs using the RDA • Basal energy requirements • Adjustment of basal energy needs • Estimating energy needs using clinical monitoring • Protein • Fat • Carbohydrate • Vitamins and min-erals • Other substances in food • Fluid
Chapter Six: Nutrition Care Plans, Formulas, Food & Dietary CounselingBreast milk • Human milk fortifiers • Commercial infant formulas • Introducing solids • Child and family nutri-tion counseling
Chapter Seven: Nutritional Problems of the NeonatePrematurity • Inborn errors of metabolism • Cleft lip and palate
Chapter Eight: Nutritional Concerns in Infants & ChildrenMalnutrition • Failure to thrive • Obesity
Chapter Nine: Pulmonary Disorders in Infants & ChildrenBronchopulmonary dysplasia • Cystic fibrosis
Chapter Ten: Chronic Diseases in Infants & ChildrenRenal disease • Gastrointestinal diseases • HIV/AIDS • Autistic spectrum disorders • Oncology
Chapter Eleven: Developmental DisabilitiesDown's syndrome • Prader-Willi syndrome • Fetal alcohol syndrome • Spinal muscular atrophy • Duchenne muscular dystrophy • Mitochondrial disorders
Chapter Twelve: Endocrine DisordersDiabetes mellitus • Congenital hyperinsulinism
Chapter Thirteen: Allergies and Eosinophilic Esophagitis/Eosinophilic GastritisSymptoms • Treatment
Chapter Fourteen: Enteral Nutrition (Tube Feeding, TF)Indications • Access • Initiation and advancement of tube feedings • Monitoring tolerance
Chapter Fifteen: Parenteral NutritionIndications • Access for administering PN • Macronutrients • Electrolytes • Vitamins, minerals and trace ele-ments • PN additives • Complications • Monitoring • Emerging issues
Chapter Sixteen: PICU-specific Nutritional IssuesInfantile botulism • Liver transplant • Congenital heart disease
Appendices • Exam

Clinical Pediatric Nutrition
Learning Objectives
iv
Upon successful completion of this course the student will be able to:
1. Be aware of the proper tools and methods for evaluating growth in children with special health care needs.
2. Demonstrate how to properly measure mid-arm circumference, triceps and subscapular fatfolds in children.
3. Compare and contrast different calorie recommendations for children with special health care needs.
4. Calculate catch-up growth energy needs for a child with failure to thrive.
5. Be aware of the various charts available for CSHCN.
6. Discuss the difference between wasting and stunting of malnourished children.
7. Explain how to increase formula concentration for an infant who is not gaining weight.
8. Identify the reason for altered nutrient needs of premature infants.
9. Describe the differences in commercial formulas for term infants and those for premature infants.
10. Describe the effects of malabsorption on the nutrient needs of a child with cystic fibrosis.
11. Identify three intervention strategies for children with failure to thrive.
12. Evaluate the growth anomalies seen in children with fetal alcohol syndrome.
13. Describe appropriate intervention strategies for a child with Prader-Willi syndrome.
14. List the major nutritional concerns for a child with spina bifida.
15. Analyze the diet and the biochemical indicators of a child with renal disease and make appropriate recommendations.
1Clinical Pediatric Nutrition
Introduction
For the dietitian or other health care professional working with children withspecial health care needs, it is important to be aware of the factors that impact feeding,growth and nutritional status. Nutrition interventions must be individualized andinclude realistic recommendations appropriate to the child's developmental readiness.Caring for infants and children is best approached through a multidisciplinary model.The infant/child and family are essential members of the team and the dietitian facili-tates nutrition intervention strategies with input from other professionals.
The 2004 Position Paper of the American Dietetic Association (ADA) on nutritionservices for children with special health care needs (CSHCN) states that:
It is the position of The American Dietetic Association that nutrition servicesare essential components of comprehensive care for infants, children andadults with developmental disabilities and special health needs.
Pediatric patients with special healthcare needs come in many shapes, sizes andages — from premature infants to full-term infants affected by congenital defects, fromfeeding disorders to eating disorders, from food allergies and intolerances to inbornerrors of metabolism, and many more. This course is designed to increase one’s knowl-edge and skill in providing nutrition services to infants and children with special healthcare needs. The first part provides an overview of the essential elements and tools tocoordinate the nutrition assessment with emphasis on identifying problems common tothe pediatric population.
2Clinical Pediatric Nutrition
Nutrition intervention should focus on supporting optimal growth and develop-ment. A review of breast feeding, infant and pediatric enteral formulas is followed by adiscussion on the introduction of complementary foods. An in-depth review of thevarious methods of enteral feeding is presented, followed by a description of pediatricparenteral nutrition. Specific conditions such as failure to thrive and obesity are ad-dressed, including the newest recommendations for assessing overweight and obesestatus in children as well as interventions. Issues unique to the premature infant aredescribed, highlighting nutritional care for the full range of premature infants (fromextremely premature to near-term premature). This course concludes with a discussionof various disease states encountered in pediatrics and the nutrition implications of eachdisease process.
REFERENCES
American Dietetic Association. Position of the American Dietetic Association: Nutrition services forchildren with special health care needs. JADA 104:97-107, 2004.

3Clinical Pediatric Nutrition
Chapter One:Nutrition Assessment:Anthropometry, Part I
Physical growth — defined as an increase in size of the whole body or any of itsparts — constitutes the most fundamental and simple, yet indispensable, indicator of achild’s nutritional status. Genetic heritage is a primary determinant of an individual’sgrowth potential, but nutrition will determine whether the child reaches that potential.Growth thus establishes itself as an important criterion to assess the nutritional status ofan individual child or a population.
Physical growth is characterized by weight, length or height (stature), head circum-ference and body composition. Anthropometry evaluates the physical growth of infantsand children by measuring the size and proportions of the human body. Measurementsare compared to an appropriate, healthy reference population to determine the extent towhich children are growing normally, or are delayed for their age. Deviation fromnorms can represent a nutrient deficiency or excess. In evaluating growth, it is essentialto review the growth trend, rather than just one point in time, if possible.
Weight, height or length, and head circumference are the measurements used toassess physical growth and development. Anthropometric measurements of arm cir-cumference and triceps and subscapular fatfolds set the parameters used in estimatingbody fat and muscle composition. This chapter explains procedures used to obtainaccurate and consistent anthropometric measurements.
For any measurement to be considered a valid gauge of growth, it must be accu-rate. The use of appropriate equipment and correct technique is the primary step inensuring accurate measurements. A 1975 Center for Disease Control study of publichealth clinics revealed that a significant proportion of anthropometric measurementsincorporate serious errors due to faulty equipment, poor technique, incorrect readingsand imprecise recordings.

4Clinical Pediatric Nutrition
It is extremely important that measurement techniques be standardized and per-formed in the same manner in which the reference data was obtained. For instance, theweight information on standard growth charts (i.e. CDC/NCHS) for children from birthto three years includes infants and children weighed without clothes or a diaper. Tocompare a child’s weight to the standard growth charts, the child must be weighedwithout clothes or a diaper.
Information regarding equipment and proper measuring techniques is presented inthe following sections. These protocols can be adapted for use in various settings (e.g. ahospital, clinic or pediatrician's office) to ensure that all persons are measuring childrenin the same manner every time. Personnel involved in the weighing and measuring ofchildren should receive training and ongoing evaluation of technique performance.
WEIGHT
Weight is a reliable, reproducible tool used to evaluate a child’s nutritional status.This measurement alone provides much information regarding the presence of acute orchronic malnutrition.
• Equipment. To properly furnish the clinic or hospital location, many types ofscales are available from the suppliers listed below.
Detecto Seritex, Inc.Division of Cardinal Scale One Madison Streetwww.cdetectoscale.com East Rutherford, NJ 07073Phone: (800) 641-2008 Phone: (973) 472-4200
Fax: (973) 472-0222www.seritex.com
HealthometerSunbeam Products, Inc. SecaConsumer Affairs (800) 542-7322P.O. Box 948389 www.secacorp.comMaitland, FL 32794-3289Phone: (800) 672-5625http://health-o-meter.balances.com QuickMedical
Toll-Free: (888) 345-4858Phone: (425) 831-5963
Perspective Enterprises Fax: (425) 831-60327829 S. Sprinkle Road www.quickmedical.comPortage, MI 49002Phone: (269) 327-0869Toll-Free: (800) 323-7452Fax: (269) 327-0837www.perspectiveent.com

5Clinical Pediatric Nutrition
A variety of scales can be purchased for different situations and needs. Infants andtoddlers — weighed lying or sitting down — should be weighed on an appropriateinfant digital or balance scale. Portable models or suspended infant weighing packs areideal for use in a home care setting or when table and counter space is limited.
For older children who can stand independently, use a platform beam scale that isaccurate to within one-quarter pound. Many manufacturers produce sturdy, accuratebalance beam and digital scales. A bathroom, spring-type scale is not appropriatebecause accuracy is questionable.
For older children who cannot stand independently, use a wheelchair or platformelectronic scale. A larger child can sit either directly on the scale or in a wheelchair. If
Weighing Infants
• Use an appropriate infant scale. Calibrate the scale to zero each time.• Infants up to 18 months should be measured nude or wearing only a clean,
dry diaper.• Place child in center of scale. Read to nearest 1/3 oz (10 gm).• Repeat measurement until at least two measurements agree within 2/3 oz
(20 gm).• If child is moving so much that scale does not register a single number
consistently, note weight as an "estimate."• Note which scale was used. Each scale should have a unique identifier, such
as a number or name.) Use the same scale each time, if possible.
Source: Maternal and Child Health Bureau, 2006; Leonberg, 2008.

6Clinical Pediatric Nutrition
these are not available, a hospital bed scale can be an acceptable substitute. At the veryleast, estimate weight using a platform beam scale while the child is held in the arms ofan adult.
All scales should be checked frequently and recalibrated periodically with a set ofstandard weights by a local dealer or an inspector of weights and measures.
STATURE
The term "stature" describes both length and height, and is a simple and reliablemeasurement that provides significant information about an infant or child's growth,and thus his/her nutritional status. Length represents recumbent (a.k.a. reclining)stature; height measures standing (i.e. upright) stature.
One should measure children without physical abnormalities using the standardtechniques described on the next pages. Children with physical abnormalities such asscoliosis or contractures, or those who cannot stand independently require creativetechniques to estimate linear growth.
Weighing Older Children
Weighing children who can standindependently:
• Use a beam scale with nondetachableweights. Calibrate to zero.
• Weigh child without shoes, wearingundergarments or light clothing only.
• Place child in the center of platformwith heels together. Record weight tothe nearest 0.01 kg, 10 gm or 1/2 oz.
• Repeat measurement until at least twomeasurements agree within 0.1 kg,100 gm or 1/4 lb.
• Note on chart if any circumstancesdeviate from protocol (e.g. heavyclothing, splints, casts, etc.)
• Note which scale was used (scalesshould be named or numbered). Usesame scale each time if possible.
Weighing children who cannot standindependently:
• Use a wheelchair scale. Calibrate thescale to zero prior to rolling wheel-chair onto the scale.
• Weigh children without shoes, aids orsplints, with minimal clothing.
– Note if a child wears a cast oranything that will affect accuracy.
• Weigh child sitting on the scale or inwheelchair.
– If weighed while seated in a wheelchair, subtract chair weight fromtotal weight.
• If a platform or wheelchair scale isunavailable, use a hospital bed scaleor have an adult hold the child onplatform scale. Subtract adult weightfrom total.
• Repeat measurement until at leasttwo recordings agree within 0.1 kg,100 gm or 1/4 lb.
• Note which scale was used, as well asmethod employed. Use the samescale and method each time.

7Clinical Pediatric Nutrition
Studies have shown there are correlations between the measurement of specificbody parts and linear growth. Belt-Niedbala, et al., (1986) determined the correlationbetween arm length measurements and linear growth for children with spina bifida.
Measurements of crown-rump are used to estimate the height of persons withlower extremity atrophy or severe lower extremity contractures (Frisancho, 1990).Chumlea, et al., (1994) and Johnson and Ferrera (1991) predicted stature from kneeheight. Upper arm, lower leg (Splender, et al., 1989) and forearm lengths (Miller, 1992)have also shown a relationship to linear growth in children.
Whichever method is used to measure stature, that same procedure should beutilized consistently to establish accurate linear growth trends. Using the proper mea-surement standard, accurate equipment and reliable techniques, linear growth is asimple and reproducible measure, reflective of many factors one of which is chronicnutritional status.
• Equipment. Lengthboards or stadiometers are the correct tools to accuratelymeasure linear growth. Measuring children’s stature with a paper or plastic tape on atable, or with the movable measuring rods on platform scales, does not yield accurateresults. The lengthboard, an instrument with a fixed perpendicular headboard and asliding footboard, is used for measuring recumbent length. Standing height should bemeasured with a stadiometer, which is a measuring tape attached to a wall with amovable headboard.
When building or attaching a stadiometer to a wall or vertical surface, be cognizantof the flooring surface. Attach the board perpendicular to a hard surface, such as woodor linoleum, to avoid a change in measurement that may occur as the body sinks intothe nap of a rug. If a stadiometer is not available, use a nonstretchable tape measureattached to a vertical flat surface.
Lengthboards or stadiometers can be obtained from the following sources:
Perspective Enterprises Ellard Instrumentation, Ltd.7829 Sprinkle Road 14253 169th Dr. SE Suite 685Portage, MI 49002 Monroe, WA 98272Phone: (616) 327-0869 Phone: (360) 805-5406
(800) 323-7452 (800) 355-2731Fax: (616) 327-0837 Fax: (360) 805-2877www.perspectiveent.com www.ellardinstrumentation.com
Seritex, Inc. QuickMedicalOne Madison Street P.O. Box 1052East Rutherford, NJ 07073 Snoqualmie, WA 98065Phone: (973) 472-4200 Phone: (888) 345-4858Fax: (973) 472-0222 www.quickmedical.comwww.seritex.com

8Clinical Pediatric Nutrition
• Techniques. Holding and measuring an infant or toddler who is kicking orsquirming can test the patience of anyone. Obviously, involving another person (e.g.caregiver or parent) — preferably one who has a lot of practice in diapering, bathing etc.— is indicated. Since accuracy is paramount, great care should be taken, and repeatmeasurements are vital. In order to ensure validity at least two measurements shouldagree within 1 cm or 1/4 inch for infants, children and adolescents. Techniques areshown below.
Measuring Recumbent Length
Measuring length using a recumbent lengthboard:• Measure child without shoes or socks.• Two or more persons are needed.• Person #1: – Stand at head of board, hold the child’s head with crown flat
against headboard. (Child should be looking upward.)– Make sure the child’s trunk and pelvis align with measuring tape.
• Person #2: – Press lightly on the child’s thighs and legs with forearm.– Hold ankles together with one hand. (Toes pointing upward.)– Press footboard against the soles of the child's feet with the other hand.
• Read the measurement to the nearest 0.1 cm.– Repeat measurement until two values agree within 1 cm or 1/4 in.
• If a child is uncooperative, take the best measurement possible, notecircumstances and record value as an estimate.
Source: Maternal and Child Health Bureau, 2006; Leonberg, 2008.
Measuring crown-rump using a lengthboard:• Two persons are needed.• Lay child on lengthboard.• Person #1 holds child’s crown against headboard.• Make sure shoulders, hips lay flat against board.• Legs bend so that thighs are at right angles to the board.• Person #2 presses footboard firmly against hips.• Repeat measurement until at least two values agree within 0.2 cm.

9Clinical Pediatric Nutrition
STANDING MEASUREMENT
When a child is old enough and well enough to stand independently, a stadiometercan be used. Young children from 24 to 36 months may have either length or staturemeasured, so long as the measurement is recorded on the appropriate growth chart forcomparison to reference standards. For younger children, a helper is essential.
Techniques for using a stadiometer for standing measurements are shown below.
Measuring Height with a Stadiometer
To measure standing height using astadiometer:
• Measure child without shoes or socks.
• Have child stand facing away fromstadiometer, with feet flat, heels together.
• Straighten knees gently, so heels, buttocks,shoulder blades, back of head touch verticalplane. (Helper supports child’s body.)
– If a straight stance is not possible, havechild stand away from wall, with onlybuttocks touching.
– Child’s chin should be horizontal, eyeslooking forward.
• Ask the child to take and hold a deep breath.
• Lower horizontal headboard to contact child’scrown. Read to nearest 0.1 cm. Reposition thechild, repeat procedure until two measure-ments agree within 0.2 cm. Record average of
values.

10Clinical Pediatric Nutrition
MEASURING ARM SPAN
Arm span measures the distance between the middle finger of one hand to themiddle finger of the other with arms fully extended at right angles to the body. Ananthropometer, a specialized tool to measure arm span, is made of a steel rod with afixed end on one side and a detachable, movable arm on the other. Techniques are listedin the diagram below.
Measuring Arm Span
Measuring arm span:• Two persons are needed, with one at each end of the anthropometer.• Have child sit or stand with arms fully extended to sides.• One person holds fixed end at tip of one middle finger.• Position anthropometer behind child. Slide sleeve until other movable
end reaches middle finger of the other hand.• Ask child to stretch arms out as far as possible.• Repeat until two measurements agree within 0.2 cm.• Record actual number. Calculate estimated height from arm span, and
plot on growth chart. (Note that arm span measurement was used.)

11Clinical Pediatric Nutrition
MEASURING TIBIAL LENGTH
If one of the child’s legs is longer than the other, the longest leg should be mea-sured. Tibial length is measured from the medial joint line of the knee to the distal edgeof the medial malleolus. Pants should ideally be removed in order to obtain an accuratemeasurement. The child should be sitting with the leg to be measured crossed over theother leg. The medial epicondyle of the femur should be found and a mark made at themedial facet of the femorotibial joint space. Second, the distal tip of the malleolusshould be found and marked.
The arms of the anthropometer are placed on both landmarks, and a measurementis read. The shaft of the anthropometer should be parallel to the leg. This measurementcan also be taken with a flexible measuring tape in which the zero end is placed on themalleolus landmark and the measurement value is read on the proximal tibial border.The measurement is taken to the nearest 0.1 cm. (Derived from: http://www.healthsystem.virginia.edu/Internet/NAGCePP/healthcare/anthropometry/segmenta.cfm)
Measuring Tibial Length
• Measurement from the supermedial edge of the tibia to the inferior edgeof the medial m mallelus using a flexible steel tape.
• Formula for the estimation of stature in children with cerebral palsyusing tibial length:Estimated stature in centimeters = (3.26 x tibial length in cm) + 30.8
Source: Splender, 1989; Stevenson, 1995.

12Clinical Pediatric Nutrition
Measurin HEAD CIRCUMFERENCE
The measurement of head circumference is an important parameter in the assess-ment of a child’s brain growth and nutrition status. Routinely measure the occipital-frontal circumference (OFC) of infants and children up to age 3. Deviations in headgrowth are not primarily caused by nutritional factors, but in cases of severe or pro-longed malnutrition, cell growth is reduced in size and number contributing to a de-ceased rate of head growth.
Abbott Nutrition and Perspective Enterprises produce nonstretchable, flexibletapes for measuring head circumference.
SUMMARY
Measurements of growth and body composition provide the primary assessmenttools in the evaluation of a child’s nutritional status. Tools and measurements must bereliable, reproducible and accurate. The data must be recorded accurately, as well as anyunusual circumstances that occurred while the measurement was obtained. It is recom-mended to establish a protocol so that all personnel are performing the procedures inthe same manner, to ensure that the measurements are accurate and consistent with thereference data.
Measuring Head Circumference
Measuring OFC• The tape should be positioned just above the eyebrows, above the ears andaround the biggest part of the back of the head.• Pull the tape taut to compress the hair and underlying soft tissue.• The measurement should be read to the nearest 0.1 cm or 1/8 in.
Source: Maternal and Child Health Bureau, 2006.

13Clinical Pediatric Nutrition
REFERENCES
Belt-Niedbala B, Ekvall S, Cook C, et al. Linear growth measurement: A comparison of single arm-lengthsand arm-span. Dev Med and Child Neuro 28, 319-324, 1986.
Chumlea W, Guo S and Steinbauch M. Prediction of stature from knee height for black and white adultsand children with application to mobility-impaired or handicapped persons. JADA 94:1385-1391,1994.
Frisancho A. Anthropometric Standards for the Assessment of Growth and Nutritional Status. Ann ArborMI, Univ. Michigan Press, 1990.
Frisancho AR. New norms of upper limb fat and muscle mass areas for assessment of nutritional status.Am J Clin Nutr 34: 2540-2545, 1981.
Johnson R and Ferrara M. Estimating stature from knee height for persons with cerebral palsy: Anevaluation of estimation equations. JADA 91:1283-4, 1991.
Leonberg BL. ADA Pocket Guide to Pediatric Nutrition Assessment. Chicago IL: American Dietetic Associa-tion, 2008.
Maternal and Child Health Bureau. Accurately Weighing and Measuring Infants, Children and Adolescents:Technique. Available at: http://depts.washington.edu/growth. Accessed January 2008.
Miller F and Koreska J. Height measurement of patients with neuromuscular disease and contractures.Dev Med Chil Neurol 34:55-60, 1992.
Splender Q, Cronk C, Charney E, et al. Assessment of linear growth of children with cerebral palsy: use ofalternative measures of height or length. Dev Med Child Neurol 31:206-214, 1989.
Stevenson RD. Use of segmental measures to estimate stature in children with cerebral palsy. Arch PediatrAdolesc Med 149: 658-662, 1995.
http://www.healthsystem.virginia.edu/Internet/NAGCePP/healthcare/anthropometry/segmenta.cfm

14Clinical Pediatric Nutrition
Notes

15Clinical Pediatric Nutrition
Chapter Two:Nutrition Assessment:Anthropometry, Part II
This chapter describes the growth charts and tables used as reference standardsto evaluate an individual’s growth parameters. Comparing a child’s growth pattern toestablished population norms is an important tool in the pediatric nutrition assessment.
STANDARD GROWTH GRIDS
The most common standardized growth charts are those published by the CDCand developed by National Center for Health Statistics (NCHS). The revised versions ofthe growth charts were released May 2000. The new charts are based on data includinga nationally representative reference population of infants from birth to 36 months andchildren and adolescents from 2 to 20 years of age. Significant new features of the chartsinclude the new Body Mass Index (BMI)-for-age charts to be used for all children 2 to 20years in place of the weight-for-stature charts and the 3rd and 97th percentiles added tospecific charts. There are also tools that can be accessed via the Internet to plot BMI:
http://apps.nccd.cdc.gov/dnpabmi/Calculator.aspxhttp://www.kidsnutrition.org/bodycomp/bmiz2.html
• Weight-for-age describes body weight relative to age and is influenced by recentchanges in health or nutritional status.
• Stature/length-for-age reflects linear growth relative to age and defines short-ness or tallness.
• Weight-for-length describes body weight in relation to growth and is not influ-enced by age. It is used as an indicator to classify infants and toddlers as over- orunderweight.

16Clinical Pediatric Nutrition
• BMI-for-age is an index of weight and height combined with age that classifieschildren and adolescents as underweight, overweight, or obese. BMI for childrenchanges with age and should be monitored over time to reflect a child’s status.
To calculate BMI, use the following formula:BMI = Kg/m2
Kg = weight in kg; M = height in meters
• Head circumference-for-age is critical during infancy and describes brain/headgrowth.
The CDC clinical growth charts are available at:www.cdc.gov/growthcharts
There are two sets available. Set #1 shows the 5th through the 95th percentile and isused for routine public health and clinical applications. Set #2 shows data between the3rd and 97th percentile and is used for providing services to special populations and forassessment of children growing at the outer percentiles.
Gender, Age-specific & Optional Charts
Gender and age-specific Charts
Boys, birth to 36 months Weight-for-lengthBoys, birth to 36 months Weight-for-ageBoys, birth to 36 months Length-for-ageBoys, birth to 36 months Head circumference-for-ageGirls, birth to 36 months Weight-for-lengthGirls, birth to 36 months Weight-for-ageGirls, birth to 36 months Length-for-ageGirls, birth to 36 months Head circumference-for-ageBoys, 2 to 20 years BMI-for-ageBoys, 2 to 20 years Weight-for-ageBoys, 2 to 20 years Stature-for-ageGirls, 2 to 20 years BMI-for-ageGirls, 2 to 20 years Weight-for-ageGirls, 2 to 20 years Stature-for-age
Optional Charts
Boys, 2 to 5 years Weight-for-statureGirls, 2 to 5 years Weight-for-stature
17Clinical Pediatric Nutrition
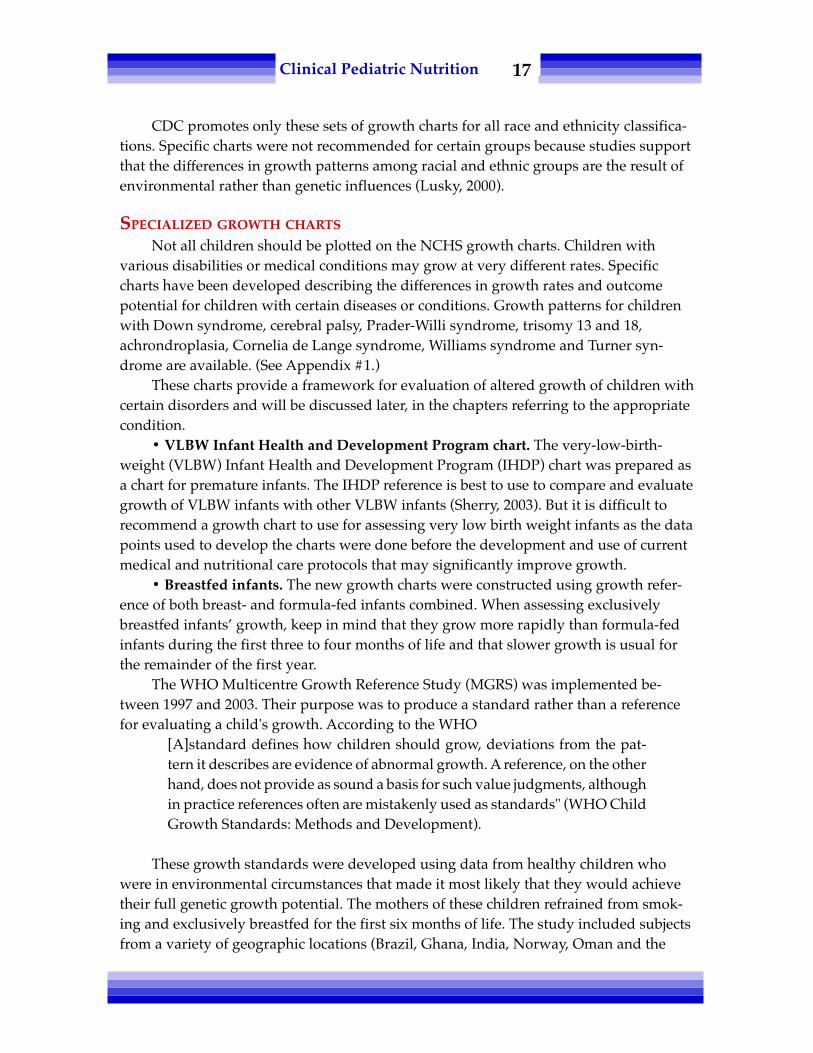
CDC promotes only these sets of growth charts for all race and ethnicity classifica-tions. Specific charts were not recommended for certain groups because studies supportthat the differences in growth patterns among racial and ethnic groups are the result ofenvironmental rather than genetic influences (Lusky, 2000).
SPECIALIZED GROWTH CHARTS
Not all children should be plotted on the NCHS growth charts. Children withvarious disabilities or medical conditions may grow at very different rates. Specificcharts have been developed describing the differences in growth rates and outcomepotential for children with certain diseases or conditions. Growth patterns for childrenwith Down syndrome, cerebral palsy, Prader-Willi syndrome, trisomy 13 and 18,achrondroplasia, Cornelia de Lange syndrome, Williams syndrome and Turner syn-drome are available. (See Appendix #1.)
These charts provide a framework for evaluation of altered growth of children withcertain disorders and will be discussed later, in the chapters referring to the appropriatecondition.
• VLBW Infant Health and Development Program chart. The very-low-birth-weight (VLBW) Infant Health and Development Program (IHDP) chart was prepared asa chart for premature infants. The IHDP reference is best to use to compare and evaluategrowth of VLBW infants with other VLBW infants (Sherry, 2003). But it is difficult torecommend a growth chart to use for assessing very low birth weight infants as the datapoints used to develop the charts were done before the development and use of currentmedical and nutritional care protocols that may significantly improve growth.
• Breastfed infants. The new growth charts were constructed using growth refer-ence of both breast- and formula-fed infants combined. When assessing exclusivelybreastfed infants’ growth, keep in mind that they grow more rapidly than formula-fedinfants during the first three to four months of life and that slower growth is usual forthe remainder of the first year.
The WHO Multicentre Growth Reference Study (MGRS) was implemented be-tween 1997 and 2003. Their purpose was to produce a standard rather than a referencefor evaluating a child's growth. According to the WHO
[A]standard defines how children should grow, deviations from the pat-tern it describes are evidence of abnormal growth. A reference, on the otherhand, does not provide as sound a basis for such value judgments, althoughin practice references often are mistakenly used as standards" (WHO ChildGrowth Standards: Methods and Development).
These growth standards were developed using data from healthy children whowere in environmental circumstances that made it most likely that they would achievetheir full genetic growth potential. The mothers of these children refrained from smok-ing and exclusively breastfed for the first six months of life. The study included subjectsfrom a variety of geographic locations (Brazil, Ghana, India, Norway, Oman and the

18Clinical Pediatric Nutrition
United States) to increase the validity of the data for international applicability. Elec-tronic copies of the WHO growth charts and tables together with tools developed tofacilitate their use are available at: www.who.int/childgrowth/en.
• Incremental growth charts and tables. Tanner and Davis (1985) developedvelocity charts as a sensitive measure for the early identification of children with under-and overnutrition. These curves describe the changes in rate of weight gain and rate oflinear growth at particular ages and provide another tool used in evaluating growthcompared to a population norm. See Appendix #1.
Incremental growth charts (Roche, 1980) can show an overview of periods of rapidand slowed growth. They measure interval growth rates. Guo, et al., (1991) compileduseful tables for assessing weight gain and stature over short periods of time. The data,from the University of Iowa and the Fels Longitudinal Study, are divided into sex-specific percentiles for increment gains of weight and recumbent length during the first24 months of life. These tables are useful in screening deviations from normal weightand length gain over days, weeks or months and aid in early detection of under- orover-nutrition. (See the chart on the following page.)
PLOTTING THE DATA
After gathering all the data — pounds, kilograms, centimeters or inches — plot thenumbers on the growth charts to provide a visual representation of the information. Theintersection of the child's age or other value with the comparing data is where theinformation is plotted.
Incremental Weight Gain Standards
Age (mo.) Weight (gm/d)Percentiles
5th 25th 50th 75th 95thboys
0-2 21 28 32 38 442-4 — 19 23 26 —4-6 12 14 16 18 216-8 10 12 13 15 178-10 9 10 11 13 15
10-12 7 9 10 12 14
girls0-2 17 23 28 32 382-4 — 19 21 24 —4-6 11 14 15 17 196-8 10 12 13 14 168-10 8 10 11 13 14
10-12 7 9 10 11 13Adapted from Guo, et al., 1991.

19Clinical Pediatric Nutrition
WEIGHT
Once you have measured and rechecked a child’s weight, plot this informationagainst the child’s age, length, and calculate BMI.
Use the following terms to describe or reference weight:• Standard or ideal weight-for-age is the weight that is at the 50th percentile for
that particular age. Find the child’s age and follow the line vertically to where itintersects with the 50th percentile for weight. This is the ideal or standardweight for that age.
• Weight-age is the age at which the child’s weight is on the 50th percentile orstandard for age. Locate weight-age by finding the intersection of lines corre-sponding to the child’s weight. Follow the horizontal weight axis line to where itintersects the 50th percentile line. The age that corresponds to this point is theweight-age.
• Percentage of ideal weight for height is the 50th percentile weight for the child'smeasured length or height. It is calculated as follows:
actual weight X 10050th percentile for weight for length or height
Interpretation of % IBW: ≥90% Normal80 to 90% Mild wasting70 to 80% Moderate wasting
<70% Severe wasting
Weight Indices
Girls: Birth–18 monthsPhysical Growth
9
8
7
6
5
4
3
2
B 3 6 9 12 15 18Age (months)
Wei
ght (
kg)
Actual weightWeight – AgeIdeal weight for age
�
�
�
�

20Clinical Pediatric Nutrition
The previous chart illustrates these terms for describing the growth indices of a 9-month-old girl. Her current weight is 7.62 kg, which falls between the 10th and 25thpercentile range for her age. The standard or ideal weight for her age is 8.5 kg or 21 lb,so she is 90 percent of ideal weight. She is the average weight-age of a 7-month-old girl.
LENGTH/STATURE
Once you have measured and rechecked a child’s length or stature, plot this infor-mation against the child’s age. Switching from infant (birth to 36 month) to children (2to 20 years) growth charts takes place when the child is no longer measuredrecumbently — standing height is obtained. Measurements between the 10 to 90thpercentile are considered in the normal range and measurements above or below thenormal range may indicate a genetic or nutritional influence. The chart below presents avisual representation of the following terms.
Use the following specific terms to describe height:• Standard height-for-age is the length or height that is the 50th percentile for that
particular age. Find the point where the child’s age intersects with the 50thpercentile line. This is the standard height for that particular age.
• Height-age is the age at which the child’s actual height or length is on the 50thpercentile. Find height-age by locating the child’s length-for-age plot. Follow thehorizontal length axis to where it intersects the 50th percentile line. The age thatcorresponds to this point is the child’s height-age.
Age (months)
Leng
th (c
m)
Girls: 3–21 monthsPhysical Growth
Length or Height Terms
★
Actual lengthLength– AgeStandard length for ageIdeal weight for length age
3 6 9 12 15 18 21
★
�
�
�
�
17
16
15
14
13
12
11
10
9
Wei
ght (
kg)
80
75
70
65
60
55
50
45
40

21Clinical Pediatric Nutrition
• Ideal body weight for height-age is the ideal weight for the child’s particularheight-age. Find the child’s height-age and follow that age down to the weightcurve. The weight that corresponds with the age at the 50th percentile line is thechild’s ideal weight for height-age.
• Percentage of ideal weight based on height-age: actual weight ÷ ideal bodyweight for height-age X 100.
This equation calculates the degree of stunting (representing chronic malnutritionor may be related to the child's disease/disorder):
>95% Normal90 to 95% Mild stunting85 to 89% Moderate stunting
<85% Severe stunting
Example: KC’s length at the age of 9 months is 74 cm, which places her at the 90thpercentile. Standard length at this age is 70 cm. Her height-age is 12 months and theideal weight for her height-age is 9.6 kg. If her current weight is 7.62 kg, then she is 80percent of ideal weight for height-age.
ALTERNATIVE MEASUREMENTS
Other measurement techniques for children with special health care needs(CSHCN) may include sitting height, crown rump length, or body segment lengths(Feucht, 2000). These interpretations are useful for children who are unable to stand,have severe contractures, or scoliosis. This data should be used in conjunction withCDC weight-for-age data. There are reference statistics available, but in general thesetechniques are more difficult to interpret from individual data points and are bestfollowed over time.
PARENTAL HEIGHT INFLUENCE
Genetic influences are the first factor evaluated in any linear growth abnormalityas parental stature is key in distinguishing between normal genetic causes of unusualstature and those with pathology. Adjustments for parental stature are based on theaverage height of the child’s biological parents, called the mid-parental height.
Mother’s height + father’s height ÷ 2 = mid-parental height
Two methods used to assess the impact of mid-parental height on a child’s growthare based on data from the Fels Longitudinal Study. One method devised by Garn andRohman (1966) uses the data to define percentile ranges for corrected height of children.Himes, et al., (1985) used the same data to formulate adjustment factors that are addedto the child’s measured stature. See Appendix #5.

22Clinical Pediatric Nutrition
Example: JJ is 13 years old. He is 145 cm tall, which places him at the 10th percen-tile on the NCHS grids. His mother is 4'9" (145 cm) and his father is 5'3" (160 cm). Mid-parental height is 145 + 160 ÷ 2 = 152.5 cm. According to Himes, the parental adjustmentis 10 cm. JJ’s adjusted height is 155 cm, which plots at the 50th percentile.
Clearly mark the adjusted figures on a growth chart along with the measured height.
NUTRITIONAL STATUS INDICATORS
The growth charts give an indication of how a child is growing in comparison toother children of the same sex and age. On each chart is a set of lines or curves that markthe percentile curves. The heavy dark line in the center is the 50th percentile curve — theaverage value. The lines above and below that curve describe the percentages of childrenin that particular population whose measurements are above or below standard.
The anthropometric index and percentile cutoffs used to screen children in theCDC growth charts are shown in the chart on the following page.
INTERPRETATION OF GROWTH DATA
Typical growth occurs between the 10th and 90th percentile on standard growthcharts. Deviations from the normal growth charts may indicate a nutritional deficiencyor excess. Clinicians should carefully scrutinize all of the data, as well as the growthtrend over time. The first approach is to ensure that any measurements that are in theextremes of the growth charts are accurate, as measurements may be obtained improp-
Effect of Parental Height on Stature
Actual heightCorrected height
Boys: 9–16 yearsPhysical Growth
165
160
155
150
145
140
1359 10 11 12 13 14 15 16
Age (Years)
Heig
ht (c
m)

23Clinical Pediatric Nutrition
erly, recorded in error or even plotted inaccurately. If a measurement seems inaccurate itis recommended to repeat the measurement and check the plot to make sure that theinformation is correct.
The second approach is to affirm that the proper chart is being used to evaluate theindividual’s growth. Is the sex correct or is prematurity accounted for in the age deter-mination? Is recumbent length being plotted on a chart which measures standingheight? Does this child have a specific condition that may alter their growth outcomeand is there a special chart for monitoring height or weight? Using the correct chart toevaluate length or weight will clarify concerns of possible growth abnormalities.
The third consideration is to evaluate the pattern of growth and compare how thisparticular point fits in with the child’s overall growth trend.
Multiple plotted points provide more information regarding the child’s growthnutritional status over time, as a change in growth rate is a significant indication ofproblems.
During the first two years of life, crossing channels is not uncommon, but after thisphase, an individual’s growth pattern is established along a specific percentile range.The child whose weight goes from the 50th to the 90th percentile in a short period oftime is at risk for obesity. A recent downward trend from the 50th to the 10th percentilemay be an indication of an acute process whereas a trend over a longer period of timemay point to a chronic problem.
Refer to the chart below for a dramatic illustration of two children’s growth trends.Although child A’s growth appears worrisome at the 5th to 10th percentile range, it hasbeen following a consistent pattern over time. Child B weighs more and is taller thanchild A, however child B’s growth pattern is more disturbing because growth is deceler-ating from the normal pattern.
Anthropometric Index and Percentile Cutoffs
Anthropometic Index Percentile cutoff Nutritional classification
BMI-for-age ≥ 95th %ile or BMI >30 Obese(whichever is lower)
BMI-for-age ≥ 85th to 94th %ile OverweightWeight-for-length >95th %ile OverweightBMI-for-age <5th %ile UnderweightLength-for-age <5th %ile Short statureHead circumference- <5th or >95th %ile Developmental
for-age concerns

24Clinical Pediatric Nutrition
If the only data available was the information at age 11, then Child A’s growthwould attract more attention than Child B’s. This example demonstrates how multipleplots provide more information on health and nutritional status.
MEASUREMENTS OF BODY COMPOSITION
Variation in body composition can be due to many factors including nutrition,altered metabolism, activity and muscle contractions. Measurement of standard loca-tions for fatfolds and arm circumference contributes information regarding fat storesand muscle reserves to the nutrition assessment.
Growth and body composition measurements together increase the interpretiveability. Take the example of a young wrestler. This child’s weight for height is abovenormal, but measurements of fat and muscle stores indicate a greater that averagevolume of lean body mass. The growth chart alone demonstrates that he is overweight,but evaluation of body fat and muscle reveal that the weight is mostly lean body massand he has very little body fat.
On the other hand, a child with hypotonia may have a low weight for length, butadequate fat stores and less than normal muscle reserves.
Measuring of fatfolds and arm circumference must be performed by a trainedhealth care provider or dietitian. When evaluating repeated measurements, it is impor-tant that the measurement be taken by the same person, as there can be much variationbetween different reporters.
★★
★
★★
★ ★ ★
2 3 4 5 6 7 8 9 10 11Age (Years)
Wei
ght (
kg)
B
A
35
30
25
20
15
10
Girls: 2–11 yearsPhysical Growth
Assessing Serial Growth Measurements

25Clinical Pediatric Nutrition
Equipment: The two pieces of equipment needed to measure body composition area nonstretchable measuring tape and special calipers. Lange or Holtain (Tanner-Whitehouse) calipers are the most reliable instruments available to measure fatfolds.They can be ordered from Seritex, Inc. (address provided in Chapter One).
Technique: Measurements are taken of the mid-arm circumference, triceps fatfoldand subscapular fatfold. Then arm muscle circumference, arm muscle area and arm fatarea are calculated.
�acromial process
�
� midpoint
olecranon process
Measuring Triceps Skinfold
• At midway mark on posterior side of same arm, loosely pinch a fold ofskin and subcutaneous tissue (avoid pinching muscle tissue). Holdskinfold between thumb and forefinger in a vertical plane.
• Apply calipers to the fold, approximately 1 cm below the pinch.• Hold the pinch, but release the calipers. Read the dial after three seconds.• Repeat procedure three times and average the values.
26Clinical Pediatric Nutrition
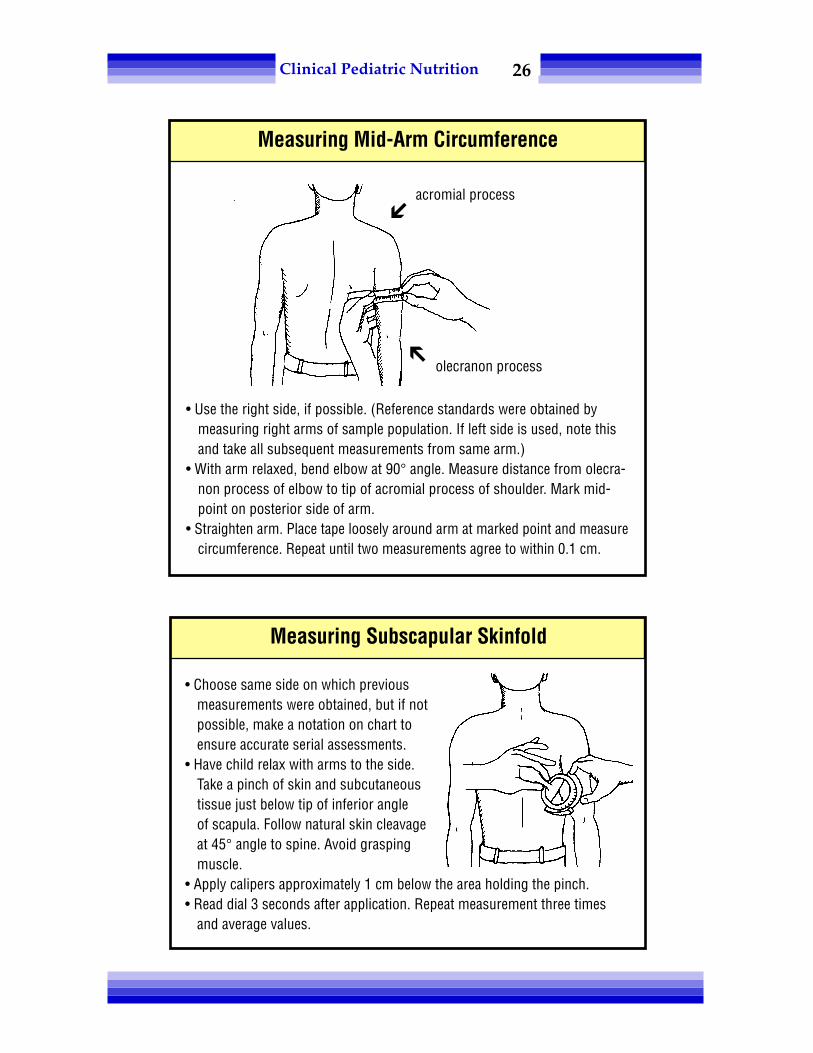
• Choose same side on which previousmeasurements were obtained, but if notpossible, make a notation on chart toensure accurate serial assessments.
• Have child relax with arms to the side.Take a pinch of skin and subcutaneoustissue just below tip of inferior angleof scapula. Follow natural skin cleavageat 45° angle to spine. Avoid graspingmuscle.
• Apply calipers approximately 1 cm below the area holding the pinch.• Read dial 3 seconds after application. Repeat measurement three times
and average values.
Measuring Subscapular Skinfold
�acromial process
� olecranon process
Measuring Mid-Arm Circumference
• Use the right side, if possible. (Reference standards were obtained bymeasuring right arms of sample population. If left side is used, note thisand take all subsequent measurements from same arm.)
• With arm relaxed, bend elbow at 90° angle. Measure distance from olecra-non process of elbow to tip of acromial process of shoulder. Mark mid-point on posterior side of arm.
• Straighten arm. Place tape loosely around arm at marked point and measurecircumference. Repeat until two measurements agree to within 0.1 cm.

27Clinical Pediatric Nutrition
ARM MUSCLE CIRCUMFERENCE (AMC), ARM MUSCLE AREA (AMA), UPPER
ARM AREA (UAA) AND ARM FAT AREA (AFA)Calculate AMC, AMA, UAA and AFA from the measurements of mid-arm circum-
ference (MAC) and triceps skinfolds (TSF). Gurney (1973) devised a nomogram (seeAppendix #10) for easy configuration of these results; you can also use the calculationsin the table below.
INTERPRETATION OF BODY COMPOSITION
The figures obtained from these measurements do not provide information about thepercentage of lean body mass or body fat, but serve as indices to compare body composi-tion to an age-related population. Frisancho (1981) and Sann, et al., (1988) configuredtables (see Appendix #8) from data in the NHANES survey, which provide percentilerankings based on age to assess nutritional status. The most effective way to use theseindices is to obtain baseline measurements on an individual and follow serial measure-ments over time to assess trends and achievement of goals to increase or decrease stores.However, there are no reference standards for children less than 1 year old.
Mid-upper arm circumference (MUAC-for-height and for-age) has also been usedas a screening tool for individuals and populations (Mei, et al., 1997).
REFERENCES
Feucht S. Assessment of growth: Part 1 Equipment, Technique and Growth Charts. Nutrition Focus 15(2),March/April 2000.
Frisancho A. New Norms of upper limb fat and muscle areas for assessment of nutritional status. Am JClin Nutr 43:2540-5, 1981.
Frisancho A. Anthropometric Standards for the Assessment of Growth and Nutritional Status. UnivMichigan Press, 1990.
Garn S and Rohmann C. Interaction of nutrition and genetics in the timing of growth and development.Pediatr Clin North Am 13:353-379, 1966.
Guo S, Roche A, Fomon S, et al. Reference data on gains in weight and length during the first two years oflife. J Pediatr 119:355-362, 1991.
Calculating AMC, AMA, UAA & AFA
AMC (cm) = MAC measured in mm – ( 0.314 x TSF )
UAA (mm2) = .785 ( )
AMA (mm2) =
AFA (mm2) = UAA – AMA
(AMC) 2
12.56
MAC 2
3.14

28Clinical Pediatric Nutrition
Gurney JM and Jelliffe DB. Arm anthropometry in nutritional assessment: nomograms for rapid calcula-tion of muscle circumference and cross sectional muscle and fat areas. Am J Clin Nutr 26:912-15,1973.
Himes J, Roche A, Thissen D, et al. Parent-specific adjustments for evaluation of recumbent length andstature of children. Pediatrics 75:304-313, 1985.
__________ Infant Health and Development Program: Enhancing the outcomes of low-birthweight,premature infants. JAMA 263(22):3035-3042, 1990.
Lusky A. Body mass index in 17-year-old Israeli males of different ethnic background. International JObesity 24:88-92, 2000.
Mei Z, Yip R, Trowbridge F. Improving trend of growth of Asian refugee children in the USA: Evidence tosupport the importance of environmental factors on growth. Asia Pacific J of Clin Nutr 7(2):111-116,1998.
Mei Z, Grummer-Strawn L, de Onis M, Yip R. The development of a MUAC-for-height reference, includ-ing a comparison to other nutritional status screening indicators. Bulletin of the World Health Organi-zation v75(4): Jul-Aug, 333-342, 1997.
Roche A, Himes J. Incremental growth charts. Am J Clin Nutr 33:2041, 1980.Sann L, Durand M, Picard J, et al. Arm fat and muscle areas in infancy. Arch Dis Child 63:256-260, 1988.Sherry B, Mei Z, Grummer-Strawn L, Dietz WH. Pediatrics 112(1):208, 2003.__________ Sources of error in weighing and measuring children in Center for Disease Control Nutrition
Surveillance, DHEW Publ. (CDC) 76-8295. Atlanta, GA. 1975.Tanner JM and Davis PSW. Clinical longitudinal standards for height and weight velocity for North
American children. J Pediatr 107:317-329, 1985.Tanner J and Whitehouse R. Revised standards for triceps and subscapular skinfolds in British children.
Arch Dis Child 50:142-145, 1975.Waterlow JC. Classification and definition or protein energy malnutrition. BMJ 3: 566-569, 1972.WHO Child Growth Standards: Methods and development, Accessed October 31, 2008. http://
www.who.int/childgrowth/standards/Chap_1.pdf

29Clinical Pediatric Nutrition
Chapter Three:Nutrition Assessment:
Dietary & Feeding Evaluation
The dietary assessment provides essential information about the quality andquantity of a child’s food and fluid intake as well as factors that determine preferences,choice and habits. It identifies potential nutrient deficiencies or toxicity and problemareas in the present and former diet. The assessment evaluates a whole compendium ofvariables including nutrient intake, developmental feeding skills and psychosocialissues that affect behavior and mother-child interactions. All these factors encompassingeating practices control the adequacy of a child’s nutritional intake.
Assessment of dietary practices involves a comprehensive interview with familiesand/or other care providers and a complete review of health records. Guide the dietaryinterview by the information sought regarding the problem. For example, detailedinformation on breast-feeding and timing of the introduction of solids is important inreviewing the intake of a former preemie with bronchopulmonary dysplasia who isnow 7 months corrected age. This information would not be necessary if the child werea 10-year-old boy with newly diagnosed diabetes mellitus.
The following chapter will identify some of the methods for collecting food intakeinformation and the skills needed for screening oral motor difficulties and psychosocialor environmental factors affecting intake.
DIETARY EVALUATION
Food intake information evaluates usual dietary consumption to allow a compari-son to suggested normal intake and estimated nutritional needs. Typical day reporting,three- to seven-day food records and 24-hour recall are methods used to collect informa-tion on dietary habits. Each method has its strengths and limitations in quantifyingnutrient value. Food intake data are prone to reporting error, specifically for the indi-

30Clinical Pediatric Nutrition
vidual or group, and the dietitian should exercise caution when evaluating the validityof such information (Livingstone, 2004).
The typical day reporting method works well to describe the type of formula,amounts and frequency of feedings for infants. This method is not as good toreport for children as appetite and intake vary from day to day and it is not easy todescribe ‘typical’ for children. For older infants and children, the three- to seven-day food record provides the most comprehensive information. There are problemswith the 24-hour recall method in that it is difficult for a person to remember allthat they, themselves, ate within the last 24 hours, let alone try to remember whatand how much their child ate.
Keeping a food record should always be accompanied by an interview to clarifyand confirm the information. The validity of the food record and history is only as goodas the parent’s willingness to share the information. Establish trust with the caregiversand give them an idea of the purpose of the interview. Providing an adequate diet is animportant aspect of nurturing or parenting, and some people may feel threatened whenqueried about their child’s — and the family’s — food habits.
Make certain that the foods listed were actually consumed, not just provided.Often, a parent will say their child takes four (8 oz) bottles a day. Upon further discus-sion, you find out that the child usually leaves about 2 oz in each bottle — which isthrown out before the next feeding. So, count only 6 oz per bottle in the analysis.
Explore whether there is food expelled from the mouth during a meal. Food maybe presented to the child, but if much of it ends up on the table, in the dog’s belly or onthe floor, this cannot be considered in the analysis. Assess, through questioning,whether this is typical for the child. Evaluate whether the days recorded were typical orout of the ordinary (Craig, 2000). Ask: “Were there any factors different from usual thatwould affect the child’s appetite or intake during the sample period, such as an illness,holiday or vacation?”
Identify through the interview and food record whether there any cultural, reli-gious and familial practices that place limitations on the child’s diet. Ask: “Does thechild have any allergies that restrict intake of certain food groups?”
Food Record Information
• Food consumed: type, amount and preparation methods(fried, baked, steamed, etc.)
• Liquid consumed: type and amount, formulas: how prepared
• Timing of meals and snacks
• Dietary supplements: type and amount

31Clinical Pediatric Nutrition
Although the recommended intake of servings from each food group are depen-dent upon caloric needs, serving size varies dependent upon child's age.
Typical Portion Sizes & Daily Intake for Infants
FeedingsAge Food (portion size) per day0 to 4 months Breast milk or infant formula (2-4 oz) 8-124 to 6 months Breast milk or infant formula (6-8 oz) 4-6
Infant cereal (1-2 Tbsp) 1-26 to 8 months Breast milk or infant formula (6-8 oz) 3-5
Infant cereal (2-4 Tbsp) 2Crackers (2), bread (1/2 slice) 1Juice (0-3 oz) 1Fruit or vegetable (2-3 Tbsp) 1-2
8 to 12 months Breast milk or infant formula (6-8 oz) 3-4Cheese (1/2 oz) or yogurt (1/2 cup) 1Infant cereal (2-4 Tbsp), bread (1/2 slice), 2
crackers (2), or pasta (3-4 Tbsp)Juice (3 oz) 1Fruit or vegetable (3-4 Tbsp) 2-3Meat (3-4 Tbsp) or beans (1/4 cup) 2
Recommended Serving Size for Various Age Ranges
Food Group 2-3 years 4-6 years 7-12 yearsGrains:Whole grain, enriched 1/4 - 1/2 slice 1 slice 1 slicebread/bun/bagel/muffinPasta, rice 1/4 - 1/3 cup 1/2 cup 1/2 cupCooked cereal 1/4 - 1/3 cup 1/2 cup 1/2 - 1 cup(grits, oatmeal)Dry cereal 1/3 - 1/2 cup 1 cup 1 cupCrackers 2 - 3 4 - 6 4 - 6Meats & Meat Alternatives:Meat/poultry/fish 1 - 2 oz 1 - 2 oz 2 ozEggs 1 1 1 - 2Peanut butter 1 Tbsp 1 - 2 Tbsp 2 TbspBeans 2 - 4 Tbsp 1/4 - 1/2 cup 1/2 cupDairy:Milk 1/2 cup 1/2 - 3/4 cup 1/2 - 1 cupCheese 1/2 oz 1/2 - 1 oz 2 ozYogurt 4 oz 4 - 6 oz 8 oz
Adapted from: Leonberg, 2008.

32Clinical Pediatric Nutrition
Appendix #14 contains lists of resources to obtain information on commerciallyavailable baby foods.
• Analyzing the information. After the data has been collected and verified,analyze the quantity of nutrients in the foods. The data can then be compared to age- orsize-appropriate norms. The information you seek will guide the type of assessmenttool to use. There are many computer and handheld programs available to assess dietrecords. The most commonly used programs for pediatrics are listed below.
Whichever program you decide to use, investigate the database to make sure itincludes infant foods, infant formulas and enteral nutritional supplements. Decide whatother features you want, such as nutrient breakdown, variety of reports, analyses anduser-friendliness.
FEEDING EVALUATION
What is a reasonable length of time to feed an infant, toddler or child? Understand-ing the timing of meals, snacks and formula or breast-feeding is a vital part of thedietary assessment. An infant may be taking one hour to drink 4 oz of formula becauseof a weak suck. A child with cerebral palsy may be eating enough food to sustain goodgrowth. However, due to oral motor dysfunction, it’s taking the family eight hours perday to feed this child.
Another child may be grazing all day long and never have structured meals or snacks.Identification of meal patterns provides additional insight into the nutrition assessment.
Try to evaluate factors surrounding the eating experience. Does the family havetrouble dealing with messiness? Does the feeder like to control the situation and notallow the child to explore and have the opportunity and independence appropriate tohis or her developmental age and skill level? Investigate the social environment. Aremeals eaten with the siblings, or separate from other family members? Does the childeat at the table or in front of the television? Who is present during mealtimes? What are
Diet Record Assessment Programs
Food ProcesserESHA (800) 659-3742www.esha.com
Compu-Cal, Inc.(360) 352-5038www.compucal.com
Mexican Food Composition Databasehttp://spin.comms/~jledesma/mexfoods/vol1.html
USDA Nutrient/Food Compositionwww.nal.usda.gov/fnic
Nutritionist 4(800) 633-3453www.firstdatabank.com
Food Finderwww.olen.com/food

33Clinical Pediatric Nutrition
the family’s eating habits? Do they frequent fast food restaurants, or eat on the run?Consider these other factors that may be influencing food intake. Does the family
have the income to procure foods? What types of cooking facilities do they have? Arethey receiving support from supplemental food programs, such as WIC or food stamps?
Intrinsic patterns of eating may provide clues to nutritional adequacy. Is therecoughing during feeding? Does the child appear to have an increased work of breath-ing, aversion to touch or food, or have some other signs of internal discomfort? Does thechild demonstrate any unusual feeding preferences, such as non-food items (pica)?
Behavioral and psychosocial problems associated with feeding, ranging from afussy eater to food refusals or rumination, provide more insight into the nutritionassessment. As it is primarily the parent’s responsibility for the child’s food experience,pay close attention to the psychological well-being of the parent-child interaction.Feeding situations are outcomes of the interaction between time, space, child, feederand food variables (Wolff and Lierman, 1994). A disordered feeder-child relationshipoften leads to dysfunctional food-related behaviors (Padgett, 1992). The associationbetween the feeding relationship and failure to thrive is discussed in more depth inChapter Eight, but some examples are listed in the table below.
Evaluation of feeding abilities and developmental readiness is key to the pediatricnutrition assessment. Feeding skill development follows a predictable sequence. Thenormal series of feeding starts with the acceptance of liquids. The next stage is introduc-tion of strained and soft foods, gradually leading to greater textures. Alteration in thissequence of maturation results in feeding problems.
To perform a feeding assessment, one must know the normal milestones of feedingskill development and observe the child while feeding or being fed. What textures doesthe child eat? What tastes does the child accept and what techniques, such as chewing,cup drinking, finger feeding skills, or using a utensil has he/she mastered?
Pertinent historical feeding information can be of significant value to the dietaryassessment. Was the child breast-fed? What was the timing of introduction of semi-solids?
Appropriate & Dysfunctional Feeding Behaviors
Negative behaviors
No eye contactMonotone voice or no vocalsRough handlingNegative verbal interactionsUnsafe environmentNonresponsive to cues
Positive behaviors
Good eye contactSmiles, vocalizationsGentle touchPraiseGentle rockingAttention to cues

34Clinical Pediatric Nutrition
Illingsworth and Lister (1964) describe a critical period of food introduction thatpermits and promotes feeding skill maturation. The history may clue into missedopportunities during this critical period. If a child was not provided with the opportuni-ties to eat solids between six and 12 months of age, there may be difficulties in thetransition, causing feeding delays or problems.
Evaluate feeding skills in relation to the child’s developmental readiness, notchronological age. Children who are premature, progress in relation to their correctedages (see Chapter Seven). Children with developmental delay may have abnormalfeeding patterns and feeding skills commensurate with their cognitive and motorabilities: see the table on the following page. Pushing them past these limitations mayset up the child for problems with aspiration or feeding aversions.
The oral motor examination is often out of the “comfort zone” for most dietitians.Contact a speech pathologist or occupational therapist with a specialty in feeding toprovide the expertise. The team approach is most effective in assisting children withfeeding difficulties.
Developmental Stages in Feeding Behaviors
Skill
Suck, reflex rooting, swallowing, tonicneck reflex, poor head control
Head control, mature suck, sits w/support
Lateral tongue movement, independentsitting position, beginning of rotarychewing movements
Reaches for and grasps w/scissorsgrasp, brings hand to mouth
Refined digital grasp
Rotary chewing pattern, approximateslips to rim of cup, uses spoon
Increased rotary jaw movements
Independent walking, names food &expresses preferences, prefers un-mixed food, variable appetite
Feeding
Breast-feeding, bottle feeding
Cereal from spoon, pureedstrained foods
Soft, mashed foods
Finger foods of large pieces
Finger foods of smaller pieces
Textured foods, introduce cup,beginning self-feeding
Chopped foods
Seeks food independently,regular table foods
Adapted from Pipes 1985, Padgett, 1992.

35Clinical Pediatric Nutrition
Criteria proposed for referral to a feeding therapist include (Cox, 1997):• Poor coordination of suck/swallow/breathe pattern, or weak suck.• Delayed or absent progress to spoon feedings or table foods within expected time.• Discomfort, increased fussiness, distress, severe irritability and/or arching
during feedings.• Disrupted breathing or apnea during feedings.• Lethargy, decreased arousal during feedings, or tires easily and has difficulty
finishing a feeding.• Feeding takes longer than 30 minutes for an infant or 45 minutes for a child.• Abnormal oral-motor anatomy or physiology: lips, tongue, jaw or palate.• Choking, excessive gagging or recurrent coughing during feedings, toward the
end of feeding, or between feedings.• Recurrent vomiting during or after a feeding.• Unexplained food refusal or inability to take adequate nutrition to support
growth.• Physical symptoms or conditions such as dysphagia, recurrent pneumonia,
aspiration, hypertonicity, hypotonicity, failure to thrive, etc.
SUMMARY
The dietary and feeding assessment contributes vital information regarding achild’s nutritional adequacy and also information regarding the behaviors and psycho-social issues that influence the feeding experience. The dietitian plays a key role in thecoordination of a team approach to services that deal with the nutritional, mechanical,medical and behavioral issues regarding feeding and dietary patterns.
Common Abnormal Feeding Patterns
Tongue thrust: forceful protrusion of the tongue making nippling or spoonfeeding difficult
Tonic bite reflex: jaw tightly clenched when teeth are stimulated by a spoon,finger or object
Lip retraction: lips drawn back, making it difficult to remove food from aspoon or draw liquid from a cup
Oral hypersensitivity: Sensitivity in and around the mouth; food is perceivedas uncomfortable and unpleasant
Refusal behaviors: Accept smooth puree consistency only; preference forcrunchy, dissolvable foods; Liquid only diet; Only consume foods/liquidsthat are one or two colors (e.g. white)

36Clinical Pediatric Nutrition
REFERENCES
Cox JH. Nutrition Screening and Diet History. In: Cox JH, ed. Nutrition Manual for At-Risk Infants andToddlers. Chicago, IL: Precept Press, 25-32, 1997.
Craig R, Kristal A, Cheney C, Shattuck A. The prevalence and impact of ‘atypical’ days in 4-day foodrecords. JADA 100:421-422, 2000.
Illingsworth R and Lister J. The critical or sensitive period, with special reference to certain feedingproblems in infants and children. J Pediatr 65:839-847, 1964.
Leonberg B. ADA Pocket Guide to Pediatric Nutrition Assessment. Chicago: American Dietetic Association,2008.
Livingstone MB, Robson PJ, Wallace JM. Issues in dietary intake assessment of children and adolescents.Br J Nutr 92(2):S213-222, 2004.
Padgett D. Behavior management of feeding problems. Nutr Focus, Univ Washington Jan/Feb, 1992.Trahms C. Nutrition in Infancy and Childhood, 7th ed. Times/Mosby, 2001.Wolff R and Lierman C. Management of behavioral feeding problems in young children. Inf Young Child
7(1):14-23, 1994.

37Clinical Pediatric Nutrition
Chapter Four:Nutrition Assessment:
Clinical, Physical & Biochemical Findings
The nutrition-focused physical exam provides additional clues to the nutritionassessment. The identification of specific nutrient(s) deficiency includes evaluation ofthe physical findings in the context of the diet history, medical diagnosis, current healthconcerns and laboratory findings (Balint, 1998; Hammond, 1997).
DIAGNOSIS AND MEDICAL HISTORY
Chronic and intermittent illnesses impact nutritional status. The physical examina-tion corroborates the findings suggested by the anthropometric, dietary and medical his-tory. Clinical signs show only after prolonged malnutrition and deficiency of body stores.
The chart below lists “alerts” and the chart on the following page lists selectedclinical signs and symptoms of various nutrient deficiencies. (See chapters on thespecific diseases or illnesses for information regarding particular nutritional concerns.)
• Has child experienced any recent weight changes?• Is child having difficulty swallowing or chewing?• Does child have chronic illness associated with altered nutrient needs (e.g. cystic
fibrosis, metabolic abnormalities, malabsorption, or respiratory abnormalities?• What trauma or injury is affecting child's ability to metabolize and utilize nutrients
for optimal growth and development?• Does child have symptoms (e.g. fever, vomiting, diarrhea, constipation, burns,
infection, nausea, or other GI disturbances)?• Have there been changes in bowel or urinary function, frequency?• What is child's medical history (e.g. previous and recurrent illness, surgical
procedures, or hospitalizations, and medications?• Is there a history of familial disease?
Red Flags of Potential Nutritional Deficiencies

38Clinical Pediatric Nutrition
BIOCHEMICAL INDICES
One of the goals of the biochemical analysis is to identify early signs of malnutri-tion or marginal deficiencies before clinical symptoms are evident. The child’s clinicalhistory, anthropometric, and dietary findings provide a logical framework on which tobase the biochemical investigation. The laboratory or biochemical data provide a mea-surement of nutrient concentration in the blood, urine or tissues. Abnormal values aredue to inadequate or excessive intake, impaired absorption or utilization, increasedrequirements, and/or excessive loss of nutrients. Quantitative analysis can confirmsuspected nutritional deficiencies or provide documentation regarding response tointervention.
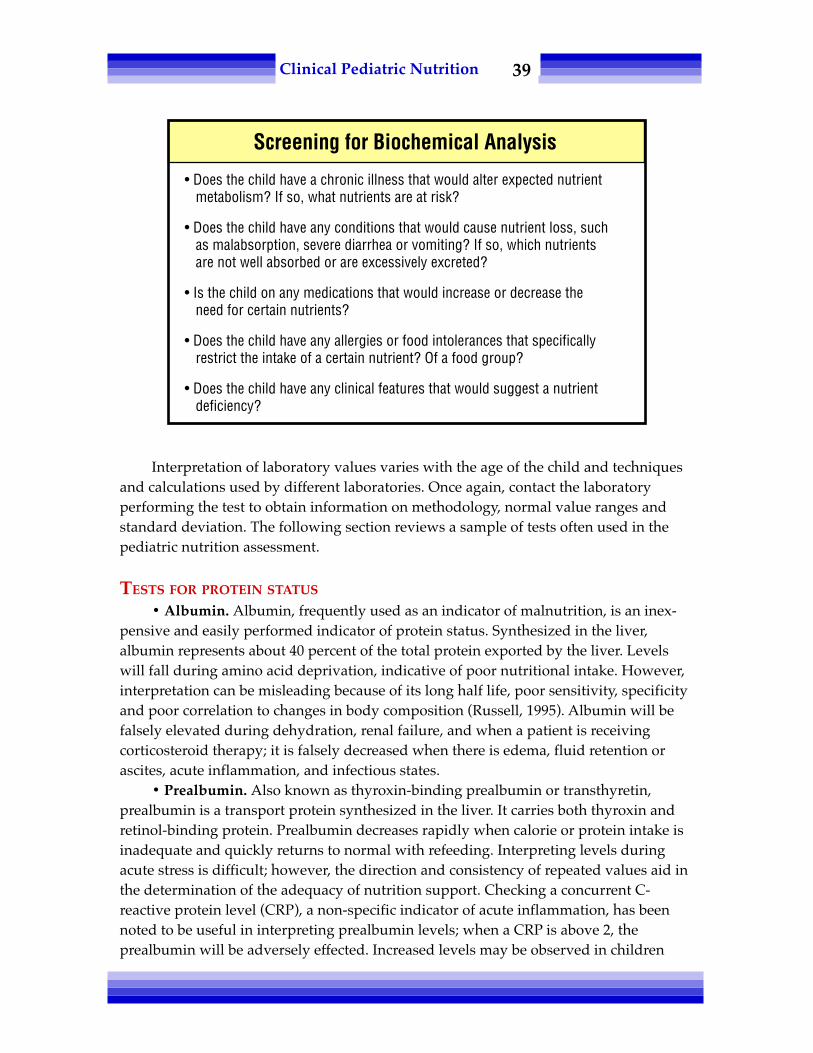
Execute biochemical inquiries judiciously. In light of rising medical costs, thinkthrough the rationale for testing. Develop a strong working relationship with the clini-cal laboratory. Discuss nutritional concerns with the lab to help define the appropriatetests that would confirm or rule out suspicions. The questions in the following table willhelp guide the biochemical inquiry:
Signs & Symptoms of Nutrient Deficiencies
Sitegeneral
skullhair
skin
eyes
teeth
GI
Signs/Symptomsweight loss, edema, ataxiaweaknessdelayed closure of fontanelleeasily pluckable, sparse,depigmenteddry, scaly, petechiae
xerosis of conjunctivacorneal vascularizationdental caries, mottled teeth
glossitis, magenta tongue,swollen/bleeding gums,fissured tongue
Potential NutrientImplicationsinadequate protein, energy,thiamin, zinc, vitamin Ainadequate vitamin D, calciuminadequate protein, zinc,essential fatty acidsinadequate vitamin A, essentialfatty acids, vitamin C & E, zincinadequate vitamin A, riboflavin
inadequate fluoride; excessfluorideinadequate zinc, niacin, folicacid, vitamin B12, riboflavin,vitamin C, niacin
Adapted from: Kelly, 1998; Ekvall,1993; Bernard, 1986.
Nutritional Deficiencies
39Clinical Pediatric Nutrition
Interpretation of laboratory values varies with the age of the child and techniquesand calculations used by different laboratories. Once again, contact the laboratoryperforming the test to obtain information on methodology, normal value ranges andstandard deviation. The following section reviews a sample of tests often used in thepediatric nutrition assessment.
TESTS FOR PROTEIN STATUS
• Albumin. Albumin, frequently used as an indicator of malnutrition, is an inex-pensive and easily performed indicator of protein status. Synthesized in the liver,albumin represents about 40 percent of the total protein exported by the liver. Levelswill fall during amino acid deprivation, indicative of poor nutritional intake. However,interpretation can be misleading because of its long half life, poor sensitivity, specificityand poor correlation to changes in body composition (Russell, 1995). Albumin will befalsely elevated during dehydration, renal failure, and when a patient is receivingcorticosteroid therapy; it is falsely decreased when there is edema, fluid retention orascites, acute inflammation, and infectious states.
• Prealbumin. Also known as thyroxin-binding prealbumin or transthyretin,prealbumin is a transport protein synthesized in the liver. It carries both thyroxin andretinol-binding protein. Prealbumin decreases rapidly when calorie or protein intake isinadequate and quickly returns to normal with refeeding. Interpreting levels duringacute stress is difficult; however, the direction and consistency of repeated values aid inthe determination of the adequacy of nutrition support. Checking a concurrent C-reactive protein level (CRP), a non-specific indicator of acute inflammation, has beennoted to be useful in interpreting prealbumin levels; when a CRP is above 2, theprealbumin will be adversely effected. Increased levels may be observed in children
Screening for Biochemical Analysis
• Does the child have a chronic illness that would alter expected nutrient metabolism? If so, what nutrients are at risk?
• Does the child have any conditions that would cause nutrient loss, such as malabsorption, severe diarrhea or vomiting? If so, which nutrients are not well absorbed or are excessively excreted?
• Is the child on any medications that would increase or decrease the need for certain nutrients?
• Does the child have any allergies or food intolerances that specifically restrict the intake of a certain nutrient? Of a food group?
• Does the child have any clinical features that would suggest a nutrient deficiency?

40Clinical Pediatric Nutrition
with kidney failure or children who are taking corticosteroids. Values may not be asaccurate in liver dysfunction or during an inflammatory process because of the inhibi-tion of protein synthesis. Abnormal values may also be related to iron status. Alteredfluid status does not significantly effect prealbumin levels.
• Transferrin. Transferrin, also synthesized in the liver, is a globulin that binds andtransports iron. There is a direct relationship between serum transferrin and nutritionalstatus (Roza, 1984). However, levels are also affected by variables independent ofmalnutrition. Severe catabolic stress, fluid overload, acute and chronic infections,antibiotic therapy and nephrotic syndrome can change outcome.
Direct measurement of serum transferrin levels is not routine in many laboratoriesand values are often calculated from total iron binding capacity (TIBC). The formulascan underestimate transferrin in iron-depleted individuals.
• Nitrogen balance. Nitrogen balance studies can be confusing to interpret inchildren. Devised for adults, most methods for calculating nitrogen balance are notaccurate for children (Boehma and Kopita, 1995). Because of nitrogen retention duringperiods of rapid growth in neonates, infants and children, calculations of nitrogenbalance studies tend to overestimate nitrogen losses. Maldonado, et al., (1988) devised aformula that takes into account the reduced urine volume, fecal output and insensiblelosses in the pediatric population:
Visceral Protein Status Biochemical Evaluation
ProteinAlbumin
Transferrin
Prealbumin
Half-life14-20 days
8-10 days
2-3 days
Conditions which may alter levelsDepressed values with:
protein & kcal malnutrition, impaired GIfunction, protein-losing enteropathy, burns,liver disease, stress, inflammation, infection,overhydration, zinc deficiency, infection
Elevated with:dehydration, corticosteroid therapy, renaldisease
Depressed values with:chronic infection, liver dysfunction, protein& kcal malnutrition, iron overload,nephrotic syndrome
Elevated with:iron deficiency, chronic blood loss
Depressed values with:liver disease, stress, inflammation, infection,surgical trauma, protein & kcal malnutrition
Elevated levels:renal disease, corticosteroid therapy

41Clinical Pediatric Nutrition
Nitrogen balance = N intake – N loss
N intake = gm protein consumed in 24 hours ÷ 6.25N loss = [UUN in gm/L ÷ 2 X urine volume(L)] + 0.8 (gm)UUN is urinary urea nitrogen
• Creatinine height index (CHI): CHI provides a method of assessing somaticprotein status. Creatinine is an end product of a complex molecule that participates insupplying ATP to muscle cells. There is a constant rate of daily creatine breakdown toform creatinine. A urine measurement of creatinine excretion in 24 hours provides anestimate of the total body muscle mass. Compare individual creatinine excretion to theexpected excretion for children of similar height to evaluate protein status in the tablebelow (Viteri and Alvarado, 1970). In patients with muscle wasting disease or chronicmalnutrition, creatinine excretion is reduced because of the distortions of body compo-sition and loss of body protein.
Difficulties with interpretation arise with getting an accurate 24-hour sample andalso in comparing children with atypical body composition or children with impairedurine output to the norms.
CHI =
An acceptable level is 80 to 100 percent, a moderate protein depletion is evidencedby values of 60 to 80 percent, and a severe protein depletion is indicated at levels below60 percent.
Children’s Ideal 24-hour Urinary Excretion of Creatinine
Heightinches cm ideal creatinine excretion(mg)
20 50.8 3823 58.4 6026 66 8429 73.7 11332 81.3 14535 88.9 19338 96.5 25341 104.1 30044 111.8 37347 119.4 44650 127 577
Adapted from Viteri and Alvarado, 1970
Measured urinary creatinine X 100Ideal urinary creatinine

42Clinical Pediatric Nutrition
TESTS FOR MALABSORPTION
• Carbohydrate. Carbohydrate malabsorption may be a primary or secondarydisorder. A primary malabsorption, caused by a defect in enzymatic function, is themore rare finding. Secondary malabsorption results from a lack of gastrointestinalabsorptive abilities following infectious diarrhea, acute damage to the brush bordermembrane or medications (Cornblath and Schwartz, 1966) and may persist for days tomonths depending upon the etiology.
One can test for carbohydrate malabsorption by evaluating the sugars in the stoolutilizing Clinitest (reducing substances). Other methods to evaluate carbohydratetolerance use analysis of breath hydrogen, one-hour xylose tolerance test, stool pH andblood lactase.
• Fat. Fat malabsorption can be caused by decreased contact time with the absorp-tive surface of the GI tract or an abnormal mucosal surface. The more definitive analysisof fat malabsorption — stool analysis — furnishes important qualitative and quantitativedata. The classic 72-hour stool sample is the standard for the diagnosis of steatorrhea.Steatorrhea is defined as an excess of fat in the stools. Stool collection can be cumber-some, and dietary fat intake during the same interval must be recorded precisely.
More extensive but invasive procedures, such as X-rays and intestinal biopsy, canreveal a number of abnormalities associated with malabsorption. Again, a good rela-tionship with the lab will help clarify and specify what test would produce the informa-tion you seek to confirm or rule out.
TESTS FOR NUTRIENT SPECIFICITY
Single biochemical analyses of certain nutrients will appraise adequacy, deficiencyor toxicity of certain vitamin and mineral levels by blood values, tissue stores or urineexcretion. Blood levels of micronutrients, specific amino acids and toxic by-productsmay be tested to aid in the detection of certain metabolic disorders. Check with yourclinical laboratorian for the most economic and effective measures to investigate con-cerns raised during the anthropometric, clinical and dietary examination.
TESTS FOR IRON STATUS AND NUTRITIONAL ANEMIAS
At one year of age, screening children for iron deficiency should be performed, asdetermined hemoglobin concentration. Use venipuncture or finger stick to determinehemoglobin and hematocrit. If the level is below the normal range for age, investigatefurther to target iron status and nutritional anemia. As obvious clinical signs occur onlyin conditions of severe anemia, a number of tests are available for assessing iron status.See the table on the following page.

43Clinical Pediatric Nutrition
Also indicated as causal agents in the development of anemias are folic acid, vitaminB12, copper, vitamin A, pyridoxine, riboflavin and vitamin E. Determination of the etiol-ogy of the anemia can be based on laboratory testing. The table below provides guidelinesfor distinguishing different types of anemias based on iron and hematologic values.
TESTS FOR IMMUNE FUNCTION
General malnutrition compromises the immune system. Decreased numbers ofcirculating lymphocytes and impaired delayed cutaneous hypersensitivity response toskin test antigens indicate impaired cell-mediated immunity in patients with proteindepletion.
Total lymphocyte count (TLC): Lymphocytes are very sensitive to malnutrition, butnot specific for any particular nutritional deficiency. Reduction in production correlateswell with other measures of visceral protein status. Interpretation of values can bedifficult if the child has concomitant infections or is on immunosuppressant drugs. Tocalculate total lymphocyte count:
Plasma iron concentrationTransferrin saturationTotal iron binding capacity (TIBC)Serum ferritinMean corpuscular volume (MCV)Mean corpuscular hemoglobin
concentration (MCH)
Assessing Iron Status
Reticulocyte responsePercent saturationHemoglobin concentrationHematocritStainable bone marrow iron
Souce: Baumgartner, 1991.
Type Hgb HCT Serum Iron MCV Ferritin TIBC
Iron D D D D D IFolic acid D D I I D D/NVitamin B12 D D I I N D/NChronic disease D D D N N D
D = decreased, I = increased, N = normalAdapted from Hendricks, 1990; Walker, 1985.
Analysis of Nutritional Anemias

44Clinical Pediatric Nutrition
TLC (cell/mm3) = WBC (cell/mm3) X % lymphocytes ÷ 100
A range of 1200 to 2000 indicates mild malnutrition, 800 to 1200 shows moderatedepletion, and below 800 means severe depletion.
• Delayed cutaneous hypersensitivity (DCH): DCH reactions, the standard forstudying cell-mediated immune response, are skin responses to recall antigens. Anumber of skin tests are given, such as purified protein derivative, streptokinase-streptodornase, mumps, Candida albicans, trichophytin and coccidioidin. Presumingprevious exposure to at least one of these antigens, a normal response is represented byan induration greater than 5 mm after 24 to 72 hours.
In the moderately to severely protein-calorie malnourished patient, the immunesystem does not react properly and there is a consistent loss of hypersensitivity. Anergyis the failure to respond to any of the antigens. Interpretation of the significance ofanergy may be difficult for individuals on immunosuppressive drugs, chemotherapeu-tic agents and those with edema or lymphoma (Alpers, et al., 1988).
DRUG-NUTRIENT INTERACTIONS
Drugs affect nutrition status in a variety of ways. Drugs interfere with the absorp-tion and metabolism of vitamins and minerals and can increase or decrease appetite.Prolonged drug usage, multiple medications, and marginal or poor nutritional intakeincrease the likelihood of interactions. Children are at greatest risk of nutrient-druginteractions due to the additional nutrient demands of growth and development.
There are many references to the delicate balance between foods and drugs; how-ever, each reaction is individual and intrinsic. The metabolism of the individual, theform of the drug, meal composition, and fluid volume all contribute to modify theinteraction of drugs and nutrients.
Dietary factors cause physiologic changes in the gastrointestinal tract that changethe rate of drug metabolism. Gastric emptying is affected by food presence and typeand may result in delayed drug absorption. Gastric pH, altered by food, can change thedissolution characteristics of some medications. As a physical barrier, food inhibits drugabsorption by interfering with its contact on the absorptive mucosa. There can be acompetition for transport across the intestinal wall between drugs and certain com-pounds in foods. This competition for binding sites can alter a drug’s metabolism,excretion and degradation.
Nutrient requirements are increased by the diminished absorption of nutrients,such as vitamin D with the use of certain anticonvulsants. Some drugs are specificallyantinutrient, such as folate-antagonistic antineoplastic drugs. Other medications de-crease vitamin synthesis, such as antimicrobials or antibiotics that decrease vitamin Kproduction.

45Clinical Pediatric Nutrition
Another mechanism of modified nutritional status associated with medications isaltered food intake. Drugs may suppress or stimulate appetite, cause nausea and vomit-ing, or alter taste acuity. Antineoplastic drugs cause anorexia, stomatitis or intestinalulceration; these can have a negative impact on appetite and food intake. There are alsodrugs that cause constipation or diarrhea. All too often nutritional status is furthercompromised as the diet is restricted in order to correct GI problems. Tube feedingformulas are commonly cited as the etiology of GI complaints, while medications areoverlooked.
Common Drug-Nutrient Interactions
Drugs
AnticonvulsantsDilantinPhenobarbitalValproic AcidTegretol
Steroids
Neoplastictreatments
Diuretics
Cardiacmedications
Antibiotics
Muscle relaxants
Thyroid drugs
Attention deficitdisorder drugs
Possible Nutrition Impact
Gum hyperplasia, nausea, constipationPotential deficiencies of vitamin D & folatePotential carnitine deficiencyTaste changes, drowsiness
Increased protein catabolism, increased appetite,hypernatremia, hypokalemia, hyperglycemia, hypo-calcemia & potential deficiencies of vitamins D, C & B6
Anorexia & potential deficiencies of folic acid &potassium
Hypokalemia, potential deficiencies of calcium & magne-sium, decreased carbohydrate tolerance & loss of appetite
Potential deficiencies of magnesium, calcium, potassium& loss of appetite
Nausea, vomiting, diarrhea, gastritis
Taste changes
Nausea, diarrhea, vomiting
Decreased appetite

46Clinical Pediatric Nutrition
Because of the complex nature of drug-nutrient interactions, it is not possible togive specific guidelines to cover all situations. Take into account the individual patient,the clinical circumstances, food consumed and the properties of the drugs. Work with thephysician and pharmacist to identify similar medications that may not be as injurious tothe nutritional state. If an equivalent alternative is not available, try to modify the medi-cation schedule, adjust the diet and/or standardize the conditions of administration.
Resources available for more information on drug-nutrient interactions include:• Handbook of Food-Drug Interactions. Wolfe JJ (Ed). Taylor & Francis, 2007• Nutrient-Drug Interactions. Meckling KA (Ed). Boca Raton FL. CRC Press LLC,
2006• Herb, Nutrient, and Drug Interactions: Clinical Implications and Therapeutic Strategies.
Stargrove MB, Treasure J, McKee DL. Mosby, 2007.
SUMMARY
Suspected deficiencies that are identified through the medical and dietary evalua-tions can be corroborated by physical findings and biochemical indices. Develop com-munication with a laboratorian to facilitate identification of the proper tests and param-eters of health and nutritional status that may affect the results of the test. Become awareof the clinical manifestations of nutritional deficits and of significant drug-nutrientinteractions. The more background about the medical, physical and biochemical evalua-tions, the more complete the profile to assess the nutritional needs of the child.
REFERENCES
Alpers D, Clouse R and Stenson W. Manual of Nutritional Therapies. Boston, MA. Little, Brown and Co.,1988.
Balint J. Physical findings in nutritional deficiencies. Ped Clin N Amer 45: 245-260, 1998.Baumgartner T, ed. Clinical Guide to Parenteral Micronutrition, Philadelphia PA. Lyphomed, 1991.Bernard M, Jacob D and Rombeau J. Nutrition and Metabolic Support of Hospitalized Patients. Philadelphia
PA. WB Saunders, 1986.
Strategies for Managing Drug-Nutrient Interactions
• Monitor growth.
• Evaluate intake. Adjust dietary recommendations.
• Supplement when necessary.
• Evaluate biochemical status of suspected nutrients.
• Adjust to accommodate taste and temperature changes.
• Adjust scheduling of medications and mealtimes.

47Clinical Pediatric Nutrition
Boehm K and Kopita A. Total nitrogen versus urea nitrogen in nitrogen balance calculations. Support Line17(3): 7-10, 1995.
Cornblath M and Schwartz R. Disorders of Carbohydrate Metabolism in Infancy. Philadelphia PA. WBSaunders, 1966.
Ekvall S, ed. Pediatric Nutrition in Chronic Diseases and Developmental Disorders, New York, NY. OxfordPress, 2005.
Hammond K. Physical assessment. A nutritional perspective. Nurs Clin North Amer 32: 779-790, 1997.Hendricks K and Walker WA. Manual of Pediatric Nutrition, 2nd ed. Philadelphia PA. BC Decker, Inc., 2000.Herbert V. Everyone should be tested for iron disorders. JADA 92(12): 1502-1509, 1992.Kelly M, Kight M, et al. A diagnostically reasoned case study with particular emphasis on B6 and zinc
imbalance directed by clinical history and nutrition physical examination findings. Nutr in Clin Prac13: 1-3, 1998.
Maldonado J, Faus MJ, Bayes R, et al. Apparent nitrogen balance and 3-methylhistidine urinary excretionin intravenously fed children with trauma and infections. Eur J Clin Nutr 42: 93-100, 1988.
Neuvonen P and Kivis K. The clinical significance of food-drug interactions: a review. Med J Aust 150: 36-40, 1989.
Roza AM, et al. Transferrin — a poor measure of nutritional status. JPEN 8(5): 523-528, 1984.Russell M. Serum proteins and nitrogen balance: Evaluating response to nutrition support. Support Line
17(1): 3-8, 1995.Viteri and Alvarado J. The creatinine height index: Its use in the estimation of the degree of protein
depletion and repletion in protein calorie malnourished children. Pediatrics 46: 696, 1970.

48Clinical Pediatric Nutrition
Notes

49Clinical Pediatric Nutrition
Chapter Five:Estimation of Nutritional Needs
To achieve optimal growth and development, children must receive sufficientquantities of protein, carbohydrates, fat, fluids, vitamins and minerals. The energycreated from the breakdown of these nutrients provides the fuel needed to perform thebody’s basic metabolic processes to build tissue for growth and to carry out activities.
The Recommended Dietary Allowances (RDA), published by the RecommendedDietary Allowances of the National Academy of Sciences National Research Council, are‘the levels of intake of essential nutrients that, on the basis of scientific knowledge, arejudged to be adequate to meet the known nutrient needs of practically all healthypersons.’ (Recommended Dietary Allowances, 10th Ed, 1989). The RDA has been ex-panded and replaced by the Dietary Reference Intakes (DRI). The DRI contain fourcategories of recommendations: nutrient reference values (RDA), adequate intakes (AI),estimated average requirements (EAR), and tolerable upper intake levels (UL). The DRIprovide a more comprehensive approach in assessing intakes of individuals and groups(see Appendix #11).
This chapter will cover energy requirements as well as macro- and micronutrientneeds for the typically growing and gaining infant and child.
ENERGY
Total energy utilization reflects basic metabolic needs, activity and growth energyexpenditure plus the needs for digestion, absorption and metabolism of foods. Manyvariables influence a child’s energy needs, such as body size and composition, age, sex,rate of growth, physical activity, genetic factors, coexisting pathologic conditions andambient temperature.
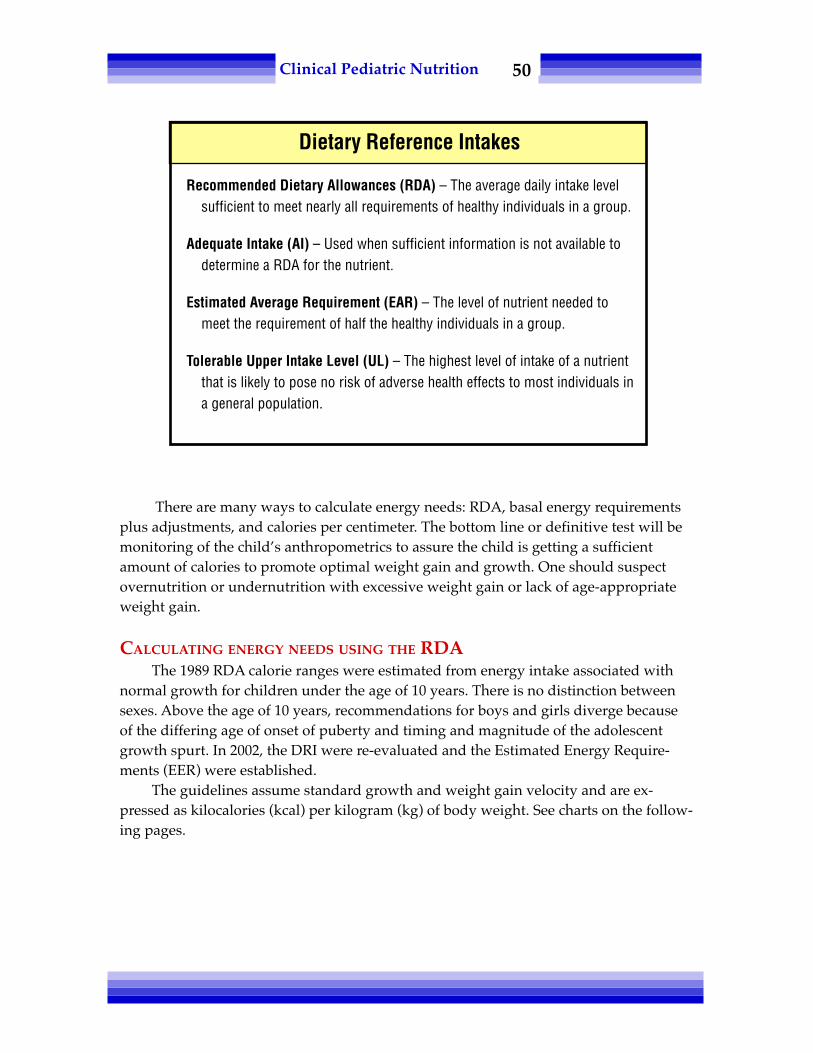
50Clinical Pediatric Nutrition
There are many ways to calculate energy needs: RDA, basal energy requirementsplus adjustments, and calories per centimeter. The bottom line or definitive test will bemonitoring of the child’s anthropometrics to assure the child is getting a sufficientamount of calories to promote optimal weight gain and growth. One should suspectovernutrition or undernutrition with excessive weight gain or lack of age-appropriateweight gain.
CALCULATING ENERGY NEEDS USING THE RDAThe 1989 RDA calorie ranges were estimated from energy intake associated with
normal growth for children under the age of 10 years. There is no distinction betweensexes. Above the age of 10 years, recommendations for boys and girls diverge becauseof the differing age of onset of puberty and timing and magnitude of the adolescentgrowth spurt. In 2002, the DRI were re-evaluated and the Estimated Energy Require-ments (EER) were established.
The guidelines assume standard growth and weight gain velocity and are ex-pressed as kilocalories (kcal) per kilogram (kg) of body weight. See charts on the follow-ing pages.
Dietary Reference Intakes
Recommended Dietary Allowances (RDA) – The average daily intake levelsufficient to meet nearly all requirements of healthy individuals in a group.
Adequate Intake (AI) – Used when sufficient information is not available todetermine a RDA for the nutrient.
Estimated Average Requirement (EAR) – The level of nutrient needed tomeet the requirement of half the healthy individuals in a group.
Tolerable Upper Intake Level (UL) – The highest level of intake of a nutrientthat is likely to pose no risk of adverse health effects to most individuals ina general population.

51Clinical Pediatric Nutrition
Energy Guidelines
Childrenage (yrs) kcal/kg
0-0.5 1080.5-1 981-3 1024-6 90
7-10 70
Femalesage (yrs) kcal/kg
11-14 4715-18 4019-24 38
Malesage (yrs) kcal/kg
11-14 5515-18 4519-24 40
Adapted from the Recommended Dietary Allowances, 1989
Estimated Energy Requirements (EER)
Age Sex EER (Kcal/day)
0-3 months Male or female (89 x weight) + 75
4-6 months Male or female (89 x weight) – 44
7-12 months Male or female (89 x weight) – 78
13-35 months Male or female (89 x weight) – 80
3-8 years Male 108.5 – (61.9 x age) + PA x (26.7 xweight + 903 x height)
3-8 years Female 155.3 – (30.8 x age) + PA x (10.0 xweight + 934 x height)
9-18 years Male 113.5 – (61.9 x age) + PA x (26.7 xweight + 903 x height)
9-18 years Female 160.3 – 30.8 x age + PA x (10.0 xweight + 934 x height)
≥19 years Male 662 – (9.53 x age) + PA x [(15.91 xweight) + (539.6 x height)}
≥19 years Female 354 – (6.91 x age) + PA x [(9.36 xweight) + (726 x height)]
Abbreviations: PA, physical activity coefficient (see following page).*In calculations, measure age in years, weight in kilograms and height in meters
Source: Food and Nutrition Board
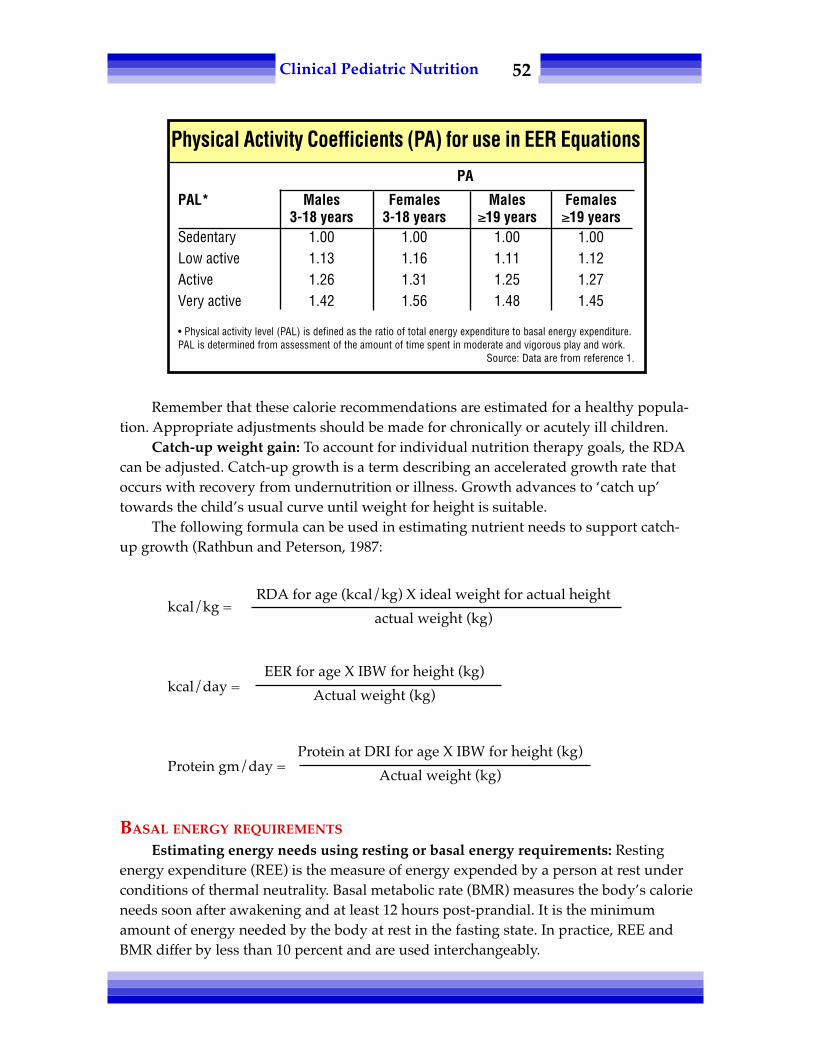
52Clinical Pediatric Nutrition
Remember that these calorie recommendations are estimated for a healthy popula-tion. Appropriate adjustments should be made for chronically or acutely ill children.
Catch-up weight gain: To account for individual nutrition therapy goals, the RDAcan be adjusted. Catch-up growth is a term describing an accelerated growth rate thatoccurs with recovery from undernutrition or illness. Growth advances to ‘catch up’towards the child’s usual curve until weight for height is suitable.
The following formula can be used in estimating nutrient needs to support catch-up growth (Rathbun and Peterson, 1987:
kcal/kg =
kcal/day =
Protein gm/day =
BASAL ENERGY REQUIREMENTS
Estimating energy needs using resting or basal energy requirements: Restingenergy expenditure (REE) is the measure of energy expended by a person at rest underconditions of thermal neutrality. Basal metabolic rate (BMR) measures the body’s calorieneeds soon after awakening and at least 12 hours post-prandial. It is the minimumamount of energy needed by the body at rest in the fasting state. In practice, REE andBMR differ by less than 10 percent and are used interchangeably.
RDA for age (kcal/kg) X ideal weight for actual height
actual weight (kg)
EER for age X IBW for height (kg)
Actual weight (kg)
Protein at DRI for age X IBW for height (kg)
Actual weight (kg)
Physical Activity Coefficients (PA) for use in EER Equations
PA
PAL* Males Females Males Females3-18 years 3-18 years ≥19 years ≥19 years
Sedentary 1.00 1.00 1.00 1.00Low active 1.13 1.16 1.11 1.12Active 1.26 1.31 1.25 1.27Very active 1.42 1.56 1.48 1.45
• Physical activity level (PAL) is defined as the ratio of total energy expenditure to basal energy expenditure.PAL is determined from assessment of the amount of time spent in moderate and vigorous play and work.
Source: Data are from reference 1.

53Clinical Pediatric Nutrition
There are many calculations that estimate basal energy needs. Following are threedifferent methods for calculating basal needs. The WHO equation estimates REE anduses weight, sex and age; the Harris-Benedict equation uses weight, height, sex and age,but is valid only for persons above 18 years of age (Frankenfield, et al., 1998). Theschofield equation uses weight, height, sex and age. The Schofield equation is mostaccurate in predicting REE of obese children and adolescents. See below.
ADJUSTMENT OF BASAL ENERGY NEEDS
Daily caloric and nutrient requirements are usually greater than basal. Total dailyenergy needs include adjustments to account for physical activity, thermic effect offoods, stress/disease-related factors and goals of therapy, such as weight gain or loss.
Schofield Height-Weight Equation for Estimating REE for Various Pediatric Ages
Male:0 - 3 yrs 0.167 weight + 1517.4 height – 617.63 - 10 yrs 19.59 weight + 130.3 height – 414.910 - 18 yrs 16.25 weight + 137.2 height – 515.5
Female:0 - 3 yrs 16.252 weight + 1023.2 height – 413.53 - 10 yrs 16.969 weight + 161.8 height – 371.210 - 18 yrs 8.365 weight + 465 height – 200
Schofield WN. Predicting basal metabolic rate, new standards and review of previous work.Hum Nutr 39C (suppl 1): 5-42, 1985.
Age (yrs) Males Females
0-3 (60.9 x wt in kg) - 54 (61.0 x wt in kg) - 513-10 (22.7 x wt in kg) + 495 (22.5 x wt in kg) + 499
10-18 (17.5 x wt in kg) + 651 (12.2 x wt in kg) + 746Source: World Health Organization. Energy and Protein Requirements. Report of a joint FAQ/WHO/UNU
Expert Consultation, WHO Geneva, Technical Report Series 724, 206, 1985.
WHO Equation (REE)
Methods of Predicting Energy Expenditure
Harris-Benedict Equation (BEE)
Men: 66 + (13.7 X actual wt in kg) + (5 X ht in cm) - (6.8 X age in yrs)
Women: 655 + (9.6 X actual wt in kg) + (1.7 X ht in cm) - (4.7 X age in yrs)

54Clinical Pediatric Nutrition
• Adjustment for activity should reflect the usual activity level of the child. If apatient is receiving mechanical ventilation, receiving sedation, and on paralytics, REE x1.0 to 1.2 is generally sufficient to meet a child's energy needs. In other cases, one canapply the following activity to factors to the REE:
Bed rest: + 10 percentLight activity: + 30 percentModerate activity: + 50 percentHeavy activity: + 75 percent
• Adjustment for the thermic effect of food: Specific dynamic action of foods or(i.e. thermogenesis) is the energy expended to absorb and metabolize foods. It is rela-tively small in relation to basal or physical energy expenditure and accounts for onlyapproximately 10 percent of energy.
• Adjustment for illness: Energy needs are increased by demands imposed on thebody by chronic illness, prematurity, surgical procedures, fever, wound healing, etc.Estimated adjustments to the BMR anticipated for patients with general or specificconditions are shown below (Hendricks, 2000):
Long bone fracture + 14 to 32 percentPeritonitis + 5 to 25 percentSurgery 1.05 to 1.5 x REESepsis 1.2 to 1.6 x REEClosed head injury 1.3 x REETrauma 1.1 to 1.8 x REEGrowth failure 1.5 to 2.0 x REEBurn 1.5 to 2.5 x REEStarvation 0.7 to 0.85 x REE
Example of the energy cost breakdown for a healthy, growing term infant.
Energy costs kcal/kg
resting energy expenditure 40-60activity 15-25thermic effect of food 10fecal losses of calories 5*growth 20
total 90-120
*For infants, the average cost of growth is 5 kcal/gm of tissue gain(Roberts, 1988)
Energy Breakdown
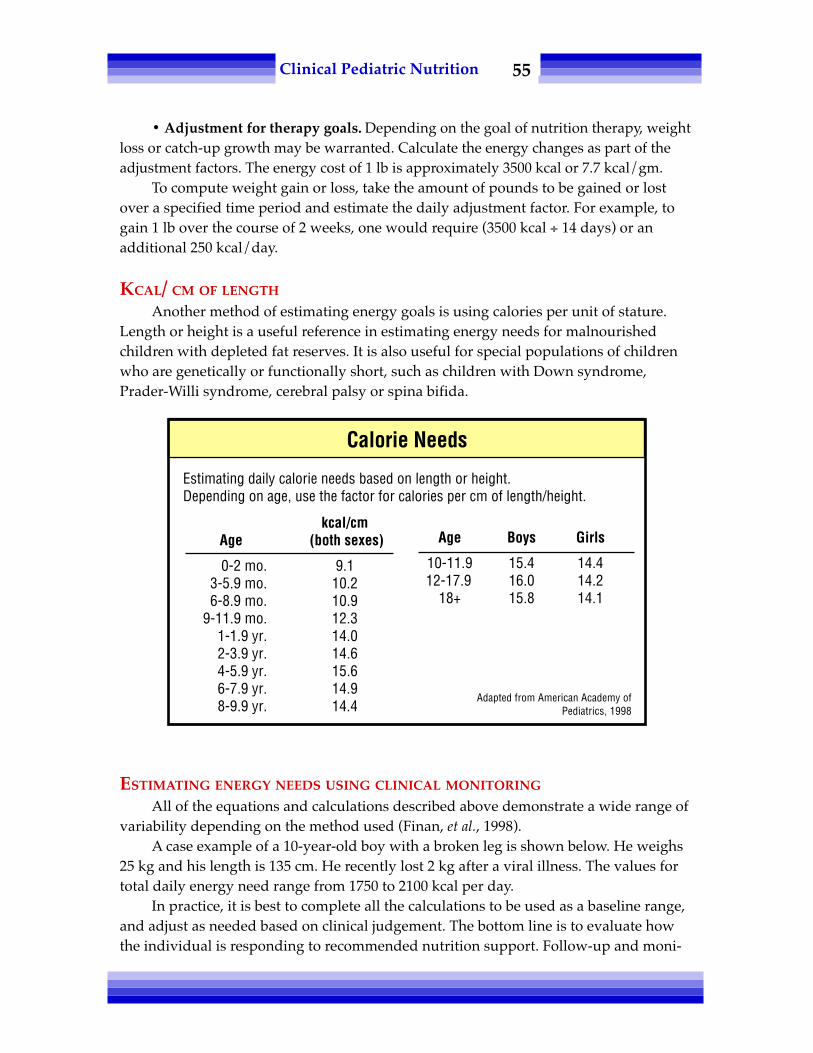
55Clinical Pediatric Nutrition
• Adjustment for therapy goals. Depending on the goal of nutrition therapy, weightloss or catch-up growth may be warranted. Calculate the energy changes as part of theadjustment factors. The energy cost of 1 lb is approximately 3500 kcal or 7.7 kcal/gm.
To compute weight gain or loss, take the amount of pounds to be gained or lostover a specified time period and estimate the daily adjustment factor. For example, togain 1 lb over the course of 2 weeks, one would require (3500 kcal ÷ 14 days) or anadditional 250 kcal/day.
KCAL/ CM OF LENGTH
Another method of estimating energy goals is using calories per unit of stature.Length or height is a useful reference in estimating energy needs for malnourishedchildren with depleted fat reserves. It is also useful for special populations of childrenwho are genetically or functionally short, such as children with Down syndrome,Prader-Willi syndrome, cerebral palsy or spina bifida.
ESTIMATING ENERGY NEEDS USING CLINICAL MONITORING
All of the equations and calculations described above demonstrate a wide range ofvariability depending on the method used (Finan, et al., 1998).
A case example of a 10-year-old boy with a broken leg is shown below. He weighs25 kg and his length is 135 cm. He recently lost 2 kg after a viral illness. The values fortotal daily energy need range from 1750 to 2100 kcal per day.
In practice, it is best to complete all the calculations to be used as a baseline range,and adjust as needed based on clinical judgement. The bottom line is to evaluate howthe individual is responding to recommended nutrition support. Follow-up and moni-
Estimating daily calorie needs based on length or height.Depending on age, use the factor for calories per cm of length/height.
kcal/cmAge (both sexes)
0-2 mo. 9.13-5.9 mo. 10.26-8.9 mo. 10.9
9-11.9 mo. 12.31-1.9 yr. 14.02-3.9 yr. 14.64-5.9 yr. 15.66-7.9 yr. 14.98-9.9 yr. 14.4
Age Boys Girls
10-11.9 15.4 14.412-17.9 16.0 14.2
18+ 15.8 14.1
Adapted from American Academy ofPediatrics, 1998
Calorie Needs

56Clinical Pediatric Nutrition
toring are key to assuring that the calculated energy figures are appropriate for thisparticular individual. Is satisfactory weight gain or repletion of energy reserves beingdocumented by sequential weights?
PROTEIN
Dietary protein provides the essential amino acids needed to synthesize and repairtissue. Requirements are higher in infancy and decrease per body size as the individualgrows. Recommendations for protein intake assume an adequate energy intake. Ifcalories are deficient for the body’s needs, protein will be broken down and utilized forenergy. In most instances, it is appropriate to base daily protein needs on actual weight.In cases where catch-up growth is warranted, one should base daily protein require-ments on ideal, not actual weight.
The protein RDA for infants and children were based on sparse data from nitrogenbalance studies and on observed and theoretical needs for growth. This theoreticalvalue was then increased by 50 percent to represent the unevenness of daily growth rateand the inability of infants and children to store amino acids against intermittent needsand also adjusted for the efficiency of utilization, estimated at 70 percent. The tablebelow describes age-dependent daily requirements as grams of protein per kilogram.
Adjust levels for specific conditions. Increase recommendations for protein-losingenteropathies, wound healing, etc; decrease for a child with protein restrictions, such asone with a metabolic disorder. The DRI for protein were released in 2002, and reflect a
Case Example: 10-year-old Boy
Daily kcalMethod Calculation estimate
RDA 25 kg X 70 kcal/kg 1750RDA with catch-up 27 kg (ideal weight) X 70 kcal/kg
÷ 25 kg = 75.6 kcal/kg
25 kg X 75.6 kcal/kg 1890
REE/BMR WHO (17.5 X 25 kg)+ 651= 1088 + adjustments 2099 Harris-Benedict N/A
Adjustments: +10% activity factor for bed rest+50% for healing long bone fracture+10% for thermic effect of foods+250 kcal for weight gain
Kcal/cm length 15.4 kcal/cm X 135 cm 2079

57Clinical Pediatric Nutrition
decreased protein intake for most age ranges. See the following page for a comparisonof the 1989 RDA and the 2002 DRI for protein for infants and children.
FAT
Fats provide a concentrated source of energy and are important in the diet ofinfants and toddlers. First of all, small amounts of essential fatty acids must be presentin the diet to maintain health as humans cannot synthesize the essential fatty acids,linoleic and linolenic acid. Essential fatty acids need to provide at a minimum 4 to 5percent of caloric intake (3 to 3.5 percent kcal form linoleic acid; 1 to 1.5 kcal fromlinolenic acid).
Secondly, fats provide a concentrated source of energy to infants and childrenwhose energy needs per body size are greatest. Fats usually supply between 40 to 50percent of the energy needs of an infant or toddler. The percentage of calories shoulddecrease to between 30 and 40 percent as the child gets older.
Age-dependent RDA of Daily Protein Requirements
Age(yrs) gm Pro/kg
0-0.5 2.20.5-1 1.61-3 1.24-6 1.1
7-10 1.0
MaleAge (yrs) gm Pro/kg
11-14 1.015-18 0.919-24 0.8
FemaleAge (yrs) gm Pro/kg
11-14 1.015-18 0.819-24 0.8
Adapted from the Recommended Dietary Allowances, 1989.
2002 DRI for Protein
0-6 months 1.52 (AI)7-12 months 1.2 (RDA)1-3 years 1.05 (RDA)4-8 years 0.95 (RDA)9-13 years 0.95 (RDA)14-18 years 0.85 (RDA)
AI = Adeqiuate intake (Based on observed or experimentally determined approximations of the nutrientintake by a defined population or subgroup that appear to sustain a defined nutritional state. Used as a
guide to nutrient intake for the individual)RDA = Recommended Dietary Allowance

58Clinical Pediatric Nutrition
CARBOHYDRATES
Relatively little carbohydrate is needed in the diet because glucose, the basicbuilding structure of carbohydrates, can be synthesized from protein and/or fat. Noabsolute requirements have been established; however, minimal amounts are essentialfor basic metabolic function. Minimum requirements of 50 to 100 gm per day preventaccelerated breakdown of dietary and tissue protein, loss of cations and dehydration(Recommended Dietary Allowances, 1989). Recommended intake is 40 to 60 percent oftotal calories.
Dietary fiber is important in the diet of children to normalize bowel function andprevent disease such as coronary heart disease and obesity. Recommended intake is 0.5gm per kilogram up to a maximum of 35 gm/day (American Academy of Pediatrics,1998). Another method utilized in practice is the "rule of thumb:" 5 gm/day + 1 gm/year of life.
VITAMINS AND MINERALS
Vitamins and minerals are fundamental cofactors in enzymatic reactions and aresignificant in a variety of other metabolic functions. See Appendix #11 for DRI. TheRDA and AI are based on nutrient balance studies, epidemiological observations,biochemical measures and extrapolation from animal data. They have then been ad-justed to account for absorption variability, incomplete utilization, variations among thepopulation and bioavailability in the food supply. Vitamin and mineral goals for theindividual should be based on this information and adjusted for specific confoundingconditions, such as malabsorption or nutrient-drug interactions.
Traditionally, the 2002 DRI have been established for essential nutrients onlywhen data are sufficient to make reliable recommendations. Safe and adequate intakesfor nutrients have now also been established for nutrients with data insufficient fordeveloping an RDA, but for which potentially tolerable upper limits (TUL) are known.Base vitamin and mineral requirements on the DRI for the healthy population, butadjust for specific confounding conditions, such as malabsorption, nutrient-druginteractions or wounds.
In October 2008, the American Academy of Pediatrics issued updated guidelinesfor vitamin D intake. The new recommendations call for a daily intake of 400 IU vitaminD for all infants in the first few days of life. A lengthy article in Pediatrics details therecommendations (Wagner, Greer 2008).
OTHER SUBSTANCES IN FOOD
Many substances naturally present in foods have yet to be identified, let alonefound to be essential for general health, growth and development. Many substances ofplant and animal origin contain inorganic and organic compounds that have no cur-rently explainable nutritional benefit.

59Clinical Pediatric Nutrition
Flavonoids, choline, taurine and carnitine, myoinositol, and some trace elementssuch as arsenic, nickel, silicon and boron are little understood. Cobalt, lead, cadmium,lithium, tin and vanadium deficiencies in animals have demonstrated depressed growthalthough no correlative evidence has been found in humans.
These nutrients may or may not be essential in the normal diet for a healthy indi-vidual, but children with chronic illnesses who are on restricted diets or polydrug therapyare at high risk of developing problems associated with multiple nutrient deficiencies.
FLUID
Water is essential for metabolic needs, even more so than food. Water is part of thebasic cellular structure and acts as a solvent for physiologic compounds. The percentageof water in a body is greatest in infancy and declines with growth. Maintenance fluidrequirements can be estimated using the following calculations: 100 mL/kg for the first10 kg, 50 mL/kg for the second 10 kg and 20 mL/kg for every kg over 20 kg.
Infants need a minimum of 1.5 mL of water per calorie, and to estimate fluidrequirements for an adolescent or young adult, one may also choose to base this calcula-tion on energy consumption: 1 mLof water per calorie consumed. For children, use bothestimations and use clinical judgement on free water needs, depending on conditionscausing an increased need or restriction, such as fever or cardiac disease respectively.
Sometimes, new information can dramatically alter our nutritional assessment.Returning to the case of the 10-year-old boy referred to earlier, see how new informationon activity and drug history changes recommendations.
Modified Case Study: 10-year-old Boy
Previous data: fractured leg, 2 kg weight loss associated with viral illness
New information: seizure disorder, has never been ambulatory, onphenobarbital for the past 9 years
Energy (adjusted for catch-up growth): 1750 to 2100 kcal/day
Protein (based on RDA): 1 gm Pro/kg ideal weight = 27 gm Pro/ day
Fluids: 1600 to 2100 cc per day.– Based on current weight of 25 kg = 1600 cc of free water/day.
Vitamins & minerals:– Estimate according to DRI. Provide additional Vitamin D,
calcium, phosphorus and folic acid.– Monitor baseline and follow-up biochemical indices and diet
to assess supplementation needs.
Note: This child's leg fracture could be a result of poor bone mineralizationdue to medications and non-ambulatory status.

60Clinical Pediatric Nutrition
SUMMARY
Although there are standards for the estimation of nutrient requirements forchildren, each infant or child requires an individualized evaluation. For the typicallygrowing and eating child, following these parameters will closely estimate nutritionalneeds. For a chronically ill child or one with special needs, estimate requirementsindividually by assessing all conditions affecting nutrition. Overall, monitor growth andhealth status to assure that the goals of nutritional therapy are met.
REFERENCES
Altman P and Dittmer D. Metabolism. Bethesda MD. FASEB, 1968.__________ American Academy of Pediatrics: Committee on Nutrition. Pediatric Nutrition Handbook, AAP,
1998.__________ Institute of Medicine, Food and Nutrition Board. Dietary Reference Intakes: Recommended Intakes
for Individuals. National Academies http://www.nal.usda.gov/fnic__________ Institute of Medicine, Food and Nutrition Board. Dietary Reference Intakes for Energy, Carbohy-
drate, Fiber, Fat, Fatty Acids, Cholesterol, Protein and Amino Acids (Macronutrients). National AcademiesPress, 2005
Finan K, Larson E, et al. Cross-validation of prediction equations for resting energy expenditures in young,healthy children. JADA 97: 140-145, 1998.
Frankenfield D, Muth E, et al. The Harris-Benedict studies of human basal metabolism: History andlimitations. JADA 98: 439-445, 1998.
Gartner L, Greer F. Section on Breastfeeding and Committee on Nutrition. Prevention of rickets andvitamin D deficiency: New guidelines for vitamin D intake. Pediatrics 111(4): 908-910, 2003.
Hendricks K, Duggan C, Walker WA. Manual of Pediatric Nutrition. WB Saunders, Philadelphia PA, 2000.__________ Institute of Medicine. Dietary Reference Intakes for Energy, Carbohydrate, Fiber, Fat, Fatty Acids,
Cholesterol, Protein and Amino Acids (Macronutrients). National Academies Press, 2005.Kaplan AS, et al. Resting energy expenditure in clinical pediatrics: measured versus prediction equations. J
Pediatr 127(2): 200-205, 1995.New Guidelines Double the Amount of Recommended Vitamin D, American Academy of Pediatrics.
Accessed Oct. 13, 2008. Available at: www.aap.org/pressroom/nce/nce08vitaminD.htmRathbun JM, Peterson KE. Nutrition in failure to thrive. In: Grand RJ, Sutphen JL, Dietz WH (Ed). Pediatric
Nutrition. Boston MA: Butterworths, 1987.__________ Recommended Dietary Allowances, National Research Council Recommended Dietary Allowances,
10th edition. National Academy Press, 1989.Roberts S and Young V. Energy costs of fat and protein deposition in the human infant. Am J Clin Nutr 48:
951-955, 1988.Schofield W. Predicting basal metabolic rate, new standards and review of previous work. Hum Nutr Clin
Nutr 39(1s): 5-42, 1985.Trumbo P, Yates, A, Schlicker S, Poos M. Dietary Reference Intakes JADA 101(3): 294-301, 2001.Wagner CL, Greer FR. Prevention of rickets and vitamin D deficiency in infants, children, and adolescents.
American Academy of Pediatrics Section on Breastfeeding; American Academy of PediatricsCommittee on Nutrition. Pediatrics. 2008 Nov;122(5):1142-52.

61Clinical Pediatric Nutrition
Chapter Six:Nutrition Care Plans, Formulas,
Food & Dietary Counseling
The Nutrition Care Process and Model (NCPM) is a "systematic problem-solvingmethod that food and nutrition professionals use to think critically and make decisionsthat address practice-related problems" (Lacey and Pritchett, 2003). There are four majorsteps in the NCP:
• Nutrition assessment and re-assessment• Nutrition diagnosis• Nutrition intervention• Nutrition monitoring and evaluation
A full description of the NCPM is beyond the scope of this chapter, but additionalinformation can be found in the following:
Writing Group of the Nutrition Care Process/Standardized Language Committee.Nutrition care process and model, Part I: The 2008 update. J Am Diet Assoc108(7): 1113-1117, 2008.
Nutrition Care Process modules: Go to www.eatright.org > Sign in under "MyADA" (left hand column) > Click on "Nutrition Care Process" (left-hand column)> Click on "Practitioner" > Click on "Nutrition Care Process Tutorial Modules"(right-hand column).
The general goal for all children is to promote optimal growth and development.Objectives to meet the goals are driven by the child’s illness and condition, such as nor-malizing biochemical indices or weight gain to achieve age-appropriate growth velocity.In the following chapters, goals of therapy will be discussed for various conditions.
This chapter will address formulas, foods and dietary counseling for the pediatricpopulation.

62Clinical Pediatric Nutrition
• Breast milk. The ideal diet regimen for infants is human milk. It contains all ofthe nutrients needed to meet the nutritional and physiological needs of the developingand growing infant for the first six months of life, in addition to its unique immunologi-cal protective factors. Breast milk is known to be a rich source of both docosahexaenoicacid (DHA) and arachidonic acid (ARA). Both DHA and ARA are long-chain polyun-saturated fatty acids (PUFA). DHA and ARA play a role in brain and eye development.
An issue at the forefront present is the fortification of formulas with DHA andARA. In 2002, formula manufacturers started fortifying infant formulas with DHA andARA with the intention of creating infant formulas that more closely modeled thenutrient profile of breast milk. ARA is derived from the essential fatty acid alpha-linoleic acid, and DHA is derived from the essential fatty acid linolenic acid. Mostinfants can endogenously create DHA and ARA if they have adequate intake of essentialfatty acids (i.e. linoleic and alpha-linolenic acids). However, some studies suggest thatinfants, particularly premature infants, have improved visual function and neuraldevelopment with direct consumption of DHA and ARA (Auestad, 2003). Other studieshave revealed that fortification is of no benefit (Fleith, 2005; Simmer, 2008).
The optimum fortification levels for DHA and ARA are unclear. According to theAmerican Academy of Pediatrics, expert panels from Life Sciences Research Office, Inc.recommend neither a minimum nor a maximum in preterm formulas of 0.35 and 0.60percent total fatty-acid intake for DHA and ARA, respectively (http://aapnews.aappublications.org/cgi/content/full/20/5/209).
Manufacturers have focused on two guidelines in deciding much to fortify theirformulas: levels found in breast milk of American women, and levels found in breastmilk internationally (i.e. WHO statistics).
Interestingly, the FDA expects infant formula manufacturers to conduct studies andto follow-up with post-marketing surveillance to monitor formulas containing DHAand ARA. DHA and ARA are considered to be "generally regarded as safe" food addi-tives, but long-term effects of their consumption is not known. The Cornucopia Insti-tute, a Wisconsin-based group that typically represents the interests of small farm-holders, has called on the USDA to enforce a prohibition on hexane-extracted ingredi-ents in organic produce. In April 2008, Cornucopia filed a legal complaint accusing theUnited States Department of Agriculture (USDA) of not looking out for the public's bestinterests because the USDA was not planning to pursue banning the addition of DHAand ARA to foods and infant formulas. Cornucopia has filed other complaints with theFederal Drug Administration (FDA) and the Federal Trade Commission (FTC).
Studies have shown a decreased incidence of necrotizing enterocolitis (NEC) whenhuman milk is administered as compared with formula, and this is of particular impor-tance when discussing the preterm infant population because of their increased predis-position to develop NEC (Lucas, 1990; Gregory, 2005). Maternal breast milk has alsobeen shown to decrease the incidence of diarrhea, and protect against childhood obesity,Crohn's disease, lymphoma, leukemia and diabetes (Gregory, 2005). In addition, gastricemptying is faster, and tolerance is better, with human milk (Yu, 2005).

63Clinical Pediatric Nutrition
O'Connor, et al. (2003) reported that infants consuming "appreciable" amounts ofbreast milk demonstrated higher Teller visual acuity scores at 2 and 6 months correctedage, and experienced fewer serious adverse events (e.g. readmission to hospital) ascompared to infants who received primarily formula.
Some mothers won't or can't provide breast milk for their infant. Although feedingpasteurized donor breast milk has not been studied as extensively as feeding themother's own milk, donor milk can provide many of the unique components andbenefits of human milk, while eliminating the risk of transmission of infectious agents."Pasteurization does affect some of the nutritional and immunologic components ofhuman milk, but many immunoglobulins, enzymes, hormones, and growth factors areunchanged or minimally decreased" (Wright, 2001).
If infants are not gaining weight well, many clinicians recommend that the motherpump her breast milk and separate her hind milk from the remainder of her breast milk.Hind milk has a higher caloric value due to its high fat content; Saarela, et al. (2005)revealed that hind milk was 25 to 35 kcal/100 mL, versus an average 20 kcal/oz concen-tration of breast milk. The mother can collect her hind milk by pumping about half ofher usual pumping time and then switching to a new collection container to obtain thelast half of her pumped breast milk. Some clinicians feel that the infant will not obtainadequate protein if this method is followed for a lengthy period of time. However,Saarela, et al. (2005) reported no statistically significant difference.
In donor and preterm milk, the protein content declined consistently from 2.0 gm/100 mL at 1 week of life to 1.0 gm/100 mL at 6 months, observed in fore-milk as well ashind milk. There were no significant changes in lactose content between the groups, orat any point during the mother's duration of lactation. The fat content was highest inhind milk, and was measured at two- to threefold of the amount of foremilk.
Efforts to promote breast-feeding, given its enormous psychological and economicbenefits, should be sustained and strengthened (JADA, 1997). Breast-feeding is recom-mended for the first year of life or longer. The American Academy of Pediatrics PolicyStatement says that:
Human milk is the preferred feeding for all infants, including prematureand sick newborns, with rare exceptions. When direct breast-feeding is notpossible, expressed human milk, fortified when necessary for the prema-ture infant, should be provided. Before advising against breast-feeding orrecommending premature weaning, the practitioner should weigh thought-fully the benefits of breast-feeding against the risks of not receiving humanmilk (AAP, 1997).
The Baby-Friendly Hospital Initiative was launched in 1991 by UNICEF and theWorld Health Organization to ensure that all maternities provide breast-feeding sup-port. In order to be designated a "baby-friendly" facility, the hospital must not acceptfree or low-cost formula, feeding bottles or nipples, and must implement the steps tosupport successful breastfeeding shown in the chart on the next page.

64Clinical Pediatric Nutrition
• Human milk fortifiers. Human milk fortifiers (HMF) are additives designedspecifically to augment nutrients in breast milk for premature babies. Unfortified hu-man milk does not contain sufficient nutrients for the infant born extremely premature,between 23 and 34 weeks gestation (Adler and Groh-Wargo, 2007). The exclusive feed-ing of unfortified breast milk in premature infants has been associated with poorgrowth velocity and nutritional deficits (Kashyap, 1990). Preterm human milk providesinadequate protein, sodium, calcium and phosphate to meet the needs of the prematureinfant (Schanler, 2001).
Human milk fortifiers provide additional protein, energy, calcium, phosphorus andother minerals needed for rapid growth. Studies have demonstrated that human milkenriched with HMF is ideal for replicating intrauterine growth and mineral retention inpreterm babies (Schanler, et al., 1999; Kuschel, 2004). These commercial fortifiers are notintended to be a sole source of nutrition, but are given in addition to human milk. A2004 meta-analysis (Kuschel) concluded that infants receiving fortified human milk:
• demonstrated greater short-term weight and length gain and head growth;• showed no significantly increased risk of NEC;• showed no statistically significant difference in mean serum alkaline phos-
phatase and bone mineral content values; and• no long-term advantage in growth or neuro-developmental outcomes.
• Have a written breastfeeding policy that is routinely communicated toall health care staff.
• Train all health care staff in skills necessary to implement this policy.• Inform all pregnant women about the benefits and management of
breastfeeding.• Help mothers initiate breastfeeding within one half-hour of birth• Show mothers how to breastfeed and maintain lactation, even if they
should be separated from their infants.• Give newborn infants no food or drink other than breast milk, unless
medically indicated.• Practice rooming in – that is, allow mothers and infants to remain
together 24 hours/day.• Encourage breastfeeding on demand.• Give no artificial teats or pacifiers (also called dummies or soothers) to
breastfeeding infants.• Foster the establishment of breastfeeding support groups and refer
mothers to them on discharge from the hospital or clinic.
For more information on the Baby-Friendly Hospital Initiative, go to:http://www.unicef.org/programme/breastfeeding/baby.htm#10
Baby-Friendly Hospital Iniative - Steps for Hospitals
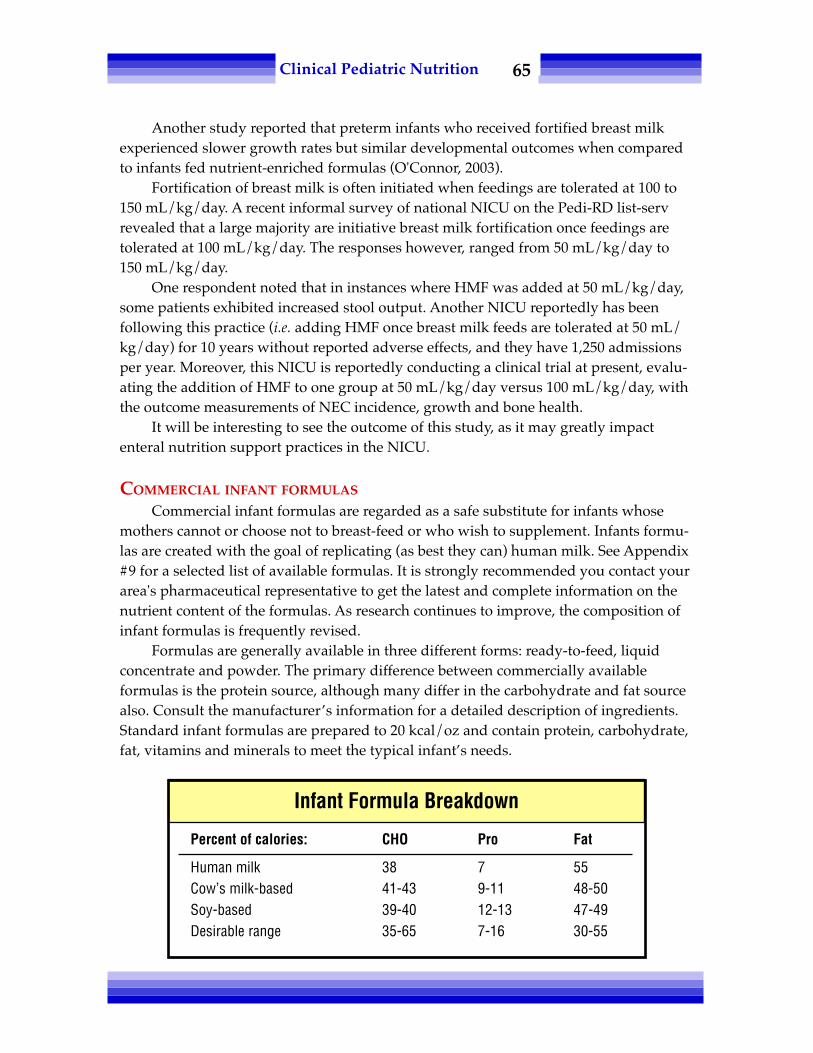
65Clinical Pediatric Nutrition
Another study reported that preterm infants who received fortified breast milkexperienced slower growth rates but similar developmental outcomes when comparedto infants fed nutrient-enriched formulas (O'Connor, 2003).
Fortification of breast milk is often initiated when feedings are tolerated at 100 to150 mL/kg/day. A recent informal survey of national NICU on the Pedi-RD list-servrevealed that a large majority are initiative breast milk fortification once feedings aretolerated at 100 mL/kg/day. The responses however, ranged from 50 mL/kg/day to150 mL/kg/day.
One respondent noted that in instances where HMF was added at 50 mL/kg/day,some patients exhibited increased stool output. Another NICU reportedly has beenfollowing this practice (i.e. adding HMF once breast milk feeds are tolerated at 50 mL/kg/day) for 10 years without reported adverse effects, and they have 1,250 admissionsper year. Moreover, this NICU is reportedly conducting a clinical trial at present, evalu-ating the addition of HMF to one group at 50 mL/kg/day versus 100 mL/kg/day, withthe outcome measurements of NEC incidence, growth and bone health.
It will be interesting to see the outcome of this study, as it may greatly impactenteral nutrition support practices in the NICU.
COMMERCIAL INFANT FORMULAS
Commercial infant formulas are regarded as a safe substitute for infants whosemothers cannot or choose not to breast-feed or who wish to supplement. Infants formu-las are created with the goal of replicating (as best they can) human milk. See Appendix#9 for a selected list of available formulas. It is strongly recommended you contact yourarea's pharmaceutical representative to get the latest and complete information on thenutrient content of the formulas. As research continues to improve, the composition ofinfant formulas is frequently revised.
Formulas are generally available in three different forms: ready-to-feed, liquidconcentrate and powder. The primary difference between commercially availableformulas is the protein source, although many differ in the carbohydrate and fat sourcealso. Consult the manufacturer’s information for a detailed description of ingredients.Standard infant formulas are prepared to 20 kcal/oz and contain protein, carbohydrate,fat, vitamins and minerals to meet the typical infant’s needs.
Percent of calories: CHO Pro Fat
Human milk 38 7 55Cow’s milk-based 41-43 9-11 48-50Soy-based 39-40 12-13 47-49Desirable range 35-65 7-16 30-55
Infant Formula Breakdown

66Clinical Pediatric Nutrition
• Cow’s milk-based formulas are the formula of choice for the formula-fed infant.Cow’s milk protein is different from human milk in the whey: casein ratio and type ofwhey protein. However, some formulas have altered the cow’s milk protein to moreclosely mimic human milk protein. The fat content will also vary among manufacturersand can be significant as fat provides approximately 50 percent of the energy source ininfant formulas.
Lactose is the primary carbohydrate source in human milk and in most of thestandard formulas. Studies have not shown an advantage to lactose-free infant formulas(Heubi, et al., 2000). The remainder of nutrients is either derived from the cow’s milk oradded as inorganic salts, trace minerals, vitamins and other elements.
Formulas are still available without added iron. These low-iron formulas are forchildren with iron metabolism disorders and are not recommended for children withoutiron problems. The American Academy of Pediatrics (1999) strongly advocates the useof iron fortification to reduce the prevalence of iron-deficiency anemia during the firstyear of life.
Regular cow’s or goat’s milk is not recommended as the primary source of nutri-tion for infants as these provide too much protein and sodium and less carbohydrateand fat than is desirable. These liquids are also deficient in many vitamins and traceelements, such as iron, vitamin C and B6, copper, and zinc.
• Soy formulas. The American Academy of Pediatrics (1998) recommends soy-protein formulas for infants in only selected cases: families seeking a vegetarian-baseddiet for a healthy term infant, infants with galactosemia, infants with primary lactasedeficiency or the recovery phase of secondary lactose intolerance. Soy formulas are safeand effective for term infants whose nutritional needs are not being met from humanmilk or cow milk-based formula. Use is contraindicated for preterm infants weighingless than 1800 gm or as a substitute formula for infants with documented cow’s milk-protein induced enteropathy. It has no proven value for infants with colic or atopicdisease. (See Chapter 13 for an in-depth review of food allergies).
There are a variety of soy formulas available and these generally have higherprotein ratios than cow’s milk-based formulas, as the protein quality is lower. Thecarbohydrate sources vary and are lactose free.
• Hypoallergenic formulations. Human milk confers the greatest protectionagainst allergy and there is less risk of exposure to antigens such as cow’s milk or soyproteins. However, for some infants a hypoallergenic formula, such as a protein hy-drolysate or amino acid formation, may be needed (American Academy of Pediatrics,2000). These formulas were designed to provide a ‘predigested’ protein source or pro-tein that is broken down into small peptides or free amino acids that are not able toelicit an immunologic response.
Alimentum®, Nutramigen®, and Pregestimil® are examples of protein hydrolysateformulas, each differing slightly in nutrient composition. Elecare® and Neocate Infant®
are amino acid-based infant elemental formulas. These formulas are intended for use byinfants with allergic symptoms or intolerance.

67Clinical Pediatric Nutrition
• Preterm formulas for use in hospitals. When breast milk is not available, prema-ture formulas are indicated for infants with birth weights under 1850 to 2000 gm(American Academy of Pediatrics and American College of Obstetrics and Gynecology,2002). Infants who require higher intakes of calcium and phosphorus (e.g. osteopenia)may continue to receive these formulas until they weigh 3500 gm (Carver, 2001).
These formulas are designed to meet the nutrient needs of premature infants andcontain increased amounts of calories, protein, calcium, phosphorus, and vitamins Aand D. The protein in premature infant formulas is predominantly whey, which mayresult in greater cystine intake and retention, as well as greater taurine stores. Becausethe formula contains less casein as compared to other infant formulas, it may decreasethe potential for the development of lacto-bezoars in premature infants. Prematureformulas contain greater amounts of protein than standard term infant formulas. The fatcontent of premature formulas is a combination of vegetable oils, which provide bothlong-chain and medium-chain fatty acids.
The high MCT content may enhance calcium absorption; promote nitrogen reten-tion, lipogenesis, and weight gain; and improve fat absorption. Mineral content (e.g.calcium, phosphorus, magnesium) of premature formulas is higher than term infantformulas, to support optimal bone mineralization (Groh-Wargo, 2000).
It is the responsibility of the Registered Dietitian and the neonatologist to strictlymonitor use of these formulas and to transition to a post-discharge premature formulawhen appropriate. Intakes of premature infant formula exceeding 500 mL/day willlikely provide excessive amounts of vitamin A and vitamin D (Lucas, 1992; Nako, 1993).Examples of premature formulas include Enfamil Premature Lipil® (Mead JohnsonNutritionals) and Similac Special Care Advance® (Abbott Nutrition). A new formula,Good Start Premature 24,® was released in 2008.
However, some clinicians have voiced concern that there is no research on thesafety and efficacy of a whey hydrolysate in premies. The research done to get theformula approved has not yet been published. Also, Nestlé has not yet marketed a post-discharge premature formula.
Some have proposed that 100 percent whey products did not give the same proteinbenefits as the mixed casein/whey formulas, but research supporting this is limited. Animportant factor to consider is the possible ramifications of the complete elimination ofcasein protein. (Of note, breast milk does contain casein.) One study demonstrated thatcalcium availability is similar in human milk, whey-based formula, and soy-basedformula, but is higher in casein-predominant formula. Availability of iron was highestin human milk. Iron availability in whey-based formula and soy formula was similar,but availability was lower in casein-predominant formula. Zinc availability was alsohighest in human milk. However, zinc availability was similar in whey-based andcasein-based formulas, but was lower in soy-based formula (Bosscher, et al., 2001).
• Preterm formulas for home use. Often referred to as "post-discharge prematureformulas" or "nutrient-enriched" formulas, EnfaCare Lipil® (Mead Johnson Nutritionals)and similac NeoSure Advance® (Abbott Nutrition) provide more calories, protein,

68Clinical Pediatric Nutrition
vitamins and minerals than standard, term formulas to support rapid growth andprevent nutrient depletion, without providing excessive nutrients (Groh-Wargo, 2000).
Carver, et al. (2001) demonstrated that premature infants fed post-discharge for-mula (PDF) had improved growth compared to those fed a term formula, with the mostsignificant beneficial effects seen among infants with birth weights under 1250 gm.Greater gains in weight and head circumference were seen in the PDF group, especiallywithin the first one to two months after discharge. Fewtrell, et al. (2001) revealed thatSGA infants fed PDF showed greater gains in length and head circumference at 9 and 18months corrected age, when compared to SGA infants fed term formula.
In contrast, Faerk, et al. (2000) showed that feeding 200 mL/kg/day of fortifiedbreast milk or premature formula did not significantly improve bone mineralization by40 weeks gestation. A recent Cochrane Review concluded that "the limited availabledata do not provide strong evidence that feeding preterm or low birth weight infantsfollowing hospital discharge with calorie and protein-enriched formula compared withstandard term formula affects growth rates or development up to 18 months post-term"(Henderson, 2005).
Despite the conflicting literature cited above, it is recommended to provide PDF toinfants born extremely premature until catch-up growth is completed, or until 9 to 12months corrected age, whichever occurs first (Groh-Wargo, 2000; Henderson, 2005;Lucas, 1992; Adler and Groh-Wargo, 2007. For the near term premature infant (i.e.infants form between 34 and 36 weeks gestation), clinical judgment should determinethe appropriate duration for the use of post-discharge premature formulas, consideringeach case individually. For infants born at 36 weeks gestation with a birth weight of atleast 2500 gm, term infant formula can be used if breast milk is not available (Adler andgroh-Wargo, 2007). Bhatia has recommended transition from a post-discharge prema-ture formula to a standard, term formula at 4 to 6 months corrected age if all growthparameters are above the 25th percentile (Bhatia, 2005).
Further studies focusing on extremely low birth weight (ELBW) and micropremieinfants are needed, as these studies will likely reveal a significant affect of post-dis-charge premature formulas on growth rates and development.
Ultimately, the primary care physician is responsible for ensuring that prematureinfants continue on a post-discharge formula for an appropriate duration. The currentstandard for practice remains to use post-discharge premature formulas until the infantreaches 9 to 12 months corrected age. The cost of post-discharge premature formulas isapproximately 10 to 30 percent more than standard formulas, depending upon geo-graphic location and place of purchase (e.g. grocery store vs. drug store). Although thesepost-discharge formulas cost slightly more than term formulas, the benefits usuallyoutweigh the costs. For patients who meet financial eligibility requirements, the SpecialSupplemental Nutrition Program for Women, Infants and Children (WIC) does coverthese formulas.
• Specialized products. Many products have been especially formulated to meetthe unusual nutritional needs of children with very specific requirements, such as those

69Clinical Pediatric Nutrition
with inborn errors of metabolism, digestive diseases, pulmonary problems, renal disor-ders, etc. These products are generally expensive as they are made to precise specifica-tions and are not used by a great percentage of the population. However, the infantsand children who most benefit from nutrition interventions have the highest likelihoodof requiring these types of formulas. Thus, clinicians should be aware of the subtledifferences between products within the same category to make the best choice for eachcase, in order to maximize tolerance and patient acceptance.
See Appendix #9 for examples and contact your formula representative to obtainmore information on nutrient composition and indications.
INTRODUCING SOLIDS
A child’s developmental skills will determine the timing of the introduction ofsolids. Generally, by 4 to 6 months, the extrusion reflex of early infancy has disappearedand the ability to swallow non-liquid foods has become established. In general, thechild will have doubled its weight and be able to sit upright without support. The childwill indicate a desire for food by opening his or her mouth and leaning forward, andshow disinterest or satiety by leaning back and turning away. (See the Nutrition Dimen-sion course Maternal & Infant Nutrition, for information on eating patterns and diets.)
• Modified diets for infants and children. Therapeutic diets are modified dietsspecific to the child’s nutrient needs or restrictions. Such examples would be a low-protein diet for a child with a metabolic disorder or renal disease, or a high-fat minimalcarbohydrate ketogenic diet for a child with a seizure disorder. Infants and childrenwho are underweight need more calorie-dense foods; children who are overweight orunable to be very active need fewer calories. Modifications can be made to a regular dietto add or decrease calories. Therapeutic dietary strategies will be discussed in theappropriate chapters to follow.
• Modified textures. Modifying textures of food or the viscosity of liquids is help-ful for children with dysphagia, oral motor problems, and/or sensory difficulties. Suchchanges can make eating and drinking safe for a child who has difficulty in coordinatingchewing or swallowing. These changes in solid food consistencies generally will increaseacceptance of oral feeds by children affected by sensory integration disorder (e.g. autisticspectrum disorder). It is important to work in conjunction with a speech pathologist oroccupational therapist to identify appropriate textures and liquid modifications. Feucht(2003) has an excellent guide to thickening liquids for safe drinking.
• Enteral nutrition support. Enteral nutrition support is appropriate for infantsand children who have a functioning gastrointestinal tract, but who either cannot usethe oral route or who need more fluids and/or nutrients than they can meet by oralintake alone. See Appendix #9 for information on formulas. PediaSure® and KinderCal®
are the primary intact protein formulas used in pediatrics. These are used for oral ortube feedings and have been formulated to provide appropriate amounts of vitaminsand minerals in kid-size volumes.
• Parenteral nutrition support. Parental nutrition (PN) is appropriate for children

70Clinical Pediatric Nutrition
with certain conditions that preclude or limit the use of the gastrointestinal tract fornutrition support, such as short gut syndrome, congenital GI anomalies, necrotizingenterocolitis (NEC), or inflammatory bowel disease (IBD). GI malformations includeomphalecele, gastroschisis, intestinal atresia, volvulus, and Hirschsprung's disease. GImalformations and NEC may require surgery that can lead to short bowel syndrome(SBS), also known as short gut syndrome. SBS symptoms include weight loss, musclewasting, diarrhea, rapid GI transit time, malabsorption, dehydration and hypokalemia.SBS is the primary cause for long-term PN support.
Other medical conditions that may warrant PN support include: intractable, non-specific diarrhea; extracorporeal membrane oxygenation (ECMO); congenital diaphrag-matic hernia; and vasopressor support (e.g. dopamine, dobutamine).
ECMO and basopressor support may not be absolute contraindications to enteralfeedings; however, many neonatologists and intensive care physicians are hesitant toenterally feed infants with hemodynamic instability due to risk of bowel ischemia.Concerns about NEC and the possible effect of hypoxia on the gut during ECMO haveled to the use of PN as the main source of nutrition support in the neonatal population.However, a study was done in which infant subjects on ECMO received full-strength,continuous enteral feedings administered via either nasogastric or post-pyloric feedingtubes (Pettignano, et al., 1998). There were no documented cases of NEC or intestinalpreformation. Although the parenteral group achieved goal calories first (3.07 plus orminus 2.1 days for PN; 4.25 plus or minus 2.6 days for enteral), the benefits of enteralnutrition far outweigh the risks of PN. Pettignano, et al. concluded that vasoactivesupport is not considered to be a contraindication to enteral feeding. See Chapter 15 forfurther details on parenteral nutrition.
• Preparation of formulas in the hospital setting: The American Dietetic Associa-tion created guidelines for formula preparation in health care facilities. See Appendix#19 for further details on guidelines for formula preparation in health care facilities.
CHILD AND FAMILY NUTRITION COUNSELING
Providing education and instruction to children and families requires a delicateconsideration of the family’s abilities, desires, constraints, cultural beliefs, economicabilities and education. Bear in mind who is the primary caretaker of the child, be it aparent, relative, non-related person or the child himself. Is the family able to support thechild to make the necessary changes or does the family in some way sabotage thechild’s ability to comply with the dietary modifications? These are questions the dieti-tian needs to probe and understand to provide constructive nutritional guidance.Motivational interviewing (MI) is a technique that has been used successfully in coun-seling adults, and has recently been used with school-age children and adolescents. Acomprehensive review of MI is beyond the scope of this chapter.
Consider how you would handle this situation: A child seen in the spina bifidaclinic is gaining weight at a rapid pace. The family is Vietnamese. Father always bringsthe child to his clinic visits and is proud of his ability to speak and understand English.

71Clinical Pediatric Nutrition
The need for dietary monitoring is explained to the father; however, he does neither theshopping nor cooking. When the child returns to the clinic with his father later on, thechild continues to exhibit an accelerated rate of weight gain. Father reports that he hadbeen unable to convince his spouse that they need to change the child’s dietary intake.In this family’s culture, the woman does the shopping and cooking and the father doesnot see it as his place to change her ways. Unfortunately, neither can you persuade himto bring his spouse in to talk about the child’s nutrition.
People of diverse backgrounds have various ways of understanding what is nur-turing and what is good for children and these ways must be respected. In special cases,enlisting the aid of cultural community members such as church groups or communityhealth services can facilitate education needs and provide the needed guidance andsupport, while maintaining cultural confidences.
Monitoring or follow-up is key to therapeutic dietary intervention. Changes ingrowth and nutrient requirements are ongoing. To assure that children continue to meettheir needs and follow the appropriate diet, monitoring is essential. Are the childrengrowing according to plan? Are specific nutrient levels in the normal ranges? Has weightmaintenance, gain or loss been achieved? Is the child tolerating the formula change?
REFERENCES
Adler A, Groh-Wargo S. Transitioning management of the preterm neonate from the hospital to home.Support Line 29(3): 12-25, 2007.
_________ American Academy of Pediatrics. Policy statement. Breastfeeding and the use of human milk.Pediatrics 115(2): 496-506, 2005.
__________ American Academy of Pediatrics. Policy statement. Hypoallergenic Infant Formulas (RE0005).Pediatrics 106(2): 346-349, 2000.
__________ American Academy of Pediatrics, Committee on Nutrition. Soy-protein formulas: Recommen-dations for use in infant feeding. Pediatrics 101: 148-153, 1998.
__________ American Academy of Pediatrics, Committee on Nutrition. Iron Fortification of InfantFormulas (RE9865). Pediatrics 104(1): 11-123, 1999.
__________ American Academy of Pediatrics and American College of Obstetrics and Gynecology.Guidelines for Perinatal Care, 5th ed. Elk Grove Village, Ill: American Academy of Pediatrics, 2002.
__________ American Dietetic Association. Position of the American Dietetic Association: Promotion ofbreastfeeding. JADA 97: 662-666, 1997.
__________ American Dietetic Association. Preparation of Formula for Infants: Guidelines for Health-careFacilities, Revised 4/2002.
Auestad N, Scott DT, Janowsky, et al. Visual, cognitive and language assessments at 39 months: a follow-up study of children fed formulas containing long-chain polyunsaturated fatty acids to 1 year ofage. Pediatrics 112(3 Pt 1): e177-83, 2003.
Bhatia J. Post-discharge nutrition of preterm infants. J of Perinatology 25: S15-S16, 2005.Bosscher D, VanCaillie-Bertrand M, Robberecht H, et al. In vitro availability of calcium, iron and zinc from
first-age infant formula and human milk. J Pediatr Gastroenterol Nutr 32(1): 54-8, 2001.Carver JD, Wu PK, Hall RT. Growth of preterm infants fed nutrient-enriched or term formula after
hospital discharge. Pediatrics 107: 683-689, 2001.__________ Committee of Nutrition, American Academy of Pediatrics, Pediatric Nutrition Handbook, 3rd
ed. Elk, Grove, IL, 1993.

72Clinical Pediatric Nutrition
Dobson B. Maternal & Infant Nutrition, 6th ed. Nutrition Dimension, Ashland OR, 2008.Faerk J, Petersen S, Peirersen B, et al. Diet and bone mineral content at term in premature infants. Pediatr
Res 47: 148-156, 2000.Fewtrell M, Morley R, Abbort R, et al. Catch-up growth in small-for-gestational-age term infants: a
randomized trial. Am J Clin Nutr 74: 516-523, 2001.Feucht S. Guidelines for the use of thickeners in foods and liquids. Nutrition Focus 18(5) Sept/Oct, 2003.Fleith M, Clandinin MT. Dietary PUFA for preterm and term infants: review of clinical studies. Crit Rev
Food Sci Nutr 45(3): 205-229, 2005.Gregory K. Update on nutrition for preterm and full-term infants. J Obstet Gynecol Neonatal Nurs 34: 98-
108, 2005.Groh-Wargo S, Thompson M, Cox J, ed. Nutritional Care for High-Risk Newborns, 3rd ed. Chicago IL:
Precept Press Inc., 2000.Henderson G, Fahey T, McGuire W. Calorie and protein-enriched formula versus standard term formula
for improving growth and development in pre-term or low birth weight infants following hospitaldischarge. Cochrane Database Syst Rev 18(2): CD004696, 2005.
Heubi J, Karasov R, Reisinger K, et al. Randomized multicenter trial documenting the efficacy and safetyof a lactose-free and a lactose-containing formula for term infants. JADA 100: 212-217, 2000.
Kashyap S, Schulze KF, Forsyth M. Growth, nutrient retention, and metabolic response of low-brith-weight infants fed supplemented and unsupplemented preterm human milk. Am J Clin Nutr 52(2):254-262, 1990.
Kuschel CA, Harding JE. Multicomponent fortified human milk for promoting growth in preterm infants.Cochrane Database Syst Rev (1): CD000343, 2004.
Lacey K, Pritchett E. Nutrition Care Process and Model: ADA adopts road map to quality care andoutcomes management. J Am Diet Assoc 103: 1061-1071, 2003.
Lucas A, Cole TJ. Breast milk and neonatal necrotizing entercolitis. Lancet 336: 1519-1523, 1990.Lucas A, King F, Bishop NB, King FJ. Randomized trial of nutrition for pre-term infants after discharge.
Arch Dis Child 67: 324, 1992.Nako Y, Fukushima N, Tomomasa T. Hypervitaminosis D after prolonged feeding with a premature
formula. Pediatrics 92: 862, 1993.O'Connor D, Jacobs J, Hall R, et al. Growth and development of premature infants fed predominantly
human milk predominantly premature infant formula and a combination of human milk andpremature formula. J Pediatr Gastroenterol Nutr 37: 437-446, 2003.
Pettignano, et al. Total enteral nutrition versus total parenteral nutrition during pediatric extracorporealmembrane oxygenation. Crit Care Med 26(2): 358-363, 1998.
Saarela T, Kokkonen J, Koivisto M. Macronutrient and energy contents of human milk fractions duringthe first six months of lactation. Acta Paediatr 94(9): 1176-1181, 2005.
Schanler R, Shulman R, Lau C. Feeding strategies for premature infants: Beneficial outcomes of feedingfortified human milk versus preterm formula. Pediatrics 103: 1150-1257, 1999.
Schanler RJ. The use of human milk for premature infants. Pediatr Clin North Am 48(1): 207-219, 2001.Simmer K, Patole SK, Rao SC. Long chain polyunsaturated fatty acid supplementation in fants born at
term. Cochrane Database Syst Rev 23(1): CD000376, 2008.Wight NE. Donor human milk for preterm infants. J Perinatol 21(40): 249-254, 2001.Yu VY. Extrauterine growth restriction in preterm infants: Importance of optimizing nutrition in neonatal
intensive care units. Croat Med J 46(5): 737-743, 2005.

73Clinical Pediatric Nutrition
Chapter Seven:Nutritional Problems
of the Neonate
PREMATURITY
Infants are considered premature if they are born before 37 weeks of gestation. Thesurvival of infants born early has improved dramatically due to the ever-increasingadvances in technology. Children are surviving at 23 to 25 weeks gestation, weighingless than 750 gm, although they often present with a variety of complex medical con-cerns.
The lower the birthweight, the greater the chance of neurological consequencesrelated to perinatal stress and illness. Some infants will survive without medical compli-cations while others will have significant medical or neurologic complications.
The rate of weight gain and growth in the developing fetus is greater than at anyother time in the human life span. Because of this increased rate of growth, prematureinfants are extremely sensitive to the quality and quantity of available nutrients.
Due to shortened gestation and immature physiology, nutrient requirements ofpreterm infants are higher than those of term infants. They have low nutrient stores,incomplete digestion, decreased retention and utilization of nutrients, as well as in-creased needs associated with stress, illness and some medications.
Early postnatal nutrient-dense intake is needed to promote catch-up growth and toprevent sequalae of undernutrition (Brandt, 2003).

74Clinical Pediatric Nutrition
NUTRITION ASSESSMENT OF PRETERM INFANTS
The following glossary of terms and abbreviations used in this chapter may behelpful.
Gestational age: Age of infant from conception to birth.Chronological age: Postnatal age.Corrected age: Gestational age plus chronologic age minus 40 weeks
(normal gestational age).Example: A baby was 30 weeks gestational age and is now 14 weekschronologically: 30 weeks + 14 weeks – 40 weeks = 4 weeks corrected age.
AGA: Appropriate for gestational age.LGA: Large for gestational age.IUGR (intrauterine growth restriction): Lack of expected intrauterine growth.SGA (small for gestational age): Infant w/birth weight <10th percentile for
gestational age.LBW (low birth weight): Birth weight between 1500 and 2500 gm.VLBW (very low birth weight): Birth weight between 1000 and 1499 gm.ELBW (extremely low birth weight): Birth weight below 1000 gm.Micropremie: Birth weight below 750 to 800 gm.
• Anthropometric data. Growth and weight gain monitoring is the primary hall-mark of nutrition status. Use the following techniques and standards:
Obtain weight history to track rate of gain. Initial weight loss after birth is between7 and 15 percent of birth weight during the first 4 to 8 days of life because of shifts in
Factors Affecting Growth of Preterm Infants
Increased caloric requirementsdue to: Increased losses due to:
Rapid growth Necrotizing enterocolitisIncreased respiratory effort Gastroesophageal refluxPoor feeding efficiency Heat losses due to lack ofTemperature control subcutaneous fat insulationStimulation and large body surface areaEnvironmental stress
Poor intake due to:FatigueOral motor dysfunctionChronic painHypoxemia

75Clinical Pediatric Nutrition
water balance. Infants usually regain to birth weight by day 10 to 22. Growth expecta-tions parallel intrauterine growth during the third trimester (15 to 20 gm/kg/day).Weight gain of 20 to 30 gm/day is expected until 6 months of age.
Measure length: expected gain is 0.5 to 1.2 cm per week.Expect OFC growth between 0.5 and 1 cm per week (Guo, et al., 1997). Slower rates
of postnatal head growth may be associated with motor delays.Plot growth on Fenton growth chart until 50 weeks gestation, and beyond 50 weeks
gestation plot corrected ages on NCHS charts. Correct growth parameters until 2 to 3years of age. Use the following parameters: Weight for corrected age, length for cor-rected age, OFC for corrected age, and weight for length on NCHS charts.
• Dietary data is also valuable. Obtain a complete history of breastfeeding prac-tices or formula feeding.
Observe a feeding or investigate problems regarding fatigue, oral motor skills, anddevelopmental feeding techniques. Consult with speech or occupational therapistexperienced in infant feeding practices.
Estimate nutritional goals as shown below:
Nutritional Needs & Guidelines for the Preterm Infant
Nutritional needs of the stable and growing preterm infant:
Adapted from Tsang, 1993; CPS, 2000.
Nutrient per kg/day
Calories 120Protein, gm 2.5-3Water, ml 120-160Vitamin A, mcg 400Vitamin D, IU/day 400Vitamin E, mcg .5-1
Nutrient per kg/day
Vitamin C, mg 20Folate, mcg 25Calcium, mg 120-230Phosphorus mg 60-140Vitamin K mcg 8-10Iron, mg 3-4
Intake guidelines for growing and gaining preterm infant after hospital discharge:
• Weight gain goal is 20-30 gm/day• Intake goal is approximately 120 kcal/kg/d• 22 kcal/oz post-discharge premature formula
Approximate weight Recommended intake/day5 lb 12-13 oz6-7 lb 15-17 oz8-10 lb 20-25 oz
Adapted from Zerzan, 1993.

76Clinical Pediatric Nutrition
• Biochemical data. Check serum calcium, phosphorus and alkaline phosphataseto evaluate bone mineralization. Premature infants have increased requirements foriron, zinc and calcium (Marriott, 2003).
• Clinical data. Monitor medical status and respiratory function as it relates toenergy expenditure.
Evaluate medications and possible effect on appetite and nutrient status.Monitor bowel function and gastrointestinal symptoms.
GOALS AND INTERVENTION STRATEGIES: PRETERM INFANTS
Goals of nutritional therapy are to ensure good weight gain and growth for cor-rected age and to optimize nutritional status.
• Human milk is the ideal food for term infants. Preterm infants fed their ownmother's milk (Pipes, 1989) gain the anti-infective factors and other essential nutrients.Breast milk produced by mothers who have given birth prematurely contains greaterconcentrations of the following when compared to term breast milk: immune compo-nents, total lipid, medium-chain fatty acids (MCT), vitamins, some minerals (i.e. calciumand sodium), and trace elements (Rao, 2005).
Breast milk is classified as preterm for only two to four weeks after birth, regard-less of how premature the birth. With increased incidence of infants born extremelypremature (i.e. less than 26 weeks gestation), this is an important matter to consider.
However, even the milk of mothers of preterm babies may lack sufficient calciumand phosphorus for bone mineralization and protein for tissue anabolism. Human milkfortifiers should be added to human milk to provide additional minerals, protein andenergy (CPS, 2000). See Chapter Five for further details.
• Premature formulas. Special formulas, such as Similac Special Care® and EnfamilPremature® were designed to meet the needs of the growing and gaining preemieweighing less than 2 kg. The formulas take into consideration the limited capacity of thepreemie to handle fluids, increased renal solute loads and to aid digestion and absorp-tion of protein, fat and carbohydrate. They are based on a 60-to-40 ratio of whey tocasein with mixtures of long- and medium-chain fatty acids and are formulated withincreased amounts of calcium, phosphorus, magnesium, sodium, zinc, copper andvitamins. See Chapter Six for a comprehensive review of premature formulas.
Soy formula is not appropriate for the premature infant due to inadequate nitrogenretention, poor calcium and phosphorus absorption and subsequent poor growth rate.
Adjust formula concentration or use calorie fortifiers to achieve optimal growthrates. See Appendix #12. If infant has an inadequate suck to meet needs, consider oralgavage, nasogastric or gastrostomy feedings to supplement nutritional intake.
Multidisciplinary follow-up and monitoring , including the services of a registereddietitian can enhance the catch-up growth of very low birth weight infants.

77Clinical Pediatric Nutrition
INBORN ERRORS OF METABOLISM
Inborn errors of metabolism (IEM) are a group of inherited disorders that involve adefect somewhere in the metabolic pathway. There are approximately 3,000 knowninborn errors of metabolism; although individually rare, collectively they total morethan one in 1,000 births. Nutrition therapy is key to the management of a majority ofinborn errors of metabolism and can change outcome from severe mental retardation tonormal development (Poustie, 2001). In other disorders, diet may improve the condi-tion, even though the prognosis remains poor.
Newborn screening is routinely performed in all states for phenylketonuria (PKU)and congenital hypothyroidism. Testing for other IEM such as maple syrup urinedisease, galactosemia, or homocystinuria is performed in some states. Check with yourstate genetic coordinator to know what disorders are screened in your state.
Treatment for IEM is to prevent the accumulation of substrates or toxic products inthe tissues. Long-term therapy includes limiting, but not necessarily excluding, theoffending substrate. Supplementation may be needed to provide a nutrient past themetabolic breakdown (thus making it conditionally essential) or to enhance the utility of
Disorder
Methylmalonic aciduriaPhenylketonuria
Tyrosinemia
Maple syrup urine disease
Ornithine transcarbamylasedeficiency
Glycogen storage disease(type 1a)
GalactosemiaHereditary fructose
intolerance
Medium chain Acyl-CoAdehydrogenase deficiency
Nutritional Treatment
Low proteinLow phenylalanine
Low phenylalanine, tyrosine
Low leucine, isoleucine,valine
Low protein+/- L-amino acids
Restrict lactose, sucrose& fructose
Lactose, galactoseFructose, sucrose, sorbitol
Low MCT avoid fasting
Disorders of amino acid metabolism:Lab Monitoring
Urine organic acidsPhenylalanine &
tyrosine levelsPhenylalanine, tyro-
sine & methionineLeucine, isoleucine,
valinePlasma citrullineArginine
Glucose levels
Galactose-1-phosphateFructose-1,6-diphosphate
–– –– –– ––
Disorders of carbohydrate metabolism:
Disorders of lipid metabolism:
Adapted from Trahms, 1995; Ekvall, 1993
Metabolic Disorders

78Clinical Pediatric Nutrition
another pathway. The specialized treatment regimen is a lifelong therapy requiringintermittent or continuous nutritional, medical and laboratory monitoring. Accumula-tion of altered metabolites can cause mental retardation, metabolic crises, growth fail-ure, neurologic problems, organ damage or death. The complications and pathophysiol-ogy differ depending on the specific metabolic defect. Disorders occur in the metabo-lism of protein, fat and carbohydrate.
NUTRITION ASSESSMENT OF IEM• Anthropometric data. Measure growth at regular intervals, including weight,
length or height, OFC (under 2 to 3 years), mid-arm circumference, and triceps orsubscapular fatfold. Plot the parameters on the following NCHS growth charts: weightfor age, length or height for age, weight for length or height and OFC for age.
Calculate body composition parameters for fat and muscle reserves.• Dietary data. Determine amount and type of feeding by obtaining accurate
intake records. Additional protein equivalents from medical foods and specializedmetabolic formulas are often needed to obtain normal linear growth rates (Acosta,2003). Analyze nutrient content. If child is on a specialized prescribed formula, deter-mine daily intake.
Evaluate family understanding and adherence to dietary guidelines and child’sself-management skills. Behavioral problems often occur due to the severe food restric-tion and parental concerns over eating. Note any religious or philosophical determi-nants of eating behavior.
Nutrition Goals: IEM
*Energy ±Proteinkcal/kg gm/kg
Infants: <1 year 105-120 2.5-3.0Children: 1-3 years 97-106 1.8-2.0
4-6 years 86-94 1.77-11 years 73-80 1.65-1.7
*Children with some IEM have greater energy requirements than unaffectedchildren as additional energy is necessary to promote anabolism and growth. Ifinadequate, protein will be broken down for energy. Subsequently, there maybe a buildup of nitrogenous byproducts that may be toxic to the system.
± Determine protein requirements individually by the specific metabolic disorder,tolerance or level of enzyme activity, age and general health status. Individualrequirements are difficult to estimate. Detailed records of growth, dietary intakeand biochemical indices help fine-tune the child’s needs.
Acosta, 1993

79Clinical Pediatric Nutrition
Ascertain whether the patient receives vitamin or mineral supplements and fluo-ride. Metabolic disease and pathways affected will determine need for supplementalmicronutrients, such as arginine, cirtrade and carnitine (Leonard, 2001).
• Biochemical data. Frequent monitoring of laboratory parameters is essential toevaluate metabolic function. Plasma amino acids, hematologic status, protein, electro-lytes, ammonia levels and blood lipid levels may be part of the monitoring. See table onprevious page for monitoring of specific disorders.
Monitor hematocrit, hemoglobin and ferritin plus albumin and prealbumin twiceper year depending on age and health status.
• Clinical data. Monitor for illness and medical status. Usual childhood illnessescan be very problematic in children with inborn errors of protein metabolism. Fever,infection and anorexia increase muscle breakdown and therefore provide additionalsubstrate to the system.
Observe for inattentiveness or irritability which may be indicative of increasinglevels of offending substrate. Note any deviation from normal or usual health.
GOALS AND STRATEGIES FOR INTERVENTION: IEMGoals of therapy are to normalize biochemical status by correcting the primary
imbalance and reducing the availability of substrate, promoting alternate metabolicpathways to decrease build-up of toxic substances, providing the essential cofactors.
• Intervention. Dietary management is best administered through a regionalmetabolic center where a dietitian, biochemical geneticist, genetic counselor, socialworker and other health care professionals who have experience in these conditions.Intervention must be individual and specific for the metabolic alteration.
For most of the rare metabolic disorders, it is extremely difficult to meet the energy,protein and nutrient needs without a specialized semi-synthetic medical foods orformula. There are formulas specific to certain metabolic alterations, such asphenyalanine-free formula for children with PKU or branched-chain amino acid-freeformulas for children with maple syrup urine disease. Read the manufacturers’ guide-lines for protocol standards and composition.
Contact your pharmaceutical representative for resources:Mead Johnson NutritionalsEvansville, IN 47721www.bms.com/aboutbms/ourbus/nutrit.htmlwww.meadjohnson.com/mjn/products
Abbott NutritionPO Box 1317Columbus, Ohio 43216www.abbott.com/products/nutritionals

80Clinical Pediatric Nutrition
Metabolic Industry Support for RDs:
Barbara Marriage, Abbott NutritionMetabolic Support Hotline(800) 986-8755
Steve Yanicelli, NutriciaMetabolic Hotline(877) 280-4321
For aminoacidopathies, formulas with high biologic value, but limited in theoffending amino acid, provide 75 to 80 percent of the total protein intake with 25 per-cent from dietary food (Duran, et al., 1999; Yannicelli, 2003). Nitrogen-free foods, such asprotein-free breads, pastas and other baked goods, provide energy without compromis-ing protein intake.
Provide information about appropriate foods to foster the development of age-appropriate self-management skills for children with metabolic disorders. Dietaryrestriction and surveillance are for life, so gaining the confidence and trust of the childis extremely important.
Education intervention is paramount to increase a child and family’s knowledge ofthe diet and disease (Singh, et al., 2000).
CLEFT LIP AND PALATE
Clefting of the lip and palate occur when parts of the face and mouth fail to cometogether properly during fetal development. There is no single cause, but genetics orsingle mutations contribute to the multitude of etiologies. The overall incidence rate isabout 1 in 700 to 800 babies (Richard, 1994). The ratio of boys to girls is approximately3:2, and it is more common in the Asian population.
There is a wide range of involvement depending on the location (lip, palate orboth) and extent of the opening. A cleft lip may be one-sided or two-sided. A cleft palatemay be as minor as a small notch in the soft palate or it may extend all the way from theback of the mouth through the soft and hard palate. Some babies will have an isolatedcleft lip or palate while others may have a combination of lip and palate malformation.
In general, surgery to correct cleft lips is performed when the infant is approxi-mately 6 to 10 weeks of age or 10 lb. Surgery for closing a cleft palate is sometimebetween 6 to 12 months depending on the size of the cleft and health of the child. Ifchildren have more involved clefting of the gums, it may require other surgeries and apossible bone graft during childhood to provide a base for teeth. For very severe casesof cleft palate a special prosthesis, an obturator, may be necessary to bring the facialstructures into alignment prior to surgery. This appliance serves as an artificial palate toassist in early feeding and help improve speech sounds.

81Clinical Pediatric Nutrition
Feeding difficulties with poor weight gain for the first two to three months occur inabout 25 percent of children with cleft lip or palate (Habel, et al., 1996). Problems in-clude poor or inadequate suction, prolonged feeding time and frequent nasal regurgita-tion. Early teaching about the anatomy of the lip and mouth and appropriate feedingtechniques are crucial to a pleasant feeding experience for the mother and child toassure good weight gain and growth.
Different techniques and feeding methods will be more helpful for one baby thananother. The families should be encourage to try various methods to find what worksbest for them.
NUTRITION ASSESSMENT OF CLEFT LIP/PALATE INFANT
• Anthropometric data. Measure growth at regular intervals: weight, length, OFC(under 3 years), mid-arm circumference and triceps or subscapular fatfold.
Plot parameters on NCHS or other appropriate growth charts: weight for age,length for age, weight for length, and OFC for age.
Calculate body composition parameters for fat and muscle reserves.• Dietary data. Determine method of feeding and quantity of intake using a food
record or typical day. Analyze nutrient content.If breastfeeding, investigate if also giving supplemental breast milk or formula
with a bottle. If bottle feeding, record type of bottle, nipple, and length andtiming of feedings. If feeding solids, record types and amount and if using apalate appliance. Determine positioning during feeding.
Evaluate parent’s comfort level and response to child’s feeding cues. Note anyfeeding difficulties and observe parent-child interaction during feeding.
Estimate nutrition goals: The feeding and nutritional needs of a baby with a cleftlip and palate are no different from non-affected babies. Adjust RDA based onanthropometrics, biochemical and clinical data.
• Biochemical data. Evaluate standard infant biochemical parameters.• Clinical data. Monitor for illness and medical status. Investigate concerns of
nasal regurgitation.
GOALS AND STRATEGIES FOR INTERVENTION: CLEFT LIP/PALATE
Goals of therapy are to facilitate development of normal feeding skills and tooptimize growth and nutritional status.
The primary intervention is to demonstrate correct feeding techniques to parents atthe time of diagnosis, before they are first discharged from the hospital. Early interven-tion decreases the stress of feeding difficulties and risk of malnutrition.
• Breastfeeding. Most babies with an isolated cleft lip can breast-feed quite well.For babies with a cleft palate, creating adequate suction during breast-feeding may bedifficult, but support from a lactation consultant, dietitian or nurse will help the babymeet nutritional needs. The team can teach the child’s mother to hold the breast so thatthe nipple protrudes and is inserted as far as possible into the baby’s mouth.
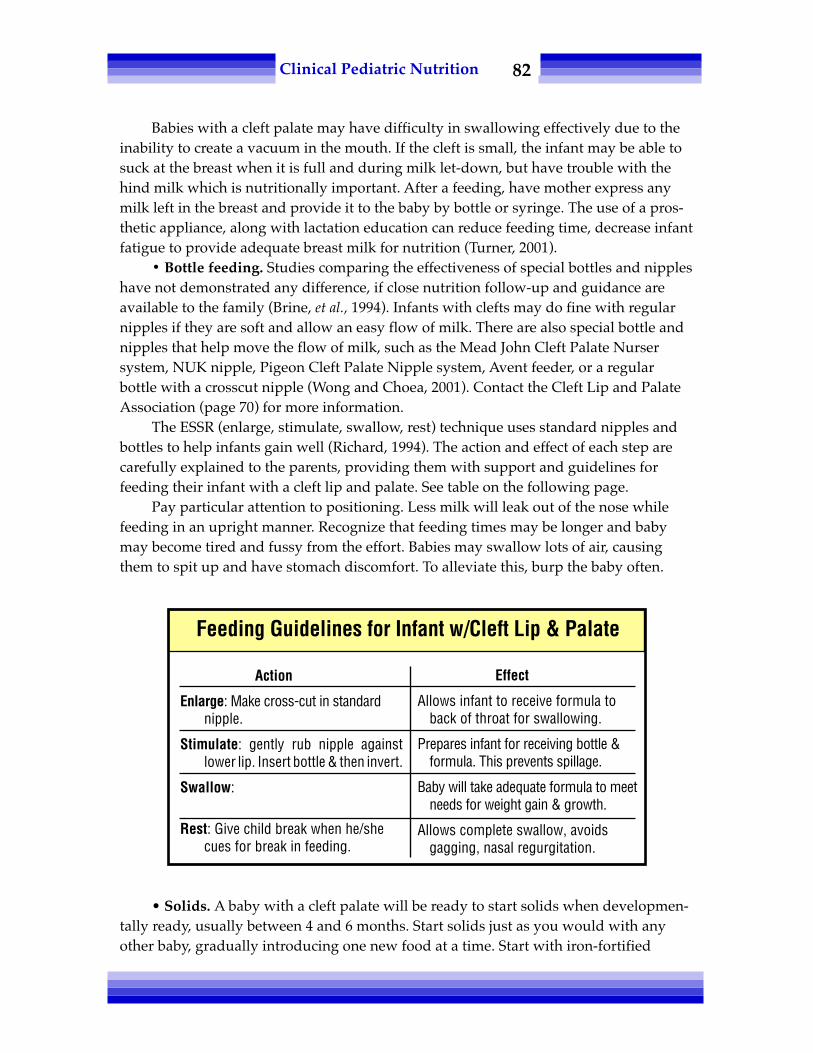
82Clinical Pediatric Nutrition
Babies with a cleft palate may have difficulty in swallowing effectively due to theinability to create a vacuum in the mouth. If the cleft is small, the infant may be able tosuck at the breast when it is full and during milk let-down, but have trouble with thehind milk which is nutritionally important. After a feeding, have mother express anymilk left in the breast and provide it to the baby by bottle or syringe. The use of a pros-thetic appliance, along with lactation education can reduce feeding time, decrease infantfatigue to provide adequate breast milk for nutrition (Turner, 2001).
• Bottle feeding. Studies comparing the effectiveness of special bottles and nippleshave not demonstrated any difference, if close nutrition follow-up and guidance areavailable to the family (Brine, et al., 1994). Infants with clefts may do fine with regularnipples if they are soft and allow an easy flow of milk. There are also special bottle andnipples that help move the flow of milk, such as the Mead John Cleft Palate Nursersystem, NUK nipple, Pigeon Cleft Palate Nipple system, Avent feeder, or a regularbottle with a crosscut nipple (Wong and Choea, 2001). Contact the Cleft Lip and PalateAssociation (page 70) for more information.
The ESSR (enlarge, stimulate, swallow, rest) technique uses standard nipples andbottles to help infants gain well (Richard, 1994). The action and effect of each step arecarefully explained to the parents, providing them with support and guidelines forfeeding their infant with a cleft lip and palate. See table on the following page.
Pay particular attention to positioning. Less milk will leak out of the nose whilefeeding in an upright manner. Recognize that feeding times may be longer and babymay become tired and fussy from the effort. Babies may swallow lots of air, causingthem to spit up and have stomach discomfort. To alleviate this, burp the baby often.
• Solids. A baby with a cleft palate will be ready to start solids when developmen-tally ready, usually between 4 and 6 months. Start solids just as you would with anyother baby, gradually introducing one new food at a time. Start with iron-fortified
Action
Enlarge: Make cross-cut in standardnipple.
Stimulate: gently rub nipple againstlower lip. Insert bottle & then invert.
Swallow:
Rest: Give child break when he/shecues for break in feeding.
Effect
Allows infant to receive formula toback of throat for swallowing.
Prepares infant for receiving bottle &formula. This prevents spillage.
Baby will take adequate formula to meetneeds for weight gain & growth.
Allows complete swallow, avoidsgagging, nasal regurgitation.
Feeding Guidelines for Infant w/Cleft Lip & Palate

83Clinical Pediatric Nutrition
cereals, strained fruits and vegetables and gradually progress to finger foods such ascrackers and dry toast.
Some foods may become stuck in the cleft. Although this is not dangerous, it maybe uncomfortable. Limit sticky foods such as peanut butter and processed cheese orsoft bread and even graham crackers. If food remains in the cleft, clean the mouth andcleft with a soft cloth and water. Avoid foods that may cause soreness, such as citrus orspicy foods.
Feeding right after cleft lip or palate surgery is controversial and most likely willdepend on the surgeon. Cohen and colleagues (1992) studied the effects of postopera-tive tube and syringe feeding compared to unrestricted breast or bottle feeding, notingno difference in wound complications.
RESOURCES
Cleft Palate Foundation Cleft Lip and Palate Association (CLAPA)104 S. Estes Drive, Suite 204 138 Buckingham Palace RoadChapel Hill, NC 27514 London UK SW19SA1-800-242-5338 www.clapa.comwww.cleftline.org email: [email protected]
Looking Forward: A Guide for Parents of the Child with Cleft Lip and Palateby Mead Johnson CompanyEvansville, IN 477211-812-429-6399
Avent America1-800-542-8368www.aventamerica.com
REFERENCES
Acosta P. Energy and protein requirements of infants and children with inherited metabolic disorders.Metabolic Currents, Ross Labs 6(2), 1993.
Acosta P, Yanicelli S, et al. Nutrient intakes and physical growth of children with phenylketonuria under-going nutrition therapy. JADA 103(90): 1167-1173, 2003.
__________ American Academy of Pediatrics, Committee on Fetus and Newborn. Pediatrics 96(5): 974-976,1995.
__________ American Dietetics Association (ADA) Manual of Clinical Dietetics, ADA Chicago IL 1988.Brandi I, Sticker EJ, Lentze MJ. Catch-up growth of head circumference of very low birth weight, small for
gestational age preterm infants and mental development to adulthood. J Pediatr 142(4): 459-461, 2003.Brine E, Rickard K, Brady M, et al. Effectiveness of two feeding methods in improving energy intake and
growth of infants with cleft palate: A randomized study. JADA 94(7): 732-738, 1994.Bryson S, Theriot L, Ryan N, et al. Primary follow-up care in a multidisciplinary setting enhances catch-up
growth of very-low-birth-weight infants. JADA 97: 386-390, 1997.Carlisle D. Feeding babies with cleft lip and palate. Nurs Times 94(4): 59-60, 1998.

84Clinical Pediatric Nutrition
Cohen M, Marschall M and Schafer M. Immediate unrestricted feeding of infants following cleft lip andpalate repair. J Craniofacial Surg 3(1): 30-32, 1992.
__________ CPS-Canadian Paediatric Society, Nutrition Committee. Nutrient Needs and feeding ofpremature infants. Can Med Assoc J 152(11): 1765-1785, 1195, Reaffirmed 2000.
Duran G, et al. Necessity of complete intake of phenylalanine-free amino acid mixture for metaboliccontrol of phenylketonuria. JADA 99: 1559-1563, 1999.
Ekvall S, ed. Pediatric Nutrition in Chronic Diseases and Developmental Disabilities. Oxford Univ Press, 1993.Guo SS, et al. Growth in weight, recumbent length, and head circumference for preterm low-birth-
weight infants during the first three years of life using gestation-adjusted ages. Early Hum Dev47(3): 305-325, 1997.
Guo SS, et al. Weight-for-length reference data for preterm, low-birth-weight infants. Arch of Ped and AdolMed 150: 964-970, 1996.
Habel A, Sell D and Mars M. Management of cleft lip and palate. Arch Dis Child 74: 360-366, 1996.Leonard JV. The nutritional management of urea cycle disorder. J Pediatr 138(1suppl): S40-S45, 2001.Marriott LD, Foots KD. Advances in the nutrition of preterm infants. JR Soc Health 123(3): 159-164, 2003.Pipes P. Nutrition In Infancy and Childhood, 4th ed. Times Mirror/Mosby, College Publishing, 1989.Poustie V, Rutherford P. Dietary interventions for phenylketonuria. Cochrane Review Abstracts, Jan 2001.Richard M. Weight comparisons of infants with complete cleft lip and palate. Ped Nurs 20: 191-196, 1994.__________ Ross Laboratories. Acosta P, Yannicelli S, eds. A practitioner’s guide to selected inborn errors of
metabolism. Ross Laboratories, 1992.Rao R, Georgieff M. Microminerals. In: Tsang R, Luca A, Uauay R and Zlotkin S. Nutritional Needs of the
Preterm Infant: Scientific Basis and Practical Guidelines, 2nd ed. Philadelphia PA: Williams and Wilkins,2005.
Singh R, Kable J, Guerrero N, et al. Impact of a camp experience on phenylalanine levels, knowledge,attitudes, and health beliefs relevant to nutrition management of phenylkentonuria in adolescentgirls. JADA 100: 797-803, 2000.
Trahms C. Overview of assessment of nutritional status for children with metabolic disorders. NutritionFocus May/June, 1995.
Tsang R, Lucas A, Uauy R, et al. Nutritional Needs of Preterm Infants: Scientific Basis and Practical Guidelines.Williams and Wilkins, 1993.
Turner L, Jacobsen C, et al. The effects of lactation education and a prosthetic obturator appliance onfeeding efficiency in infants with cleft lip and palate. Cleft Palate Craniofac J 38(5): 519-524, 2001.
Wong J, Choea M. Dietary and feeding needs of children with cleft lips and/or palates. Nutrition Focus16(4), July/Aug, 2001
Yannicelli S, Acosta PF, et al. Improved growth and nutrition status in children with methylmalonic orpropionic academia fed an alemental medical food. Mol Genet metab 80(1-2): 181-188, 2003.
Zerzan J. Nutrition care for the premature infant after discharge from the hospital. Nutrition Focus Jan/Feb, 1993.

85Clinical Pediatric Nutrition
Chapter Eight:Nutritional Concernsin Infants & Children
MALNUTRITION
Waterlow (1974) defines malnutrition as a “state of ill health which can be im-proved by qualitative or quantitative changes in the diet.” Malnutrition in infancy orchildhood due to primary inadequate intake, or secondary to infection, injury, chronicdisease or malabsorption, adversely effects growth and development.
A child deprived of adequate calories will conserve energy by first breaking downadipose stores and then muscle stores, resulting in no weight gain or even weight loss.After a prolonged period of poor nutrition, linear growth deteriorates. Severe malnutri-tion during periods of rapid brain growth reduces the number of cells, resulting incompromised head growth and neurological impairment. Depending on the age of thechild and the severity and duration of malnutrition, the effects on physical and cogni-tive development can be permanent.
Malnutrition is also poor nutrition. A child may be getting ample calories forgrowth but be consuming a diet that is deficient in essential nutrients. Severely restric-tive diets or those lacking in variety often lack adequate protein, vitamins or mineralsfor basic metabolic processes. Children with poor nutrition are more difficult to identifyas their growth parameters may be normal, but subclinical and biochemical abnormali-ties may be present. These conditions may result in unfavorable outcomes in the follow-ing areas: learning, alertness and activity. Malnourishment inevitably leads to increasedsusceptibility to disease, delayed wound healing, reduced response to interventions andtreatments, and altered drug metabolism.

86Clinical Pediatric Nutrition
NUTRITION ASSESSMENT: MALNUTRITION
• Anthropometric data. Growth is the primary indicator of malnutrition. Abnor-malities in weight gain and linear growth provide detectable indicators of protein-caloriemalnutrition in the pediatric population. Measure and assess weight, length or height,OFC (under 3 years), mid-arm circumference and both triceps and subscapular fatfolds.
Calculate body composition parameters for fat and muscle stores. Compare mea-surements against height-for-age, as opposed to chronologic age, because arm circumfer-ence is height-dependent. Most researchers now use skinfold measurements as a standardfor assessment of nutritional status in children with neurodevelopmental disability(Canadian Paediatric Society, 2000). Changes in body composition will accompany weightloss with an initial decline in adipose stores followed by a decrease in muscle reserves.Variables below the 5th percentile may be indicative of protein and calorie malnutrition. Itis essential to evaluate the growth trend over time, as well as the child's BMI or weight/length for assessment of proportionality.
Refer to the table below to describe the degree of malnutrition in each example.
• Weight-for-age deficit is a basic indicator of acute malnutrition (Gomez, et al., 1956):Actual body weight ÷ ideal body weight-for-age X 100 = percentage of ideal
weight-for-age.Example: 6 month-old girl who weighs 6 kg is mildly malnourished characterized
by 83 percent weight-for-age (6 ÷ 7.2 times 100 = 83 percent).• Wasting illustrates a deficit in weight for stature (Waterlow, 1973):Actual weight ÷ ideal weight-for-length or height X 100 = percentage of weight-for-
height.Example: 9 year-old boy weighs 23 kg. Height is 128 cm. Ideal weight-for-height is
25.75 kg. He is 89 percent of ideal weight-for-height or mildly malnourished.• Stunting is a deficit in height-for-age that occurs after prolonged (chronic)
malnourishment. The degree of malnutrition is reflected in a low height-for-agedespite adjustment for genetic height potential.
Acute malnutrition: Wasting:weight for age weight for height
(Gomez, et al., 1956) (Waterlow, 1973)Degree of malnutrition Percentage of standard
Normal >90 >90Mild 75-90 81-90Moderate 60-74 70-80Severe <60 <70
Adapted from Wright, 1994.
Classification of Malnutrition

87Clinical Pediatric Nutrition
Actual height ÷ Ideal height-for-age times 100 = percentage of height-for-age.Example: A 7-year-old boy is 113 cm. Ideal height for a 7-year-old boy is 122 cm. 113÷ 122 times 100 = 93 percent height-for-age. This is indicative of mild stunting.
• Dietary data. Estimate energy needs based on calories for catch-up growth.Calculate protein needs using ideal weight for height, not actual weight. Forfluid needs, use ideal — not actual — weight. For micronutrients, one to one-and-a-half times RDA is indicated, unless repletion needs are identified thoughbiochemical studies.
• Biochemical data. Interpret laboratory values cautiously due to effects of starvationon metabolism, infection process or drug interactions. Tests should include acomplete blood count; if the hematocrit and/or hemoglobin levels are low, furtherinvestigation of iron status is warranted. Evaluate visceral protein status, lean bodymass, and immunologic function. Consider evaluation of calcium, carotene, phos-phorus, prothrombin (as an indicator of vitamin K status), and vitamins A and E.
• Clinical data. Several clinical signs are associated with nutritional deficiencies(see Chapter Four).
Growth stunting on the basis of height for age:95-100 percent of standard height for age = normal90-95 percent of standard height for age = mildly stunted85-90 percent of standard height for age = moderately stunted<85 percent of standard height for age = severely stunted
Adapted from Wright, 1994.
Growth Stunting
A 26-month-old boy weighs 10.6 kg, is 89 cm in length and has an OFC of 49cm. Classify the degree of malnutrition and estimate calorie and protein needs:
Weight/age = <5th percentile Ideal wt/age = 13 kg
Finding: wt/age is 85% of standard and is indicative of mild malnutrition
Ideal wt/ht-age = 12 kg. Finding: mild wastingLength/age = 10th percentile. Finding: no stunting
Diagnosis: Child is mildly malnourished.Calorie needs: 102 kcal X 12-13 kg ÷ 10.6 kg = 115 – 125 kcal per kg of
actual weightProtein needs: 1.2 gm of protein X 12-13 kg = 14.5 – 15.6 gm protein/ day
Practice Problem

88Clinical Pediatric Nutrition
NUTRITION INTERVENTIONS: MALNUTRITION
For the mildly malnourished child, use techniques for increasing the caloric den-sity of formula or foods (see Appendices #12 and 13). Assure adequate hydration.Recommend a vitamin and mineral supplement with iron and zinc.
In the acute stages of rehabilitation, a child may need supplemental nutritionsupport (i.e. tube feeding). It is possible that a child with moderate or severe malnutri-tion may benefit from an elemental or semi-elemental enteral formula to maximizeabsorption during the initial phase of nutrition rehabilitation.
For long-term rehabilitation, consider a standard intact protein enteral productonce the child is past the risk of gut permeability. For the severely malnourished child, aperiod of hospitalization may be necessary.
Initially the focus should be rehydration and achieving/maintaining electrolytebalance. Once these initial goals are achieved nutritional rehabilitation should be initi-ated, keeping in mind that these children are at high risk for developing refeedingsyndrome. Nutrient intake should be started at the level equivalent prior to admissionto hospital (if unable to determine this, start with 70 percent REE). Calorie and proteinintake should be gradually advanced while concurrently monitoring electrolyte statusclosely. With refeeding syndrome, it may be necessary to replete potassium, magnesiumand phosphorus.
FAILURE TO THRIVE
Failure to thrive (FTT) has no agreed-upon official definition but in general thisterm describes a condition of inadequate intake to meet nutritional requirements basedon appropriate growth standards. FTT is defined by inadequate physical growth; thevarious diagnostic criteria associated with the condition are:
• Weight-for-age is less than the 5th percentile,• Weight-for-length is less than the 5th percentile,• A decrease in weight gain and growth velocity or downward crossing of at least
two major growth channels,• Weight less than 90 percent of ideal for genetic height potential, and• Subcutaneous fat stores below the 5th percentile (Krugman, 2003; Shah, 2002).
The etiology of FTT is generally organized into organic and non-organic riskfactors; however, these factors are not mutually exclusive but overlap in a complexmixture of physical and psychosocial issues. Causes of FTT that are organic in natureinclude physical problems of the child causing poor food intake, loss of nutrients, and/or impaired absorption and metabolism. Non-organic risk factors include neglect,poverty, deliberate withholding of food (abuse), errors in formula preparation,breastfeeding problems, or misguided dietary beliefs.
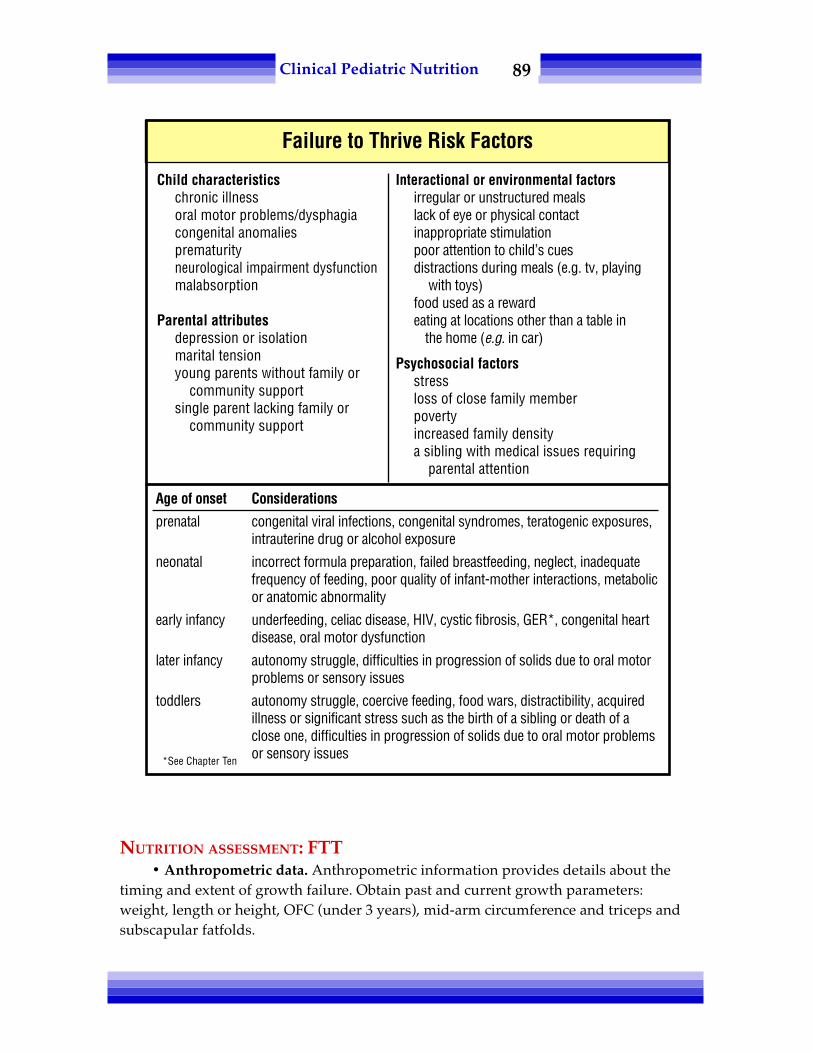
89Clinical Pediatric Nutrition
NUTRITION ASSESSMENT: FTT• Anthropometric data. Anthropometric information provides details about the
timing and extent of growth failure. Obtain past and current growth parameters:weight, length or height, OFC (under 3 years), mid-arm circumference and triceps andsubscapular fatfolds.
Child characteristicschronic illnessoral motor problems/dysphagiacongenital anomaliesprematurityneurological impairment dysfunctionmalabsorption
Parental attributesdepression or isolationmarital tensionyoung parents without family or
community supportsingle parent lacking family or
community support
Interactional or environmental factorsirregular or unstructured mealslack of eye or physical contactinappropriate stimulationpoor attention to child’s cuesdistractions during meals (e.g. tv, playing
with toys)food used as a rewardeating at locations other than a table in
the home (e.g. in car)
Psychosocial factorsstressloss of close family memberpovertyincreased family densitya sibling with medical issues requiring
parental attention
Failure to Thrive Risk Factors
Age of onset Considerations
prenatal congenital viral infections, congenital syndromes, teratogenic exposures,intrauterine drug or alcohol exposure
neonatal incorrect formula preparation, failed breastfeeding, neglect, inadequatefrequency of feeding, poor quality of infant-mother interactions, metabolicor anatomic abnormality
early infancy underfeeding, celiac disease, HIV, cystic fibrosis, GER*, congenital heartdisease, oral motor dysfunction
later infancy autonomy struggle, difficulties in progression of solids due to oral motorproblems or sensory issues
toddlers autonomy struggle, coercive feeding, food wars, distractibility, acquiredillness or significant stress such as the birth of a sibling or death of aclose one, difficulties in progression of solids due to oral motor problemsor sensory issues*See Chapter Ten

90Clinical Pediatric Nutrition
Plot data on appropriate growth chart. Evaluate degree of malnutrition per classifi-cations in previous section: weight-for-age (percent of weight-for-age); length or height-for-age (percent of current height or length/standard height-for-age to determinestunting); OFC-for-age; and relationship of weight-for-height (percent of currentweight/ideal weight-for-height to determine wasting).
Calculate body composition.
• Dietary data. The dietary history and recall often provide clues to the etiology ofgrowth failure. Commonly identified problems include over-dilution of formula, restric-tion of food textures (e.g. 5-year-old still taking commercial baby foods), infrequentfeedings, or underfeeding. Juice consumption of 12 to 30 oz/day is directly correlated toa deterioration of weight and linear growth (Smith and Lifshitz, 1994). Closely scruti-nize usual intake and analyze it for nutrient value.
Determine feeding patterns, such as mealtime and snack structure, type of seating,food struggles, and mealtime environment.
Evaluate the psychosocial feeding experience. A more in-depth interview canreveal parental emotions about feeding, cultural issues, autonomy struggles, andconcerns of the exceedingly fastidious parent. Note any religious or philosophicaldeterminants of food choices. Observation of a feeding will provide information aboutthe parent-child interaction, mechanical feeding problems, coercive feeding, and theprospects of a highly distractible child. The NCAST (Nursing Child AssessmentFeeding Scale) program is a standardized tool that evaluates the parent-child interac-tion. Contact: NCAST, Univ. of Washington, Box 357920, Seattle, WA 98195-7920.Phone: (206) 543-8528, FAX: (206) 685-3284.
Estimate nutritional goals for calories, protein, fluids and micronutrients:• Calories: Base calorie requirements using the formula for catch-up growth:
Ideal body weight ÷ actual body weight X RDA for height-ageor use 150 percent RDA (Ashworth, 1986).
• Protein: Calculate needs using ideal, not actual, weight.Ideal body weight ÷ actual body weight X RDA for height-age
• Fluid: Use ideal, not actual, weight.• Micronutrients: Both iron and zinc deficiencies have been implicated in growth
failure. Studies have demonstrated improved growth rates for children whoreceive mineral supplements (Walravens, et al., 1989).
• Clinical data. Determine medical status of the child, elimination patterns andinvestigate developmental history. Review the age of onset of failure to thrive as thiscan provide clues to feeding problems. There are distinct age-related variables thatimpact risk factors, as shown in the chart on the previous page.

91Clinical Pediatric Nutrition
GOALS AND STRATEGIES: FTTThe goal of nutrition therapy is to promote “catch-up” growth and achievement of
optimal nutrition status. Interventions for nutritional rehabilitation should be individual-ized, depending on the etiology of FTT and needs of the family. For the severely malnour-ished child, increase energy gradually to avoid the refeeding syndrome. In general:
• Provide guidelines for increasing the caloric density of formula (Appendix #12)and meals (Appendix #13). Consider oral supplements. Enteral or parenteralnutrition may be necessary given the severity of the failure to thrive.
• Arrange for contact with available community resources such as WIC, foodbanks, food stamps and other local resources.
• Recommend a multi-vitamin and mineral supplement with iron and zinc.• Provide guidelines on appropriate feeding strategies as described below.
Biochemical Data: FTT
Basic Additional studies Radiological studies
Complete blood count Lead Chest XrayUrinalysis Thyroid studies Upper GIUrine culture Sweat chloride Gastric emptying
Stool fat studyStool elastaseStool ova and parasitesStool reducing substancesAlbumin or prealbuminVitamin levelsUrine metabolic screenHIV
Mealtime Strategies: FTT
• Use positive reinforcement and praise for good behavior.• Make eye contact with the child.• Relax, avoid conflict during mealtimes; make mealtimes pleasant:
– Turn off the television or any other distractions.– Have a set schedule for meals and snacks.– Avoid battles over eating.– Provide nutritious food, let child decide how much to eat.
• Do not use food as a punishment or a reward.• Let the child be messy and explore new foods.• Try to eat together as a family and model desired behaviors.• Avoid excessive consumption of juices, soda, water, and milk.• Learn to recognize a child's cues for hunger, satiety and food preference.

92Clinical Pediatric Nutrition
CASE STUDY
A 15-month-old male presents to the pediatrician with persistent FTT, diarrhea andemesis. The boy is transferred directly from the physician's office to the emer-gency department (ED).
Diet history: exclusively breast-fed until he was 6 months of age. At 1 month ofage, he developed bloody stools and the pediatrician presumed the diagnosis ofcow's milk protein allergy. The child's mother was advised to avoid dairy in herdiet — she chose to use rice-based products rather than soy due to taste prefer-ence. After the mother changed her diet, there was complete resolution of theinfant's GI symptoms.
At 6 months of age, mom reports an appropriate introduction of complementaryfoods; the only exception was that the child continued on a dairy-free diet. Themother reports that breast milk was the only liquid that this child consumeduntil mom started weaning breastfeeding approximately two weeks prior topresentation to the ED. During the breastfeeding weaning, feedings have beensupplemented with Good Start 2 Supreme Soy® based on the pediatrician'srecommendations due to history of poor weight gain and presumed cow's milkallergy. The child developed persistent emesis and diarrhea.
Upon admission to the hospital, the gastroenterologist is suspicious that this childhas a cow's milk protein and soy allergy. Elecare 30 cal/oz® is initiated assupplemental nasogastric tube (NGT feedings) because the child refuses to drinkthis formula. Despite the use of an elemental and hypoallergenic formula, thediarrhea and emesis continued. After a three day trial on the Elecare, the teamconcluded that the child was so allergic to soy that he was reacting to the soy oilin the Elecare (despite the fact that oils are typically so refined that they do notcontain any offending proteins).
Question: What other formulas would be appropriate for his age and clinical issues?Which one is preferrable, and why?
Answers:a. Neocate Juniorb. Neocate One +c. EO28 Splash
Neocate Junior contains more calcium and phosphorus.(This case study is adapted from materials created by Jen Thorpe, RD, MBA, LDN)

93Clinical Pediatric Nutrition
OBESITY
Obesity is excessive fat. Early onset of obesity is more severe and resistant totreatment than obesity acquired later in life, and the majority of obese children becomeobese adults (Lloyd, et al., 1961). Genetics play a major role in obesity, however, theprevalence of obesity has increased greatly over the past few decades due to a decreasein physical activity and changes in lifestyle choices (Francis, et al., 1999).
Obesity is a major health hazard in the United States, but what used to be prima-rily an adult health concern has now become a very real issue for children too. Theprevalence of pediatric obesity has tripled since 1980 in the 6 to 19-year age group(Copperman, 2007). It is a major health risk for children and predisposes them to earlyonset of chronic diseases such as hypertension, cardiovascular disease, and diabetes.The use of fat-restricted diets can be contended, as there is no evidence that this willprevent adult atherosclerosis and may in fact potentiate a preference for those restrictedfoods (Olson, 2000). A more moderate approach may be realistic (Satter, 2000).
Prevention of obesity is necessary to decrease the prevalence in society. Familybased obesity intervention needs to target not only the biophysical elements, butchanges in activity, and family/social functioning (Wilkins, et al., 1998).
The Body Mass Index (BMI) is used as a screening tool to identify individuals whoare overweight (Dietz and Bellizzi, 1999; Odgen, 2004). BMI-for-age can be evaluated forchildren over 2. Evaluating the BMI of a child or adolescent is different from assessingan adult's BMI.
The evidence shows treatment strategies such as caloric restriction, exercise, andbehavioral therapy are only moderately effective (Fowler-Brown, 2004). Interventionneeds to be a national priority with changes targeted at industry and media, along witheducation and more healthful opportunities (Institute of Medicine, 2004).
Evaluation of Obesity and Overweight
BMI-for-age ≥95th %ile or BMI >30 (whichever is lower) Obese
BMI-for-age 85 to 94th %ile Overweight
Weight-for-length >95th %ile Overweight
Online BMI calculators:http://apps.nccd.cdc.gov/dnpabmi/Calculator.aspxhttp://www.kidsnutrition.org/bodycomp/bmiz2.html
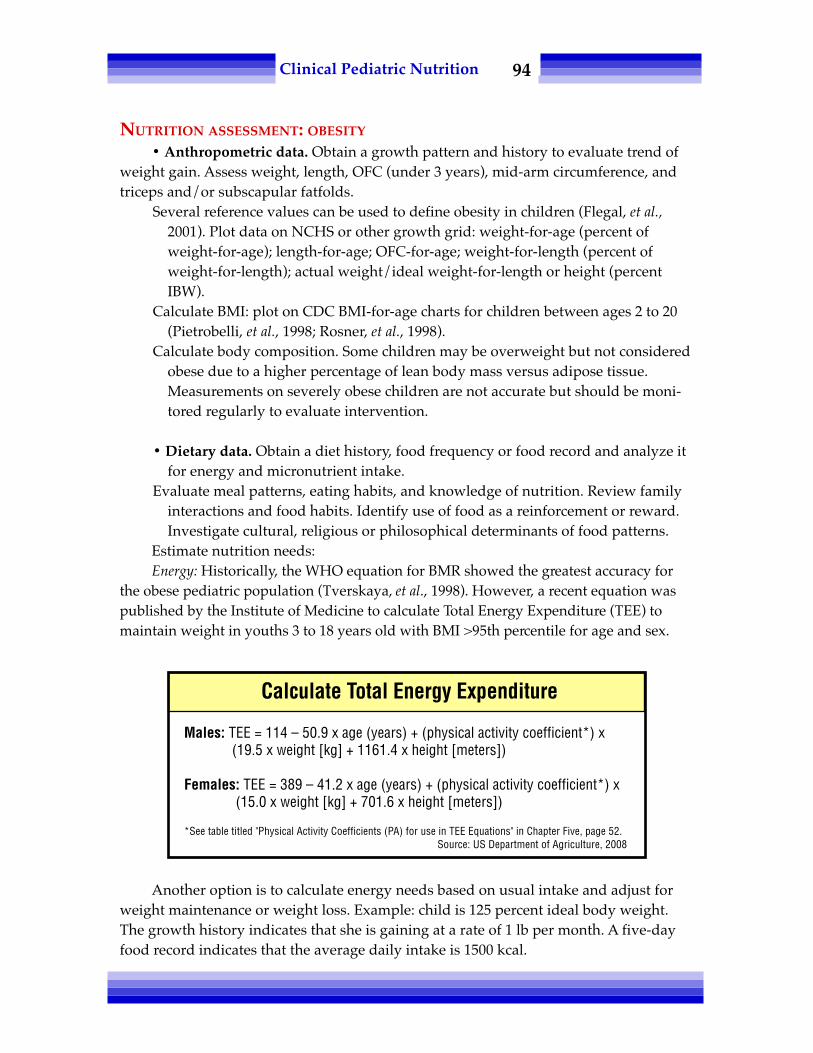
94Clinical Pediatric Nutrition
NUTRITION ASSESSMENT: OBESITY
• Anthropometric data. Obtain a growth pattern and history to evaluate trend ofweight gain. Assess weight, length, OFC (under 3 years), mid-arm circumference, andtriceps and/or subscapular fatfolds.
Several reference values can be used to define obesity in children (Flegal, et al.,2001). Plot data on NCHS or other growth grid: weight-for-age (percent ofweight-for-age); length-for-age; OFC-for-age; weight-for-length (percent ofweight-for-length); actual weight/ideal weight-for-length or height (percentIBW).
Calculate BMI: plot on CDC BMI-for-age charts for children between ages 2 to 20(Pietrobelli, et al., 1998; Rosner, et al., 1998).
Calculate body composition. Some children may be overweight but not consideredobese due to a higher percentage of lean body mass versus adipose tissue.Measurements on severely obese children are not accurate but should be moni-tored regularly to evaluate intervention.
• Dietary data. Obtain a diet history, food frequency or food record and analyze itfor energy and micronutrient intake.
Evaluate meal patterns, eating habits, and knowledge of nutrition. Review familyinteractions and food habits. Identify use of food as a reinforcement or reward.Investigate cultural, religious or philosophical determinants of food patterns.
Estimate nutrition needs:Energy: Historically, the WHO equation for BMR showed the greatest accuracy for
the obese pediatric population (Tverskaya, et al., 1998). However, a recent equation waspublished by the Institute of Medicine to calculate Total Energy Expenditure (TEE) tomaintain weight in youths 3 to 18 years old with BMI >95th percentile for age and sex.
Another option is to calculate energy needs based on usual intake and adjust forweight maintenance or weight loss. Example: child is 125 percent ideal body weight.The growth history indicates that she is gaining at a rate of 1 lb per month. A five-dayfood record indicates that the average daily intake is 1500 kcal.
Calculate Total Energy Expenditure
Males: TEE = 114 – 50.9 x age (years) + (physical activity coefficient*) x(19.5 x weight [kg] + 1161.4 x height [meters])
Females: TEE = 389 – 41.2 x age (years) + (physical activity coefficient*) x (15.0 x weight [kg] + 701.6 x height [meters])
*See table titled "Physical Activity Coefficients (PA) for use in TEE Equations" in Chapter Five, page 52.Source: US Department of Agriculture, 2008

95Clinical Pediatric Nutrition
A 1 lb gain per month correlates to average overabundance of 116 kcal daily: (1 lb X3500 kcal/lb or 7.7 kcal/gm) ÷ 30 days per month = 116 kcal per day.
To achieve weight maintenance, intake needs to be reduced 116 kcal (1500 – 116 =~1385 kcal/day). For a 1 lb weight loss per month, a 232 kcal/day deficit is required.When guesstimating energy needs, be sure to evaluate activity or energy expenditure.
To estimate needs without a history of weight gain, calculate energy needs on calo-ries per centimeter of height and adjust for maintenance or weight loss (see Chapter Five).
• Protein: Base protein needs on ideal weight.• Micronutrients: Provide vitamins and minerals at RDA for age.• Biochemical data. If child is on a severe weight reduction protocol, monitor
serum proteins and electrolytes regularly.• Clinical and other data. Determine medical status and maturation stage. Obtain
information on family history of obesity. Evaluate the family and child’s feelings regard-ing his/her weight and obesity. Identify social relationships, mental functioning, andemotional and psychological status. Determine exercise and activity schedule.
GOALS AND STRATEGIES FOR NUTRITIONAL THERAPY: MODERATE OBESITY
Weight goals and intervention strategies vary based on age and severity of obesity.
Weight Goals & Intervention Strategies
Age2-5 years
2-5 years
2-5 years
6-11 years
6-11 years
6-11 years
12-18 years
12-18 years
12-18 years
BMI & ClassificationOverweightBMI 85-94th %ileObeseBMI ≥95th %ile
ObeseBMI ≥21OverweightBMI 85-94th %ileObese95-98th %ile
Obese≥99th %ileOverweightBMI 85-94th %ileObese95-98th %ileObese99th %ile
Weight goalsWt. maintenance until BMI <85th%ile or a slower rate of weight gainWt. maintenance until BMI <85th%ile. Any weight loss should belimited to ≤1 lb/monthGradual wt. loss. Weight loss shouldbe limited to ≤1 lb/monthWt. maintenance until BMI <85th%ile or a slower rate of weight gainWt. maintenance until BMI <85th%ile or gradual wt. loss of approxi-mately 1 lb/monthWt. loss averaging 2 lb/week
Wt. maintenance until BMI <85th%ile or a slower rate of weight gainWt. loss (≤2 lb/week) until BMI <85th%ileWt. loss averaging 2 lb/week
Adapted from: Copperman, 2007
96Clinical Pediatric Nutrition
Intervention should be focused on appropriate diet, regular physical activity, andbehavioral changes and emphasize a long term approach (Lyznicki, et al., 2001). Theapproach to healthy eating and weight loss must be a family matter. The family must beinvolved and supportive, and must acknowledge the need for weight control. It is coun-terproductive to single out a child and withhold foods that the rest of the family is eating.
Investigate the motivation for losing weight. Develop an individualized nutritioncare plan based on the child’s food preferences, food allergies, feeding skills, thefamily’s resources, and estimated nutritional needs.
Provide dietary guidelines on content and timing of meals and snacks. Provideideas of appropriate types of foods to be available to the child at home, at school, and atother places. Limit, but do not restrict, high calorie foods. Initiate behavior modificationstrategies. Motivational interviewing is a technique that is being used with some suc-cess in performing nutrition counseling with adolescents. Encourage parents to modelhealthy food choices.
Recommend a multiple vitamin and mineral supplement, as foods low in energymay be lacking in nutrient requirements.
Do not use food as a reward. Encourage physical activity. Try friendly encourage-ment to get the child to make appropriate food choices. Promote high self-esteem.
Limit exposure to television and other food advertisements (Borzekowski andRobinson, 2001; AAP, 2003). Limit time spent playing video games and on the internet.Incorporate physical activity (Krebs and Johnson, 2000).
Monitor the child’s weight and linear growth regularly. Re-evaluate the nutritioncare plan according to the child’s changing needs. Helping a child succeed in weightmaintenance or loss often requires the support of a team including the family, child,pediatric dietitian, physician, and behavioral therapist.
REFERENCES
AAP American Academy of Pediatrics. Committee on Nutrition. Prevention of pediatric overweight andobesity. Pediatrics 112:424-430, 2003. Available at: http://pediatrics.aappulications.org/cgi/content/full/112/424?eaf
Ashworth M. Catch-up growth in children. Nutrition Reviews 44: 157, 1986.Borzekowski D, Robinson T. The 30-second effect: An experiment revealing the impact of television
commercials on food preferences of preschoolers. JADA 101(1): 42-46, 2001.__________ Canadian Paediatric Society. Nutrition Committee Canadian Medical Assoc J 151(6):753-759, 1994,
2000.Casey S. Failure to thrive: A challenge that warrants teamwork. Nutrition News Jan/Feb, 1989.Copperman N. Nutrition Management of Overweight and Obesity. In: Amorde-Spalding K, Nieman L
(Eds). Pediatric Manual of Clinical Dietetics, 2nd ed. American Diabetes Association, Chicago, 2007.Dietz W, Bellizzi M. Introduction: the use of BMI to assess obesity in children. J Clin Nutr 70(suppl): 123s-
125s, 1999.__________ Expert Committee Recommendations on the Assessment, Prevention, and Treatment of Child
and Adolescent Overwight and Obesity (Appendix). Jan 25, 2007. <www.ama-assn.org/ama1/pub/upload/mm/433/ped_obesity_recs.pdf> Accessed Nov. 15, 2008.
Frewett RF, Kasese-Hara M, Wright C. Feeding behavior in young children who fail to thrive. Appetite40(1): 55-60, 2003.

97Clinical Pediatric Nutrition
Flegal K, Ogden C, Wei R, et al. Prevalence of overweight in US children: comparison of US growth chartsfrom the Centers for Disease Control and Prevention with other reference values for body massindex. Am J Clin Nutr 73(6): 1086-1093, 2001.
Francis C, Bope A, MaWhinney S, et al. Body composition, dietary intake, and energy expenditure innonobese, prepubertal children of obese and nonobese biological mothers. JADA 99(1): 58-65, 1999.
Frank D, Silva M and Needleman R. Failure to thrive: Mystery, myth, and method. Contemporary Pediatrics10(2): 114-133, 1993.
Gahagan S, Holmes R. A stepwise approach to evaluation of undernutrition and failure to thrive. PedClinics of North Amer 45: 169-187, 1998.
Gomez F, Calvan R and Frank S. Mortality in second and third degree malnutrition. J of Tropical Pediatrics2: 77, 1956.
________ Institute of Medicine. Overview of the IOM's Childhood obesity prevention study, September2004 fact sheet. www.iom.edu
Krebs N, Johnson S. Guidelines for healthy children: Promoting eating, moving, and common sense.JADA 100(1): 37-39, 2000.
Krugman S, Dubowitz H. Failure to thrive. Am Family Physician 68(5): 879-884, 2003.Lloyd J, Wolff O, Whelen W. Childhood obesity, a long-term study of height andweight. BMJ 2: 145-148,
1961.Lyznicki J, Young D, Riggs T, et al. Obesity: Assessment and management in primary care. Am Fam
Physician 63(11): 2139-2145, 2001.Ogden CL. Defining overweight in children using growth charts. Md Med 5(3): 19-21, 2004.Olson R. Is it wise to restrict fat in the diets of children? JADA 100(1): 28-32, 2000.Pietrobelli A, Faith M, et al. Body mass index as a measure of adiposity among children and adolescents: A
validation study. J Pediatr 132: 204-210, 1998.Rosner R, Prineas R, et al. Percentiles for body mass index in US children 5 to 17 years of age. J Pediatr 132:
211-222, 1998.Satter E. A moderate view on fat restriction for young children. JADA 100(1): 32-35, 2000.Shah MD. Failure to thrive in children. J Clin Gastroenterol 35(5): 371-375, 2002.Smith M and Lifshitz F. Excess fruit juice consumption as a contributing factor in nonorganic failure to
thrive. Pediatrics 93(3): 438-443, 1994.Trahms C, Pipes P. Nutrition in Infancy and Childhood. Times Mirror/Mosby, St. Louis, 1997.Tverskaya R, Rising R, et al. Comparison of several equations and derivation of a new equation for
calculating basal metabolic rate in obese children. Am Coll Nutr 17: 333-336, 1998.US Department of Agriculture. Dietary Guidelines for Americans, 2005. <www.healthierus.gov/
dietaryguidelines> Accessed Oct. 20, 2008.Walravens P, Hambridge M and Koepfer D. Zinc supplementation in infants with a nutritional pattern of
failure to thrive: A double-blind, controlled study. Pediatrics 83(4): 532-537, 1989.Waterlow J. Note on the assessment and classification of protein-energy malnutrition in children. Lancet
July 14: 87-89, 1973.Waterlow J. Some aspects of childhood malnutrition as a public health problem. BMJ 4: 88, 1974.Wilkins S, Kendrick O, Stitt K, et al. Family functioning is related to overweight in children. JADA 98(5):
570-574, 1998.

98Clinical Pediatric Nutrition
Notes

99Clinical Pediatric Nutrition
Chapter Nine:Pulmonary Disordersin Infants & Children
BRONCHOPULMONARY DYSPLASIA
Bronchopulmonary dysplasia (BPD) is a chronic lung disorder of infancy resultingfrom pulmonary damage associated with prematurity, prolonged mechanical ventila-tion, supplemental oxygen, and endotracheal intubation. Seventy-seven percent ofinfants born at less than 1000 gm birth weight and 32 weeks gestation will develop BPD(Bhandari, et al., 2003).
Babies and children with BPD are at high risk for growth failure because of in-creased metabolic demands, complications of respiratory disease, poor intake, andretention of food (Johnson, et al., 1998). Fatigue, shortness of breath with eating, delayedgastric emptying, anorexia related to medications, and illness contribute to risk ofmalnutrition. Very low birth weight infants who develop BPD are at the highest risk fordeveloping malnutrition (Biniwale, et al., 2006). Premature babies may also suffer aneurologic insult, predisposing them to feeding and swallowing difficulties. Moreover,a history of unpleasant oral experiences, such as intubation and suctioning, lays thegroundwork for oral feeding aversion.
NUTRITION ASSESSMENT FOR BPD• Anthropometric data. Growth is a good indicator of medical and nutritional
status. Studies have indicated that catch-up growth correlates with improvement inrespiratory symptoms. During the first four months past discharge, monitor weightweekly, and length and head growth monthly. Thereafter, measure every one to threemonths until one year of age or more often if growth is poor.
Obtain accurate and serial measurements of: weight, length or height, and OFC(under 2 years). Mid-arm circumference, and triceps and/or subscapular fatfolds maybe measured as well; however, there are no reference standards to utilize for comparisonfor infants (i.e. under one year old).

100Clinical Pediatric Nutrition
Plot parameters on premature charts or using corrected age on NCHS growthcharts: weight for corrected age, length or height for corrected age, weight for lengthand OFC for corrected age.
Calculate body composition parameters for fat and muscle reserves.
• Dietary data. Analyze dietary information for calories, protein, carbohydrate,vitamins, minerals, electrolytes and fluid by obtaining a food frequency, 24 hour recallor three- to five-day food record. When in hospital, the nursing flow sheet that recordsinput and output is most helpful to obtain the necessary information to analyze nutrientintake.
Assess acquisition of developmentally appropriate oral motor skills and feedingbehavior. Refer to an occupational or speech therapist for feeding evaluation and appro-priate feeding therapy. Consult with team to determine need for enteral feedings.
Problems with BPD
• obstructive emphysema & atelectasis• possibility of prolonged ventilatordependency & tracheostomy
• Up to 25% greater metabolic rateduring acute phase
• poor growth, severe failure to thrive• generalized weakness• impaired suck & swallow• gastroesophageal reflux &aspiration
• Reduced respiratory musclestrength
• chest malformation• hypoventilation with hypoxemia• interstitial fibrosis• hypercarbia, cyanosis, dyspnea• Cor pulmonale with fluid restriction
(heart disease secondary to diseaseof the lungs or blood vessels).
• poor intestinal perfusion
Common Medical Problems
• Interruption of nutrition support dueto respiratory instability
• Delayed initiation of enteral feeding• Delayed advancement from
parenteral to enteral nutritionsupport
• Severe fluid restriction• Dysphagia
• Concurrent organ dysfunction (e.g.congestive heart failure, congenitalheart disease, necrotizingentercolitis)
• Hypoxia resulting in poor suck/swallow
• Chronic respiratory acidosis
Causes of Growth Failure & Malnutrition

101Clinical Pediatric Nutrition
Assess risk of feeding difficulties, including: history of aversive oral experiences(such as intubation or gavage feeding), delayed introduction of solids, medicationsassociated with nausea and vomiting, poor oral motor coordination, fatigue and/ormealtime stresses.
• Nutrition goals. Estimated energy needs are 120 to 180 kcal/kg/day (Khalhan, etal., 1990; Kurzner, et al., 1988; Barrington, et al., 1998). Goals for nutrient intake shouldbe adjusted for changes in medical status, activity level, respiratory function, andgrowth rate. Use kcal/cm of height estimations for those with growth stunting. Patientswith chronic BPD who are medically stable and have optimal respiratory support oftenneed much fewer calories as compared to the acute phase of BPD.
• Macronutrients: Protein goals should be 7 to 12 percent of total calorie intake,from 2.5 to 4.5 gm/kg/day. Although some have proposed use of a high-fat dietto deter excessive carbon dioxide production, studies have revealed that lungfunction is not significantly changed with moderate carbohydrate/high fatregimens (Carlson, 2004). Excess fats may compromise gastric emptying (Gainingand Growing, 2000).
• Micronutrients: Needs may be slightly higher than the RDA. Consider medicationinteractions when using long term steroids or diuretics. Vitamin a status may beadversely affected by steroid therapy; monitor vitamin A status and supplementif appropriate (Atkinson, 2001). For children on diuretics, electrolytes, calcium,phosphorus, and magnesium should be monitored regularly. Supplementationof electrolytes, essential fatty acids, and trace elements and other supplementsmay be important to maximize nutritional rehabilitation (Sharma, 2002).
• Fluids: Often it is medically necessary to restrict fluid intake at 80 to 130 mL/kg/day, depending on the severity of the lung disease and the response to diuretics.Excessive fluid intake may contribute to the development of cor pulmonale(Weston, 2008). However, this fluid allowance is generally adequate to provideadequate nutrient intake by administering a calorically concentrated formula. Itis not recommended to concentrate infant formulas in excess of 27 to 30 kcal/oz.Monitor fluid balance by the number of wet diapers and signs or symptoms ofdehydration or overhydration.
• Biochemical data. In the outpatient setting, evaluate hematologic parametersevery two months until stable, and monitor every six to 12 months thereafter.
• Clinical data. Monitor oxygen status, fluid restriction, gastroesophageal refluxand overall medical status as it affects energy consumption. Evaluate feeding skills,fatigue, oral-tactile sensitivity, and psychosocial interactions.
102Clinical Pediatric Nutrition
GOALS AND STRATEGIES FOR BPD The goals of nutritional therapy are to achieve optimal nutritional status, to pro-
mote linear growth and appropriate weight gain, promote fluid balance, and to mini-mize the impact on feeding abilities and effect of medications on health.
It should be noted, however, that despite optimal clinical care and nutrition sup-port, patients with BPD are highly likely to have stunted linear growth to varyingdegrees due to administration of parenteral nutrition support until adequate enteralfeeds can be established, chronic steroid therapy, and lack of long bone stimulation.
The following strategies should be considered:• A comprehensive approach to growth failure using nutrition intervention, feeding
evaluation, parental support, and education. If growth chart demonstrates poor weightand linear growth, increase calories using formula concentration or high calorie strategies.It is also recommended to maximize protein intake (see macronutrient section above formore details) to promote accretion of lean body mass, rather than excessive fat stores. (SeeAppendices #12 and 13.) Continue to monitor growth closely.
• Creative approaches to the feeding experience. Provide gentle guidance, appro-priate positioning, and create a pleasant mealtime environment. Avoid any aversive oralexperiences. Gently introduce pleasant oral tactile exploration. Allow children theindependence appropriate for their developmental age and skill level. Enlist supportfrom the multidisciplinary feeding team.
• Scheduling meals separate from medications or therapies such as chest clappingor suctioning.
• Replacing nutrients lost due to medications — a multiple vitamin and mineralsupplement with iron and zinc; additional supplements of calcium and potassium(ADA, 1988). Infants with BPD are at risk of aspiration and need to be monitored closelyif respiratory deterioration or wheezing with feeding is noted.
• If gastroesophageal reflux is a factor, try thickening formulas. (See Chapter Ten.)Evaluate the need for supplemental enteral feeding. Consider continuous drip deliverymode if reflux is a problem. Oxygen status should be assessed during feeding as hypox-emia may contribute to poor growth. Tube feedings may be needed for infants or chil-dren with BPD who are on mechanical ventilators; however, in comparison to adults,some infants and children dependent on mechanical ventilator support are able tosafely take a portion (or even all) of their feeds orally.
CYSTIC FIBROSIS
Cystic fibrosis (CF) is an autosomal recessive disorder that is characterized bychronic lung disease and varying degrees of pancreatic insufficiency. The incidence rateis one in 3,500 live births in the US. CF is rare among African-Americans, Asians andNative Americans.
CF is an inherited disease of mucus and sweat glands. It affects the followingsystems or organs: lungs, pancreas, liver, intestines, sinuses, and sex organs. In a personwithout CF mucus is watery and functions to keep the linings of certain organs moistand prevents infection.

103Clinical Pediatric Nutrition
In persons affected with CF, mucus becomes thick and sticky resulting in accumu-lation of mucus in the lungs, which blocks the airways and leads to repeated lunginfections. Chronic infections can cause serious damage to the lungs. Also, CF-affectedpersons tend to be immunocompromised and may contract virulent bacterial infectionsthat are resistant to antibiotic treatment (e.g. pseudomonas).
In CF, mucus can also block ducts in the pancreas, which can lead to pancreaticinsufficiency and thus malabsorption. The malabsorption of fat is the main concern, andCF patients with pancreatic insufficiency are prescribed enzyme therapy to optimize fatabsorption. In conjunction with fat malabsorption, there is malabsorption of fat-solublevitamins (i.e. A, D, E and K). It is standard of care to prescribe a water-miscible fat-soluble vitamin supplement, and these products tend to contain additional zinc as well.
Diagnosis of CF was historically confirmed via a sweat test; however, a sweat testis not a valid tool in infants less than 6 months old. Some other methods utilized todiagnose CF include a gene mutation analysis and the testing of a stool specimen for thepresence of elastase-1. Over 1,000 mutations of the CF gene have been identified. Thepredicted median age of survival for a person with CF is more than 37 years(www.cff.org).
CF-related diabetes is also a potential manifestation. Interestingly, the typicalmethod of identifying diabetes (i.e. HbgA1C) is not useful in revealing CF-relateddiabetes. It is recommended instead to perform a glucose tolerance test. Many CFcenters are now taking steps to regularly screen patients for CF-related diabetes; inrecent years it has been recognized that this is a more common co-morbidity thanpreviously thought. Without early identification, proper dietary treatment and medicalinterventions, growth failure may be exacerbated.
Steatorrhea may not be pronounced, but most people affected by CF have insuffi-cient exocrine pancreatic function (Borowitz, et al., 2005). The hallmark of nutritiontherapy is the use of enteric-coated microtablet or microsphere pancreatic enzymes thatare broken down in the alkaline environment of the duodenum. The enzymes contain
Clinical Manifestations of Cystic Fibrosis
• Chronic cough• Wheezing or shortness of breath• Bronchial infections,
recurrent pneumonia• Abdominal cramps• Malabsorption, steatorrhea• Malnutrition, failure to thrive
• Growth failure (despite good appetitein some)
• Abnormally high concentration ofsodium & chloride in the sweat
• Sterility in males; decreased fertilityin females

104Clinical Pediatric Nutrition
primarily lipase, which breaks down fats, and small amounts of protease and amylasefor digestion of protein and carbohydrates, respectively. Enzyme replacement therapyshould be regulated closely by the dietitian and physician to assure adequate nutrientabsorption.
Powdered pancreatic enzymes do not have enteric coating, but these are commer-cially available. These enzymes are less frequently prescribed because they are lesseffective than the enteric-coated products. Determine dosing by careful monitoring ofstool pattern, growth, and gastrointestinal symptoms. Any item consumed that containsfat or protein requires enzyme replacement.
Dosing guidelines for enzyme replacement therapy are quite limited. Some litera-ture reports requirements of 500 to 4000 units of lipase per gram of fat consumed;however, in clinical practice the dose generally used is 1000 units lipase per kg per mealinitially, not to exceed a maximum dose of 2500 units lipase per meal (Borowitz, et al.,1995). Dosing exceeding 6000 units lipase per meal has been associated with fibrosingcolonopathy. Typically, snacks that contain fat and/or protein warrant a dose of en-zymes that is half of that used at a meal.
Because of the diverse needs of CF patients and their families, coordination oftreatment is best accomplished through a multidisciplinary approach at a CF centerwith an emphasis on nutrition education (Stapleton, et al., 2000). The Registered Dieti-tian is an essential member of the CF team and is the primary clinician to focus onmonitoring growth parameters, optimizing nutritional status and suggesting moreintensive nutritional interventions when appropriate.
Nutrition therapy is important because of increased energy requirements, decreasedintake and loss of nutrients. Factors which affect energy expenditure includes lungimpairment (Dorlochter, 2002), malabsorption, anorexia, and increased metabolic rate.
Energy Balance in Cystic Fibrosis
Barriers to adequate intake& absorption:
Malabsorption of protein & fatFatigue with oral feedsNausea & vomitingVomiting after excessive coughing
or chest physiotherapyLoss of fat-soluble vitamins with
malabsorption
Loss of bile acids whichexacerbates malabsorption
Pain w/refluxDepression
Factors that increaseenergy needs
Respiratory infectionsIncreased work of breathing

105Clinical Pediatric Nutrition
NUTRITION ASSESSMENT FOR CYSTIC FIBROSIS
• Anthropometric data. Obtain current and serial anthropometric data at least fourtimes during the first year of life and at regularly scheduled intervals thereafter (Stettler,et al., 2000). Obtain data on: weight, length or height, OFC (under 3 years), mid-armcircumference, and triceps and/or subscapular fatfolds.
Plot anthropometrics on NCHS growth charts: weight-for-age, length- or height-for-age, weight-for-length, and OFC-for-age. Calculate percentage of ideal weight-for-height. Height-for-age has been shown to be a significant prognostic factor for survival(Becker, et al., 2001). Calculate body composition parameters for fat and muscle reserves.
• Dietary data. Analyze dietary information for calories, protein, carbohydrate,vitamins, minerals, electrolytes and fluid by getting food frequency information, 24hour recall or three- to five-day food record.
• Estimate nutrition goals. Energy: Standard energy equations may underpredictactual energy expenditures for children with CF. Calorie requirements can be as high as110 to 200 percent of RDA-for-age (Stallings, 2005; Food and Nutrition Board, 2005).Adjust needs dependent on changes in medical status, activity level, respiratory func-tion and growth rate (Taylor, et al., 2001).
Protein: Recommend protein at 150 to 200 percent RDA or 15 to 20 percent of dailyenergy intake (Ramsey, et al., 1992; Food and Nutrition Board, 2005).
Fat: While in infancy, fat should comprise 50 percent of total caloric needs; over theage of one, fat should provide 35 to 45 percent of total calories (Cystic FibrosisFoundation Consensus Conference, 2002; Ramsey, et al., 1992; Erdman, 1999).Rehammel, et al., (1995) demonstrated improved nutritional status with highlinoleic acid and fat-soluble vitamins.
Micronutrients: Supplementation of vitamin and minerals is often required. (Seeintervention strategies below.)
• Biochemical data. Measure electrolytes, complete blood count, serum albumin,serum retinol (vitamin A), alpha-tocopherol (vitamin E), and 25-OH-vitamin D at initialdiagnosis and at annual visits, or more often if medically necessary. If hemoglobin orhematocrit is low, measure serum iron, iron-binding capacity and serum ferritin, as wellas protime (Wilson, 1998).
Obtain a three-day stool sample combined with a three-day food record to evaluatemalabsorption. Inform the laboratory if the child is on medium-chain triglycerides asspecial solvents are needed to assess the stool sample.
Other tests as indicated by clinical and dietary assessment may include liverfunction tests and serum glucose, calcium, phosphorus, DEXA scan, and oral glucosetolerance test.

106Clinical Pediatric Nutrition
• Clinical data. Assess stool pattern for number per day, consistency, presence ofoily discharge, abdominal cramping and foul-smelling gas.
Evaluate enzyme replacement therapy for type of enzymes, amount taken per mealand snacks, timing and method of administration. Consider pulmonary status anddisease. Consider drug-nutrient interactions; antibiotics, bronchodilators, steroids,diuretics and heart medications.
Determine level of physical activity.
STRATEGIES AND GOALS FOR INTERVENTION: CF The goal of nutritional therapy is to achieve optimal nutritional status to promote
linear growth and weight gain, absence of gastrointestinal symptoms and optimalresistance to infection. Growth should be normal for all pediatric patients with CF(Cystic Fibrosis Foundation Consensus Conference, 2002). The Cystic Fibrosis Founda-tion has recommended following these goals throughout the life cycle:
• Infants and toddlers should achieve weight-for-length at the 50th percentile byage 2 years.
• Children and adolescents should achieve or exceed the 50th percentile for BMI(for age and gender) up to age 20
• Women older than 20 years should achieve or exceed a BMI of 22• Men older than 20 years should achieve a BMI of 23
The chart below categorizes nutritional management of CF patients:
Nutritional Management of Cystic Fibrosis Patients
CategoryRoutine
management
Anticipatoryguidance
Supportiveintervention
Rehabilitativecare
Resuscitative &palliative care
GroupAll CF patients
Pulmonaryproblems but
maintaining ≥90%IBW/ht.Decreased wt gainor 85-90% IBW/ht.
% IBW/Ht consis-tently <85%% IBW/Ht <75% orprogressivenutritional failure
InterventionNutrition education, pancreatic
enzyme therapy, vitamin supple-mentation
More intensive counseling toincrease caloric intake, dietarymonitoring, behavioral assess-ment
Above plus oral nutritional supple-ments
Above plus enteral supplementationw/nasogastric or gastrostomyfeedings
Above plus continuous drip enteralfeedings or hyperalimentation
Adapted from Ramsey, 1992

107Clinical Pediatric Nutrition
The Cystic Fibrosis Foundation recommends using percentage of ideal bodyweight and body mass index to assess and screen. Studies by Zhang (2004) indicatedthat percentage of ideal body weight underestimated the severity of malnutrition inchildren with short stature, but overestimated the same in children with tall stature. Thehighest lung function for age is associated with an average BMI or better (Stallings,2005; Peterson, 2003)
• Breast milk, cow’s milk-based formulas, or predigested formulas with mediumchain triglycerides are most effective with enzyme therapy. Concentrate formulas orsupplement breast milk as needed. Introduce complementary foods when developmen-tally appropriate, and encourage the use of high-calorie baby foods.
• Behavioral therapy intervention will promote weight gain (Jelalian, et al., 1998).Identify and encourage readily available high calorie preferred foods. Create recipes forhomemade milkshakes according to individual preference. Provide guidelines onincreasing calorie content of usual foods without increasing the volume of food. SeeAppendices #12 and 13 and resource list.
RESOURCES
Pass the Calories PleaseJumbo Jack’s Cookbook Co. ScandipharmAudubon, IA 1990 for Scandishake® and ADEKs® vitaminsContact: Gail Farmer 22 Inverness Center Parkway, Ste. 310PO Box 5127 Birmingham, AL 35242Belmont, CA 94002 1-800-950-8085
www.axcanscandipharm.com
Cystic Fibrosis Foundation CF Service Pharmacy6931 Arlington Road for Vitamax® and Calories Plus®
Bethesda, MD 20814 6931 Arlington Rd. Ste. 2001-800-344-4823 Bethesda, MD 20814www.cff.org 1-800-541-4959free patient/family education www.cfservicespharmacy.com/materials available at:www.cff.org/LivingWithCF/StayingHealthy/
RDA for Cystic Fibrosis
Age Vitamin A (IU) Vitamin E (IU) Vitamin D (IU) Vitamin K (mg)
0-1 year 1,500 40 - 50 400 0.3 - 0.5 mg1-3 years 5,000 80 - 150 400 - 800 –4-8 years 5,000 - 10,000 100 - 200 400 - 800 –>8 years 10,000 200 - 400 400 - 800 –

108Clinical Pediatric Nutrition
Use calorie fortifiers as needed (Polycose®, Scandical®, Benecal®, MCT oil, breakfastpowders). Consider high calorie commercial supplements, such as PediaSure®, BrightBeginnings®, Scandishake® (Smyth, 2001), and Resource Just for Kids 1.5®. When childrenare approximately ten, calorically dense adult nutritional supplements may be used.
Infants and children with CF and pancreatic insufficiency should receive supple-ments of water-miscible forms of fat soluble vitamins, as well as zinc. There are severalcommercially available products for this niche:
• SourceCF® liquid, chewable, and softgelManufacturer: SourceCF
• AquADEK® softgels and AquADEK pediatric liquidManufacturer: Axcan
• Vitamax® liquid and chewableManufacturer: CF Services
Salt intake should be liberal for all persons with CF. However, it is especiallyimportant to provide sodium supplements to infants who are receiving exclusive breastmilk feedings, to children who are physically active and to all during hot or humidweather. A generally accepted safe dose for sodium supplementation is 2 to 4 mEq/kgper day. The least expensive and most practical way to provide sodium supplementa-tion is by giving table salt using this conversion factor: 1/8 tsp provides 11 mEq ofsodium (Cystic Fibrosis Foundation Consensus Conference, 2002). Identify possibledrug-nutrient interactions. Adjust supplements and diet as needed.
Enzyme replacement therapy should be closely monitored by a dietitian andphysician. Reevaluate pancreatic enzyme prescription at each visit and adjust dosageuntil the child has a normal stool pattern, a good growth rate, and absence of gas-trointestinal complaints. Give enzymes with all meals, and snacks. Adequate replace-ment therapy will vary individually and with the amount and content of food eaten.
For infants, open the capsules and mix the microspheres with a smooth, puréedfood that does not have an alkaline pH level (e.g. applesauce), and feed by spoon at thestart of each feeding. Infants should receive 2000 to 4000 units lipase per 120 mL ofbreast milk or formula (Borowitz, 1995). Do not add beads to the bottle as they may clogthe opening to the nipple. Check the inside of baby’s mouth to ensure that no beadsremain under the tongue or anywhere in the mouth as oral dissolution can cause tissuebreakdown.
Instruct children to swallow enzymes in capsule form. Chewing the beads destroysthe enteric coating.
Give additional enzymes if meal or feeding takes longer than 20 to 30 min.If chest therapy causes vomiting, hold meals 1 hour before or 1/2 hour after physi-
cal therapy. If difficult breathing interferes with chewing and swallowing, consider asoft diet or high-calorie liquids.
Children should be monitored by a multidisciplinary team at two- to six-monthintervals to provide the necessary medical, psychosocial, and nutritional support.

109Clinical Pediatric Nutrition
REFERENCES
Adde F, Rodriguez J, Cardoso A. Nutritional follow-up of cystic fibrosis patients : the role of nutritioneducation. J Pediatr (Rio J) 80(6): 475-482, 2004.
American Dietetics Association (ADA). Manual of Clinical Dietetics, ADA. Chicago IL. 1988.Atkinson SA. Special nutritional needs of infants for prevention of and recovery from bronchopulmonary
dysplasia. J Nutr 131 (3 Suppl): 942S-946S, 2001.Barrington KJ, Finer NN. Treatment of bronchopulmonary dysplasia: a reviwe. Clin Perinatol 25: 177-202, 1998.Becker L, Russek-Cohen E, Fink R. Stature as a prognostic factor in cystic fibrosis survival. JADA 101: 438-
442, 2001.Bhandari A, Ghandari V. Pathogenesis, pathology and pathophysiology of pulmonary sequelae of
bronchopulmonary dysplasia in premature infants. Front Biosci 8: 370-380, 2003.Biniwale MA, Ehrenkranz RA. The role of nutrition in the prevention and management of bronchopulmo-
nary dysplasia. Semin Perinatol 20: 200-208, 2006.Borowitz D, Durie PR, Clarke LL, Werlin SL, et al. Gastrointestinal outcomes and confounders in cystic
fibrosis. J Pediatr Gastroenterol Nutr 41: 273-285, 2005.Borowitz DS, Grand RJ, Durie PR. Use of pancreatic enzyme supplements for patients with cystic fibrosis
in the context of fibrosing colonopathy. Consensus Committee. J Pediatr 127: 681-684, 1995.Carlson SJ. Current nutrition management of infants with chronic lung disease. Nutr Clin Pract 19: 581-
586, 2004.__________ Children's Hospital and Medical Center (CHMC), University of Washington. Nutrition
Guidelines for Children with Disabilities and Chronic Illness, WA DSHS, 1989.__________ Cystic Fibrosis Foundation Consensus Conference. Concepts in Care: Pediatric Nutrition for
Patients with Cystic Fibrosis. Bethesda MD: Cystic Fibrosis Foundation. 2002.Dorlöchter L, et al. Resting energy expenditure and lung disease in cystic fibrosis. Journal of Cystic Fibrosis
1(3): 131-136, 2002.Erdman SH. Nutritional imperatives in cystic fibrosis therapy. Pediatr Ann 28: 129-136, 1999.Food and Nutrition Board. Dietary Reference Intakes for Energy, Carbohydrate, Fiber, Fat, Fatty Acids, Choles-
terol, Protein, and Amino Acids. Washington DC: National Academy Press, 2005.Food and Nutrition Board. Recommended Dietary Allowance, 10th ed. Washington DC: National Academy
Press, 1989.__________ Gaining and Growing: Assuring Nutritional Care of Preterm Infants: Bronchopulmonary
Dysplasia. http://staff.washington.edu/growing/Assess/BPDJelalian E, Stark L, et al. Nutrition intervention for weight gain in cystic fibrosis: A meta-analysis. J Pediatr
132: 486-492, 1998.Johnson D, Cheney C, Monsen E. Nutrition and feeding in infants with bronchopulmonary dysplasia after
initial hospital discharge: Risk factors for growth failure. JADA 98:649-656, 1998.Kalhan SC, Denne SC. Energy consumption in infants with bronchopulmonary dysplasia. J Pediatr 116:
662-664, 1990.Kurzner SI, Garg M, Bautista DB, et al. Growth failure in bronchopulmonary dysplasia: elevated metabolic
rates and pulmonary mechanics. J Pediatr 112: 73-80, 1988.Peterson ML, Jacobs DR Jr., Milla CE. Longitudinal changes in growth parameters are correlated with
changes in pulmonary function in children with cystic fibrosis. Pediatr 112: 588-592, 2003.Rehammel A, Marcus M, Farrell P, et al. Oral supplementation with a high-fat, high-energy product improves
nutritional status and alters serum lipids in patients with cystic fibrosis. JADA 95: 454-495, 1995.Rosenstein B and Cutting G. The diagnosis of cystic fibrosis: A consensus statement. J Pediatr 132: 589-595, 1998.Sharma M Singh M. Nutritional management of children with cystic fibrosis. Indian Pediatrics 40: 1055-
1062, 2003.

110Clinical Pediatric Nutrition
Smyth R, Walters S. Oral calorie supplements for cystic fibrosis (Cochrane Review). In: The CochraneLibrary, 2, 2001.
Stallings VA. New nutrition guidelines. Presented at: North American Cystic Fibrosis Conference;altimore MD. Oct 22, 2005.
Stapleton, D, Gurrin L, Zubrick S, et al. What do children with cystic fibrosis and their parents know aboutnutrition and pancreatic enzymes? JADA 100: 1494-1500, 2000.
Stettler N, Kawchak D, Boyle L, et al. Prospective evaluation of growth, nutritional status, and bodycomposition in children with cystic fibrosis. Am J ClinNutr 72(2): 407-413, 2000.
Taylor C, Beckles-Willson N, Wolfe S. The child with cystic fibrosis who fails to gain weight. JR Soc Med 94suppl 40: 25-28, 2001.
Weston S. Bronchopulmonary dysplasia and ventilator-dependent pediatric patients. In: Amorde-Spalding K, Nieman L, eds. Pediatric Manual of Clinical Dietetics, 2nd ed. ADA. Chicago IL, 2008.
Wilson D, Pencharz P. Nutrition and cystic fibrosis. Nutrition 14: 792-792, 1998.Zhang Z, Lai HJ. Comparison of the use of body mass index percentiles and percentage of ideal body
weight to screen for malnutrition in children with cystic fibrosis. Am J Clin Nutr 80(4): 982-991, 2004.

111Clinical Pediatric Nutrition
Chapter Ten:Chronic Diseases inInfants & Children
RENAL DISEASE
Renal disease is a progressive condition characterized by two stages: chronic renalfailure (CRF) and end-stage renal disease (ESRD). CRF is distinguished by having lessthan 50 percent normal kidney function and ESRD describes less than 5 to 10 percentkidney function. Kidney transplant or dialysis closely follows ESRD. Etiology of renaldisease in children is varied.
Congenital causes of renal disease in children include anatomic abnormalities amdinherited disease resulting from an inborn error of metabolism. Acquired causesincludeuntreated infections, trauma or illness, and xposure to nephrotoxic drugs(Brizee, 1995).
Renal dysfunction affects the metabolism of nutrients, resulting in problems ofbone mineralization, anemia, hypertension, metabolic acidosis and fluid and electrolyteimbalance. Renal osteodystrophy results from inadequate vitamin D activation anddecreased intestinal absorption of calcium. Impaired excretion of phosphorus, potas-sium and urea adds to the problem. Children with significant renal insufficiency do notgrow well in stature despite adequate nutrition and metabolic balance. Use of humangrowth hormone improves growth and may alter dietary goals in the course of thedisease (Spinozzi, 1997).
Nutrition problems for children with renal disease include:• Poor weight gain and growth,• Anemia,• Inadequate nutritional intake,• Renal osteodystrophy,• Frequent vomiting, and• Hypertension.

112Clinical Pediatric Nutrition
NUTRITION ASSESSMENT FOR RENAL DISEASE
Interval measurements of nutrition parameters should be obtained to assureoptimal growth and health status.
• Anthropometric data. Obtain current and serial anthropometric data at least fourtimes during the first year of life and at regularly scheduled intervals thereafter. Assessweight (Determine a “dry” or “real” weight by evaluating current weight with regard topresence of edema, dehydration, blood pressure and weight history), length or height,OFC (under 3 years), assess mid-arm circumference and fatfold measurements (Usefulonly if child is at “dry” weight. Presence of edema will skew the information).
Plot growth parameters on NCHS chart: weight-for-age, length- or height-for-age,OFC-for-age, and weight for length or height.
• Dietary data. Analyze dietary information for calories, protein, carbohydrate,mineral, electrolytes and fluid by getting food frequency information on special renalformulas. Determine caregiver’s and child’s understanding of dietary interventions andevaluate compliance. Assess psychological, cultural and social considerations affectingnutritional status. Evaluate appetite and energy level. Increases in blood urea causenausea and vomiting. Fatigue is associated with anemia due to decreased erythropoietinproduction. Estimate nutrition goals, including:
Energy: Calorie requirements are often difficult to determine due to fluid overloadand abnormalities in distribution of fat and lean body tissue. Body compositionmeasures relative weight to height, which is important to recognize in thispopulation where short stature is prevalent. (Foster, 2004).
In infants and children with chronic kidney disease (CKD) but are not yet ondialysis, caloric intake should at least meet the RDA-for-age. Caloric needs whenreceiving hemodialysis (HD) or peritoneal dialysis therapy are the same aspreviously described for pre-dialysis CKD.
Protein: The level of protein intake is geared to minimize metabolic complicationswhile providing sufficient endogenous protein for anabolism. Protein restrictionis not recommended for an infant or child (CHMC, 1989; Porcellini, et al., 1998).
Protein Requirements for HD or PD Treatments
Age HD (gm/kg) PD (gm/kg)0 - 5 months 2.6 2.9 - 3.06 - 12 months 2.0 2.3 - 2.41 - 3 years ≥1.6 1.9 - 2.04 - 6 years ≥1.6 1.9 - 2.07 - 10 years ≥1.4 1.7 - 1.811 - 14 years 1.4 1.7 - 1.815 - 18 years 1.3 (male) 1.4 - 1.5
1.2 (female)

113Clinical Pediatric Nutrition
Protein intake goals should be equivalent to the RDA-for-age in CKD without HDor PD therapy. If blood levels of urea by-products build up, discuss dialysis withthe team, rather than protein restrictions.
Micronutrients: Vitamin, mineral and electrolyte homeostasis is altered by renalinsufficiency. Evidence indicates that an intake of 100 percent of the RDA shouldbe the goal for vitamins A, E, C, and K, copper and zinc (National Kidney Foun-dation, 2000). Compare actual intake from diet history to estimated needs.
• Biochemical data. Check the following labs every one to three months: BUN,creatinine, calcium, phosphorus, sodium, potassium, albumin, alkaline phosphatase,hemoglobin and hematocrit. Urea kinetics is recommended for children on dialysis(Spinozzi, 1997).
• Clinical data. Assess medical status, renal function, and current illness. Reviewfrequency of vomiting and nausea. Assess fluid status. Consider drug-nutrient interac-tions. Determine level of physical activity.
GOALS AND STRATEGIES FOR NUTRITION INTERVENTION: RENAL DISEASE
The goal of nutritional therapy is to minimize metabolic disturbances and to pro-vide adequate nutrition to promote growth at the 25th to 75th percentile range. Childrenwith renal disease are best cared for by a multidisciplinary team including the child andfamily, primary care provider, pediatric nephrologist, nurse, social worker and dietitian.
Breast milk is good for children with renal failure because of its calcium-to-phos-phorus (Ca:P) ratio and protein content. A favorable Ca:P ratio is found in some com-mercial formulas, such as Similac PM 60:40®.
Young infants with ESRD may show signs of an uncoordinated suck-swallow-breathe pattern. Enlist help from an experienced speech pathologist (Rodzilsky andConstatinescu, 1997). If rate of weight gain and growth is less than expected velocity-for-age, increase caloric density using carbohydrate, fat or a protein-free module (SeeAppendix #12). For toddlers and children who are not gaining well, try increasedcalorie strategies within dietary restrictions (See Appendix #13).
Calcium-to-Phosphorus Ratio
Product (per 100 kcal) Calcium Phosphorus Ca:P ratioSimilac Advance 78 mg 42 mg 1.85:1Nestle Good Start Supreme 67 mg 38 mg 1.76:1Similac PM 60:40 56 mg 28 mg 2:1Enfamil Lipil 78 mg 43 mg 1.8:1

114Clinical Pediatric Nutrition
For those unable to meet their nutritional requirements for growth, consider gas-trostomy tube feedings to augment intake. Formulas such as PediaSure® can improvenutrition status. Specialized adult renal enteral products are available, such as Nepro®
and Suplena®. These products may be used independently or in combination withpediatric formulas for children aged 1 to 10, but the daily intake of vitamins and miner-als from the regimen should be evaluated to minimize the risk of toxicity or deficiency.
Give iron supplements and erythropoietin for treating anemia. Potassium restrictionis necessary when serum potassium levels are repeatedly elevated. It may be necessaryto administer sodium polystyrene (Kayexalate®) to bring down extremely elevated serumpotassium levels. In pediatrics, it is becoming more common for formulas to be "pre-treated" with Kayexalate using the following method: add the dose of Kayexalate di-rectly to the formula and wait 1 hour for the resin to bind the potassium and settle to thebase of the container, pour the formula out of the container, making sure the potassium-bound resin remains in the container. (Of note, this method will result in a formula witha higher sodium content )(Sabo, 2008).
For renal osteodystrophy, give Calcitriol® (activated vitamin D), low phosphorusdiet and phosphate binders (calcium carbonate or calcium acetate). Establish sodiumrestriction for children with hypertension.
Treatment with recombinant human growth hormone should be considered forchildren with growth stunting.
GASTROINTESTINAL DISEASES
Selected gastrointestinal conditions and special concerns of the pediatric popula-tion are addressed in this section. There are many formulas available, both oral andenteral, ready-to-use (also known as ready-to-feed), for complete or supplementalnutrition for children with impaired gastrointestinal function, short bowel syndrome,inflammatory bowel disease, malabsorption syndromes, pancreatic insufficiency,chronic diarrhea, radiation enteritis and HIV/AIDS-related malabsorption.
DIARRHEA
Diarrhea is a change in bowel pattern represented by an increase in stool frequency,fluidity and volume, and loss of fluid and electrolytes. Diarrhea in infants and childrenis classified as acute, chronic intractable or chronic nonspecific.
Common causes of acute diarrhea are infection, medication side effects, foodintolerance, or poisoning. Children with acute diarrhea are at risk for dehydration; ifrecurrent, it may impact calorie and protein status. Treatment goals are adequate hydra-tion, maintain electrolyte balance and preserve nutritional status (Katsh, 2000).
No specific treatment is indicated for mild acute diarrhea. Breast milk and formulafeedings should continue and caregivers should be reassured that the diarrhea maycontinue for several days after initiation of refeeding and hydration. Give small, fre-quent volumes to meet maintain fluid requirements plus to replace losses from emesisor diarrhea. Give approximately 40 to 50 ml/kg over 4 hours with re-evaluation ofclinical symptoms in 3 to 4 hours.

115Clinical Pediatric Nutrition
In general, it is not recommended to use carbonated beverages, broth, juice orsports drinks as they may result in an osmotic diarrhea. Children should resume age-appropriate diets as soon as they have been rehydrated. Age-appropriate foods that arebest tolerated include the following: complex carbohydrates, lean meats, yogurt, fruitsand vegetables (AAP, 1996).
Chronic diarrhea, defined as diarrhea lasting greater than three weeks, may becaused by carbohydrate intolerance, irritable bowel syndrome, parasite infections, cysticfibrosis, HIV/AIDS, or medications. Again, a good medical, nutrition and growthhistory can provide the clues to the cause of the diarrhea. Malnutrition can result frommalabsorption, decreased appetite, selective intake, and loss of fluid. Treatment ofchronic diarrhea should be focused on the etiology. Energy, fluid and micronutrientreplenishment is a challenge and requires a comprehensive nutrition assessment andteam approach to the child’s care (Katsh, 2000).
Oral rehydration therapy (ORT) is the treatment of choice for mild to moderatediarrhea (Ulrickson, 2005). Commercially available oral rehydration products includeInfalyte® , Pedialyte® , or Rehydralyte® . General guidelines from AAP recommend ORT,safe- and age-appropriate foods after rehydration, continuing breastfeeding and avoid-ing foods high in fat and simple sugars. Historically, the BRAT diet (i.e. bananas, rice,applesauce, and tea/toast) was used to treat diarrhea but there is no scientific evidencethat its use is superior or produces faster recovery than the above diet recommendations.
Chronic nonspecific diarrhea does not affect growth. There is no malabsorption,nor identifiable pathogens. This condition is treated with a moderate-high fat (30 to 55percent of calories) and low-carbohydrate diet (Cohen, et al., 1979).
CONSTIPATION
Constipation is a decrease in the frequency of bowel movements and difficultpassage of stools. However, providing a formal definition of constipation is difficult dueto the variance in what is considered a "normal" stool pattern and stool size. The RomeII Criteria for defining chronic, functional constipation for infants and young childrenincludes at least two weeks of the following: pebble-like, hard stools for the majority ofstools; firm stools occurring two or fewer times per week and no evidence of structural,endocrine or metabolic disease (Arce, 2002).
The precursor to constipation is not always known, but inadequate dietary fiber,excessive cow's milk, and inadequate fluid intake are common causes. Other causes ofconstipation include anatomic obstruction, hypotonia, decreased physical activity, sideeffects of medications and abnormal muscle tone and innervation. See the AmericanAcademy of Pediatrics practice guideline endorsement at:
http://aappolicy.aappublications.org/miscConstipation_in_Infants_and_Children.dtl.
Dietary treatment entails increasing fluids and encouraging intake of soluble and/or insoluble fibers. Provide fluids based on guidelines in Chapter Five.
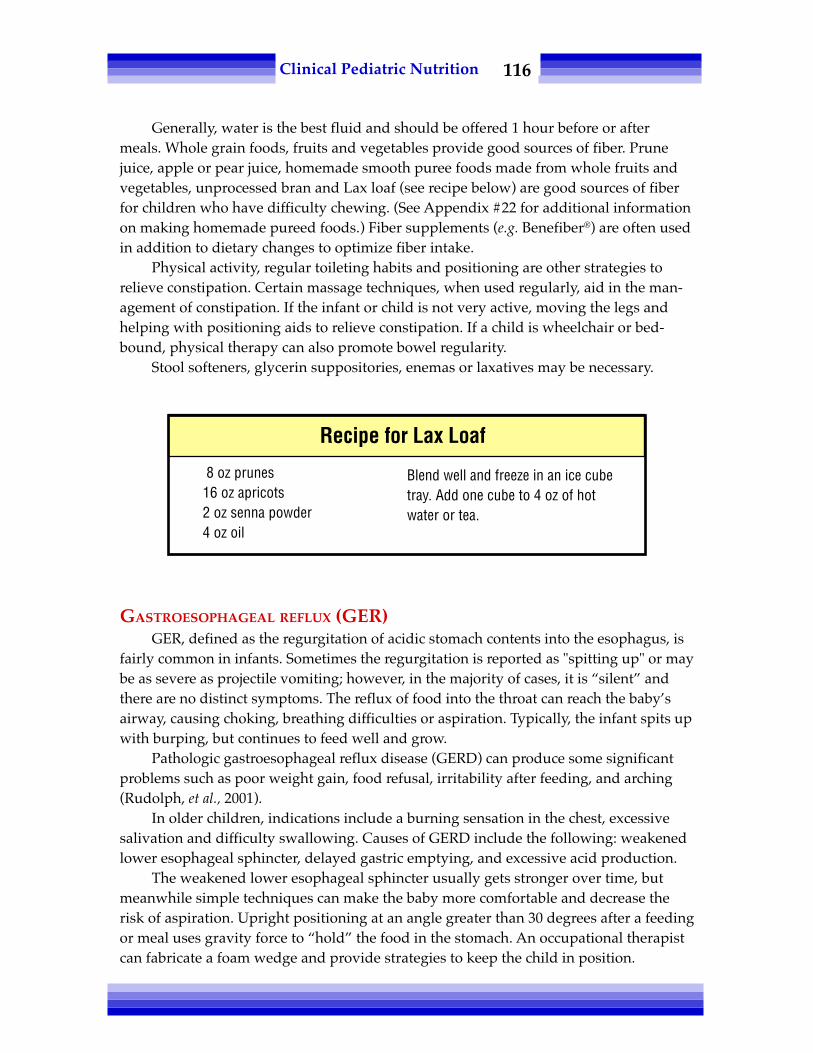
116Clinical Pediatric Nutrition
Generally, water is the best fluid and should be offered 1 hour before or aftermeals. Whole grain foods, fruits and vegetables provide good sources of fiber. Prunejuice, apple or pear juice, homemade smooth puree foods made from whole fruits andvegetables, unprocessed bran and Lax loaf (see recipe below) are good sources of fiberfor children who have difficulty chewing. (See Appendix #22 for additional informationon making homemade pureed foods.) Fiber supplements (e.g. Benefiber®) are often usedin addition to dietary changes to optimize fiber intake.
Physical activity, regular toileting habits and positioning are other strategies torelieve constipation. Certain massage techniques, when used regularly, aid in the man-agement of constipation. If the infant or child is not very active, moving the legs andhelping with positioning aids to relieve constipation. If a child is wheelchair or bed-bound, physical therapy can also promote bowel regularity.
Stool softeners, glycerin suppositories, enemas or laxatives may be necessary.
GASTROESOPHAGEAL REFLUX (GER)GER, defined as the regurgitation of acidic stomach contents into the esophagus, is
fairly common in infants. Sometimes the regurgitation is reported as "spitting up" or maybe as severe as projectile vomiting; however, in the majority of cases, it is “silent” andthere are no distinct symptoms. The reflux of food into the throat can reach the baby’sairway, causing choking, breathing difficulties or aspiration. Typically, the infant spits upwith burping, but continues to feed well and grow.
Pathologic gastroesophageal reflux disease (GERD) can produce some significantproblems such as poor weight gain, food refusal, irritability after feeding, and arching(Rudolph, et al., 2001).
In older children, indications include a burning sensation in the chest, excessivesalivation and difficulty swallowing. Causes of GERD include the following: weakenedlower esophageal sphincter, delayed gastric emptying, and excessive acid production.
The weakened lower esophageal sphincter usually gets stronger over time, butmeanwhile simple techniques can make the baby more comfortable and decrease therisk of aspiration. Upright positioning at an angle greater than 30 degrees after a feedingor meal uses gravity force to “hold” the food in the stomach. An occupational therapistcan fabricate a foam wedge and provide strategies to keep the child in position.
Recipe for Lax Loaf
Blend well and freeze in an ice cubetray. Add one cube to 4 oz of hotwater or tea.
8 oz prunes16 oz apricots2 oz senna powder4 oz oil

117Clinical Pediatric Nutrition
Some clinicians recommend thickening feeds to alleviate GER, but research on theefficacy of this therapy shows mixed results. One study of 14 infants revealed that feedsthickened with carob bean gum (St. John's bread) had a significant effect in reducingregurgitation frequency and amount in otherwise healthy infants (Wenzl, et al., 2003). Itwas noted, however, that the occurrence of acidic GER was not reduced.
From this study, one might conclude that thickened feedings may be useful forinfants who are thriving well but experiencing recurrent regurgitation. For cases ofcomplicated GER, thickened feedings are not likely to be of benefit.
A general rule of thumb is to thicken with 1 Tblsp of rice or oatmeal cereal forevery 1 to 2 oz of formula (Jung, 2001). For the infant who is breast-feeding, providesmall amounts of baby cereal by spoon prior to each feeding.
The next step in the treatment process would be medications to decrease acidproduction (e.g. H2 antagonists, PPI) or increase gastric motility (e.g. Reglan®).
Surgical interventions are the treatment of last resort. These include fundoplicationand placement of a gastro-jejunal feeding tube. The fundoplication procedure (alsoreferred to as "fundo") is when a surgeon wraps part of the stomach fundus around theesophagus to tighten the sphincter (Papasavas, 2003).
After surgery, children can eat without foods sloshing back up into the esophagus.Although a child may not technically be able to vomit after a successful fundoplication,many still experience frequent retching during and after feeds. In addition, it is notuncommon for a fundoplication to come partially unwrapped over time, which oftenresults in the reoccurrence of vomiting. It is felt that placement of a gastro-jejunal feed-ing tube (GJT) deters vomiting because the feeds are being administered directly intothe small bowel (bypassing the stomach), and this may be particularly helpful forchildren with severely delayed gastric emptying.
SHORT BOWEL SYNDROME
Short bowel syndrome (SBS) is a malabsorptive state due to a significant bowelresection or congenital defect. SBS may present with a decreased ability to secrete GIregulatory peptides and trophic hormones, as well as compromised GI immune func-tion (Vanderhoof, 2004). Common causes of SBS include necrotizing enterocolitis (NEC),gastroschisis, volvulus, multiple intestinal atresias, and severe intestinal resections.
SBS symptoms may include any of the following: weight loss, muscle wasting,diarrhea, rapid GI transit time, malabsorption, dehydration and electrolyte imbalance.
SBS is the primary cause for long-term PN support in infants and children. Theprimary nutritional complications are deficiencies due to loss of absorptive surface andbacterial overgrowth which further exacerbates malabsorption. It is important thatchildren with SBS have long-term nutrition monitoring to prevent potential inadequa-cies of macro- and micro-nutrients and fluids.
The ileocecal valve, which is the main barrier between the small and large intes-tine, helps to regulate bacterial reflux into the small bowel. It is the major mechanismfor preventing reflux of colonic bacteria into the small intestine. Often, it is removed

118Clinical Pediatric Nutrition
during bowel surgery. Outcome is predicated on site and extent of resection and pres-ence or removal of the ileocecal valve. Infants or children with as little as 25 cm of smallbowel with an ileocecal valve, or 40 cm without an ileocecal valve, have a reasonablechance of survival on enteral or oral nutrition support (Vanderhoof, et al., 1992).
After a bowel resection, the remaining small bowel adapts in the following ways:mucosal hyperplasia, villus lengthening, increased crypt depth, and bowel dilation(Andorsky, 2001). Gut adaptation is stimulated by the presence of enteral nutrients,which activate trophic secretions. In some cases, the post-resection gut adaptation issufficient to allow for a patient to wean off PN and sustain adequate growth on enteralnutrition. Children with less than 20 cm of small bowel often are dependent upon PNfor life and may require an intestinal transplant to survive long-term (Gonzales, et al.,2005). As a whole, patients with more than 20 cm of small bowel can have adequateadaptation to survive on oral enteral nutrition (Gonzales, et al., 2005).
Given the complications of PN (e.g. line sepsis, cholestatic liver disease, poor bonemineralization) in the NICU, weaning from PN support should be a priority. Many SBSpatients, however, require at least supplemental PN support to sustain adequate growthand/or hydration. Factors associated with a reduction in duration of PN include per-centage of enteral feeding days when breast milk or an amino acid-based formula was
Proximal small bowelDuodenum-jejunum� Secretin� Cholecystikinin� Pancreatic secretions� Bilary secretions� Fat digestion, absorption� Fat-soluble vitamin absorption� Protein digestion,
absorption� Mineral losses: Ca, Fe, Mg,
Cu, Cr, Mn� Losses of water-soluble
vitamins� Surface area for absorption� Disaccharidase
�� Lactase� Sucrase
� Substrate for bacterialovergrowth
� Osmotic diarrhea
Possible Implications of Intestinal Resections
Distal small bowelIleum�� Vitamin B12 absorption� Bile salt reabsorption� Enterohepatic circulation
Resulting in:� Bile acid pool� Micelle formation� Long-chain fat
absorption� Fat-soluble vitamin
absorption� Steatorrhea� Potential for
cholelithiasis� Dihydroxy bile salts
� Trace element losses� Colonic fluid absorption� Bile diarrhea� Risk of renal oxalate
stones
Ileocecal valve� Transit time� Malabsorption� Bacterial
overgrowth� Vitamin B12
absorption� Folate absorp-
tion
Colon� Water absorp-
tion� Sodium
absorption� Risk of renal
oxalate stones

119Clinical Pediatric Nutrition
given and percentage of caloric intake received by the enteral route six weeks afterintestinal resection (Andorsky, 2001).
Andorsky, et al. observed that the mean residual bowel length in the group ofpatients able to be weaned from PN was 88.6 cm, as compared to 71.7 cm in the groupunable to be weaned (Andorsky, 2001). Some studies have associated the presence of anileocecal valve with a decreased duration of PN, but other studies have not found this(Andorsky, 2001). Early restoration of intestinal continuity (i.e. ostomy "take-down")appears to correlate with less severe PN-related cholestasis (Andorsky, 2001).
The process for feedings and nutritional monitoring should progress as follows:• Fluid, electrolyte and nutritional replenishment with parenteral nutrition.• Gradual introduction of enteral nutrition. While receiving parenteral and enteral
feedings, infants and children should be encouraged to continue non-nutritiveoral stimulation, or even small volumes of oral feedings, to maintain normalfeeding development and readiness for transition to oral feedings.
• If the infant or child's initial feeding regimen was continuous feedings, attempttransition to bolus enteral feedings. Progress slowly to oral nutrition
• Monitor growth and clinical status regularly for signs of malabsorption, nutri-tional deficiencies and bacterial overgrowth.
• Monitor for malabsorption of minerals (e.g. zinc), carbohydrate (exhibited bystools positive for reducing substances), fat and fat-soluble vitamins. Considersupplementing with water-soluble forms of vitamins, vitamin B12 injections (ifterminal ileum was resected), calcium, iron, magnesium and zinc.
Patients with SBS are prone to morbidity and mortality from progressive liverfailure and sepsis (Andorsky, 2001). PN-cholestasis is defined as a marked impairmentin bile flow and a conjugated bilirubin >2 mg/dL (Karpen, 2002).
Typically, patients with cholestasis are jaundiced, and may have pale, clay-coloredstools from fat malabsorption. Neonates are especially prone to PN-cholestasis becauseof their diminished bile acid pool size and key hepatobiliary transporters, as well asreduced enterohepatic circulation of bile acids (i.e. decreased bile flow)(Karpen, 2002).
Karpen observed that patients with elevated conjugated bilirubin levels at approxi-mately 4 months of age or older may have irreversible PN-associated cholestasis. Recog-nizing end-stage liver disease as early as possible is essential, and referral for liver, orliver-plus-small-bowel, transplantation, should be made when medically appropriate(Karpen, 2002).
Goals of nutrition therapy for the infant with SBS should include the following:promote normal growth and development, maximize intestinal adaptation, and mini-mize complications. Initially, the focus of nutritional therapy is maintaining fluid andelectrolyte balance, which is often accomplished through IV fluid (e.g. 1/2 NS with KCl)replacement of ostomy losses (Vanderhoof, 2004).
Once fluid and electrolyte losses have resolved and GI function has returned (i.e.salem sump is placed to gravity drainage without increased abdominal distention),trophic enteral feeds should be initiated.

120Clinical Pediatric Nutrition
Andorsky, et al., demonstrated that the use of breast milk showed the highestcorrelation with shorter PN courses (Andorsky, 2001). If breast milk is not available,hydrolyzed or amino acid-based formulas are generally used to facilitate absorption(Vanderhoof, 2004). Amino-acid based formulas may improve outcomes in SBS becausethere seems to be a higher incidence of allergy in children with SBS and the infantamino acid-based formula used in several studies (i.e. Neocate Infant,® SHS/NutriciaNorth America) contains a high percentage of fat from long-chain fatty acid sources,which has been shown to stimulate mucosal adaptation better than MCT in animalmodels (Andorsky, 2001; Bines, 1998).
Another amino acid-based formula was recently approved for use in infants (i.e.Elecare,® Ross/Abbott Nutrition) and this has also been administered to SBS patientswith good tolerance. In comparing Elecare with Neocate Infant, one observes a similaramino acid base; however, Elecare contains significantly more MCT when compared toNeocate (33 percent of total fat vs. 5 percent), facilitating optimal absorption duringcholestasis.
In clinical practice, many have observed that continuous enteral feedings enhanceabsorption and are advantageous over bolus feeds in infants and children with SBS(Parker, 1981). Aggressive enteral nutrition reduces the need for PN as early as possibleand helps to ameliorate the development and progression of PN-associated cholestasis;moreover aggressive enteral nutrition stimulates gut adaptation (Vanderhoof, 2004).Factors hindering advancement of enteral feeds include stool losses increasing morethan 50 percent over baseline, ostomy output greater than 40 to 50 mL/kg/day, andostomy output strongly positive for reducing substances (Vanderhoof, 2004).
Once patients are weaned from PN support, SBS patients should routinely bescreened for fat-soluble vitamin (e.g. A, D, E, and K), calcium, magnesium, and zincdeficiencies. Once a patient is tolerating full enteral feeds and PN has been discontin-ued, it is recommended to provide the following vitamin supplementation: TPGS-E (e.g.Liqui-E® or Nutr-E-Sol®) at 25 IU/kg/day, plus 2 mL liquid multi-vitamin (e.g. Poly-vi-sol®) to provide adequate vitamins A and D; vitamin K (e.g. phytonadione) from 1 to 2.5mg weekly up to 5 to 10 mg daily, according to need (Karpen, 2002; Francavilla, 2003).
Karpen (2002) states that the "...use of this combination vitamin treatment is supe-rior to use of the available water-soluble vitamin supplements (e.g. ADEK® orAquADEK®)" Dosing of vitamin supplements can be adjusted based on the results ofmonthly measurements of vitamins A, 25-OH vitamin D, E, and coagulation profile.
Some clinicians are utilizing enteral fiber supplementation (e.g. Benefiber®, pectin)with the intended goal of maximizing absorption of enteral feedings by slowing the GItransit time and decreasing ostomy/stool output (Pediatric Nutrition Handbook, 5th ed.).
The beneficial effects of short-chain fatty acids (SCFA) on intestinal morphology(adaptation/proliferation) and function in animals suggests potential for use of fer-mentable fiber in treatment of SBS in humans (Hawkins, 1995). Risks or drawbacks ofusing fiber supplementation in infants include the following:

121Clinical Pediatric Nutrition
• Acute intestinal obstruction was noted in newborns fed pectin and cellulose foodthickeners (Montagne, 1974);
• they are contraindicated for use in infants with CF and Hirschsprung's disease(Vandenplas, 1997);
• using soluble, fermentable fiber supplements without a colon or with an intactileostomy will not likely be very effective; and
• soluble fibers (gums [guar gum], pectins) are currently thought to decreasemineral absorption more than the insoluble fibers — the theory is that by increasing theamount of fiber one causes lower mineral retention (Groh-Wargo, 2000).
There is limited data on the long-term outcomes of children with SBS. A study wasconducted in 2005 involving 10 children with SBS who had been weaned from PN for atleast two years (Gonzales, et al., 2005). Eight to 10 children had normal weight-for-height; height-for-age was low in five children (notably, these children were affected bySBS very early in their lives); and fat mass was low in five of the subjects.
Caring for infants and children with SBS is often a challenging task. Changes aremade to the enteral nutrition support regimen at least weekly, and even daily, with thegoal of minimizing the need for PN support. It is recommended to complete continualmonitoring of growth and laboratory results, as well as monitor for symptoms of intol-erance of enteral nutrition. The dietitian's close collaboration with the medical andsurgical teams, as well as the gastroenterologist, hepatologist and pharmacy, is essentialto facilitating a positive outcome for the SBS patient.
Valuable information can be found at the website Gaining and Growing: AssuringNutritional Care of Preterm Infants; Short Bowel Syndrome.
http://staff.washington.edu/growing/Assess/SBS.htm
INFLAMMATORY BOWEL DISEASE
Inflammatory bowel disease (IBD) includes ulcerative colitis (UC) and Crohn’sdisease. Whereas the inflammation is limited to the large intestine in UC, the inflamma-tion in Crohn’s disease can occur anywhere along the GI tract from the mouth to anus.
IBD can be particularly devastating in childhood by adversely impacting nutritionstatus, physical growth and psychosocial development. Crohn’s disease is more com-monly associated with growth failure than UC. The primary cause of growth problemsis inadequate nutrient intake, malabsorption, and drug-nutrient interactions (Saha, et al.,1998). Additionally, energy requirements are increased during active disease, medicalcomplications, or acute post operative phase.
Management of children with IBD includes a complete nutrition assessment with aseven-day food record to aid with meal planning. Evaluation of biochemical indices ofprotein status and specific nutrient deficiencies and appraisal of clinical status is essen-tial to identify nutrition goals.
Energy goals for catch-up growth are estimated as at least 130 percent of the RDA(Sullivan and Heyman, 1995). Lactose and fat restrictions are sometimes necessary to

122Clinical Pediatric Nutrition
lessen the severity of GI symptoms. Vitamins and minerals may need to be supple-mented above the RDA in cases of malabsorption or drug-nutrient interaction.
Oral nutritional supplemention with low-residue, lactose-free products can preventand assuage growth problems. Use of elemental products via nasogastric or gastros-tomy supplemental feedings has been successful in optimizing nutritional status andgrowth for children with IBD (Belli, et al., 1988). During acute flare-ups that requirebowel rest, parenteral nutrition support is recommended. Close follow-up and monitor-ing with particular attention to the overall growth trend is important (Laiho andNuutinen, 1998).
HIV/AIDSThe first case of pediatric HIV was diagnosed in 1987. Mother-to-newborn trans-
mission has been the primary mode (92 percent of cases) of HIV infection in pediatrics.Other causes are transfusion-associated, hemophilia or unknown. Since the beginning ofthe AIDS epidemic, 9,522 children have been reported with AIDS.
As of December 2006, the most recent statistics available, a total of 1,116 children inthe US were living with AIDS, and an additional 2,587 children were living with HIVinfection (not AIDS). In 2006, 86 children with AIDS were reported to CDC. The largestnumber of pediatric HIV cases reported in 2006 were in New York and Florida. A greatmedical achievement has been the reduction of infected infants through maternaltransmission (Church, 2000), due to public education and efforts to preventbreastfeeding by HIV-affected mothers and the use of medical therapies and postnatalprophylaxis of newborns.
AIDS is a progressive disease that affects the immune and central nervous system.In children, AIDS is associated with failure to thrive (FTT) and protein-energy malnutri-tion (Gorbea-Robles, et al., 1998). Weight loss and growth failure are early symptoms ofserious involvement (Heller, et al., 2000) and can lead to developmental delays, deficitsin fine and gross motor skills, dysphagia, and loss of feeding skills.
Malnutrition has multiple causes, as shown in the following chart.
• Decreased nutrient intake • Anorexia
• Decreased absorption • Dysphagia
• Increased nutrient needs • Developmental or neurologic
• Oral or intestinal lesions impairment
• Medication interactions • Diarrhea/nausea/vomiting
• Alterations in taste & smell • Hypermetabolism
• Loss of feeding skills • Lactose and/or fat intolerance
Causes of Malnutrition in Children with HIV/AIDS

123Clinical Pediatric Nutrition
NUTRITION ASSESSMENT: HIV/AIDS• Anthropometric data. Obtain growth history and anthropometric data at least
four times during the first year of life and at regularly scheduled intervals thereafter.Assess weight, length or height, OFC (under 3 years of age), growth trend, mid-armcircumference, and triceps and subscapular fatfold measurements.
Plot growth parameters on NCHS chart: weight-for-age, length- or height-for-age,OFC-for-age, weight-for-length or height for children under two and BMI-for-age forchildren over 2.
Calculate body composition parameters for fat and muscle reserves.• Dietary data. Analyze dietary information for calories, protein, carbohydrate,
vitamins, minerals, electrolytes and fluid by obtaining a food frequency history, 24 hourrecall or three- to five-day food record. Record foods that are reportedly not tolerated.Ask about sources of water (well water vs. city or bottled) and use of raw/rare meats,raw eggs or unpasteurized milk.
Determine whether the child is taking any alternative therapies, dietary supple-ments, or herbal remedies. Determine caregiver’s and child’s understanding of dietaryintervention and evaluate compliance. Assess psychological and social considerations ofthe home environment that determine eating behavior and patterns. Evaluate appetite,energy level, and feeding skills. Identify risk factors such as polypharmacy, acute, andchronic disease.
Estimate nutrition goals:Energy: Base needs for catch-up growth if growth is impaired; however, nutrition
interventions should be specific to each child’s disease classification, usual nutrientintake and growth history (Rothpletz-Puglia, 1999).
Minimum: kcal/kg= ideal wt-for-ht x RDA-for-age ÷ actual wtMaximum: kcal/kg = ideal wt-for-age x RDA-for-age ÷ actual wt
Increase recommendations for stress states (e.g. pneumonia, fever or sepsis.)
Protein: 150 to 200 percent RDA, unless contraindicated.Micronutrients: RDA or greater as indicated by malabsorption, medical status,
medications and biochemical indices and poor diet. Assure adequate calcium intake dueto low bone mass and potential calcium insufficiency (O’Brien, et al., 2001). Nutritioncounseling and early intervention should focus on foods rich in micro-nutrients foroptimal immune function (Kruzich, 2004).
Compare actual intake from diet history to estimated needs.• Biochemical data. Check the following labs regularly: albumin, CBC, creatinine,
liver function tests, prealbumin, potassium, BUN, and total iron-binding capacity.• Clinical data. Assess medical status. Monitor stooling pattern for malabsorption.
Consider drug-nutrient interactions. Determine physical activity level.
124Clinical Pediatric Nutrition
GOALS AND STRATEGIES FOR NUTRITION INTERVENTION: HIV/AIDSThe goals of medical nutritional therapy are to promote growth that is comparable
to the expected velocity for the child's age, body composition, and laboratory valuesand reduce drug-nutrient side effects. Nutrition intervention tactics include:
• In areas where infant formula is accessible, affordable, and the water source issafe, women who are known to be HIV+ should not breastfeed due to the risk oftransmission (Read, 2003).
• Provide guidelines for maximizing nutrient content of the diet within toleratedfood and formula choices. Consider alteration of temperatures and textures,especially if a child has oral lesions.
• Food safety is a priority since immunocompromised persons are at high risk forcontracting food borne illnesses.
• Recommend a daily multi-vitamin/mineral supplement, up to two times RDA.Increase calcium, vitamin C, iron and zinc for children on multiple medications.
• Consider using commercial enteral nutritional products to supplement the diet.Depending on tolerance, begin with a product containing intact protein. Use asemi-elemental or elemental formula for infants or children with malabsorption.For the older child, there are specialized adult formulas, such as Peptamen®
(Nestle) and Juven® (Abbott Nutrition).• Provide individualized nutrition intervention as needed for diarrhea, nausea,
vomiting, anorexia, xerostomia, etc. (Rothpletz-Puglia, 1999).• Miller and colleagues (1995) demonstrated improved weight gain and growth for
children who receive gastrostomy feedings. For a complex case, it is not uncom-mon to utilize a combination of oral, enteral and parenteral modes to meetnutritional needs.
• Frequent monitoring by a pediatric dietitian is important to note changes inappetite, food tolerances, GI function, feeding skills, weight and growth.
Resources:CDC National Aids Hotline: 1-800-342-AIDSNational Pediatric and Family HIV Resource Center: 1-800-362-0071National Association of People with AIDS: www.napwa.orgAids Nutrition Service Alliance: www.aidsnutrition.org
AUTISTIC SPECTRUM DISORDERS (ASD)Historically, autism was described as a rare disorder. However, recent studies have
shown increases in prevalence to as high as 50 to 100 per 10,000 (Nordin, et al., 2005).Autism is classified as a pervasive developmental disorder. There is a wide variationbetween patients diagnosed with autism, and thus it is often referred to as the autisticspectrum. Commonalities amongst all of the autistic spectrum disorders include quali-tatively impaired reciprocal social interaction, communication, and restricted, repetitive,and stereotyped interests and behavior (Nordin, et al., 2005).

125Clinical Pediatric Nutrition
Children with autism often have nutrition-related issues (malnutrition is generallynot one of these issues) because of the characteristics of the condition:
First, children typically learn food-related behaviors by modeling others. Unfortu-nately, this method of learning via imitation is not very successful in children withautism due to their impaired social interactions.
Second, communication skills are severely impaired in children with autism, andthus it is difficult for caregivers to interpret their food preferences and behaviors duringmeals. Often these caregivers (and presumably the children too) report frustration whento attempting to feed, prepare or serve food to their child.
Finally, sensory integration disorders are common. This has significant impacts oneating. A child may refuse to accept textures — rejecting those that are more complexthan smooth, purée for instance.
A common observation by pediatric dietitians is that an autistic child may includefive items in his/her food repertoire, and no more. New textures and tastes are oftenrejected, despite attempts at positive reinforcement, encouragement and repeatedintroduction of the foods. A child may only eat foods of one color (often white).
Although these self-restricting behaviors do not often impair growth, there is anincreased risk that these children will develop micronutrient deficiencies. Multi-vitaminand mineral supplements are generally refused, another factor contributing to the riskof nutrient deficiencies. Thankfully, many foods are fortified (e.g. ready-to-eat breakfastcereals) which helps to prevent the development of nutrient deficiencies.
There are anecdotal reports of behavioral improvement with the administration ofdietary supplements and/or exclusion diets (e.g. gluten- and casein-free). To date, noresearch has revealed that these treatments are effective. Dietitians should educatecaregivers on the risks of vitamin and mineral mega-dosing. In addition, the odds ofdeveloping a nutrient deficiency greatly increase when one imposes a restrictive diet ona child is already a severely picky eater.
Resources:The Out-of-Sync Child: Recognizing and Coping with Sensory Processing Disorder (Stock
Kranowitz C, 2006)Elder JH. The gluten-free, casein-free diet in autism: An overview with clinical
implications. Nutrition in Clinical Practice 23(6): 583-88, 2009.

126Clinical Pediatric Nutrition
ONCOLOGY
Cancer during childhood is the most common cause of disease-related mortality,with 2,300 deaths annually. The three most common types of cancer diagnosed inchildhood are leukemias, cancer of the central nervous system, and lymphomas/reticu-loendothelial neoplasms (Bogucki, et al., 2008). Malnutrition at the time of diagnosis isreported in 6 to 50 percent of high-risk nutrition cases. During the treatment course,malnutrition is observed in 8 to 32 percent of cases (Bogucki, et al., 2008).
Cancer treatment is tailored to the type and severity of the cancer. Therapy optionsinclude surgery, radiation, and chemotherapy. Malnourished children who undergosurgical interventions experience compromised would healing and increased morbidityand mortality, as compared to well nourished patients (Bogucki, et al., 2008). Complica-tions of surgery include the following: fatigue, nausea, emesis, and decreased appetite.
Radiation is a treatment employed to destroy the cancer cells; however, thistherapy damages healthy cells concurrently, and this is what causes adverse side effects.The duration and severity of the side effects are dependent upon the location, dose,fraction, duration, and volume of the radiation therapy. Generally, acute side effectsstart by the third week of therapy, and last until two to three weeks post-treatment(Bogucki, et al., 2008). If the GI tract is exposed to radiation, the child is more susceptibleto nutrition-related issues. Nutrition-related side effects of radiation therapy mayinclude: nausea/vomiting, fatigue, loss of appetite, xerostomia, sore mouth and/orthroat, dysphagia, odynophagia, mucositis, altered taste and smell, diarrhea, abdominalcramping, bloating, gas, colitis or enteritis, and lactose intolerance.
Chemotherapy describes a class of drugs that inhibit the growth and division ofrapidly dividing cancer cells. This type of treatment is systemic, and this there is anincreased risk of side effects, including anorexia, early satiety, vomiting, diarrhea, tastechanges, nausea, mucositis/esophagitis and constipation Side effects can alter digestionand absorption of nutrients (Bogucki, et al., 2008).
• Neuroblastoma (stages III and IV)• Acute myelogenous leukemia (AML)• Chronic myelogenous leukemia (CML)• Metastatic solid tumors• Wilms’ tumor (stages II and IV)• Medulloblastoma/CNS tumors• Acute lymphocytic leukemia (ALL)
High Risk Diagnoses

127Clinical Pediatric Nutrition
Cancer treatments have their fair share of complications! Children undergoingtreatment for cancer are at increased risk for infection, which in turn increases their riskof malnutrition by 15 to 20 percent (Bogucki, et al., 2008). Viral and bacterial infectionsincrease energy needs by up to 30 percent. Anorexia is another commonly reportedcomplication, and this is compounded by cachexia, weight loss, dehydration, persistentnausea and vomiting, and early satiety. Malabsorption may result from any of thetreatments described above. If a child experienced just one of these complications orside effects then it may not be a detriment to his/her prognosis; however, the repeatedcycles of treatment courses magnify the impact on the child’s nutritional status.
Because of its adverse effects on nutrient intake and its uniqueness to the oncologypopulation, a further description of mucositis is warranted. Mucositis is the breakdown ofthe mucosal lining of the aerodigestive and gastrointestinal tracts (Bogucki, et al., 2008).This is a side effects of certain chemotherapy agents and some forms of radiation. As youcan imagine, this is a very painful experience and often children will not want to eat.
NUTRITION ASSESSMENT: ONCOLOGY
Dietary data. Analyze dietary information for calories, protein, carbohydrate,vitamins, minerals, electrolytes and fluid by obtaining a food frequency history, 24 hourrecall or three- to five-day food record. Record foods that are reportedly not tolerated.
Determine whether the child is taking any alternative therapies, dietary supple-ments, or herbal remedies. Determine caregiver’s and child’s understanding of dietaryintervention and evaluate compliance. Assess psychological and social considerations ofthe home environment that determine eating behavior and patterns. Evaluate appetite,energy level, and feeding skills. Identify risk factors such as polypharmacy, acute, andchronic disease.
Estimate nutrition goals:Energy: Base needs for catch-up growth if growth is impaired; however, nutrition
interventions should be specific to each child’s disease classification, usualnutrient intake and growth history.REE x 1.2 to 1.5
For mildly stressed children with good nutritional status
REE x 1.5 to 1.7For mildly stressed children with baseline malnutritionFor moderately stressed children with adequate nutrition status at baseline
REE x 1.7 to 2.0For moderately stressed children with baseline malnutritionFor severely stressed children with adequate nutrition status at baseline
** Stress states include not only cancer treatment therapies but also other medicalcomplications (e.g. pneumonia, fever or sepsis.)

128Clinical Pediatric Nutrition
Protein: 150 to 200 percent RDA, unless contraindicated. Stress and nutritionalstatus at the time of initial diagnosis may increase need for protein to promoteanabolism.
Micronutrients: RDA or greater as indicated by malabsorption, medical status,medications and biochemical indices and poor diet. Compare actual intake fromdiet history to estimated needs.
• Biochemical data. Check the following labs regularly: albumin, CBC, creatinine,liver function tests, prealbumin, potassium, BUN, and total iron-binding capacity. Itshould be noted however that albumin and prealbumin results are limiting due to theadverse impact of infection and inflammation on these. Recommend checking C-reac-tive protein (CRP) concurrently when checking prealbumin; if the CRP is greater than 2,the validity of the prealbumin result is in question.
• Clinical data. Assess medical status. Monitor stooling pattern for malabsorption.Consider drug-nutrient interactions. Determine physical activity level.
GOALS AND STRATEGIES FOR NUTRITION INTERVENTION: ONCOLOGY
The main goals of nutrition therapy for the oncology patient include: maximizingoral intake, maximizing enteral nutrition whenever possible, minimizing side effects,providing parenteral nutrition support when nutrient needs cannot be fully met withenteral nutrition, and supporting age-appropriate growth and development.
Symptom Dietary InterventionNausea and Small frequent meals, high carbohydrate content, non-acidicVomiting beverages, cold clear foods and beverages, avoid extreme temp-
eratures and highly seasoned items, avoid high-fat content items.Anorexia Small frequent meals, nutrient dense foods and supplements,
carbohydrate and protein modulars, create a pleasant atmosphere,dine with the child, vary colors/flavors/textures of food.
Diarrhea Low fat, high fiber, cold or room temperature foods, avoid caffeine,encourage adequate fluid intake.
Dysgeusia Herbs, spices, and marinades, cold non-odorous foods, fruit-flavored beverages, good oral hygiene, rinse mouthwashes, lemonflavored beverages and sour candies.
Mucositis Soft diet, smooth bland moist foods, frozen slushies/ices, icecream, high calorie liquid beverages.
Xerostomia Moist foods, encourage liquids with meals, add sauces/gravy/butter/broth, add vinegar and lemons to stimulat saliva, good oral hygiene.
Dietary Interventions for Common Symptoms
129Clinical Pediatric Nutrition
ONCOLOGY CASE STUDY
8-year-old male WB presents to the emergency department with fevers and ahistory of ALL (acute lymphocytic leukemia). He may have lost some weightrecently, but does not know how much. Appetite has been fair. Upon visualinspection, he appears cachectic.
Admission weight: 22 kg (NCHS growth chart: 10-25th percentile).Admissionheight: 132 cm (NCHS growth chart: 75th percentile) BMI: 12.6 (<5th percentile);IBW/Ht: 28 kg (78.6 percentile). Standard Ht/age: 128 cm (103%) Classified asunderweight, with moderate wasting
Assessment of Estimated Nutrient Needs:Enteral: ~1690 kcal/day (REE x 1.7)
~33-44 gm Protein/day (RDA x 1.5 to 2.0 or 1.5-2.0 gm PRO/kg)~1540 mL/day (maintenance based on weight)
REFERENCES
__________ AAP Provisional Committee on Quality Improvement: The management of acute gastroen-teritis in young children. Pediatrics 97:424-435, 1996.
Andorsky DJ, Lund DP, Lillebei CW, et al. Nutritional and other postoperative management of neonateswith short bowel syndrome correlates with clinical outcomes. J Ped 139(1): 27-33, 2001.
Arce D, Ermocillia C, Costa H. American Family Physician: Evaluation of Constipation 65: 2283-90, 2002.Ayoob K. Nutrition issues in children with HIV/AIDS. Dietetics in Developmental Disabilities, Spring 1996.Belli D, Seidman E and Bouthillier L. Chronic intermittent elemental diet improves growth failure in
children with Crohn’s disease. Gatroenterol 94: 603-610, 1988.Bines J, Francis D, Hill D. Reducing parenteral requirement in children with short bowel syndrome:
impact of an amino acid-based complete formula. J Ped Gastr Nutr 26(2): 123-128, 1998.Bogucki B, Sacks N, Wallace E. Nutrition challenges of the pediatric oncology population. Nutrition Week
conference lecture, 2008.__________ Children’s Hospital and Medical Center and University of Washington Nutrition guidelines
for children with disabilities and chronic illnesses. WA DSHS, 1989.Church J. HIV Disease in Children: The many ways it differs from the disease in adults. Post Grad Med
107(4): 163-82, 2000.Cohen S, Hendricks K, Mathis R, et al. Chronic nonspecific diarrhea: Dietary relationships. Ped 64: 402-404, 1979.__________ Committee on Pediatric AIDS. Human milk, breastfeeding, and transmission of human
immunodeficiency virus in the United States. Ped 96(5): 977-978, 1995.Foster BJ, Leonard MB. Measuring nutritional status in children withchronic kidney disease. Am J Clin
Nutr 80(4): 801-814, 2004.Francavilla R, Miniello VL, Lionetti ME, et al. Hepatitis and cholestasis in infancy: clinical and nutritional
aspects. Acta Paediatr Suppl 441: 101-104, 2003.Gonzalez HF, Perez NB, Malpeli A, et al. Nutrition and immunologic status in long-term follow-up of
children with short bowel syndrome. JPEN 29(3): 186-191, 2005.Gorbea-Robles M, Flores L, Torres-Gonzalez F, et al. Nutrition assessment in pediatric patients infected
with human immunodeficiency virus. Nut in Clinical Practice 13: 172-176, 1998.Groh-Wargo S, Thompson M, Cox J, eds. Nutritional Care for High-risk Newborns, 3rd ed. Chicago IL:
Precept Press, Inc. 2000.Hawkins R, Henry B, Gottschalk ME. Pectin supplemented enteral feedings in the treatment of short
bowel syndrome in two infants (poster session). J Am Diet Assoc 95(9): A28, 1995.

130Clinical Pediatric Nutrition
Heller L, Fox S, Hell K, Church J. Development of an instrument to assess nutritional risk factors for children infectedwith human immunodeficiency virus. JADA 100: 323-329, 2000.
Hyman P. Gastroesophageal reflux: One reason why baby won’t eat. J Ped 125: S103-109, 1994.Jung A. Gastroesophageal reflux in infants and children. Am Fam Physician 64: 1853-1860, 2001.Karpen S. Update on the etiologies and management of neonatal cholestasis. Clin Perinatol 29(1): 159-180, 2002.Katsh N. Nutrition concerns in acute and chronic diarrhea. Nutrition Focus 15(6), 2000.Kruzich LA, et al. US youths in the early stages of HIV diseases have low intakes of some micronutrients important for
optimal immune function. JADA 104(9): 1481, 2004.Laiho K and Nuutinen O. Crohn’s disease affects diet and growth in children. J Hum Nutr and Dietetics 11: 287-294, 1998.Miller T, Awnetwant E, Evans S, et al. Gastrostomy tube supplementation for HIV-infected children. Pediatrics 96: 696-
702, 1995.Montagne JP, Coussement A, Gruner M, Fauré C. Neonatal intestinal obstruction. 2 cases in newborn infants fed pectin
and cellulose food thickeners. J Radiol Electrol Med Nucl 55(8-9): 607-9, Aug-Sep 1974.Nordin V, Ekvall SW. Autism. In: Ekvall SW, Ekvall VK (Ed.) Pediatric Nutrition in Chronic Diseases and Developmental
Disorders. Oxford University Press, 2005.O’Brien K, Razari M, Henderson R, et al. Bone mineral content in girls prenatally infected with HIV. Am J Clin Nut 73(4):
821-826, 2001.Papasavas PK, Keenan RJ, Yeaney WW, et al. Effectiveness of laparoscopic fundoplication in relieving symptoms of
gastroesophageal reflux disease (GERD) and eliminating antireflux medical therapy. Surg Endosc 17(8): 1200-5,2003.
Parker P, Stroop S, Greene H. A controlled comparison of continuous versus intermittent feeding in the treatment ofinfants with intestinal disease. J Pediatr 99(3): 360-364, Sep 1981.
Porcellini M, Bonaudo R, et al. Providing the right stuff: Feeding children with chronic renal failure. J Nephrol 11:171-176,1998.
__________ Position of the American Dietetic Association and Dietitians of Canada: Nutrition intervention in the care ofpersons with human immunodeficiency virus infection. JADA 100: 708-717, 2000.
Read J, Committee on Pediatrics AIDS. Human milk, breastfeeding, and transmission of human immunodeficiencyvirus type 1 in the US. Pediatrics 112(5): 1196-1205, 2003.
Rodzilsky D and Constatinescu A. Nutritional guidelines for infants and pediatric patients on peritoneal dialysis.Nephrology News and Issues May: 22-23, 1997.
Rothpletz-Puglia P. Nutritional management of the child with HIV infection. Nutrition Focus Vol 14 (1,2) 1999.Rudolph C, Mazur L, Liptak G, et al. Guidelines for evaluation and treatment of gastroesophageal reflux in infants and
children: recommendations from the North American Society for Pediatric Gastroenterology and Nutrition. J PedGast Nut 32-suppl 2: S1-31, 2001.
Sabo J. Nutrition management of renal diseases. In: Amorde-Spalding K, Nieman L (Eds.) Pediatric Manual of ClinicalDietetics, 2nd ed. AmericanDietetic Association, 2008.
Saha M-T, Ruvska T, et al. Growth of prepubertal children with inflammatory bowel disease. JPGN 26: 310-314, 1998.Sullivan M and Heyman M. Increasing use of nutritional therapy in pediatric inflammatory bowel disease. Essential
News for Dietitians, Sandoz 15(1): 1-9, 1995.Vandenplas Y, Belli D, Benhamou P, et al. A critical appraisal of current management practices for infant regurgitation -
recommendations of a working party. Eur J Pediatr 156(5): 343-57, May 1997.Vanderhoof J, Langnas A, Pinch L, et al. Short bowel syndrome. J Ped Gastroenterol Nut 14(4): 359-370, 1992.Vanderhoof J. New and emerging therapies for short bowel syndrome in children. J Ped Gastr Nutr 29: S769-771, 2004.Wenzl TG, Schneider S, Scheele F, et al. Effects of thickened feeding on gastroesophageal reflux in infants: A placebo-
controlled crossover study using intraluminal impedance. Pediatrics 111(4): e355-e359, 2003.

131Clinical Pediatric Nutrition
Chapter Eleven:Developmental Disabilities
DOWN SYNDROME (DS)Down (or "Down's") syndrome (DS), named for the the British doctor who de-
scribed the syndrome in 1866, is caused by a chromosomal disorganization resulting inthe presence of an additional chromosome on the #21 arm (hence its other name: tri-somy 21). At approximately one in every 800 to 1,000 live births, it is the most commonchromosomal abnormality associated with mental retardation in the US (Saenz, 1999).
Children with DS show a wide variability in mental abilities, behavior and physicaldevelopment. Common physical features include a flattening of the back of the head,slightly slanted eyelids, epicanthal folds at the inner corners of the eye, a mildly de-pressed nasal bridge, short broad hands, and a furrowed tongue. Individuals are usu-ally hyperflexible and slightly hypotonic.
Approximately 40 to 50 percent of children have heart defects. Other commonassociations include hypothyroid, hearing deficiency, obesity, and seizure disorders.About 8 to 12 percent have gastrointestinal tract anomalies, including esophageal atresia,tracheoesophageal fistula, pyloric stenosis, duodenal atresia, Meckel's diverticulum,Hirschsprung's disease, and imperforate anus.
During infancy, feeding problems often develop due to hypotonia, cardiac difficul-ties, a small oral cavity causing tongue protrusion, or abnormal dentition. Other nutri-tion-related issues commonly experienced in DS include gastroesophageal reflux anddysphagia.
NUTRITION ASSESSMENT FOR DOWN SYNDROME
• Anthropometric data. Monitor serial measurements of weight, length or height,OFC (under age 3), mid-arm circumference and triceps and subscapular fatfold.
Plot linear growth on the Down’s syndrome-specific growth charts (Cronk, et al.,

132Clinical Pediatric Nutrition
1988). Some researchers believe that children with Down syndrome should be plottedand charted on a standard growth chart. Crossing of growth channels may be due togrowth hormone deficiency and an appropriate investigation is warranted.
Weight gain is generally more rapid than linear growth and the tendency to beoverweight is reflected in the Down syndrome specific weight charts. It is recom-mended to plot weight on both the Down syndrome and NCHS charts. Weight forlength and OFC can be plotted on NCHS charts.
Calculate body composition parameters for fat and muscle reserves.• Dietary data. Obtain 3- to 5-day food records and analyze usual intake for calo-
ries, protein, vitamins and minerals.In infancy, evaluate oral motor skills and address parent’s concerns regarding
feeding and developmental readiness to progress to complex textures.Estimate nutrition goals:Energy: young infants may need additional calories due to cardiac anomalies or
feeding difficulties. Older infants and toddlers without heart disease need fewer calo-ries because of hypotonia and decreased velocity of linear growth. Individualize caloriegoals and base on height with figures adjusted for activity.
Children with Down syndrome and an appropriate weight for height:Male: 16.1 kcal/cmFemale: 14.3 kcal/cm
Children with Down syndrome and who are >120 percent of standard weight forheight (Pipes, 1988; Ekvall, 1993):
Male: 13 kcal/cmFemale: 12 kcal/cm
Protein: Provide protein per RDA based on ideal weight for height.Micronutrients: There is no current definitive research that points to nutrient abnor-
malities in children with Down’s syndrome. Emphasis should be placed on consuminga balanced diet and administration of an age-appropriate multi-vitamin supplementdaily.
• Biochemical data. See above.• Clinical data. Monitor health status and complications of cardiac and/or GI
anomalies. Evaluate for dental concerns.
GOALS AND STRATEGIES FOR INTERVENTION: DOWN SYNDROME
Goals of nutritional therapy are to optimize nutritional status and promote devel-opmental feeding progress while maintaining a weight for height between the 10th and75th percentile on NCHS growth chart. Nutrition intervention strategies include:
• Monitor growth regularly. Adjust energy needs to maintain appropriate growthparameters by encouraging foods high in nutrient value and higher or lower caloricvalue as needed.
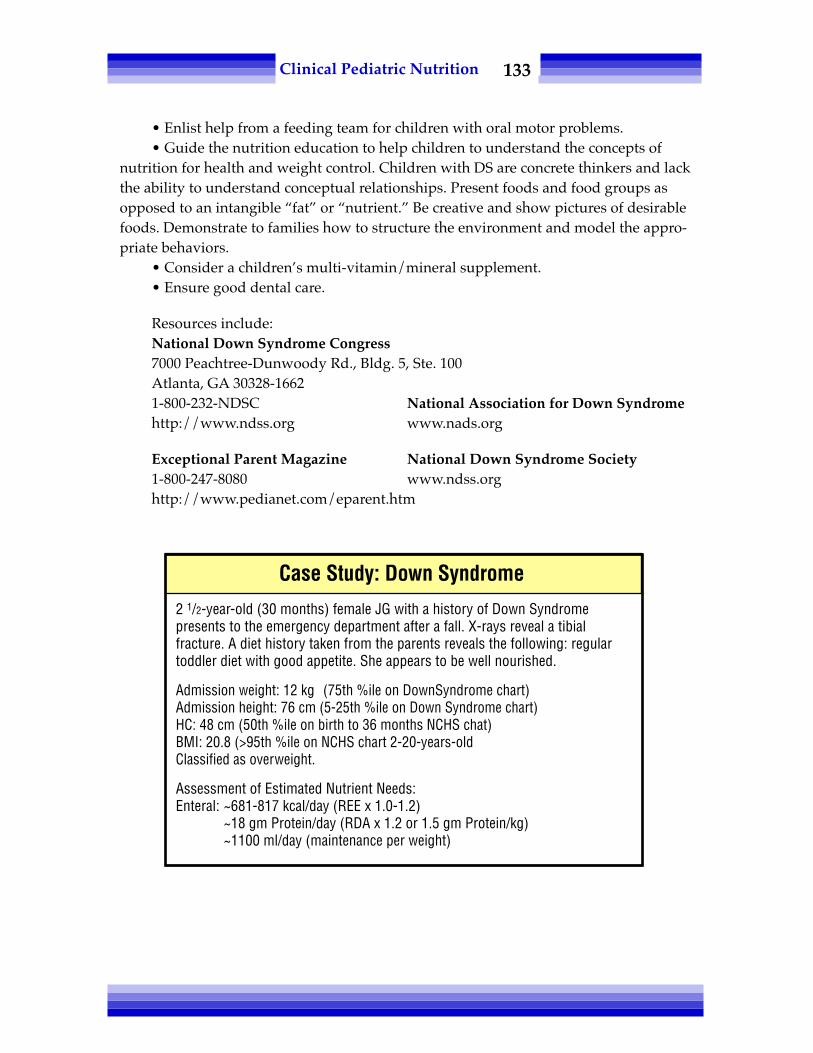
133Clinical Pediatric Nutrition
• Enlist help from a feeding team for children with oral motor problems.• Guide the nutrition education to help children to understand the concepts of
nutrition for health and weight control. Children with DS are concrete thinkers and lackthe ability to understand conceptual relationships. Present foods and food groups asopposed to an intangible “fat” or “nutrient.” Be creative and show pictures of desirablefoods. Demonstrate to families how to structure the environment and model the appro-priate behaviors.
• Consider a children’s multi-vitamin/mineral supplement.• Ensure good dental care.
Resources include:National Down Syndrome Congress7000 Peachtree-Dunwoody Rd., Bldg. 5, Ste. 100Atlanta, GA 30328-16621-800-232-NDSC National Association for Down Syndromehttp://www.ndss.org www.nads.org
Exceptional Parent Magazine National Down Syndrome Society1-800-247-8080 www.ndss.orghttp://www.pedianet.com/eparent.htm
2 1/2-year-old (30 months) female JG with a history of Down Syndromepresents to the emergency department after a fall. X-rays reveal a tibialfracture. A diet history taken from the parents reveals the following: regulartoddler diet with good appetite. She appears to be well nourished.
Admission weight: 12 kg (75th %ile on DownSyndrome chart)Admission height: 76 cm (5-25th %ile on Down Syndrome chart)HC: 48 cm (50th %ile on birth to 36 months NCHS chat)BMI: 20.8 (>95th %ile on NCHS chart 2-20-years-oldClassified as overweight.
Assessment of Estimated Nutrient Needs:Enteral: ~681-817 kcal/day (REE x 1.0-1.2)
~18 gm Protein/day (RDA x 1.2 or 1.5 gm Protein/kg)~1100 ml/day (maintenance per weight)
Case Study: Down Syndrome

134Clinical Pediatric Nutrition
PRADER-WILLI SYNDROME (PWS)Prader-Willi syndrome affects about 1 in 10,000 to 1 in 20,000 people of both sexes
and all races (Ekvall, 2005). Many individuals have an abnormality of chromosome 15;however, not all persons with this deletion have PWS. Hence, diagnosis is made on thebasis of clinical symptomatology (Ekvall 1993; Pipes, 1990).
The chart below lists characteristics seen in 50 to 100 percent of individuals with PWS.
In infancy, the disorder is characterized by profound hypotonia, developmentaldelay and failure to thrive. A weak suck often requires initiation of nutrition supportsuch as nasogastric or gastrostomy feedings.
Between 1 and 4 years of age, appetite problems become apparent and rapidweight gain occurs. There is a defect in the hunger-satiety mechanism that manifests asa continuous urge to eat. Coupled with reduced energy metabolism and hypotonia,obesity is often a problem. Behavior problems are evident in childhood and adolescencewith temper tantrums, stubbornness, rigidity, argumentativeness and repetitivethoughts and behaviors.
Common associations are results of obesity and may be prevented: scoliosis,diabetes mellitus type 2, Pickwickian syndrome, sleep apnea and heart disease.
NUTRITION ASSESSMENT FOR PWS• Anthropometric data. Children with PWS are shorter than non-affected children.
Measure: weight, length or height, OFC (under age 3), mid-arm circumference, andtriceps and subscapular fatfolds.
Plot linear measurements on the PWS-specific growth charts. Infants with PWShave a normal length at birth, with deceleration after the first few months of life; fur-
• Hypotonia in infancy with normal neuromuscular studies• Feeding problems in infancy• Obesity between 12 months and 6 years• Abnormal growth:
– short stature– small hands and feet– narrow forehead– scoliosis
• Incomplete sexual development(Holmes, 1993)
• Irregularities in body temperaturecontrol mechanisms
• Speech and language difficulties• High pain threshold• Hyperphagia• Low muscle tone• Reduced basal energy expenditure• Growth hormone deficiency• Characteristic behavior problems• Global developmental delay
Classification Criteria for Children with PWS

135Clinical Pediatric Nutrition
thermore, the typical adolescent growth spurt is not experienced by adolescents withPWS. Plot weight, weight-for-length and OFC on NCHS charts.
Calculate body composition parameters for fat and muscle reserves. Growthhormone therapy has shown benefit in decreases of body fat mass and weight for heightindices (Eiholzer, 2004).
• Dietary data. In infancy, evaluate oral motor skills and address parent’s concernsregarding feeding and behaviors. In childhood, food-related manners such as foraging,hoarding, sneaking and gorging become a problem.
Obtain a 3 to 5-day food record to get sufficient data to quantify usual intake ofcalories, protein, vitamins and minerals. This provides good information on usualcalorie intake and provides a precise baseline on which to adjust recommendations.
Estimate nutrition goals and standards:Energy: Young infants may need additional calories due to feeding difficulties and
failure to thrive. Toddlers and children with PWS need appreciably fewer calories thannormal to maintain weight because of poor muscle development, a lower ratio of fatfree mass and reduced basal energy expenditure (Hirsch, 2000). Additionally, lineargrowth velocity is slowed, thereby reducing daily calorie needs.
Daily calorie needs are estimated at 50 to 75 percent of individuals of the same ageand sex (Holm and Pipes, 1976). Individualize calorie goals and base estimations onheight instead of weight. Adjust for activity level. Estimated needs for preschool andschool-aged children are:
To promote weight maintenance: 8 to 14 kcal/cm of height (Holm and Pipes, 1976).To effect a gradual weight loss while linear growth continues in channel:
8.5 to 9.5 kcal/cm (Ekvall, 1993; Pipes, 1990).Protein: 25 percent of energy intake dailyMicronutrients: RDA levels. A multi-vitamin/mineral supplement is recommended
• Biochemical and clinical data. No specific tests are indicated. Monitor for healthstatus and behavioral problems. Evaluate medications. To date, no appetitesuppressants have worked for all persons with PWS.
GOAL AND STRATEGIES FOR INTERVENTION: PWSGoals of nutritional therapy are to optimize nutrition status maintaining a weight
for height between the 25th and 75th percentile, or a BMI of less than 85th percentile onthe NCHS growth chart (Ekvall, 2005).
In infancy, failure to thrive is common because of hypotonia and a weak suck.Increase the caloric density of formula to support growth. Alternate feeding supportmay be needed such as gastrostomy or nasogastric feedings.
An interdisciplinary approach is best for children with PWS given the diversity oftheir medical and behavioral/social issues.
The key to weight maintenance is early intervention, a lifelong low calorie dietand regulation of the environment to limit access to food. Close monitoring is essentialto prevent obesity before it becomes a significant problem. Behavior management, use

136Clinical Pediatric Nutrition
of incentives, and rewarding compliance with exercise are some strategies that havehelped families (Goldberg, 2002). Food restriction can be challenging and will impactthe entire family. A multiple vitamin and mineral supplement is recommended.
Weight control mechanisms are described in the table below.
RESOURCES
Prader-Willi Syndrome Association March of Dimes Birth2510 Brentwood Blvd. Defects FoundationSt. Louis, MO 63144 www.modimes.org1-800-926-4797www.pwsausa.org
The Prader-Willi Connection1-800-358-0682
FETAL ALCOHOL SYNDROME (FAS)Fetal alcohol syndrome is one of the chief causes of mental retardation that is
completely preventable. If mothers did not drink alcohol while they were pregnant,children would not be born with FAS. The American Academy of Pediatrics recom-mends abstinence from alcohol for women who are pregnant or who are planning apregnancy (AAP, 2000). The National Council on Alcoholism outlines the three criteriaused for diagnosis: abnormalities in growth, central nervous system dysfunction, andcharacteristic facial features. A less severe condition is characterized as fetal alcoholeffects (FAE).
Weight Control Mechanisms for Children w/PWS
• Individualize energy intake recommendations to achieve appropriateweight for height.
• Control environment to limit access to food at home, school & elsewhere.– Lock all refrigerators, cupboards, garbage cans. Recognize and
monitor any opportunities for food procurement in any setting.
• Prepare behavioral management strategies to respond to food-seekingbehaviors.
– Use verbal praise and non-food rewards.– A drastic but successful tactic is removing parts of a meal or
snack in response to tantrums or outbursts.
• Encourage regular exercise activities as part of daily routine.
• Family support is necessary to control & monitor food-related behaviors.

137Clinical Pediatric Nutrition
The occurrence is most likely underdiagnosed, but estimated to be about 0.9 to 1.9per 1,000 live births. More recent data suggest that incidence rates are 5.2 per 10,000 livebirths (American Academy of Pediatrics, 2000). For FAS and FAE combined it is esti-mated to occur in about one in 300 live births.
NUTRITION ASSESSMENT FOR FAS• Anthropometric Data: Obtain current growth measurements and growth history.
Growth deficiency is related to FAS and may not respond to nutritional intervention.Generally, children are below the 10th percentile for stature and have a low weight forheight ratio. They may have a growth spurt after puberty, and weight gain is common.Overweight can become a problem in adolescence.
Measure weight, length, OFC, mid-arm circumference and triceps and subscapularfatfolds.
Plot weight-for-age, length- or height-for-age, OFC-for-age, and weight-for-lengthor height on NCHS growth charts.
• Dietary data: Obtain a diet history and assessment of usual intake of calories,protein, micronutrients and fluid.
Assess feeding skills and developmental milestones. Infants often have a weaksuck and may take an excessive amount of time to feed. Streissguth, et al. (1997) noticeda dose-effect response between alcohol intake and feeding difficulties.
Determine feeding behavior. Children with FAS are highly distractible and havedifficulties making transitions. Consider psychosocial consequence affecting nutritionalintake, including family lifestyle, supports and food resources.
Estimate nutrient requirements:Calories: RDA-for-age or size. Estimate for catch-up as needed.Protein: RDA based on ideal weight-for-age or size.Vitamins and minerals: RDA (unless on medications that interfere with nutrient
utilization).• Biochemical data: Per standard monitoring of infants and children.• Clinical data: Evaluate health status and sleeping patterns.
Principal Features of Children with FAS
Mild to moderate mental retardationMicrocephalyIrritability in infancyGrowth retardation at birthGrowth retardation postnatally
Diminished fat storesEpicanthal foldsHypoplastic philtrumThin upper lipFlat midface

138Clinical Pediatric Nutrition
GOALS AND INTERVENTION OF FASGoals of nutritional therapy are to achieve optimal nutrition status and steady but
consistent growth. Getting the mother who continues to drink alcohol into a treatmentprogram will confer the greatest benefits to the child. Drinking mothers should notbreastfeed their infants.
Regular monitoring of growth and feeding is important to identify problems. Setrealistic growth expectations. Maintain steady growth along a consistent growth chan-nel, even if below the 5th percentile.
Control the environment to decrease distractibility. Turn off lights, minimize noiseand try swaddling the infant. Help the older child with transitions by setting a routineor ritual prior to mealtime and snacks.
RESOURCES
The Fetal Alcohol Syndrome Family Resource Institutewww.accessone.com/~delindam/1-215-531-2878
National Organization on Fetal Alcohol Syndromewww.nofas.org1-202-785-4585
March of Dimes Birth Defects Foundationwww.modimes.org
SPINAL MUSCULAR ATROPHY
Spinal muscle atrophy (spinal muscular atrophy, SMA) is an autosomal recessivegenetic disease. SMA is characterized by progressive hypotonia and muscular weak-ness. Weakness occurs because of a progressive degeneration of the alpha motor neuronfrom anterior horn cells in the spinal cord. Intellect is generally unaffected.
Incidence of SMA is about one case in 15,000 to 20,000 (five to seven per 100,000)live births. SMA is the most common degenerative disease of the nervous system inchildren. It is the leading cause of infant mortality among the genetic disorders. Malesare twice as likely to be affected with SMA as compared to females; the clinical course inmales is more severe.
There are three different types of SMA. When you look at the gene mutations of thedifferent types they appear to be similar; however, they differ in the patient’s age atpresentation and in their clinical courses.
• Type I (Werdnig-Hoffmann disease): usually identified birth to age 6 months.Newborns with Type I SMA are floppy and inactive. Infants cannot control or lift theirhead, which often leads to issues with aspiration and dysphagia.
• Type II diagnosed in infants 6 to 12 months. Patients with Type II SMA havehead control, and 75 percent of these patients can sit independently. Muscular weakness

139Clinical Pediatric Nutrition
is greater in the lower extremities than the upper extremities. Feeding issues present at alater age as compared to Type I SMA.
• Type III (Kugelberg-Welander disease): diagnosed in children 2 to 15 years.Patients with Type III SMA walk early in life and do not have degeneration in theseskills until adolescence or later.
The prognosis is worse for patients who are diagnosed at younger ages. Patientswith Type I SMA usually die by age 2; some patients with Type II SMA live into their50s, while patients with Type III SMA have a nearly normal life expectancy. Deathoccurs as a result of respiratory compromise. If caregivers choose to pursue more ag-gressive respiratory interventions (e.g. tracheostomy), the life span can be extended.
Dietary interventions for SMA may include an increase or decrease of energyintake. Affected infants and children may develop difficulty sucking and swallowing.Dysphagia may be treated with various methods: position changes, volume changes, orthickening of liquids. Weakness of the muscles in the face and tongue generally lead toinadequate oral intake and thus poor growth. Many patients, particularly Type I SMA,eventually require placement of a feeding tube to ensure adequate nutrient intake. Itappears that placement of a percutaneous endoscopic gastrostomy (PEG) was found tobe safe with minimal risks.
There is much discussion among the members of on-line SMA support groupsabout the need for special dietary interventions in treating SMA, including exclusiveuse of elemental enteral formulas, extreme dilution of enteral formulas, limited proteinintake, and supplementation with glutamine, arginine, vitamins, minerals and enzymes.
Unfortunately, these recommendations are solely based on anecdotal reports. Todate, there is no proven benefit to utilizing elemental formulas in treating SMA. Morestudies are needed to evaluate if people affected by SMA also have a fatty acid oxida-tion defect. There is discussion among the scientific community about whether treat-ment with carnitine would benefit SMA patients, but there are no studies to supportthis.
Nutrition management of SMA should focus on the following:• Limit fasting• Avoid excessive weight gain• Provide frequent meals and snacks• Provide moderate/low fat intake• Meet the age-appropriate DRI for protein• Provide adequate fluid to maintain hydration
Patients with SMA generally have lower energy requirements due to decreasedmuscle mass and decreased energy expenditure (a.k.a. activity). In clinical experience, ithas been noted that patients may require as little as 70 to 90 percent of their restingenergy expenditure to avoid excessive weight gain. If ventilator support is pursued,energy needs will decrease even further.

140Clinical Pediatric Nutrition
DUCHENNE MUSCULAR DYSTROPHY
Duchenne Muscular Dystrophy (DMD) is the most common muscular dystrophyin children. Appearing between age 2 and 6, DMD is a degenerative disorder that affectsmuscles, causing progressive and degenerative muscle weakness. It is caused by amutation in the dystrophin gene, which creates a protein that anchors muscle fibers incells.
Prevalence of DMD is approximately one in 3,500 live-born males in the UnitedStates; an X-linked genetic disorder, DMD affects mainly males. The disease progressionvaries, but many children need a wheelchair by the age of 12. In contrast to SMA, somechildren affected by DMD are mildly retarded.
People with DMD generally die in their late teens or early 20s. Possible nutritionimplications of DMD include: decreased energy needs due to decreased energy expen-diture and dysphagia. A recent studied revealed that symptoms related to pharyngealphase dysfunction were more frequent than those related to oral and oesophagealphases in a cohort of 31 patients affected by DMD. Coughing while eating was seen in71 percent of the patients, choking while eating in 32 percent and a need to clear thethroat in 26 percent.
Abnormalities of a videofluoroscopy (a.k.a. modified barium swallow) were ob-served in 30 patients (96.8 percent). Common abnormalities included pooling in thevalleculae (90.3 percent) and in the pyriform sinus (90.3 percent). This study concludedthat videofluoroscopy is recommended for all patients with DMD (Hanayama, et al.,2008). The body mass index should be used with caution for the evaluation of thenutritional status of patients with DMD. Indices that incorporate the assessment of bodycomposition are more sensitive (Pessolano, et al., 2003).
MITOCHONDRIAL DISORDERS
The term “mitochondrial disorders” describes a grouping of a large number ofseparate inborn errors of metabolism. The two most frequently seen causes of mitochon-drial disorders are defects in the pyruvate dehydrogenase complex subunits and defectsin the electron transport chain components.
Mitochondrial diseases are quite diverse in their degree of severity, age of onset,organ and/or tissue involved, and method of inheritance (i.e. autosomal recessive vsmaternally inherited). Tissues that require high energy (e.g. nerves, muscles, endocrinegland, kidney) are most likely to be affected in mitochondrial disorders. With the excep-tion of pyruvate dehydrogenase complex deficiency (PDH), mitochondrial disordersinvolve defects in the metabolism of sugars, fatty acids, and amino acids, and thus thetypical of approach of limiting the offending nutrient is not applicable. PDH has beentreated with the ketogenic diet with carrying degrees of success.
Dietary management of mitochondrial disorders involves avoidance of fasting, asfasting may result in disease manifestations with or without hypoglycemia. The issue ofdietary fat content has been causing much controversy.
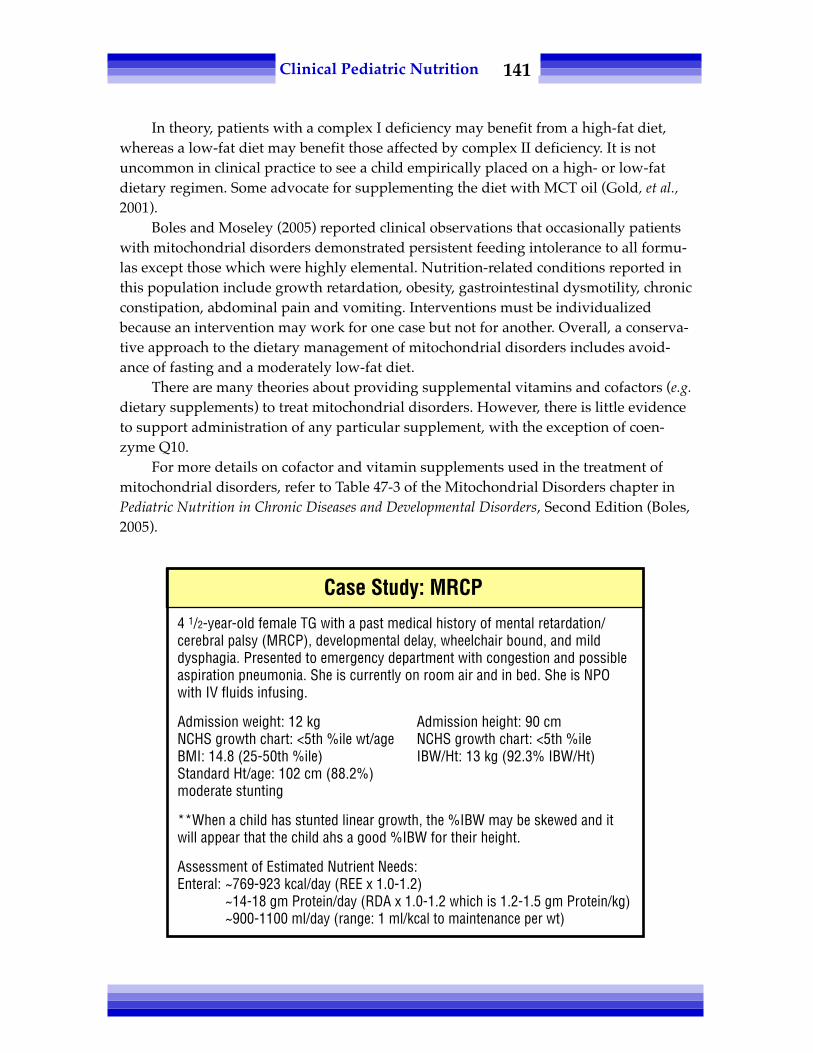
141Clinical Pediatric Nutrition
In theory, patients with a complex I deficiency may benefit from a high-fat diet,whereas a low-fat diet may benefit those affected by complex II deficiency. It is notuncommon in clinical practice to see a child empirically placed on a high- or low-fatdietary regimen. Some advocate for supplementing the diet with MCT oil (Gold, et al.,2001).
Boles and Moseley (2005) reported clinical observations that occasionally patientswith mitochondrial disorders demonstrated persistent feeding intolerance to all formu-las except those which were highly elemental. Nutrition-related conditions reported inthis population include growth retardation, obesity, gastrointestinal dysmotility, chronicconstipation, abdominal pain and vomiting. Interventions must be individualizedbecause an intervention may work for one case but not for another. Overall, a conserva-tive approach to the dietary management of mitochondrial disorders includes avoid-ance of fasting and a moderately low-fat diet.
There are many theories about providing supplemental vitamins and cofactors (e.g.dietary supplements) to treat mitochondrial disorders. However, there is little evidenceto support administration of any particular supplement, with the exception of coen-zyme Q10.
For more details on cofactor and vitamin supplements used in the treatment ofmitochondrial disorders, refer to Table 47-3 of the Mitochondrial Disorders chapter inPediatric Nutrition in Chronic Diseases and Developmental Disorders, Second Edition (Boles,2005).
4 1/2-year-old female TG with a past medical history of mental retardation/cerebral palsy (MRCP), developmental delay, wheelchair bound, and milddysphagia. Presented to emergency department with congestion and possibleaspiration pneumonia. She is currently on room air and in bed. She is NPOwith IV fluids infusing.
Admission weight: 12 kg Admission height: 90 cmNCHS growth chart: <5th %ile wt/age NCHS growth chart: <5th %ileBMI: 14.8 (25-50th %ile) IBW/Ht: 13 kg (92.3% IBW/Ht)Standard Ht/age: 102 cm (88.2%)moderate stunting
**When a child has stunted linear growth, the %IBW may be skewed and itwill appear that the child ahs a good %IBW for their height.
Assessment of Estimated Nutrient Needs:Enteral: ~769-923 kcal/day (REE x 1.0-1.2)
~14-18 gm Protein/day (RDA x 1.0-1.2 which is 1.2-1.5 gm Protein/kg)~900-1100 ml/day (range: 1 ml/kcal to maintenance per wt)
Case Study: MRCP

142Clinical Pediatric Nutrition
REFERENCES
AAP (American Academy of Pediatrics) Statement on Prenatal Exposure to Alcohol. Pediatrics August,2000.
American Academy of Pediatrics. Fetal alcohol-related neuro-development disorders. Pediatr 106: 358,2000.
Boles R, Moseley. Mitochondrial Disorders. In: Ekvall SW, Ekvall VK (Eds.) Pediatric Nutrition in ChronicDisease and Developmental Disorders, 2nd ed. Oxford University Press, 2005.
Carrel A, Myers S, Whitman B, Allen D. Growth hormone improves body composition, fat utilization,physical strength and agility, and growth in Prader-Willi syndrome: A controlled study. J Pediatr134(2): 215-221, 1999.
Cronk C, Crocker A and Pueschel S. Growth charts for children with Down’s syndrome 1 month to 18years of age. Peds 18: 102-110, 1988.
Eiholzer V, Blum W, Molinari L. Body fat determined by skinfold measurements is elevated despiteunderweight in infants with Prader-Labhart-Willi syndrome. J Pediat 134(2):222-225, 1999.
Ekvall S, ed. Pediatric Nutrition in Chronic Diseases and Developmental Disorders: Prevention, Assessment andTreatment. Oxford University Press, Inc. 1993.
Ekvall SW, Ekvall VK (Eds.). Pediatric Nutrition in Chronic Diseases and Development Disorders, 2nd ed.Oxford University Press, 2005.
Gold DR, Cohen BH. Treatment of mitochondrial cytopathies. Semin Neurol 21: 309, 2001.Goldberg DL, Garrett CL, Van Riper C, et al. JADA 102(4): 537-542, 2002.Hanayama K, Liu M, Higuchi Y, et al. Dysphagia in patients with Duchenne muscular dystrophy evalu-
ated with a questionnaire and videofluorography. Disabil Rehabil 30(7): 517-22, 2008.Hirsch D. Prader-Willi Syndrome. Lancet 19(356): 673, 2000.Holmes V, Cassidy S, Butler M, et al. Prader-Willi Syndrome: Consensus diagnostic criteria. Peds 91(2):
398-401, 1993.Holmes VA, Pipes PL. Food and children with Prader-Willi Syndrome. Am J Dis Child 130: 1063, 1976.Pessolano FA, Suarez AA, Monteiro SG, et al. Nutritional assessment of patients with neuromuscular
diseases. Am J Phys Med Rehabil 82(3): 182-5, 2003.Pipes P. Nutrition and individuals with Down’s Syndrome. Nutrition News, May/June 1988.Pipes P. Prader-Willi Syndrome and Rett Syndrome. Nutrition Focus, Mar/Apr, 1990.Saenz R. Primary care of infants and young children with Down Syndrome. Am Fam Phy 59(2): 381, 1999.Streissguth A. A Guide for Families and Communities: Fetal Alcohol Syndrome, Brooks Publishing, 1997.

143Clinical Pediatric Nutrition
Chapter Twelve:Endocrine Disorders
DIABETES MELLITUS (DM)According to the Centers for Disease Control, more than 13,000 young people are
diagnosed with type I diabetes annually (CDC website, 2008). About 186,300 youngpeople under 20 years of age have type I and type II diabetes. In the US, the incidence oftype I DM is rising in most age and ethnic groups; this is in accordance with the increas-ing incidence worldwide.
Although experts agree that the rates of type II diabetes are exponentially increas-ing due to the increased rates of overweight and obesity, the cause for increasing ratesof type I DM is unknown. An in-depth description of types of insulin and oral medica-tions used to treat the forms of diabetes is beyond the scope of this chapter.
TYPE I DMHearing the term "type I diabetes," many people’s first thought is “childhood
diabetes.” Although 25 percent of type I DM cases are diagnosed in early adulthood orolder, it is most often diagnosed during childhood. This type of diabetes is caused by adecrease in the production of insulin by the pancreatic beta cells.
Studies have not yet determined the etiology of type I DM, although we do knowthat a person with an affected close relative is at significantly increased risk for develop-ing this disease. There are theories that environmental factors are linked to an increasedrisk for type I DM, although studies are conflicting. Environmental factors that havebeen implicated include the following: viral infections, immunizations, diet (exposure tocow’s milk at an early age, in particular), and perinatal factors (e.g. maternal age, preec-lampsia, neonatal jaundice, and low birth weight).

144Clinical Pediatric Nutrition
A person with classic type I DM typically presents with hyperglycemia withoutacidosis. Symptoms are caused by hyperglycemia — polyuria, polydipsia, weight loss,polyphagia, and lethargy. However, children with type I DM may present with diabeticketoacidosis (DKA), which is hyperglycemia coupled with ketoacidosis. DKA requireshospitalization for rehydration, aggressive insulin therapy and close monitoring. Thesymptoms cited above are generally present, but are more severe. Young children aremore likely to develop DKA than older children.
The basis for diagnosing diabetes in children is similar to adults. Criteria fordiagnosis include:
• Fasting plasma glucose exceeding 126 mg/dL on two occasions;• A non-fasting plasma glucose exceeding 200 mg/dL, as well as symptoms of
hyperglycemia; and• An oral glucose tolerance test with a plasma glucose exceeding 200 mg/dL
(although this test is generally not necessary when diagnosing type I DM be-cause most children and adolescents are symptomatic).
Immediately following initial diagnosis, training for the patient and care giver(s)should focus on “survival skills:” understanding the cause and treatment of type I DM,maintaining a daily glucose monitoring schedule, insulin administration, basic carbohy-drate counting, recognizing symptoms of hypo- and hyperglycemia, and sick daymanagement.
Once the basic management techniques have been mastered by the patient and caregiver(s) and the child’s diabetes is well-controlled, the decision to pursue advanceddiabetes management techniques depends upon care giver motivation and ability tocomprehend more complex concepts. Advanced management skills may include ad-vanced carbohydrate counting and transition to an insulin pump.
• Promoting optimal glycemic control by balancing food, activity, medication• Avoiding hyperglycemia (which increases risk for long-term complications)• Avoiding severe hypoglycemia (which can cause permanent neurological
damage)• Achieving and maintaining normal blood lipid levels• Implementing a practical, realistic, individual plan for patient and care
giver(s)• Maintaining normal growth and development• Supporting self-management as the patient’s maturation level allows• Educating patients and care giver(s) to recognize and treat hypoglycemia
Goals of Type I DM Management

145Clinical Pediatric Nutrition
Nutrition assessment of a diabetic infant or child should include evaluation ofanthropometric measurements, growth pattern, medical and surgical history, biochemi-cal indices, current diet, and activity/exercise.
Energy: the goal is to provide adequate caloric intake to support growth velocitythat is normal for age; if weight loss occurred prior to diagnosis, an additional200 to 700 kcal/day may be needed initially (Nevin-Folino, 2003).
Protein: DRI for age should be adequate. Ten to 20 percent of calories from proteinare also considered appropriate.
Carbohydrate: Should comprise 50 to 60 percent of total daily caloric intake.Evenly distribute carbohydrate intake throughout the day. Encourage nutrient-dense carbohydrates, but that does not mean children cannot have sugar orrefined carbohydrates. The main focus should be the total carbohydrate intakefrom day to day, rather than the source. Carbohydrate intake should be adjustedfor exercise level. A handy chart (Table 16.5) is found in The Pediatric Manual forClinical Dietetics, 2nd ed. (Nevin-Folino, 2003).
Fiber: 0.5 gm fiber/kg daily, for a maximum of 35 gm (Nevin-Folino, 2003).
There are unique challenges in caring for infants and children with diabetes. Theseinclude, but are not limited to, the various sizes of the patients, the stages of develop-ment, and medical issues (e.g. increased risk for hypoglycemia and diabetic ketoacido-sis, in comparison to adults). Goals for various age groups are shown below.
HbA1C BS goal BS goalAge level at bedtime before meals
<6 years old 7.5-8.5% 110-200 mg/dL 100-180 mg/dL6-12 years old ≤8% 100-180 mg/dL 90-180 mg/dL13-19 years old ≤7.5% 90-150 mg/dL 90-130 mg/dL
Source: Silverstein, et al., 2005.
Blood Glucose (BS) & HbA1C Goals
• Appetite• Food preferences• Cultural and ethnic traditions• Financial resources• Ability to learn management skills• Readiness for change
Factors That Influence Nutrition Management Goals

146Clinical Pediatric Nutrition
INFANTS
There is an increased risk for hypoglycemia in the first 12 months of life. Diabetesmanagement during his developmental period is also made more complex by frequentfeedings (i.e. every two to four hours). Care giver(s) often experience stress and anxietywhen providing diabetes management during this stage of the child’s life.
During infancy, a typical infant diet is appropriate. Either breast feeding or stan-dard infant formula is recommended for the first four to six months of life. Complemen-tary foods should be introduced as they would for any other infant. Carbohydratecounting should be initiated when carbohydrate-containing foods are added to theinfant’s diet, such as single-grain cereals and smooth puréed fruits (Nevin-Folino, 2003).
TODDLERS AND EARLY SCHOOL-AGE CHILDREN
As we all know, toddlers are unpredictable — they may eat only small amounts forseveral days, and then eat ravenously, with no plausible explanation. Children tend tobe very active during this developmental stage as well, which can complicate diabetesmanagement further.
Because bad behavior (e.g. tantrums) can be common, it may be difficult for caregiver(s) to distinguish symptoms of hyper- and hypoglycemia from normal toddlerbehavior. Children may take an interest in participating in their own care at this point,but usually they become bored and lose interest. The diabetes clinicians should continueto support the care giver(s) during this stage of development by explaining that this isnormal behavior for the child’s age, but care giver(s) should continue to encourage thechild’s involvement with diabetes care. Any level of participation by the child should besupervised by the care giver(s). When a child enters day care and/or preschool, it isessential that the individuals caring for the child be provided with the information andskills to provide safe and consistent care.
An appropriate diet during this age consists of three meals and two to three snacksdaily. Increased frequency of blood glucose monitoring is often necessary due to incon-sistent intake (Nevin-Folino, 2003). A unique aspect of diabetes management during thisdevelopmental phase is the use of post-meal dosing of rapid-acting insulin, rather thanadministering a pre-meal insulin injection. Rutledge, et al. described this treatmentapproach as safe and effective for toddlers with diabetes (Rutledge, et al., 1997).
SCHOOL-AGE CHILDREN
At this age, children should be encouraged to participate more in their daily diabe-tes management (i.e. giving insulin injections, performing basic carbohydrate counting).Care givers should continue to supervise and support the child’s self-management, andany decisions about diet and insulin that are non-routine should definitely be deter-mined by the care giver(s) and not the child. Care giver(s) should still be integrallyinvolved with routine care because too much autonomy for the child often results insub-optimal diabetes management.

147Clinical Pediatric Nutrition
Upon entering school, the insulin and diet pattern will need to be adjusted basedon the school’s schedule for classes, meals/snacks and recess. This period requires closecollaboration and planning between the child’s care giver(s) at home and the schoolpersonnel (e.g. teachers, school nurse). Care giver(s) should provide meal and snackalternatives if the options served at school are not preferred by the child, so that thechild does not skip meals and snacks. The child should always carry a source of fast-acting carbohydrate, in case of hypoglycemia (American Diabetes Association, 2001). Asnack may need to be added before recess, gym class, or after-school sports to preventhypoglycemia.
ADOLESCENTS
This is a difficult time — most adolescents are often pushing for increased indepen-dence, not just with their medical care but also with their social lives and school respon-sibilities. If the adolescent has developed the skills to perform routine diabetes manage-ment (which they should have by this age), the optimal scenario is for the care giver(s)and the patient to collaborate on all facets of diabetes management. If the adolescentmakes all of the diabetes management decisions independently, or if the care giver(s)and the adolescent have persistent conflict over medical decisions, generally the resultis poor glycemic control.
Special dietary concerns during this developmental phase include skipping meals,eating fast food often, choosing poor nutrient-dense foods more often, and fluctuatingappetite due to growth spurts (Nevin-Folino, 2003). Eating disorders have been noted inadolescents with type I diabetes — by not giving themselves insulin injections, they caninduce weight loss. This is a very dangerous practice and therefore weight trendsshould be monitored closely.
• When possible, follow the usual meal pattern
• If the usual meal pattern cannot be tolerated, replace each meal andsnack’s usual carbohydrate intake with an equal number of carbohy-drate grams from liquids or soft foods
• Eat small, frequent meals when ill
• If the child is nauseous and/or vomiting, aim for intake of 15 grams ofcarbohydrate every hour and encourage fluid intake.
• Increase frequency of blood glucose monitoring as necessary
• If blood glucose level is above 300 mg/dL, monitor urine for ketones
• Increased insulin doses may be needed if hyperglycemia is presentAdapted from: Nevin-Folino, 2003.
Sick Day Management

148Clinical Pediatric Nutrition
TYPE II DIABETES
It is no wonder that type II DM is on the rise given that it is strongly linked toobesity, and the prevalence of obesity is swiftly increasing for people of all ages andraces. Because there is not currently routine screening of type II DM in children andadolescents, it is difficult to precisely describe the incidence and prevalence of thisdisease in these populations. However, two surveys did take place between the years of1999 and 2006 which revealed a prevalence rate of type II DM between 0.04 and 0.15percent among adolescents (Duncan, 2006; Liese, et al., 2006).
It may be difficult for clinicians to differentiate type I DM from type II DM inchildren, given that some of the symptoms of type II DM are similar to type I DM —polyuria, polydipsia, and nocturia. However, weight loss is infrequently reported withtype II DM; children and adolescents with type II DM are typically overweight or obese.DKA can occur with type II DM; in fact, 5 to 25 percent of cases initially present thisway (Scott, 1997; Sapru, 2005).
Criteria for diagnosis of type II DM include:• Fasting plasma glucose exceeding 126 mg/dL on two occasions;• A non-fasting plasma glucose exceeding 200 mg/dL as well as symptoms of
hyperglycemia;• An oral glucose tolerance test with a plasma glucose exceeding 200 mg/dL.
If children are overweight or obese and have two or more of the following riskfactors, the American Academy of Pediatrics and the American Diabetes Associationrecommends screening children every two years, beginning at 10 years of age or at theonset of puberty, whichever comes first. The risk factors are: type II DM in a first- orsecond-degree relative; member of a high-risk ethnic group (listed below); or exhibitingsigns of insulin resistance (e.g. hypertension, dyslipidemia, acanthosis nigricans, andpolycystic ovary syndrome). Glycated hemoglobin (HbA1C) is currently not recom-mended for screening purposes.
• Obesity (i.e. BMI ≥95th percentile)• Family history (40-80% of children and adolescents affected have ≥1
affected parent)• Ethnicity (type II DM is more common in Native American, African
American, and Hispanic-American children as compared to the generalpopulation)
• Female gender (girls are 1.3 to 1.7 times more likely than boys todevelop type II DM during childhood)
• Conditions involving insulin resistance (puberty, polycystic ovarysyndrome)
Risk Factors for Developing Type II DM
149Clinical Pediatric Nutrition
TREATMENT
In treating type II DM, starting with one treatment approach and working uptoward the larger goals may provide patients with the success and encouragementnecessary to achieve adequate glycemic control and weight management. Examples ofappropriate strategies to implement initially include: reducing intake of high calorie/high carbohydrate beverages (e.g. soda), decreasing portion sizes, increasing activitylevel, decreasing time spent watching television or playing video games, and decreasingintake of fast foods.
If a child is not ill when diagnosed, type II DM can be managed with diet, exerciseand medication (Nevin-Folino, 2003). However, more research is needed on the safetyand efficacy of the use of oral medications in children with type II DM. The AmericanDiabetes Association has stated that the pathophysiology of type II DM is the same inchildren as it is in adults, and thus it concluded that “it is reasonable to assume thatsuch agents will be effective in children” (American Diabetes Association, 2000).
NUTRITION ASSESSMENT
Energy: Base caloric needs on child’s usual intake and growth. Provide adequatecalories to promote linear growth and sexual maturation while aiming for ahealthy weight (i.e. BMI for age). First evaluate usual intake, ideally by foodrecords but diet recall may suffice is need be. A reduction in caloric intake by 250to 500 kcal/day from the usual intake is appropriate (Nevin-Folino, 2003).
Protein: DRI for age should be adequate. Ten to 20 percent of calories from proteinis also appropriate.
Carbohydrate: Should comprise 50 to 60 percent of total daily caloric intake.Evenly distribute carbohydrate intake throughout the day. Encourage nutrient-dense carbohydrates, but that does not mean children cannot have sugar orrefined carbohydrates. The main focus should be the total carbohydrate intakefrom day to day, rather than the source.
Fiber: 0.5 gm fiber/kg, for a maximum of 35 gm/day (Nevin-Folino, 2003)
CONGENITAL HYPERINSULINISM
Congenital hyperinsulinism (HI) is a disorder in which there is an oversecretion ofinsulin by the beta cells of the pancreas, which results in profound hypoglycemia. HI isthe most common cause of hypoglycemia in infants less than 1 year of age. Excessiveinsulin levels prevent the body from the typical mechanisms used to prevent hypogly-cemia: gluconeogenesis, fatty acid oxidation and ketogenesis. There are many types ofcongenital HI, but the focus will be on only three types: transient, focal and diffuse.
Transient HI occurs in premature infants, primarily those who are SGA or whohave experiences fetal distress due to hypoxia (Stanley, 1997). The diffuse-type of HIusually effects LGA infants, but not always. In these cases, severe hypoglycemia typi-cally occurs on the first days of life.

150Clinical Pediatric Nutrition
Treatment options often include the following therapies: Octreotide (Sandostatin,®
Novartis Pharmaceuticals), continuous dextrose infusion, and ultimately ~97 to 98percent pancreatectomy.
Focal HI clinically presents similarly to the diffuse type. However, focal HI may becured if the focal lesion in the pancreas is removed. Treatments often utilized with thisdisease include the following: Octreotide, continuous dextrose infusion, and partialpancreatectomy.
Diagnosis of HI is typically defined as persistent hypoglycemia in the presence of:• Inappropriately elevated insulin levels and raised C-peptide levels• Low ketones and free fatty acid levels• Glycemic response to the administration of glucagon• Absence of ketonuria• Glucose infusion rate exceeding 6 to 8 mg/kg/min is required to maintain
euglycemia (Aynsley-Green, et al. 2000)
Steinkrauss, et al found that one third of children with congenital HI manifest someform of developmental delay (2005). Complications of HI can include:
• Permanent brain damage• Stroke• Seizures• Cerebral Palsy• Blindness• Diabetes• Reflux• Food malabsorption• Feeding difficulties
Possible nutrition implications of HI include:• Decreased caloric needs• Risk of excessive weight gain• Feeding difficulties• GE Reflux• Pancreatic insufficiency after surgery• Diabetes after pancreatectomy
In clinical practice, it has been noted that an infant with HI may need as little as 70to 80 kcal/kg to support optimal growth. However, because HI treatment often requiresthe use of high dextrose infusions (i.e. GIR >20 mg/kg/minute), it may be difficult toavoid providing excessive calories.

151Clinical Pediatric Nutrition
REFERENCES
American Diabetes Association. Consensus statement: type 2 diabetes in children and adolescents.Diabetes Care 23: 381-389, 2000.
American Diabetes Association. Position Statement: care of children with diabetes in the school anddaycare setting. Diabetes Care 24 (Suppl 1): S108-S112, 2001.
Aynsley-Green A, et al. Arch Dis Child Fetal Neonatal Ed. 82(2): F98-F107, Mar 2000.Duncan GE. Prevalence of diabetes and impaired fasting glucose levels among US adolescents: National
Health and Nutrition Examination Survey, 1999-2002. Arch Pediatr Adolec Med 160:523, 2006.Liese AD, D’Agostino RB, Hamman RF, et al. The burden of diabetes mellitus among US youth: preva-
lence estimates from the SEARCH for Diabetes in Youth Study. Pediatrics 118: 1510, 2006.National Center for Chronic Disease Prevention and Health Promotion. Diabetes Projects, Available at:
www.cdc.gov/diabetes/projects/cdc2.htm (Accessed December 15, 2008).Nevin-Folino N (Ed). Pediatric Manual of Clinical Dietetics, Second Edition. Chicago: American Dietetic
Association, 207-225, 2003.Rutledge KS, Chase HP, Klingensmith GL, et al. Effectiveness of postprandial Humalog in toddlers with
diabetes. Pediatrics 100:968-972, 1997.Sapru A, Gitelman SE, Bhatia S, et al. Prevalence and characteristics of type 2 diabetes mellitus in 9-18
year-old children with diabetic ketoacidosis. J Pediatr Endocrinol Metab 18: 865, 2005.Scott C, Smith JM, Cradock MM, Pihoker C. Characteristics of young-onset noninsulin-dependent
diabetes mellitus and insulin-dependent diabetes mellitus at diagnosis. Pediatrics 100: 84, 1997.Silverstein J, Klingensmith G, Copeland K, et al. Care of children and adolescents with type I diabetes: a
statement of the American Diabetes Association. Diabetes Care 28: 186, 2005.Stanley, CA. Hyperinsulinism in infants and children. Pediatr Clin North Am 44(2): 363-74, Apr 1997.Steinkrauss, L, et al. Effects of hypoglycemia on developmental outcome in children with congenital
hyperinsulinism. J Pediatr Nurs 20(2): 109-18, Apr 2005.

152Clinical Pediatric Nutrition
Notes

153Clinical Pediatric Nutrition
Chapter Thirteen:Allergies and Eosinophilic
Esophagitis/Eosinophilic Gastritis
It is estimated that 12 million Americans are affected by food allergies (FAAN,2008). Up to 6 percent of children under age 3 are affected by food allergies (Shuker andGroetch, 2008). Twenty five percent of infants born to families with a history of atopicdisease will develop food allergy by the age of 7 (Greer, et al., 2008).
Often, the terms "food allergy" and "food intolerance" are used interchangeably, butthey have significantly different meanings.
A food intolerance is an adverse food-induced reaction that does not involve theimmune system. Lactose intolerance is one example of a food intolerance. A food intol-erance does not produce symptoms that are life-threatening, such as some severe foodallergies. Many people report food intolerance to dyes, preservatives, MSG and others.Avoidance is the only treatment.
Food allergies involve the immune response to an allergen. With food allergies, theimmune system fails to develop tolerance to food protein(s) — proteins which arenormally perceived as harmless. In essence, the body is overreacting to certain foodprotein(s), and perceives them as an antigen, or dangerous foreign intruder. The im-mune system responds to an invading antigen by creating an antigen-specific antibody,Immunoglobulin E (IgE). On a second exposure to the antigen, the IgE binds to theantigen, activating a cascade of events including release of histamine and other sub-stances which cause symptoms of an allergic reaction (Shuker and Groetch, 2008). Theseare called "IgE-mediated allergies.
A second way that the immune system may respond to an antigen is by the releaseof T-cells, which are a catalyst for the release of eosiniphils, a type of white blood cell(i.e. leukocyte). This causes "non-IgE-mediated" allergic reactions.
The gastrointestinal tract (GI) normally has the most eosinophils in our body.Eosinophils normally work to protect the body by attacking and killing bacteria and

154Clinical Pediatric Nutrition
other microorganisms (e.g. parasites). In the case of eosinophilic esophagitis and gastri-tis, eosinophils go to those sites and accumulate in response to what they perceive as anantigen. The accumulation of too many eosinophils in an area of the body results insymptoms, such as reflux, dysphagia, vomiting and diarrhea (American Partnership forEosiniphilic Disorders).
The chart below lists characteristics of each type of allergy.
Timing ofsymptoms
Diagnosis
Treatment
Comparison of Allergies
IgE mediated allergies
Quick onset in minutes, or up to2 hours
Detailed diet history
Detailed medical history
Allergist should carefully choosewhich foods to test—avoidscreening for a “panel” of foods
No test can guarantee that apositive result equates to asignificant allergy
No test can predict the severityof a food allergic reaction
May need to use several tests todecide which foods to eliminate(e.g. skin prick tests, CAP RAST)
Eliminate implicated foods andmonitor
If reactions continue to occur,initiate a strict elimination dietand reintroduce foods one at atime, monitoring closely forrecurrence of symptoms*
Treat if there is a reaction(emergency kit containingepinephrine)
Non-IgE mediated allergies
Delayed onset (several hours to days), withthe exception of food protein-inducedenterocolitis syndrome (1 to 3 hours)
Detailed diet history
Detailed medical history
Endoscopy and biopsy of esophagus,stomach and duodenum
May need to use several tests to decidewhich foods to eliminate (e.g. skin prick,atopy patch testing)
To confirm allergy to an implicated food,follow an elimination diet for 3-4 weeksand re-challenge with the one food; itusually takes ≥ 1 week for symptoms torecur
Food allergy is implicated in most cases—symptoms resolve and repeat biopsies arenormal once food (antigen) is removedfrom the diet
If skin prick and atopy patch testing doesnot reveal the offending food, a selectiveelimination diet (or a strict elimination dietin more severe cases) is warranted
* Strict elimination diet generally includes: 1 meat (chicken or turkey), 1 starch (rice or potato), 1 vegetable, 1 fruit(apple); supplement with amino-acid based formula if needed

155Clinical Pediatric Nutrition
SYMPTOMS
Food allergies can cause symptoms ranging from mild to severe. Examples ofrespiratory symptoms include acute rhinoconjunctivitis, bronchospasm and asthma.Symptoms involving the skin may include urticaria (i.e. hives), angioedema, and atopicdermatitis. GI symptoms can include pollen food allergy syndrome, GI anaphylaxis,food protein-induced enterocolitis or prococolitis syndrome, and eosinophilic esophagi-tis/eosinophilic gastritis. The cardiovascular system may exhibit reactions to foodprotein(s) as hypotension or cardiac dysrhyhmias.
Some reactions are immediate after ingestion of the antigen; others are delayed.
DIAGNOSIS
Tests for diagnosing true food allergies are listed below.
Skin Prick Test Description: a diluted extract of the suspected food is put on the skinand then the skin is scratched with a needle
Interpretation of results: after 15 minutes each skin prick is reviewed,and the result is positive if a raised area/hive is present and ≥3 mmlarger than the control (e.g. saline)*
A negative test definitively confirms the absence of an IgE-mediatedfood allergy
Serum Tests Examples include: radioallergosorbent (RAST) and quantitativemeasurements of food-specific IgE antibodies (CAP RAST or CAPSystem FEIA)
Diagnostic levels of food-specific IgE for various foods have beenreported (Sampson HA, 2001)*
It is not recommended to perform a large panel of foods, as resultscan be difficult to interpret. Food should be chosen based on infor-mation obtained thorough diet and medical history.
Atopy Patch Testing Useful in identifying potential non-IgE-mediated food allergies
Method: fresh foods are prepared (semi-liquid pudding consistency)and put into aluminum chambers and placed on a person’s back for48 hours; the patch is removed, then 24 more hours go by before thetest is read; interpretation is based on redness and swelling
Drawbacks: All methodology is consistent between medical centersexcept the reagents used—this can potentially cause conflictingresults for the same foods at different centers
*Positive skin prick/RAST tests for food predict a positive challenge in 40 to 50 percent of cases (Justinich, 2005)
Types of Food Allergy Testing
156Clinical Pediatric Nutrition
WEANING/COMPLEMENTARY FOODS
There has been an ongoing debate about whether the timing of the introduction ofcomplementary foods in infancy affects the incidence of food allergies. A recent studyconcluded that there is no evidence to recommend delayed introduction of solidsbeyond 4 to 6 months (Zutavern, et al., 2008). Delayed introduction does not preventasthma, allergic rhinitis, or food sensitization. The subjects were studies until age 6.Greer, et al, stated that it was not possible to make decisive conclusions about the role ofbreastfeeding in either preventing or delaying the onset of specific foods allergies(Greer, et al., 2008). However, they also reported the following in their article:
• Exclusive breast-feeding of the high-risk infant for at least four months, com-pared to feeding intact cow milk-protein-based formula, decreases the incidenceof atopic dermatitis and milk allergy during the first two years of life.
• Use of soy-based formula does not prevent allergies.• Maternal dietary restrictions during pregnancy or lactation do not play a signifi-
cant role in preventing atopic disease in infants.
TREATMENT
There are no medications available to cure food allergies; avoidance of the aller-genic food(s) is the only way to prevent a reaction. Many children outgrow their foodallergies; however, peanut, tree nuts, fish, and shellfish have a strong likelihood of beinglifelong allergies. Compliance and accuracy with a restricted diet can often be quitechallenging. In addition, the more foods that are eliminated based on their propensityfor allergies, the more difficult it becomes to provide a healthy, well-balanced diet.
Labeling requirements make identifying allergens easier. In January 2006 the FoodAllergy Labeling and Consumer Protection Act (FALCPA) became effective. This lawmandates that manufacturers list ingredients derived from commonly allergenic foodson all product packaging.
There are eight major food allergens: milk, egg, soybean, wheat, peanut, tree nut,fish and crustacean shellfish. The information may be listed by using any (at least onemust be used) of these methods:
• list the food in the ingredient list;• identify the allergen after the ingredient [e.g. farina (wheat)]; or• make a “contains” statement below the ingredients list (e.g. "This product con-
tains milk, soy and wheat").
Milk and wheat protein are the most difficult allergens to avoid because there areso many foods that contain one or both of these. These items are also quite nutrient-dense and one must ensure that equivalent foods are provided to prevent low intake ofnutrients. For instance, milk is an important source of calcium, vitamin D and vitaminB12.

157Clinical Pediatric Nutrition
Enriched soy milk is an appropriate substitution; however, some children haveallergies to both milk and soy. In these cases, the most appropriate treatment is provi-sion of a complete milk-free and soy-free formula to ensure adequate calorie, protein,vitamin and mineral intake. Rice milk is a source of calcium and vitamin D, but it islacking in protein and fat.
In cases that warrant a strict elimination diet, it is often necessary to supplementwith hypoallergenic formula or a multi-vitamin with minerals. When wheat-containingproducts are avoided, it is essential to find alternative sources of vitamins and minerals,such as fortified cereals. Resources for food allergy products and are listed below.
Allergen Vitamins and Minerals
Milk Vitamin A, vitamin D, riboflavin, pantothenic acid, vitamin B12,calcium, and phosphorus
Egg Vitamin B12, riboflavin, pantothenic acid, biotin, and selenium
Soy Thiamin, riboflavin, pyridoxine, folate, calcium, phosphorus,magnesium, iron, and zinc
Wheat Thiamin, riboflavin, niacin, iron, and folate (if fortified)
Peanut Vitamin E, niacin, magnesium, manganese, and chromium
Source: Mofidi, 2005.
Nutrients Provided by Common Food Allergens
Companies Specializing in Hypoallergenic Food
Roads End Organicwww.chreese.com
The Gluten-Free Pantrywww.glutenfree.com
Tofuttiwww.tofutti.com
U.S. Mills Inc.www.usmillsinc.com
Wellshire Farmswww.wellshire.com
Eden Foodswww.edenfoods.com
Ener-G-Foodswww.energfoods.com
Enjoy Life Foodswww.enjoylifefoods.com
Namaste Foodswww.namastefoods.com

158Clinical Pediatric Nutrition
Additional resources:Food Allergy and Anaphylaxis Networkwww.foodallergy.orgAn excellent resource for education materials and updates on current research.
American Partnership for Eosinophilic Disorderswww.apfed.org
Food Allergy Research and Resource Programwww.foodsci.uni.edu
American and Allergy Foundation of Americawww.aafa.org
American Academy of Allergy, Asthma, and Immunologywww.aaaai.orgPatient information and physician referral line: 800/822-2762
Food Allergy Kitchenwww.foodallergykitchen.com
Freeda Vitaminswww.freedavitamins.com
Kirkman Labswww.kirkmanlabs.com
Kids with Food Allergies: Food Allergy Supportwww.kidswithfoodallergies.com
Authentic Foodswww.authenticfoods.com
Barbara’s Bakerywww.barbarasbakery.com
Bob’s Red Millwww.bobsredmill.com
Breads From Annawww.glutenevolution.com
Cherrybrook Kitchenwww.cherrybrookkitchen.com
AllerEnergywww.allerenerg.com
Allergy Grocerwww.allergygrocer.com
Amy’s Kitchenwww.amys.com
Arrowhead Millswww.arrowheadmills.com
Aunt Candicewww.auntcandicefoods.com
Companies Specializing in Allergen-restricted Diets

159Clinical Pediatric Nutrition
REFERENCES
American Partnership for Eosiniphilic Disorders. www.apfed.org accessed 11/10/08.Greer FR, Sicherer SH, Burks AW, and the Committee on Nutrition and Section on Allergy and Immunol-
ogy 121(1): 183-191, 2008.Justinich CJ. IgE and Non-IgE Gastorointestinal Food Allergy. Clinical Nutrition Week: A Scientific and
Clinical Forum and Exposition, 2005.Mofidi S. Food allergies in the pediatric patient- Nutritional management. Clinical Nutrition Week: A
Scientific and Clinical Forum and Exposition, 2005.Sampson HA. Utility of food-specific IgE concentrations in predicting symptomatic food allergy. J Allergy
Clin Immunol 107: 891-896, 2001.Shuker M and Groetch. In: Pediatric Manual of Clinical Dietetics, 2nd ed. Amorde-Spalding K, Nieman L,
Eds. Chicago: American Dietetic Association, 2008.The Food Allergy and Anaphylaxis Network. www.foodallergy.org accessed 11/10/08.Zutavern A, Brockow I, Schaff B, et al. Timing of Solid Food Introduction in Relation to Eczema, Asthma,
Allergic Rhinitis, and Food and Inhalant Sensitization at the Age of 6 Years: Results from theProspective Birth Cohort Study LISA. Pediatrics 121: e44-e52, 2008.

160Clinical Pediatric Nutrition
Notes

161Clinical Pediatric Nutrition
Chapter Fourteen:Enteral Nutrition
(Tube Feeding, TF)
If an infant or child is unable to consume adequate calories and protein orally,supplemental or exclusive nutrition support is warranted to support optimal growthand development. Options for supplemental nutrient provision include enteral orparenteral nutrition support (EN or PN). Enteral nutrition is the preferred method ofnutrition support, presuming that it is safe to utilize the gastrointestinal (GI) tract.
ENTERAL NUTRITION SUPPORT
The following are the advantages of EN over parenteral nutrition support: lowercosts, reduced infectious complications, reduction in bacterial translocation via mainte-nance of gut integrity, and decreased incidence of cholestasis.
INDICATIONS
Often, nasogastric feedings are necessary for premature infants due to their lack ofcoordination of the suck/swallow/breathe pattern. (See Chapter Seven for an in depthdiscussion of nutrition support for premature infants.)
Long-term EN is often indicated for children with severe neurological impairment,including cerebral palsy, anoxic brain injury, Down syndrome, or severe seizure disor-ders (Axelrod, 2006).
If a child is not consuming adequate nutrients orally, the first course of action is toinitiate high-calorie oral supplements and other calorie-boosting strategies. If thesetreatments fail and any of thefollowing factors are present, EN should be considered(Axelrod, 2006):

162Clinical Pediatric Nutrition
• Inability to consume at least 75 to 80 percent of estimated energy needs by mouth• Total feeding time exceeds four hours per day• One month duration of inadequate growth or weight gain less than expected
velocity-for-age (for children under the age of two)• Weight loss or no weight gain for 3 months (for children over the age of two)• A decrease of two growth channels for weight-for-age or weight-for-length on
the Centers for Disease Control growth chart• Tricep skinfold persistently less than 5th%ile for age
Moreover, EN is indicated for the following conditions: congenital heart disease,chronic lung disease/cystic fibrosis, renal disease, inborn errors of metabolism, andinflammatory bowel disease. Conditions that are associated with higher metabolic ratesmay necessitate full or supplemental EN. These conditions include burns, severe sepsis,advanced human immunodeficiency virus (HIV), cystic fibrosis with pancreatic insuffi-ciency, and cancer in its advanced stages.
ACCESS
To administer EN, access to either the stomach or small bowel is needed. Wheninitiating EN, these are factors in chosing the type of access:
• How long will the EN be needed?• Are there anatomic abnormalities that preclude access to either the stomach or
the small bowel?• Are there co-existing gastrointestinal (GI) disorders that will impact the tolerance
of the EN (e.g. GER)?
• Anorexia/weight loss• Growth failure• Intubation• Hypermetabolic states such as
burns, sepsis, and trauma• Neurologic disease or impairment
such as difficulty sucking or swal-lowing, or risk for aspiration
• Long-term coma
Indications for Pediatric Tube Feedings
• Congenital anomalies (such as cleftpalate, esophageal atresia, ortracheo-esophageal fistula)
• Esophageal injury or obstruction• Short bowel syndrome• Cystic fibrosis with pancreatic
insufficiency• Advanced AIDS• Malignant cancer
Source: Nevin-Foline, 2005.

163Clinical Pediatric Nutrition
There are numerous access options, none unique to childhood in comparison toadults. For temporary access, one may consider a nasogastric, nasoduodenal, ornasojejunal tube. Long-term access options include gastrostomy (PEG or surgical) andjejunostomy (surgical). Something unique to infants and children is the use of soft,small-bore tubes for nasal feedings (5, 6, or 8 French). When patients require EN formore than four weeks they are eligible for placement of a long-term feeding tube (surgi-cally, endoscopically, or radiologically placed).
INITIATION AND ADVANCEMENT OF TUBE FEEDINGS
There are a few decisions to make prior to initiating EN:• Continuous or bolus (intermittent) feedings?• What volume should feeds start at?• Is breast milk available? If not, what formula should be used?
Advantages of continuous feeds are: minimal gastric distention (and thus minimaladverse effects on pulmonary functions) — they minimize “abdominal competition”;improved tolerance in patients with apnea and bradycardia; and increased nutrientabsorption with GI disease.
Advantages of bolus (intermittent) feeds include the following: ease administra-tion; ease of monitoring gastric residuals; optimal nutrient delivery due to enhancementof gut hormone surges; and ease of transition to oral feedings.
The initial feeding volume is dependent upon the infant or child’s age and clinicalpresentation. This table is a general guideline to initiating and advancing enteralfeedings in healthy infants and children.
Initial Advance By GoalContinuous 0-1 yr 1-2 ml/kg/h 1-2 ml/kg/h q 2-8 h 6 ml/kg/h 1-6 yr 1 ml/kg/h 1 ml/kg/h q 2-8 h 4-5 ml/kg/h >6 yr 25 ml/hour 25 ml q 2-8 h 100-150 ml/hBolus 0-1 yr 10-60 ml q 2-3 h 10-60 ml/feed 90-180 ml q 4-5 h 1-6 yr 30-90 ml q 2-3 h 30-90 ml/feed 150-300 ml q 4-5 h >6 yr 60-120 ml q 2-3 h 60-90 ml/feed 220-480 ml q 4-5 hCyclic 0-1 yr 1-2 ml/kg/h 1-2 ml/kg q 2 h 60-90 ml/hr; 12-18 h/d 1-6 yr 1 ml/kg/h 1 ml/kg q 2 h 75-125 ml/hr; 8-16 h/d >6 yr 25 ml/ h 25 ml/h q 2 h 100-175 ml/hr; 8-16 h/d
Enteral Feeding Guidelines

164Clinical Pediatric Nutrition
The following guidelines apply• Decrease caloric intake by 25 percent for transition to oral diet (cycle TF if not
already doing so).• Initiate with isotonic formula; advance rate first, caloric concentration second.• Depending on the volume of formula delivered with enteral feeding, additional
fluid flushes may be required to meet hydration needs.• Most enteral formulas for children 1 to 10 years old, require that approximately
1000ml are delivered in order to meet 100 percent of the RDAs for vitamins andminerals. Children receiving less than this volume may require vitamin/mineralsupplementation to meet nutrient needs.
MONITORING TOLERANCE
When monitoring the tolerance of EN in infants and children, the practice variesfrom hospital to hospital and from clinician to clinician. However, generally the param-eters considered include gastric residual volume; presence of vomiting, reflux, or aspira-tion; stool consistency and volume; respiratory function; and growth (Weckwerth, 2004).Mechanically-focused parameters are particularly important when a patient receivesoutpatient EN, and these include: tube position, tube site, equipment use, and formulapreparation.
Gastric residuals should only be checked for patients with feeding tubes terminat-ing in the stomach. There is no clear definition of an “excessive” gastric residual volume(Weckworth, 2004). Consensus is also lacking regarding whether the gastric residualshould be returned to the stomach.
Average Stomach Capacity of Full Term Infant
Day of life (DOL) Stomach capacity (ml)
1 72 133 274 465 576 647 688 719 76
10 81

165Clinical Pediatric Nutrition
Regurgitation of feedings can be benign and may not indicate feeding intolerance.In children, there are many causes for reflux or vomiting when receiving EN, includingthe following: rapid administration of feeding, delayed gastric emptying, partial gas-trointestinal obstruction, tube migration into the esophagus or gastric antrum, behav-ioral issues, or intolerance to a component in the feeding.
It is also important to monitor for any signs or symptoms of aspiration, althoughan optimal method to determine aspiration has not been identified. The use of blue dyewas found to be unreliable and unsafe (Gaur, et al., 2003). Glucose oxidase strips have alow specificity and can be falsely positive if hyperglycemia is present (Weckworth,2004).
Aspiration can be minimized by administering EN to the small bowel, by decreas-ing sedatives and narcotics, by elevating the head of the bed or using a reverseTrandelenberg position, by using continuous feedings rather than bolus, and by use ofprokinetic agents (e.g. Reglan®).
Many clinicians also assess patients for abdominal distention, which is a very non-specific indicator of enteral feeding tolerance. Serial measures of abdominal girth is oneobjective tool to measure abdominal distention, and is often used with infants. The useof abdominal distention for evaluating feeding tolerance most likely stems from the fact
Children
Premature Infants
Gastric Residual Monitoring
Continuous gastricfeedings
Check residuals every4 hours
Hold feeding if theresidual is ≥the hourlyrate
Intermittent gastricfeedings
Check residuals prior to each feeding
Hold the feeding if the residual is >50percent of the prior feeding volume
If residual volume is <50 percent of aprevious bolus feed, refeed the aspirate
If >50 percent or >1 mL, discard theaspirate and perform clinical assess-ment of abdomen
If abdominal assessment is benign,wait until next scheduled feeding andre-assess
If residual contains bile or blood, holdfeedings; an urgent physician assess-ment is warranted
Source: Weckworth, 2004.

166Clinical Pediatric Nutrition
that the classic indicators of necrotizing enterocolitis include abdominal distention, aswell as pneumatosis intestinalis on x-ray, bloody stools, or increased gastric residuals(Weckwerth, 2004). Stool output is also used in monitoring feeding tolerance. Diarrheacan be one of the more immediate and obvious signs of feeding intolerance; however,diarrhea can be a result of factors other than feeding.
• Malabsorption conditions (mucosalatrophy, short bowel syndrome)
• Bacterial overgrowth• Substrate intolerance• Fecal impaction with overflow
diarrhea
Non-Nutritional Causes of Diarrhea
• Antibiotics• Sorbitol-containing medications• Infection• Improper feeding tube placement• Hyperosmolar formula• Excessive infusion rate
Enteral Nutrition Case Study
continued on following page
15-month-old male presented to his pediatrician with persistent failure to thrive,diarrhea and emesis. He was 40-week gestation at birth (full-term). He wastransferred from the pediatrician's office to the emergency department.
Diet history:• Exclusively breastfed until 6 months of age. At 1 month, he developed blood
stools, it was presumed that he had cow's milk protein allergy (CMP). Momwas advised to avoid dairy in her diet — she chose to use rice-based productsrather than soy due to taste preference. This change in mom's diet supportedresolution of the infant's GI symptoms.
• At 6 months of age, mom reports a normal/healthy introduction of complemen-tary foods (with avoidance of dairy products). Mom reports the only liquid hedrank was breastmilk.
• Mom started weaning breastfeeding approximately two weeks ago and has beensupplementing with Good Start 2 Supreme Soy based on the pediatrician'srecommendations due to history of poor weight gain. He developed emesis onthe same day that formula was started.
Anthropometrics:Birth weight: 3.2 kg (Appropriate for gestational age)
Weight: 8.6 kg (≤5th percentile on CDC growth chart)Length: 77 cm (25th percentile on CDC growth chart)
Head circumference: 46 cm (10-25th percentile on CDC growth chart)IBW for height: 10.6 kg
% IBW: 81%

167Clinical Pediatric Nutrition
REFERENCES
Axelrod D, Kazmerski K, Iyer K. Pediatric enteral nutrition. JPEN 30(1): S21-S26, 2006.Gaur S, Sorg T, Shukia V. Systemic absorption of FD&C blue dye associated with patient mortality.
Postgraduate Medical Journal 79: 602-603, 2003.Nevin-Foline N. Pediatric Manual of Clinical Dietetics. American Dietetic Association, 2005.Weckwroth JA. Monitoring enteral nutrition support tolerance in infants and children. NCP 19(5): 496-
503, 2004.
Estimated nutrient needs:Kcal = 125 kcal/kg/day [1075 kcal/day]
10.6 kg (this is IBW) x 102 kcal/kg (this is RDA for age)8.6 kg
Protein = 1.5 gm/kg/day [12.9 gm protein/day]10.6 kg (this is IBW) x 1.2 gm protein/kg (this is RDA for age)
8.6 kg
Upon admission, GI is suspicious that this child has a CMP and soy allergy. Dietrecall reveals that he was consuming 400 calories per day from solid foods. Thegoal is to make up the difference of 675 kcal per day to support catch-upgrowth. The team decided to trial Elecare 30 cal/oz supplemental NGT feedings(the patient refuses to drink his formula).
Plan:1) Initiate nocturnal cyclic tube feedings at 9 mL/hour (1 ml/kg/hour), to run for
10 hours each night (8 pm to 6 am)2) The tube feedings are advanced by 1 ml/kg (9 mL) every 2 hours to a goal of
68 mL/hour for 10 hours each night (8 pm to 6 am), which provides 680 kcaland 20.4 gm protein daily.
Enteral Nutrition Case Study (continued)

168Clinical Pediatric Nutrition
Notes

169Clinical Pediatric Nutrition
Chapter Fifteen:Parenteral Nutrition
INDICATIONS
Parenteral nutrition (PN) should be initiated immediately for medical conditionswhere enteral feedings are contraindicated until the medical situation allows for safeinitiation of enteral feedings. The majority of cases in neonates requiring PN support aredue to either gastrointestinal (GI) malformations or necrotizing enterocolitis (NEC).
GI malformations include omphalecele, gastroschisis, intestinal atresia, volvulus,and Hirschsprung’s disease. GI malformations and NEC may require surgery that canlead to short bowel syndrome (SBS), also known as short gut syndrome. SBS is theprimary cause for long-term PN support. (Please refer to Chapter Ten for an in depthdiscussion of SBS.)
Infants with a diaphragmatic hernia often require PN until surgical repair of thehernia occurs, and the stomach and/or intestines are returned to a more anatomicallycorrect place in the abdominal cavity and are functioning (e.g. stooling).
Anorexia nervosa <65% IBW and history of treatmentfailures
Chylothorax or chylous ascites Requiring bowel rest >1 week
Chronic intractable diarrhea Dehydration and electrolyte depletionor vomiting
GI dysfunction Inflammatory bowel disease (Crohn's,ulcerative colitis), villous atrophy
Hypermetabolic states where Cancer with radiation enteritis, trauma,enteral nutrition is tolerated burns
Indications for Pediatric Parenteral Nutrition Support

170Clinical Pediatric Nutrition
Other medical conditions that may warrant the use of PN support include thefollowing: intractable, nonspecific diarrhea; extra corporeal membrane oxygenation(ECMO); congenital diaphragmatic hernia; and vasopressor support (e.g. dopamine,dobutamine).
ECMO and vasopressor support may not be absolute contraindications to enteralfeedings; however, many neonatologists are hesitant to enterally feed infants andchildren with hemodynamic instability due to risk of bowel ischemia. Concerns aboutNEC and the possible effect of hypoxia on the gut during ECMO have led to the use ofPN as the main source of nutritional support in pediatrics.
However, a study was done in which infant subjects on ECMO received full-strength, continuous enteral feedings administered via either nasogastric or post-pyloricfeeding tubes (Pettignano, et al., 1998). There were no documented cases of NEC orintestinal perforation. Although the parenteral group achieved goal calories first (3.07plus or minus 2.1 days for PN; 4.25 plus or minus 2.6 days for enteral), the benefits ofenteral nutrition far outweigh the risks of PN. Pettignano, et al. concluded that vasoac-tive support is not considered to be a contraindication to enteral feeding.
(Appendix #15 shows criteria and recommendations for initiation and advance-ment of pediatric PN.)
If you are unable to feed an infant or child enterally, when should you start PN(Nevin-Folino, 2003)?
• Term infants within 3 to 5 days• Children with GI dysfunction in ≥3 days• Children with baseline malnutrition in ≤3 days
ACCESS FOR ADMINISTERING PNPN can be administered through a peripheral vein, as peripheral parenteral nutri-
tion (PPN). PPN requires a relatively large volume to allow for adequate administrationof nutrients. In the critically ill infant or child, nutrient requirements often cannot bemet with PPN due to fluid restriction. It is recommended to limit dextrose concentrationto 10 to 12.5 percent with a final osmolality of 900 mOsm/kg to minimize risk of phlebi-tis and infiltration (Committee on Nutrition, 1983).
• Unstable fluid and electrolyte status
• Unstable metabolic acidosis or alkalosis
• Functional GI tract
• Aggressive nutrition interventions are not warranteddue to poor prognosis/comfort measures only
Contraindications to Administering Parenteral Nutrition

171Clinical Pediatric Nutrition
Total parenteral nutrition (TPN) requires central vein access and allows for adminis-tration of a solution with a high osmolality (i.e. >900 mOsm/kg). Venous access is notdefined by the initial point of entry, but by the position of the catheter tip. With centrallines (CVL), the catheter tip terminates in the superior vena cava (SVC) or the rightatrium of the heart. Examples of CVL that are found in infants include umbilical venouscatheters (UVC), non-tunneled lines, and tunneled lines. UVC are generally placed afterbirth and are removed within two weeks due to increased risk of infection (Pereira, 1995).
Non-tunneled lines include femoral, jugular, subclavian and peripherally/percuta-neously inserted central catheters (PICC). PICC lines are generally placed when a long-term intravenous (IV) access is needed, and duration may vary from several days tomonths. PICC lines may be central or peripheral, depending on the placement of thecatheter tip. If the PICC line terminates in the SVC it is considered central, and termina-tion in other vessels needs to be individually evaluated as to determine the maximumdextrose concentration that can be safely infused.
A Broviac line is the tunneled line typically used in pediatric patients, comparableto a Groshong or Hickman in adults. Broviac lines are often placed when an infant isexpected to be discharged on home PN support, as with SBS patients. X-ray confirma-tion of central line placement is essential prior to administration of a solution with ahigh osmolality. Dextrose concentration of PN solution administered via a central line isgenerally limited to a maximum of 25 to 30 percent.
MACRONUTRIENTS
Parenterally, carbohydrates are administered in the form of dextrose, which pro-vides 3.4 kcal per gram. Protein is administered as a crystalline amino acid solution,which provides 4 kcal/gm. Specialized amino acid solutions are available for infantsand include TrophAmine® 6 percent and 10 percent (B.Braun), Premasol® 6 percent and10 percent (Baxter Healthcare), and Aminosyn-PF® 7 percent (Hospira).
These specialized solutions contain high concentrations of essential amino acids,including histadine and tyrosine; low concentrations of phenylalanine, methionine, andglycine; as well as glutamic acid, aspartic acid, taurine, and N-acetyl-L-tyrosine. Theamino acid solutions for infants are designed to replicate plasma amino acids in breast-fed infants. They also have a lower pH, which allows higher levels of calcium andphosphate to be added to the solution.
See Appendix #16 for a chart comparing various pediatric AA solutions.Using a more-concentrated amino acid solution allows for a smaller volume of this
solution, which then allows for a greater volume of other solutions (i.e., dextrose orlipids), as well as electrolytes, minerals, trace elements, vitamins, and lipids.
Using a less-concentrated amino acid solution may sometimes be necessary be-cause of the difficulty in measuring extremely small volumes of the more concentratedsolutions. When an infant or child is severely fluid-restricted, it may be difficult to meetthe estimated nutrient needs via PN due to the lack of a concentrated infant amino acidsolution (i.e. 15 percent).
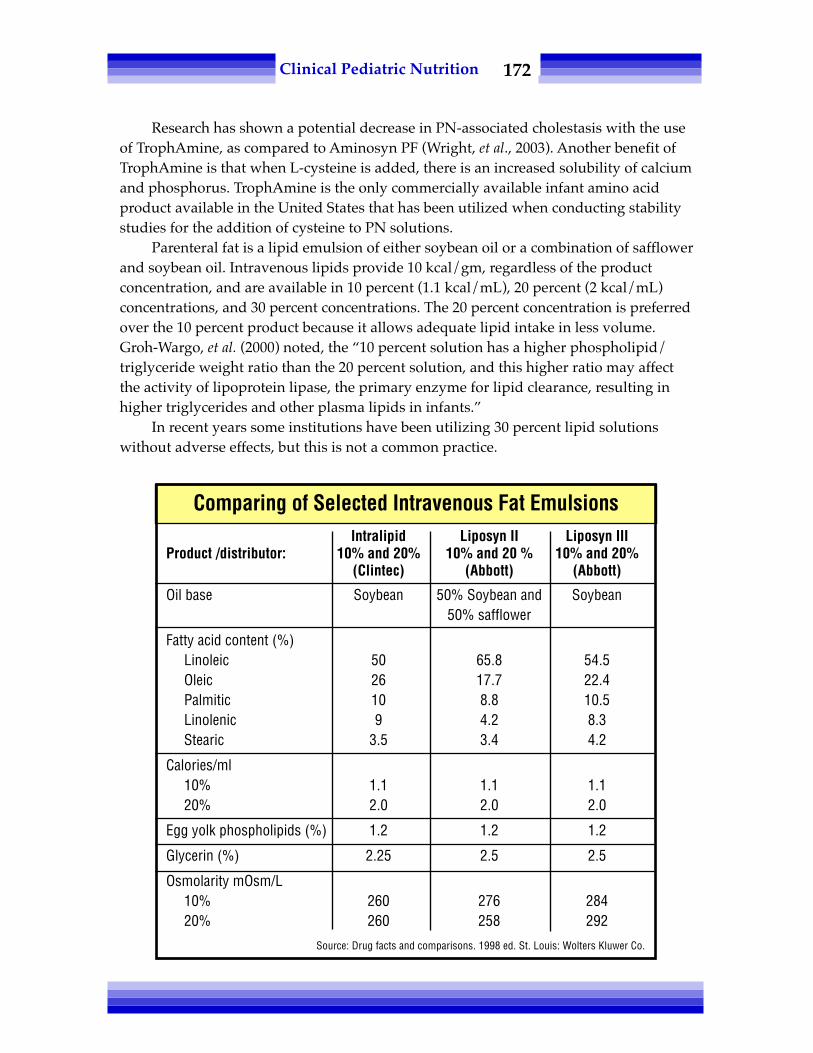
172Clinical Pediatric Nutrition
Research has shown a potential decrease in PN-associated cholestasis with the useof TrophAmine, as compared to Aminosyn PF (Wright, et al., 2003). Another benefit ofTrophAmine is that when L-cysteine is added, there is an increased solubility of calciumand phosphorus. TrophAmine is the only commercially available infant amino acidproduct available in the United States that has been utilized when conducting stabilitystudies for the addition of cysteine to PN solutions.
Parenteral fat is a lipid emulsion of either soybean oil or a combination of safflowerand soybean oil. Intravenous lipids provide 10 kcal/gm, regardless of the productconcentration, and are available in 10 percent (1.1 kcal/mL), 20 percent (2 kcal/mL)concentrations, and 30 percent concentrations. The 20 percent concentration is preferredover the 10 percent product because it allows adequate lipid intake in less volume.Groh-Wargo, et al. (2000) noted, the “10 percent solution has a higher phospholipid/triglyceride weight ratio than the 20 percent solution, and this higher ratio may affectthe activity of lipoprotein lipase, the primary enzyme for lipid clearance, resulting inhigher triglycerides and other plasma lipids in infants.”
In recent years some institutions have been utilizing 30 percent lipid solutionswithout adverse effects, but this is not a common practice.
Comparing of Selected Intravenous Fat EmulsionsIntralipid Liposyn II Liposyn III
Product /distributor: 10% and 20% 10% and 20 % 10% and 20%(Clintec) (Abbott) (Abbott)
Oil base Soybean 50% Soybean and Soybean50% safflower
Fatty acid content (%)Linoleic 50 65.8 54.5Oleic 26 17.7 22.4Palmitic 10 8.8 10.5Linolenic 9 4.2 8.3Stearic 3.5 3.4 4.2
Calories/ml10% 1.1 1.1 1.120% 2.0 2.0 2.0
Egg yolk phospholipids (%) 1.2 1.2 1.2
Glycerin (%) 2.25 2.5 2.5
Osmolarity mOsm/L10% 260 276 28420% 260 258 292
Source: Drug facts and comparisons. 1998 ed. St. Louis: Wolters Kluwer Co.

173Clinical Pediatric Nutrition
Not only are lipids a concentrated source of calories, but they also provide essentialfatty acids (EFA) for cell membrane integrity and brain development. Lipids also help toprolong the integrity of peripheral lines because of their lower osmolality. It is crucial toprovide a minimum of 0.5 to 1.0 gm lipids/kg/day to prevent EFA deficiency. EFAdeficiency was historically defined as a triene-to-tetraene ratio equal to or greater than0.4 (Kerner, 1996); however, Mayo Clinical Laboratories recently developed a new set ofstandards for assessing the triene-to-tetraene ratio for various age groups, but this isonly applicable if the test is run by their lab.
ELECTROLYTES
Close monitoring of electrolyte status is essential. The addition of electrolytes toPN may be deferred until the second day of life in some cases. Potassium is generallyadded once normal kidney status and good urine output are established, and sodium isoften added once diuresis begins (Groh-Wargo, et al., 2000). Daily adjustments to elec-trolyte intake are often necessary. Electrolyte requirements of preterm and full-terminfants are generally similar, with the exception of calcium and phosphorus.
Initiate dose at low end of range and increase on a case by case basis. Specific clinicalsituations may require doses outside of these ranges.
Parenteral Nutrition Dosing Guidelines
Infant Infant/child Adolescent/Adult0-5 kg 5-20 kg 20-40 kg >40 kg
Sodium 2-5 mEq/kg 2-6 mEq/kg 2-3 mEq/kg 80-150 mEq/dayPotassium 2-4 mEq/kg 2-3 mEq/kg 1.5-2.5 mEq/kg 40-60 mEq/dayChloride 2-5 mEq/kg 2-5 mEq/kg 2-3 mEq/kg 80-150 mEq/dayAcetate Balance Balance Balance BalanceCalcium 1-4 mEq/kg 0.5-1 mEq/kg 10-25 mEq/day 10-20 mEq/day
*neonates mayneed 3-4 mEq/kg
Phosphorus 2-4 mEq/kg 1-2 mEq/kg 1-1.5 mEq/kg 30-60 mEq/dayMagnesium 0.3-0.5 mEq/kg 0.3-0.5 mEq/kg 0.3-0.5 mEq/kg 10-30 mEq/dayIron (pt >2 mo.) 0.1-0.2 mg/kg 0.1 mg/kg 0.1 mg/kg 2-6 mg/dayHeparin 0.5 units/mL for <1500 gm, 1 unit/mL 1 unit/mL 1 unit/mL
1 unit/mL ≥ 1500 gmAmino acids 2-3.5 gm/kg 1-2.5 gm/kg 1-2 gm/kg 0.8-2 gm/kg
up to 4 gm/kg for w/max. ofpremature infants 150 gm/day
LipidsInitial dose 1-2 gm/kg 1-2 gm/kg 1-1.5 gm/kg 0.5-1 gm/kgDaily dose increment 1 gm/kg 1 gm/kg 0.5-1 gm/kg 0.5 gm/kgStandard dose 3 gm/kg 3 gm/kg 1.5-2 gm/kg 0.5-1 gm/kg

174Clinical Pediatric Nutrition
VITAMINS, MINERALS AND TRACE ELEMENTS
In cases of specific medical conditions, such as renal or hepatic disease, some unitswill use “custom” trace elements. A standard pediatric trace element commercial prod-uct is available.
• Zinc is important for the maintenance of cell growth and development. WhenPN is supplemental to enteral nutrition or of short duration, zinc is the onlytrace element that requires supplementation. Some conditions that requireadditional zinc intake include elevated urinary zinc excretion (e.g. high outputrenal failure) and increased GI excretion (e.g. high volume stool loss and fistula/stoma losses).
• Copper is an essential constituent of many enzymes. Current daily recommenda-tions are adequate to prevent deficiency in preterm infants. Clinical manifesta-tions of copper deficiency include hypochromic anemia that is unresponsive toiron therapy, neutropenia and osteoporosis. Conditions requiring higher copperintake include increased biliary losses due to jejunostomy and losses via externalbiliary drainage.
Historically, copper was withheld in PN for patients with cholestasis; however,cases of copper deficiency have recently been reported when copper was with-held (Hurwitz, et al., 2004). In patients with cholestasis, it is recommended toreduce supplementation by 50 percent of the amount typically provided for age,monitor monthly serum copper levels and ceruloplasmin, and adjust supple-mentation accordingly.
• Manganese is an important component of several enzymes (Reifen, 1993). Man-ganese deficiency has not been documented in humans. However, manganesetoxicity has been reported. Manganese supplementation in PN should be with-held in patients with cholestasis or other liver function impairment (Reifen,1993; Fok, et al., 2001). Fok, et al., provided evidence suggesting that high manga-nese intake contributes to the development of cholestasis. Manganese shouldtherefore be used with caution in PN provided to infants because they are moresusceptible to cholestasis (Fok, et al., 2001). It is recommended to monitormonthly serum manganese levels and adjust supplementation as needed.
• Selenium is a component of the enzyme glutathione peroxidase, which is in-volved in protecting cell membranes from peroxidase damage through detoxifi-cation of peroxides and free radicals (Reifen, 1993). Supplementation withselenium is recommended in long-term PN (i.e. longer than one month). It isrecommended to decrease selenium intake when renal dysfunction is present.
• Chromium potentiates the action of insulin and is required for growth in light ofits role in glucose, protein and lipid metabolism (Reifen, 1993). It is also recom-mended to decrease chromium intake with renal dysfunction.
• Molybdenum supplementation is recommended in cases when exclusive PNexceeds four weeks. Deficiency of molybdenum has not been reported in pediat-rics; however, one adult case of deficiency has been documented (Reifen, 1993).

175Clinical Pediatric Nutrition
• Iodine is often omitted from PN given that iodine-containing disinfectants anddetergents are used on the skin and absorbed.
• Iron supplementation should be considered only among long-term PN-depen-dent patients who are not receiving frequent blood transfusions. Monitoring ironstatus is imperative with iron supplementation as there is risk of iron overload(Mirtallo, et al., 2004).
For information on parenteral vitamin solutions, refer to:Greene HL, Hambidge KM, Schanler R and Tsang RC. Guidelines for the use of vitamins, trace elements,
calcium, magnesium, and phosphorus in infants and children receiving total parenteral nutrition:report of the Subcommittee on Pediatric Parenteral Nutrition Requirements from the Committee onClinical Practice Issues of the American Society for Clinical Nutrition. Am J Clin Nutr 48(5);1324-42,Nov 1998.
PN ADDITIVES: HEPARIN, CARNITINE AND CYSTEINE
• Heparin. Addition of heparin to PN solutions “reduces the formation of a fibrinsheath around the catheter, may reduce phlebitis… and increases the duration of cath-eter patency” (Groh-Wargo, et al., 2000). Heparin also stimulates the release of lipopro-tein lipase, which may improve lipid clearance. It is recommended to add 0.25 to 1.0units heparin/mL of PN solution (Groh-Wargo, et al., 2000). There is an increased risk ofanti-coagulation with the higher doses of heparin.
• Carnitine is essential for optimum oxidation of fatty acids in the mitochondria,according to the same source. Impaired fatty acid oxidation can present ashypertriglyceridemia. Carnitine synthesis and storage are not optimal at birth, whencompared to older children and adults. Premature infants less than 34 weeks gestationreceiving PN without carnitine can develop carnitine deficiency 6 to 10 days after birth(Schmidt-Sommerfield, et al., 1982).
Carnitor® (Sigma-Tau Pharmaceuticals) is available for intravenous supplementa-tion. An initial, safe dose to consider for infants on exclusive PN for more than fourweeks is 8 to 10 mg/kg/day (Groh-Wargo, et al., 2000). A recent study revealed thatparenteral supplementation of 20 mg/kg/day carnitine resulted in plasma total car-nitine concentrations that exceeded the reference range, which supports the use ofsmaller doses of carnitine supplementation (Crill, et al., 2006). It is now recommended tomonitor monthly carnitine levels and titrate supplementation from 8 to 10 mg/kg/day,up to a maximum of 20 mg/kg/day.
• Cysteine, a conditionally essential amino acid, is not a component of crystallineamino acid solutions because it is unstable and will form an insoluble precipitate (Groh-Wargo, et al., 2000). In adults, cysteine can be synthesized from methionine; however,preterm infants lack adequate hepatic cystathionase to facilitate this conversion. Com-monly recommended dosing for L-cysteine hydrochloride is 40 mg per gram of aminoacids. Current practice suggests supplementation with L-cysteine hydrochloride for thefirst year of life, although practice varies widely (Mirtallo, et al., 2004).

176Clinical Pediatric Nutrition
One benefit of the addition of L-cysteine hydrochloride to PN is the decrease in thepH of the solution, which increases the solubility of supplemental calcium and phos-phorus. It should be noted though that the addition of cysteine to PN warrants closemonitoring of an infant’s acid-base status as it may predispose infants to acidosis, andacetate may need to be added to the solution.
COMPLICATIONS OF PNShort-term potential adverse effects of PN include the following: infection, hyperg-
lycemia, electrolyte abnormalities, disturbance of acid-base balance,hypertriglyceridemia, bacterial translocation and compromised gut integrity. With long-term PN support adverse effects may include: infection, PN-cholestasis, metaboliccomplications, disturbance of acid-base balance, osteopenia, risk of vitamin/mineraldeficiency or toxicity, and continued risk of bacterial translocation. Nosocomial infec-tions appear to result either from improper care of the catheter and/or frequent use ofthe catheter for purposes other than delivery of nutrients (e.g. blood draws, medicationadministration) (Reifen, 1993).
MONITORING PNPrior to initiation of PN support, it is recommended to check the following bio-
chemical indices: basic metabolic panel (BMP), calcium, magnesium, phosphorus, liverfunction tests (i.e. Alk Phos, ALT, AST, GGT), total bilirubin, conjugated or direct biliru-bin, pre-albumin, albumin and triglyceride. The BMP, calcium, magnesium, phosphorusand triglyceride levels should be checked daily for three days after the initiation of PNsupport, or until levels are stable and normal. Weekly LFT, total bilirubin, conjugated ordirect bilirubin, pre-albumin, albumin and triglyceride should be monitored.
Other biochemical studies (e.g. iron status, vitamin levels, ionized calcium, serumzinc, copper, ceruloplasmin, manganese) may be warranted on an individual basis.Patients on long-term PN, such as those with SBS, need monthly monitoring of vitaminand mineral status.
EMERGING ISSUES
It has come to light that various products utilized during PN compounding have ahigh aluminum content, which can be especially dangerous for infants and children.Preterm infants are extremely vulnerable to aluminum toxicity due to immature renalfunction and the likelihood for long-term PN (Mirtallo, et al., 2004).
Since July 2004, FDA mandates that products used in compounding PN should notethe aluminum content on the label. The FDA identified 5 mcg/kg/day as the maximumamount of aluminum that can be safely tolerated and amounts exceeding this limit maybe associated with central nervous system or bone toxicity (Mirtallo, et al., 2004).
It is essential for pharmacists, dietitians, physicians, and nurses to collaborate toreduce the use of higher aluminum content products.

177Clinical Pediatric Nutrition
However, it is difficult to achieve the recommended aluminum intake level set bythe FDA when patients are receiving multiple medications and PN. A reasonable goalfor clinicians is to minimize aluminum exposure.
In summary, providing PN is wrought with unique potential risks and complica-tions to these fragile infants and calls for a diligent interdisciplinary team approach.Early enteral nutrition as soon as medically appropriate is the key to minimizing thepotential adverse effects of PN support.
REFERENCES
Crill CM, et al. Relative bioavailability of carnitine supplementation in premature neonates. JPEN 30(5):421-425, 2006.
Committee on Nutrition, American Academy of Pediatrics. Commentary on Parenteral Nutrition.Pediatrics 71(4): 547, 1983.
Fok TF, Chui KKM, Cheung R, Ng PC, Cheung KL and Hjelm M. Manganese intake and cholestatisjaundice in neonates receiving parenteral nutrition: a randomized controlled study. Acta Paediatr 90:1009-1015, 2001.
Groh-Wargo S, Thompson M and Cox J, ed. Nutritional Care for High-Risk Newborns, 3rd ed. Chicago, IL:Precept Press, Inc; 2000.
Hurwitz M, Garcia MG, Poole RL and Kerner J. Copper deficiency during parenteral nutrition: a report offour pediatric cases. Nutr Clin Practice 19:305-308, June 2004.
Kerner JA. Parenteral nutrition. In: Walker WA, Durie PR, Hamilton JR, Walker-Smith JA and Watkins JB,eds. Pediatric gastrointestinal disease: pathophysiology, diagnosis, management, vol 2. St. Louis: Mosby,1904-51, 1996.
Mirtallo J, Canada T, Johnson D, et al. Safe practices for parenteral nutrition. JPEN 28(6): S39-S70, 2004.Nevin-Folino N (Ed). Pediatric Manual of Clinical Nutrition, 2nd ed. American Dietetic Association, 2003.Pereira G. Nutritional care of the extremely premature infant. Neonatal/Perinatal Nutrition 22(1): 61-75,
1995.Pettignano, et al. Total enteral nutrition versus total parenteral nutrition during pediatric extracorporeal
membrane oxygenation. Crit Care Med 26(2): 358-363, 1998.Reifen RM. Microminerals. In: Tsang R, Luca A, Uauy R and Zlotkin S. Nutritional Needs of the Preterm
Infant: Scientific Basis and Practical Guidelines. Philadelphia: Williams & Wilkins, 195-242, 1993.Schmidt-Sommerfield E, Penn D, Wolf H. Carnitine blood concentrations and fat utilization in parenter-
ally alimented premature newborn infants. J Pediatr 100: 260;1982.Wright K, Ernst KD, Gaylord MS, et al. Increased incidence of parenteral nutrition-associated cholestasis
with Aminosyn PF compared to Trophamine. J Perinatol 23(6): 444-450, 2003.

178Clinical Pediatric Nutrition
Notes

179Clinical Pediatric Nutrition
Chapter Sixteen:PICU-specific Nutritional Issues
This chapter will focus on medical and surgical conditions unique to the pediatricintensive care unit including infantile botulism, liver transplant, and congenital heartdisease.
INFANTILE BOTULISM
Infantile botulism is quite rare. Botulism is acquired by ingestion of Clostridiumbotulinum spores, which are found in soil or honey products. The spores germinate intobacteria that colonize the bowel and excrete toxin. The typical clinical presentation of aninfant with botulism is progressive weakness (weak cry), generalized hypotonia (re-duced movement of extremities), constipation, lethargy, poor feeding and dehydration(Cox, 2002). Botulism can quickly progress to respiratory failure, so early diagnosis andtreatment is paramount.
Treatment consists of nutritional and respiratory support until new motorendplates are regenerated, which results in spontaneous recovery. Neurologic sequelaeare seldom seen. Some children require outpatient tube feeding as the transition back tooral feedings may be slow.
LIVER TRANSPLANT
An infant or child may develop liver failure for a variety of reasons. Commonetiologies of liver failure can be classified in the following categories: chronic liverdisease, acute liver failure, liver tumors, and metabolic liver disease with life-threaten-ing extra-hepatic complications.
Examples of chronic liver disease include biliary atresia, alpha-1-antitrypsin defi-ciency, autoimmune hepatitis, sclerosing cholangitis, Caroli syndrome, Wilson’s Dis-

180Clinical Pediatric Nutrition
ease, Cystic Fibrosis, progressive familial intrahepatic cholestasis (all types), Alagillesyndrome, glycogen storage diseases type 3 and 4, and tyrosinaemia type 1 (not treatedwith NTBC).
Some conditions may warrant liver transplant, although there is limited outcomedata for these populations:
• Organic acidaemia• Unresectable hepatic malignancies without extrahepatic spread• Diffuse hepatic haemangioendothelioma unresponsive to alternative treatments• Langerhans cell histiocytosis• Mitochondrial respiratory chain disorders with chronic liver disease (selected)
but without discernible disabling extrahepatic disease• Intestinal failure associated liver disease
The success of liver splitting (using only a part of the liver) allows many childrento benefit from liver transplantation.
Malnutrition is common in pediatric patients with liver failure, and this contributesto their morbidity and mortality. When diagnosed with liver failure, an infant or childshould be referred to a dietitian. It is crucial to optimize nutrition status prior to trans-plantation because it can reduce morbidity and mortality.
Post-transplant patients are hypercatabolic, which results from preexisting malnu-trition, surgical stress, corticosteroid use, and possible sepsis (Brizee, et al., 2003). Ag-gressive nutrition support in this acute post-transplant phase improves the immunesystem, promotes wound healing, and repletes nutrient stores. Up to three months post-transplant (or until stable), energy needs increase to 120 to 130 percent of the RDA forage and protein needs are 175 to 200 percent RDA for age (Brizee, et al., 2003). Thesenutrient need estimates are just a starting point, and further adjustments should bemade on an individual basis.
Parenteral nutrition should be initiated if it is not possible to initiate oral or enteralfeedings by post-operative day three. Patients who require tube feedings prior to trans-plant generally continue on tube feedings after the liver transplant, at least for a fewweeks. Infant who undergo liver transplant are at high risk for inadequate intake,feeding intolerance, and vomiting in the early post-operative period. Continuous tubefeedings may alleviate feeding intolerance and vomiting.
CONGENITAL HEART DISEASE (CHD)Depending upon the cardiac defect, there are varying degrees of the affect on an
infant’s growth and nutritional status. CHD are often categorized as cyanotic oracyanotic defects. The former is associated with right-to-left shunts, cyanosis, andgrowth retardation. Acyanotic defects are associated with large left-to-right shunts and/or left-sided cardiac obstruction possibly resulting in congestive heart failure (CHF),dyspnea, poor oral feeding, and poor weight gain. According to Cameron, et al. (1995)infants with CHD are at significant risk for malnutrition and growth failure, with an 80

181Clinical Pediatric Nutrition
percent occurrence of acute and chronic malnutrition. Infants with CHD are oftenunable to sustain adequate oral intake due to fatigue, thus supplemental tube feedingsare often necessary. The increased work of breathing commonly noted in this populationalso complicated matters due to its increased energy demands.
The need for fluid restriction is common in infants who have CHD, due to theincreased risk for CHF and the overall tendency to retain fluid. There is concern that aninfant is retaining excessive fluid when s/he has a daily weight gain in excess of 50 gm(Hazinski, 1983). Caloric needs may be as high as 130 to 160 kcal/kg per day in infantswith CHD to support optimal growth (Huse, 1975; Krieger, 1970). Therefore, it is prob-able that a calorically dense (i.e. 27 to 30 kcal/oz) formula will be necessary to provideoptimal calories without administering excessive fluid.
Two common CHD are hypoplastic left heart syndrome (HLHS) and patent ductusarteriosis (PDA). In HLHS, the structures of the left side of the heart (ventricle, mitralvalve, aortic valve) are underdeveloped, and they are unable to pump blood adequately.This condition is usually diagnosed within the first few days of life, at which point theinfant may be critically ill. Fortunately, prenatal imaging tests often disclose the problemin advance.
The ductus arteriosus (DA) is a normal blood vessel in the developing fetus thatdiverts circulation away from the lungs and sends it directly to the body. The DA usuallycloses shortly after birth because it is no longer needed once a newborn breathes on hisown. In PDA, this closure does not occur, causing too much blood flow to a newborn’slungs. PDA is common in premature infants; sometimes it will resolve with medicaltreatment (i.e. Indomethacin®), but on occasion the PDA must be surgically repaired.
Cardiac System
Superior Vena CavaAorta
Ligamentum Ductus ArteriosusPulmonary Artery
Pulmonary Veins
LUNG
Mitral Valve
LeftAtrium
LUNG
LeftVentricle
RightAtrium
RightVentricle
Aortic Valve
Inferior Vena Cava
Tricuspid Valve

182Clinical Pediatric Nutrition
See Appendix #17 for a list of common congenital cardiac defects.
An excellent resource for learning more about CHD is:http://www.kidshealth.org/parent/medical/heart/congenital_heart_defects.html
REFERENCES
Brizee L, Nelson MP, Asfaw M, House J. Nutrition management of transplantation. In: Nevin-Folino N(Ed). Pediatric Manual of Clinical Dietetics, 2nd ed. American Dietetic Association, 2003.
Cameron JW, et al. Malnutrition in hospitalized children with congenital heart disease. Arch Pediatr AdolescMed 149:1098, 1995.
Cox N, Hinkle R. Infant botulism. Am Fam Physician 65:1388-92, 2002.Hazinski MF. Congenitalheart disease in the neonate. Part III-Congestive Heart Failure. Neonatal Network
1(6): 8, 1983.Huse DM, et al. Infants with congential heart disease. Am J Dis Child 129: 65, 1975.Krieger I. Growth failure and congenital heart disease. Am J Dis Child 120: 497, 1970.

183©
2009
Nut
ritio
n D
imen
sion
, Inc
.
Appendix #1
Growth Grids & Where to Get ThemNCHS growth charts Mead Johnson:
birth - 36 months Local representative orgirls/boys Bristol-Meyers, USPNG
Public Affairs Department2-18 years 2400 W. Lloyd Expressway
girls/boys Evansville, IN 47721-0001(812) 429-8829(800) 222-9123
Ross LaboratoriesLocal rep. or Ross Lab.Division of Abbott LabsPO Box 1317Columbus, OH 43216Attn: Medical Director(614) 227-3333
Genentech, Inc.1 DNA WayS. San Francisco, CA 94080(800) 626-3553
Prematurity charts Ross LaboratoriesLBW premature <37 wkl Local representative1501-2500 gm or see address above
boys, girlsVLBW premature <37 wk
<1500 gboys/girls
24 wk gestation-24 mo. Castlemead Publicationsboys/girls 12 Little Mundells
WelwynGarden CityHertfordshire, AL7 1EWUnited Kingdom
Head circumference Mead Johnsonbirth-18 years Local representative
boys/girls or see address aboveSource: Nellhaus, 1968
Height Velocity Serono LaboratoriesWeight Velocity 100 Longwater Circle
birth-19 years Norwell, MA 02061boys/girls (781) 963-8154
Source: Tanner, 1985
Source: Hamill, 1979
Source: IHDP, 1990; Casey, 1991
Source: Gairdner, 1971,1985
Down Syndrome Nat’l Down Syndrome1-26 months Congress
girls/boys 1370 Center Dr., Suite 1022-18 years Atlanta, GA 30338
girls/boys (800) 232-NDSChttp:/www.NDSCcenter.org
Turner Syndrome Genentech, Inc.2-19 years 1 DNA Way
girls S. San Francisco, CA 94080(800) 626-3553
Turner Syndrome Society, US14450 TC Jester, Suite 260Houston, TX 77014(800) 365-9944fax: (832) 249-9987http://www.turner-syndrome-us.org
Trisomy 13 and 18 Support Organizationgirls/boys for Trisomy (SOFT)
(800) 716-SOFThttp://www.trisomy.org
Source: Baty, 1994
Cornelia de Lange CDLS Foundation302 West Main St., #100Avon, CT 06001(800) 223-8355http://www.cdlsoutreach.org
Achondroplasia Skeletal Dysplasia Registrybirth-18 years Cedars-Sinai Med Center
boys/girls 444 S. San Vincente #1001Los Angeles, CA 90048http://www.csmc.edu/genetics/skeldys
Prader-Willi Prader-Willi Syndrome Foundation223 Main StreetPort Washington, NY 11050(800) 253-7993http://www.prader-willi.org
Source: Lyon, 1992
Source: Horton, 1978

184©
2009
Nut
ritio
n D
imen
sion
, Inc
.
Appendix #2
Girls Height- and Weight-for-Age

185©
2009
Nut
ritio
n D
imen
sion
, Inc
.
Appendix #3
Boys Height- and Weight-for-Age

186©
2009
Nut
ritio
n D
imen
sion
, Inc
.
Appendix #4
Premature Boys Growth Percentile (Weight)
Premature Boys Growth Percentile (Length)
Weight
Length
Wei
ght (
kg)
Gestation-Adjusted Age (mo)
Gestation-Adjusted Age (mo)
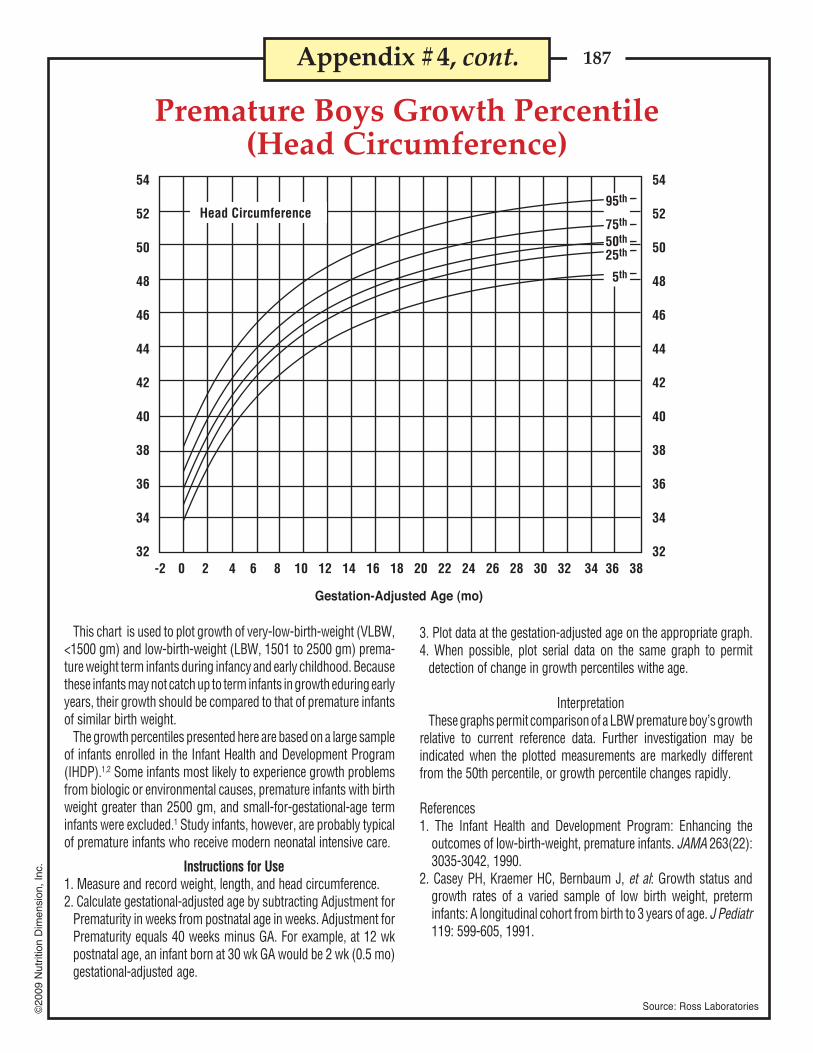
187©
2009
Nut
ritio
n D
imen
sion
, Inc
.
Appendix #4, cont.
Premature Boys Growth Percentile(Head Circumference)
Gestation-Adjusted Age (mo)
3. Plot data at the gestation-adjusted age on the appropriate graph.4. When possible, plot serial data on the same graph to permit
detection of change in growth percentiles withe age.
InterpretationThese graphs permit comparison of a LBW premature boy’s growth
relative to current reference data. Further investigation may beindicated when the plotted measurements are markedly differentfrom the 50th percentile, or growth percentile changes rapidly.
References1. The Infant Health and Development Program: Enhancing the
outcomes of low-birth-weight, premature infants. JAMA 263(22):3035-3042, 1990.
2. Casey PH, Kraemer HC, Bernbaum J, et al: Growth status andgrowth rates of a varied sample of low birth weight, preterminfants: A longitudinal cohort from birth to 3 years of age. J Pediatr119: 599-605, 1991.
This chart is used to plot growth of very-low-birth-weight (VLBW,<1500 gm) and low-birth-weight (LBW, 1501 to 2500 gm) prema-ture weight term infants during infancy and early childhood. Becausethese infants may not catch up to term infants in growth eduring earlyyears, their growth should be compared to that of premature infantsof similar birth weight.
The growth percentiles presented here are based on a large sampleof infants enrolled in the Infant Health and Development Program(IHDP).1,2 Some infants most likely to experience growth problemsfrom biologic or environmental causes, premature infants with birthweight greater than 2500 gm, and small-for-gestational-age terminfants were excluded.1 Study infants, however, are probably typicalof premature infants who receive modern neonatal intensive care.
Instructions for Use1. Measure and record weight, length, and head circumference.2. Calculate gestational-adjusted age by subtracting Adjustment for
Prematurity in weeks from postnatal age in weeks. Adjustment forPrematurity equals 40 weeks minus GA. For example, at 12 wkpostnatal age, an infant born at 30 wk GA would be 2 wk (0.5 mo)gestational-adjusted age.
Source: Ross Laboratories
Head Circumference
54
52
50
48
46
44
42
40
38
36
34
32
54
52
50
48
46
44
42
40
38
36
34
32-2 0 2 4 6 8 10 12 14 16 18 20 22 24 26 28 30 32 34 36 38
95th
75th
50th
25th
5th

188©
2009
Nut
ritio
n D
imen
sion
, Inc
.
Parent-Specific Adjustments for Stature of Boys 3-18 YearsMidparent Stature (cm)Age
(year)
Appendix #5
3
4
5
6
7
8
9
10
11
12
13
14
15
16
17
18
Stature(cm)
86.0-87.988.0-97.9
98.0-106.9
90.0-93.994.0-103.9
104.0-112.9
96.0-103.994.0-113.9
114.0-122.9
102.0-111.9112.0-121.9122.0-130.9
108.0-117.9118.0-127.9128.0-136.9
114.0-115.9116.0-125.9126.0-135.9136.0-144.9
120.0-121.9122.0-131.9132.0-141.9142.0-150.9
124.0-127.9128.0-137.9138.0-147.9148.0-158.9
128.0-133.9134.0-143.9144.0-153.9154.0-162.9
132.0-141.9142.0-151.9152.0-161.9162.0-170.9
136.0-139.9140.0-149.9150.0-159.9160.0-169.9170.0-178.9
142.0-145.9146.0-155.9156.0-165.9166.0-175.9176.0-184.9
148.0-151.9152.0-161.9162.0-171.9172.0-181.9182.0-190.9
156.0-163.9164.0-173.9174.0-183.9184.0-192.9
162.0-165.9166.0-175.9176.0-185.9186.0-194.9
160.0-165.9166.0-175.9176.0-185.9186.0-194.9
Source: Ross Laboratories, Columbus, Ohio
150
788
788
899
89
10
91012
10111213
11111213
11121314
12121415
12131314
1212131415
1314151516
1415171819
17192123
17202225
18202326
152
678
678
789
789
89
10
99
1012
9101112
10111213
10111213
10111213
1011121313
1112131415
1314151617
15171921
15172023
16182124
154
567
567
678
778
789
889
10
89
1011
9101112
9101112
9101112
910101112
1011111213
1112131416
13151719
13151820
13161922
156
556
456
567
677
678
6789
789
10
789
11
88
1011
899
10
889
1011
89
101112
910111314
11131517
11131618
11131619
158
445
445
456
566
567
5678
6678
6789
6789
6789
67889
7889
10
78
101112
9101214
9111316
9111417
160
344
334
345
456
456
4567
4567
5678
5678
5678
56678
56789
6789
10
78
1012
79
1114
69
1215
162
234
233
234
345
345
3456
3456
3457
4457
4556
44566
45567
45679
568
10
469
12
479
12
166
112
012
012
123
123
1123
1124
1234
1234
1234
11234
11234
01234
1246
0257
0258
164
123
123
123
234
234
2235
2345
2345
2345
2345
23445
23456
23467
3468
2479
247
10
168
001
–101
001
012
012
–1012
0012
–1013
0013
0112
–10122
–10123
–10123
–1024
2035
–3036
170
–1–1
0
–1–1
0
–100
–101
–101
–2–1
01
–2–1
01
–2–1
01
–2–1
01
–2–1
01
–2–1–1
01
–2–2–1
01
–3–2–1
02
–3–2
02
–4–2
02
–5–3
03
172
–2–1
0
–2–1–1
–2–1
0
–2–1
0
–2–1
0
–3–2–1
0
–3–2–1
0
–3–2–1
0
–3–2–1
0
–3–2–1
0
–3–3–2–1
0
–4–3–2–1
0
–5–4–3–1
0
–5–4–2
0
–7–4–2
1
–7–5–2
1
174
–3–2–1
–3–2–1
–3–2–1
–3–2–1
–4–2–1
–4–3–2–1
–4–3–2–1
–5–4–3–1
–5–4–3–2
–4–3–2–2
–5–4–3–3–2
–5–5–4–3–2
–7–6–4–3–2
–7–6–4–2
–9–7–4–1
–10–7–4–1
176
–3–3–2
–4–3–2
–4–3–2
–4–3–2
–5–4–2
–5–5–4–2
–5–5–4–3
–6–5–4–3
–6–5–4–3
–6–5–4–3
–6–6–5–4–3
–7–6–5–4–4
–8–7–6–5–4
–9–8–6–4
–11–9–6–4
–12–10
–7–4
178
–4–4–3
–5–4–3
–5–4–3
–5–4–3
–6–5–4
–6–6–5–4
–7–6–5–4
–7–6–5–4
–7–6–5–4
–7–6–5–4
–7–7–6–5–5
–8–8–7–6–5
–10–9–8–7–5
–11–10
–8–6
–13–11
–8–6
–14–12
–9–6
180
–5–5–4
–5–5–4
–6–5–4
–6–5–4
–7–6–5
–8–7–6–5
–8–7–6–5
–9–8–7–5
–9–8–7–6
–8–7–6–6
–9–8–7–7–6
–10–9–8–7–7
–12–11–10
–8–7
–13–12–10
–8
–15–13–11
–8
–17–14–11
–8
182
–6–5–4
–6–6–4
–7–6–5
–7–6–5
–8–7–6
–9–8–7–6
–9–8–7–6
–10–9–8–7
–10–9–8–7
–10–9–8–7
–10–10
–9–8–7
–11–11–10
–9–8
–14–13–11–10
–9
–16–14–12–10
–17–15–13–10
–19–17–14–11
184
–7–6–5
–7–6–6
–8–7–6
–8–7–6
–9–8–7
–10–9–8–7
–10–10
–9–7
–11–10
–9–8
–11–10
–9–8
–11–10
–9–8
–12–11–10
–9–9
–13–12–11–11–10
–15–14–13–12–11
–18–16–14–12
–20–18–15–12
–21–19–16–13
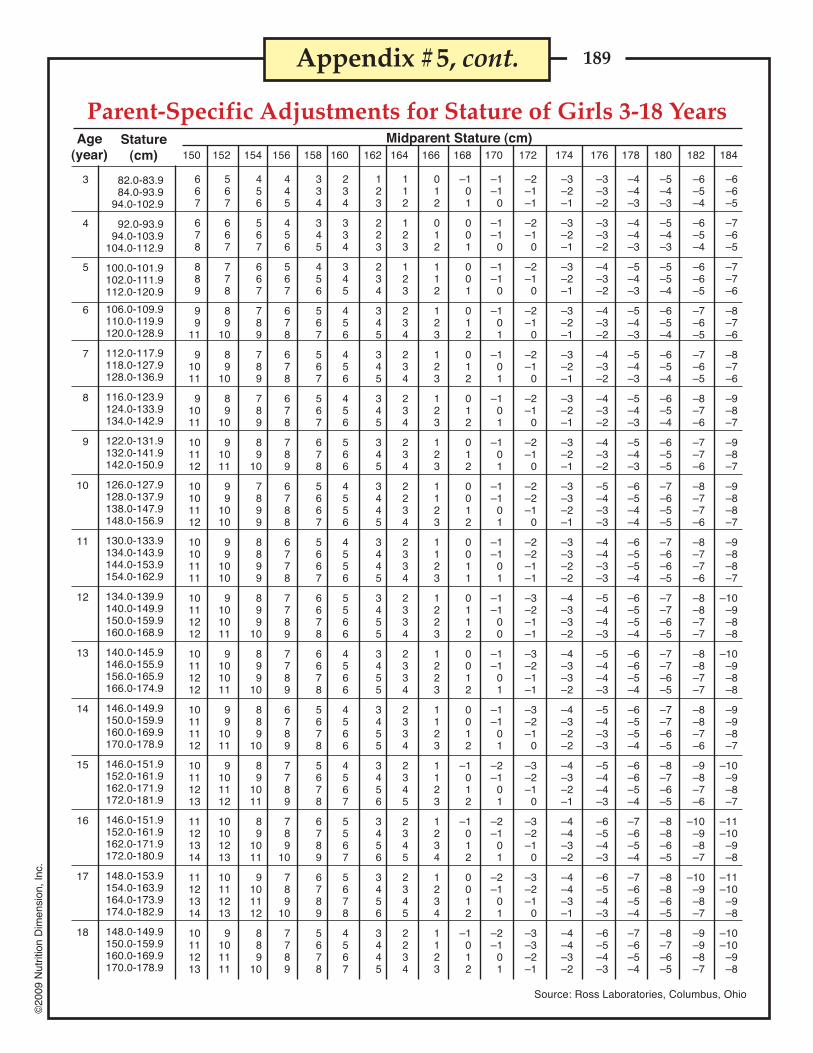
189©
2009
Nut
ritio
n D
imen
sion
, Inc
.
Parent-Specific Adjustments for Stature of Girls 3-18 YearsMidparent Stature (cm)Age
(year)
3
4
5
6
7
8
9
10
11
12
13
14
15
16
17
18
Stature(cm)
82.0-83.984.0-93.9
94.0-102.9
92.0-93.994.0-103.9
104.0-112.9
100.0-101.9102.0-111.9112.0-120.9
106.0-109.9110.0-119.9120.0-128.9
112.0-117.9118.0-127.9128.0-136.9
116.0-123.9124.0-133.9134.0-142.9
122.0-131.9132.0-141.9142.0-150.9
126.0-127.9128.0-137.9138.0-147.9148.0-156.9
130.0-133.9134.0-143.9144.0-153.9154.0-162.9
134.0-139.9140.0-149.9150.0-159.9160.0-168.9
140.0-145.9146.0-155.9156.0-165.9166.0-174.9
146.0-149.9150.0-159.9160.0-169.9170.0-178.9
146.0-151.9152.0-161.9162.0-171.9172.0-181.9
146.0-151.9152.0-161.9162.0-171.9172.0-180.9
148.0-153.9154.0-163.9164.0-173.9174.0-182.9
148.0-149.9150.0-159.9160.0-169.9170.0-178.9
Appendix #5, cont.
Source: Ross Laboratories, Columbus, Ohio
150
667
678
889
99
11
91011
91011
101112
10101112
10101111
10111212
10111212
10111112
10111213
11121314
11121314
10111213
152
567
667
778
89
10
89
10
89
10
91011
99
1010
99
1010
9101011
9101011
99
1011
9101112
10101213
10111213
9101111
154
456
567
667
789
789
789
89
10
7899
8899
899
10
899
10
889
10
89
1011
89
1011
9101112
889
10
156
445
456
567
678
678
678
789
6788
6778
7789
7789
6789
7789
789
10
789
10
7789
160
234
334
345
456
456
456
566
4556
4556
5566
4566
4566
4567
5567
5678
4567
158
334
345
456
567
567
567
678
5667
5667
6678
6678
5678
5678
6789
6789
5678
164
112
123
123
234
234
234
234
2234
2334
2334
2334
2334
2345
2345
2345
2234
162
123
223
234
345
345
345
345
3445
3445
3455
3455
3455
3456
3456
3456
3445
166
012
012
112
123
123
123
123
1123
1123
1223
1223
1123
1123
1234
1234
1123
168
–101
001
001
012
012
012
012
0012
0011
0112
0012
0012
–1012
–1012
0012
–1012
170
–1–1
0
–1–1
0
–1–1
0
–101
–101
–101
–101
–1–1
01
–1–1
01
–1–1
00
–1–1
01
–1–1
01
–2–1
01
–2–1
01
–2–1
01
–2–1
01
174
–3–2–1
–3–2–1
–3–2–1
–3–2–1
–3–2–1
–3–2–1
–3–2–1
–3–3–2–1
–3–3–2–2
–4–3–3–2
–4–3–3–2
–4–3–2–2
–4–3–2–1
–4–4–3–2
–4–4–3–1
–4–4–3–2
172
–2–1–1
–2–1
0
–2–1
0
–2–1
0
–2–1
0
–2–1
0
–2–1
0
–2–2–1
0
–2–2–1–1
–3–2–1–1
–3–2–1–1
–3–2–1
0
–3–2–1
0
–3–2–1
0
–3–2–1
0
–3–3–2–1
178
–4–4–3
–4–4–3
–5–4–3
–5–4–3
–5–4–3
–5–4–3
–5–4–3
–6–5–4–4
–6–5–5–4
–6–5–5–4
–6–6–5–4
–6–5–5–4
–6–6–5–4
–7–6–5–4
–7–6–5–4
–7–6–5–4
180
–5–4–3
–5–4–3
–5–5–4
–6–5–4
–6–5–4
–6–5–4
–6–5–5
–7–6–5–5
–7–6–6–5
–7–7–6–5
–7–7–6–5
–7–7–6–5
–8–7–6–5
–8–8–6–5
–8–8–6–5
–8–7–6–5
182
–6–5–4
–6–5–4
–6–6–5
–7–6–5
–7–6–5
–8–7–6
–7–7–6
–8–7–7–6
–8–7–7–6
–8–8–7–7
–8–8–7–7
–8–8–7–6
–9–8–7–6
–10–9–8–7
–10–9–8–7
–9–9–8–7
184
–6–6–5
–7–6–5
–7–7–6
–8–7–6
–8–7–6
–9–8–7
–9–8–7
–9–8–8–7
–9–8–8–7
–10–9–8–8
–10–9–8–8
–9–9–8–7
–10–9–8–7
–11–10
–9–8
–11–10
–9–8
–10–10
–9–8
176
–3–3–2
–3–3–2
–4–3–2
–4–3–2
–4–3–2
–4–3–2
–4–3–2
–5–4–3–3
–4–4–3–3
–5–4–4–3
–5–4–4–3
–5–4–3–3
–5–4–4–3
–6–5–4–3
–6–5–4–3
–6–5–4–3

190©
2009
Nut
ritio
n D
imen
sion
, Inc
.
Classification of NewbornsBased on Maturity and Intrauterine Growth
Appendix #6

191©
2009
Nut
ritio
n D
imen
sion
, Inc
.
Appendix #7
Fetal-Infant Growth Chart for Preterm Infants

192©
2009
Nut
ritio
n D
imen
sion
, Inc
.
Percentiles for Triceps SkinfoldTriceps skinfold percentiles (mm)
1–1.92–2.93–3.94–4.95–5.96–6.97–7.98–8.99–9.9
10–10.911–11.912–12.913–13.914–14.915–15.916–16.917–17.918–18.919–24.9
Age(year) 5
6666655566665444544
10
7776666666665555555
25
8888877778887766667
50
101010
99898
1010111110
98889
10
75
12121111111012101314161414141112121316
90
14141412141315131718202222211816162020
95
16151514151617161821242826242422192424
Males
5
667766668778898
10101010
10
7888767888898
101012121211
25
89988899
1010101112131215131514
50
10101110101011121312131415161718191818
75
12121212121213151617181821212122242224
90
14151414151416182023242326262526302630
95
16161516181618242227282730283231373034
Females
Source: American Journal of Clinical Nutrition 34: Nov. 1981.
% of Upper Arm Circumference & Estimated Upper Arm Muscle Circumference
1–1.92–2.93–3.94–4.95–5.96–6.97–7.98–8.99–9.9
10–10.911–11.912–12.913–13.914–14.915–15.916–16.917–17.918–18.919–24.9
Age(year)
Arm muscle circumference (mm)5
142141150149153155162162175181186193194220222244246245262
10
146145153154160159167170178184190200211226229248253260272
95
183185190192204228230245257274280303301322320343347379372
90
176178184186195209223220249262261282286303311324336353355
75
170170175180185188201202217231244254263283284303308321331
25
150153160162167167177177187196202214228237244262267276288
5
110111117123128131137140151156159167172189199213224226238
10
113114123126133135139145154160165171179199204225231237245
95
147150153159169177190187202221230241245264272296312324321
90
144146148156162170177182196209205223238260266287294298309
75
135140143148154161168170183191195210226240254269273283289
50
127130137141147151160162170180183195211223237249258264273
25
119122131133140142151154161166173182196212218234245252257
Males
50
159162167171175179187190200210223232247253264278285297308
Males
FemalesFemales138142143149153156164168178174185194202214208218220222221
142145150154157162167172182182194203211223221224227227230
177184189191211211231261260265303294338322322334350325345
172176183184203204216247251251276282301304300318324312319
164167175177185187199214224228248256271272279283295281290
148152158160165170174183194193208216223237239241241241247
105111113115125130129138147148150162169174175170175174179
111114119121128133135140150150158166175179178180183179185
143147152157165171176194198197223220240247244249257245249
139142146152159166171183194190217214226232228234239237236
132133140144151154160171180180196201211216215216221215221
124126132136142145151160167170181191198201202202205202207
117119124128134138142151158159171180183190189190194191195
156160167169175176183195211210224237243252254258264258265
1–1.92–2.93–3.94–4.95–5.96–6.97–7.98–8.99–9.9
10–10.911–11.912–12.913–13.914–14.915–15.916–16.917–17.918–18.919–24.9
Arm circumference (mm)
Appendix #8

193©
2009
Nut
ritio
n D
imen
sion
, Inc
.
Source: American Journal of Clinical Nutrition 34: Nov. 1981.
Appendix #8, cont.
% of Upper Arm Fat Area (mm2) & Upper Arm Muscle Area (mm2)
1–1.92–2.93–3.94–4.95–5.96–6.97–7.98–8.99–9.9
10–10.911–11.912–12.913–13.914–14.915–15.916–16.917–17.918–18.919–24.9
Age(year)
Arm fat area percentiles (mm2)5
956973
10951207129813601497155018111930201622162363283031383625399840704508
5
452434464428446371423410485523536554475453521542598560594
10
486504519494488446473460527543595650570563595593698665743
50
741737736722713678758725859982
1148117210961082
9311078109612641406
25
590578590598582539574588635738754874812786690844827860963
MalesMales
FemalesFemales885973
10141058123813541330151317231740178420922269241824262308244223982538
401469473490470464491527642616707782726981839
1126102410031046
466526529541529508560634690702802854838
104311261351126712301198
578642656654647638706769933842
101510901219142313961663146316161596
1–1.92–2.93–3.94–4.95–5.96–6.97–7.98–8.99–9.9
10–10.911–11.912–12.913–13.914–14.915–15.916–16.917–17.918–18.919–24.9
Arm muscle area percentiles (mm2)10
1014104012011264141114471548166418842027215623392546314733174044425244814777
25
1133119013571408155016051808189520672182238226493044358637884352477750665274
50
1278134514841579172018152027208922882575267030223553396344814951528655525913
75
1447155716181747188420562246229626572903302234964081457551345753595063746660
90
1644169017501926208922972494262850533486335939684502536856316576688670677606
95
1720178718532008228524932886278832573882422646404794553059006980772683558200
75
895871868859914896
1011100312521376171015581702160814231746163619472231
90
103610441071
989117611151393124818641906234825362744274624342280240733023098
95
1176114811511085129915191511155820812609257435803322350831003041288839283652
973102911331171130114141441156617881784198721822426252625182567267425382728
1084111912271313142315131602180819762019231625792657287428472865299629173026
1221126913961475159816831815203422272296261229043130322032483248333632433406
1378140515631644182518772045232725712583307132253529370436893718388336943877
1535159516901832201221822332265729872873373936554081429441234353455244614439
1621172718461958215923232469299631123093395338474568485047564946525147674940
1140117311581236153614361644248225243005369033694150376541954236515937334896
1022106111061109133012631407187221712500273026663272325030933374386435084050
847894967907991
10091135138315841608194220562374240325442598297726172959
706747822766812827920
104212191141130115111625181818862006210421042166
Results of measurements taken throughout the study [mean (SD)]
SexAge
(year)
Neonate
15 days
1 month
4 months
6 months
9 months
12 months
BoysGirls
BoysGirls
BoysGirls
BoysGirls
BoysGirls
BoysGirls
BoysGirls
Arm fatarea
(mm2)
Arm fatarea(%)
Arm waterarea
(mm2)
205 (42)200 (51)
254 (52)261 (55)
313 (61)331 (72)
577 (100)534 (110)
647 (135)612 (150)
676 (111)610 (154)
660 (112)669 (157)
15.0 (5.7)17.7 (7.4)
16.9 (5.7)17.3 (7.5)
19.1 (8.8)18.2 (8.2)
19.8 (6.6)25.4 (11.0)
23.7 (11.4)22.8 (10.0)
22.6 (8.8)18.8 (7.9)
25.0 (10.5)19.2 (8.0)
23.7 (3.4)23.7 (3.3)
27.6 (3.7)28.7 (3.8)
28.9 (3.7)32.2 (4.3)
35.1 (4.4)35.1 (5.0)
35.9 (4.5)34.8 (6.8)
34.9 (4.5)34.8 (6.8)
33.5 (4.0)35.6 (6.4)
Tricipital skinfoldthickness at60 sec. (mm)
Arm musclearea
(mm2)
Armarea
(mm2)
4.20 (0.7)4.15 (0.8)
5.10 (0.8)5.30 (0.9)
5.80 (0.9)6.40 (1.2)
8.90 (1.3)8.60 (1.5)
9.50 (1.6)9.60 (2.1)
9.60 (1.4)9.13 (2.1)
9.23 (1.3)9.70 (2.1)
864 (116)835 (135)
916 (129)906 (138)
1078 (138)1022 (143)
1644 (212)1522 (242)
1804 (280)1613 (218)
1942 (262)1741 (226)
1986 (318)1872 (226)
643 (89)617 (91)
645 (91)628 (91)
746 (95)674 (96)
1047 (161)977 (136)
1132 (193)977 (136)
1243 (208)1113 (163)
1300 (253)1184 (165)

194©
2009
Nut
ritio
n D
imen
sion
, Inc
.
Appendix #9
Infant FormulasDisclaimer:
Keep in mind that powdered formulas are not commercially sterile, so these products should not be used for immune-compromised patients unless no appropriate substitution is available.
Product nutrient values and ingredients are subject to change. The information presented below is accurate as of May 20,2008. The most up-to-date information should be obtained directly from manufacturers.
Weighing formula with a gram scale is the most accurate method measurement, rather than using scoops or householdmeasurements.
Note that the standard mixing instructions for most infant formulas are one scoop plus two ounces of water to make 20calories/ounce concentration; however, Neocate Infant products are mixed one scoop plus one ounce of water to make 20calories/ounce concentration.
Indications for use:Standard infant formulas- normal term infant when breast milk is not available or to be used as supplement in cases when
breast milk supply is inadequateLactose-free infant formulas- indicated for primary lactose-intolerance (quite rare); not appropriate for galactosemiaProtein hydrolysate-based infant formulas- cow’s milk and soy protein allergiesProtein hydrolysate-based infant formulas with increased MCT content- cow’s milk and soy protein allergies, short bowel
syndrome, malabsorption, feeding intoleranceAmino acid-based infant formulas- allergies to cow’s milk and soy unresolved with use of protein hydrolysate-based infant
formulas, short bowel syndrome, feeding intoleranceFormulas with altered macronutrient composition:High MCT content is indicated for steatorrhea, chylothorax, intestinal lympangiectasia (e.g. Portagen, Monogen)Altered carbohydrate content formula is indicated for infants requiring the ketogenic diet or infants with stool output
strongly positive for reducing substances (this product allows CHO to be added back incrementally until maximaltolerance is reached)(e.g. RCF, product 3232A)
Altered protein content formula is indicated for infants requiring a protein-restricted diet, such as severe renal impairmentor an inborn error of metabolism (e.g. Pro-Phree)
*Calories per gram of powder**Grams of powder per unpacked, level scoop***Grams of powder per unpacked, level measuring cup
Standard Infant Formulas: kcal/mL kcal/gm* gm/scoop** gm/cup***Enfamil LIPIL (Mead Johnson)
Ready-to-feed: 0.68 -- 8.5 116Powder: -- 5.2 8.5 116
EnfamilLactoFree LIPIL (Mead Johnson)Ready-to-feed: 0.68 -- -- --Powder: -- 5.2 8.5 123
Enfamil Gentlease LIPIL (Mead Johnson)Ready-to-feed: 0.68 -- -- --Powder: -- 5.2 8.6 110
Enfamil A.R. LIPIL (Mead Johnson)Ready-to-feed: 0.68 5.1 8.7 95
Good Start Supreme (Nestlé) -- 5.12 8.7 102Good Start Supreme DHA & ARA (Nestlé) -- 5.12 8.7 102Good Start Natural Cultures (Nestlé) -- 5.12 8.7 102Similac Advance (Abbott Nutrition) -- 5.2 8.6 100Similac Sensitive (Abbott Nutrition) -- 5.19 8.7 100Similac Sensitive R.S. (Abbott Nutrition) -- 1.45 gm Protein/100 mL --
Ready-to-feed only: 0.676 -- -- --Similac Organic (Abbott Nutrition) -- 5.2 8.6 100
continued on following page

195©
2009
Nut
ritio
n D
imen
sion
, Inc
.
Infant Formulas, continuedSoy-Based Infant Formulas: kcal/mL kcal/gm* gm/scoop** gm/cup***Enfamil ProSobee LIPIL (Mead Johnson)
Ready-to-feed: 0.68 -- -- --Powder: -- 5 8.8 128
Good Start Supreme Soy DHA & ARA (Nestle)Powder: -- 5.01 8.9 --
Similac Isomil Advance (Ross/Abbott Nutrition) -- 5.14 8.7 100Similac Isomil DF (Ross/Abbott Nutrition)
Available in ready-to-feed only: 0.676 1.8 gm Protein/100 mL
Protein Hydrolysate-Based Infant Formulas:Nutramigen LIPIL (Mead Johnson)
Ready-to-feed: 0.68 -- -- --Powder: -- 5 9.0 129 gm/cup^
Protein Hydrolysate-Based Infant Formulas w/increased MCT content:Pregestimil LIPIL (Mead Johnson)
Read-to-feed: 20 cal/oz 0.68 -- -- --24 cal/oz 0.81 -- -- --
Powder: -- -- 8.9 128^Similac Alimentum (Ross/Abbott Nutrition) -- 8.7 5.09 118
Amino Acid-Based Infant Formulas:Nutramigen AA LIPIL (Mead Johnson)
2.8 gm Protein/100 kcal -- 5 4.5 (unpacked, - -level measurement)
Neocate Infant (Nutricia) -- 4.21 4.5 114Neocate Infant with DHA & ARA (Nutricia) -- 4.21 4.7 114Elecare (Ross/Abbott Nutrition) -- 4.75 9.4 130
Formulas with altered macronutrient content:Portagen (Mead Johnson) [not indicated for <1 year of age per manufacturer]
Only available as powder: 4.7 kcal/100 gm 9.4 (packed) 1213232A (Mead Johnson)
22 gm Protein/100gm 162 (packed, level)Monogen (Nutricia) [not indicated for <1 year of age per manufacturer]
11.4 gm Protein/100 gm -- 4.24 5 --RCF (Ross/Abbott Nutrition)
Only available as liquid concentrate: 0.814 gm Protein/100 mL
Pro-Phree (Ross/Abbott Nutrition) -- 5.1 -- 107 (packed, level)0 gm Protein
Premature Infant Formulas (20 and 24 Cal/oz):Enfamil Premature LIPIL (Mead Johnson)
Available as ready-to-feed only:20 cal/oz 0.68 2 gm Protein/100 mL --24 cal/oz 0.81 2.4 gm Protein/100 mL --
Similac Special Care Advance (Ross/Abbott Nutrition)Available in ready-to-feed only:20 cal/oz product: 0.676 kcal/100 mL -- 2.03 gm Protein/100 mL --24 cal/oz product: 0.812 kcal/100 mL -- 2.43 gm Protein/100 mL --
Good Start Premature 243 gm protein/100 kcal -- -- 0.8 --
Appendix #9, cont.

196©
2009
Nut
ritio
n D
imen
sion
, Inc
.
Infant Formulas, continued
For further details on infant formula composition, please refer to the following free resource:http://www.pediatricnutrition.org/pdfs/PediatricManualofClinicalDietetics_Appendix1.pdfPediatric Manual of Clinical Dietetics, 2nd Edition Update, by Mary Sharrett MS, RD, LD, CNSDAppendix 1: Composition of Infant Formulas and Selected Nutritional Supplements
Contact information for manufacturers of infant formulas:
Mead Johnson 812-429-6399www.MeadJohnson.com/professional
Nestlé 800-284-9488www.verybestbaby.com
Nutricia North America (formerly SHS) 800-365-7354www.shsna.com
Ross/Abbott Nutrition 800-227-5767www.ross.com and www.abbottnutrition.com
Premture Infant Formulas (30 Cal/oz): kcal/mL kcal/gm* gm/scoop** gm/cup***Similac Special Care Advance (Ross/Abbott Nutrition)
Available in ready-to-feed only: 1.01 3.04 gm Protein/100 mL --
Human Milk Fortifiers:Enfamil Human Milk Fortifier (Mead Johnson) -- -- -- --
Available as powder only (0.71 gm/packet) -- -- -- --1 packet = 2 kcal, 0.275 gm Protein -- -- -- --Contains 1.44 mg iron/4 packets -- -- -- --
Similac Human Milk Fortifier (Ross/Abbott Nutrition)Available as powder only (0.90 gm/packet) -- -- -- --1 packet per 50 mL= 22 kcal/oz -- -- -- --1 packet per 25 mL = 24 kcal/oz -- -- -- --1 packet = 0.24 gm ProteinContains 0.34 mg iron/4 packets (it is thought that iron content promotes bacterial growth)
Refer to this resource for nutrient profile whenmixed with premature breast milk:http://abbottnutrition.com/products/products.aspx?pid=46
Post-Discharge Premature Infant Formulas (22 Cal/oz):Enfamil EnfaCare LIPIL (Mead Johnson)
Ready-to-feed: 0.74 2.8 gm protein/100 kcal --Powder: -- 4.9 9.8 --
Similac NeoSure (Ross/Abbott Nutrition)Ready-to-feed: 0.744 kcal/100mL -- 2.08 gm Protein/100mL --Powder: -- 5.5 9.6 100
Follow-Up and Toddler Formulas:Enfamil Next Step LIPIL (Mead Johnson) 0.68 5 8.8 --
2.6 gm Protein/100 kcalEnfamil Next Step ProSobee LIPIL (Mead Johnson) 0.68 4.7 9.3 --
3.3 gm Protein/100 kcalGood Start 2 Natural Cultures (Nestlé)
Available in powder only: -- 5 -- -- 2.2 gm Protein/100 kcal
Good Start 2 Supreme DHA & ARA (Nestlé)Available as powder only: -- 5.03 8.8 --
2.2 gm Protein/100 kcalGood Start 2 Supreme Soy (Nestlé)
Available as powder only: -- 5 8.9 -- 2.8 gm Protein/100 kcal
Similac Go & Grow Milk-Based Formula -- 5.2 8.6 100(Ross/Abbott Nutrition)
Similac Go & Grow Soy-Based Formula -- 5.14 8.7 100(Ross/Abbott Nutrition)
Appendix #9, cont.
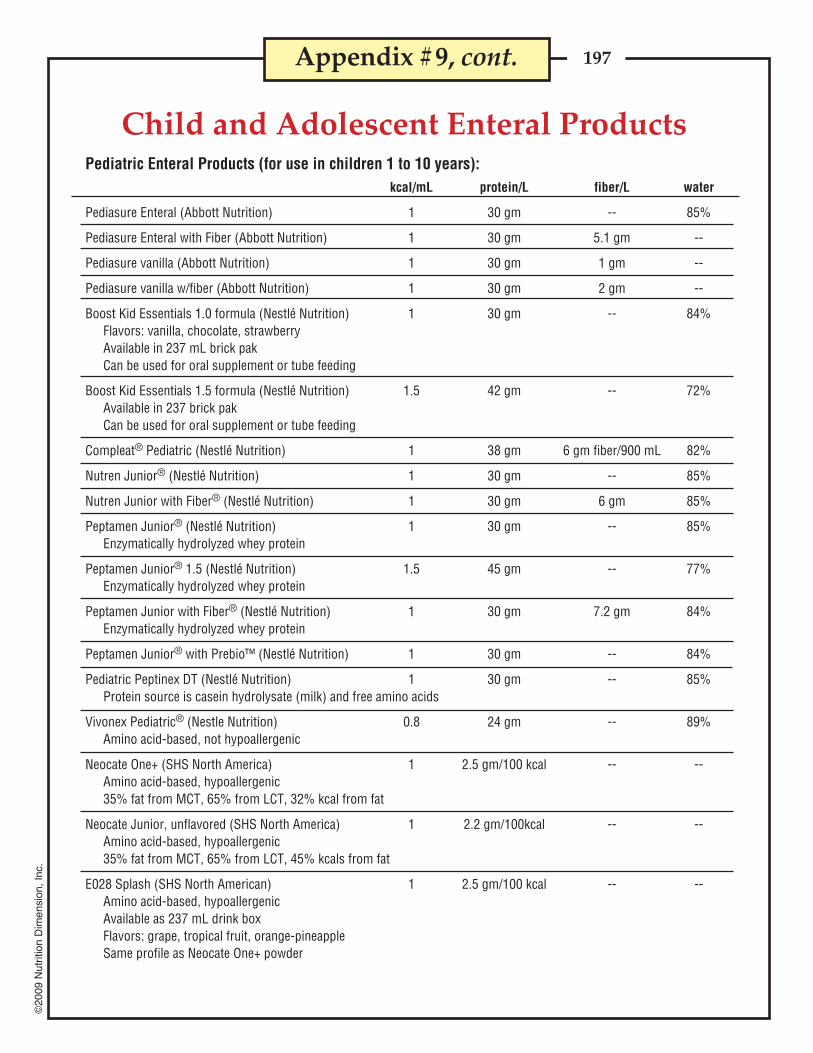
197©
2009
Nut
ritio
n D
imen
sion
, Inc
.
Pediatric Enteral Products (for use in children 1 to 10 years):kcal/mL protein/L fiber/L water
Pediasure Enteral (Abbott Nutrition) 1 30 gm -- 85%
Pediasure Enteral with Fiber (Abbott Nutrition) 1 30 gm 5.1 gm --
Pediasure vanilla (Abbott Nutrition) 1 30 gm 1 gm --
Pediasure vanilla w/fiber (Abbott Nutrition) 1 30 gm 2 gm --
Boost Kid Essentials 1.0 formula (Nestlé Nutrition) 1 30 gm -- 84%Flavors: vanilla, chocolate, strawberryAvailable in 237 mL brick pakCan be used for oral supplement or tube feeding
Boost Kid Essentials 1.5 formula (Nestlé Nutrition) 1.5 42 gm -- 72%Available in 237 brick pakCan be used for oral supplement or tube feeding
Compleat® Pediatric (Nestlé Nutrition) 1 38 gm 6 gm fiber/900 mL 82%
Nutren Junior® (Nestlé Nutrition) 1 30 gm -- 85%
Nutren Junior with Fiber® (Nestlé Nutrition) 1 30 gm 6 gm 85%
Peptamen Junior® (Nestlé Nutrition) 1 30 gm -- 85%Enzymatically hydrolyzed whey protein
Peptamen Junior® 1.5 (Nestlé Nutrition) 1.5 45 gm -- 77%Enzymatically hydrolyzed whey protein
Peptamen Junior with Fiber® (Nestlé Nutrition) 1 30 gm 7.2 gm 84%Enzymatically hydrolyzed whey protein
Peptamen Junior® with Prebio™ (Nestlé Nutrition) 1 30 gm -- 84%
Pediatric Peptinex DT (Nestlé Nutrition) 1 30 gm -- 85%Protein source is casein hydrolysate (milk) and free amino acids
Vivonex Pediatric® (Nestle Nutrition) 0.8 24 gm -- 89%Amino acid-based, not hypoallergenic
Neocate One+ (SHS North America) 1 2.5 gm/100 kcal -- --Amino acid-based, hypoallergenic35% fat from MCT, 65% from LCT, 32% kcal from fat
Neocate Junior, unflavored (SHS North America) 1 2.2 gm/100kcal -- --Amino acid-based, hypoallergenic35% fat from MCT, 65% from LCT, 45% kcals from fat
E028 Splash (SHS North American) 1 2.5 gm/100 kcal -- --Amino acid-based, hypoallergenicAvailable as 237 mL drink boxFlavors: grape, tropical fruit, orange-pineappleSame profile as Neocate One+ powder
Appendix #9, cont.
Child and Adolescent Enteral Products

198©
2009
Nut
ritio
n D
imen
sion
, Inc
.
Appendix #9, cont.
Resource Beneprotein (Novartis) Available as powder only 100% whey protein, lactose-free
7.0 gm(1 Scoop or 1 Packet) 100 gm
Calories (kcal) 25 357Protein (gm) 6 86Fat (gm) 0 0
Saturated Fat (gm) 0 0 Trans Fat (gm) 0 0
Carbohydrate (gm) 0 0Sodium (mg) 15 215Potassium (mg) 35 500Calcium (mg) 30 430Phosphorus (mg) 15 215
Polycose Glucose Polymers (Ross/Abbott Nutrition) Available as powder only in 12.3 oz cans• Easily digestible source of carbohydrate calories• Mixes easily with regular foods and beverages• For oral or tube feeding• Lactose and gluten free
It is not intended to be used as a sole-source nutritional product because it contains no protein, fat, orvitamins and very low levels of minerals.
Modular Supplements
Caloric Yield of Various Amounts of Polycose
Polycose Powder Calories(tablespoons)
2 464 928 184
16 36824 55232 736
Approximate Caloric Equivalents
Powder
1 level tsp (2 gm) = 8 Cal1 level tbsp (6 gm) = 23 Cal
1/4 c (25 gm) = 95 Cal1/3 c (33 gm) = 125 Cal1/2 c (50 gm) = 190 Cal1 c (100 gm) = 380 Cal

199©
2009
Nut
ritio
n D
imen
sion
, Inc
.
Vegetable Oil:Caloric Density: Approximately 8 kcal/mL100% fat
Microlipid (Novartis):100% Fat (Source: Safflower Oil)Caloric Density: 4.5 cal/mLWater Content: 45 gm/100 mLLactose free, gluten free
MCT Oil (Novartis):This product is modular source of MCT for patients unable to digest or absorb conventional fats.MCT are more readily hydrolyzed and absorbed than long-chain fatty acids. MCT require less enzymes andbile acids for digestion than long-chain fatty acids.kcal/mL: 7.7 (or 8.3 kcal/g)100% FatSource of Oil: coconut oillactose-free*, kosher
Increasing caloric density of breast milk:Human milk fortifier can be added to breast milk feedings for premature infants requiring additionalcalories, protein, calcium, and phosphorus.1 packet per 50 mL = 22 calories/ounce1 packet per 25 mL = 24 calories/ounce
**At 24 calories/ounce, the osmolality of the breast milk will increase by 60 mOsm/kg.
See Altering Formula Concentrations earlier in Appendix #11.
Modular Supplements
Appendix #9, cont.

200©
2009
Nut
ritio
n D
imen
sion
, Inc
.
Appendix #10
Arm Anthropometry Nomogram for Children
27.0
26.0
25.0
24.0
23.0
22.0
21.0
20.0
19.0
18.0
17.0
16.0
15.0
14.0
13.0
12.0
11.0
10.0
9.0
8.0
58.056.054.052.050.048.046.044.042.040.038.036.034.032.030.028.026.024.0
22.0
20.0
18.0
16.0
14.0
12.0
10.0
8.0
6.0
Armarea(cm2)
Armcircumference
(cm)
Tricepsfatfold(mm)
2
4
6
8
10
12
14
16
18
20
22
24
26
28
30
32
26.0
24.0
22.0
20.0
18.0
16.0
14.0
12.0
10.0
8.0
6.0
4.0
52.048.044.040.0
36.0
32.0
28.0
24.0
20.0
16.0
12.0
8.0
4.0
2.0
Armmuscle
circumference(cm)
Armmusclearea(cm2)
To obtain muscle circumference:1. Lay ruler between values of arm circumference and fatfold.2. Read off muscle circumference on middle line.
To obtain tissue areas:1. The arm areas and muscle areas are alongside their perspective circumferences.2. Fat area = arm area – muscle area.
Source: American Journal for Clinical Nutrition 26, Sept. 1973.

201©
2009
Nut
ritio
n D
imen
sion
, Inc
.
Appendix #11
Infants0-6 mo 400* 40* 5* 4* 2.0* 0.2* 0.3* 2* 0.1* 65* 0.4* 1.7* 5* 125*
7-12 mo 500* 50* 75* 5* 2.5* 0.3* 0.4* 4* 0.3* 80* 0.5* 1.8* 6* 150*Children
1-3 yr 300 15 5* 6 30* 0.5 0.5 6 0.5 150 0.9 2* 8* 200*4-8 yr 400 25 5* 7 55* 0.6 0.6 8 0.6 200 1.2 3* 12* 250*Males
9-13 yr 600 45 5* 11 60* 0.9 0.9 12 1.0 300 1.8 4* 20* 375*14-18 yr 900 75 5* 15 75* 1.2 1.3 16 1.3 400 2.4 5* 25* 550*19-30 yr 900 90 5* 15 120* 1.2 1.3 16 1.3 400 2.4 5* 30* 550*31-50 yr 900 90 5* 15 120* 1.2 1.3 16 1.3 400 2.4 5* 30* 550*51-70 yr 900 90 10* 15 120* 1.2 1.3 16 1.7 400 2.4h 5* 30* 550*
> 70 yr 900 90 15* 15 120* 1.2 1.3 16 1.7 400 2.4h 5* 30* 550*Females
9-13 yr 600 45 5* 11 60* 0.9 0.9 12 1.0 300 1.8 4* 20* 375*14-18 yr 700 65 5* 15 75* 1.0 1.0 14 1.2 400i 2.4 5* 25* 400*19-30 yr 700 75 5* 15 90* 1.1 1.1 14 1.3 400i 2.4 5* 30* 425*31-50 yr 700 75 5* 15 90* 1.1 1.1 14 1.3 400i 2.4 5* 30* 425*51-70 yr 700 75 10* 15 90* 1.1 1.1 14 1.5 400 2.4h 5* 30* 425*
> 70 yr 700 75 15* 15 90* 1.1 1.1 14 1.5 400 2.4h 5* 30* 425*Pregnancy
≤18 yr 750 80 5* 15 75* 1.4 1.4 18 1.9 600j 2.6 6* 30* 450*19-30 yr 770 85 5* 15 90* 1.4 1.4 18 1.9 600j 2.6 6* 30* 450*31-50 yr 770 85 5* 15 90* 1.4 1.4 18 1.9 600j 2.6 6* 30* 450*
Lactation≤18 yr 1200 115 5* 19 75* 1.4 1.6 17 2.0 500 2.8 7* 35* 550*
19-30 yr 1300 120 5* 19 90* 1.4 1.6 17 2.0 500 2.8 7* 35* 550*31-50 yr 1300 120 5* 19 90* 1.4 1.6 17 2.0 500 2.8 7* 35* 550*
Dietary Reference IntakesRecommended Levels for Individual Intake (Vitamins)
Note: This table (taken from the DRI reports, seewww.nap.edu) presents Recommended DietaryAllowances (RDA) in bold type and AdequateIntakes (AI) in ordinary type followed by anasterisk (*). RDA are set to meet the needs ofalmost all (97-98%) individuals in a group. Forhealthy breastfed infants, the AI is the meanintake. The AI for other life stage and gendergroups is believed to cover needs of all individualsin the group, but lack of data or uncertainty in thedata prevent being able to specify with confidencethe percentage of individuals covered by thisintake.
a As retinol activity equivalents (RAE). 1 RAE = 1mcg retinol, 12 mcg β-carotene, 24 mcg α-carotene, or 24 mcg β-cryptoxanthin. To calculateRAE from RE of provitamin A carotenoids infoods, divide the REs by 2. For preformed vitaminA in foods or supplements and for provitamin Acarotenoids in supplements, 1 RE = 1 RAE.
b calciferol. 1 mcg cholecalciferol = 40 IU vitamin D.c In the absence of adequate exposure to sunlight.d As α-tocopherol. α-Tocopherol includes RR-α-
tocopherol, the only form of α-tocopherol thatoccurs naturally in foods, and the 2R-stereoisometric forms of α-tocopherol (RRR-,
RSR-, RRS-, and RSS-α-tocopherol) that occurin fortified foods and supplements. It does notinclude the 2S-stereoisomeric forms of α-tocopherol (SRR-, SSR-, and SSS-α-tocopherol, also found in fortified foods andsupplements.
e As niacin equivalents (NE). 1 mg niacin = 60 mgtryptophan; 0-6 months = preformed niacin (not NE).
f As dietary folate equivalent (DFE). 1 DFE = 1mcg food folate = 0.6 mcg folic acid fromfortified food or supplement consumed withfood = 0.5 mcg of supplemental taken on anempty stomach.
...continued on following page.
Life
-sta
ge g
roup
Vita
min
A (m
cg/d
)a
Vita
min
C (m
g/d)
Vita
min
D (m
cg/d
)b,c
Vita
min
E (m
g/d)
d
Vita
min
K (m
cg/d
)
Thia
min
(mg/
d)
Ribo
flavi
n (m
g/d)
Niac
ind (m
g/d)
Vita
min
B6 (m
g/d)
Fola
te (m
cg/d
)f
Vita
min
B12
(mcg
/d)
Pant
othe
nic
acid
(mg/
d)
Biot
in (m
cg/d
)
Chol
inef (m
g/d)
g
Food & Nutrition Board, Institute of Medicine - National Academy of Sciences

202©
2009
Nut
ritio
n D
imen
sion
, Inc
.
Infants0-6 mo 210* 0.2* 200* 0.01* 110* 0.27* 30* 0.003* 2* 100* 15* 2*
7-12 mo 270* 5.5* 220* 0.5* 130* 11* 75* 0.6* 3* 275* 20* 3Children
1-3 yr 500* 11* 340 0.7* 90 7 80 1.2* 17 460 20 34-8 yr 800* 15* 440 1* 90 10 130 1.5* 22 500 30 5
Males9-13 yr 1300* 25* 700 2* 120 8 240 1.9* 34 1250 40 8
14-18 yr 1300* 35* 890 3* 150 11 410 2.2* 43 1250 55 1119-30 yr 1000* 35* 900 4* 150 8 400 2.3* 45 700 55 1131-50 yr 1000* 35* 900 4* 150 8 420 2.3* 45 700 55 1151-70 yr 1200* 30* 900 4* 150 8 420 2.3* 45 700 55 11
> 70 yr 1200* 30* 900 4* 150 8 420 2.3* 45 700 55 11Females
9-13 yr 1300* 21* 700 2* 120 8 240 1.6* 34 1250 40 814-18 yr 1300* 24* 890 3* 150 15 360 1.6* 43 1250 55 919-30 yr 1000* 25* 900 3* 150 18 310 1.8* 45 700 55 831-50 yr 1000* 25* 900 3* 150 18 320 1.8* 45 700 55 851-70 yr 1200* 20* 900 3* 150 8 320 1.8* 45 700 55 8
> 70 yr 1200* 20* 900 3* 150 8 320 1.8* 45 700 55 8Pregnancy
≤18 yr 1300* 29* 1000 3* 220 27 400 2.0* 50 1250 60j 1219-30 yr 1000* 30* 1000 3* 220 27 350 2.0* 50 700 60 1131-50 yr 1000* 30* 1000 3* 220 27 360 2.0* 50 700 60 11
Lactation≤18 yr 1300* 44* 1300 3* 290 10 360 2.6* 50 1250 70 13
19-30 yr 1000* 45* 1300 3* 290 9 310 2.6* 50 700 70 1231-50 yr 1000* 45* 1300 3* 290 9 320 2.6* 50 700 70 12
Dietary Reference IntakesRecommended Levels for Individual Intake (Elements)
Note: This table (taken from the DRI reports, seewww.nap.edu) presents Recommended DietaryAllowances (RDA) in bold type and AdequateIntakes (AI) in ordinary type followed by anasterisk (*). RDA are set to meet the needs ofalmost all (97-98%) individuals in a group. Forhealthy breastfed infants, the AI is the meanintake. The AI for other life stage and gendergroups is believed to cover needs of all individualsin the group, but lack of data or uncertainty in thedata prevent being able to specify with confidencethe percentage of individuals covered by thisintake.
g Although AI have been set for choline, there arefew data to assess whether a dietary supply ofcholine is needed at all stages of the life cycle,and it may be that the choline requirement can bemet by endogenous synthesis at some of thesestages.
h Because 10-30% of older people may malabsorbfood bound with B12, it is advisable for those olderthan 50 years to meet their RDA mainly byconsuming foods fortified with vitamin B12 or a
supplement containing vitamin B12.i In view of evidence linking folate intake with
neural tube defects in the fetus, it is recom-mended that all women capable of becomingpregnant consume 400 mcg from supplementsor fortified foods in addition to intake of foodfolate from a varied diet.
i It is assumed that women will continueconsuming 400 mcg from supplements orfortified food until their pregnancy is confirmedand they enter prenatal care, which ordinarilyoccurs after the end of the periconceptionalperiod - the critical time for formation of theneural tube.
Life
-sta
ge g
roup
Calc
ium
(mg/
d)
Chro
miu
m (m
cg/d
)
Copp
er (m
cg/d
)
Fluo
ride
(mg/
d)
Iodi
ne (m
cg/d
)
Iron
(mg/
d)
Mag
nesi
um (m
g/d)
Man
gane
se (m
g/d)
Mol
ybde
num
(mcg
/d)
Phos
phor
us (m
g/d)
Sele
nium
(mcg
/d)
Zinc
(mg/
d)
Appendix #11, cont.
Food & Nutrition Board, Institute of Medicine - National Academy of Sciences

203©
2009
Nut
ritio
n D
imen
sion
, Inc
.
Appendix #11, cont.
0-6 mo NDe ND ND 25 0.7 ND ND ND ND7-12 mo ND ND ND 25 0.9 ND ND ND ND
1-3 yr 2.5 3 65 50 1.3 10 30 300 1.04-8 yr 2.5 3 110 50 2.2 15 40 400 1.0
9-13 yr 2.5 4 350 50 10 20 60 600 2.014-18 yr 2.5 4 350 50 10 30 80 800 3.019-70 yr 2.5 4 350 500 10 35 100 1000 3.5
> 70 yr 2.5 3 350 50 10 35 100 1000 3.5Pregnancy
≤ 18 yr 2.5 3.5 350 50 10 30 80 800 3.019-50 yr 2.5 3.5 350 50 10 35 100 1000 3.5
Lactation≤18 yr 2.5 4 350 50 10 30 80 800 3.0
10-50 yr 2.5 4 350 50 10 35 100 1000 3.5
Tolerable Upper Intake Levelsa
a UL = the maximum level of daily nutrient intakethat is likely to pose no risk of adverse effects.Unless otherwise specified, the UL representstotal intake from food, water, and supplements.Due to lack of suitable data, UL could not beestablished for thiamin, riboflavin, vitamin B12,pantothenic acid or biotin. In the absence of UL,extra caution may be warranted in consuminglevels above recommended intakes.
c The UL for magnesium represents intake from apharmacological agent only and does not includeintake from food and water.
d The UL for niacin and synthetic folic acid apply toforms obtained from supplements, fortified foods,or a combination of the two.
e ND: Not determinable due to lack of data ofadverse effects in this age group and concernwith regard to lack of ability to handle excessamounts. Source of intake should be from foodonly to prevent high levels of intake.
Life
-sta
ge g
roup
Calc
ium
(gm
/d)
Phos
phor
us (g
m/d
)
Mag
nesi
umc (m
g/d)
Vita
min
D (μ
g/d)
Fluo
ride
(mg/
d)
Niac
ind (m
g/d)
Vita
min
B6 (m
g/d)
Synt
hetic
folic
aci
dd
( μg/
d)
Chol
inef (g
m/d
)
Dietary Reference Intake (Total Fat)
a AI = Adequate Intake.b ND = not determined. The observed average or experimentally determined intake by a defined population or subgroup that appears to sustain a defined
nutritional status, such as growth rate, normal circulating nutrient values, or other functional indicators of health. The AI is used if sufficient scientific evidence isnot available to derive an Estimated Average Requirement (EAR). For healthy infants receiving human milk, the AI is the mean intake. The AI is notequivalent to an RDA.
AI (g/d)a
Life Stage Group Criterion Male Female0-6 mo Average consumption of total fat from human milk 31 317-12 mo Average consumption of total fat from human milk 30 30
and complementary foods1-3 yr NDb ND4-8 yr ND ND9-13 yr ND ND14-18 yr ND ND
Pregnancy14-18 yr ND ND
Lactation14-18 yr ND ND
Food & Nutrition Board, Institute of Medicine - National Academy of Sciences

204©
2009
Nut
ritio
n D
imen
sion
, Inc
.
Appendix #11, cont.
Dietary Reference Intake (Energy)by Active Individuals
a For healthy moderately active Americans and Canadiansb PAL = physical activity level, EER = estimated energy requirement, TEE = total energy expenditure. The intake that meets the average energy expenditure of
individuals at the reference height, weight, and age.
Active PALbEER (kcal/d)Life Stage Group Criterion Male Female
0-6 mo Energy expenditure plus energy deposition 570 520 (3 mo)7-12 mo Energy expenditure plus energy deposition 743 676 (9 mo)1-2 yr Energy expenditure plus energy deposition 1,046 992 (24 mo)3-8 yr Energy expenditure plus energy deposition 1,742 1,642 (6 yr)9-13 yr Energy expenditure plus energy deposition 2,279 2,071 (11 yr)14-18 yr Energy expenditure plus energy deposition 3,152 2,368 (16 yr)
Pregnancy14-18 yr Adolescent female EER plus change in TEE
1st trimester plus pregnancy energy deposition 2,368 (16 yr)2nd trimester 2,708 (16 yr)3rd trimester 2,820 (16 yr)
Lactation Adolescent female EER plus milk energy1st 6 mo output minus weight loss 2,698 (16 yr)2nd 6 mo 2,768 (16 yr)
Dietary Reference Intake (Carbohydrate)
a EAR = Estimated Average Requirement. The intake that meets the estimated nutrient needs of half of the individuals in a group.b RDA = Recommended Dietary Allowance. The intake that meets the nutrient need of almost all (97-98 percent) of individuals group.c AI = Adequate Intake. The observed average or experimentally determined intake by a defined population or subgroup that appears to sustain a defined
nutritional status, such as growth rate, normal circulating nutrient values, or other functional indicators of health. The AI is used if sufficient scientific evidence isnot available to derive an EAR. For healthy infants receiving human milk, the AI is the mean intake. The AI is not equivalent to an RDA.
EAR (gm/d)a RDA (gm/d)b
Life Stage Group Criterion Male Female Male Female AI (gm/d)c
0-6 mo Average content of human milk 607-12 mo Average intake from human milk plus complementary foods 951-3 yr Extrapolation from adult data 100 100 130 1304-8 yr Extrapolation from adult data 100 100 130 1309-13 yr Extrapolation from adult data 100 100 130 13014-18 yr Extrapolation from adult data 100 100 130 130
Pregnancy14-18 yr Adolescent female EAR plus fetal
brain glucose utilization 135 175Lactation Adolescent female EAR plus average
human milk content of carbohydrate 160 210
Food & Nutrition Board, Institute of Medicine - National Academy of Sciences

205©
2009
Nut
ritio
n D
imen
sion
, Inc
.
Appendix #11, cont.
Dietary Reference Intake (Fiber)
a AI = Adequate intake. Based on 14 gm/1,000 kcal of required energy.b ND = not determined. The observed average or experimentally determined intake by a defined population or subgroup that appears to sustain a defined
nutritional status, such as growth rate, normal circulating nutrient values, or other functional indicators of health. The AI is used if sufficient scientificevidence is not available to derive an Estimated Average Requirement (EAR). For healthy infants receiving human milk, the AI is the mean intake. The AIis not equivalent to an RDA.
AI (gm/d)a
Life Stage Group Criterion Male Female0-6 mo NDb ND7-12 mo ND ND1-3 yr Intake level shown to provide the greatest protection 19 19
against coronary heart disease (14 gm/1000 kcal) xmedian energy intake level (kcal/1,000 kcal/d)
4-8 yr Intake level shown to provide the greatest protection 25 25against coronary heart disease (14 gm/1,000 kcal) xmedian energy intake level (kcal/1,000 kcal/d)
9-13 yr Intake level shown to provide the greatest protection 31 26against coronary heart disease (14 gm/1,000 kcal) xmedian energy intake level (kcal/1,000 kcal/d)
14-18 yr 38 36Pregnancy
14-18 yr Intake level shown to provide the greatest protection 28against coronary heart disease (14 gm/1,000 kcal) xmedian energy intake level (kcal/1,000 kcal/d)
Lactation14-18 yr Intake level shown to provide the greatest protection 29
against coronary heart disease (14 gm/1,000 kcal) xmedian energy intake level (kcal/1,000 kcal/d)
Dietary Reference Intake(Ω-6 PUFA)(Linoleic Acid)
AI (gm/d)a
Life Stage Group Criterion Male Female0-6 mo Average consumption of total n-6 fatty acids 4.4 4.4
from human milk7-12 mo Average consumption of total n-6 fatty acids 4.6 4.6
from human milk and complementary foods1-3 yr Median intake of linoleic acid from CFSIIb 7 74-8 yr Median intake of linoleic acid from CFSII 10 109-13 yr Median intake of linoleic acid from CFSII 12 1014-18 yr Median intake of linoleic acid from CFSII 16 11
Pregnancy14-18 yr Median intake of linoleic acid from CFSII 13
Lactation14-18 yr Median intake of linoleic acid from CFSII 13
a AI = Adequate intake. The observed average or experimentally determined intake by a defined population or subgroup that appears to sustain a definednutritional status, such as growth rate, normal circulating nutrient values, or other functional indicators of health. The AI is used if sufficient scientificevidence is not available to derive an Estimated Average Requirement (EAR). For healthy infants receiving human milk, the AI is the mean intake. The AIis not equivalent to an RDA.
b CSFII = Continuing Survey of Food Intake by Individuals.Food & Nutrition Board, Institute of Medicine - National Academy of Sciences

206©
2009
Nut
ritio
n D
imen
sion
, Inc
.
Appendix #11, cont.
Dietary Reference Intake(Ω-3 PUFA)(ααααα-Linolenic Acid)
a AI = Adequate intake. The observed average or experimentally determined intake by a defined population or subgroup that appears tosustain a defined nutritional status, such as growth rate, normal circulating nutrient values, or other functional indicators of health. The AIis used if sufficient scientific evidence is not available to derive an Estimated Average Requirement (EAR). For healthy infants receivinghuman milk, the AI is the mean intake. The AI is not equivalent to an RDA.
b CSFII = Continuing Survey of Food Intake by Individuals.
AI (gm/d)a
Life Stage Group Criterion Male Female0-6 mo Average consumption of total n-3 fatty acids 0.5 0.5
from human milk7-12 mo Average consumption of total n-3 fatty acids 0.5 0.5
from human milk and complementary foods1-3 yr Median intake of a-linolenic acid from CFSIIb 0.7 0.74-8 yr Median intake of a-linolenic acid from CFSII 0.9 0.99-13 yr Median intake of a-linolenic acid from CFSII 1.2 1.014-18 yr Median intake of a-linolenic acid from CFSII 1.6 1.1
Pregnancy14-18 yr Median intake of a-linolenic acid from CFSII 1.4
Lactation14-18 yr Median intake of a-linolenic acid from CFSII 1.3
Dietary Reference Intake (Protein)
AI or RDA for Reference Individual(gm/day) EAR (gm/kg/d)a RDA (gm/kg/d)b AI
Life Stage Group Criterion Male Female MaleFemale MaleFemale (gm/kg/d)c
0-6 mo Average consumption 9.1 (AI) 9.1 (AI) 1.52of protein from human milk
7-12 mo Nitrogen equilibrium 13.5 13.5 1.1 1.1 1.5 1.5+ protein deposition
1-3 yr Nitrogen equilibrium 13 13 0.88 0.88 1.10 1.10+ protein deposition
4-8 yr Nitrogen equilibrium 19 19 0.76 0.76 0.95 0.95+ protein deposition
9-13 yr Nitrogen equilibrium 34 34 0.76 0.76 0.95 0.95+ protein deposition
14-18 yr Nitrogen equilibrium 52 46 0.73 0.71 0.85 0.85+ protein deposition
a EAR = Estimated Average Requirement. The intake that needs the estimated nutrient needs of half of the individuals in a groupb RDA = Recommended Dietary Allowance. The intake that meets the nutrient need of almost all (97-98%) of individuals in a group.c AI = Adequate intake. The observed average or experimentally determined intake by a defined population or subgroup that appears to sustain a defined
nutritional status, such as growth rate, normal circulating nutrient values, or other functional indicators of health. The AI is used if sufficient scientific evidence isnot available to derive an Estimated Average Requirement (EAR). For healthy infants receiving human milk, the AI is the mean intake. The AI is notequivalent to an RDA.
d The EAR and RDA for pregnancy are only for the second half of pregnancy. For the first half of pregnancy the protein requirements are the ame as those of thenonpregnant woman.
e In addition to the EAR and RDA of the nonlactating adolescent or woman.

207©
2009
Nut
ritio
n D
imen
sion
, Inc
.
Appendix #12
Increasing Caloric Density of Formulas1. Concentrating formulas to 24 kcal/oz:
Formula type and amount H20 final volumeLiquid concentrate, 13 oz 8-9 oz 21-22 oz
Ready to feed, 32 oz No H20 33-34 oz+ 3 1/3 scoops ofpowdered formula
Powdered formula*± 3 scoops 5 oz15 scoops 25 oz
* Powdered formula displaces volume when mixing. Mix to a final volume goal for accuracy in devising arecipe. For ease of mixing, start with a small amount of water and add the formula. Mix well and whenbubbles settle, add water to final volume desired.± Most powdered formulas are 40-44 kcal/scoop. New formulas such as Carnation Good Start andNeocare have different scoop sizes or concentration from standard formulas. Read the manufacturer’sinstructions to assure accurate mixing.
2. To concentrate formulas to greater than 24 kcal/oz: Use carbohydrate or fat modules to increasecalories while avoiding risk of dehydration from a high renal solute load.
Carbohydrate Additives: Fat Additives: Combination carbohydrateSugar: 16 kcal/tsp Vegetable oil: 40-45 kcal/tsp and fat modules:Corn syrup: 20 kcal/tsp Microlipid: 4.5 kcal/cc Product 80056: 49 kcal/tbspPolycose liquid: 2 kcal/cc MCT oil: 7.7 kcal/cc (580 kcal/100 gm)Polycose powder: 23 kcal/tbsp Pro-phree: 44 kcal/tbspModucal powder: 10 kcal/tsp (520 kcal/100 gm)
Examples of concentrated formulas:
26 kcal/oz formula:12 scoops of Prosobee powder1 tbsp + 2 tsp Polycose powderAdd H20 to make total volume of 20 ozProvides 520 kcal (26 kcal/oz) +
14.4 gm of protein (0.72 gm protein/oz)11% kcal from protein45 % kcal from carbohydrate44% kcal from fat
30 kcal/oz formula:20 scoops of Pregestimil powder35 ml of Polycose liquid12 ml of MCTAdd H20 to total volume of 32 ozProvides 962 kcal (30 kcal/oz) +
22.5 gm of protein (0.7 gm protein/oz)9% kcal from protein40% kcal from carbohydrate51% kcal from fat
28 kcal/oz formula:13 oz of Enfamil w/Iron liquid concentrate3 tbsp & 2 tsp of Product 80056Add H20 to a total volume of 24 ozProvides 700 kcal (28 kcal/oz) +
11.7 gm of protein (0.5 gm protein/oz)7% kcal from protein45% kcal from carbohydrate48% kcal from fat

208©
2009
Nut
ritio
n D
imen
sion
, Inc
.
Appendix #13
High Calorie StrategiesEat small frequent mealsLimit foods and beverages low in calories and nutrientsMake food presentation fun for children
Supermilk: mix 1 cup of powdered milk and 1 quart whole milkSupershakes:
Add ice cream, frozen yogurt or sherbetMake with supermilk, half and half or heavy creamAdd Instant Breakfast®, chocolate syrup or powder, fresh fruitTry pasteurized or liquid egg substitute
Fruit Smoothies:Fruit flavored yogurtFresh or canned fruitMilk or juicePowdered milkIce cream, frozen yogurt or sherbet
High Calorie FoodsFruits
Canned in heavy syrupAvocadoDried fruits as snacksNectars instead of juices
Peanut butterUse liberally on toast, crackers, pancakes, waffles, french toastMix into hot foods such as hot cereal, potatoes, pasta, gritsMix in supershakesUse as a dip for vegetables or fruit
SandwichesUse mayonnaiseAdd avocadosAdd extra butter/margarine and cheese to grilled sandwiches
EggsAdd sour cream or half and half to scrambled eggsAdd cheese to omeletes or scrambled eggsCombine eggs with ground meatAdd extra yolks to French toast and when preparing baked goodsUse beaten eggs to dip chicken, fish, etc. for breading
MiscellaneousHigh fat granolasAdd extra margarine to vegetables, casseroles, toast and other foodsFruit with cottage cheeseTry trail mix, chex mix, nuts for snacksGraham crackers with peanut butter and honey

209©
2009
Nut
ritio
n D
imen
sion
, Inc
.
Resources for Nutritional Informationon Baby Foods
United States Department of Agriculture Nutrient Databasehttp://www.nal.usda.gov/fnic/foodcomp/search/
Bowes and Church Food Values of Portions Commonly Usedby Jean AT Pennington and Judith S. DouglassPublisher: Lippincott Williams & Wilkins; 18th edition (March 1, 2004)
GerberThe nutritional information for the Gerber products is not listed on the Gerber website, but can beobtained by contacting customer service with a request for nutritional information on a specific product.www.gerber.com/contactus
Beech Nutwww.beechnut.com/Our%20Baby%20Food/index.asp
Earth's Best Organicwww.earthsbest.com/products/index_infant.php
Heinz Babywww.heinzbaby.com/english/products
Resources for appropriate foods and textures for each phase of development can be found at:www.gerber.com/fptimelinewww.beechnut.com/images/solic_advice.pdfwww.heinzbaby.com/english/pdfs/Heinz_Starting_Right_Guide.pdf
Sample menus based on a baby's developmental phase are available at:www.gerber.com/fpmenus
Link from Manitobe Health (Canada) with PDF files for information on Breastfeeding, infant formula,and introduction of solids:
www.gov.mb.ca/health/nutrition/resources.htmlwww.happybabyfood.com
PDF files can be found under the "Health + Happiness" link.Under the "VITAL NUTRITION: TIPS + CHARTS" section, information on the following topics can be found:
- Nutritional Needs: Ages + Stages- Month-by-Month Guide to New Foods- Introducing Solids: 4 to 6 Months- Beyond Solids
Appendix #14

210©
2009
Nut
ritio
n D
imen
sion
, Inc
.
Initiation and Advancement ofPediatric Parenteral Nutrition
Appendix #15
Initial Advance By Goals
Infants (<1 year) Preterm Term Preterm Term General MAX
Kcal (kcal/kg/day) 27-34 – – – 80-110 –
Protein (gm/kg/day) 1.5-3.0 1.5-3.0 1.0 1.0 1.5-3.0 3-4
CHO 5-7 6-9 1.0 or 1.0-2.0 or 4-14 13-16(mg/kg/min) 2.5% 2.5-5.0%
Dextrose/day Dextrose/day
Fat (gm/kg/day) 1.0-2.0 1.0-2.0 0.5-1.0 0.5-1.0 0.5-3.0 3-4(0.17 gm/
kg/hr)
Children (1-10 years)
Kcal (kcal/kg/day) – – 60-90
Protein (gm/kg/day) 1.0-2.0 1.0 1.5-3.0
CHO 10% Dextrose 5%/day 5.5-14(mg/kg/min)
Fat (gm/kg/day) 1.0-2.0 0.5-1.0 2.0-3.0 (MAX is 4)
Adolescents
Kcal (kcal/kg/day) – – 30-75
Protein (gm/kg/day) 0.8-1.5 1.0 0.8-2.5
CHO 3.5 or 10% 1.0-2.0 or 5-10% 3.5-12(mg/kg/min) Dextrose Dextrose/day
Fat (gm/kg/day) 1.0 1.0 1.0-2.5
* General recommendations for PN are 8-15% of calories as proteins, 45-60% carbohydrate, and 25-40%fat.
* For EN/PN combined, when EN meets 50% of needs, start tapering PN (1 ml per ml); when EN meets75% of needs, taper until PN is discontinued.

211©
2009
Nut
ritio
n D
imen
sion
, Inc
.
Comparison of Various Pediatric AA SolutionsTen percent pediatric amino acid formulations
Company B. Braun (McGaw), Hospira (Abbott), Baxter,Bethlehem, PA Abbott Park, IL Deerfield, IL
Product TrophAmine Aminosyn PF PremaSolIntroduction date (FDA approval date) July 20, 1984 Sept. 6, 1985 June 23, 2003Amino acid content (gm/100mL)Essential amino acids
Isoleucine 0.820 0.760 0.820Leucine 1.400 1.200 1.400Lysine 0.820 0.677 0.820
(added as lysine acetate) 1.200 -- --Methionine 0.340 0.180 0.340Phenylalanine 0.480 0.427 0.480Threonine 0.420 0.512 0.420Tryptophan 0.200 0.180 0.200Valine 0.780 0.673 0.780Cysteine <0.016 -- <0.016
(as cysteine HCI H2O) <0.024 -- --Histidine 0.480 0.312 0.480Tyrosine 0.240 0.044 0.240
(added as tyrosine 0.044 -- --and N-acetyl-L-tyrosine) 0.240 -- --
Nonessential amino acidsAlanine 0.540 0.698 0.540Arginine 1.200 1.227 1.200Proline 0.680 0.812 0.680Serine 0.380 0.495 0.380Glycine 0.360 0.385 0.360L-Aspartic acid 0.320 0.527 0.320L-Glutamic acid 0.500 0.820 0.500Taurine 0.025 0.070 0.025
Sodium metabisulfite NF (as an antioxidant) <0.050 0 0pH adjusted with glacial acetic acid USP
pH: Average and (range) 5.5 (5.0-6.0) 5.5 (5.0-6.5) 5.5 (5.0-6.0)Calc. osmolarity (mOsmol/L) 875 788 865Total amino acids (gm/L) 100 100 100Total nitrogen (gm/L) 15.5 15.2 15.5Protein equivalent (gm/L) 97 100 --
Electrolytes (mEq/L)Sodium 5 None --Acetate 97 46 94Chloride <3 None <3
Appendix #16

212©
2009
Nut
ritio
n D
imen
sion
, Inc
.
Appendix #17
Common Congenital Cardiac Defects
Defect Description Symptoms/treatment Growth implications
Patent ductusarteriosis
Ventricular septaldefect (VSD)
Transposition of thegreat arteries (TGA)
Pulmonary stenosis
Aortic stenosis
Tricuspid atresia
Atrial septal defect(ASD)
Aorta coarctation
Tetralogy of Fallot
Hypoplastic left heartsyndrome (HLHS)
Failure of contraction ofductus arteriosis thatconnects the pulmonaryartern and aorta
Abnormal connectionbetween ventricles,allowing blood flowbetween them
Two parallel and sepa-rate circulatory systemsexist, one pulmonaryand one systemic
Obstruction to rightventricular outflow
Obstruction to leftventricular outflow
Absent atrioventricularconnection
Abnormal connectionbetween 2 atria persistsafter birth
Narrowing of aortabeyond left subclavianartery
Right ventricular outflowobstruction and VSD
Absence or severehypoplasia of some or allleft-sided heart struc-tures
Heart murmur/fluid restric-tion, pharmacologicclosure, surgical ligation
Congestive heart failure/surgical closure
Cardiomegaly, cyanosis/arterial switch
Variable presentation/valvectomy
Variable presentation/valvectomy
Slightly increased heartsize/staged surgical repair
Asymptomatic or mildrespiratory symptoms/direct closure of defect,patch graft
Elevated upper extremityblood pressure, congestivefailure/medical manage-ment, balloon angioplastyor surgical repair
Cyanosis, dyspnea/primaryrepair
Respiratory distress,pallor, congestive failure/3stage Norwood’s proce-dures, cardiac transplanta-tion
Weight adversely affectedprior to duct closure.
Large VSD is associated withsevere growth failure
Growth retardation in a thirdto half of patients
Normal growth unless defectis severe
Growth failure in 16% ofpatients
40% of children have weightand height growth retardation
Weight gain is poor if lesionis severe
Growth normal with minordefect
Moderate growth failure,primarily in weight
Early mortality (before recentsurgical procedures) pre-cluded observations ofgrowth; Recent post: surgicalobservations indicate weightgain is improved with aggres-sive nutrition interventions
Adapted from: Groh-Wargo S, Thompson M, Cox J, Eds. Nutritional Care for HighRisk Newborns, Revised, 3rd edition. Chicago IL: Precept Press, 2000.

213©
2009
Nut
ritio
n D
imen
sion
, Inc
.
Appendix #18
Generic Name Brand Name Concentration Manufacturer mOsm/kg
Caffeine citrate Generic 10 mg/1 ml Armend/CHOP* 89solution
Calcium carbonate Generic 500 mg/5 ml Ca Roxane 3140suspension†
Calcium glubionate Neo-Calglucon 1.8 gm/5 ml Sandoz 2043syrup
Cisapride suspension Propulsid 1 mg/1 ml Janssen/CHOP* 4323
Dexamethasone Generic 1 mg/1 ml Roxane 10,737solution
Ergocalciferol Calciferol 8000 U/1 ml Schwarz Pharma 16,2777solution
Ferrous sulfate Generic 25 mg/1 ml Barre 4587drops
Furosemide Lasix 10 mg/1 ml Hoechst 4037solution†
Multivitamin Poly-vi-sol NA Mead-Johnson 11,173solution†
Phenobarbital Generic 4 mg/1 ml Rugby 7417
Ranitidine syrup† Zantac 15 mg/1 ml G. Wellcome 2360
Theophylline Generic 2 mg/1 ml Roxane/CHOP* 28solution†
Vitamins ADC Tri-vi-sol NA Mead-Johnson 7010solution†
Vitamin E drops† Aquasol E 50 mg/1 ml Astra 4083
* Children’s Hospital of Philadelphia (CHOP) formulation† Measurements performed with medication/supplement diluted 10-fold
Osmolality of Selected Medicationsand Vitamin/Mineral Supplements

214©
2009
Nut
ritio
n D
imen
sion
, Inc
.
Appendix #19
Increasing Caloric Density ofFormulas and Breast Milk
The standard caloric concentration of breast milk and infant formulas is 20 calories/ounce. However, someinfants may benefit from an increase in caloric density and possible reasons for this include the following:
• Fluid restriction• Inadequate growth or weight gain• Increased calorie and protein needs due to increased energy expenditure (BPD, CHD, etc)
It is generally a safe practice to concentrate infant formulas to 24 cal/oz by adding less water to formulapowder or concentrate, rather than using a carbohydrate or fat modular product. When concentrating aformula to greater than 24 cal/oz using formula alone, the increase in renal solute load and osmolality is ofconcern. In some instances, however, this technique would not be medically appropriate (e.g., extremelyelevated creatinine level, intolerance to increased renal solute load).
Recipes for 22 cal/oz infant formulas, using most standard infant formulas:13-oz liquid concentrate + 11-oz water, or1 cup powdered formula + 20-oz water
Recipes for 24 cal/oz infant formulas, using most standard infant formulas:13-oz liquid concentrate + 9-oz water, or1 cup powdered formula + 18.5-oz water
Some infants may tolerate an increase in caloric density to 26 to 30 cal/oz by using the method mentionedabove, but this should be done with caution.
Typically, if caloric concentration greater than 24 cal/oz is needed, modular lipids can be added (i.e. vegetableoil, MCT oil, or Microlipid) as appropriate to achieve a 26 to 27 cal/oz final product. If it is necessary toconcentrate a formula from 26 or 27 cal/oz to 29 or 30 cal/oz, it is then recommended to add a carbohydrate-based modular (i.e. Polycose). Modulars do not contribute significantly to renal solute load, and fat modularsdo not increase osmolarity. It is not recommended to exceed 30 cal/oz concentration.
On average, powdered formula displaces 0.7 mL/gm
SterilewareBel-Art Products1-800-4BEL-ARTwww.belart.comMeasurements in partial and full teaspoon units:www.belart.com/cat/samplehandling/en/367230000.aspMeasurements in less than 1 mL units:www.belart.com/cat/samplehandling/en/367210005.asp
National Measures7920 W. 215th St.Lakeville, MN 55044Fax: 952-469-20511-800-328-4577Phone: 952-469-4977Email: [email protected]/productguide.php
Seedman.com/Rachel’s Supply3421 Bream St.Gautier, MS 39553228-497-5488Phone not availablewww.rachelssupply.com/measuringspoons.htm
Apothecary Products, Inc.11750 12th Ave. SouthBurnsville, MN 55337-1295Fax (toll-free): 1-800-328-1584To Order: 1-888-770-8767
[email protected] Service: 1-800-328-2742
[email protected]://apothecaryproducts.dirxion.com/Main.asp
Disposable Teaspoons for NICU

215©
2009
Nut
ritio
n D
imen
sion
, Inc
.
Appendix #19, cont.
Altering Formula Concentrations*
*This does not apply to premature formulas or Neocate Infant formula.
Concentration and Dilution of Powdered Infant FormulasSmall Quantities Per Quart
Desired Caloric Powdered Formula Add Water Powdered Formula WaterConcentration (1Tbsp) to make this Formula (oz)
(kcal/oz) final volume (oz) (Tbsp)
10 1 4 8 [1/2 cup]
15 3 8 12 [3/4 cup]
20 1 2 16 [1 cup]
24 3 5 19 [1 cup + 3 Tbsp]
27 2 3 22 [11/3 cup]
30 3 4 24 [11/2 cup]
(Note: Powdered infant formulas are on average 40 kcal/level, Tbsp – where 1 Tbsp = 1 scoop)
Add enoughwater to
prepare a finalvolume of one
quart
Concentration and Dilution of Infant Formula ConcentratesPer Feeding Per Can of Concentrate
Desired Caloric Liquid Formula Water Liquid Formula WaterConcentration Concentrate (oz) Concentrate (oz)
(kcal/oz)
10 1 3 13 39
15 1.5 2.5 13 21
20 1 1 13 13
24 3 2 13 8.5
26 - 27 3 1.5 13 6.5
28 - 29 5 2 13 5
30 3 1 13 4.5
(Note: Liquid formula concentrates are 40 kcal/oz)

216©
2009
Nut
ritio
n D
imen
sion
, Inc
.
Appendix #19, cont.
Concentrating Breast Milkwith Formula Concentrate
22 kcal/oz (0.736 kcal/mL)Add 10 mL formula concentrate per 90 mL FT breast milk
22.5 kcal/oz (0.75 kcal/mL)Add 12 mL formula concentrate per 90 mL FT breast milk
23 kcal/oz (0.764 kcal/mL)Add 14 mL formula concentrate per 90 mL FT breast milk
23.5 kcal/oz (0.78 kcal/mL)Add 17 mL formula concentrate per 90 mL FT breast milk
24 kcal/oz (0.8 kcal/mL)Add 21 mL formula concentrate per 90 mL FT breast milk
24.5 kcal/oz (0.818 kcal/mL)Add 24 mL formula concentrate per 90 mL FT breast milk
25 kcal/oz (0.84 kcal/mL)Add 29 mL formula concentrate per 90 mL FT breast milk
25.5 kcal/oz (0.85 kcal/mL)Add 32 mL formula concentrate per 90 mL FT breast milk
26 kcal/oz (0.866 kcal/mL)Add 36 mL formula concentrate per 90 mL FT breast milk
26.5 kcal/oz (0.883 kcal/mL)Add 41 mL formula concentrate per 90 mL FT breast milk
27 kcal/oz (0.9 kcal/mL)Add 47 mL formula concentrate per 90 mL FT breast milk
28 kcal/oz (0.931 kcal/mL)Add 57 mL formula concentrate per 90 mL FT breast milk
29 kcal/oz (0.963 kcal/mL)Add 70 mL formula concentrate per 90 mL FT breast milk
Key: 30 mL liquid concentrate = 40 kcal (on average)

217©
2009
Nut
ritio
n D
imen
sion
, Inc
.
Appendix #20
Guidelines for Infant Formula Preparationand Handling of Breast Milk in the HospitalThis resource should not be considered a list of requirements for hospitals that provide care for infants and children;however, these are recommendations intended to minimize patient exposure to bacterial contaminants.
This appendix is a summary of pertinent information found in the following reference:Robbins ST and Beker LT, eds. Infant Feedings: Guidelines for Preparation of Formula and Breastmilk in HealthcareFacilities. Chicago: American Dietetic Association, 2004.
Facilities: If infant formula is prepared on-site, a separate room should be provided for this task. This area should bephysically separate from the direct patient care areas, be separate from the storage and anteroom areas, and used solelyfor the preparation and handling of infant formula, breast milk and enteral feedings.
• The design for the room should support use of aseptic technique.• A hand washing sink with either foot pedal controls or an auto-sensor should be provided.• Access to the formula preparation area should be limited.• A clean air supply with an appropriate pressure gradient is necessary.• It is important to provide an area for staff to perform administrative duties (label preparation, etc).• A sufficient number of electrical outlets should be provided.• These areas should be made of materials that are easily maintained and cleaned: floor, walls and ceiling.• Lighting should be sufficient.
Equipment utensils and supplies: These items should meet all regulations of local/national health regulations andsanitary codes.• Stainless steel hand-held whisks or hand-held mixers with removable beater/whisk are acceptable. Food-grade plastic
cylinders are also safe for use.• A commercial dishwasher should be utilized, for use exclusively for the formula preparation equipment, for sanitization
of small equipment and utensils.• Scoops provided by the manufacturers should not be utilized for formula preparation in the hospital, due to variability. A
gram scale should be utilized instead.• Preventative and corrective maintenance of equipment should be in place and documented.• Refrigerators should be maintained at 35 to 40°F. Refrigeration equipment should be adequate enough to cool prepared
formulas to 40°F within one hour of preparation. Fresh human milk can be safely stored in the refrigerator for 48 hours.Fortified breast milk can be safely stored in the refrigerator and used within 24 hours of fortification.
• Freezers intended for breast milk should be maintained at -4°F or less. To avoid accidental thawing of breast milk, alarmsshould be available to alert if the equipment’s temperature goes above a certain threshold. Frozen breast milk can besafely stored in a home freezer for up to three months, and in a deep freezer (-4°F) for up to twelve months.
• Supplies should be ample enough to support the implementation and continuation of aseptic technique.• Single-use bottles and nipples are to be used, and these items should not be washed and reused. When no comparable
alternative product is available then the product can be reused.• Each mother’s expressed breast milk should be placed in a separate bin for storage in either the refrigerator or freezer, to
facilitate easy identification and to minimize risk of the incorrect infant receiving the breast milk.• Microwave ovens, garbage disposals and blenders are not recommended.• Cleaning supplies should be stored separately from formula products.• Cleaning supplies should be provided for exclusive use of the formula preparation area, to avoid cross-contamination.• Chilled, sterile water should be used for formula preparation.• Prepared formula should be transported for delivery in equipment that can maintain the formula temperature at less than
40°F.• Trash containers should each have a lid, and be opened by a foot pedal.• A laminar flow hood is optional, but use of this equipment does not replace aseptic technique.
Source: Robbins ST, Beker LT, ed. Infant Feedings: Guidelines for Preparation of Formula and Breastmilkin Health Care Facilities.American Dietetic Association, 2004.

218©
2009
Nut
ritio
n D
imen
sion
, Inc
.
Appendix #20, cont.
Formula Label Template
Patient name:________________________ MR #: ________________ Room: ________
Formula expiration date/time: ________________________________________________
Administration Route: ______________ Volume ________ mL Rate: ________ mL/hr
Frequency: _______________________________________________________________
Base formula: ____________________________________________________________
Nutrient additives: _________________________________________________________
_______________________________________________________________________
Final concentration: ____________ kcal/oz
Mixture contains: ____________ mL plus _____________ mL overfill
Date/time of expiration: _____________________________________________________
Name of ordering clinician: __________________________________________________
Keep refrigerated until ready to use. Shake well before using.
FOR ENTERAL USE ONLY
Staff: Minimum qualifications for staff who are responsible for formula preparation should include the following: ability toread, write and perform math at the high school level or above.
• A dress code should be developed to support maintenance of aseptic technique, including details addressing personalhygiene.
• A training policy should include the following components: orientation period of adequate length, continuous andconsistent training, and periodic evaluation of competency.
• Sufficient number of staff is needed to ensure timely preparation and delivery of formulas.
Formula Preparation and Handling: Written guidelines should be maintained regarding proper receiving and storage ofinfant formula products and ingredients.
• Expired or damaged products should be disposed of properly.• Storage areas should be maintained at a proper temperature, to maintain product integrity: between 32 and 95°F.• A process should be maintained for identifying and following-up when a product’s integrity is in question or the physical
appearance of a product is suspect.• Written guidelines should be maintained for ordering formulas, communicating formula orders to the formula room, and
maintaining order records for each patient.• Each prepared formula’s label should contain the following information: patient name, medical record number, location
in the hospital, formula name and any additives, caloric density, volume, feeding frequency, name of ordering clinician,date of order, and the date/time of expiration.
• When formula is being prepared, the doors to the preparation room should be closed and secured to ensure that noother activities will take place (e.g. cleaning).
• Aseptic technique should always be employed.

219©
2009
Nut
ritio
n D
imen
sion
, Inc
.
Appendix #20, cont.
Administration of feedings: Administration of fresh beast milk is preferred over frozen breast milk due to more activity ofimmunogical and digestive components.
• Frozen breast milk should be thawed in the chronological order in which it was expressed (i.e. use oldest milk first).Frozen breast milk can be placed in the refrigerator to thaw gradually, marked with an expiration date. A faster alterna-tive for thawing is to place the container of frozen breast milk under running water. Thawed breast milk needs to beused within 24 hours of the initiation of the thawing process.
• Fresh or thawed pasteurized donor breast milk should be stored in the refrigerator and administered within 48 hours.• Human milk fortifiers must be measured accurately. If the product is not commercially available in individual sterile
packaging, then the formula room should weigh, package and distribute the fortifier with aseptic technique.• Bolus feedings of breast milk is preferred, to minimize risk of bacterial growth and losses of fat.• Hang time should not exceed four hours, and the syringe and tubing must be changed every four hours when continu-
ous feedings regimens are utilized.• Any breast milk or formula remaining in the bottle (at the end of the oral feeding) or after one hour of the feeding
initiation must be discarded.• A procedure should be in place to address an instance where an infant receives milk from someone other than his own
mother (with the exception of donated, pasteurized breast milk).• Any supplies used for infant feedings should be stored in a secure area with limited access on the patient unit. Proper
refrigerator and freezer temperatures cited earlier also apply.• Formula and breast milk should be stored in separate refrigerators and freezers from food items.• If an infant is to be fed a prepared formula that is delivered in a large container, the formula needed for each feed should
be poured from the bulk container into a single use container on a clean, dry and sanitized surface. The label on theprepared formula should be verified and compared to the current diet order prior to the administration of each feeding.
• Feedings intended for continuous administration should never be warmed. Bolus or oral feedings should be warmed inless than fifteen minutes utilizing one of the following strategies: utilization of an electric warming unit or holding thecontainer under warm running water. Warming water should never reach the level of the nipple or the lid.
• Supplies used for tube feedings should be assembled and handled on a clean, dry and disinfected surface.• Aseptic technique should be used when filling, refilling or changing feeding containers. In the hospital, feeding syringes
and bags should not be reused.• Tubing should be flushed with sterile water or air after administration of intermittent feedings and medications.• Hang times in the NICU should be four hours (or less if indicated by the manufacturer).• Blue dye should never be added to enteral feedings.• A policy and procedure should be maintained discussing parental education on formula and/or fortified breast milk
preparation upon discharge.
Recommendations for Breast Milk Storagefor Hospitalized Infants
Storage Method Recommended Storage Time
Freezer (home unit) 3 monthsFreezer (-20°C / -4°F) 6-12 monthsFreezer (-70°C / -94°F) ≥12 monthsRefrigerator (4°C / 39°F) fresh milk 48 hoursRefrigerator (4°C / 39°F) thawed milk 24 hoursRefrigerator (4°C / 39°F) fortified milk 24 hoursCooler with ice packs (15°C / 59°F) fresh milk 24 hoursRoom temperature (25°C / 77°F) ≤ 4 hours

220©
2009
Nut
ritio
n D
imen
sion
, Inc
.
Infection Control Issues: Powdered formulas are not sterile; therefore, if an appropriate ready-to-feed product or liquidconcentrate is available, those products should be utilized preferentially.
• The Hazard Analysis Critical Control Points (HACCP) method should be applied to the preparation of infant formulas andenteral feedings.
• All infant formula containers should be inspected prior to use, and discarded if any of these factors are noted: currentdate is beyond the expiration date; the container is damaged, leaking or swollen.
• Once a formula container is opened for use, the contents should be inspected and discarded if the product seemsquestionable (e.g. smells rancid, color/consistency is unusual, lumpy or clumped powder, grainy liquid).
• The Centers for Disease Control (CDC) does not recommend performing routine sampling of formula to evaluate formicrobial contaminants, based on the fact that there is no evidence that this procedure influences the infection rate inhealthcare facilities.
Appendix #20, cont.
Bedside Hang-Time Practicesfor Infant Formulas
These guidelines are developed for pediatric formulas in the absence of any commercially sterile,ready-to-hang closed systems.
Hang Time at Room Frequency of Tubing Frequency of FeedingTemperature* Change Reservoir Change
(Hours) (Hours) (Hours)
Nutrition Neonates/ Infants/Peds: Neonates/ Infants/Peds: Neonates/ Infants/Peds:Source Immuno- Nonimmuno- Immuno- Nonimmuno- Immuno- Nonimmuno-
compromised compromised compromised compromised compromised compromisedInfants Infants Infants Infants Infants Infants
Sterile, 4 8 4 8 4 8ready-to-feed
Powdered 4 4 4 4 4 4formulas,concentratedliquidformulas,and nonsterileadditives
Expressed 4 4 4 4 4 4breast milk,includingw/sterileliquidadditives
Expressed 2-4 4 2-4 4 2-4 4breast milkw/addedpowderedfortifiers

221©
2009
Nut
ritio
n D
imen
sion
, Inc
.
Appendix #21
Newborn Screening andAssociated Nutritional Implications
Name [abbreviation] Category Medical nutrition therapy Vitamin cofactors/key(name of most common enzyme affected) (subgroup) (amino acid restricted) Medications
Argininosuccinic acidemia [ASA](argininosuccinic acid lyase)
Beta-ketothiolase deficiency [T2](acetyl-CoAacetyltransferase)
Biotinidase deficiency [ BIOT](biotinidase)Carnitine uptake defect [CUD](carnitine
transporter)Citrullinemia [CIT](argininosuccinic acid
synthetase)
Congenital adrenal hyperplasia [CAH]Congenital hypothyroidismCystic fibrosis [CF](CF conductance regulator)
Fatty acid oxidation: long-chain hydroxyacyl-CoA dehydrogenase deficiency [LCHAD]
Fatty acid oxidation: medium chain hydroxyacyl-CoA dehydrogenase deficiency [MCAD]
Fatty acid oxidation: very long-chain acyl-CoAdehydrogenase deficiency [VLCAD]
Galactosemia: classic (variant forms, 3 differentenzymes)
Glutaric acidemia [GA](type 1 glutaryl-CoAdehydrogenase and 2 )
3-Hydroxy 3-methyl glutaric acidemia [HMG] 3-hydroxy-3methylglutaryl-CoA (HMG-CoA)lyase deficiency
Hemoglobinopathies (four types)Homocystinuria [HCY](cystathionine beta-
synthase)Isovaleric acidemia [IVA](isovaleryl CoA
dehydrogenase)Maple syrup urine disease [MSUD](branched-
chain alpha-keto acid dehydrogenasecomplex)
Methymalonic acidemia [MMA](mutasedeficiency) and B12 disorders (many types)
Multiple carboxylase deficiency [MCD](3enzymes)
Phenylketonuria [PKU](phenylalanine hydroxy-lase) hyperphenylalaninemia (+6 biopterinenzymes)
Propionic acidemia [PA](propionyl-CoAcarboxylase)
Tyrosinemia types I [TYR](fumarylaceto-acetatehydrolase) and II (tyrosine transaminase)
Trifunctional protein deficiency [TFP](two genesin complex)
3-methylcrotonyl-CoA carboxylase deficiency[3MCC](3-methylcrotonyl-CoA carboxylase)
Protein (urea cycle)
Protein
Enzyme cofactorLipid/energy metabolism
Protein (urea cycle)
EndocrineEndocrinePulmonary/endocrine/GI
Lipid/energy metabolism
Lipid/energy metabolism
Lipid/energy metabolism
Carbohydrate
Protein
Protein/organic acids
Sickle cellProtein
Protein/organic acid
Protein
Protein/organic acid
Protein/organic acid
Protein
Protein/organic acid
Protein
Lipid/energy metabolism
Protein/organic acid
Low protein/adequate energy diet/supplemental calcium/supplementalvitamin/mineral
Mild protein restriction/adequateenergy diet (isoleucine)
Routine nutrition careRoutine nutrition care
Low protein/adequate energy diet/supplemental calcium/supplementalvitamin/mineral
Routine nutrition careRoutine nutrition careHigh energy/high protein diet
Very low (food) fat/replacement withmedium-chain triglycerides
Prevent fasting; routine nutrition care;avoid high fat intake
Very low (food) fat/replacement withmedium-chain triglycerides
Galactose-restricted diet in earlyinfancy; supplemental calcium
Low protein/adequate energy diet/supplemental calcium (lysine andtryptophan)
Low protein/adequate energy diet(leucine)
Routine nutrition careLow protein/adequate energy diet
calcium source (methionine)Low protein/adequate energy/
supplemental calcium (leucine)Low protein/adequate energy diet/
supplemental calcium (leucine,isoleucine, valine)
Low protein/adequate energy diet(isoleucine, valine, methionine,threonine)
Routine nutrition care
Low protein/adequate energy diet(phenylalanine)
Low protein/adequate energy diet(isoleucine, valine, methionine,threonine)
Low protein/adequate energy diet(tyrosine and phenylalanine)
None proven effective (some centersrestrict LCFA and MCT)
Routine nutrition care (leucine); sick-day modifications to lower proteinand raise sugar may be used
Arginine
Carnitine
BiotinNone
ArginineBuphenyla
Hormone replacement therapyHormone replacement therapyPancreatic enzyme replacement;vitamin ADEK supplementationEssential fatty acids, carnitine
Carnitine (some)
Essential fatty acids, carnitine
None
RiboflavinCarnitine
None
Per protocolVitamin B6 folate
Carnitine, glycine
Isoleucine and valine. Rareforms respond to thiamin
B12 folate
Biotin
Supplemental tyrosineBH4 (Kuvan)
Rare forms respond to biotin
Nitisinone
None
Biotin
Source: www.adajournal.org

222©
2009
Nut
ritio
n D
imen
sion
, Inc
.
Appendix #22
Homemade Puréed Foods
For various reasons, some families continue to provide children >1 year of age with baby foods, which aremuch lower in calories as compared to pureed table foods.
Stage 1 baby foods have:• high water content• bland flavors• thin consistency
Comparison of baby food versus pureed table food:4 oz pureed peaches in heavy syrup = 95 calories4 oz stage 2 peaches = 60-70 calories
Comparison of various "baby food" products:4 oz stage 2 sweet potato = 70 calories4 oz sweet potato soufflé Beech-Nut First Advantage = 140 calories
Recommendations for making homemade baby foods:• Prepare meals in bulk and freeze in ice cube trays ( 1 oz = 1 ice cube)• Purchase pre-prepared and frozen foods to ease preparation• Foods that puree well: canned fruits, pancakes, mac-n-cheese, peanut butter & jelly, sweet potatoes,
raviolis, broccoli & cheese, Stouffer's Spinach Soufflé, perogies, beef stew• Foods that DO NOT puree well: peas, corn, hot dog with skin, rice, chunky peanut butter, bacon,
steak, fruit with skin or seeds• Naturally occurring purees: yogurt without fruit pieces, applesauce, mashed potatoes, pudding,
cream of wheat• Fluids to use when pureeing: milk, broth, olive/vegetable oil, gravy, formula• Use well cooked and very soft meats, vegetables and ripe fruits without seeds or skin• When purees are too thin or runny, add potato flakes, bread, baby rice or oatmeal cereal• When purees are too thick or lumpy, add more liquids
Resources:Top 100 Baby Purees: 100 Quick and Easy Meals for a Healthy and Happy Baby by Annabel Karmel
Blender Baby Food: Over 125 Recipes for Healthy Homemade Meals by Nicole Young and Nadine Day

223©
2009
Nut
ritio
n D
imen
sion
/ G
anne
tt Ed
ucat
ion
Answer each question by checking the correct answer online or filling the circle corresponding to the correct answer on the answer sheet. There is one best answer for each question. If you want a record of your answers, photocopy the answer sheet or record your choices on another piece of paper. Do not detach the examination from the book. This exam has 40 questions.
1. Ideal weight-for-height is what percentile for child's measured length or height? a. 25th percentile b. below 5th percentile c. above 95th percentile d. 50th percentile
2. Young children from 24 to 36 months may have either length or stature measured, as long as the measurement is recorded on the appropriate growth chart. a. True b. False
3. Body Mass Index (BMI) is calculated by: a. Height (cm) divided by weight (kg) b. Weight (kg) divided by height2 (m) c. Weight (lb) divided by height (in.) d. Height2 (m) times weight (kg) e. Weight (kg) times height2 (m)
4. Typical growth on the NCHS charts occurs between the: a. 25th and 75th percentiles b. 15th and 90th percentiles c. 10th and 90th percentiles d. 5th and 95th percentiles e. 25th and 50th percentiles
5. The four categories of DRI include: a. RDA, safe allowances, USRDA, estimated requirements b. Calories, protein, carbohydrates, vitamins c. Age, gender, weight, height d. RDA, EAR, UL, AI e. None of the above
6. Infants with mild acute diarrhea should: a. Continue breast and formula feedings b. Not eat any solids c. Replete fluid losses with water or juice d. Be ignored e. All of the above
7. Physical growth is characterized by which of the following? a. Weight b. Length or height (stature) c. Head circumference for less than 2 years old d. Body composition e. All of the above
ExaminationPED09

224©
2009
Nut
ritio
n D
imen
sion
/ G
anne
tt Ed
ucat
ion
Exam, cont. PED09
8. How would you classify a 75 percent IBW? a. Normal b. Mild wasting c. Moderate wasting d. Severe wasting e. None of the above
9. Which of the following are positive feeding behaviors? a. Attention to cues b. Monotone voice or no vocals c. Good eye contact d. Both a and c e. None of the above
10. Which of the following methods are valid to evaluate carbohydrate tolerance? a. Analysis of breath hydrogen b. One-hour xylose tolerance test c. Stool pH d. Blood lactase e. All of the above
11. A BMI-for-age of 95th percentile or above would be classified as which of the following? a. Overweight b. At risk for overweight c. Obese d. All of the above
12. Baby Smith was born at 28 weeks gestation with a birth weight of 1100 gm. Which of the following statements is true? a. Baby Smith is very low birth weight. b. The birth weight plots as appropriate for gestational age (AGA) on the Lubchenco Intrauterine Growth Chart c. Baby Smith is a micropremie d. a and c e. a and b
13. Mealtime strategies that help the child with failure to thrive include: a. Using food as a reward b. Excessive consumption of juices c. Positive reinforcement and praise and avoiding conflict at mealtimes d. Denying food for misbehavior e. None of the above
14. If a patient has an elevated CRP level, you would suspect that the prealbumin level would be affected in which of these ways? a. Increased b. Decreased c. No change

225©
2009
Nut
ritio
n D
imen
sion
/ G
anne
tt Ed
ucat
ion
Exam, cont.PED09
15. Children with cystic fibrosis should take pancreatic enzymes: a. Once a day b. In the morning and evening c. With all meals and snacks d. Every 3 hours e. Once a week
16. The Schofield equation is most accurate in predicting what for obese children and adolescents? a. BMR b. DRI c. REE d. RDA
17. Failure to thrive is defined as which of the following? a. Weight-for-age less than the 5th percentile b. A decrease in growth velocity or downward crossing of at least two major growth channels c. Weight-for-length less than the 5th percentile d. Subcutaneous fat stores below the 5th percentile e. All of the above are true
18. A child who receives exclusive breastfeeding would benefit from supplementation with: a. Folate b. Vitamin D c. Vitamin B12
d. Vitamin A e. Vitamin C
19. The 2002 DRI calorie recommendations are estimated for a healthy population. Appropriate adjustments should be made for chronically or acutely ill children. a. True b. False
20. Failure-to-thrive present in a 3-month-old infant may be caused by which of the following? a. HIV b. Intrauterine drug exposure c. Fetal alcohol syndrome d. Oral motor dysfunction e. Both a and d are correct
21. Which of the following are good reasons to refer a patient to see a feeding therapist? a. Unexplained food refusal or inability to take adequate nutrition to support growth b. Disrupted breathing or apnea during feedings c. Feeding takes longer than 30 minutes for infants or 45 minutes for children d. All of the above
22. Which of the following is/are essential to performing a feeding assessment? a. Knowing the normal milestones of feeding skill development b. Observing the child while feeding or being fed c. Having a child of your own d. Both a and b

226©
2009
Nut
ritio
n D
imen
sion
/ G
anne
tt Ed
ucat
ion
Exam, cont.PED09
23. Above the age of 10 years, why do calorie and protein recommendations for boys and girls differ? a. Differing age of onset of puberty b. Boys have a bigger appetite than girls c. Timing and magnitude of the adolescent growth spurt d. Both a and c
24. Which of the following gestations is classified as premature? a. 36 weeks b. 38 weeks c. 39 weeks d. 40 weeks
25. In order to be designated a "baby-friendly" facility, a hospital must implement which of the following steps to support successful breastfeeding? a. Help mothers initiate breastfeeding within 2 hours of birth b. Give no artificial teats or pacifiers to breastfeeding infants c. Have a written breastfeeding policy, but only nurses need to be aware of this d. Allow the baby to sleep in the nursery to allow mom to get enough sleep
26. If a baby was 34 weeks gestational age and is now 10 weeks chronologically, what is the corrected age? a. 6 weeks corrected age b. 8 weeks corrected age c. 2 weeks corrected age d. 4 weeks corrected age
27. All of the following would benefit from soy formulas, EXCEPT: a. Premature infants b. Babies with galactosemia c. Infants with primary lactase deficiency d. Babies of vegetarian families who exclude animal products
28. Why are infants and children with BPD at high risk for growth failure? a. Increased metabolic demands b. Over-dilution of enteral formulas c. Poor oral intake d. Both a and b are true e. Both a and c are true
29. Stunting of linear growth is a result of which of the following nutritional causes? a. Acute malnutrition b. Iron deficiency c. Chronic malnutrition d. Vitamin C deficiency
30. Nutrition problems for children with renal disease include which of the following? a. Poor weight gain and growth b. Anemia c. Inadequate nutrient intake d. Frequent vomiting e. All of the above
227©
2009
Nut
ritio
n D
imen
sion
/ G
anne
tt Ed
ucat
ion
Exam, cont. PED09
31. Infants and children with cystic fibrosis and pancreatic insufficiency are at increased risk of which vitamin deficien-cies? a. Vitamins A, D, E and K b. Vitamins A, B12, C and D c. Vitamins E, K, B6 and folate d. Vitamins C, D, pyridoxine and biotin
32. What is NOT generally a cause for inadequate intake in children with seizure disorders? a. Vomiting b. Anorexia due to medications c. Missed meals or snacks d. Increased energy needs e. Malabsorption
33. Which of the following is NOT a consequence of renal disease? a. Hypertension b. Osteodystrophy c. Glucose intolerance d. Anemia e. Poor weight gain and growth
34. The prevalence of pediatric obesity has ______ since 1980 in the 6 to 19 year age group. a. Doubled b. Stayed the same c. Tripled d. Decreased
35. Common causes of short bowel syndrome in pediatrics include which of the following? a. Necrotizing enterocolitis b. Severe intestinal resections c. Gastroschisis d. Volvulus e. All of the above
36. When a child has renal insufficiency but is not on dialysis, the RD should recommend what modification to the protein intake? a. Provide 10% less than the DRI b. Provide 20% more than the DRI c. Provide 75% of the DRI d. The DRI for age is appropriate, no modification needed
37. Infants with cystic fibrosis cannot digest breast milk feedings. a. True b. False
38. What information is needed to calculate genetic height potential or mid-parental height? a. Child's height and weight of both parents b. Child's height and height of both parents c. Child's height and height of all siblings d. Child's height and height of both parents and siblings e. Child's height and height of all grandparents

228©
2009
Nut
ritio
n D
imen
sion
/ G
anne
tt Ed
ucat
ion
Exam, cont.PED09
39. Long-term EN is indicated for children with which of the following? a. Type I diabetes b. Renal transplant c. Severe neurological impairment d. Wilson's disease
40. Parenteral nutrition (PN) should be initiated immediately if the medical situation allows for safe initiation of tube feedings. a. True b. False