clinical research in infectious diseases
TRANSCRIPT
CLINICAL RESEARCH IN INFECTIOUS DISEASES
STATISTICAL ANALYSIS PLAN For Abbreviated CSR
DMID Protocol: 15-0045
Study Title: Multi-center, Randomized, Open-label Trial to
Evaluate the Efficacy of Oral Fosfomycin versus Oral Levofloxacin Strategies in Complicated Urinary Tract
Infections (FOCUS)
NCT03697993
Version 1.0
DATE: 16JUL2020
THIS COMMUNICATION IS PRIVILEGED AND CONFIDENTIAL

Statistical Analysis Plan - DMID Protocol: 15-0045 Version 1.0 16JUL2020
- ii - PRIVILEGED AND CONFIDENTIAL COMMUNICATION
STUDY TITLE Protocol Number Code: DMID Protocol: 15-0045
Development Phase: Phase IV
Products: Fosfomycin and levofloxacin Other drugs: Amoxicillin-clavulanate Cefixime Trimethoprim-sulfamethoxazole
Form/Route: Tablet/Oral, Solution/Oral, Suspension/Oral
Indication Studied: Complicated urinary tract infections
Sponsor: Division of Microbiology and Infectious Diseases National Institute of Allergy and Infectious Diseases National Institutes of Health
Clinical Trial Initiation Date: 07NOV2018
Clinical Trial Completion Date: 24OCT2019
Date of the Analysis Plan: 16JUL2020
Version Number: Version 1.0
This study was performed in compliance with Good Clinical Practice. Information contained in this publication is the property of Division of Microbiology and Infectious Diseases and is confidential. This information may not be disclosed to third parties without written authorization from Division of Microbiology and Infectious Diseases. This report may not be reproduced, stored in a retrieval system or transmitted in any form or by any means - electronic, mechanical, recording or otherwise - without the prior authorization from Division of Microbiology and Infectious Diseases. This document must be returned to Division of Microbiology and Infectious Diseases upon request.

Statistical Analysis Plan - DMID Protocol: 15-0045 Version 1.0 16JUL2020
- iii - PRIVILEGED AND CONFIDENTIAL COMMUNICATION
TABLE OF CONTENTS STUDY TITLE ............................................................................................................................... II
TABLE OF CONTENTS ...............................................................................................................III
LIST OF ABBREVIATIONS ....................................................................................................... VI
1. PREFACE .....................................................................................................................1
2. INTRODUCTION ........................................................................................................2
2.1. Purpose of the Analyses ................................................................................................2
3. STUDY OBJECTIVES AND ENDPOINTS ................................................................3
3.1. Study Objectives ...........................................................................................................3
3.1.1. Primary Objectives .......................................................................................................3
3.1.2. Secondary Objectives ...................................................................................................3
3.1.3. Exploratory Objectives .................................................................................................3
3.2. Endpoints ......................................................................................................................4
3.2.1. Primary Endpoints ........................................................................................................4
3.2.2. Secondary Endpoints ....................................................................................................4
3.2.3. Exploratory Endpoints ..................................................................................................4
3.3. Study Definitions and Derived Variables .....................................................................5
4. INVESTIGATIONAL PLAN .......................................................................................7
4.1. Overall Study Design and Plan .....................................................................................7
4.2. Discussion of Study Design, Including the Choice of Control Groups ........................7
4.3. Selection of Study Population ......................................................................................8
4.3.1. Inclusion Criteria ..........................................................................................................8
4.3.2. Exclusion Criteria .......................................................................................................10
4.3.3. Reasons for Withdrawal .............................................................................................11
4.4. Treatments ..................................................................................................................11
4.4.1. Treatments Administered ............................................................................................11
4.4.2. Identity of Investigational Products ............................................................................12
4.4.3. Method of Assigning Subjects to Treatment Groups (Randomization) .....................12
4.4.4. Selection of Doses in the Study ..................................................................................12
4.4.5. Selection and Timing of Dose for Each Subject .........................................................13
4.4.6. Blinding ......................................................................................................................13

Statistical Analysis Plan - DMID Protocol: 15-0045 Version 1.0 16JUL2020
Table of Contents (continued)
- iv - PRIVILEGED AND CONFIDENTIAL COMMUNICATION
4.4.7. Prior and Concomitant Therapy ..................................................................................14
4.4.8. Treatment Compliance ................................................................................................14
4.5. Efficacy and Safety Variables ....................................................................................14
5. SAMPLE SIZE CONSIDERATIONS .......................................................................16
6. GENERAL STATISTICAL CONSIDERATIONS ....................................................17
6.1. General Principles .......................................................................................................17
6.2. Timing of Analyses .....................................................................................................17
6.3. Analysis Populations ..................................................................................................17
6.3.1. Intent-to-Treat Population ..........................................................................................18
6.3.2. Microbiological Intent-to-Treat Population ................................................................18
6.3.3. Complete Case Populations ........................................................................................18
6.3.4. Safety Population ........................................................................................................18
6.3.5. Fosfomycin Safety Population ....................................................................................18
6.4. Covariates and Subgroups ..........................................................................................19
6.5. Missing Data ...............................................................................................................19
6.6. Interim Analyses and Data Monitoring ......................................................................19
6.7. Multicenter Studies .....................................................................................................19
6.8. Multiple Comparisons/Multiplicity ............................................................................19
7. STUDY SUBJECTS ...................................................................................................20
7.1. Disposition of Subjects ...............................................................................................20
7.2. Protocol Deviations ....................................................................................................20
8. EFFICACY EVALUATION ......................................................................................21
8.1. Primary Efficacy Analysis ..........................................................................................21
8.1.1. Analysis of Treatment Success at TOC in the Micro-ITT Population .......................21
8.2. Secondary Efficacy Analyses .....................................................................................22
8.2.1. Analysis of Composite Cure at EOT in the Micro-ITT Population, Performed in an Analogous Manner to the Primary Analysis ....................................22
8.2.2. Sensitivity Analyses of Composite Cure at TOC and EOT in the Micro-ITT Population ...................................................................................................................23
8.3. Exploratory Efficacy Analyses ...................................................................................23
8.4. Imputation of Missing Data ........................................................................................23

Statistical Analysis Plan - DMID Protocol: 15-0045 Version 1.0 16JUL2020
Table of Contents (continued)
- v - PRIVILEGED AND CONFIDENTIAL COMMUNICATION
8.4.1. Multiple Imputation of Missing Values of Treatment Success at TOC and EOT .............................................................................................................................23
9. SAFETY EVALUATION ..........................................................................................27
9.1. Demographic and Other Baseline Characteristics ......................................................27
9.1.1. Prior and Concurrent Illnesses and Medical Conditions ............................................27
9.1.2. Prior and Concurrent Medications ..............................................................................27
9.2. Measurements of Treatment Compliance ...................................................................27
9.3. Adverse Events ...........................................................................................................28
9.3.1. Solicited Events and Symptoms .................................................................................28
9.3.2. Unsolicited Adverse Events ........................................................................................29
9.4. Deaths, Serious Adverse Events and other Significant Adverse Events ....................30
9.5. Pregnancies .................................................................................................................30
9.6. Clinical Laboratory Evaluations .................................................................................30
9.7. Vital Signs and Physical Evaluations .........................................................................30
9.8. Concomitant Medications ...........................................................................................30
10. REPORTING CONVENTIONS ................................................................................31
11. TECHNICAL DETAILS ............................................................................................32
12. SUMMARY OF CHANGES IN THE CONDUCT OF THE STUDY OR PLANNED ANALYSES ............................................................................................33
13. REFERENCES ...........................................................................................................34
14. LISTING OF TABLES, FIGURES, AND LISTINGS ..............................................35
APPENDICES ...............................................................................................................................36
APPENDIX 1. TABLE MOCK-UPS..........................................................................................37
APPENDIX 2. FIGURE MOCK-UPS ......................................................................................108
APPENDIX 3. LISTINGS MOCK-UPS ...................................................................................114

Statistical Analysis Plan - DMID Protocol: 15-0045 Version 1.0 16JUL2020
- vi - PRIVILEGED AND CONFIDENTIAL COMMUNICATION
LIST OF ABBREVIATIONS
AE Adverse Event
AESI Adverse Event of Special Interest
ALT Alanine Aminotransferase
AST Aspartate Aminotransferase
ATC Anatomical Therapeutic Classification
BP Blood Pressure
BUN Blood Urea Nitrogen
C Celsius
CC Complete Case
CFU Colony Forming Units
CI Confidence Interval
CrCl Creatinine Clearance
CRF Case Report Form
cUTI Complicated Urinary Tract Infection
DCC Data Coordinating Center
DMID Division of Microbiology and Infectious Diseases
DSMB Data and Safety Monitoring Board
eCRF Electronic Case Report Form
EDC Electronic Data Capture
EOT End of Therapy
ER Emergency Room
ESBL Extended-spectrum beta-lactamase
F Fahrenheit
ICF Informed Consent Form
ICH International Conference on Harmonisation
IDES Internet Data Entry System
IRB Institutional Review Board
ITT Intention to Treat
L Liter
LAR Legally Authorized Representative
MedDRA® Medical Dictionary for Regulatory Activities
mg Milligram

Statistical Analysis Plan - DMID Protocol: 15-0045 Version 1.0 16JUL2020
List of Abbreviations (continued)
- vii - PRIVILEGED AND CONFIDENTIAL COMMUNICATION
MIC Minimum Inhibitory Concentration
Micro-ITT Microbiological Intent-to-Treat population
mL Milliliter
MAR Missing at Random
MCAR Missing Completely at Random
MNAR Missing Not at Random
MVUE Minimum Variance Unbiased Estimate
N Number (typically refers to subjects)
NIH National Institutes of Health
PI Principal Investigator
PP Per Protocol
PT Preferred Term
RBC Red Blood Cell
SAE Serious Adverse Event
SD Standard Deviation
SDCC Statistical and Data Coordinating Center
SGOT Serum Glutamic Oxaloacetic Transaminase
SGPT Serum Glutamic Pyruvic Transaminase
SMC Safety Monitoring Committee
TMP-SMX Trimethoprim-Sulfamethoxazole
SOC System Organ Class
SOP Standard Operating Procedures
TOC Test of Cure
U Units
UTI Urinary Tract Infection
WBC White Blood Cell
WHO World Health Organization

Statistical Analysis Plan - DMID Protocol: 15-0045 Version 1.0 16JUL2020
- 1 - PRIVILEGED AND CONFIDENTIAL COMMUNICATION
1. PREFACE The Statistical Analysis Plan (SAP) for “Multi-center, Randomized, Open-label Trial to Evaluate the Efficacy of Oral Fosfomycin versus Oral Levofloxacin Strategies in Complicated Urinary Tract Infections” (DMID Protocol 15-0045) describes and expands upon the statistical information presented in the protocol v4.0.
This study was stopped early prior to reaching full enrollment due to the slow enrollment rate. Only 62 out of the 634 planned subjects were enrolled in the study with only 48 subjects to be included in the micro-ITT population. Therefore, the initial statistical analyses proposed for this protocol were updated for a more accurate and meaningful inference based on a reduced sample size. This document describes the updated analysis plan agreed upon with the study team. In addition, this document includes sample tables, listings, and figures planned for the final analyses and for the primary manuscript.
Regarding the final analyses and abbreviated Clinical Study Report (CSR), this SAP follows the International Conference on Harmonisation of Technical Requirements for Registration of Pharmaceuticals for Human Use (ICH) Guidelines, as indicated in Topic E3 (Structure and Content of Clinical Study Reports), and more generally is consistent with Topic E8 (General Considerations for Clinical Trials) and Topic E9 (Statistical Principles for Clinical Trials). The structure and content of the SAP provides sufficient detail to meet the requirements identified by the FDA and ICH, while all work planned and reported for this SAP will follow internationally accepted guidelines published by the American Statistical Association and the Royal Statistical Society for statistical practice.
This document includes a review of the study design, general statistical considerations, comprehensive statistical analysis methods safety outcomes, and a list of proposed tables and figures and listings (TFLs). Within the table, figure, and listing mock-ups (Appendices 1, 2, and 3), references to the abbreviated CSR sections are included. Any deviation from this SAP will be described and justified in the abbreviated CSR, as appropriate. Additionally, this document also describes statistical analysis methods for efficacy outcomes and a subset of the TFLs to be included in the primary manuscript. Those TFLs designated for the manuscript will be marked by an asterisk (*) symbol and will not be included in the abbreviated CSR. The reader of this SAP is encouraged to also review the study protocol for details on conduct of the study and the operational aspects of clinical assessments.

Statistical Analysis Plan - DMID Protocol: 15-0045 Version 1.0 16JUL2020
- 2 - PRIVILEGED AND CONFIDENTIAL COMMUNICATION
2. INTRODUCTION This is a Phase IV, multi-center, open-label randomized pragmatic superiority clinical trial with a primary objective to evaluate the efficacy of Strategy 1 (initial OR step-down with fosfomycin 3 grams, oral, once daily) vs. Strategy 2 (initial OR step-down with levofloxacin 750 mg, oral tablet once daily) in terms of treatment success rates for patients with complicated urinary tract infections (cUTIs). Each strategy allowed for a subsequent investigator-directed adjustment to another adequate oral therapy if needed. Subjects were randomized 1:1 to receive oral therapy from Strategy 1 vs. Strategy 2. Subjects were stratified by (1) pyelonephritis vs. other cUTIs and (2) participating site.
2.1. Purpose of the Analyses Analyses will be made to determine the relative efficacy and safety of the two strategies for initial or step-down oral therapy for cUTI. A comparison of the two strategies in terms of treatment success (clinical cure and microbiological cure) at the test of cure (TOC) visit in the microbiological intent-to-treat (micro-ITT) population will be the primary analysis. A comparison of the two strategies in terms of treatment success at the end of therapy (EOT) in the micro-ITT population will be a secondary analysis. Additionally, the two strategies will be compared in terms of clinical cure and microbiological cure separately at TOC and EOT.

Statistical Analysis Plan - DMID Protocol: 15-0045 Version 1.0 16JUL2020
- 3 - PRIVILEGED AND CONFIDENTIAL COMMUNICATION
3. STUDY OBJECTIVES AND ENDPOINTS
3.1. Study Objectives The objective of this trial is to compare the safety and efficacy of two pragmatic strategies (Strategy 1 vs Strategy 2) as initial or step-down therapies for cUTI without bacteremia with a uropathogen, including pyelonephritis. 3.1.1. Primary Objectives
1. To compare Strategy 1 and Strategy 2 in terms of treatment success rates at TOC. 3.1.2. Secondary Objectives
1. To assess the safety of fosfomycin.
2. To compare Strategy 1 and Strategy 2 in terms of solicited adverse events.
3. To compare Strategy 1 and Strategy 2 in terms of treatment success rates at EOT. 3.1.3. Exploratory Objectives
1. To compare Strategy 1 and Strategy 2 in terms of treatment success rates at EOT, separately analyzing subjects with pyelonephritis vs. other types of cUTI.
2. To compare Strategy 1 and Strategy 2 in terms of treatment success rates at TOC, separately analyzing subjects with pyelonephritis vs. other types of cUTI.
3. To compare Strategy 1 and Strategy 2 in terms of clinical cure rates at EOT.
4. To compare Strategy 1 and Strategy 2 in terms of clinical cure rates at TOC.
5. To compare Strategy 1 and Strategy 2 in terms of microbiological success rates at EOT.
6. To compare Strategy 1 and Strategy 2 in terms of microbiological success rates at TOC.
7. To compare Strategy 1 and Strategy 2 in terms of adjustment-free treatment success rates at EOT.
8. To compare Strategy 1 and Strategy 2 in terms of adjustment-free treatment success rates at TOC.
9. To compare Strategy 1 and Strategy 2 in terms of number of days of antibiotic at TOC.
10. To compare Strategy 1 and Strategy 2 in terms of relapse infection rates after EOT.
11. To compare Strategy 1 and Strategy 2 for subjects with in vitro non susceptibility to fosfomycin in terms of treatment success rates at EOT.
12. To compare Strategy 1 and Strategy 2 for subjects with in vitro non susceptibility to levofloxacin in terms of treatment success rates at EOT.
13. To compare rates of discontinuation in subjects treated with Strategy 1 vs. Strategy 2 due to occurrence of a significant related adverse event.
14. To compare Strategy 1 and Strategy 2 for subjects with in vitro heteroresistance to fosfomycin or levofloxacin in terms of treatment success rates at EOT.
15. To compare Strategy 1 and Strategy 2 for subjects with in vitro heteroresistance to fosfomycin or levofloxacin in terms of treatment success rates at TOC.

Statistical Analysis Plan - DMID Protocol: 15-0045 Version 1.0 16JUL2020
- 4 - PRIVILEGED AND CONFIDENTIAL COMMUNICATION
3.2. Endpoints
3.2.1. Primary Endpoints 1. The difference in the proportion of subjects achieving treatment success at TOC between Strategy 1
and Strategy 2.
3.2.2. Secondary Endpoints 1. The number of solicited and unsolicited adverse events (AEs) grade 2 and above in subjects receiving
fosfomycin for the duration of fosfomycin use until 2 days after last dose.
2. The number of serious adverse events (SAEs) in subjects receiving at least two doses of fosfomycin during the trial.
3. The difference in rates and severity of solicited AEs in subjects in Strategy 1 and Strategy 2.
4. The difference in the proportion of subjects achieving treatment success at EOT between Strategy 1 and Strategy 2.
3.2.3. Exploratory Endpoints
1. The difference in the proportion of subjects achieving treatment success at EOT between Strategy 1 and Strategy 2, stratified by pyelonephritis vs. other types of cUTI.
2. The difference in the proportion of subjects achieving treatment success at TOC between Strategy 1 and Strategy 2, stratified by pyelonephritis vs. other types of cUTI.
3. The difference in the proportion of subjects achieving clinical cure at EOT between Strategy 1 and Strategy 2.
4. The difference in the proportion of subjects achieving clinical cure at TOC between Strategy 1 and Strategy 2.
5. The difference in the proportion of subjects achieving microbiological success at EOT between Strategy 1 and Strategy 2.
6. The difference in the proportion of subjects achieving microbiological success at TOC between Strategy 1 and Strategy 2.
7. The difference in the proportion of subjects achieving treatment success at EOT with an adjustment-free strategy between Strategy 1 and Strategy 2.
8. The difference in the proportion of subjects achieving treatment success at TOC with an adjustment-free strategy between Strategy 1 and Strategy 2.
9. The difference in the number of days of unique antibiotics prescribed between randomization and TOC between Strategy 1 and Strategy 2.
10. The difference in the proportion of subjects having a relapse infection after EOT between Strategy 1 and Strategy 2.
11. The difference in the proportion of subjects having fosfomycin in vitro non susceptibility with treatment success at EOT between Strategy 1 and Strategy 2.
Statistical Analysis Plan - DMID Protocol: 15-0045 Version 1.0 16JUL2020
- 5 - PRIVILEGED AND CONFIDENTIAL COMMUNICATION
12. The difference in the proportion of subjects having levofloxacin in vitro non susceptibility with treatment success at EOT between Strategy 1 and Strategy 2.
13. The difference in the proportion of fosfomycin-treated subjects from both Strategy 1 and Strategy 2 between levofloxacin-susceptible and levofloxacin-non susceptible isolates.
14. The difference in discontinuation rate of initial fosfomycin in Strategy 1 and initial levofloxacin in Strategy 2 because of a significant related adverse event.
15. The difference in the proportion of subjects having levofloxacin heteroresistance with treatment success at EOT between Strategy 1 and Strategy 2.
16. The difference in the proportion of subjects having levofloxacin heteroresistance with treatment success at TOC between Strategy 1 and Strategy 2.
17. The difference in the proportion of subjects having fosfomycin heteroresistance with treatment success at EOT between Strategy 1 and Strategy 2.
18. The difference in the proportion of subjects having fosfomycin heteroresistance with treatment success at TOC between Strategy 1 and Strategy 2.
3.3. Study Definitions and Derived Variables Clinical cure is defined as:
• Resolution of UTI symptoms from presentation (fever, hypothermia, chills or rigors or warmth, flank pain, flank tenderness, suprapubic pain, pelvic pain, suprapubic tenderness, nausea, vomiting, pain on urination, urinary frequency, urinary urgency)
AND
• No new UTI symptoms
AND
• Avoidance of parenteral antibiotic therapy, in or out of hospital, at any time after randomization OR oral antibiotic therapy different from per protocol
A subject will be considered a clinical failure if at least one of the above conditions is not met.
Microbiological success (Microbiologic cure) is defined as:
• Reduction of the pathogen found at presentation to <104 CFU/mL for non-catheter specimens or < 103
for catheter specimens on urine culture.
Treatment success (composite cure) is defined as:
• Clinical cure and microbiological success.
• Treatment Success will be referred to as Composite Cure in manuscript TFLs.
Treatment Failure is defined as:
• A subject will be considered a treatment failure if the subject experiences clinical/microbiologic failure OR if the subject develops bacteremia with a uropathogen after randomization.

Statistical Analysis Plan - DMID Protocol: 15-0045 Version 1.0 16JUL2020
- 6 - PRIVILEGED AND CONFIDENTIAL COMMUNICATION
Adjustment-free treatment success is defined as:
• Treatment success without therapy adjustments.
Relapse infection is defined as: • Recurrence of UTI symptoms between EOT and TOC.
End of Therapy (EOT) Visit is also referred to as Visit 3 in the protocol and will occur within 2 days of the completion of oral therapy. The window for this visit is Day 5-10 +2 days.
Test of Cure (TOC) Visit is the final visit for this study (Visit 4) and will be scheduled within the window of Day 21 + 7 days after randomization.
Day 1: is defined as the day of first dose for subjects who were treated with study product. For subjects not treated with study product, Day 1 will be defined as the day of randomization.

Statistical Analysis Plan - DMID Protocol: 15-0045 Version 1.0 16JUL2020
- 7 - PRIVILEGED AND CONFIDENTIAL COMMUNICATION
4. INVESTIGATIONAL PLAN
4.1. Overall Study Design and Plan This is a Phase IV, multi-center, open-label randomized pragmatic superiority clinical trial comparing two strategies for initial or step-down oral therapy for cUTI without bacteremia with a uropathogen after 0-48 hours of parenteral antibiotic therapy. The trial will evaluate the success and safety of a strategy of initial or step-down fosfomycin administered at a dose of 3 g once daily (Strategy 1) vs. a strategy of initial or step-down levofloxacin administered at a dose of 750 mg once daily (Strategy 2). Initial therapy is defined as the first effective agent and step-down therapy is defined as with prior effective agents. Investigator-directed adjustment to another adequate oral therapy is allowed after randomization 1) if the causative pathogen is not susceptible in vitro to quinolone initial or step-down therapy in a subject randomized to the levofloxacin strategy, OR 2) if the subject develops an intolerance or allergy to the initial or step-down oral therapy and at the investigator’s discretion, OR 3) the subject has an underlying condition posing increased risk for adverse events from quinolone therapy. Another adequate oral therapy is defined as an oral therapy to which the pathogen shows in-vitro susceptibility AND to which the subject is tolerant based on history AND which is listed below:
- Levofloxacin 750 mg oral tablet once daily (Strategy 1 only) - Fosfomycin 3 grams oral powder once daily (Strategy 2 only) - Amoxicillin-clavulanate 875/125 mg oral tablet twice daily - Cefixime 400 mg oral tablet once daily - Trimethoprim-sulfamethoxazole (TMP-SMX) 160/800 mg double-strength oral tablet twice daily
The duration of oral therapy (initial + investigator-directed adjustment if indicated) in each strategy is 5-7 days of any per protocol antibiotic to which the pathogen is susceptible such that the total duration of effective antibacterial therapy (including pre-study administration of oral therapy escalated to parenteral therapy or parenteral therapy alone) is 7 days. The dosing of oral therapy depends on creatinine clearance (CrCl).
The trial originally planned to enroll approximately 634 subjects with cUTI from outpatient and inpatient settings over ~24 months. However, the trial was terminated in October 2019 after ~12 months of enrollment, and only 62 subjects had been enrolled. Each subject was followed for safety and efficacy up to 28 days according to the schedule of study procedures in Table 1.
4.2. Discussion of Study Design, Including the Choice of Control Groups Levofloxacin at 750 mg daily is FDA-approved for the treatment of cUTI and the current standard of care in the US.
The goal of this trial is to evaluate the safety and efficacy of two different strategies as initial or step-down oral therapy of cUTI without bacteremia with a uropathogen, including pyelonephritis: a strategy of initial or step-down oral fosfomycin, administered at a dose of 3 grams once daily with one investigator-directed adjustment if needed for tolerability (Strategy 1), vs. a strategy of initial or step-down oral levofloxacin, administered at a dose of 750 mg once daily with one investigator-directed adjustment if needed for tolerability or non-susceptible clinical isolate (Strategy 2).
Investigator-directed adjustment if needed in oral antibiotic choice is permitted once in this pragmatic design as in-vitro susceptibility and tolerability data, such as non-susceptibility to levofloxacin or intolerance or allergy to the initial or step-down therapy leading to fosfomycin or levofloxacin discontinuation, become

Statistical Analysis Plan - DMID Protocol: 15-0045 Version 1.0 16JUL2020
- 8 - PRIVILEGED AND CONFIDENTIAL COMMUNICATION
available. The dosing of oral therapy depends on CrCl. The total duration of study drug administration is 5-7 days of any per protocol antibiotic to which the pathogen is susceptible.
The potential risks for subjects enrolled in this study are that fluoroquinolones exert broad-spectrum antimicrobial activity against most UTI pathogens, achieve high levels in the urinary tract, and are comparable or superior to other broad-spectrum antibiotics, including parenteral regimens, making them ideal agents to treat cUTIs. However, given that fluoroquinolone has concerning side effects and increased resistance among community and hospital-acquired uropathogens, and that no new oral antibiotics for treatment of UTIs are expected to become available for several years, there is a critical need for an alternative strategy for the treatment of cUTI.
4.3. Selection of Study Population The trial will be conducted in male and non-pregnant female subjects aged ≥18 years who are diagnosed with cUTI without bacteremia with a uropathogen. The trial is a multi-site study that is planned to enroll approximately 634 subjects (randomized 1:1).
Subjects will be recruited from inpatient and outpatient settings (clinics, urgent care clinics, emergency departments, hospital wards). Once identified, the subject or a subject’s legally authorized representative (LAR) and the subject’s primary medical team will be approached for study participation before any screening procedures or tests are carried out. The trial will be discussed with the subject/subject’s LAR through the informed consent process and any questions will be answered.
4.3.1. Inclusion Criteria
Subjects may be included in the trial if they meet ALL of the following criteria:
1. Have documented clinical signs and/or symptoms of cUTI at diagnosis1. 1 Clinical signs and symptoms of cUTI include either:
a. Pyelonephritis, as indicated by at least 2 of the following:
• Documented fever (temperature >38°C) accompanied by symptoms of rigors, chills, or "warmth"
• Flank pain
• Costovertebral angle tenderness on physical exam
• Nausea or vomiting
• Dysuria, urinary frequency, or urinary urgency
OR
b. Complicated lower UTI, as indicated by:
• At least 2 of the following new or worsening symptoms of cUTI:
Dysuria, urinary frequency, or urinary urgency Documented fever (temperature >38°C) accompanied by symptoms of rigors, chills, or "warmth"
Documented hypothermia (temperature <35.5°C) Suprapubic pain or pelvic pain Suprapubic tenderness on physical exam New onset of foul smell to urine or increased cloudiness of urine per subject or their caregiver Nausea or vomiting

Statistical Analysis Plan - DMID Protocol: 15-0045 Version 1.0 16JUL2020
- 9 - PRIVILEGED AND CONFIDENTIAL COMMUNICATION
AND
• At least 1 of the following complicating factors:
Males with documented history of urinary retention
Indwelling urinary catheter that is planned to be removed or replaced during study therapy and before EOT
Current obstructive uropathy that is scheduled to be medically or surgically relieved during study therapy and before EOT
Any functional or anatomical abnormality of the urogenital tract (including anatomic malformations or neurogenic bladder) with voiding disturbance resulting in at least 100 mL of residual urine OR with the need for intermittent or ongoing self-catheterization.
2. Able to understand and provide written informed consent2. 2 A legally acceptable representative may provide consent if the subject is unable to do so, provided this is approved by local institution-specific guidelines.
3. Anticipated to be able to be stepped down or initially started on study oral antibiotic therapy within 48 hours of enrollment3, 4. 3 The readiness of a subject for initial or step-down oral therapy is determined by the primary medical team. In addition, for step down therapy the following conditions have to be met: temperature at randomization must be less than 38C without any rigors/chills AND the subject must have an improvement in baseline symptoms of cUTI and no new cUTI symptoms.
4 Subject may be enrolled if he/she received a non-study oral antibiotic only if it is followed by parenteral antibiotics for less than 48 hours prior to de-escalation with study drugs.
4. Male or non-pregnant female.
5. Aged 18 or older.
6. Women of childbearing potential5 must agree to use an effective method of contraception6 for the duration of the trial. 5 Female is considered of childbearing potential unless postmenopausal, or surgically/non surgically sterilized and at least 3 months has passed since sterilization procedure. A woman is considered postmenopausal if her last menstrual period was ≥12 months. 6 Includes, but is not limited to, non-male sexual relationships, abstinence from sexual intercourse with a male partner, monogamous relationship with vasectomized partner who has been vasectomized for ≥180 days before the subject receiving the first dose of study drug, barrier methods such as condoms or diaphragms, effective intrauterine devices, NuvaRing®, and licensed hormonal methods such as implants, injectables but not oral contraceptives.
7. If female of childbearing potential5, a negative urine or serum pregnancy test within 48 hours of randomization.
8. Have pyuria (WBC count ≥10µ/mL in unspun urine or ≥10 per high power field in spun urine) or dipstick analysis positive (excluding “trace”) for leukocyte esterase.
9. Have a pretreatment baseline urine culture specimen obtained within 48 hours before the first dose of any antibiotic is administered (including pre-study antibiotics)7. 7 Subjects may be enrolled in the trial and start study drug before the investigator knows the results of the baseline urine culture.

Statistical Analysis Plan - DMID Protocol: 15-0045 Version 1.0 16JUL2020
- 10 - PRIVILEGED AND CONFIDENTIAL COMMUNICATION
10. Able to reliably take, tolerate, and absorb oral medications, at the investigator’s discretion.
11. Ability to understand study procedures and willing and able to comply with all required procedures and visits for the duration of the trial.
4.3.2. Exclusion Criteria
Subjects must be excluded from the trial if they meet ANY of the following criterion:
1. Have a documented history of any moderate or severe hypersensitivity or allergic reaction to all five oral therapy options.
2. Have a concomitant infection at the time of randomization, which requires non-study systemic antibacterial therapy effective against cUTI in addition to study drug.
3. Have received more than 48 hours of a potentially therapeutic antibiotic for treatment of the current cUTI within 72 hours before randomizaiton8. 8 Except if the following apply:
a. The subject has a known baseline urinary pathogen (urine culture positive) and has failed prior therapy clinically (persistence of inclusion criteria)
AND b. The pathogen is known to be non-susceptible to the previous therapeutic regimen used or the urine culture
remains positive with a density of ≥50,000 CFU/mL or ≥10,000 for catheterized patients.
4. Women breastfeeding or donating breast milk.
5. Have intractable UTI infection at baseline that the investigator anticipates would require >7 days of study drug therapy.
6. Have complete, permanent obstruction of the urinary tract9. 9 Patients with complete permanent obstruction expected to be medically or surgically treated prior to EOT are eligible.
7. Have confirmed fungal UTI at time of randomization (with ≥103 fungal CFU/mL).
8. Have suspected or confirmed perinephric or intrarenal abscess.
9. Have suspected or confirmed prostatitis, epididymitis.
10. Have an ileal loop or known vesico-ureteral reflux.
11. Have a current urinary catheter that is not scheduled to be replaced before EOT10. 10 Intermittent straight catheterization or replacement of new nephrostomy catheters is acceptable.
12. Have planned inpatient urological intervention(s) for suspected infected kidney stone or any other planned urological procedure with anticipated antibiotic prophylaxis between randomization and EOT.
13. Have bacteremia with a uropathogen causing cUTI.
14. Have an estimated or calculated CrCl ≤20 mL/min or currently receiving hemo- or peritoneal dialysis at screening.
15. Have any condition or circumstance that, in the opinion of the investigator, would compromise the safety of the subject of the quality of study data11. 11 Including any rapidly progressing disease or immediately life-threatening (acute hepatic failure, respiratory failure or septic shock).

Statistical Analysis Plan - DMID Protocol: 15-0045 Version 1.0 16JUL2020
- 11 - PRIVILEGED AND CONFIDENTIAL COMMUNICATION
16. Have participated in any interventional trial of an investigational product within 30 days before the proposed first day of study drug administration.
17. Plans to participate or currently enrolled in any interventional study of an investigational agent for the duration of the trial.
18. Previous randomization in this trial.
19. Any recent (< 4 weeks) history of trauma to the pelvis or urinary tract.
20. Prior fosfomycin use in the past 12 months.
4.3.3. Reasons for Withdrawal
Subject Withdrawal
A subject or a subject’s LAR may voluntarily withdraw their consent for study participation at any time without penalty or loss of benefits to which they are otherwise entitled.
Subjects diagnosed with bacteremia with a uropathogen after randomization are considered treatment failures and will only be followed for safety and referred to standard of care for treatment.
The investigator may also discontinue a subject for other reasons; however, follow-up safety evaluations will be conducted if the subject/subject’s LAR agrees.
If a subject withdraws or is discontinued before completion of the trial, the reason will be recorded in the electronic case report form (eCRF).
Additional reasons for withdrawal might include, but are not limited to, the following:
• Medical disease or condition, or new clinical finding(s) for which continued participation, in the opinion of the investigator or the patient’s primary medical provider, might compromise the safety of the subject.
• Subject is lost to follow-up.
• Termination of the trial.
Study Drug Discontinuation
Subjects who discontinue study drug should remain in study and be assessed for safety and clinical/microbiological success per defined criteria. Discontinuation of study drug does not, per se, cause withdrawal from the trial nor by itself constitute treatment failure.
4.4. Treatments
4.4.1. Treatments Administered
Fosfomycin is administered orally daily as one 3-gram single-dose sachet into 3-4 ounces of cool water. Levofloxacin is administered orally daily as one 750 mg tablet.
Alternative therapies cefixime (400 mg), amoxicillin-clavulanate (875/125 mg), and TMP-SMX (160/800 mg) are administered orally as one tablet once (cefixime) or twice (amoxicillin-clavulanate and TMP-SMX) daily.
Strategy 1 is defined as initial OR step-down therapy with fosfomycin 3 grams, oral powder, once daily and if indicated a subsequent investigator-directed adjustment to another adequate oral therapy.

Statistical Analysis Plan - DMID Protocol: 15-0045 Version 1.0 16JUL2020
- 12 - PRIVILEGED AND CONFIDENTIAL COMMUNICATION
Strategy 2 is defined as initial OR step-down therapy with levofloxacin 750 mg, oral tablet, once daily and if indicated a subsequent investigator-directed adjustment to another adequate oral therapy.
Initial therapy is defined as the first effective agent and step down therapy is defined as with prior effective agents. The dosing of oral therapy depends on CrCl.
4.4.2. Identity of Investigational Products
Fosfomycin is a synthetic, broad-spectrum, bactericidal antibiotic for oral administration. It is available as a single-dose sachet which contains white granules consisting of 5.631 grams of Fosfomycin tromethamine and the following inactive ingredients: mandarin flavor, orange flavor, saccharin, and sucrose.
Levofloxacin is a synthetic, broad-spectrum, antibacterial agent. Levofloxacin is a light yellowish-white to yellow-white crystal or crystalline powder with an empirical formula of C18H20FN3O4 ● ½ H20 and the molecular weight is 370.38. The 750 mg film-coated tablet (expressed in the anhydrous form) contains the following inactive ingredients: hypromellose, crospovidone, microcrystalline cellulose, magnesium stearate, polyethylene glycol, titanium dioxide, and polysorbate 80.
Cefixime is supplied as a 200 mg chewable tablet, 400 mg capsule, or tablet, or oral suspension (100 mg/ 5mL and 200 mg/5 mL) for oral administration.
Amoxicillin-clavulanate is supplied as a tablet in the following strength: 875mg/125mg. The 875mg/125mg film-coated tablet is a white-off-white capsule shaped tablet. Each tablet contains 875 mg amoxicillin anhydrous and 125 mg clavulanate acid for oral administration.
TMP-SMX is supplied as a tablet in the following strength: 160 mg/800 mg (double strength). The 160 mg/800 mg double strength (DS) tablet for oral administration contains 800 mg SMX and 160 mg TMP
4.4.3. Method of Assigning Subjects to Treatment Groups (Randomization)
Per ICH guideline E6: Good Clinical Practice, screening records will be kept at each site to document the reason why an individual was screened, but failed trial entry criteria. The reasons why individuals failed screening will be recorded in the Data Coordinating Center’s (DCC’s) AdvantageEDCSM (Electronic Data Capture) system.
Once consented and upon entry of demographic data and confirmation of eligibility for the trial, the subject was enrolled. Enrollment of subjects was done online using the enrollment module of AdvantageEDCSM. Subjects were randomized 1:1 to receive oral therapy from Strategy 1 or Strategy 2. Subjects were stratified by (1) pyelonephritis vs. other cUTIs and (2) participating site.
The list of randomized treatment assignments was prepared by statisticians at the DCC (The Emmes Company) and included in the enrollment module of its Internet Data Entry System (IDES). The IDES assigned each subject a treatment code and treatment assignment from the list after demographic and eligibility data had been entered.
4.4.4. Selection of Doses in the Study
The duration of oral study therapy (initial + investigator-directed adjustment if indicated) in each strategy is 5-7 days of any per protocol antibiotic to which the pathogen is susceptible such that the total duration of effective antibacterial therapy (including pre-study administration of oral therapy escalated to parenteral therapy or parenteral therapy alone) is 7 days.

Statistical Analysis Plan - DMID Protocol: 15-0045 Version 1.0 16JUL2020
- 13 - PRIVILEGED AND CONFIDENTIAL COMMUNICATION
In the US, a tromethamine salt of fosfomycin has been FDA-approved since 1996 as a single oral sachet weighing 3 grams for the treatment of uncomplicated UTIs.
Levofloxacin at 750 mg daily was selected for this study because it is FDA-approved for the treatment of cUTI and the current standard of care in the US. The 750-mg dose of levofloxacin is used because it may more effectively eradicate pathogens and prevent amplification of resistant clones.
A subject’s treatment might also be adjusted to receive another FDA approved treatment for cUTI if the causative pathogen is not susceptible in vitro to the initial treatment or the subject develops an intolerance or allergy or the subject has an underlying condition posing an increased risk wih the original therapy. Possible ajustments are:
- Levofloxacin 750 mg oral tablet once daily (Strategy 1 only) - Fosfomycin 3 grams oral powder once daily (Strategy 2 only) - Amoxicillin-clavulanate 875/125 mg oral tablet twice daily - Cefixime 400 mg oral tablet once daily - Trimethoprim-sulfamethoxazole (TMP-SMX) 160/800 mg double-strength oral tablet twice daily
These doses will be adjusted per subject depending on their Creatinine Clearance (CrCl) as described in Section 4.4.5.
4.4.5. Selection and Timing of Dose for Each Subject
Fosfomycin is administered orally as one 3-gram single-dose sachet into 3-4 ounces (1/2 cup) of cool water. If CrCl is <20 mL/min, fosfomycin should be taken as 3 grams every other day.
Levofloxacin 750 mg is administered orally as one tablet once daily with or without food for normal kidney function. If CrCl is 20-49 mL/min, 750 mg should be taken every other day. If on subsequent testing post-randomization, the CrCl <20 mL/min, the dose is 500 mg every other day.
Cefixime 400 mg is administered orally as one tablet or capsule once daily with or without food for normal kidney function. If CrCl is between 21 to 59 mL/min, 260 mg of oral suspension should be taken once daily. If on subsequent testing post-randomization CrCl is ≤20 mL/min, 200 mg chewable tablet should be taken once daily.
Amoxicillin-clavulanate 875/125 mg is administered orally as one tablet twice daily ideally at the start of a meal for normal kidney function. If on subsequent testing post-randomization CrCl is between 10 and < 20 mL/min, 500/125 mg should be taken twice daily or if CrCl is < 10 mL/min, 500/125 mg should be taken once daily.
TMP-SMX 160/800 mg is administered orally as one double-strength tablet twice daily with or without food for normal kidney function. If on subsequent testing post-randomization CrCl is between 15 and <20 mL/min, one single-strength tablet (TMP-SMX 80/400 mg) should be taken twice daily. This treatment should not be given if CrCl is <15 mL/min.
4.4.6. Blinding
None; this is an open-label trial.

Statistical Analysis Plan - DMID Protocol: 15-0045 Version 1.0 16JUL2020
- 14 - PRIVILEGED AND CONFIDENTIAL COMMUNICATION
4.4.7. Prior and Concomitant Therapy
Medication history (concomitant medications) will include a review of all current medications and medications taken within 30 days before signing the informed consent form (ICF) through the TOC visit. Prescription and over-the-counter drugs will be included as well as herbals, vitamins, and supplements.
When co-administered with fosfomycin, metoclopramide lowers the serum concentration and urinary excretion of fosfomycin, with other drugs that increase gastrointestinal motility producing similar effects. Subjects should be counseled regarding this potential interaction and metoclopramide dosing should be separated by at least 3 hours from fosfomycin dosing.
Levofloxacin should be administered at least 2 hours before or 2 hours after antacids containing magnesium or aluminum, as well as sucralfate, metal cations (e.g., iron), multivitamins containing zinc, or didanosine chewable/buffered tablets.
4.4.8. Treatment Compliance
Subjects will be directly observed at the time of first dosing by a member of the clinical research team who is trained to administer the study drug. Administration will be documented on the source document and entered in the eCRF. A pill/sachet count will be performed.
4.5. Efficacy and Safety Variables For the primary outcome, the frequency and proportion of subjects achieving treatment success at the TOC visit will be reported by treatment strategy. For the secondary and exploratory efficacy outcomes, the frequency and proportion of subjects achieving treatment success, clinical cure, microbiological success, and adjustment-free treatment success at TOC and EOT will be reported by treatment strategy and will be reported overall as well as stratified by subgroups including cUTI type, investigator-adjusted therapy, age group (<65, ≥65 years), BMI (<30, ≥30 kg/m2) , sex, creatinine clearance (≥60 mL/min, <60 mL/min), indwelling urinary catheter, obstructive uropathy, diabetes, recurrent UTI status, number of days of antibiotics use ( ≤7, > 7 days), and susceptibility to various pathogens at baseline. Note that subgroup analysis will be performed only for subgroups with total sample size above 10 subjects. Refer to Section 3.3 for definitions of treatment success, clinical cure, and microbiological success (cure).
95% confidence intervals (CIs) of frequencies of solicited and unsolicited AEs, SAEs and adverse events of special significance (AESIs) will be provided using the Wilson method.
Frequency and number of solicited AEs of grade 2 and above will be reported by treatment strategy, study day, and severity, and differences between treatment arms in frequency of grade 2 and above severity solicited AEs after the first dose of study drug will be tested using Fisher Exact Tests. For subjects receiving fosfomycin, frequency and number of each solicited adverse event of grade 2 and above severity occurring any time from date of first dose of fosfomycin in subjects receiving 2 or more doses until 2 days after last dose of fosfomycin will be tabulated. See Table 1 for schedule of study procedures.
Frequency and number of SAEs in subjects receiving at least two doses of fosfomycin during the trial will be tabulated.
All AEs will be graded for severity and relationship to study drug (see definitions below). AEs characterized as intermittent require documentation of onset and duration of each episode. The start and stop date of each reported AE will be recorded on the appropriate data collection form and eCRF.
Only Grade 2 and above AEs and SAEs will be reported. AESIs of any grade will be reported.

Statistical Analysis Plan - DMID Protocol: 15-0045 Version 1.0 16JUL2020
- 15 - PRIVILEGED AND CONFIDENTIAL COMMUNICATION
Severity of Event:
Solicited AEs will be assessed by the investigator using a protocol-defined grading system (Table 3). For unsolicited AEs, the following guidelines will be used to quantify severity:
• Mild (Grade 1): Events require minimal or no treatment; do not interfere with the subject’s daily activities.
• Moderate (Grade 2): Events result in a low level of inconvenience or concern with therapeutic measures; may cause some interference with functioning and daily activities.
• Severe (Grade 3): Events interrupt the subject’s daily activities and may require systemic drug therapy or other treatment; are usually incapacitating.
Changes in the severity of an AE should be documented to allow an assessment of the duration of the AE at each level of intensity to be performed.

Statistical Analysis Plan - DMID Protocol: 15-0045 Version 1.0 16JUL2020
- 16 - PRIVILEGED AND CONFIDENTIAL COMMUNICATION
5. SAMPLE SIZE CONSIDERATIONS This is a Phase IV multicenter, open-label, randomized pragmatic superiority clinical trial comparing two strategies for step-down oral therapy for cUTI. The basic null hypothesis of this trial is:
H0: The probability of success (clinical cure and microbiological cure) at TOC is not conditional on the treatment strategy.
This hypothesis testing question will result in one of three statements regarding the results of this trial:
1. Strategy 1 is superior to Strategy 2.
2. Strategy 2 is superior to Strategy 1.
3. Evidence from the trial is insufficient to conclude that either strategy is superior.
The primary analysis will use the micro-ITT population, defined as all randomized subjects who have a positive baseline bacterial culture of urine. Subjects will not be excluded from this population based upon events that occurred post-randomization (e.g., loss to follow-up). An assumption of 92% micro-ITT eligibility is made for the sample size calculations. If 634 subjects are enrolled with 1:1 allocation, 291 subjects per arm would be expected to qualify for the micro-ITT population. Assuming a 10% difference in treatment success at TOC, with 80% success for one strategy and 70% success for the other strategy, there will be 80% power to reject the null hypothesis using a two sided ztest (without continuity correction), with a Type I error rate of 5%. These calculations assume an interim analysis after 40% of subjects have completed the study, with Type I error controlled using Lan DeMets with an O’Brien Fleming spending function. The specific success rates of 70% and 80% are based on a 10% clinically significant difference an approximate rate of success consistent with example calculations in the FDA guidance for cUTI studies. Sample size calculations were computed using PASS 2008 software. The calculations do not adjust for dropout, because analysis methods will include subjects that have dropped out early, assuming they meet micro-ITT criteria (Section 6.3.1).
If true success rates are instead 65% and 75%, there will be 75% power to conclude a difference in the strategies. If true success rates are 80% and 90%, there will be 92% power to conclude a difference.
However, this study was terminated early due to slow enrollment with only 62 subjects enrolled in the study. Only 48 out of the 62 subjects were eligible to be in the micro-ITT analysis population. Using the same assumptions of 10% difference in the treatment success, there was only a 12% power to reject the null hypothesis using a two sided z-test (without a continuity correction) with a Type I error rate of 5. Given this low power, the efficacy results should be interpreted with caution as to not make any conclusions regarding the superiority of either strategy.

Statistical Analysis Plan - DMID Protocol: 15-0045 Version 1.0 16JUL2020
- 17 - PRIVILEGED AND CONFIDENTIAL COMMUNICATION
6. GENERAL STATISTICAL CONSIDERATIONS
6.1. General Principles All continuous variables will be summarized using the following descriptive statistics: n (non-missing sample size), mean, standard deviation, median, maximum and minimum. The frequency and percentages (based on the non-missing sample size) of observed levels will be reported for all categorical measures. In general, all data will be listed, sorted by treatment group, and subject, and when appropriate by time within subject. The listing of non-subject specific protocol deviation will be sorted by site, start date and deviation. All summary tables will be structured with a column for each treatment and will be annotated with the total population size relevant to that table/treatment.
6.2. Timing of Analyses The final analysis described in this SAP will be performed after database lock.
6.3. Analysis Populations The primary analysis will be performed using the micro-ITT population. Other analyses, as specified below, may use the complete cases (CC) at Test of Cure or End of Therapy (CC-TOC or CC-EOT) populations. Analyses of the micro-ITT population will include imputation for missing data (Section 8.4), while analyses of the CC populations will not contain missing data by design. Analysis of clinical cure will use the ITT analysis population and will include imputation for missing data. Analysis of clinical cure will be repeated to use all subjects in ITT with complete data. Analysis of unsolicited events will use the Fosfomycin safety analysis population while analysis of solicited events will use both the Safety and Fosfomycin Safety populations.
Reasons for exclusion from each analysis population are summarized in Table 7 and shown by subject in Listing 4. Excluded subjects might satisfy multiple criteria justifying their exclusion but will have only the first exclusion criteria met for a given population indicated in Table 7 and Listing 4. The reason indicated will be determined by the following rules in order.
ITT Analysis Exclusion Reasons:
• Subject not randomized
Micro-ITT Analysis Exclusion Reasons:
• Subject does not have a baseline culture from a urine sample taken prior to treatment with study drug • Baseline culture is not positive for a uropathogen or is contaminated
CC-TOC Analysis Exclusion Reasons:
• Subject not in micro-ITT population • Subject not treated with at least one dose of study product • Early termination before TOC • Missing urine culture or had a urine culture that was contaminated at TOC
CC-EOT Analysis Exclusion Reasons:
• Subject not in micro-ITT population

Statistical Analysis Plan - DMID Protocol: 15-0045 Version 1.0 16JUL2020
- 18 - PRIVILEGED AND CONFIDENTIAL COMMUNICATION
• Subject not treated with at least one dose of study product • Early termination before EOT • Missing urine culture or had a urine culture that was contaminated at EOT
Safety Analysis Exclusion Reasons:
• Subject not treated with at least one dose of study product
Fosfomycin Safety Analysis Exclusion Reasons:
• Subject not treated with at least two doses of Fosfomycin
6.3.1. Intent-to-Treat Population
The ITT population includes all randomized subjects regardless of whether they received the study treatment of not. This analysis population will be used for the analysis of clinical cure.
6.3.2. Microbiological Intent-to-Treat Population
The micro-ITT population includes all randomized subjects who have a positive baseline bacterial culture of urine. Positive baseline culture is defined as a culture grown from a urine sample collected prior to treatment with study drug that has ≥105 colony forming units (CFU)/mL (50,000 and above is an allowed cut-off provided it is a causative uropathogen) for non-catheter specimens OR ≥104 CFU/mL for catheter specimens of a single species of bacteria that causes cUTI. Subjects will not be excluded from this population based on events that occur after randomization. Whether the organism is a causative pathogen is collected in the data system as MIB.MIBP1UTI, MIB.MIBP2UTI, etc. A urine culure will be defined as contaminated if three organisms are detected or contaminants are indicated; when there isn't at least one non-contaminant pathogen with >=50,000 CFU/mL and all contaminant pathogens are <=40,000 CFU/mL. Multiple imputation as described in Section 8.4.1 will be used in the case of missing values for treatment success, clinical cure, or microbiological success at TOC and EOT in the micro-ITT population.
6.3.3. Complete Case Populations
The CC-TOC and CC-EOT populations include all subjects from the micro-ITT population who received at least one dose of study product and have non-missing values for treatment success at TOC or EOT, respectively. Exclusion from CC analysis population due to a urine culture that was contaminated at TOC or EOT will be reviewed prior to finalization. Subjects in the CC analysis populations are analyzed as randomized without imputation. Both CC populations will be used for analysis of exploratory endpoints.
6.3.4. Safety Population
The Safety Population includes all enrolled subjects who received at least one dose of study drug. The analyses on the Safety Population will be performed using the actual treatment received.
6.3.5. Fosfomycin Safety Population
The Fosfomycin Safety Population includes all enrolled subjects who received at least two doses of Fosfomycin.

Statistical Analysis Plan - DMID Protocol: 15-0045 Version 1.0 16JUL2020
- 19 - PRIVILEGED AND CONFIDENTIAL COMMUNICATION
6.4. Covariates and Subgroups Subjects were stratified by (1) pyelonephritis vs. other cUTIs and (2) participating site at randomization. Although the protocol does not define any formal subgroup analyses, for secondary and exploratory efficacy outcomes, analyses of treatment success, clinical cure, and microbiological success at TOC and EOT will reported by treatment strategy and overall and will additionally be stratified by subgroups including cUTI type, indwelling urinary catheter, obstructive uropathy, recurrent UTI status, diabetes status, age group (<65, ≥65 years), BMI (<30, ≥30 kg/m2) , sex, creatinine clearance (≥60 mL/min, <60 mL/min), investigator-adjusted therapy, number of days of antibiotics use ( ≤7,> 7 days), pathogen at baseline (including further subgrouping by antibiotic susceptibility). Note that subgroup analysis will be performed only for subgroups with total sample size above 10 subjects.
6.5. Missing Data While all efforts will be made to minimize missing data, some missing data is expected. Whenever possible, subjects terminating from the study early will be given an early termination visit during which all assessments that would have been completed at the EOT visit should be made. The primary analysis will use multiple imputation as detailed in Section 8.4.1. The primary analysis will be repeated using CC populations without imputation. A sensitivity analysis considering various scenarios for the values of the missing data will also be performed.
6.6. Interim Analyses and Data Monitoring Regular reviews for safety by a DSMB were planned, with the first one occurring approximately 12 months following the enrollment of the first participant. However, this DSMB meeting did not occur since the study was terminated before the 12-month timeline. The DSMB may also review available safety data if a halting rule was met or convene an ad hoc meeting to discuss any issue of safety raised by an investigator, the sponsor, or a member of the DSMB. No halting rules were met in this study. There are no additional formal stopping rules based on safety data assessed in interim safety reviews.
One formal interim analysis of efficacy was scheduled to occur after approximately 40% of subjects completed the trial but will not be performed due to the study closing early.
6.7. Multicenter Studies This is a multicenter study with a total of 6 sites participating in the trial which were: University of Rochester, Emory University Hospital-Midtown, Grady Memorial Hospital, Hope Clinic of the Emory Vaccine Center, Northwestern University, and University of Iowa. Only 5 of the 6 sites had enrolled subjects by the time of study closure; Northwestern University did not enroll any subjects. During randomization, subjects are stratified by participating site, but in the primary analysis, data will be pooled across all clinical sites.
6.8. Multiple Comparisons/Multiplicity The results presented in this report will not be adjusted for multiple comparisons. The 5% significance level will be used for all tests.
Statistical Analysis Plan - DMID Protocol: 15-0045 Version 1.0 16JUL2020
- 20 - PRIVILEGED AND CONFIDENTIAL COMMUNICATION
7. STUDY SUBJECTS
7.1. Disposition of Subjects Reasons for screening failures will be summarized in Table 10. The completion status and reasons for early termination or treatment discontinuation will be summarized in Table 6. A listing of subjects who discontinued treatment or terminated from study follow-up and the reason will be included in Listing 1. A subject could be discontinued early due to an AE (serious or non-serious), being diagnosed with bacteremia with a uropathogen, loss to follow-up, non-compliance with study, voluntary withdrawal by subjects/subject’s LAR, withdrawal at the investigator request, termination of the site by the sponsor, termination of the study by the sponsor, death, lack of eligibility at enrollment, or becoming ineligible after enrollment.
The composition of analysis populations, including reasons for subject exclusion, by treatment arm, will be presented in Table 7. Table 8 will present the number of enrolled subjects who received study product by site and treatment group.
A flowchart showing the disposition of study subjects, adapted from the CONSORT Statement will be included in Figure 1. This figure will present the number of subjects screened, enrolled and randomized, received study drug, included in the micro-ITT population, and received an investigator-adjusted therapy by treatment arm.
7.2. Protocol Deviations A summary of subject-specific protocol deviations will be presented by the reason for the deviation, the deviation category, and treatment group for all subjects in Table 2. All subject-specific protocol deviations and non-subject specific protocol deviations will be presented in Listing 2 and Listing 3, respectively. Major protocol deviations will be discussed.

Statistical Analysis Plan - DMID Protocol: 15-0045 Version 1.0 16JUL2020
- 21 - PRIVILEGED AND CONFIDENTIAL COMMUNICATION
8. EFFICACY EVALUATION Tables containing an asterisk (*) in the title indicate tables and figures that will be provided to the PI for publication in the primary manuscript while the rest of the tables, figures, and listing will be provided to the FDA in the abbreviated CSR.
8.1. Primary Efficacy Analysis
8.1.1. Analysis of Treatment Success at TOC in the Micro-ITT Population
The primary efficacy endpoint is the difference in the proportion of subjects achieving treatment success at TOC between Strategy 1 and Strategy 2. The primary efficacy analyses will be performed for the micro-ITT population.
The null hypothesis corresponding to the primary analysis of this study was:
H0: The treatment success at TOC is not conditional on the treatment strategy.
This test will be conducted using the Wald test from linear regression using the multiple imputation model.
The primary analysis will use multiple imputation with a linear regression model without rounding to impute missing values for treatment success at TOC in the micro-ITT population [1 and 2].
Although the linear regression without rounding can sometimes yield implausible imputed values of treatment success, Horton et.al (2003) [2] showed this method yields an unbiased estimate of the binomial proportion.
• Let 𝑌𝑌1,𝑌𝑌2, … ,𝑌𝑌𝑁𝑁 be independent and identically distributed (iid) Bernouilli random variables
• Let 𝑝𝑝 = 𝐸𝐸(𝑌𝑌𝑖𝑖) be the probability of success
• Assume that only 𝑛𝑛 out of the 𝑁𝑁 Bernoulli data points are observed; the rest are missing. For simplicity, assume Let 𝑌𝑌1,𝑌𝑌2, … ,𝑌𝑌𝑛𝑛 are observed and Let 𝑌𝑌𝑛𝑛+1, … ,𝑌𝑌𝑁𝑁 are missing. We further assume that data is Missing Completely at Random (MCAR).
For estimating 𝑝𝑝, the minimum variance unbiased estimate (MVUE) of 𝑝𝑝 denoted by �̂�𝑝 which is simply the mean of observed data, i.e.,
�̂�𝑝 = 1𝑛𝑛
�𝑌𝑌𝑖𝑖
𝑛𝑛
𝑖𝑖=1
Rubin and Schenker (1986) [4] proposed using a full normal imputation method to impute missing values 𝑌𝑌𝑛𝑛+1, … ,𝑌𝑌𝑁𝑁 which assumes that the 𝑌𝑌𝑖𝑖 are iid from normal distribution with mean 𝑝𝑝 and variance 𝜎𝜎2. This method follows the following algorithm to generate the missing values.
This full normal imputation method without rounding incorrectly assumes a normal distribution and can sometimes yield implausible imputed values (above 1 or below 0). However, it produces an unbiased estimate of the probability of success 𝑝𝑝.
Allison (2005) [1] showed that this approach can be extended to allow covariates in the model. Hence, Using simulation studies, Allison showed that multiple imputation using linear regression performed well in estimating regression coefficients in different missing data scenarios (MCAR, MAR) even when compared to logistic regression. The added benefit of using the linear regression model is that it directly provides proportion differences along with their 95% CI after applying PROC MIANALYZE to the model fits from the 𝑀𝑀 multiply imputed datasets.

Statistical Analysis Plan - DMID Protocol: 15-0045 Version 1.0 16JUL2020
- 22 - PRIVILEGED AND CONFIDENTIAL COMMUNICATION
Due to the low sample size at the close of the study, the results of this hypothesis test should be interpreted with care since the required power to conclude a significant difference was not achieved. An estimate of the composite cure and composite cure difference between the two strategies along with its 95% Wald CI (no continuity correction) and p-value will be provided.
Details of multiple imputation methods for efficacy outcomes specific to DMID-15045 are described in Section 8.4.1.
Step 1: A multiple regression model: 𝑌𝑌𝑖𝑖 = 𝛽𝛽0 + 𝛽𝛽1𝑋𝑋1 + 𝛽𝛽2𝑋𝑋2 + 𝛽𝛽3𝑋𝑋3 + ⋯+ 𝛽𝛽𝑐𝑐𝑋𝑋𝑐𝑐 + 𝜖𝜖𝑖𝑖 , 𝜖𝜖𝑖𝑖 ∼ 𝑁𝑁(0,𝜎𝜎2) where 𝑌𝑌𝑖𝑖 represents the indicator for composite cure and 𝑋𝑋𝑐𝑐 are the covariates decribed in Section 8.4.1 to be used in the multiple imputation model to generate M multiply imputed datasets.
Step 2: A simple linear regression model 𝑌𝑌𝑖𝑖 = 𝛽𝛽0 + 𝛽𝛽1𝑡𝑡𝑡𝑡𝑡𝑡 + 𝜖𝜖𝑖𝑖 will be fit on each of the m multiply imputed datasets. Estimates of composite cure from each of the m models will be given by the 𝛽𝛽1 which represent the difference in treatment success between the tro strategies.
Step 3: The final composite cure will be obtained by combining M estimates of composite cure estimates using PROC MIANALYZE as described in Section 8.4.1. The p-value for trt from this step will be used for hypothesis testing. The null hypothesis will be rejected if the p-value is less than or equal to 0.05 and will conclude that the treatment success at TOC is conditional on treatment strategy. If the composite cure estimate for strategy 1 is above that of strategy 2 and the p-value is ≤ 0.05, then we can conclude that strategy 1 is superior to strategy 2 at TOC. Similarly, if the composite cure estimate for strategy 2 is above that of strategy 1 and the p-value is ≤ 0.05, then we can conclude that strategy 2 is superior to strategy 2 at TOC. If the null hypothesis is not rejected, we will conclude that evidence from the trial is insufficient to conclude that either strategy is superior.
The proportion of subjects with composite cure at TOC in each strategy will be provided. The difference in the proportion of subjects having composite cure at TOC between Strategy 1 and Strategy 2 along with the 95% Wald CI (no continuity correction) for the treatment difference from Step 3 above will be provided (Table 20). A listing of urine culture results used for calculating microbiological cure is provided in Listing 8. A listing of UTI signs and symptoms used for calculating clinical cure at TOC is provided in Listing 9.
8.2. Secondary Efficacy Analyses
8.2.1. Analysis of Composite Cure at EOT in the Micro-ITT Population, Performed in an Analogous Manner to the Primary Analysis
The secondary efficacy endpoint is the difference in the proportion of subjects achieving treatment success at EOT between Strategy 1 and Strategy 2. The secondary efficacy analyses will also be performed for the micro-ITT population.
The null hypothesis corresponding to the secondary analysis of this study was:
H0: The probability of success at EOT is not conditional on the treatment strategy.
The secondary analysis will be conducted in a similar manner as the primary analysis by using multiple imputation with a linear regression model to impute missing values for treatment success at EOT in the micro-ITT population. Details of the multiple imputation methods are described in Section 8.1.1. and Section 8.4.1.
The proportion of subjects with composite cure at EOT in each strategy will be provided. The difference in the proportion of subjects having composite cure at EOT between Strategy 1 and Strategy 2 along with the 95% CI for the treatment success difference will be provided (Table 20). A listing of individual

Statistical Analysis Plan - DMID Protocol: 15-0045 Version 1.0 16JUL2020
- 23 - PRIVILEGED AND CONFIDENTIAL COMMUNICATION
microbiological response data at EOT is provided in Listing 8 and a listing of UTI symptoms used for calculating clinical cure at EOT is provided in Listing 9.
8.2.2. Sensitivity Analyses of Composite Cure at TOC and EOT in the Micro-ITT Population
A sensitivity analysis will be performed for the primary analysis using subjects in the micro-ITT population that have no missing treatment success values at TOC (CC-TOC Population) and EOT (CC-EOT Population). These subjects will be analyzed as randomized without imputation. The treatment success will be estimated from this model: 𝑌𝑌𝑖𝑖 = 𝛽𝛽0 + 𝛽𝛽1𝑡𝑡𝑡𝑡𝑡𝑡 + 𝜖𝜖𝑖𝑖
For this analysis, estimate of treatment success in each strategy, the difference in the proportion of subjects in this population having composite cure at TOC and EOT between Strategy 1 and Strategy 2 with the 95% Wald CI (no continuity correction), and p-value will be provided in Table 21. Additionally, a sensitivity analysis of best/worst case scenarios using various percentages of missing composite cure is provided in Table 24 for TOC and Table 25 for EOT.
8.3. Exploratory Efficacy Analyses Multiple exploratory efficacy analyses will be performed for this study using subjects in the micro-ITT population with no missing values at EOT and TOC, the endpoints of interest (CC-EOT and CC-TOC Populations, respectively).
A comparison of the proportion of subjects achieving clinical cure and microbiological success at EOT and TOC between Strategy 1 and Strategy 2 will be provided in Table 20 using micro-ITT population and Table 21 using CC populations. Analysis of clinical cure will be repeated using ITT analysis population with multiple imputation (Table 22) and using all subjects with non-missing clinical cure without multiple imputation (Table 23).
Comparison of subjects achieving treatment success, clinical cure, and microbiological cure at TOC between the two treatment strategies, including the 95% CI, stratified by multiple subgroups including cUTI type, indwelling urinary cather, obstructive uropathy, recurrent UTIs, baseline characteristics (Age, BMI, sex, creatinine clearance etc.), adjustment of therapy per protocol, number of days of unique antibiotics prescribed between randomization and TOC (≤7 days vs. >7 days), and susceptibility to various pathogens at baseline will be provided in Table 26, Table 28, Table 29, and Table 32, respectively. Similar comparisons for the proportions of subjects achieving treatment success, clinical cure, and microbiological cure at EOT between Strategy 1 and Strategy 2 will be provided in Table 27, Table 30, Table 31, and Table 33, respectively. Note that Table 5 provides a list of antimicrobial categories for several antibiotics will be used to determine whether a pathogen is multidrug resistant [5].
8.4. Imputation of Missing Data
8.4.1. Multiple Imputation of Missing Values of Treatment Success at TOC and EOT
Primary and secondary analyses depend on multiple imputation of treatment success at TOC and EOT, respectively. First, a table showing the number and percentage of missing data for each outcome at EOT and TOC will be presented in Table 18. In order to use the MI model to adjust for bias caused by missing data, we assume that data is missing at random (MAR). To test this assumption, we will a fit a logistic model for missing data indicator D (1 if missing, 0 if non-missing) adjusting for covariates of the MI model listed below. Parameter estimates, 95% confidence intervals, and p-values from this model will be provided in

Statistical Analysis Plan - DMID Protocol: 15-0045 Version 1.0 16JUL2020
- 24 - PRIVILEGED AND CONFIDENTIAL COMMUNICATION
Table 19 at TOC and at EOT. If some of these covariates have a significant relationship with the missing data indicator (p-value ≤ 0.05), then the MAR assumption is more likely than MCAR.
In case of missing treatment success at TOC or EOT, multiple imputations of missing treatment success at TOC or EOT will be performed independently, and each subject will have their missing endpoints imputed independently of other subjects’ imputations using a subject-specific imputation model. The pseudocode shown below details how missing data for treatment success at TOC (or EOT) will be imputed using m multiply imputed datasets from linear models. The following covariates will be considered for the MI model: treatment strategy, site indicators, age, sex, pyelonephritis status, and number of bacterial species. The number of imputed, m, datasets will be chosen based on the average percent of missing data. Default value will be m=20 since sample size calculation assumed a 20% drop-out rate. Similar models will be fit for clinical cure and microbiological success.
As a first step to multiple imputation, an ordered list of variables to include in the subject-specific imputation model will be constructed. Ordering is specified so that exact imputation results from final data are prespecified may be replicated in SAS (using seeds described below). The complete ordered list of variables for the imputation models for treatment success, clinical cure, and microbiological success at TOC and EOT is below:
• Treatment Strategy (Strategy 2 is the reference)
• Indicator of subject enrolled at the site with the second most number of subjects enrolled (binary indicator)
• Indicator of subject enrolled at the site with the third most number of subjects enrolled (binary indicator)
• Indicator of subject enrolled at the site with the fourth most number of subjects enrolled (binary indicator)
• Indicator of subject enrolled at the site with the least number of subjects enrolled (binary indicator)
o Note: the site with the most number of subjects enrolled is reference for site. Language is written to allow for an arbitrary number of sites. In the event of a number of ties for the number of subjects enrolled, tied sites will be ordered in ascending alphanumeric order in the list of model variables.
• Age at enrollment
• Sex (Male is the reference)
• Indicator for pyelonephritis (No is the reference)
• Number of species detected in the urine at baseline (1 is the reference)
The actual list of MI model variables for each subject-specific imputation model will follow the ordering above but omit variables with missing values. The below pseudo-code / SAS code outlines the creation of 20 multiple imputation datasets. Note that the seeds used in the actual analysis must follow the specification given in the pseudo-code and subjects must be processed in the order described in the pseudo-code. Clinical cure and microbiological success will simultaneously be imputed with composite cure at each respective time point. The pseudo-code is in terms of TOC endpoints, but the general logic is also applicable to the EOT.

Statistical Analysis Plan - DMID Protocol: 15-0045 Version 1.0 16JUL2020
- 25 - PRIVILEGED AND CONFIDENTIAL COMMUNICATION
*Outcome variables: trtsuccess clincure microsuccess
DEFINE i=index variable for subjects having treatment success imputed.
Subjects requiring imputation are sorted in ascending order
by PATID.
DEFINE N=number of subjects requiring imputation
DEFINE g&i=analysis dataset containing predictors and treatment success for
CC-TOC subjects as well as subject i (only one subject not in
CC-TOC included). Note that CC-TOC subjects that are missing a value
for one or more variables in the subject-specific imputation model are excluded.
DEFINE imp_g&i = g&i, with 20 imputed values for the missing treatment success
added by PROC MI
DEFINE &&modelVars_&i = list of observed variables in subject i (site1, site2, site3, site4, age, sex, treatment strategy, pyelonephritis, Nbacterias), to be used for imputation of treatment success, clinical cure, and microbiological cure.
Step 1: Imputation model: This model will generate 20 datasets with each dataset containing original complete data along with imputed values for subjects with missing endpoint.
%do i=1 %to &N;
PROC MI data= g&i out= imp_g&i seed= 22131&i NIMPUTE=20 noprint;
Var &&modelVars_&i trtsuccess_TOC clincure_TOC microsuccess_TOC;
monotone regression(trtsucess_TOC = &&modelVars_&i);
monotone regression(clincure_TOC = &&modelVars_&i);
monotone regression(microsuccess_TOC = &&modelVars_&i);
run;
%end;
imp_g&i will be subset to contain only rows for the subjects with imputed treatment success, clinical cure, and microbiological success and merged together and with CC-TOC data to create the twenty complete multiply imputed datasets
Step 2: Analysis model: This model will fit regression models to the 20 complete datasets to obtain parameter estimates for treatment success, clinical cure, microbiological success.
proc reg data= imp_g outest= out_trts covout noprint;
model trtsuccess= trt /clb alpha=0.05;
by _imputation_;
run;

Statistical Analysis Plan - DMID Protocol: 15-0045 Version 1.0 16JUL2020
- 26 - PRIVILEGED AND CONFIDENTIAL COMMUNICATION
proc reg data= impdata outest= out_clinc covout noprint;
model clincure= trt /clb alpha=0.05;
by _imputation_;
run;
proc reg data= impdata outest= out_micros covout noprint;
model microsuccess= trt/clb alpha=0.05;
by _imputation_;
run;
Step 3: Combine estimates from models in step 2 to obtain overall estimatics summarized over 20 imputed datasets;
proc mianalyze data= out_trts alpha = 0.05;
modeleffects trt;
ods output ParameterEstimates=parms_trts;
run;
proc mianalyze data= out_clinc alpha = 0.05;
modeleffects trt;
ods output ParameterEstimates=parms_clinc;
run;
proc mianalyze data= out_micros alpha = 0.05;
modeleffects trt;
ods output ParameterEstimates=parms_micros;
run;
********************************************************************

Statistical Analysis Plan - DMID Protocol: 15-0045 Version 1.0 16JUL2020
- 27 - PRIVILEGED AND CONFIDENTIAL COMMUNICATION
9. SAFETY EVALUATION Safety summaries will be presented overall and grouped by treatment group. Continuous variables will be summarized using the following descriptive statistics: n (non-missing sample size), mean, standard deviation, median, maximum and minimum. All categorical measures will be summarized by the frequency and percentages of observed levels. The denominator for the percentages may be based on the number of non-missing observations for an assessment or on the number of subjects in a population. This will be described for each table. Note that tables containing an asterisk (*) in the title indicate tables that will be provided to the PI for publication.
9.1. Demographic and Other Baseline Characteristics The following will be summarized for all enrolled subjects. Summaries of sex, ethnicity, race, cUTI type, age group (< 65, ≥ 65 years), age, BMI, and baseline CrCl will be presented by site (Table 11 and Table 12) or by treatment group and overall (Table 13 and Table 14). Ethnicity is categorized as Hispanic or Latino, or not Hispanic and not Latino. In accordance with NIH reporting policy, subjects may self-designate as belonging to more than one race or may refuse to identify a race, the latter reflected in the eCRF as “No” to each racial option.
The following will be summarized for subjects in the micro-ITT population. Summaries of age, sex, race, BMI, cUTI type, baseline CrCl, medical history, and susceptibility to select pathogens will be presented by treatment group and overall (Table 15). Table 16 will present summaries of these baseline characteristics by treatment group and missing composite cure status. A pie chart showing the distribution of all uropathogens is provided in Figure 2.
Demographic information for individual subjects will be provided in Listing 5.
9.1.1. Prior and Concurrent Illnesses and Medical Conditions
Summaries of subject’s medical history will be presented by MedDRA® system organ class (SOC) and treatment group for all enrolled subjects (Table 17).
Individual subject listings for all reported medical history including prior and concurrent medical conditions will be presented in Listing 6.
9.1.2. Prior and Concurrent Medications
All concomitant medications taken within 30 days of signing the informed consent or during the study period will be recorded. Concomitant medications will be coded to the Anatomical Therapeutic Classification (ATC) using the WHO Drug Dictionary. The use of concomitant medications during the study will be summarized by ATC1 and ATC2 code and treatment group for subjects in the Safety population (Table 53). A listing of concomitant medications will be presented in Listing 19.
9.2. Measurements of Treatment Compliance Subjects will be directly observed at the time of first dosing by a member of the clinical research team who is trained to administer the study drug. Administration will be documented on the source document and entered in the eCRF. A pill/sachet count will be performed.
The number of enrolled subjects receiving the first dose of study product will be tabulated by site and treatment group (Table 8 ). The number of doses of study product administered will be presented by treatment

Statistical Analysis Plan - DMID Protocol: 15-0045 Version 1.0 16JUL2020
- 28 - PRIVILEGED AND CONFIDENTIAL COMMUNICATION
group (Table 9), and as part of the subject disposition table (Table 6). Listing 7 provides a subject listing of missed doses along with a list of extra doses if applicable.
9.3. Adverse Events All summaries of solicited AEs will be presented for the Safety Population and repeated for the Fosfomycin Safety Population. Summaries of unsolicited AEs will only be provided for the Fosfomycin Safety Population.
When calculating the incidence of AEs over multiple days (i.e., on a per subject basis), each subject will only be counted once and any repetitions of AEs within a subject will be ignored; the denominator will be the total population size on the first day of the time period (Day 1). For tabulation of AEs by day, the denominator will be the number of subjects enrolled and not withdrawn from the study by the day being described. All AEs reported will be included in the summaries and analyses.
A summary of all AEs will be provided in Table 34 for the Fosfomycin safety population. A summary of all AEs that occurred in ≥5% of subjects in the Fosfomycin safety population in any treatment group will be provided in Table 35. A summary of any grade 2 and above solicited AE, any AE that led to discontinuation of the study product, and any AESI will be provided in Table 36. Among subjects who took at least two doses of fosfomycin, the frequency and percentage of subjects who experienced at least one solicited AE, unsolicited AE, and SAE, and subjects who discontinued fosfomycin in any treatment strategy will be summarized in Table 37.
9.3.1. Solicited Events and Symptoms
Solicited AEs are AEs that are common following administration of these types of antibiotics. The solicited AEs will be collected after first dose of study product is given and until the EOT. If a subject is on fosfomycin, solicited AEs will be collected for 2 days after last dose of fosfomycin or until EOT, whichever occurs later.
Solicited events were recorded for trial Days 1-12, or until study completion or termination, as the maximum severity for each day. Only grade 2 and above solicited AEs will be reported. Target solicited events include insomnia, headache, dizziness, nausea, vomiting, constipation, diarrhea, back pain, rhinitis, pharyngitis, allergic reaction, candidiasis. The solicited events were measured by grading scales as defined in Table 3.
When calculating the incidence of solicited events, each subject will be counted once at the highest severity per day, and any repetitions will be ignored. For summaries presented separately for each treatment group, the denominator will be the number of subjects who received at least one dose of the treatment with non-missing data for the event summarized.
The number and percentage of subjects reporting at least one solicited adverse event of moderate severity or higher will be summarized for each solicited symptom and any symptom in Table 38 for the Safety analysis population. For each event, the denominator is the number of subjects in the applicable treatment group who received at least one dose of study product with non-missing data for the specific event. The 95% CIs calculated using Wilson methodology from a binomial distribution (SAS Proc Freq with a binomial option) will be presented. This analysis will be repeated in Table 39 to include subjects in the Fosfomycin safety analysis population who are those who received at least two doses of Fosfomycin.
For each systemic and any systemic event, the maximum severity over 12 days after the first dose will be summarized. The number and percentage of subjects reporting each event will be summarized by the maximum severity and treatment group. For each event, the denominator is the number of subjects who received the applicable treatment with non-missing data for the specific event. The 95% CI calculated using

Statistical Analysis Plan - DMID Protocol: 15-0045 Version 1.0 16JUL2020
- 29 - PRIVILEGED AND CONFIDENTIAL COMMUNICATION
Wilson methodology from a binomial distribution (SAS Proc Freq with a binomial option) will be presented Table 40 for the Safety population and Table 41 for the Fosfomycin safety population.
The proportion of subjects in each treatment group experiencing each solicited event will also be tabulated by day and severity level in Table 42 for the Safety population and Table 43 for the Fosfomycin safety population. Finally, solicited events will be analyzed by taking the most severe response over the follow-up period in Table 44 for the Safety population and Table 45 for the Fosfomycin safety population. Proportions for these derived binary variables will be reported along with 95% exact CIs. Comparisons of proportions by treatment groups will be given as odds ratio from the proportional odds model defined as:
𝑙𝑙𝑙𝑙𝑙𝑙𝑙𝑙𝑡𝑡(𝑃𝑃(𝑌𝑌 ≤ 𝑗𝑗)) = 𝑙𝑙𝑙𝑙𝑙𝑙 �𝑃𝑃(𝑌𝑌≤𝑗𝑗)𝑃𝑃(𝑌𝑌>𝑗𝑗)
�= αj +βtrt where j=0,1,2,3 is the ordered severity with 0=None/Mild, 2 = Moderate, 3=Severe and trt=1 for strategy 1 and trt=0 for strategy 2. In order to interpret the model, the log of odds ratio (OR) can be expressed as
Log[ odds(Severit ≤j|trt=1)/odds(Severit≤j|trt=0)] = β.
Therefore, the odds ratio calculated as eβ can be interpreted as the odds ratio of having a maximum severity less than or equal to j for strategy 1 compared to strategy 2. The 95% CI for OR and associated p-value will be obtained from the above proportional odds model using the Wald Test.
The maximum severity occurrence of each solicited event (proportion of subjects for each severity level) will be plotted for each solicited adverse event Figure 3 for the Safety population and in Figure 4 for the Fosfomycin safety population. Solicited events by subject will also be presented (Listing 10).
9.3.2. Unsolicited Adverse Events
The unsolicited AEs will be collected only in the Fosfomycin Safety Population which includes subjects who receive at least two doses of Fosfomycin from the time of second dose of fosfomycin until EOT or 2 days after last dose of fosfomycin whichever occurs later. The grading scale for AESIs is provided in Table 4.
The number and percentage of subjects reporting at least one unsolicited AE will be summarized by MedDRA SOC and preferred term (PT). A 95% CI will be presented for the percentage of subjects reporting any unsolicited AE (serious or non-serious) for each MedDRA SOC and PT (Table 46).
The following summaries for unsolicited AEs will be presented by MedDRA SOC, PT, and treatment group:
• Incidence of AEs by severity and relationship to study product (Table 47);
• Incidence of non-serious, related AEs by severity (Table 48);
• Subject listing of non-serious AEs of moderate or greater severity (Table 51);
• Bar chart displaying total frequency of AEs by severity, MedDRA SOC and treatment group (Figure 5);
• Bar chart displaying incidence of AEs by severity, MedDRA SOC and treatment group (Figure 6);
Listing 11 will present details of unsolicited AEs including Subject ID, AE description, AE onset date/end date, relationship to treatment, alternate etiology if not related, outcome, and duration of event (days).

Statistical Analysis Plan - DMID Protocol: 15-0045 Version 1.0 16JUL2020
- 30 - PRIVILEGED AND CONFIDENTIAL COMMUNICATION
9.4. Deaths, Serious Adverse Events and other Significant Adverse Events Detailed narratives will be given for any deaths or other protocol-defined SAEs that occurred during the study. Listings of SAEs will be presented including Subject ID, AE description, AE onset date/end date, reason reported as an SAE, relationship to treatment, alternate etiology if not related, outcome, and duration of event (days) (Listing 12). SAEs will also be listed in Table 49. A subject listing of adverse events of special interest will be provided in Table 50.
9.5. Pregnancies Pregnancies that occur during the study will be reported via The Emmes Company’s IDES on the Pregnancy Report form within 5 days of site awareness.
Efforts will be made to follow all pregnancies occurring during the study through to outcome, as described in the MOP (e.g., delivery, spontaneous abortion, therapeutic abortion, etc.).
Listing 20, Listing 21, Listing 22, Listing 23, and Listing 24 will present any study pregnancies and their outcomes.
9.6. Clinical Laboratory Evaluations Serum chemistries (including Cr, BUN, glucose, sodium, potassium, chloride, bicarbonate, calcium), urinalysis (including dipstick analysis and microscopic evaluation to assess WBCs, nitrites, leukocyte esterase and squamous epithelial cells), and hematology including complete blood count (with RBC count, hemoglobin, hematocrit, total WBC count with differential counts, and platelet count), were ordered at the screening visit if not already done as standard of care.
Liver function tests (AST, ALT, alkaline phosphatase, total bilirubin) and LDH, albumin, total protein, PT and PTT were not required for the trial but were recorded if obtained by the primary medical team as standard of care.
Regular safety laboratory tests were not collected. However, a complete listing of screening laboratory results collected as standard of care will be presented in Listing 13 for chemistry, Listing 14 for hematology, Listing 15 for Urinalysis, and Listing 16 for liver function tests.
9.7. Vital Signs and Physical Evaluations Vital sign measurements include systolic blood pressure, diastolic blood pressure, heart rate, respiration and oral temperature. Vital signs are assessed at the Screening/Enrollment visit, Randomization visit, Interim visit, End-of-Therapy visit and the Test-of-Cure visit. For each visit, the mean, median, standard deviation, minimum, and maximum of vital signs will be calculated for temperature, respiration rate, and pulse by treatment group (Table 52). Individual vital signs measurements will be listed (Listing 17). A listing of the physical exam findings is provided in Listing 18.
9.8. Concomitant Medications Concomitant medications will be coded to the ATC using the WHO Drug Dictionary. The use of prior and concomitant medications taken during the study will be recorded on the CRFs. A by-subject listing of concomitant medication use will be presented. The use of concomitant medications during the study will be summarized by ATC1 code, ATC2 code and treatment group for the Safety Population (Table 53).

Statistical Analysis Plan - DMID Protocol: 15-0045 Version 1.0 16JUL2020
- 31 - PRIVILEGED AND CONFIDENTIAL COMMUNICATION
10. REPORTING CONVENTIONS P-values ≥0.001 and ≤0.999 will be reported to 3 decimal places; p-values less than 0.001 will be reported as “<0.001”; p-values greater than 0.999 will be reported as “> 0.999“. The mean, standard deviation, and any other statistics other than quantiles, will be reported to one decimal place greater than the original data. Quantiles, such as median, or minimum and maximum will use the same number of decimal places as the original data. Proportions will be presented as two decimal places; values <0.01 will be presented as “<0.01”. Percentages will be reported to the nearest whole number; non-zero values < 1% will be presented as “<1”; values greater than 99% but less than 100% will be presented as >99. Estimated parameters, not on the same scale as raw observations (e.g. regression coefficients) will be reported to 3 significant figures.

Statistical Analysis Plan - DMID Protocol: 15-0045 Version 1.0 16JUL2020
- 32 - PRIVILEGED AND CONFIDENTIAL COMMUNICATION
11. TECHNICAL DETAILS SAS version 9.4 or above will be used to perform analyses and to generate all tables, figures and listings.

Statistical Analysis Plan - DMID Protocol: 15-0045 Version 1.0 16JUL2020
- 33 - PRIVILEGED AND CONFIDENTIAL COMMUNICATION
12. SUMMARY OF CHANGES IN THE CONDUCT OF THE STUDY OR PLANNED ANALYSES
Changes to the Planned Analyses
The trial closed early after only 12 months of enrollment. At the time of study closure, only 62 of 634 subjects were enrolled. The early closure impacts some of the planned analyses. The following are changes to the analyses:
• An interim analysis of efficacy will not be performed.
• Analysis of treatment success for subjects with Fosfomycin or levofloxacin heteroresistance will not be part of the abbreviated CSR and primary manuscript. Details regarding analysis of these data might be provided in a separate analysis document to be included in a secondary manuscript.
• Analysis of relapse infection by treatment strategy is not part of this analysis document and will not be provided in the abbreviated CSR and primary manuscript.
• The ITT analysis population was added to allow comparison of treatment strategies based on clinical presentation only.

Statistical Analysis Plan - DMID Protocol: 15-0045 Version 1.0 16JUL2020
- 34 - PRIVILEGED AND CONFIDENTIAL COMMUNICATION
13. REFERENCES 1. Allison, Paul. (2005). Imputation of categorical variables with PROC MI.
2. Horton N.J., Lipsitz S.R., and Parzen, M. (2003) A potential for bias when rounding in multiple imputation. American Statistician 57: 229-232.
3. Marshall, A., Altman, D.G., Holder, R.L. and Royston, P., 2009. Combining estimates of interest in prognostic modelling studies after multiple imputation: current practice and guidelines. BMC medical research methodology, 9(1), p.1.Allison, Paul. (2005). Imputation of categorical variables with PROC MI.
4. Rubin, D. B., and Schenker, N. (1986), “Multiple Imputation for Interval Estimation from Simple Random Samples with Ignorable Nonresponse,” Journal of the American Statistical Association, 81, 366–374.
5. Magiorakos AP, Srinivasan A, Carey RB, et al. Multidrug-resistant, extensively drug-resistant and pandrug-resistant bacteria: an international expert proposal for interim standard definitions for acquired resistance. Clin Microbiol Infect. 2012;18(3):268‐281.

Statistical Analysis Plan - DMID Protocol: 15-0045 Version 1.0 16JUL2020
- 35 - PRIVILEGED AND CONFIDENTIAL COMMUNICATION
14. LISTING OF TABLES, FIGURES, AND LISTINGS Table, figure, and listing shells are presented in Appendices 1, 2, and 3.

Statistical Analysis Plan - DMID Protocol: 15-0045 Version 1.0 16JUL2020
- 36 - PRIVILEGED AND CONFIDENTIAL COMMUNICATION
APPENDICES

Statistical Analysis Plan - DMID Protocol: 15-0045 Version 1.0 16JUL2020
- 37 - PRIVILEGED AND CONFIDENTIAL COMMUNICATION
APPENDIX 1. TABLE MOCK-UPS
LIST OF TABLES
Table 1: Schedule of Study Procedures ....................................................................................41
Table 2: Distribution of Protocol Deviations by Category, Type, and Treatment Group ..........................................................................................................................44
Table 3: Solicited Adverse Event Grading Scale ......................................................................45
Table 4: Adverse Events of Special Interest Grading Scale .....................................................46
Table 5: List of Antibiotics by Pathogen and Antibiotic Category ..........................................47
Table 6: Subject Disposition by Treatment Group - All Enrolled Subjects .............................50
Table 7: Analysis Populations by Treatment Group - All Enrolled Subjects ...........................51
Table 8: Number of Enrolled Subjects that Received Study Product by Site and Treatment Group .........................................................................................................52
Table 9: Treatment Compliance by Treatment Group - All Enrolled Subjects ........................53
Table 10: Ineligibility Summary of Screen Failures ...................................................................54
Table 11: Summary of Categorical Demographic and Baseline Characteristics by Site - All Enrolled Subjects ..................................................................................................55
Table 12: Summary of Continuous Demographic and Baseline Characteristics by Site - All Enrolled Subjects ..................................................................................................56
Table 13: Summary of Categorical Demographic and Baseline Characteristics by Treatment Group - All Enrolled Subjects ...................................................................58
Table 14: Summary of Continuous Demographic and Baseline Characteristics by Treatment Group - All Enrolled Subjects ...................................................................59
Table 15: Summary of Demographic and Baseline Characteristics by Treatment Group - Micro-ITT Population* ............................................................................................60
Table 16: Summary of Demographic and Baseline Characteristics by Treatment Group and Missing Composite Cure Status- Micro-ITT Population* ...................................61
Table 17: Summary of Subjects with Pre-Existing Medical Conditions by MedDRA System Organ Class and Treatment Group - All Enrolled Subjects ...........................62
Table 18: Number and Percentage of Missing Data by Study Endpoint, Timepoint, and Treatment Group* .......................................................................................................63
Table 19: Verification of the MAR Missing Data Assumption Using Logistic Regression Model with Missing Composite Cure Indicator as the Outcome - Micro-ITT Population* ...............................................................................................64

Statistical Analysis Plan - DMID Protocol: 15-0045 Version 1.0 16JUL2020
- 38 - PRIVILEGED AND CONFIDENTIAL COMMUNICATION
Table 20: Comparison of Composite Cure, Clinical Cure and Microbiological Cure Rates at TOC and EOT between Treatment Group - Micro-ITT Population* ...........66
Table 21: Comparison of Composite Cure, Clinical Cure and Microbiological Cure Rates at TOC and EOT by Treatment Group, Complete Case at EOT and TOC Populations* ......................................................................................................67
Table 22: Comparison of Clinical Cure Rates at TOC and EOT between Treatment Group - ITT Population* ............................................................................................68
Table 23: Comparison of Clinical Cure Rates at TOC and EOT between Treatment Group – All Subjects with Non-missing Clinical Cure* ............................................69
Table 24: Sensitivity Analysis of Composite Cure Rates at TOC Using Various Imputations of Missing Data, micro-ITT Population* ...............................................70
Table 25: Sensitivity Analysis of Composite Cure Rates at EOT Using Various Imputations of Missing Data, micro-ITT Population* ...............................................70
Table 26: Comparison of Composite Cure Rates at TOC between Treatment Groups by Baseline Characteristics, Therapy Adjustment, and Baseline Pathogen - Complete Case at TOC Population* ...........................................................................71
Table 27: Comparison of Composite Cure Rates at EOT between Treatment Groups by Baseline Characteristics, Therapy Adjustment, and Baseline Pathogen - Complete Case at EOT Population* ...........................................................................73
Table 28: Comparison of Clinical Cure Rates at TOC by Baseline Characteristics, Therapy Adjustment, Baseline Pathogen, and Treatment Group - Complete Case at TOC Population* ...........................................................................................75
Table 29: Comparison of Clinical Cure Rates at TOC by Baseline Characteristics, Therapy Adjustment, Baseline Pathogen, and Treatment Group – All Subjects with Non-Missing Clinical Cure at TOC* ...................................................76
Table 30: Comparison of Clinical Cure Rates at EOT by Baseline Characteristics, Therapy Adjustment, Baseline Pathogen, and Treatment Group - Complete Case at EOT Population* ............................................................................................77
Table 31: Comparison of Clinical Cure Rates at EOT by Baseline Characteristics, Therapy Adjustment, Baseline Pathogen, and Treatment Group – All Subjects with Non-Missing Clinical Cure at EOT* ...................................................78
Table 32: Comparison of Microbiological Success Rates at TOC by Baseline Characteristics, Therapy Adjustment, Baseline Pathogen, and Treatment Group - Complete Case at TOC Population* .............................................................79
Table 33: Comparison of Microbiological Success Rates at EOT by Baseline Characteristics, Therapy Adjustment, Baseline Pathogen, and Treatment Group - Complete Case at EOT Population* .............................................................81
Table 34: Overall Summary of Adverse Events – Fosfomycin Safety Population .....................83

Statistical Analysis Plan - DMID Protocol: 15-0045 Version 1.0 16JUL2020
- 39 - PRIVILEGED AND CONFIDENTIAL COMMUNICATION
Table 35: Adverse Events Occurring in 5% of Subjects in Any Treatment Group by MedDRA System Organ Class and Preferred Term, and Treatment Group – Fosfomycin Safety Population ....................................................................................84
Table 36: Number and Percentage of Subjects Experiencing Adverse Events by Treatment Group - Safety Population* .......................................................................85
Table 37: Number and Percentage of Adverse Events – Fosfomycin Safety Population* .................................................................................................................86
Table 38: Number and Percentage of Subjects Experiencing Solicited Events of Moderate Severity or Higher with 95% Confidence Intervals by Symptom and Treatment Group - Safety Population ..................................................................87
Table 39: Number and Percentage of Subjects Experiencing Solicited Events of Moderate Severity or Higher with 95% Confidence Intervals by Symptom and Treatment Group – Fosfomycin Safety Population .............................................88
Table 40: Number and Percentage of Subjects Experiencing Solicited Events of Moderate Severity or Higher with 95% Confidence Intervals by Symptom, Study Day Post Dose 1, and Treatment Group - Safety Population ...........................89
Table 41: Number and Percentage of Subjects Experiencing Solicited Events with 95% Confidence Intervals by Symptom, Day Post Dose 1, and Treatment Group – Fosfomycin Safety Population ....................................................................................90
Table 42: Number and Percentage of Subjects Experiencing Solicited Events by Symptom, Maximum Severity, Study Day Post Dose 1, and Treatment Group - Safety Population ..........................................................................................91
Table 43: Number and Percentage of Subjects Experiencing Solicited Events by Symptom, Maximum Severity, Study Day Post Dose 1, and Treatment Group - Fosfomycin Safety Population ......................................................................94
Table 44: Number and Percentage of Subjects Experiencing Solicited Adverse Events of Moderate Severity or Greater Over the Follow-up Period by Treatment Group and Severity - Safety Population .....................................................................95
Table 45: Number and Percentage of Subjects Experiencing Solicited Adverse Events of Moderate Severity or Greater Over the Follow-up Period by Treatment Group and Severity – Fosfomycin Safety Population ................................................96
Table 46: Number and Percentage of Subjects Experiencing Unsolicited Adverse Events with 95% Confidence Intervals by MedDRA System Organ Class and Preferred Term, and Treatment Group - Fosfomycin Safety Population .............97
Table 47: Number and Percentage of Subjects Experiencing Unsolicited Adverse Events by MedDRA System Organ Class and Preferred Term, Maximum Severity, Relationship, and Treatment Group – Fosfomycin Safety Population ...................................................................................................................98
Table 48: Number and Percentage of Subjects Experiencing Non-Serious Related Unsolicited Adverse Events by MedDRA System Organ Class and Preferred

Statistical Analysis Plan - DMID Protocol: 15-0045 Version 1.0 16JUL2020
- 40 - PRIVILEGED AND CONFIDENTIAL COMMUNICATION
Term, Maximum Severity, and Treatment Group – Fosfomycin Safety Population ...................................................................................................................99
Table 49: Listing of Serious Adverse Events ...........................................................................100
Table 50: Listing of Adverse Events of Special Interest ..........................................................101
Table 51: Listing of Non-Serious, Unsolicited, Moderate or Severe Adverse Events .............101
Table 52: Summary of Vital Signs by Visit and Treatment Group ..........................................105
Table 53: Number and Percentage of Subjects with Prior and Concurrent Medications by WHO Drug Classification and Treatment Group ................................................107

Statistical Analysis Plan - DMID Protocol: 15-0045 Version 1.0 16JUL2020
- 41 - PRIVILEGED AND CONFIDENTIAL COMMUNICATION
9.1 Overall Study Design and Plan Description
9.5.1 Efficacy/Immunogenicity and Safety Measurements Assessed and Flow Chart
Table 1: Schedule of Study Procedures
Scre
enin
g/
Enro
llmen
t V
isit
Ran
dom
izat
ion
(Stu
dy D
rug
Initi
atio
n) a
Inte
rim S
tudy
V
isit
(by
phon
e or
in
per
son)
Futu
re U
se
Col
lect
ione
End
of T
hera
py
Follo
w u
ph (p
hone
ca
ll)
Test
of C
ure
Uns
ched
uled
Vis
it
Early
Ter
min
atio
n V
isit
Visit Number 00
01
02
02 A
03
03 A
04
Study day (window) Day 1-2 Day 1-3 Day 7
Day 5-10 (+2 days)
Day 7-12 (+2 days)
Day 21 (+7 days)
Study day from first dose of study drug Day 2-4
Informed consent X
Review of Inclusion/Exclusion criteria X X
Medical/medication history X X X X X X X X X
Assessment of study drug compliance X X X (X) (X)
Dispense memory aid X
Review of memory aid X X X (X) (X)
Limited physical examination b X (X) (X) X X X X
Vital signs b X X (X) X X X X
Weight X X
Height X
Assessment of cUTI signs & symptoms X X X X X X X
Investigator’s assessment of improvement X X X X X
Randomization X
Pregnancy test c X

Statistical Analysis Plan - DMID Protocol: 15-0045 Version 1.0 16JUL2020
Table 1: Schedule of Study Procedures (continued)
- 42 - PRIVILEGED AND CONFIDENTIAL COMMUNICATION
Scre
enin
g/
Enro
llmen
t V
isit
Ran
dom
izat
ion
(Stu
dy D
rug
Initi
atio
n) a
Inte
rim S
tudy
V
isit
(by
phon
e or
in
per
son)
Futu
re U
se
Col
lect
ione
End
of T
hera
py
Follo
w u
ph (p
hone
ca
ll)
Test
of C
ure
Uns
ched
uled
Vis
it
Early
Ter
min
atio
n V
isit
Visit Number 00
01
02
02 A
03
03 A
04
Study day (window) Day 1-2 Day 1-3 Day 7
Day 5-10 (+2 days)
Day 7-12 (+2 days)
Day 21 (+7 days)
Study day from first dose of study drug Day 2-4
Clin
ical
La
bora
tory
Serum chemistries d (3 mL)
X
Hematology d (4 mL) X
Urinalysis d X
Future use samples (optional)
Xe
15 ml blood 10 ml urine
(Xe) 3 ml blood 10 ml urine
Blood culturesf (32-40 mL) X (Xf) (Xf) (Xf) (Xf)
Urine specimen for culture Xg Xg Xg Xg Xg
Review culture results Xi Xi Xj
Study drug administration X-As Described in the Summary-X
Collection of solicited and unsolicitedh
grade 2 and above AEs X X X X X (X) (X)
Collection of AESIs X X X X X X X X
Collection of SAEsh X X X X X X X X (X) – As indicated/appropriate. aRandomization and study drug initiation must occur within 48 hours of Enrollment visit. bLimited physical examination includes abdominal, flank, and suprapubic palpation, and examination of any other body site as indicated by subject symptomatology; vital signs include blood pressure, heart rate, respiration rate, and temperature. cA urine or serum pregnancy test will be performed on women of childbearing potential within 48 hours before the first dose of study drug unless performed as SOC. dHematology includes complete blood count (with RBC count, hemoglobin, and hematocrit, total WBC count with differential counts, platelet count). Serum Chemistry includes Cr, BUN, glucose, sodium, potassium, chloride, bicarbonate, calcium, SGPT, SGOT, alkaline phosphatase, total bilirubin, Urinalysis includes dipstick analysis and microscopic evaluation includes for WBC, nitrites,

Statistical Analysis Plan - DMID Protocol: 15-0045 Version 1.0 16JUL2020
Table 1: Schedule of Study Procedures (continued)
- 43 - PRIVILEGED AND CONFIDENTIAL COMMUNICATION
Scre
enin
g/
Enro
llmen
t V
isit
Ran
dom
izat
ion
(Stu
dy D
rug
Initi
atio
n) a
Inte
rim S
tudy
V
isit
(by
phon
e or
in
per
son)
Futu
re U
se
Col
lect
ione
End
of T
hera
py
Follo
w u
ph (p
hone
ca
ll)
Test
of C
ure
Uns
ched
uled
Vis
it
Early
Ter
min
atio
n V
isit
Visit Number 00
01
02
02 A
03
03 A
04
Study day (window) Day 1-2 Day 1-3 Day 7
Day 5-10 (+2 days)
Day 7-12 (+2 days)
Day 21 (+7 days)
Study day from first dose of study drug Day 2-4
leukocyte esterase and squamous epithelial cells. These data are gathered at baseline; if they are not obtained by the primary medical team, then the study provider should order them as study labs. LDH, albumin, total protein, PT, and PTT are not required for the study but should be recorded if ordered by the primary medical team. eSamples to be collected for future use on a subset of subjects who complete Strategy 1 without adjustment. The 24 hour collection of blood and urine samples will occur as part of EOT visit. Venous blood sample collection at collection at 0 (pre-dose) 0.5, 1, 2, 4 and 24 hours after the dose. The 24 hour collection will be done as part of EOT visit. Three mL of blood will be collected at each of these timepoints. Total voided urine collection between 0-4 hours and 4-24 hours post dose. The subject is asked to empty his/her bladder before taking the fosfomycin dose. The collection of the 4-24 hours urine will be done as part of EOT visit. fIf baseline blood cultures were positive for a uropathogen after randomization, subject is considered treatment failure, will only be followed for safety and referred to standard of care treatment. Blood cultures are repeated if the subject is febrile and/or at the investigator’s discretion. gAn adequate and appropriate infection specimen should be obtained at the specified time points. If a subject fails treatment at any point in this study, an adequate and appropriate specimen should be obtained. The microorganisms identified from the urine culture will be sent to central study laboratory for susceptibility testing. hUnsolicited grade 2 and above AEs and SAEs will be recorded in subjects receiving at least 2 doses of fosfomycin. A follow up visit on Day 7-14 is done by phone and only for a subject which last dose of oral antibiotic per protocol was fosfomycin. iReview urine culture results if available jReview urine culture results if not available at screening/randomization

Statistical Analysis Plan - DMID Protocol: 15-0045 Version 1.0 16JUL2020
- 44 - PRIVILEGED AND CONFIDENTIAL COMMUNICATION
10.2 Protocol Deviations
Table 2: Distribution of Protocol Deviations by Category, Type, and Treatment Group
Category Deviation Type
Strategy 1 (N=X)
Strategy 2 (N=X)
All Subjects (N=X)
No. of Subj.
No. of Dev.
No. of Subj.
No. of Dev.
No. of Subj.
No. of Dev.
Eligibility/enrollment Any type
Did not meet inclusion criterion x x x x x x
Met exclusion criterion
ICF not signed prior to study procedures
Other
Treatment administration schedule Any type
Out of window visit
Missed visit/visit not conducted
Missed treatment administration
Delayed treatment administration
Other
Follow-up visit schedule Any type
Out of window visit
Missed visit/visit not conducted
Other
Protocol procedure/assessment Any type
Incorrect version of ICF signed
Blood not collected
Urine not collected
Too few aliquots obtained
Specimen result not obtained
Required procedure done incorrectly
Specimen temperature excursion
Other
Treatment administration Any type
Required procedure not conducted
Required procedure done incorrectly
Study product temperature excursion
Other Note: N= Number of Subjects Enrolled.

Statistical Analysis Plan - DMID Protocol: 15-0045 Version 1.0 16JUL2020
- 45 - PRIVILEGED AND CONFIDENTIAL COMMUNICATION
12.2.2 Displays of Adverse Events
Table 3: Solicited Adverse Event Grading Scale
Solicited AE Mild (Grade 1) Moderate (Grade 2) Severe (Grade 3)
Insomnia Mild difficulty falling asleep or staying asleep, or waking up early
Moderate difficulty falling asleep or staying asleep, or waking up early
Severe difficulty falling asleep or staying asleep, or waking up early
Headache No interference with activity Repeated use of non-narcotic pain reliever >24 hours, or some interference with activity
Any use of narcotic pain reliever, or prevents daily activity
Dizziness No interference with activity, or mild unsteadiness or sensation of movement
Some interference with activity, or moderate unsteadiness or sensation of movement
Prevents daily activity, or severe unsteadiness or sensation of movement
Nausea No interference with activity Some interference with activity Prevents daily activity, or requires IV hydration
Vomiting 1-2 episodes in 24 hours 3-5 episodes in 24 hours >5 episodes in 24 hours, or ER visit, or hospitalization, or requires outpatient IV hydration
Constipation Occasional or intermittent symptoms, or occasional use of stool softeners, laxatives, dietary modification or enema
Some interference with activity, or persistent symptoms with regular use of laxatives or enemas
Prevents daily activity, or obstipation with manual evacuation indicated
Diarrhea 3 loose stools or <400 grams/24 hours
4-5 loose stools or 400-800 grams/24 hours
>5 loose stools or >800 grams/24hours, or requires IV hydration
Back pain No interference with activity Repeated use of non-narcotic pain reliever >24 hours, or some interference with activity
Any use of narcotic pain reliever, or prevents daily activity
Rhinitis No interference with activity Some interference with activity, or local intervention required
Prevents daily activity
Pharyngitis No interference with activity Some interference with activity, or local intervention indicated
Prevents daily activity, or IV therapy indicated
Allergic reaction Localized rash, or itching without rash
Diffuse rash covering multiple areas of the body
Rash requiring clinical visit
Candidiasis Mild mucocutaneous candidiasis, requiring no treatment
Moderate mucocutaneous candidiasis, requiring topical or other over-the-counter treatment
Severe mucocutaneous candidiasis, requiring urgent clinical evaluation, intravenous treatment or hospitalization

Statistical Analysis Plan - DMID Protocol: 15-0045 Version 1.0 16JUL2020
- 46 - PRIVILEGED AND CONFIDENTIAL COMMUNICATION
Table 4: Adverse Events of Special Interest Grading Scale
AESI Mild (Grade 1) Moderate (Grade 2) Severe (Grade 3)
Diarrhea with a positive C diff test
3 loose stools or < 400 grams/24 hours
4 – 5 loose stools or 400 – 800 grams/24 hours
6 or more loose stools or >800 grams/24 hours or requires outpatient IV hydration
Arrhythmia Asymptomatic, intervention not indicated
Symptomatic; medical intervention indicated
Symptomatic and incompletely controlled medically, or controlled with device

Statistical Analysis Plan - DMID Protocol: 15-0045 Version 1.0 16JUL2020
- 47 - PRIVILEGED AND CONFIDENTIAL COMMUNICATION
Table 5: List of Antibiotics by Pathogen and Antibiotic Category
Antibiotic Category Antibiotic
Staphylococcus aureus
Aminoglycosides Gentamicin
Anti-staphylococcal β-lactams (or cephamycins) Cefoxitin
Fluoroquinolones Ciprofloxacin
Glycopeptides Vancomycin
Glycylcyclines Tigecycline
Macrolides Erythromycin
Oxazolidinones Linezolid
Phosphonic acids Fosfomycin
Tetracyclines Tetracycline
Enterococcus spp.a
Aminoglycosides Gentamicin
Carbapenems Imipenem
Meropenem
Fluoroquinolones Ciprofloxacin
Levofloxacin
Glycopeptides Vancomycin
Glycylcyclines Tigecycline
Oxazolidinones Linezolid
Penicillins Ampicillin
Penicillin G
Enterobacteriaceaeb
Aminoglycosides Amikacin
Gentamicin
Tobramycin
Antipseudomonal penicillins + β-lactamase inhibitors Piperacillin-tazobactam
Carbapenems Ertapenem
Imipenem
Meropenem
Carbapenem
Cephalosporins Cefazolin
Cefuroxime
Cefepime
Ceftriaxone

Statistical Analysis Plan - DMID Protocol: 15-0045 Version 1.0 16JUL2020
Table 5: List of Antibiotics by Pathogen and Antibiotic Category (continued)
- 48 - PRIVILEGED AND CONFIDENTIAL COMMUNICATION
Antibiotic Category Antibiotic
Ceftazidime
Cefpodoxime
Ceftazidime/Avibactam
Ceftolozane/tazobactam
Cephalothin
Penicillins Ampicillin
Penicillin G
Cephamycins Cefoxitin
Fluoroquinolones Ciprofloxacin
Glycylcyclines Tigecycline
Monobactams Aztreonam
Phosphonic acids Fosfomycin
Lincomycin Clindamycin
Polymyxins Colistin
Sulfonamide TMP/SMX
Nitrofuran Nitrofurantoin
Tetracyclines Tetracycline
Pseudomonas aeruginosa
Aminoglycosides Gentamicin
Tobramycin
Amikacin
Carbapenems Imipenem
Meropenem
Cephalosporins Ceftazidime
Cefepime
Fluoroquinolones Ciprofloxacin
Levofloxacin
Antipseudomonal penicillins + β-lactamase inhibitors Piperacillin-tazobactam
Monobactams Aztreonam
Phosphonic acids Fosfomycin
Polymyxins Colistin
Acinetobacter spp.c
Aminoglycosides Gentamicin
Tobramycin

Statistical Analysis Plan - DMID Protocol: 15-0045 Version 1.0 16JUL2020
Table 5: List of Antibiotics by Pathogen and Antibiotic Category (continued)
- 49 - PRIVILEGED AND CONFIDENTIAL COMMUNICATION
Antibiotic Category Antibiotic
Amikacin
Carbapenems Imipenem
Meropenem
Fluoroquinolones Ciprofloxacin
Levofloxacin
Antipseudomonal penicillins + β-lactamase inhibitors Piperacillin-tazobactam
Cephalosporins Ceftriaxone
Ceftazidime
Cefepime
Penicillins + β-lactamase inhibitors Ampicillin-sulbactam
Polymyxins Colistin
Tetracyclines Tetracycline a Enterococcus faecalis and Enterococcus faecium. b Escherichia coli, Klebsiella pneumoniae, Proteus mirabilis, and Enterobacter cloacae. c Acinetobacter baumannii and Acinetobacter iwoffi
12.4.1 Individual Laboratory Measurements and Abnormal Laboratory Values
Not applicable for this study.

Statistical Analysis Plan - DMID Protocol: 15-0045 Version 1.0 16JUL2020
- 50 - PRIVILEGED AND CONFIDENTIAL COMMUNICATION
14.1 Description of Study Subjects
14.1.1 Disposition of Subjects
Table 6: Subject Disposition by Treatment Group - All Enrolled Subjects
Subject Disposition
Strategy 1 (N=X)
Strategy 2 (N=X)
All Subjects (N=X)
n % n % n %
Screened -- -- -- -- x --
Enrolled/Randomized x x x x x x
Received Dose 1 x x x x x x
Received Dose 2 x x x x x x
Received Dose 3 x x x x x x
Received Dose 4 x x x x x x
Received Dose 5 x x x x x x
Received Dose 6 x x x x x x
Received Dose 7 x x x x x x
Received investigator-directed adjustment x x x x x x
Adjusted Dose due to low CrCl x x x x x x
Received at least one dose of Fosfomycin x x x x x x
Received at least one dose of Levofloxacin x x x x x x
Received at least 1 Dose of Fosfomycin or Levofloxacin without adjustment x x x x x x
Received all Scheduled Doses of Fosfomycin or Levofloxacin without Adjustmenta x x x x x x
Completed EOT Visit x x x x x x
Included in the micro-ITT Analysisb x x x x x x
Completed TOC Visit x x x x x x Note: N = Number of Subjects Enrolled. a Refer to Listing 1 for reasons subjects discontinued or terminated early. b Refer to Listing 4 and Table 6 for reasons subjects are excluded from the Analysis populations.

Statistical Analysis Plan - DMID Protocol: 15-0045 Version 1.0 16JUL2020
- 51 - PRIVILEGED AND CONFIDENTIAL COMMUNICATION
Table 7: Analysis Populations by Treatment Group - All Enrolled Subjects
[Implementation Note: Although subjects may meet multiple criteria for exclusion, they should be counted under only one reason for exclusion in this table. Priority for assigning reasons for exclusions is defined in the SAP text.]
Analysis Populations Reason Subjects Excluded
Strategy 1 (N=X)
Strategy 2 (N=X)
All Subjects (N=X)
n % n % % n
Safety Population Any Reason x x x x x x
Subject not treated with at least one dose of study product x x x x x x
ITT Any Reason x x x x x x
Subject not randomized x x x x x x
Micro-ITT Population Any Reason x x x x x x
Subject does not have a baseline culture from a urine sample taken prior to treatment with study product
x x x x x x
Baseline culture is not positive for a uropathogen or is contaminated x x x x x x
CC-TOC Population Any Reason x x x x x x
Subject not in micro-ITT population x x x x x x
Subject not treated with at least one dose of study product
Early termination before TOC x x x x x x
Missing urine culture or had a urine culture that was at TOC x x x x x x
CC-EOT Population Any Reason x x x x x x
Subject not in micro-ITT population x x x x x x
Subject not treated with at least one dose of study product x x x x x x
Early termination before EOT x x x x x x
Missing urine culture or had a urine culture that was contaminated at EOT x x x x x x Note: N = Number of Subjects Enrolled. CC-TOC: Complete Case at Test of Cure CC-EOT: Complete Case at End of Therapy

Statistical Analysis Plan - DMID Protocol: 15-0045 Version 1.0 16JUL2020
- 52 - PRIVILEGED AND CONFIDENTIAL COMMUNICATION
Table 8: Number of Enrolled Subjects that Received Study Product by Site and Treatment Group
Site Strategy 1
(N=X) Strategy 2
(N=X) All Subjects
(N=X)
All Sites x x x
EU Hospital - Midtown x x x
Grady Memorial Hospital x x x
Hope Clinic of the Emory Vaccine Center x x x
University of Iowa x x x
University of Rochester x x x Note: N = Number of Subjects in the Safety Population.

Statistical Analysis Plan - DMID Protocol: 15-0045 Version 1.0 16JUL2020
- 53 - PRIVILEGED AND CONFIDENTIAL COMMUNICATION
Table 9: Treatment Compliance by Treatment Group - All Enrolled Subjects
Treatment Group
Number of Doses Administered
0 1 2 3 4 5 6 7
n (%) n (%) n (%) n (%) n (%) n (%) n (%) n (%)
Strategy 1 (N=X) x (x) x (x) x (x) x (x) x (x) x (x) x (x) x (x)
Strategy 2 (N=X) x (x) x (x) x (x) x (x) x (x) x (x) x (x) x (x)
Note: N = Number of Subjects Enrolled.

Statistical Analysis Plan - DMID Protocol: 15-0045 Version 1.0 16JUL2020
- 54 - PRIVILEGED AND CONFIDENTIAL COMMUNICATION
Table 10: Ineligibility Summary of Screen Failures
Inclusion/Exclusion Category Inclusion/Exclusion Criterion na %b
Inclusion and Exclusion Number of subjects failing any eligibility criterion x 100
Inclusion Any inclusion criterion x xx
[inclusion criterion 1] x xx
[inclusion criterion 2] x xx
[inclusion criterion 3] x xx
Exclusion Any exclusion criterion x xx
[exclusion criterion 1] x xx
[exclusion criterion 2] x xx
[exclusion criterion 3] x xx a More than one criterion may be marked per subject. b Denominator for percentages is the total number of screen failures.
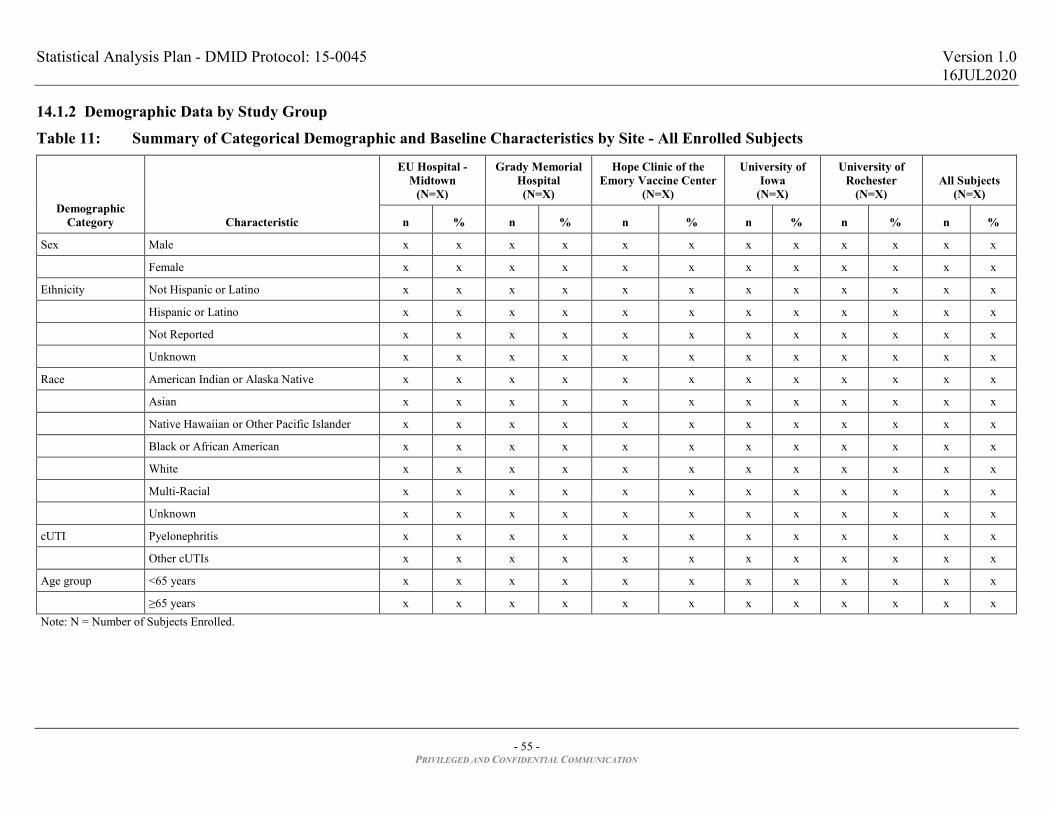
Statistical Analysis Plan - DMID Protocol: 15-0045 Version 1.0 16JUL2020
- 55 - PRIVILEGED AND CONFIDENTIAL COMMUNICATION
14.1.2 Demographic Data by Study Group
Table 11: Summary of Categorical Demographic and Baseline Characteristics by Site - All Enrolled Subjects
Demographic Category Characteristic
EU Hospital - Midtown
(N=X)
Grady Memorial Hospital (N=X)
Hope Clinic of the Emory Vaccine Center
(N=X)
University of Iowa
(N=X)
University of Rochester
(N=X) All Subjects
(N=X)
n % n % n % n % n % n %
Sex Male x x x x x x x x x x x x
Female x x x x x x x x x x x x
Ethnicity Not Hispanic or Latino x x x x x x x x x x x x
Hispanic or Latino x x x x x x x x x x x x
Not Reported x x x x x x x x x x x x
Unknown x x x x x x x x x x x x
Race American Indian or Alaska Native x x x x x x x x x x x x
Asian x x x x x x x x x x x x
Native Hawaiian or Other Pacific Islander x x x x x x x x x x x x
Black or African American x x x x x x x x x x x x
White x x x x x x x x x x x x
Multi-Racial x x x x x x x x x x x x
Unknown x x x x x x x x x x x x
cUTI Pyelonephritis x x x x x x x x x x x x
Other cUTIs x x x x x x x x x x x x
Age group <65 years x x x x x x x x x x x x
≥65 years x x x x x x x x x x x x Note: N = Number of Subjects Enrolled.

Statistical Analysis Plan - DMID Protocol: 15-0045 Version 1.0 16JUL2020
- 56 - PRIVILEGED AND CONFIDENTIAL COMMUNICATION
Table 12: Summary of Continuous Demographic and Baseline Characteristics by Site - All Enrolled Subjects
Variable Statistic
EU Hospital - Midtown
(N=X)
Grady Memorial Hospital (N=X)
Hope Clinic of the Emory Vaccine Center
(N=X)
University of Iowa
(N=X)
University of Rochester
(N=X) All Subjects
(N=X)
Age (years) Mean x.x x.x x.x x.x x.x x.x
Standard Deviation x.x x.x x.x x.x x.x x.x
Median x.x x.x x.x x.x x.x x.x
Minimum x x x x x x
Maximum x x x x x x
Height (cm) Mean x.xx x.xx x.xx x.xx x.xx x.xx
Standard Deviation x.xx x.xx x.xx x.xx x.xx x.xx
Median x.xx x.xx x.xx x.xx x.xx x.xx
Minimum x.x x.x x.x x.x x.x x.x
Maximum x.x x.x x.x x.x x.x x.x
Weight (kg) Mean x.xx x.xx x.xx x.xx x.xx x.xx
Standard Deviation x.xx x.xx x.xx x.xx x.xx x.xx
Median x.xx x.xx x.xx x.xx x.xx x.xx
Minimum x.x x.x x.x x.x x.x x.x
Maximum x.x x.x x.x x.x x.x x.x
BMI (kg/m2) Mean x.xx x.xx x.xx x.xx x.xx x.xx
Standard Deviation x.xx x.xx x.xx x.xx x.xx x.xx
Median x.xx x.xx x.xx x.xx x.xx x.xx
Minimum x.x x.x x.x x.x x.x x.x
Maximum x.x x.x x.x x.x x.x x.x
CrCl (mL/min) Mean x.xxx x.xxx x.xxx x.xxx x.xxx x.xxx
Standard Deviation x.xxx x.xxx x.xxx x.xxx x.xxx x.xxx
Median x.xxx x.xxx x.xxx x.xxx x.xxx x.xxx
Minimum x.xx x.xx x.xx x.xx x.xx x.xx
Maximum x.xx x.xx x.xx x.xx x.xx x.xx

Statistical Analysis Plan - DMID Protocol: 15-0045 Version 1.0 16JUL2020
Table 12: Summary of Continuous Demographic and Baseline Characteristics by Site - All Enrolled Subjects (continued)
- 57 - PRIVILEGED AND CONFIDENTIAL COMMUNICATION
Variable Statistic
EU Hospital - Midtown
(N=X)
Grady Memorial Hospital (N=X)
Hope Clinic of the Emory Vaccine Center
(N=X)
University of Iowa
(N=X)
University of Rochester
(N=X) All Subjects
(N=X)
Baseline WBC (10^9/L) Mean x.xxx x.xxx x.xxx x.xxx x.xxx x.xxx
Standard Deviation x.xxx x.xxx x.xxx x.xxx x.xxx x.xxx
Median x.xxx x.xxx x.xxx x.xxx x.xxx x.xxx
Minimum x.xx x.xx x.xx x.xx x.xx x.xx
Maximum x.xx x.xx x.xx x.xx x.xx x.xx Notes: N = Number of Subjects Enrolled. BMI = Weight (kg) / Height (m)2.

Statistical Analysis Plan - DMID Protocol: 15-0045 Version 1.0 16JUL2020
- 58 - PRIVILEGED AND CONFIDENTIAL COMMUNICATION
Table 13: Summary of Categorical Demographic and Baseline Characteristics by Treatment Group - All Enrolled Subjects
Variable Characteristic
Strategy 1 (N=X)
Strategy 2 (N=X)
All Subjects (N=X)
n % n % n %
Sex Male x x x x x x
Female x x x x x x
Ethnicity Not Hispanic or Latino x x x x x x
Hispanic or Latino x x x x x x
Not Reported x x x x x x
Unknown x x x x x x
Race American Indian or Alaska Native x x x x x x
Asian x x x x x x
Native Hawaiian or Other Pacific Islander x x x x x x
Black or African American x x x x x x
White x x x x x x
Multi-Racial x x x x x x
Unknown x x x x x x
cUTI Pyelonephritis x x x x x x
Other cUTIs x x x x x x
Age Group <65 years x x x x x x
≥65 years x x x x x x Note: N = Number of Subjects Enrolled.
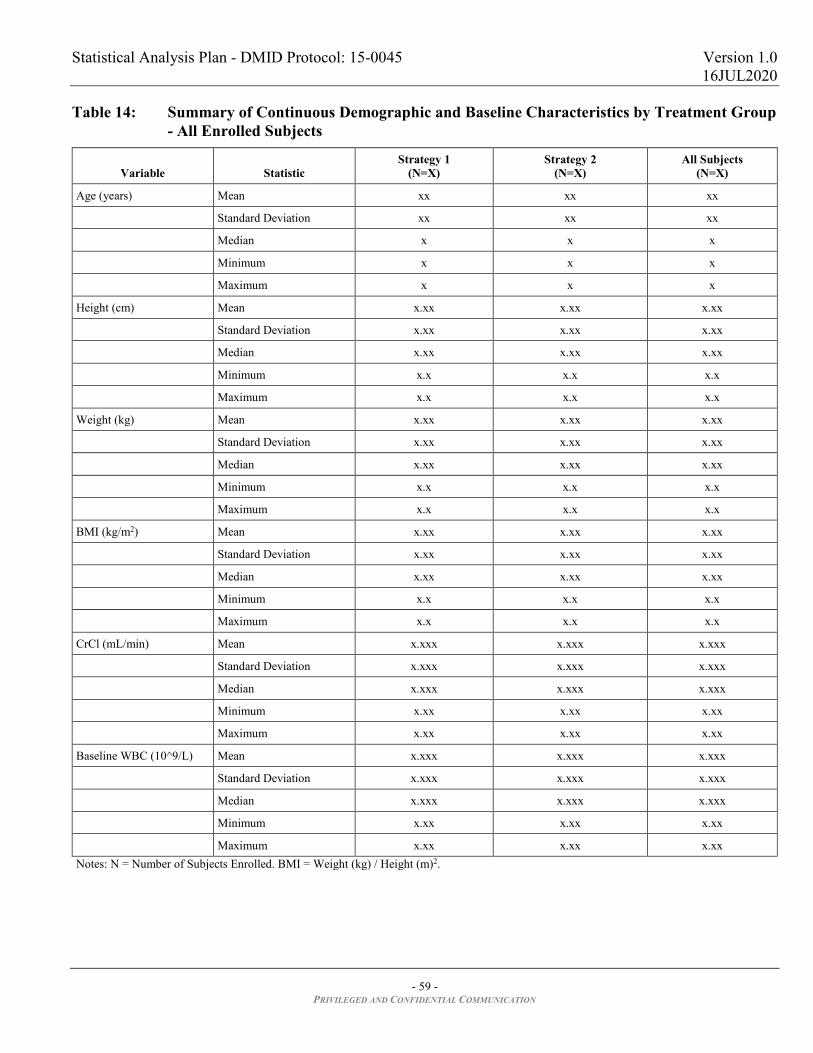
Statistical Analysis Plan - DMID Protocol: 15-0045 Version 1.0 16JUL2020
- 59 - PRIVILEGED AND CONFIDENTIAL COMMUNICATION
Table 14: Summary of Continuous Demographic and Baseline Characteristics by Treatment Group - All Enrolled Subjects
Variable Statistic Strategy 1
(N=X) Strategy 2
(N=X) All Subjects
(N=X)
Age (years) Mean xx xx xx
Standard Deviation xx xx xx
Median x x x
Minimum x x x
Maximum x x x
Height (cm) Mean x.xx x.xx x.xx
Standard Deviation x.xx x.xx x.xx
Median x.xx x.xx x.xx
Minimum x.x x.x x.x
Maximum x.x x.x x.x
Weight (kg) Mean x.xx x.xx x.xx
Standard Deviation x.xx x.xx x.xx
Median x.xx x.xx x.xx
Minimum x.x x.x x.x
Maximum x.x x.x x.x
BMI (kg/m2) Mean x.xx x.xx x.xx
Standard Deviation x.xx x.xx x.xx
Median x.xx x.xx x.xx
Minimum x.x x.x x.x
Maximum x.x x.x x.x
CrCl (mL/min) Mean x.xxx x.xxx x.xxx
Standard Deviation x.xxx x.xxx x.xxx
Median x.xxx x.xxx x.xxx
Minimum x.xx x.xx x.xx
Maximum x.xx x.xx x.xx
Baseline WBC (10^9/L) Mean x.xxx x.xxx x.xxx
Standard Deviation x.xxx x.xxx x.xxx
Median x.xxx x.xxx x.xxx
Minimum x.xx x.xx x.xx
Maximum x.xx x.xx x.xx Notes: N = Number of Subjects Enrolled. BMI = Weight (kg) / Height (m)2.

Statistical Analysis Plan - DMID Protocol: 15-0045 Version 1.0 16JUL2020
- 60 - PRIVILEGED AND CONFIDENTIAL COMMUNICATION
Table 15: Summary of Demographic and Baseline Characteristics by Treatment Group - Micro-ITT Population*
[Implementation note: This table will be generated for the CSR and will be provided to the PI for the paper manuscript as Table 1.]
Variable – Statistic Characteristic Strategy 1
(N=X) Strategy 2
(N=X) All Subjects
(N=X)
Age (years) – Mean (SD) - xx.x (xx.x) xx.x (xx.x) xx.x (xx.x)
Sex – n (%) Male x (xx) x (xx) x (xx)
Female x (xx) x (xx) x (xx)
Race – n (%) American Indian or Alaska Native x (xx) x (xx) x (xx)
Asian x (xx) x (xx) x (xx)
Native Hawaiian or Other Pacific Islander x (xx) x (xx) x (xx)
Black or African American x (xx) x (xx) x (xx)
White x (xx) x (xx) x (xx)
Multi-Racial x (xx) x (xx) x (xx)
Unknown x (xx) x (xx) x (xx)
BMI (kg/m2) – Mean (SD) - xx.xx (xx.xx) xx.xx (xx.xx) xx.xx (xx.xx)
cUTI type – n (%) Acute pyelonephritis x (xx) x (xx) x (xx)
Other cUTI x (xx) x (xx) x (xx)
Calculated Creatinine Clearance – n (%) ≥ 90 mL/min x (xx) x (xx) x (xx)
60 – 89 mL/min x (xx) x (xx) x (xx)
30 – 59 mL/min x (xx) x (xx) x (xx)
≤ 29 mL/min x (xx) x (xx) x (xx)
Medical History – n (%) With recurrent UTIs x (xx) x (xx) x (xx)
With obstructive uropathy x (xx) x (xx) x (xx)
With indwelling urinary catheter x (xx) x (xx) x (xx)
Diabetes mellitus x (xx) x (xx) x (xx)
All uropathogens – n (%) - x (xx) x (xx) x (xx)
Enterobacteriaceae uropathogensa – n (%) Not susceptible to quinolonesb x (xx) x (xx) x (xx)
Not susceptible to Fosfomycin x (xx) x (xx) x (xx)
Not susceptible to carbapenems x (xx) x (xx) x (xx)
ESLBc x (xx) x (xx) x (xx)
Multidrug resistantd x (xx) x (xx) x (xx) Notes: mITT = Microbiologic Intention-to-Treat Population = all randomized patients who have a positive baseline bacterial culture of urine N = Number of Subjects in the Micro-ITT Population. SD = Standard Deviation. BMI = Weight (kg) / Height (m)2. a Escherichia coli, Klebsiella pneumoniae, Proteus mirabilis, and Enterobacter cloacae b Levofloxacin and Ciprofloxacin. c Resistance to either ceftazidime, aztreonam, or ceftriaxone. d Resistance to at least one antibiotic from at least three different classes

Statistical Analysis Plan - DMID Protocol: 15-0045 Version 1.0 16JUL2020
- 61 - PRIVILEGED AND CONFIDENTIAL COMMUNICATION
Table 16: Summary of Demographic and Baseline Characteristics by Treatment Group and Missing Composite Cure Status- Micro-ITT Population*
Not Missing Composite Cure
(N=X) Missing Composite Cure
(N=X)
Variable – Statistic Characteristic Strategy 1
(N=X) Strategy 2
(N=X) Strategy 1
(N=X) Strategy 2
(N=X)
Age (years) – Mean (SD) - xx.x (xx.x) xx.x (xx.x) xx.x (xx.x) xx.x (xx.x)
Sex – n (%) Male x (xx) x (xx) x (xx) x (xx)
Female x (xx) x (xx) x (xx) x (xx)
Race – n (%) American Indian or Alaska Native x (xx) x (xx) x (xx) x (xx)
Asian x (xx) x (xx) x (xx) x (xx)
Native Hawaiian or Other Pacific Islander
x (xx) x (xx) x (xx) x (xx)
Black or African American x (xx) x (xx) x (xx) x (xx)
White x (xx) x (xx) x (xx) x (xx)
Multi-Racial x (xx) x (xx) x (xx) x (xx)
Unknown x (xx) x (xx) x (xx) x (xx)
BMI (kg/m2) – Mean (SD) - xx.xx (xx.xx) xx.xx (xx.xx) xx.xx (xx.xx) xx.xx (xx.xx)
cUTI type – n (%) Acute pyelonephritis x (xx) x (xx) x (xx) x (xx)
Other cUTI x (xx) x (xx) x (xx) x (xx)
Calculated Creatinine Clearance – n (%) ≥ 90 mL/min x (xx) x (xx) x (xx) x (xx)
60 – 89 mL/min x (xx) x (xx) x (xx) x (xx)
30 – 59 mL/min x (xx) x (xx) x (xx) x (xx)
≤ 29 mL/min x (xx) x (xx) x (xx) x (xx)
Medical History – n (%) With recurrent UTIs x (xx) x (xx) x (xx) x (xx)
With obstructive uropathy x (xx) x (xx) x (xx) x (xx)
With indwelling urinary catheter x (xx) x (xx) x (xx) x (xx)
Diabetes mellitus x (xx) x (xx) x (xx) x (xx)
All uropathogens – n (%) - x (xx) x (xx) x (xx) x (xx)
Enterobacteriaceae uropathogensa – n (%) Not susceptible to quinolonesb x (xx) x (xx) x (xx) x (xx)
Not susceptible to Fosfomycin x (xx) x (xx) x (xx) x (xx)
Not susceptible to carbapenems x (xx) x (xx) x (xx) x (xx)
ESLBc x (xx) x (xx) x (xx) x (xx)
Multidrug resistantd x (xx) x (xx) x (xx) x (xx) Notes: mITT = Microbiologic Intention-to-Treat Population = all randomized patients who have a positive baseline bacterial culture of urine N = Number of Subjects in the Micro-ITT Population. SD = Standard Deviation. BMI = Weight (kg) / Height (m)2. a Escherichia coli, Klebsiella pneumoniae, Proteus mirabilis, and Enterobacter cloacae b Levofloxacin and Ciprofloxacin. c Resistance to either ceftazidime, aztreonam, or ceftriaxone. d Resistance to at least one antibiotic from at least three different classes

Statistical Analysis Plan - DMID Protocol: 15-0045 Version 1.0 16JUL2020
- 62 - PRIVILEGED AND CONFIDENTIAL COMMUNICATION
14.1.3 Prior and Concurrent Medical Conditions
Table 17: Summary of Subjects with Pre-Existing Medical Conditions by MedDRA System Organ Class and Treatment Group - All Enrolled Subjects
MedDRA System Organ Class
Strategy 1 (N=X)
Strategy 2 (N=X)
All Subjects (N=X)
n % n % n %
Any SOC x xx x xx x xx
[SOC 1]
[SOC 2]
Notes: N= Number of Subjects Enrolled; n = Number of subjects reporting medical history within the specified SOC. A subject is only counted once per SOC.

Statistical Analysis Plan - DMID Protocol: 15-0045 Version 1.0 16JUL2020
- 63 - PRIVILEGED AND CONFIDENTIAL COMMUNICATION
14.2 Efficacy/Microbiology Data
Table 18: Number and Percentage of Missing Data by Study Endpoint, Timepoint, and Treatment Group*
Endpoint
Strategy 1 (N=X)
Strategy 2 (N=X)
All Subjects (N=X)
n % n % n %
End of Therapy
Composite Cure x x x x x x
Clinical Cure
Microbiological Cure
Test of Cure
Composite Cure
Clinical Cure
Microbiological Cure N = Number of subjects in the micro-ITT population in the respective treatment group. Clinical cure is defined as: 1) Resolution of UTI symptoms from presentation and 2) No new UTI symptoms and 3) Avoidance of parenteral antibiotic therapy, in or out of hospital, at any time after randomization OR oral antibiotic therapy different from per protocol. Microbiological cure is defined as a reduction of the pathogen found at presentation to <104 CFU/mL for non-catheter specimens or < 103 for catheter specimens on urine culture. Treatment success (composite cure) is defined as a combination of clinical cure and microbiological success.

Statistical Analysis Plan - DMID Protocol: 15-0045 Version 1.0 16JUL2020
- 64 - PRIVILEGED AND CONFIDENTIAL COMMUNICATION
Table 19: Verification of the MAR Missing Data Assumption Using Logistic Regression Model with Missing Composite Cure Indicator as the Outcome - Micro-ITT Population*
Model Parameter Parameter Category Parameter Estimates 95 % CI P-value
End of Therapy
Intercept N/A x.x x.x, x.x x.xxx
Treatment Strategy 2 - - -
Strategy 1 x.x x.x, x.x x.xxx
Site 1 No - - -
Yes x.x x.x, x.x x.xxx
Site 2 No - - -
Yes x.x x.x, x.x x.xxx
Site 3 No - - -
Yes x.x x.x, x.x x.xxx
Site 3 No - - -
Yes x.x x.x, x.x x.xxx
Age N/A x.x x.x, x.x x.xxx
Sex Male - - -
Female x.x x.x, x.x x.xxx
Pyelonephritis No - - -
Yes x.x x.x, x.x x.xxx
Number of bacterial species in the urine 1 - - -
2 x.x x.x, x.x x.xxx
3 x.x x.x, x.x x.xxx
Test of Cure
Intercept N/A x.x x.x, x.x x.xxx
Treatment Strategy 2 - - -
Strategy 1 x.x x.x, x.x x.xxx
Site 1 No - - -
Yes x.x x.x, x.x x.xxx
Site 2 No - - -
Yes x.x x.x, x.x x.xxx
Site 3 No - - -
Yes x.x x.x, x.x x.xxx
Site 3 No - - -
Yes x.x x.x, x.x x.xxx
Age N/A x.x x.x, x.x x.xxx
Sex Male - - -
Female x.x x.x, x.x x.xxx

Statistical Analysis Plan - DMID Protocol: 15-0045 Version 1.0 16JUL2020
Table 19: Verification of the MAR Missing Data Assumption Using Logistic Regression Model with Missing Composite Cure Indicator as the Outcome - Micro-ITT Population (continued)
- 65 - PRIVILEGED AND CONFIDENTIAL COMMUNICATION
Model Parameter Parameter Category Parameter Estimates 95 % CI P-value
Pyelonephritis No - - -
Yes x.x x.x, x.x x.xxx
Number of bacterial species in the urine 1 - - -
2 x.x x.x, x.x x.xxx
3 x.x x.x, x.x x.xxx

Statistical Analysis Plan - DMID Protocol: 15-0045 Version 1.0 16JUL2020
- 66 - PRIVILEGED AND CONFIDENTIAL COMMUNICATION
Table 20: Comparison of Composite Cure, Clinical Cure and Microbiological Cure Rates at TOC and EOT between Treatment Group - Micro-ITT Population*
[Implementation note: This table will be provided to the PI for the paper manuscript as Table 2A.]
Endpoint
Strategy 1 Strategy 2 Difference (95% CI)b
P-valuec Na # missing %b Na # missing %b %
Test of Cure
Composite Cure x x x x x x x (x.x, x.x) x.xxx
Clinical Cure x x x x x x x (x.x, x.x) x.xxx
Microbiological Cure x x x x x x x (x.x, x.x) x.xxx
End of Therapy
Composite Cure x x x x x x x (x.x, x.x) x.xxx
Clinical Cure x x x x x x x (x.x, x.x) x.xxx
Microbiological Cure x x x x x x x (x.x, x.x) x.xxx a N = Number of subjects in the micro-ITT population at that endpoint.Multiple imputations are used to impute missing values. b Composite, clinical, or microbiological cure rates will be estimated from the multiple imputation model and 95% Wald CI without continuity correction will be provided. c P-value from the multiple imputation method using the Wald method. Clinical cure is defined as: 1) Resolution of UTI symptoms from presentation and 2) No new UTI symptoms and 3) Avoidance of parenteral antibiotic therapy, in or out of hospital, at any time after randomization OR oral antibiotic therapy different from per protocol. Microbiological cure is defined as a reduction of the pathogen found at presentation to <104 CFU/mL for non-catheter specimens or < 103 for catheter specimens on urine culture. Treatment success (composite cure) is defined as clinical cure and microbiological success.

Statistical Analysis Plan - DMID Protocol: 15-0045 Version 1.0 16JUL2020
- 67 - PRIVILEGED AND CONFIDENTIAL COMMUNICATION
Table 21: Comparison of Composite Cure, Clinical Cure and Microbiological Cure Rates at TOC and EOT by Treatment Group, Complete Case at EOT and TOC Populations*
[Implementation note: This table will be provided to the PI for the paper manuscript as Table 2B.]
Endpoint
Strategy 1 Strategy 2 Difference (95% CI)a P-valuec
Nb n % Nb n % %
Complete Case at Test of Cure
Composite Cure x x x x x x x (x.x, x.x) x.xxx
Clinical Cure x x x x x x x (x.x, x.x) x.xxx
Microbiological Success x x x x x x x (x.x, x.x) x.xxx
Complete Case at End of Therapy
Composite Cure x x x x x x x (x.x, x.x) x.xxx
Clinical Cure x x x x x x x (x.x, x.x) x.xxx
Microbiological Success x x x x x x x (x.x, x.x) x.xxx a 95% Wald CI without continuity correction will be provided. b N = Number of subjects in CC-TOC (or CC-EOT). Note that this varies by endpoint depending on whether the subjects are missing composite cure, clinical cure or microbiological cure at TOC (or EOT). n = number of subjects with cure. c P-value from the linear regression model using the Wald method Clinical cure is defined as: 1) Resolution of UTI symptoms from presentation and 2) No new UTI symptoms and 3) Avoidance of parenteral antibiotic therapy, in or out of hospital, at any time after randomization OR oral antibiotic therapy different from per protocol. Microbiological success is defined as a reduction of the pathogen found at presentation to <104 CFU/mL for non-catheter specimens or < 103 for catheter specimens on urine culture. Treatment success (composite cure) is defined as a combination of clinical cure and microbiological success.

Statistical Analysis Plan - DMID Protocol: 15-0045 Version 1.0 16JUL2020
- 68 - PRIVILEGED AND CONFIDENTIAL COMMUNICATION
Table 22: Comparison of Clinical Cure Rates at TOC and EOT between Treatment Group - ITT Population*
[Implementation note: This table will be provided to the PI for the paper manuscript as Table 2C.]
Endpoint
Strategy 1 Strategy 2 Difference (95% CI)a
Nb # missing %a Nb # missing %a %
Test of Cure x x x x x x x (x.x, x.x)
End of Therapy x x x x x x x (x.x, x.x) a Clinical cure rates will be estimated from the linear regression model and 95% Wald CI without continuity correction will be provided. b N = Number of subjects in ITT population at that endpoint. Missing data imputed using multiple imputation. Clinical cure is defined as: 1) Resolution of UTI symptoms from presentation and 2) No new UTI symptoms and 3) Avoidance of parenteral antibiotic therapy, in or out of hospital, at any time after randomization OR oral antibiotic therapy different from per protocol.

Statistical Analysis Plan - DMID Protocol: 15-0045 Version 1.0 16JUL2020
- 69 - PRIVILEGED AND CONFIDENTIAL COMMUNICATION
Table 23: Comparison of Clinical Cure Rates at TOC and EOT between Treatment Group – All Subjects with Non-missing Clinical Cure*
[Implementation note: This table will be provided to the PI for the paper manuscript as Table 2D.]
Endpoint
Strategy 1 Strategy 2 Difference (95% CI)a
Nb n % Nb n % %
Test of Cure x x x x x x x (x.x, x.x)
End of Therapy x x x x x x x (x.x, x.x) a 95% Wald CI without continuity correction will be provided. b N = Number of subjects in ITT population at that endpoint with non-missing clinical cure. Subjects with missing clinical cure will be excluded. n=number of subject who had clinical cure. Clinical cure is defined as: 1) Resolution of UTI symptoms from presentation and 2) No new UTI symptoms and 3) Avoidance of parenteral antibiotic therapy, in or out of hospital, at any time after randomization OR oral antibiotic therapy different from per protocol.

Statistical Analysis Plan - DMID Protocol: 15-0045 Version 1.0 16JUL2020
- 70 - PRIVILEGED AND CONFIDENTIAL COMMUNICATION
Table 24: Sensitivity Analysis of Composite Cure Rates at TOC Using Various Imputations of Missing Data, micro-ITT Population*
[Implementation note: This table will be provided to the PI for the paper manuscript as Table 2E.]
% Imputed as Treatment Success in Strategy 1
% Imputed as Treatment Success in Strategy 2 0% 40% 60% 80% 100%
0% x (x.x, x.x) x (x.x, x.x) x (x.x, x.x) x (x.x, x.x) x (x.x, x.x)
40% x (x.x, x.x) x (x.x, x.x) x (x.x, x.x) x (x.x, x.x) x (x.x, x.x)
60% x (x.x, x.x) x (x.x, x.x) x (x.x, x.x) x (x.x, x.x) x (x.x, x.x)
80% x (x.x, x.x) x (x.x, x.x) x (x.x, x.x) x (x.x, x.x) x (x.x, x.x)
100% x (x.x, x.x) x (x.x, x.x) x (x.x, x.x) x (x.x, x.x) x (x.x, x.x) Note: Values shown are treatment success differences and their 95% CI is calculated using the Wald Method without continuity correction.
Table with similar format:
Table 25: Sensitivity Analysis of Composite Cure Rates at EOT Using Various Imputations of Missing Data, micro-ITT Population*
[Implementation note: This table will be provided to the PI for the paper manuscript as Table 2F.]

Statistical Analysis Plan - DMID Protocol: 15-0045 Version 1.0 16JUL2020
- 71 - PRIVILEGED AND CONFIDENTIAL COMMUNICATION
Table 26: Comparison of Composite Cure Rates at TOC between Treatment Groups by Baseline Characteristics, Therapy Adjustment, and Baseline Pathogen - Complete Case at TOC Population*
[Implementation note: This table will be provided to the PI for the paper manuscript as Table 3A.]
Subgroup Characteristic
Strategy 1 Strategy 2 Difference (95% CI)a
N n % N n % %
Baseline Characteristic
cUTI Type Pyelonephritis x x x x x x x (x, x)
Other cUTI x x x x x x x (x, x)
Indwelling urinary catheter Yes x x x x x x x (x, x)
No x x x x x x x (x, x)
Obstructive uropathy Yes x x x x x x x (x, x)
No x x x x x x x (x, x)
Recurrent UTIs Yes x x x x x x x (x, x)
No x x x x x x x (x, x)
Diabetes Yes x x x x x x x (x, x)
No x x x x x x x (x, x)
Age (years) <65 x x x x x x x (x, x)
≥65 x x x x x x x (x, x)
BMI (kg/m2) <30 x x x x x x x (x, x)
≥30 x x x x x x x (x, x)
Sex Female x x x x x x x (x, x)
Male x x x x x x x (x, x)
Creatinine Clearance (mL/min) ≥60 x x x x x x x (x, x)
<60 x x x x x x x (x, x)
Therapy Adjustment
With adjustment of therapy per protocol Yes x x x x x x x (x, x)
No x x x x x x x (x, x)
Number of days of unique antibiotics prescribed between randomization and TOC ≤7 x x x x x x x (x, x)
>7 x x x x x x x (x, x)
Baseline Pathogen
Enterobacteriaceaeb Not susceptible to quinolonesc x x x x x x x (x, x)
Not susceptible to Fosfomycin x x x x x x x (x, x)
ESBLd x x x x x x x (x, x)
Carbapenem resistant x x x x x x x (x, x)
Multidrug resistante x x x x x x x (x, x)

Statistical Analysis Plan - DMID Protocol: 15-0045 Version 1.0 16JUL2020
Table 26: Comparison of Composite Cure Rates at TOC between Treatment Groups by Baseline Characteristics, Therapy Adjustment, and Baseline Pathogen - Complete Case at TOC Population (continued)
- 72 - PRIVILEGED AND CONFIDENTIAL COMMUNICATION
Subgroup Characteristic
Strategy 1 Strategy 2 Difference (95% CI)a
N n % N n % %
Escherichia coli Not susceptible to quinolonesc x x x x x x x (x, x)
Not susceptible to Fosfomycin x x x x x x x (x, x)
ESBLd x x x x x x x (x, x)
Carbapenem resistant x x x x x x x (x, x)
Multidrug resistante x x x x x x x (x, x)
Klebsiella pneumoniae Not susceptible to quinolonesc x x x x x x x (x, x)
Not susceptible to Fosfomycin x x x x x x x (x, x)
ESBLd x x x x x x x (x, x)
Carbapenem resistant x x x x x x x (x, x)
Multidrug resistante x x x x x x x (x, x)
Proteus mirabilis x x x x x x x (x, x)
Enterobacter cloacae x x x x x x x (x, x)
Pseudomonas aeruginosa x x x x x x x (x, x)
Staphylococcus x x x x x x x (x, x)
Enterococcus x x x x x x x (x, x) Notes: N = Number of Subjects in the Complete Case at TOC Population. Complete Case at TOC Population is defined as subjects in the micro-ITT population that completed the TOC visit or have non-missing composite cure. a 95% CI will be calculated using the Wald Method without continuity correction. b Escherichia coli, Klebsiella pneumoniae, Proteus mirabilis, and Enterobacter cloacae. c Levofloxacin or Ciprofloxacin. d Resistance to either ceftazidime, aztreonam, or ceftriaxone. e Resistance to at least one antibiotic from at least three different antimicrobial categories.

Statistical Analysis Plan - DMID Protocol: 15-0045 Version 1.0 16JUL2020
- 73 - PRIVILEGED AND CONFIDENTIAL COMMUNICATION
Table 27: Comparison of Composite Cure Rates at EOT between Treatment Groups by Baseline Characteristics, Therapy Adjustment, and Baseline Pathogen - Complete Case at EOT Population*
[Implementation note: This table will be provided to the PI for the paper manuscript as Table 3B.]
Subgroup Characteristic
Strategy 1 Strategy 2 Difference (95% CI)a
N n % N n % %
Baseline Characteristic
cUTI Type Pyelonephritis x x x x x x x (x, x)
Other cUTI x x x x x x x (x, x)
Indwelling urinary catheter Yes x x x x x x x (x, x)
No x x x x x x x (x, x)
Obstructive uropathy Yes x x x x x x x (x, x)
No x x x x x x x (x, x)
Recurrent UTIs Yes x x x x x x x (x, x)
No x x x x x x x (x, x)
Diabetes Yes x x x x x x x (x, x)
No x x x x x x x (x, x)
Age (years) <65 x x x x x x x (x, x)
≥65 x x x x x x x (x, x)
BMI (kg/m2) <30 x x x x x x x (x, x)
≥30 x x x x x x x (x, x)
Sex Female x x x x x x x (x, x)
Male x x x x x x x (x, x)
Creatinine Clearance (mL/min) ≥60 x x x x x x x (x, x)
<60 x x x x x x x (x, x)
Therapy Adjustment
With adjustment of therapy per protocol Yes x x x x x x x (x, x)
No x x x x x x x (x, x)
Number of days of unique antibiotics prescribed between randomization and EOT ≤7 x x x x x (x, x) x x (x, x)
>7 x x x x x (x, x) x x (x, x)
Baseline Pathogen
Enterobacteriaceaeb Not susceptible to quinolonesc x x x x x x x (x, x)
Not susceptible to Fosfomycin x x x x x x x (x, x)
ESBLd x x x x x x x (x, x)
Carbapenem resistant x x x x x x x (x, x)
Multidrug resistante x x x x x x x (x, x)

Statistical Analysis Plan - DMID Protocol: 15-0045 Version 1.0 16JUL2020
Table 27: Comparison of Composite Cure Rates at EOT between Treatment Groups by Baseline Characteristics, Therapy Adjustment, and Baseline Pathogen - Complete Case at EOT Population (continued)
- 74 - PRIVILEGED AND CONFIDENTIAL COMMUNICATION
Subgroup Characteristic
Strategy 1 Strategy 2 Difference (95% CI)a
N n % N n % %
Escherichia coli Not susceptible to quinolonesc x x x x x x x (x, x)
Not susceptible to Fosfomycin x x x x x x x (x, x)
ESBLd x x x x x x x (x, x)
Carbapenem resistant x x x x x x x (x, x)
Multidrug resistante x x x x x x x (x, x)
Klebsiella pneumoniae Not susceptible to quinolonesc x x x x x x x (x, x)
Not susceptible to Fosfomycin x x x x x x x (x, x)
ESBLd x x x x x x x (x, x)
Carbapenem resistant x x x x x x x (x, x)
Multidrug resistante x x x x x x x (x, x)
Proteus mirabilis x x x x x x x (x, x)
Enterobacter cloacae x x x x x x x (x, x)
Pseudomonas aeruginosa x x x x x x x (x, x)
Staphylococcus x x x x x x x (x, x)
Enterococcus x x x x x x x (x, x) Notes: N = Number of Subjects in the Complete Case at EOT Population. Complete Case at EOT Population is defined as subjects in the micro-ITT population that completed the EOT visit or have non-missing composite cure. a 95% CI will be calculated using the Wald Method without continuity correction. b Escherichia coli, Klebsiella pneumoniae, Proteus mirabilis, and Enterobacter cloacae. c Levofloxacin or Ciprofloxacin d Resistance to either ceftazidime, aztreonam, or ceftriaxone. e Resistance to at least one antibiotic from at least three different antimicrobial categories.

Statistical Analysis Plan - DMID Protocol: 15-0045 Version 1.0 16JUL2020
- 75 - PRIVILEGED AND CONFIDENTIAL COMMUNICATION
Table 28: Comparison of Clinical Cure Rates at TOC by Baseline Characteristics, Therapy Adjustment, Baseline Pathogen, and Treatment Group - Complete Case at TOC Population*
[Implementation note: This table will be provided to the PI for the paper manuscript as Table 3C.]
Subgroup Characteristic
Strategy 1 (N = X)
Strategy 2 (N = X)
Difference (95% CI)a
n % n % %
Baseline Characteristic
cUTI Type Acute pyelonephritis x x x x x (x, x)
Other cUTI x x x x x (x, x)
Indwelling urinary catheter Yes x x x x x (x, x)
No x x x x x (x, x)
Obstructive uropathy Yes x x x x x (x, x)
No x x x x x (x, x)
Recurrent UTIs Yes x x x x x (x, x)
No x x x x x (x, x)
Diabetes Yes x x x x x (x, x)
No x x x x x (x, x)
Age (years) <65 x x x x x (x, x)
≥65 x x x x x (x, x)
BMI (kg/m2) <30 x x x x x (x, x)
≥30 x x x x x (x, x)
Sex Female x x x x x (x, x)
Male x x x x x (x, x)
Creatinine Clearance (mL/min) ≥60 x x x x x (x, x)
<60 x x x x x (x, x)
Therapy Adjustment
With adjustment of therapy per protocol Yes x x x x x (x, x)
No x x x x x (x, x)
Number of days of unique antibiotics prescribed between randomization and TOC ≤7 x x x x x (x, x)
>7 x x x x x (x, x)
Baseline Pathogen
Enterobacteriaceaeb Not susceptible to quinolonesc x x x x x (x, x)
Not susceptible to Fosfomycin x x x x x (x, x)
ESBLd x x x x x (x, x)
Carbapenem resistant x x x x x (x, x)
Multidrug resistante x x x x x (x, x)

Statistical Analysis Plan - DMID Protocol: 15-0045 Version 1.0 16JUL2020
Table 28: Comparison of Clinical Cure Rates at TOC by Baseline Characteristics, Therapy Adjustment, Baseline Pathogen, and Treatment Group - Complete Case at TOC Population (continued)
- 76 - PRIVILEGED AND CONFIDENTIAL COMMUNICATION
Subgroup Characteristic
Strategy 1 (N = X)
Strategy 2 (N = X)
Difference (95% CI)a
n % n % %
Escherichia coli Not susceptible to quinolonesc x x x x x (x, x)
Not susceptible to Fosfomycin x x x x x (x, x)
ESBLd x x x x x (x, x)
Carbapenem resistant x x x x x (x, x)
Multidrug resistante x x x x x (x, x)
Klebsiella pneumoniae Not susceptible to quinolonesc x x x x x (x, x)
Not susceptible to Fosfomycin x x x x x (x, x)
ESBLd x x x x x (x, x)
Carbapenem resistant x x x x x (x, x)
Multidrug resistante x x x x x (x, x)
Proteus mirabilis x x x x x (x, x)
Enterobacter cloacae x x x x x (x, x)
Pseudomonas aeruginosa x x x x x (x, x)
Staphylococcus x x x x x (x, x)
Enterococcus x x x x x (x, x) Notes: N = Number of Subjects in the Complete Case at TOC Population. Complete Case at EOT Population is defined as subjects in the micro-ITT population that completed the EOT visit or have non-missing clinical cure. a 95% CI will be calculated using the Wald Method without continuity correction. b Escherichia coli, Klebsiella pneumoniae, Proteus mirabilis, and Enterobacter cloacae. c Levofloxacin or Ciprofloxacin. d Resistance to either ceftazidime, aztreonam, or ceftriaxone. e Resistance to at least one antibiotic from at least three different antimicrobial categories.
Table with similar format:
Table 29: Comparison of Clinical Cure Rates at TOC by Baseline Characteristics, Therapy Adjustment, Baseline Pathogen, and Treatment Group – All Subjects with Non-Missing Clinical Cure at TOC*

Statistical Analysis Plan - DMID Protocol: 15-0045 Version 1.0 16JUL2020
- 77 - PRIVILEGED AND CONFIDENTIAL COMMUNICATION
Table 30: Comparison of Clinical Cure Rates at EOT by Baseline Characteristics, Therapy Adjustment, Baseline Pathogen, and Treatment Group - Complete Case at EOT Population*
[Implementation note: This table will be provided to the PI for the paper manuscript as Table 3D.]
Subgroup Characteristic
Strategy 1 (N = X)
Strategy 2 (N = X)
Difference (95% CI)a
n % n % %
Baseline Characteristic
cUTI Type Acute pyelonephritis x x x x x (x, x)
Other cUTI x x x x x (x, x)
Indwelling urinary catheter Yes x x x x x (x, x)
No x x x x x (x, x)
Obstructive uropathy Yes x x x x x (x, x)
No x x x x x (x, x)
Recurrent UTIs Yes x x x x x (x, x)
No x x x x x (x, x)
Diabetes Yes x x x x x (x, x)
No x x x x x (x, x)
Age (years) <65 x x x x x (x, x)
≥65 x x x x x (x, x)
BMI (kg/m2) <30 x x x x x (x, x)
≥30 x x x x x (x, x)
Sex Female x x x x x (x, x)
Male x x x x x (x, x)
Creatinine Clearance (mL/min) ≥60 x x x x x (x, x)
<60 x x x x x (x, x)
Therapy Adjustment
With adjustment of therapy per protocol Yes x x x x x (x, x)
No x x x x x (x, x)
Number of days of unique antibiotics prescribed between randomization and TOC ≤7 x x x x x (x, x)
>7 x x x x x (x, x)
Baseline Pathogen
Enterobacteriaceaeb Not susceptible to quinolonesc x x x x x (x, x)
Not susceptible to Fosfomycin x x x x x (x, x)
ESBLd x x x x x (x, x)
Carbapenem resistant x x x x x (x, x)
Multidrug resistante x x x x x (x, x)

Statistical Analysis Plan - DMID Protocol: 15-0045 Version 1.0 16JUL2020
Table 30: Comparison of Clinical Cure Rates at EOT by Baseline Characteristics, Therapy Adjustment, Baseline Pathogen, and Treatment Group - Complete Case at EOT Population (continued)
- 78 - PRIVILEGED AND CONFIDENTIAL COMMUNICATION
Subgroup Characteristic
Strategy 1 (N = X)
Strategy 2 (N = X)
Difference (95% CI)a
n % n % %
Escherichia coli Not susceptible to quinolonesc x x x x x (x, x)
Not susceptible to Fosfomycin x x x x x (x, x)
ESBLd x x x x x (x, x)
Carbapenem resistant x x x x x (x, x)
Multidrug resistante x x x x x (x, x)
Klebsiella pneumoniae Not susceptible to quinolonesc x x x x x (x, x)
Not susceptible to Fosfomycin x x x x x (x, x)
ESBLd x x x x x (x, x)
Carbapenem resistant x x x x x (x, x)
Multidrug resistante x x x x x (x, x)
Proteus mirabilis x x x x x (x, x)
Enterobacter cloacae x x x x x (x, x)
Pseudomonas aeruginosa x x x x x (x, x)
Staphylococcus x x x x x (x, x)
Enterococcus x x x x x (x, x) Notes: N = Number of Subjects in the Complete Case at EOT Population. Complete Case at EOT Population is defined as subjects in the micro-ITT population who completed the final EOT visit or have non-missing clinical cure. a 95% CI will be calculated using the Wald Method without continuity correction. b Escherichia coli, Klebsiella pneumoniae, Proteus mirabilis, and Enterobacter cloacae. c Levofloxacin or Ciprofloxacin d Resistance to either ceftazidime, aztreonam, or ceftriaxone. e Resistance to at least one antibiotic from at least three different antimicrobial categories.
Table with similar format:
Table 31: Comparison of Clinical Cure Rates at EOT by Baseline Characteristics, Therapy Adjustment, Baseline Pathogen, and Treatment Group – All Subjects with Non-Missing Clinical Cure at EOT*
[Implementation note: This table will be provided to the PI for the paper manuscript as Table 3E.]

Statistical Analysis Plan - DMID Protocol: 15-0045 Version 1.0 16JUL2020
- 79 - PRIVILEGED AND CONFIDENTIAL COMMUNICATION
Table 32: Comparison of Microbiological Success Rates at TOC by Baseline Characteristics, Therapy Adjustment, Baseline Pathogen, and Treatment Group - Complete Case at TOC Population*
[Implementation note: This table and will be provided to the PI for the paper manuscript as Table 3E.]
Subgroup Characteristic
Strategy 1 (N = X)
Strategy 2 (N = X)
Difference (95% CI)a
n % n % %
Baseline Characteristic
cUTI Type Acute pyelonephritis x x x x x (x, x)
Other cUTI x x x x x (x, x)
Indwelling urinary catheter Yes x x x x x (x, x)
No x x x x x (x, x)
Obstructive uropathy Yes x x x x x (x, x)
No x x x x x (x, x)
Recurrent UTIs Yes x x x x x (x, x)
No x x x x x (x, x)
Diabetes Yes x x x x x (x, x)
No x x x x x (x, x)
Age (years) <65 x x x x x (x, x)
≥65 x x x x x (x, x)
BMI (kg/m2) <30 x x x x x (x, x)
≥30 x x x x x (x, x)
Sex Female x x x x x (x, x)
Male x x x x x (x, x)
Creatinine Clearance (mL/min) ≥60 x x x x x (x, x)
<60 x x x x x (x, x)
Therapy Adjustment
Adjustment of therapy per protocol Yes x x x x x (x, x)
No x x x x x (x, x)
Number of days of unique antibiotics prescribed between randomization and TOC ≤7 x x x x x (x, x)
>7 x x x x x (x, x)
Baseline Pathogen
Enterobacteriaceaeb Not susceptible to quinolonesc x x x x x (x, x)
Not susceptible to Fosfomycin x x x x x (x, x)
ESBLd x x x x x (x, x)
Carbapenem resistant x x x x x (x, x)
Multidrug resistante x x x x x (x, x)

Statistical Analysis Plan - DMID Protocol: 15-0045 Version 1.0 16JUL2020
Table 32: Comparison of Microbiological Success Rates at TOC by Baseline Characteristics, Therapy Adjustment, Baseline Pathogen, and Treatment Group - Complete Case at TOC Population (continued)
- 80 - PRIVILEGED AND CONFIDENTIAL COMMUNICATION
Subgroup Characteristic
Strategy 1 (N = X)
Strategy 2 (N = X)
Difference (95% CI)a
n % n % %
Escherichia coli Not susceptible to quinolonesc x x x x x (x, x)
Not susceptible to Fosfomycin x x x x x (x, x)
ESBLd x x x x x (x, x)
Carbapenem resistant x x x x x (x, x)
Multidrug resistante x x x x x (x, x)
Klebsiella pneumoniae Not susceptible to quinolonesc x x x x x (x, x)
Not susceptible to Fosfomycin x x x x x (x, x)
ESBLd x x x x x (x, x)
Carbapenem resistant x x x x x (x, x)
Multidrug resistante x x x x x (x, x)
Proteus mirabilis x x x x x (x, x)
Enterobacter cloacae x x x x x (x, x)
Pseudomonas aeruginosa x x x x x (x, x)
Staphylococcus x x x x x (x, x)
Enterococcus x x x x x (x, x) Notes: N = Number of Subjects in the Complete Case at TOC Population. Complete Case at TOC Population is defined as subjects in the micro-ITT population that completed the TOC visit or have non-missing microbiological success. a 95% CI will be calculated using the Wald Method without continuity correction. b Escherichia coli, Klebsiella pneumoniae, Proteus mirabilis, and Enterobacter cloacae. c Levofloxacin or Ciprofloxacin. d Resistance to either ceftazidime, aztreonam, or ceftriaxone. e Resistance to at least one antibiotic from at least three different antimicrobial categories.

Statistical Analysis Plan - DMID Protocol: 15-0045 Version 1.0 16JUL2020
- 81 - PRIVILEGED AND CONFIDENTIAL COMMUNICATION
Table 33: Comparison of Microbiological Success Rates at EOT by Baseline Characteristics, Therapy Adjustment, Baseline Pathogen, and Treatment Group - Complete Case at EOT Population*
[Implementation note: This table will be provided to the PI for the paper manuscript as Table 3F.]
Subgroup Characteristic
Strategy 1 (N = X)
Strategy 2 (N = X)
Difference (95% CI)a
n % n % %
Baseline Characteristic
cUTI Type Acute pyelonephritis x x x x x (x, x)
Other cUTI x x x x x (x, x)
Indwelling urinary catheter Yes x x x x x (x, x)
No x x x x x (x, x)
Obstructive uropathy Yes x x x x x (x, x)
No x x x x x (x, x)
Recurrent UTIs Yes x x x x x (x, x)
No x x x x x (x, x)
Diabetes Yes x x x x x (x, x)
No x x x x x (x, x)
Age (years) <65 x x x x x (x, x)
≥65 x x x x x (x, x)
BMI (kg/m2) <30 x x x x x (x, x)
≥30 x x x x x (x, x)
Sex Female x x x x x (x, x)
Male x x x x x (x, x)
Creatinine Clearance (mL/min) ≥60 x x x x x (x, x)
<60 x x x x x (x, x)
Therapy Adjustment
With adjustment of therapy per protocol Yes x x x x x (x, x)
No x x x x x (x, x)
Number of days of unique antibiotics prescribed between randomization and EOT ≤7 x x x x x (x, x)
>7 x x x x x (x, x)
Baseline Pathogen
Enterobacteriaceaeb Not susceptible to quinolonesc x x x x x (x, x)
Not susceptible to Fosfomycin x x x x x (x, x)
ESBLd x x x x x (x, x)
Carbapenem resistant x x x x x (x, x)
Multidrug resistante x x x x x (x, x)

Statistical Analysis Plan - DMID Protocol: 15-0045 Version 1.0 16JUL2020
Table 33: Comparison of Microbiological Success Rates at EOT by Baseline Characteristics, Therapy Adjustment, Baseline Pathogen, and Treatment Group - Complete Case at EOT Population (continued)
- 82 - PRIVILEGED AND CONFIDENTIAL COMMUNICATION
Subgroup Characteristic
Strategy 1 (N = X)
Strategy 2 (N = X)
Difference (95% CI)a
n % n % %
Escherichia coli Not susceptible to quinolonesc x x x x x (x, x)
Not susceptible to Fosfomycin x x x x x (x, x)
ESBLd x x x x x (x, x)
Carbapenem resistant x x x x x (x, x)
Multidrug resistante x x x x x (x, x)
Klebsiella pneumoniae Not susceptible to quinolonesc x x x x x (x, x)
Not susceptible to Fosfomycin x x x x x (x, x)
ESBLd x x x x x (x, x)
Carbapenem resistant x x x x x (x, x)
Multidrug resistante x x x x x (x, x)
Proteus mirabilis x x x x x (x, x)
Enterobacter cloacae x x x x x (x, x)
Pseudomonas aeruginosa x x x x x (x, x)
Staphylococcus x x x x x (x, x)
Enterococcus x x x x x (x, x) Notes: N = Number of Subjects in the Complete Case at EOT Population. Complete Case at EOT Population is defined as subject in the micro-ITT population that completed the final EOT visit or have non-missing microbiological success. a 95% CI will be calculated using the Wald Method without continuity correction. b Escherichia coli, Klebsiella pneumoniae, Proteus mirabilis, and Enterobacter cloacae. c Levofloxacin or Ciprofloxacin. d Resistance to either ceftazidime, aztreonam, or ceftriaxone. e Resistance to at least one antibiotic from at least three different antimicrobial categories.

Statistical Analysis Plan - DMID Protocol: 15-0045 Version 1.0 16JUL2020
- 83 - PRIVILEGED AND CONFIDENTIAL COMMUNICATION
14.3 Safety Data
14.3.1 Displays of Adverse Events
Table 34: Overall Summary of Adverse Events – Fosfomycin Safety Population
Strategy 1
(N=X) Strategy 2
(N=X) All Subjects
(N = xx)
Subjectsa with n % n % n %
At least one solicited adverse event x x x x x x
At least one unsolicited adverse event x x x x x x
At least one related unsolicited adverse event x x x x x x
Mild (Grade 1) x x x x x x
Moderate (Grade 2) x x x x x x
Severe (Grade 3) x x x x x x
At least one severe (Grade 3) unsolicited adverse event x x x x x x
Related x x x x x x
Unrelated x x x x x x
At least one serious adverse eventb x x x x x x
At least one related, serious adverse event x x x x x x
At least one adverse event leading to early terminationc x x x x x x
At least one adverse event of special interest x x x x x x
Mild (Grade 1)
Moderate (Grade 2)
Severe (Grade 3) Note: N = Number of subjects in the Fosfomycin Safety Population. Unsolicited grade 2 and above AEs and SAEs were collected only in subjects receiving at least two doses of Fosfomycin. a Subjects are counted once for each category regardless of the number of events. b A listing of Serious Adverse Events is included in Table 36. c As reported on the Adverse Event eCRF.

Statistical Analysis Plan - DMID Protocol: 15-0045 Version 1.0 16JUL2020
- 84 - PRIVILEGED AND CONFIDENTIAL COMMUNICATION
Table 35: Adverse Events Occurring in 5% of Subjects in Any Treatment Group by MedDRA System Organ Class and Preferred Term, and Treatment Group – Fosfomycin Safety Population
MedDRA System Organ Class Preferred Term Strategy 1
(N=X) Strategy 2
(N=X) All Subjects
(N=X)
n % Events n % Events n % Events
Serious Adverse Events
All All x x x x x x x x x
SOC1 PT1 x x x x x x x x x
Etc. Etc.
Other (Non-serious) Adverse Events
All All x x x x x x x x x
SOC1 PT1 x x x x x x x x x
Etc. Etc. Notes: N = Number of subjects who received at least two doses of Fosfomycin, n = Number of subjects reporting event. Events = Total frequency of events reported.

Statistical Analysis Plan - DMID Protocol: 15-0045 Version 1.0 16JUL2020
- 85 - PRIVILEGED AND CONFIDENTIAL COMMUNICATION
Table 36: Number and Percentage of Subjects Experiencing Adverse Events by Treatment Group - Safety Population*
[Implementation note: This table will be generated for the CSR and will be included in the paper manuscript as Table 4.]
Adverse Event
Strategy 1 (N = X)
Strategy 2 (N = X)
All Subjects (N = X)
n % n % n %
Patients with any grade 2 and above solicited adverse event x x x x x x
Patients with any adverse events leading to discontinuation of Fosfomycin in Strategy 1 or levofloxacin in Strategy 2 x x x x x x
Patients with any AESI x x x x x x Notes: N = Number of subjects in the Safety Population. Subjects are counted once for each category, regardless of the number of events. AESI = Adverse Event of Special Interest.

Statistical Analysis Plan - DMID Protocol: 15-0045 Version 1.0 16JUL2020
- 86 - PRIVILEGED AND CONFIDENTIAL COMMUNICATION
Table 37: Number and Percentage of Adverse Events – Fosfomycin Safety Population*
[Implementation note: This table will be generated for the CSR and will be included in the paper manuscript as Table 5.]
Adverse Event
All Subjects (N = X)
n %
Any solicited adverse event grade 2 and above x x
Any unsolicited adverse event grade 2 and above x x
Any serious adverse event x x
Discontinuation of Fosfomycin in any strategy x x Notes: N = Number of Subjects who received 2 or more doses of Fosfomycin in any treatment group. Subjects are counted once for each category, regardless of the number of events.

Statistical Analysis Plan - DMID Protocol: 15-0045 Version 1.0 16JUL2020
- 87 - PRIVILEGED AND CONFIDENTIAL COMMUNICATION
14.3.1.1 Solicited Adverse Events
Table 38: Number and Percentage of Subjects Experiencing Solicited Events of Moderate Severity or Higher with 95% Confidence Intervals by Symptom and Treatment Group - Safety Population
Symptom
Strategy 1 (N=X)
Strategy 2 (N=X)
Risk Difference P-valuec
n % 95% CIa n % 95% CIa % 95% CIb
Any Symptom xx xx xx.x, xx.x xx xx xx.x, xx.x xx xx.x, xx.x x.xxx
Insomnia
Headache
Dizziness
Nausea
Vomiting
Constipation
Diarrhea
Back Pain
Rhinitis
Pharyngitis
Allergic Reaction
Candidiasis Notes: N = Number of subjects in the Safety Population; n = Number of subjects who reported the indicated symptom with moderate severity or higher. a 95% CI will be calculated using the Wilson method. b 95% CI for the risk difference for strategy 1 compared to strategy 2 will be calculated using the Newcombe method with continuity correction. c P-value obtained by Fisher’s Exact Test.

Statistical Analysis Plan - DMID Protocol: 15-0045 Version 1.0 16JUL2020
- 88 - PRIVILEGED AND CONFIDENTIAL COMMUNICATION
Table 39: Number and Percentage of Subjects Experiencing Solicited Events of Moderate Severity or Higher with 95% Confidence Intervals by Symptom and Treatment Group – Fosfomycin Safety Population
Symptom
Strategy 1 (N=X)
Strategy 2 (N=X)
Risk Difference P-valuec
n % 95% CIa n % 95% CIa % 95% CIb
Any Symptom xx xx xx.x, xx.x xx xx xx.x, xx.x xx xx.x, xx.x x.xxx
Insomnia
Headache
Dizziness
Nausea
Vomiting
Constipation
Diarrhea
Back Pain
Rhinitis
Pharyngitis
Allergic Reaction
Candidiasis Notes: N = Number of subjects in the Fosfomycin Safety Population; n = Number of subjects who reported the indicated symptom with moderate severity or higher. a 95% CI will be calculated using the Wilson method. b 95% CI for the risk difference for strategy 1 compared to strategy 2 will be calculated using the Newcombe method with continuity correction. c P-value obtained by Fisher’s Exact Test.

Statistical Analysis Plan - DMID Protocol: 15-0045 Version 1.0 16JUL2020
- 89 - PRIVILEGED AND CONFIDENTIAL COMMUNICATION
Table 40: Number and Percentage of Subjects Experiencing Solicited Events of Moderate Severity or Higher with 95% Confidence Intervals by Symptom, Study Day Post Dose 1, and Treatment Group - Safety Population
Symptom
Day 1 Day 2 Day 3 Day 4 Day 5 Day 6 Day 7 Day 8 Day 9 Day 10 Day 11 Day 12 Day 13+
n/N (%)
n/N (%)
n/N (%)
n/N (%)
n/N (%)
n/N (%)
n/N (%)
n/N (%)
n/N (%)
n/N (%)
n/N (%)
n/N (%)
n/N (%)
Strategy 1
Any Symptom x/x (x) x/x (x) x/x (x) x/x (x) x/x (x) x/x (x) x/x (x) x/x (x) x/x (x) x/x (x) x/x (x) x/x (x) x/x (x)
Insomnia
Headache
Dizziness
Nausea
Vomiting
Constipation
Diarrhea
Back Pain
Rhinitis
Pharyngitis
Allergic Reaction
Candidiasis
Strategy 2
Any Symptom x/x (x) x/x (x) x/x (x) x/x (x) x/x (x) x/x (x) x/x (x) x/x (x) x/x (x) x/x (x) x/x (x) x/x (x) x/x (x)
Insomnia
Headache
Dizziness
Nausea
Vomiting
Constipation
Diarrhea
Back Pain
Rhinitis
Pharyngitis
Allergic Reaction
Candidiasis Note: N = Number of subjects in the Safety Population in the respective treatment group for a given symptom on the respective day(s). n = Number of subjects reporting a moderate or severe severity for a given symptom for that day.

Statistical Analysis Plan - DMID Protocol: 15-0045 Version 1.0 16JUL2020
- 90 - PRIVILEGED AND CONFIDENTIAL COMMUNICATION
Table 41: Number and Percentage of Subjects Experiencing Solicited Events with 95% Confidence Intervals by Symptom, Day Post Dose 1, and Treatment Group – Fosfomycin Safety Population
[Implementation note: Update footnote to use Fosfomycin Safety Population]

Statistical Analysis Plan - DMID Protocol: 15-0045 Version 1.0 16JUL2020
- 91 - PRIVILEGED AND CONFIDENTIAL COMMUNICATION
Table 42: Number and Percentage of Subjects Experiencing Solicited Events by Symptom, Maximum Severity, Study Day Post Dose 1, and Treatment Group - Safety Population
Symptom Severity
Day 1 Day 2 Day 3 Day 4 Day 5 Day 6 Day 7 Days 8 Day 9 Day 10 Day 11 Day 12 Day 13+ Any Day
n/N (%) n/N (%) n/N (%) n/N (%) n/N (%) n/N (%) n/N (%) n/N (%) n/N (%) n/N (%) n/N (%) n/N (%) n/N (%) n/N (%)
Strategy 1
Insomnia None/Mild x/x (x) x/x (x) x/x (x) x/x (x) x/x (x) x/x (x) x/x (x) x/x (x) x/x (x) x/x (x) x/x (x) x/x (x) x/x (x) x/x (x)
Moderate x/x (x) x/x (x) x/x (x) x/x (x) x/x (x) x/x (x) x/x (x) x/x (x) x/x (x) x/x (x) x/x (x) x/x (x) x/x (x) x/x (x)
Severe x/x (x) x/x (x) x/x (x) x/x (x) x/x (x) x/x (x) x/x (x) x/x (x) x/x (x) x/x (x) x/x (x) x/x (x) x/x (x) x/x (x)
Headache None/Mild x/x (x) x/x (x) x/x (x) x/x (x) x/x (x) x/x (x) x/x (x) x/x (x) x/x (x) x/x (x) x/x (x) x/x (x) x/x (x) x/x (x)
Moderate x/x (x) x/x (x) x/x (x) x/x (x) x/x (x) x/x (x) x/x (x) x/x (x) x/x (x) x/x (x) x/x (x) x/x (x) x/x (x) x/x (x)
Severe x/x (x) x/x (x) x/x (x) x/x (x) x/x (x) x/x (x) x/x (x) x/x (x) x/x (x) x/x (x) x/x (x) x/x (x) x/x (x) x/x (x)
Dizziness None/Mild x/x (x) x/x (x) x/x (x) x/x (x) x/x (x) x/x (x) x/x (x) x/x (x) x/x (x) x/x (x) x/x (x) x/x (x) x/x (x) x/x (x)
Moderate x/x (x) x/x (x) x/x (x) x/x (x) x/x (x) x/x (x) x/x (x) x/x (x) x/x (x) x/x (x) x/x (x) x/x (x) x/x (x) x/x (x)
Severe x/x (x) x/x (x) x/x (x) x/x (x) x/x (x) x/x (x) x/x (x) x/x (x) x/x (x) x/x (x) x/x (x) x/x (x) x/x (x) x/x (x)
Nausea None/Mild x/x (x) x/x (x) x/x (x) x/x (x) x/x (x) x/x (x) x/x (x) x/x (x) x/x (x) x/x (x) x/x (x) x/x (x) x/x (x) x/x (x)
Moderate x/x (x) x/x (x) x/x (x) x/x (x) x/x (x) x/x (x) x/x (x) x/x (x) x/x (x) x/x (x) x/x (x) x/x (x) x/x (x) x/x (x)
Severe x/x (x) x/x (x) x/x (x) x/x (x) x/x (x) x/x (x) x/x (x) x/x (x) x/x (x) x/x (x) x/x (x) x/x (x) x/x (x) x/x (x)
Vomiting None/Mild x/x (x) x/x (x) x/x (x) x/x (x) x/x (x) x/x (x) x/x (x) x/x (x) x/x (x) x/x (x) x/x (x) x/x (x) x/x (x) x/x (x)
Moderate x/x (x) x/x (x) x/x (x) x/x (x) x/x (x) x/x (x) x/x (x) x/x (x) x/x (x) x/x (x) x/x (x) x/x (x) x/x (x) x/x (x)
Severe x/x (x) x/x (x) x/x (x) x/x (x) x/x (x) x/x (x) x/x (x) x/x (x) x/x (x) x/x (x) x/x (x) x/x (x) x/x (x) x/x (x)
Constipation None/Mild x/x (x) x/x (x) x/x (x) x/x (x) x/x (x) x/x (x) x/x (x) x/x (x) x/x (x) x/x (x) x/x (x) x/x (x) x/x (x) x/x (x)
Moderate x/x (x) x/x (x) x/x (x) x/x (x) x/x (x) x/x (x) x/x (x) x/x (x) x/x (x) x/x (x) x/x (x) x/x (x) x/x (x) x/x (x)
Severe x/x (x) x/x (x) x/x (x) x/x (x) x/x (x) x/x (x) x/x (x) x/x (x) x/x (x) x/x (x) x/x (x) x/x (x) x/x (x) x/x (x)
Diarrhea None/Mild x/x (x) x/x (x) x/x (x) x/x (x) x/x (x) x/x (x) x/x (x) x/x (x) x/x (x) x/x (x) x/x (x) x/x (x) x/x (x) x/x (x)
Moderate x/x (x) x/x (x) x/x (x) x/x (x) x/x (x) x/x (x) x/x (x) x/x (x) x/x (x) x/x (x) x/x (x) x/x (x) x/x (x) x/x (x)
Severe x/x (x) x/x (x) x/x (x) x/x (x) x/x (x) x/x (x) x/x (x) x/x (x) x/x (x) x/x (x) x/x (x) x/x (x) x/x (x) x/x (x)

Statistical Analysis Plan - DMID Protocol: 15-0045 Version 1.0 16JUL2020
Table 42: Number and Percentage of Subjects Experiencing Solicited Events by Symptom, Maximum Severity, Study Day Post Dose 1, and Treatment Group - Safety Population (continued)
- 92 - PRIVILEGED AND CONFIDENTIAL COMMUNICATION
Symptom Severity
Day 1 Day 2 Day 3 Day 4 Day 5 Day 6 Day 7 Days 8 Day 9 Day 10 Day 11 Day 12 Day 13+ Any Day
n/N (%) n/N (%) n/N (%) n/N (%) n/N (%) n/N (%) n/N (%) n/N (%) n/N (%) n/N (%) n/N (%) n/N (%) n/N (%) n/N (%)
Back Pain None/Mild x/x (x) x/x (x) x/x (x) x/x (x) x/x (x) x/x (x) x/x (x) x/x (x) x/x (x) x/x (x) x/x (x) x/x (x) x/x (x) x/x (x)
Moderate x/x (x) x/x (x) x/x (x) x/x (x) x/x (x) x/x (x) x/x (x) x/x (x) x/x (x) x/x (x) x/x (x) x/x (x) x/x (x) x/x (x)
Severe x/x (x) x/x (x) x/x (x) x/x (x) x/x (x) x/x (x) x/x (x) x/x (x) x/x (x) x/x (x) x/x (x) x/x (x) x/x (x) x/x (x)
Rhinitis None/Mild x/x (x) x/x (x) x/x (x) x/x (x) x/x (x) x/x (x) x/x (x) x/x (x) x/x (x) x/x (x) x/x (x) x/x (x) x/x (x) x/x (x)
Moderate x/x (x) x/x (x) x/x (x) x/x (x) x/x (x) x/x (x) x/x (x) x/x (x) x/x (x) x/x (x) x/x (x) x/x (x) x/x (x) x/x (x)
Severe x/x (x) x/x (x) x/x (x) x/x (x) x/x (x) x/x (x) x/x (x) x/x (x) x/x (x) x/x (x) x/x (x) x/x (x) x/x (x) x/x (x)
Pharyngitis None/Mild x/x (x) x/x (x) x/x (x) x/x (x) x/x (x) x/x (x) x/x (x) x/x (x) x/x (x) x/x (x) x/x (x) x/x (x) x/x (x) x/x (x)
Moderate x/x (x) x/x (x) x/x (x) x/x (x) x/x (x) x/x (x) x/x (x) x/x (x) x/x (x) x/x (x) x/x (x) x/x (x) x/x (x) x/x (x)
Severe x/x (x) x/x (x) x/x (x) x/x (x) x/x (x) x/x (x) x/x (x) x/x (x) x/x (x) x/x (x) x/x (x) x/x (x) x/x (x) x/x (x)
Allergic Reaction None/Mild x/x (x) x/x (x) x/x (x) x/x (x) x/x (x) x/x (x) x/x (x) x/x (x) x/x (x) x/x (x) x/x (x) x/x (x) x/x (x) x/x (x)
Moderate x/x (x) x/x (x) x/x (x) x/x (x) x/x (x) x/x (x) x/x (x) x/x (x) x/x (x) x/x (x) x/x (x) x/x (x) x/x (x) x/x (x)
Severe x/x (x) x/x (x) x/x (x) x/x (x) x/x (x) x/x (x) x/x (x) x/x (x) x/x (x) x/x (x) x/x (x) x/x (x) x/x (x) x/x (x)
Candidiasis None/Mild x/x (x) x/x (x) x/x (x) x/x (x) x/x (x) x/x (x) x/x (x) x/x (x) x/x (x) x/x (x) x/x (x) x/x (x) x/x (x) x/x (x)
Moderate x/x (x) x/x (x) x/x (x) x/x (x) x/x (x) x/x (x) x/x (x) x/x (x) x/x (x) x/x (x) x/x (x) x/x (x) x/x (x) x/x (x)
Severe x/x (x) x/x (x) x/x (x) x/x (x) x/x (x) x/x (x) x/x (x) x/x (x) x/x (x) x/x (x) x/x (x) x/x (x) x/x (x) x/x (x)
Strategy 2
Insomnia None/Mild x/x (x) x/x (x) x/x (x) x/x (x) x/x (x) x/x (x) x/x (x) x/x (x) x/x (x) x/x (x) x/x (x) x/x (x) x/x (x) x/x (x)
Moderate x/x (x) x/x (x) x/x (x) x/x (x) x/x (x) x/x (x) x/x (x) x/x (x) x/x (x) x/x (x) x/x (x) x/x (x) x/x (x) x/x (x)
Severe x/x (x) x/x (x) x/x (x) x/x (x) x/x (x) x/x (x) x/x (x) x/x (x) x/x (x) x/x (x) x/x (x) x/x (x) x/x (x) x/x (x)
Headache None/Mild x/x (x) x/x (x) x/x (x) x/x (x) x/x (x) x/x (x) x/x (x) x/x (x) x/x (x) x/x (x) x/x (x) x/x (x) x/x (x) x/x (x)
Moderate x/x (x) x/x (x) x/x (x) x/x (x) x/x (x) x/x (x) x/x (x) x/x (x) x/x (x) x/x (x) x/x (x) x/x (x) x/x (x) x/x (x)
Severe x/x (x) x/x (x) x/x (x) x/x (x) x/x (x) x/x (x) x/x (x) x/x (x) x/x (x) x/x (x) x/x (x) x/x (x) x/x (x) x/x (x)
Dizziness None/Mild x/x (x) x/x (x) x/x (x) x/x (x) x/x (x) x/x (x) x/x (x) x/x (x) x/x (x) x/x (x) x/x (x) x/x (x) x/x (x) x/x (x)

Statistical Analysis Plan - DMID Protocol: 15-0045 Version 1.0 16JUL2020
Table 42: Number and Percentage of Subjects Experiencing Solicited Events by Symptom, Maximum Severity, Study Day Post Dose 1, and Treatment Group - Safety Population (continued)
- 93 - PRIVILEGED AND CONFIDENTIAL COMMUNICATION
Symptom Severity
Day 1 Day 2 Day 3 Day 4 Day 5 Day 6 Day 7 Days 8 Day 9 Day 10 Day 11 Day 12 Day 13+ Any Day
n/N (%) n/N (%) n/N (%) n/N (%) n/N (%) n/N (%) n/N (%) n/N (%) n/N (%) n/N (%) n/N (%) n/N (%) n/N (%) n/N (%)
Moderate x/x (x) x/x (x) x/x (x) x/x (x) x/x (x) x/x (x) x/x (x) x/x (x) x/x (x) x/x (x) x/x (x) x/x (x) x/x (x) x/x (x)
Severe x/x (x) x/x (x) x/x (x) x/x (x) x/x (x) x/x (x) x/x (x) x/x (x) x/x (x) x/x (x) x/x (x) x/x (x) x/x (x) x/x (x)
Nausea None/Mild x/x (x) x/x (x) x/x (x) x/x (x) x/x (x) x/x (x) x/x (x) x/x (x) x/x (x) x/x (x) x/x (x) x/x (x) x/x (x) x/x (x)
Moderate x/x (x) x/x (x) x/x (x) x/x (x) x/x (x) x/x (x) x/x (x) x/x (x) x/x (x) x/x (x) x/x (x) x/x (x) x/x (x) x/x (x)
Severe x/x (x) x/x (x) x/x (x) x/x (x) x/x (x) x/x (x) x/x (x) x/x (x) x/x (x) x/x (x) x/x (x) x/x (x) x/x (x) x/x (x)
Vomiting None/Mild x/x (x) x/x (x) x/x (x) x/x (x) x/x (x) x/x (x) x/x (x) x/x (x) x/x (x) x/x (x) x/x (x) x/x (x) x/x (x) x/x (x)
Moderate x/x (x) x/x (x) x/x (x) x/x (x) x/x (x) x/x (x) x/x (x) x/x (x) x/x (x) x/x (x) x/x (x) x/x (x) x/x (x) x/x (x)
Severe x/x (x) x/x (x) x/x (x) x/x (x) x/x (x) x/x (x) x/x (x) x/x (x) x/x (x) x/x (x) x/x (x) x/x (x) x/x (x) x/x (x)
Constipation None/Mild x/x (x) x/x (x) x/x (x) x/x (x) x/x (x) x/x (x) x/x (x) x/x (x) x/x (x) x/x (x) x/x (x) x/x (x) x/x (x) x/x (x)
Moderate x/x (x) x/x (x) x/x (x) x/x (x) x/x (x) x/x (x) x/x (x) x/x (x) x/x (x) x/x (x) x/x (x) x/x (x) x/x (x) x/x (x)
Severe x/x (x) x/x (x) x/x (x) x/x (x) x/x (x) x/x (x) x/x (x) x/x (x) x/x (x) x/x (x) x/x (x) x/x (x) x/x (x) x/x (x)
Diarrhea None/Mild x/x (x) x/x (x) x/x (x) x/x (x) x/x (x) x/x (x) x/x (x) x/x (x) x/x (x) x/x (x) x/x (x) x/x (x) x/x (x) x/x (x)
Moderate x/x (x) x/x (x) x/x (x) x/x (x) x/x (x) x/x (x) x/x (x) x/x (x) x/x (x) x/x (x) x/x (x) x/x (x) x/x (x) x/x (x)
Severe x/x (x) x/x (x) x/x (x) x/x (x) x/x (x) x/x (x) x/x (x) x/x (x) x/x (x) x/x (x) x/x (x) x/x (x) x/x (x) x/x (x)
Back Pain None/Mild x/x (x) x/x (x) x/x (x) x/x (x) x/x (x) x/x (x) x/x (x) x/x (x) x/x (x) x/x (x) x/x (x) x/x (x) x/x (x) x/x (x)
Moderate x/x (x) x/x (x) x/x (x) x/x (x) x/x (x) x/x (x) x/x (x) x/x (x) x/x (x) x/x (x) x/x (x) x/x (x) x/x (x) x/x (x)
Severe x/x (x) x/x (x) x/x (x) x/x (x) x/x (x) x/x (x) x/x (x) x/x (x) x/x (x) x/x (x) x/x (x) x/x (x) x/x (x) x/x (x)
Rhinitis None/Mild x/x (x) x/x (x) x/x (x) x/x (x) x/x (x) x/x (x) x/x (x) x/x (x) x/x (x) x/x (x) x/x (x) x/x (x) x/x (x) x/x (x)
Moderate x/x (x) x/x (x) x/x (x) x/x (x) x/x (x) x/x (x) x/x (x) x/x (x) x/x (x) x/x (x) x/x (x) x/x (x) x/x (x) x/x (x)
Severe x/x (x) x/x (x) x/x (x) x/x (x) x/x (x) x/x (x) x/x (x) x/x (x) x/x (x) x/x (x) x/x (x) x/x (x) x/x (x) x/x (x)
Pharyngitis None/Mild x/x (x) x/x (x) x/x (x) x/x (x) x/x (x) x/x (x) x/x (x) x/x (x) x/x (x) x/x (x) x/x (x) x/x (x) x/x (x) x/x (x)
Moderate x/x (x) x/x (x) x/x (x) x/x (x) x/x (x) x/x (x) x/x (x) x/x (x) x/x (x) x/x (x) x/x (x) x/x (x) x/x (x) x/x (x)
Severe x/x (x) x/x (x) x/x (x) x/x (x) x/x (x) x/x (x) x/x (x) x/x (x) x/x (x) x/x (x) x/x (x) x/x (x) x/x (x) x/x (x)

Statistical Analysis Plan - DMID Protocol: 15-0045 Version 1.0 16JUL2020
Table 42: Number and Percentage of Subjects Experiencing Solicited Events by Symptom, Maximum Severity, Study Day Post Dose 1, and Treatment Group - Safety Population (continued)
- 94 - PRIVILEGED AND CONFIDENTIAL COMMUNICATION
Symptom Severity
Day 1 Day 2 Day 3 Day 4 Day 5 Day 6 Day 7 Days 8 Day 9 Day 10 Day 11 Day 12 Day 13+ Any Day
n/N (%) n/N (%) n/N (%) n/N (%) n/N (%) n/N (%) n/N (%) n/N (%) n/N (%) n/N (%) n/N (%) n/N (%) n/N (%) n/N (%)
Allergic Reaction None/Mild x/x (x) x/x (x) x/x (x) x/x (x) x/x (x) x/x (x) x/x (x) x/x (x) x/x (x) x/x (x) x/x (x) x/x (x) x/x (x) x/x (x)
Moderate x/x (x) x/x (x) x/x (x) x/x (x) x/x (x) x/x (x) x/x (x) x/x (x) x/x (x) x/x (x) x/x (x) x/x (x) x/x (x) x/x (x)
Severe x/x (x) x/x (x) x/x (x) x/x (x) x/x (x) x/x (x) x/x (x) x/x (x) x/x (x) x/x (x) x/x (x) x/x (x) x/x (x) x/x (x)
Candidiasis None/Mild x/x (x) x/x (x) x/x (x) x/x (x) x/x (x) x/x (x) x/x (x) x/x (x) x/x (x) x/x (x) x/x (x) x/x (x) x/x (x) x/x (x)
Moderate x/x (x) x/x (x) x/x (x) x/x (x) x/x (x) x/x (x) x/x (x) x/x (x) x/x (x) x/x (x) x/x (x) x/x (x) x/x (x) x/x (x)
Severe x/x (x) x/x (x) x/x (x) x/x (x) x/x (x) x/x (x) x/x (x) x/x (x) x/x (x) x/x (x) x/x (x) x/x (x) x/x (x) x/x (x) Note: N = Number of subjects in the Safety Population in the respective treatment group with severity grades collected for each solicited symptom on the respective day(s). n = Number of subjects reporting a corresponding severity for a given symptom for that day.
Table 43: Number and Percentage of Subjects Experiencing Solicited Events by Symptom, Maximum Severity, Study Day Post Dose 1, and Treatment Group - Fosfomycin Safety Population
[Implementation note: Update footnote to use Fosfomycin Safety Population]

Statistical Analysis Plan - DMID Protocol: 15-0045 Version 1.0 16JUL2020
- 95 - PRIVILEGED AND CONFIDENTIAL COMMUNICATION
Table 44: Number and Percentage of Subjects Experiencing Solicited Adverse Events of Moderate Severity or Greater Over the Follow-up Period by Treatment Group and Severity - Safety Population
Symptom Severity Strategy 1
(N=X) Strategy 2
(N=X) Odds Ratio (95% CI)b P-Valueb
n (%) 95% CIa n (%) 95% CIa
Any Symptom Moderate x (x) (x, x) x (x) (x, x) x.x (x.x, x.x) x.xxx
Severe x (x) (x, x) x (x) (x, x)
Insomnia Moderate x (x) (x, x) x (x) (x, x) x.x (x.x, x.x) x.xxx
Severe x (x) (x, x) x (x) (x, x)
Headache Moderate x (x) (x, x) x (x) (x, x) x.x (x.x, x.x) x.xxx
Severe x (x) (x, x) x (x) (x, x)
Dizziness Moderate x (x) (x, x) x (x) (x, x) x.x (x.x, x.x) x.xxx
Severe x (x) (x, x) x (x) (x, x)
Nausea Moderate x (x) (x, x) x (x) (x, x) x.x (x.x, x.x) x.xxx
Severe x (x) (x, x) x (x) (x, x)
Vomiting Moderate x (x) (x, x) x (x) (x, x) x.x (x.x, x.x) x.xxx
Severe x (x) (x, x) x (x) (x, x)
Constipation Moderate x (x) (x, x) x (x) (x, x) x.x (x.x, x.x) x.xxx
Severe x (x) (x, x) x (x) (x, x)
Diarrhea Moderate x (x) (x, x) x (x) (x, x) x.x (x.x, x.x) x.xxx
Severe x (x) (x, x) x (x) (x, x)
Back Pain Moderate x (x) (x, x) x (x) (x, x) x.x (x.x, x.x) x.xxx
Severe x (x) (x, x) x (x) (x, x)
Rhinitis Moderate x (x) (x, x) x (x) (x, x) x.x (x.x, x.x) x.xxx
Severe x (x) (x, x) x (x) (x, x)
Pharyngitis Moderate x (x) (x, x) x (x) (x, x) x.x (x.x, x.x) x.xxx
Severe x (x) (x, x) x (x) (x, x)
Allergic Reaction Moderate x (x) (x, x) x (x) (x, x) x.x (x.x, x.x) x.xxx
Severe x (x) (x, x) x (x) (x, x)
Candidiasis Moderate x (x) (x, x) x (x) (x, x) x.x (x.x, x.x) x.xxx
Severe x (x) (x, x) x (x) (x, x) Note: N = Number of subjects in the Safety Population. a 95% CI estimated using Wilson method. b 95% CI for OR and P-value calculated from the proportional odds model using the Wald Test. OR can be interpreted as the odds ratio of having a maximum severity less than or equal to a severity category of j for strategy 1 compared to strategy 2 where j = 0,1,2,3.

Statistical Analysis Plan - DMID Protocol: 15-0045 Version 1.0 16JUL2020
- 96 - PRIVILEGED AND CONFIDENTIAL COMMUNICATION
Table 45: Number and Percentage of Subjects Experiencing Solicited Adverse Events of Moderate Severity or Greater Over the Follow-up Period by Treatment Group and Severity – Fosfomycin Safety Population
[Implementation note: Update footnote to use Fosfomycin Safety Population]

Statistical Analysis Plan - DMID Protocol: 15-0045 Version 1.0 16JUL2020
- 97 - PRIVILEGED AND CONFIDENTIAL COMMUNICATION
14.3.1.2 Unsolicited Adverse Events
Table 46: Number and Percentage of Subjects Experiencing Unsolicited Adverse Events with 95% Confidence Intervals by MedDRA System Organ Class and Preferred Term, and Treatment Group - Fosfomycin Safety Population
MedDRA System Organ Class MedDRA Preferred Term
Strategy 1 (N=X)
Strategy 2 (N=X)
n % (95% CI)a n % (95% CI)a
Any SOC Any PT x xx (xx, xx) x xx (xx, xx)
[SOC 1] Any PT
[PT 1]
[PT 2]
[SOC 2] Any PT
[PT 1]
[PT 2] Notes: N = Number of subjects in the Fosfomycin Safety Population. This table presents number and percentage of subjects. A subject is only counted once per PT. a 95% CI estimated using Wilson method.

Statistical Analysis Plan - DMID Protocol: 15-0045 Version 1.0 16JUL2020
- 98 - PRIVILEGED AND CONFIDENTIAL COMMUNICATION
Table 47: Number and Percentage of Subjects Experiencing Unsolicited Adverse Events by MedDRA System Organ Class and Preferred Term, Maximum Severity, Relationship, and Treatment Group – Fosfomycin Safety Population
MedDRA System Organ Class MedDRA Preferred Term
Any Incidence
Severity Relationship to Treatment
None/Mild Moderate Severe Not Related Related
n % n % n % n % n % n %
Strategy 1 (N = X)
Any SOC Any PT x xx x xx x xx x xx x xx x xx
[SOC 1] Any PT
[PT 1]
[PT 2]
[SOC 2] Any PT
[PT 1]
[PT 2]
Strategy 2 (N = X)
Any SOC Any PT x xx x xx x xx x xx x xx x xx
[SOC 1] Any PT
[PT 1]
[PT 2]
[SOC 2] Any PT
[PT 1]
[PT 2] Notes: N = Number of subjects in the Fosfomycin Safety Population. For severity, a subject is counted once per PT and summary according to their highest severity. For relationship, a subject is only counted once per PT and is summarized according to their closest relationship.

Statistical Analysis Plan - DMID Protocol: 15-0045 Version 1.0 16JUL2020
- 99 - PRIVILEGED AND CONFIDENTIAL COMMUNICATION
Table 48: Number and Percentage of Subjects Experiencing Non-Serious Related Unsolicited Adverse Events by MedDRA System Organ Class and Preferred Term, Maximum Severity, and Treatment Group – Fosfomycin Safety Population
MedDRA System Organ Class MedDRA Preferred Term
Any Incidence
Severity
None/Mild Moderate Severe
n % n % n % n %
Strategy 1 (N = X)
Any SOC Any PT x xx x xx x xx x xx
[SOC 1] Any PT
[PT 1]
[PT 2]
[SOC 2] Any PT
[PT 1]
[PT 2]
Strategy 2 (N = X)
Any SOC Any PT x xx x xx x xx x xx
[SOC 1] Any PT
[PT 1]
[PT 2]
[SOC 2] Any PT
[PT 1]
[PT 2] Notes: N = Number of subjects in the Fosfomycin Safety Analysis Population. A subject is counted once per PT and is summarized according to their highest severity.

Statistical Analysis Plan - DMID Protocol: 15-0045 Version 1.0 16JUL2020
- 100 - PRIVILEGED AND CONFIDENTIAL COMMUNICATION
14.3.2 Listing of Deaths, Other Serious and Significant Adverse Events
Table 49: Listing of Serious Adverse Events
[Implementation Note: If the event is ongoing (no stop date), indicate “ongoing” in the “Duration” column. If more than one reason is selected for the reason reported as an SAE, list all reasons in the column, separated by a comma. In the “If Not Related, Alternate Etiology” column, merge the 2 data fields for collecting alternate etiology, separate by a colon. In the CSR, Subject ID should be USUBJID (not PATID) for purposes of de-identification.]
Adverse Event
Reason Reported as
an SAE Severity Relationship to
Study Treatment
If Not Related, Alternative
Etiology
Action Taken with Study Treatment
Subject Discontinued Due
to AE Outcome
MedDRA System Organ
Class MedDRA
Preferred Term
Subject ID: , Treatment Strategy: , AE Number:
Comments:
Subject ID: , Treatment Strategy: , AE Number:
Comments:

Statistical Analysis Plan - DMID Protocol: 15-0045 Version 1.0 16JUL2020
- 101 - PRIVILEGED AND CONFIDENTIAL COMMUNICATION
Table 50: Listing of Adverse Events of Special Interest
Adverse Event
Reason Reported as
an SAE Severity Relationship to
Study Treatment
If Not Related, Alternative
Etiology
Action Taken with Study Treatment
Subject Discontinued Due
to AE Outcome
MedDRA System Organ
Class MedDRA
Preferred Term
Subject ID: , Treatment Group: , AE Number:
Comments:
Subject ID: , Treatment Group: , AE Number:
Comments:
Tables with similar format
Table 51: Listing of Non-Serious, Unsolicited, Moderate or Severe Adverse Events

Statistical Analysis Plan - DMID Protocol: 15-0045 Version 1.0 16JUL2020
- 102 - PRIVILEGED AND CONFIDENTIAL COMMUNICATION
14.3.3 Narratives of Deaths, Other Serious and Significant Adverse Events
Not included in SAP, but this is a placeholder for the CSR.

Statistical Analysis Plan - DMID Protocol: 15-0045 Version 1.0 16JUL2020
- 103 - PRIVILEGED AND CONFIDENTIAL COMMUNICATION
14.3.4 Abnormal Laboratory Value Listings (by Subject)
Not Applicable

Statistical Analysis Plan - DMID Protocol: 15-0045 Version 1.0 16JUL2020
- 104 - PRIVILEGED AND CONFIDENTIAL COMMUNICATION
14.3.5 Displays of Laboratory Results
Not Applicable.

Statistical Analysis Plan - DMID Protocol: 15-0045 Version 1.0 16JUL2020
- 105 - PRIVILEGED AND CONFIDENTIAL COMMUNICATION
14.3.6 Displays of Vital Signs
Table 52: Summary of Vital Signs by Visit and Treatment Group
Screening Visit
(Visit 00) Randomization Visit
(Visit 01) Interim Visit
(Visit 02) End-of-Therapy Visit Test-of-Cure Visit
Strategy 1 Strategy 2 Strategy 1 Strategy 2 Strategy 1 Strategy 2 Strategy 1 Strategy 2 Strategy 1 Strategy 2
Temperature (°F) N xx xx xx xx xx xx xx xx xx xx
Mean x.xx x.xx x.xx x.xx x.xx x.xx x.xx x.xx x.xx x.xx
Std xx.xx xx.xx xx.xx xx.xx xx.xx xx.xx xx.xx xx.xx xx.xx xx.xx
Median x x x x x x x x x x
Min, Max xx,xx xx,xx xx,xx xx,xx xx,xx xx,xx xx,xx xx,xx xx,xx xx,xx
Diastolic Blood Pressure (mmHg) N xx xx xx xx xx xx xx xx xx xx
Mean x.xx x.xx x.xx x.xx x.xx x.xx x.xx x.xx x.xx x.xx
Std xx.xx xx.xx xx.xx xx.xx xx.xx xx.xx xx.xx xx.xx xx.xx xx.xx
Median x x x x x x x x x x
Min, Max xx,xx xx,xx xx,xx xx,xx xx,xx xx,xx xx,xx xx,xx xx,xx xx,xx
Systolic Blood Pressure (mmHg) N xx xx xx xx xx xx xx xx xx xx
Mean x.xx x.xx x.xx x.xx x.xx x.xx x.xx x.xx x.xx x.xx
Std xx.xx xx.xx xx.xx xx.xx xx.xx xx.xx xx.xx xx.xx xx.xx xx.xx
Median x x x x x x x x x x
Min, Max xx,xx xx,xx xx,xx xx,xx xx,xx xx,xx xx,xx xx,xx xx,xx xx,xx
Respiratory Rate (breaths/min.) N xx xx xx xx xx xx xx xx xx xx
Mean x.xx x.xx x.xx x.xx x.xx x.xx x.xx x.xx x.xx x.xx
Std xx.xx xx.xx xx.xx xx.xx xx.xx xx.xx xx.xx xx.xx xx.xx xx.xx
Median x x x x x x x x x x
Min, Max xx,xx xx,xx xx,xx xx,xx xx,xx xx,xx xx,xx xx,xx xx,xx xx,xx

Statistical Analysis Plan - DMID Protocol: 15-0045 Version 1.0 16JUL2020
Table 52: Summary of Vital Signs by Visit and Treatment Group (continued)
- 106 - PRIVILEGED AND CONFIDENTIAL COMMUNICATION
Screening Visit
(Visit 00) Randomization Visit
(Visit 01) Interim Visit
(Visit 02) End-of-Therapy Visit Test-of-Cure Visit
Strategy 1 Strategy 2 Strategy 1 Strategy 2 Strategy 1 Strategy 2 Strategy 1 Strategy 2 Strategy 1 Strategy 2
Pulse (beats/min.) N xx xx xx xx xx xx xx xx xx xx
Mean x.xx x.xx x.xx x.xx x.xx x.xx x.xx x.xx x.xx x.xx
Std xx.xx xx.xx xx.xx xx.xx xx.xx xx.xx xx.xx xx.xx xx.xx xx.xx
Median x x x x x x x x x x
Min, Max xx,xx xx,xx xx,xx xx,xx xx,xx xx,xx xx,xx xx,xx xx,xx xx,xx Note: N = Number of subjects in the Safety Population without missing values for a given parameter at a given visit.

Statistical Analysis Plan - DMID Protocol: 15-0045 Version 1.0 16JUL2020
- 107 - PRIVILEGED AND CONFIDENTIAL COMMUNICATION
14.4 Summary of Concomitant Medications
Table 53: Number and Percentage of Subjects with Prior and Concurrent Medications by WHO Drug Classification and Treatment Group
WHO Drug Code Level 1, Anatomic Group
WHO Drug Code Level 2, Therapeutic
Subgroup
Strategy 1 (N=X)
Strategy 2 (N=X)
All Subjects (N=X)
n % n % n %
Any Level 1 Codes Any Level 2 Codes x xx x xx x xx
[ATC Level 1 - 1] Any [ATC 1 – 1]
[ATC 2 - 1]
[ATC 2 - 2]
[ATC 2 - 3]
[ATC Level 1 – 2] [ATC 2 - 1]
[ATC 2 - 2]
[ATC 2 - 3] Notes: N= Number of subjects in the Safety population. n=Number of subjects reporting taking at least one medication in the specific WHO Drug Class.

Statistical Analysis Plan - DMID Protocol: 15-0045 Version 1.0 16JUL2020
- 108 - PRIVILEGED AND CONFIDENTIAL COMMUNICATION
APPENDIX 2. FIGURE MOCK-UPS
LIST OF FIGURES
Figure 1: CONSORT Flow Diagram* ......................................................................................109
Figure 2: Distribution of Baseline Uropathogens* ...................................................................110
Figure 3: Maximum Severity of Solicited Adverse Events by Symptom - Safety Population .................................................................................................................111
Figure 4: Maximum Severity of Solicited Adverse Events by Symptom - Fosfomycin Safety Population ......................................................................................................111
Figure 5: Frequency of Related Adverse Events by MedDRA System Organ Class and Severity - Fosfomycin Safety Population .................................................................112
Figure 6: Incidence of Unsolicited Adverse Events by MedDRA System Organ Class and Severity - Fosfomycin Safety Population ..........................................................113

Statistical Analysis Plan - DMID Protocol: 15-0045 Version 1.0 16JUL2020
- 109 - PRIVILEGED AND CONFIDENTIAL COMMUNICATION
10.1 Disposition of Subjects
Figure 1: CONSORT Flow Diagram*
[Implementation note: This figure will be generated for the CSR and will be included in the paper manuscript as Figure 1.]
Strategy 1 (n=x) ♦ Received allocated intervention (n=x) ♦ Intervention adjusted per investigator (n=x) ♦ Did not receive allocated intervention (n=x)
[Reason 1] (x), [Reason 2] (x)
Discontinued Intervention (n=x) ♦ [Reason 1] (x), [Reason 2] (x) Early Termination (n=32) ♦ [Reason 1] (x), [Reason 2] (x)
Analysed for micro-ITT (n=x) ♦ Excluded from micro-ITT analyses (n=x)
[Reason 1] (x), [Reason 2] (x) Analyzed for ITT (n=x) ♦ Excluded from ITT analyses (n=x)
[Reason 1] (x) Analyzed for safety (n=x) ♦ Excluded from safety analyses (n=x)
[Reason 1] (x), [Reason 2] (x)
Assessed for Eligibility (n=x)
Excluded* (n=x) ♦ [Reason 1] (n=x) ♦ Concern of potential risk (n=x)
Randomized (n=x)
Allo
catio
n
Anal
ysis
Fo
llow
-Up
Enro
llmen
t
Strategy 2 (n=x) ♦ Received allocated intervention (n=x) ♦ Intervention adjusted per investigator (n=x) ♦ Did not receive allocated intervention (n=x)
[Reason 1] (x), [Reason 2] (x)
Discontinued Intervention (n=x) ♦ [Reason 1] (x), [Reason 2] (x) Early Termination (n=32) ♦ [Reason 1] (x), [Reason 2] (x)
Analysed for micro-ITT (n=x) ♦ Excluded from micro-ITT analyses (n=x)
[Reason 1] (x), [Reason 2] (x) Analyzed for ITT (n=x) ♦ Excluded from ITT analyses (n=x)
[Reason 1] (x) Analyzed for safety (n=x) ♦ Excluded from safety analyses (n=x)
[Reason 1] (x), [Reason 2] (x)

Statistical Analysis Plan - DMID Protocol: 15-0045 Version 1.0 16JUL2020
- 110 - PRIVILEGED AND CONFIDENTIAL COMMUNICATION
14.2.2 Microbiologic Response Figures
Figure 2: Distribution of Baseline Uropathogens*
[Implementation note: This figure will be included in the manuscript as Figure 2 and will provide a distribution of all detected pathogens regardless of treatment strategy. This is just a shell. Actual pathogens detected at baseline for this study will be used. Pathogens detected less than 5% will be combined into the others category. The grey scale will be used with darker shade representing higher percentages. The denominator will be total number of pathogens identified in positive cultures for subjects in mITT analysis population. The numerator will be the number of times a particular pathogen is identified in positive cultures.]

Statistical Analysis Plan - DMID Protocol: 15-0045 Version 1.0 16JUL2020
- 111 - PRIVILEGED AND CONFIDENTIAL COMMUNICATION
14.3.1.1 Solicited Adverse Events
Figure 3: Maximum Severity of Solicited Adverse Events by Symptom - Safety Population
[Implementation Note: This figure will present maximum severity of all solicited events across all doses separately by treatment group. A generic example is shown below. The actual figure will contain 2 panels for the two treatment groups. The x-axis will contain all solicited events relevant to the 15-0045 protocol.]
Figure with similar format:
Figure 4: Maximum Severity of Solicited Adverse Events by Symptom - Fosfomycin Safety Population

Statistical Analysis Plan - DMID Protocol: 15-0045 Version 1.0 16JUL2020
- 112 - PRIVILEGED AND CONFIDENTIAL COMMUNICATION
14.3.1.2 Unsolicited Adverse Events
Figure 5: Frequency of Related Adverse Events by MedDRA System Organ Class and Severity - Fosfomycin Safety Population
[Implementation Note: A generic figure is shown below. This figure includes only unsolicited events of grade 2 and above for subjects in the Fosomycin Safety population. A horizontal bar chart should be presented in 1 image file separate panels for each treatment group (2 columns (treatment groups)). Axes should be labeled as follows: y-axis label: System Organ Class, y-axis label: Number of Events. The treatment groups should be indicated in the panel headers including “(N=X)”, where N = the number of subjects in the in the Safety Population (Strategy 1or Strategy 2. The y-axis should present all SOCs reported by at least 1 subject and an “All Events” category. Y-axis should be sorted with “All Events first, then in decreasing order of total incidence.]

Statistical Analysis Plan - DMID Protocol: 15-0045 Version 1.0 16JUL2020
- 113 - PRIVILEGED AND CONFIDENTIAL COMMUNICATION
Figure 6: Incidence of Unsolicited Adverse Events by MedDRA System Organ Class and Severity - Fosfomycin Safety Population
[Implementation Note: A Generic figure is shown below. This figure includes only unsolicited events of grade 2 and above for subjects in the Fosomycin Safety population. A horizontal bar chart should be presented in 1 image file with separate panels for each treatment group (2 columns: Strategy 1 or Strategy 2). Axes should be labeled as follows: y-axis label: System Organ Class, x-axis label: Percentage of Subjects (%). The treatment groups should be indicated in the panel headers including “(N=X)”, where N = the number of subjects in the in the Safety Population. Subjects are counted at most once at the maximum severity across for any events in the applicable SOC. The y-axis should present all SOCs reported by at least 1 subject and an “All Events” category. Y-axis should be sorted with “All Events” first then in decreasing order of total incidence.]

Statistical Analysis Plan - DMID Protocol: 15-0045 Version 1.0 16JUL2020
- 114 - PRIVILEGED AND CONFIDENTIAL COMMUNICATION
APPENDIX 3. LISTINGS MOCK-UPS
LISTINGS
Listing 1: 16.2.1: Early Terminations or Discontinued Subjects ..............................................116
Listing 2: 16.2.2.1: Subject-Specific Protocol Deviations ........................................................117
Listing 3: 16.2.2.2: Non-Subject-Specific Protocol Deviations ................................................118
Listing 4: 16.2.3: Subjects Excluded from Analysis Populations .............................................119
Listing 5: 16.2.4.1: Demographics Data ...................................................................................120
Listing 6: 16.2.4.2: Pre-Existing and Concurrent Medical Conditions .....................................121
Listing 7: 16.2.5: Treatment Compliance .................................................................................122
Listing 8: 16.2.6: Individual Microbiological Response Data ..................................................123
Listing 9: 16.2.6: Listing of UTI Symptoms .............................................................................124
Listing 10: 16.2.7.1: Solicited Events .........................................................................................125
Listing 11: 16.2.7.3: Unsolicited Adverse Events .......................................................................126
Listing 12: 16.2.7 - Serious Adverse Events ...............................................................................127
Listing 13: 16.2.8.1: Baseline Clinical Laboratory Results – Chemistry....................................128
Listing 14: 16.2.8.2: Baseline Clinical Laboratory Results – Hematology ................................129
Listing 15: 16.2.8.3: Baseline Clinical Laboratory Results – Urinalysis ....................................130
Listing 16: 16.2.8.3: Baseline Clinical Laboratory Results – Liver Function Tests ...................130
Listing 17: 16.2.9.1: Vital Signs .................................................................................................131
Listing 18: 16.2.9.2: Physical Exam Findings ............................................................................132
Listing 19: 16.2.10: Concomitant Medications ...........................................................................133
Listing 20: 16.2.11.1: Pregnancy Reports – Maternal Information ............................................134
Listing 21: 16.2.11.2: Pregnancy Reports – Gravida and Para ...................................................134
Listing 22: 16.2.11.3: Pregnancy Reports – Live Birth Outcomes .............................................135
Listing 23: 16.2.11.4: Pregnancy Reports – Still Birth Outcomes ..............................................135
Listing 24: 16.2.11.5: Pregnancy Reports – Spontaneous, Elective, or Therapeutic Abortion Outcomes ...................................................................................................135

Statistical Analysis Plan - DMID Protocol: 15-0045 Version 1.0 16JUL2020
- 115 - PRIVILEGED AND CONFIDENTIAL COMMUNICATION
16.1.6 Listing of Subjects Receiving Investigational Product
Not included in SAP, but this is a placeholder for the CSR.

Statistical Analysis Plan - DMID Protocol: 15-0045 Version 1.0 16JUL2020
- 116 - PRIVILEGED AND CONFIDENTIAL COMMUNICATION
16.2 Database Listings by Subject
16.2.1 Discontinued Subjects
Listing 1: 16.2.1: Early Terminations or Discontinued Subjects
[Implementation Note: Category will be either “Early Termination” or “Treatment Discontinuation.” In the “Reason” column, concatenate any “specify” fields, including AE number and DV number.]
Treatment Group Subject ID Category Reason for Early Termination or Treatment Discontinuation Study Day

Statistical Analysis Plan - DMID Protocol: 15-0045 Version 1.0 16JUL2020
- 117 - PRIVILEGED AND CONFIDENTIAL COMMUNICATION
16.2.2 Protocol Deviations
Listing 2: 16.2.2.1: Subject-Specific Protocol Deviations
[Implementation Note: In the “Deviation” column, concatenate any and all “specify” fields (including visit number, etc.). If “Reason for Deviation” is “Other,” concatenate “specify” field, separate by a colon, e.g., “Other: Subject refusal”.]
Treatment Group Subject ID DV Number Deviation
Deviation Category Study Day
Reason for Deviation
Deviation Resulted in
AE?
Deviation Resulted in Subject
Termination?
Deviation Affected Product
Stability? Deviation Resolution Comments

Statistical Analysis Plan - DMID Protocol: 15-0045 Version 1.0 16JUL2020
- 118 - PRIVILEGED AND CONFIDENTIAL COMMUNICATION
Listing 3: 16.2.2.2: Non-Subject-Specific Protocol Deviations
[Implementation Note: In the “Deviation” column, concatenate any and all “specify” fields (including visit number, etc.). If “Reason for Deviation” is “Other,” concatenate “specify” field, separate by a colon, e.g., “Other: Subject refusal”.]
Site Start Date Deviation End Date Reason for Deviation
Deviation Resulted in Subject Termination?
Deviation Affected Product Stability?
Deviation Category Deviation Resolution Comments

Statistical Analysis Plan - DMID Protocol: 15-0045 Version 1.0 16JUL2020
- 119 - PRIVILEGED AND CONFIDENTIAL COMMUNICATION
16.2.3 Subjects Excluded from the Efficacy Analysis
Listing 4: 16.2.3: Subjects Excluded from Analysis Populations
[Implementation Note: This data in this listing should be congruent with the “Analysis Populations by Treatment Group” table. The reasons included here should match the SAP text that describes who will be excluded from analyses.]
Treatment Group Subject ID Analyses in which
Subject is Included Analyses from which Subject is Excluded Results Available? Reason Subject Excluded
[e.g., Safety, micro-ITT, CC] [e.g., Safety, micro-ITT, CC, Timepoint (EOT or TOC)]
Note: “Yes” in the “Results available” column indicates that available data were removed from the analysis. “No” indicates that no data were available for inclusion in the analysis.

Statistical Analysis Plan - DMID Protocol: 15-0045 Version 1.0 16JUL2020
- 120 - PRIVILEGED AND CONFIDENTIAL COMMUNICATION
16.2.4 Demographic Data
Listing 5: 16.2.4.1: Demographics Data
[Implementation Note: If a subject is multi-racial, in “Race” column, note “Multiple: (list races, separated by a comma).”]
Treatment Group Subject ID Sex Age at Enrollment (years) Ethnicity Race cUTI CrCl BMI

Statistical Analysis Plan - DMID Protocol: 15-0045 Version 1.0 16JUL2020
- 121 - PRIVILEGED AND CONFIDENTIAL COMMUNICATION
Listing 6: 16.2.4.2: Pre-Existing and Concurrent Medical Conditions
[Implementation Note: “Condition Start Day” and “Condition End Day” are relative to enrollment (which is Day 1, day before enrollment is Day -1). If ongoing, display “Ongoing” in the “Condition End Day” column.]
Treatment Group Subject ID MH Number Medical History Term Condition Start Day Condition End Day MedDRA System Organ Class MedDRA Preferred Term

Statistical Analysis Plan - DMID Protocol: 15-0045 Version 1.0 16JUL2020
- 122 - PRIVILEGED AND CONFIDENTIAL COMMUNICATION
16.2.5 Compliance and/or Drug Concentration Data (if available)
Listing 7: 16.2.5: Treatment Compliance
Treatment Group
Subject ID
Initial Treatment Received and Dose Amount
Investigator Directed Adjustment?
Yes or No Reason for Investigator
Directed Adjustment Treatment Received after
Adjustment and Dose Amount Total Number of Received Doses
Total Number of Missed Dosesa
a Total number of expected doses will vary by subject depending on whether the dose is applicable or not as recorded on the product administration form.

Statistical Analysis Plan - DMID Protocol: 15-0045 Version 1.0 16JUL2020
- 123 - PRIVILEGED AND CONFIDENTIAL COMMUNICATION
16.2.6 Individual Efficacy/Microbiological Response Data
Listing 8: 16.2.6: Individual Microbiological Response Data
[Implementation Note: Sort the listing by Treatment Group, Subject ID, Planned Visit, and Pathogen.]
Treatment Group Subject ID Planned Visit Actual Study Day Specimen Type Pathogen Density (CFU/mL)
Urine or Blood

Statistical Analysis Plan - DMID Protocol: 15-0045 Version 1.0 16JUL2020
- 124 - PRIVILEGED AND CONFIDENTIAL COMMUNICATION
Listing 9: 16.2.6: Listing of UTI Symptoms
[Implementation Note: Sort the listing by Treatment Group, Subject ID, and Planned Visit.]
Treatment Group Subject ID Planned Visit
Actual Study Day Fever Hypothermia
Rigors or Chills
Nuasea or Vomiting Dysuriaa
Flank Pain
Suprapubic or Pelvic
Pain Costovertebral
angle tenderness Suprapubic tenderness
Antibiotic Therapy
a Dysuria including urinary frequency or urinary urgency

Statistical Analysis Plan - DMID Protocol: 15-0045 Version 1.0 16JUL2020
- 125 - PRIVILEGED AND CONFIDENTIAL COMMUNICATION
16.2.7 Adverse Events
Listing 10: 16.2.7.1: Solicited Events
Treatment Group Subject ID
Study Day Insomnia Headache Dizziness Nausea Vomiting Constipation Diarrhea
Back Pain Rhinitis Pharyngitis
Allergic Reaction Candidiasis

Statistical Analysis Plan - DMID Protocol: 15-0045 Version 1.0 16JUL2020
- 126 - PRIVILEGED AND CONFIDENTIAL COMMUNICATION
Listing 11: 16.2.7.3: Unsolicited Adverse Events
[Implementation Note: For the SAE, AESI, or SUSAR column , report ‘No’ if the event is neither SAE, AESI, or SUSAR. Use individual type if the event meets one category (SAE). Combine the types by ‘and’ if the adverse event can be classified as more than one catory (SAE and AESI for example. Sort by Treatment Group, Subject ID, and AE Number.]
Adverse Event
MedDRA Sytem Organ
Class
MedDRA Preferred
Term SAE, AESI, or SUSAR Duration (days) Severity
Relationship to Study Treatment
If Not Related, Alternative
Etiology
Action Taken with Study Treatment
Subject Discontinued
Due to AE Outcome
Subject ID: , Treatment Group: , AE Number:
No SAE SAE and AESI
Comments:
Subject ID: , Treatment Group: , AE Number:
Comments:

Statistical Analysis Plan - DMID Protocol: 15-0045 Version 1.0 16JUL2020
- 127 - PRIVILEGED AND CONFIDENTIAL COMMUNICATION
Listing 12: 16.2.7 - Serious Adverse Events
[Implementation Note: Sort by Treatment Group, Subject ID, and AE Number.]
Adverse Event
Associated with Dose
No.
No. of Days Post Associated
Dose (Duration)
No. of Days Post Dose the
Event Became Serious
Reason Reported as an SAE Severity
Relationship to Study
Treatment
If Not Related,
Alternative Etiology
Action Taken
with Study Treatment
Subject Discontinued
Due to AE Outcome
Is the Event a
SUSAR?
MedDRA System Organ Class
MedDRA Preferred
Term
Subject ID: , Treatment Group: , AE Number:
Comments:
Subject ID: , Treatment Cohort: , AE Number:
Comments:

Statistical Analysis Plan - DMID Protocol: 15-0045 Version 1.0 16JUL2020
- 128 - PRIVILEGED AND CONFIDENTIAL COMMUNICATION
16.2.8 Individual Laboratory Measurements
Listing 13: 16.2.8.1: Baseline Clinical Laboratory Results – Chemistry
Treatment Group Subject ID
Planned Time Point
Actual Study Day Sex Age (years)
Laboratory Parameter (Units)
Result (Severity Grade)
Reference Range Low
Reference Range High

Statistical Analysis Plan - DMID Protocol: 15-0045 Version 1.0 16JUL2020
- 129 - PRIVILEGED AND CONFIDENTIAL COMMUNICATION
Listing 14: 16.2.8.2: Baseline Clinical Laboratory Results – Hematology
Treatment Group Subject ID
Planned Time Point
Actual Study Day Sex
Age (years)
Laboratory Parameter (Units)
Result (Severity Grade)
Reference Range Low
Reference Range High

Statistical Analysis Plan - DMID Protocol: 15-0045 Version 1.0 16JUL2020
- 130 - PRIVILEGED AND CONFIDENTIAL COMMUNICATION
Listing 15: 16.2.8.3: Baseline Clinical Laboratory Results – Urinalysis
Treatment Group Subject ID
Planned Time Point
Actual Study Day Sex
Age (years)
Laboratory Parameter (Units)
Result (Severity Grade)
Reference Range Low
Reference Range High
Listing 16: 16.2.8.3: Baseline Clinical Laboratory Results – Liver Function Tests
Treatment Group Subject ID
Planned Time Point
Actual Study Day Sex
Age (years)
Laboratory Parameter (Units)
Result (Severity Grade)
Reference Range Low
Reference Range High

Statistical Analysis Plan - DMID Protocol: 15-0045 Version 1.0 16JUL2020
- 131 - PRIVILEGED AND CONFIDENTIAL COMMUNICATION
16.2.9 Vital Signs and Physical Exam Findings
Listing 17: 16.2.9.1: Vital Signs
Treatment Group Subject ID Visit Number
Temperature (°F)
Systolic Blood Pressure (mmHg)
Diastolic Blood Pressure (mmHg)
Heart Rate (beats/min)
Respiratory Rate
(breaths/min) Height (cm) Weight (kg)
Statistical Analysis Plan - DMID Protocol: 15-0045 Version 1.0 16JUL2020
- 132 - PRIVILEGED AND CONFIDENTIAL COMMUNICATION
Listing 18: 16.2.9.2: Physical Exam Findings
Treatment Group Subject ID
Planned Time Point
Actual Study Day Body System Abnormal Finding
Reported as an unsolicited AE? (AE Description; Number)
Reported as a Solicited Event? (Solicited Event Description)

Statistical Analysis Plan - DMID Protocol: 15-0045 Version 1.0 16JUL2020
- 133 - PRIVILEGED AND CONFIDENTIAL COMMUNICATION
16.2.10 Concomitant Medications
Listing 19: 16.2.10: Concomitant Medications
[Implementation Note: Sort by Treatment Group, Subject ID, and CM Number.]
Treatment Group
Subject ID
CM Number Medication
ATC Level 1 (ATC Level 2)
Medication Start Day
Medication End Day Indication
Reported as an unsolicited AE?
(AE Description; Number)
Reported as a Solicited Event? (Solicited Event
Description)
Taken for a condition on Medical History?
(MH Description)

Statistical Analysis Plan - DMID Protocol: 15-0045 Version 1.0 16JUL2020
134 PRIVILEGED AND CONFIDENTIAL COMMUNICATION
16.2.11 Pregnancy Reports
Listing 20: 16.2.11.1: Pregnancy Reports – Maternal Information
Treatment Group Subject ID
Pregnancy Number
Study Day Corresponding
to Estimated Date of
Conception
Source of Maternal
Information Pregnancy
Status
Mother’s Pre-
Pregnancy BMI
Mother’s Weight
Gain During
Pregnancy
Tobacco, Alcohol, or Drug Use During
Pregnancy?
Medications During
Pregnancy?
Maternal Complications
During Pregnancy?
Maternal Complications During Labor,
Delivery, or Post-Partum?
Note: Maternal Complications are included in the Adverse Event listing. Medications taken during pregnancy are included in the Concomitant Medications Listing.
Listing 21: 16.2.11.2: Pregnancy Reports – Gravida and Para
Live Births
Treatment Group Subject ID Gravida
Extremely PBa
Very Early PBa
Early PBa
Late PBa
Early TBb
Full TBb
Late TBb
Post TBb
Still Births
Spontaneous Abortion/
Miscarriage Elective
Abortions Therapeutic Abortions
Major Congenital Anomaly
with Previous
Pregnancy?
Note: Gravida includes the current pregnancy, para events do not. a Preterm Birth b Term Birth

Statistical Analysis Plan - DMID Protocol: 15-0045 Version 1.0 16JUL2020
135 PRIVILEGED AND CONFIDENTIAL COMMUNICATION
Listing 22: 16.2.11.3: Pregnancy Reports – Live Birth Outcomes
Treatment Group Subject ID
Fetus Number
Pregnancy Outcome (for this Fetus)
Fetal Distress During
Labor and Delivery?
Delivery Method
Gestational Age at Live
Birth
Size for Gestational
Age
Apgar Score, 1 minute
Apgar Score, 5 minutes Cord pH
Congenital Anomalies?
Illnesses/ Hospitalizations
within 1 Month of Birth?
Note: Congenital Anomalies are included in the Adverse Event listing.
Listing 23: 16.2.11.4: Pregnancy Reports – Still Birth Outcomes
Treatment Group
Subject ID
Fetus Number
Pregnancy Outcome (for
this Fetus)
Fetal Distress During
Labor and Delivery?
Delivery Method
Gestational Age at Still
Birth
Size for Gestational
Age Cord pH Congenital Anomalies?
Autopsy Performed?
If Autopsy, Etiology for Still Birth Identified?
Listing 24: 16.2.11.5: Pregnancy Reports – Spontaneous, Elective, or Therapeutic Abortion Outcomes
Treatment Group Subject ID Fetus Number
Pregnancy Outcome (for this Fetus)
Gestational Age at Termination
Abnormality in Product of Conception?
Reason for Therapeutic Abortion