closed-loop exhaust gas scrubber onboard a merchant … · technical, economical, environmental and...
TRANSCRIPT
Technical, Economical, Environmental and Operational Viewpoints
Closed-loop Exhaust Gas Scrubber Onboard a Merchant Ship
JARI M. LAHTINEN
ACTA WASAENSIA 342
ENERGY TECHNOLOGY 1

Reviewers Professor Erik Fridell IVL Swedish Environmental Research Institute Box 530 21 400 14 Göteborg Sverige Doctor Jorma Kämäräinen Finnish Transport Safety Agency P.O.Box 320 FI-00101 Helsinki Finland

III
Julkaisija Julkaisupäivämäärä Vaasan yliopisto Helmikuu 2016 Tekijä(t) Julkaisun tyyppi Jari M. Lahtinen Monografia
Julkaisusarjan nimi, osan numero Acta Wasaensia, 342
Yhteystiedot ISBN Vaasan yliopisto Teknillinen tiedekunta Energiatekniikka PL 700 FI-65101 VAASA
978-952-476-658-6 (painettu) 978-952-476-659-3 (verkkojulkaisu) ISSN 0355-2667 (Acta Wasaensia 342, painettu) 2323-9123 (Acta Wasaensia 342, verkkojulkaisu) 2343-3094 (Acta Wasaensia. Energiatekniikka 1, painettu) 2343-3108 (Acta Wasaensia, Energiatekniikka 1, verkkojulkaisu) Sivumäärä Kieli 161 englanti
Julkaisun nimike Suljetun kierron makeavesipesuri kauppa-aluksessa – teknisten, taloudellisten, operatiivisten sekä ympäristökuormituksiin liittyvien näkökohtien tarkastelu Tiivistelmä Väitöskirjan tavoitteena oli tutkia laivaan asennettua suljetun kierron makeavesipakokaasupesuria ja sen kykyä täyttää merenkulun rikkisäädökset. Tarkastelunäkökulma oli tekninen ja taloudellinen; lisäksi tarkasteltiin ympäristökuormitusta sekä yleisiä näkökohtia. Tulokset perustuivat säiliöalus Suulalla sekä konttialus Containership VII:llä tehtyihin mittauksiin. Pakokaasupesurien rikinpoistokyky oli erinomainen ja myös pesuvesien laatu täytti määräykset. Veden sameusrajavaatimus osoittautui haasteelliseksi. Makean veden kulutus ja jäteveden tuotto pesurissa olivat vähäisiä. Jos raskas rikkipitoinen polttoöljy luokitellaan jätteeksi ja öljynjalostamon saastepäästöt kohdistetaan pitkälle jalostettuihin tuotteisiin, pesurilaiva on ympäristöystävällisempi rikkidioksidi-, typpioksidi- ja hiilidioksidipäästöjen osalta kuin rikitöntä kevyttä polttoöljyä käyttävä alus. Taloudellisesti tarkastellen pakokaasupesurin käyttö on kannattavaa keskisuurissa ja suurissa aluksissa. Rikkiä sisältävien ja rikittömien polttoaineiden hinnoilla, ja erityisesti hintaerolla, on suuri merkitys investointien kannattavuuteen. Pakokaasupesurin jälkiasennus on haasteellista ja tulee kyseeseen lähinnä suuremmissa aluksissa, joilla on riittävästi käyttövuosia jäljellä. Jatkotutkimuksia suositellaan pesuvesien prosessoinnin ja varastoinnin osalta siten, että pakokaasupesurit olisivat nollapäästöisiä vesistöön kaikissa käyttöolosuhteissa ja kaikilla kuljetusreiteillä. Asiasanat Pakokaasu, pesuri, laiva, päästöt, investointi

V
Publisher Date of publication Vaasan yliopisto February 2016 Author(s) Type of publication Jari M. Lahtinen Monograph
Name and number of series Acta Wasaensia, 342
Contact information ISBN University of Vaasa Faculty of Technology Energy Technology P.O. Box 700 FI-65101 Vaasa Finland
978-952-476-658-6 (print) 978-952-476-659-3 (online) ISSN 0355-2667 (Acta Wasaensia 342, print) 2323-9123 (Acta Wasaensia 342, online) 2343-3094 (Acta Wasaensia. Energy Technology 1, print) 2343-3108 (Acta Wasaensia. Energy Technology 1, online) Number of pages Language 161 English
Title of publication Closed-loop Exhaust Gas Scrubber Onboard a Merchant Ship - Technical, Economical, Environmental and Operational Viewpoints Abstract The objective of this thesis project was to study the properties of a closed-loop fresh water exhaust gas scrubber as an option for meeting the requirements of global marine traffic fuel sulphur legislation. The viewpoint was technical, environmental and economic. The execution and results of the project were based on tests conducted onboard MT Suula and MV Containerships VII. The Suula scrubber was the first certified marine unit in the world. The results showed that sulphur removal from exhaust gas was excellent. The effluent parameter limits set by the legislation were also complied with, the most challenging one being effluent turbidity. Both fresh water flow into the scrubber and effluent flow out of the scrubber were low. A zero effluent ship can be developed as the tank capacities required for fuel and high density effluent are roughly the same. From an environmentally perspective, a scrubber ship is slightly better than a gas oil ship when sulphur dioxide, nitrogen oxides and carbon dioxide emissions are considered, assuming that heavy fuel oil is classified as waste and refinery emissions are added to gas oil ship emissions. Economically speaking, then, a scrubber is a better option than the use of gas oil in medium size and large vessels. Fuel prices, and especially fuel price differences, have a strong influence on the cost-effectiveness of a scrubber investment. Scrubber retrofitting on existing ships is more challenging; such an investment should be considered for large ships with several operational years left. Further research is recommended on bleed-off water processes and water recycling in ship systems aiming at zero-effluent operation in all ship operating conditions. Keywords Exhaust gas, scrubber, ship, emissions, investment


VII Preface
Sulphur dioxide is harmful for human life as well as for the environment and the built infrastructure. International maritime legislation is shifting towards lower levels of permitted exhaust gas sulphur oxide emissions from ships. These regula-tions allow compliance by using expensive fuels with less sulphur, or by cleaning exhaust gases, thus enabling ships to use cheaper traditional marine fuels. Exhaust gas scrubbing is one technology capable of removing sulphur from exhaust gas. The present study is an effort to analyse closed loop fresh water scrubber proper-ties.
I wish to acknowledge and thank my supervisor, Professor Seppo Niemi of the Faculty of Technology, Electrical Engineering and Energy Technology at the University of Vaasa, for the sympathy, encouragement and supervision originat-ing from deep technical and scientific understanding.
Wärtsilä Ltd has enabled this thesis work; great thanks to Mr Juha Kytölä for al-lowing me to publish these research results. The person invaluable for the study is Mr Torbjörn Henriksson of Wärtsilä Ltd. His expertise in scrubber legislation and comprehensive understanding of what happens inside ship engine room is unique. Furthermore, I want to thank the other Wärtsilä personnel for all the help they provided: Mr. Henri Chydenius, Mr Petri Fabritius, Mr Antti Ivaska, Mr Teemu Jutila, Mr Mats Knipström, Mr Jussi Kreula, Mr Marko Lehikoinen, Mr Leevi Mäenpää, Ms Kaisa Nikulainen, and Mr Jyrki Ristimäki.
Further I am grateful for the funding from Wärtsilä which, together with the flex-ibility of my employee Turku University of Applied Sciences, enabled my partic-ipation in the scrubber development projects. Also special thanks to the founda-tion Merenkulun Säätiö for supporting the writing work.
Finally, I want to thank all the important people around me for support and pa-tience, in particular my charming wife Kirsi, dear children Martta and Tuomas, all other relatives, colleagues and friends.


IX Table of contents
1 INTRODUCTION ........................................................................................... 1 1.1 Background ........................................................................................... 1 1.2 Objective and outline of the study ........................................................ 1 1.3 Restrictions of the study ....................................................................... 3 1.4 Methodology ......................................................................................... 4
2 WET MARINE EXHAUST GAS CLOSED-LOOP SCRUBBER ................. 5 2.1 Marine fuels .......................................................................................... 5 2.2 Exhaust gas ........................................................................................... 7 2.3 Scrubber configurations ........................................................................ 9 2.4 Operational principle .......................................................................... 11 2.5 Scrubber exhaust gas piping arrangements ......................................... 13 2.6 Scrubber installation ........................................................................... 15
2.6.1 Scrubber loads .................................................................... 16 2.6.2 Weight and space ............................................................... 17 2.6.3 Scrubber system tanks and interfaces to ship systems ....... 18 2.6.4 General operational requirements ...................................... 19 2.6.5 Retrofit installations ........................................................... 21
3 EXPERIMENTAL SCRUBBER INSTALLATION ..................................... 22 3.1 Scrubbers onboard MT Suula ............................................................. 22 3.2 Scope of tests ...................................................................................... 26 3.3 Test results .......................................................................................... 28
3.3.1 Certification tests ............................................................... 28 3.3.2 Sulphur removal ................................................................. 32 3.3.3 Sludge and effluent ............................................................ 37 3.3.4 Chemical consumption ....................................................... 42 3.3.5 Water consumption ............................................................ 43 3.3.6 Electricity consumption ..................................................... 44 3.3.7 Other observations ............................................................. 47
3.4 Conclusions ......................................................................................... 49
4 COMMERCIAL SCRUBBER INSTALLATION ......................................... 51 4.1 MV Containerships VII scrubber introduction ................................... 51
4.1.1 System description ............................................................. 51 4.1.2 General arrangement .......................................................... 53
4.2 Scope of tests ...................................................................................... 54 4.3 Test results .......................................................................................... 55
4.3.1 Sulphur removal ................................................................. 55 4.3.2 Alkali consumption ............................................................ 58 4.3.3 Fresh water consumption ................................................... 60 4.3.4 Bleed-off ............................................................................ 63 4.3.5 Effluent .............................................................................. 64 4.3.6 Energy consumption .......................................................... 65 4.3.7 Weight and space ............................................................... 67

X
4.4 Conclusions ......................................................................................... 68
5 COMPARISON OF EMISSIONS AND DISCHARGES OF SOX REDUCTION ALTERNATIVES .................................................................. 70 5.1 Ship emissions ..................................................................................... 71
5.1.1 Exhaust gas ......................................................................... 71 5.1.2 Effluent ............................................................................... 76 5.1.3 Energy consumption ........................................................... 81
5.2 Emissions from oil refineries and alkali production............................ 82 5.2.1 Refinery process ................................................................. 82 5.2.2 Emissions to atmosphere .................................................... 84 5.2.3 Effluents to sea ................................................................... 85 5.2.4 Energy consumption ........................................................... 86 5.2.5 Alkali production energy .................................................... 87
5.3 Scrubber environmental analysis ......................................................... 88 5.4 Conclusions ......................................................................................... 90
6 ECONOMIC ANALYSIS .............................................................................. 93 6.1 Marine fuel price development and scrubber market potential ........... 93 6.2 Scrubber investment calculations ........................................................ 95
6.2.1 Newbuilding ships .............................................................. 97 6.2.2 Retrofit installations ........................................................... 98
6.3 Scrubber cost calculations ................................................................... 99 6.3.1 Calculation principle........................................................... 99 6.3.2 Calculation parameters and functions ............................... 102
6.4 Scrubber cost analysis ....................................................................... 109 6.5 Conclusions ....................................................................................... 115
7 DISCUSSION, CONCLUDING REMARKS AND RECOMMENDATIONS .............................................................................. 117 7.1 Scrubber performance ....................................................................... 117 7.2 Operational issues .............................................................................. 117 7.3 Scrubber investment .......................................................................... 118
7.3.1 Scrubber installation ......................................................... 118 7.3.2 Legislation development and enforcement ....................... 120 7.3.3 Low-sulphur fuel price and availability............................ 121 7.3.4 Investment risks ................................................................ 125
7.4 Shipping company options and scrubber market............................... 126 7.5 Concluding Remarks ......................................................................... 130 7.6 Recommendations ............................................................................. 132
8 SUMMARY .................................................................................................. 134
REFERENCES ................................................................................................... 136

XI Figures
Figure 2-1. Global sulphur content in marine residual fuels based on Wahl (2013). ................................................................................. 6
Figure 2-2. Categorization of marine scrubbers based on operational principle. ..................................................................................... 10
Figure 2-3. Mole fraction of sulphur (IV) species in equilibrium at 25°C as a function of aqueous solution pH (Vainio et al. 2012) ........................................................................................... 13
Figure 2-4. Typical mainstream scrubber exhaust gas piping arrangement (Wärtsilä). .............................................................. 14
Figure 2-5. Typical integrated scrubber exhaust gas piping arrangement (Wärtsilä). ................................................................................... 15
Figure 2-6. Ship main axes and terms for ship hull movements in three dimensions. ................................................................................. 17
Figure 3-1. Exhaust gas scrubber system installed on board MT Suula. The units are located in front of the blue funnel (Kai Saarinen). .................................................................................... 22
Figure 3-2. Scrubber unit operational principle (Wärtsilä). ........................... 23 Figure 3-3. Operational principle of Venturi unit (Wärtsilä). ........................ 24 Figure 3-4. Operational principle of combination unit (Wärtsilä). ................ 25 Figure 3-5. Arrangement of exhaust gas certification measurements on
board MT Suula (Tikka et Lipponen). ........................................ 31 Figure 3-6. Accuracy of local ship engine hot exhaust gas monitoring
equipment. ................................................................................... 33 Figure 3-7. Scrubber sulphur removal measurements classified
according to test result. ............................................................... 34 Figure 3-8. Effect of scrubbing water pumping speed on sulphur
reduction in exhaust gas scrubber. .............................................. 35 Figure 3-9. Influence of washwater pH on sulphur reduction in exhaust
gas scrubber. ............................................................................... 36 Figure 3-10. Influence of fuel sulphur content on sulphur reduction in
exhaust gas scrubber. .................................................................. 36 Figure 3-11. Effluent quality during bleed-off treatment unit sludge
production test. ............................................................................ 39 Figure 3-12. Alkali consumption in the scrubber. ........................................... 43 Figure 3-13. Nominal fresh water feed to scrubber as a function of
exhaust gas outlet temperature. ................................................... 44 Figure 3-14. Pressure and power curves of scrubbing water centrifugal
pumps type Munch NP 65-40-200. ............................................. 46 Figure 3-15. Plume of MT Suula in summer (left) and in late autumn
night conditions (Wärtsilä). ........................................................ 48 Figure 3-16. MT Suula scrubber noise comparison with the original
silencer (Wärtsilä). ...................................................................... 48 Figure 3-17. MT “Suula” scrubber dynamic test (Wärtsilä). ........................... 49 Figure 4-1. Container vessel Containerships VII equipped with an
exhaust gas scrubber. .................................................................. 51

XII
Figure 4-2. General operational principle of closed-loop scrubber system (Wärtsilä). ....................................................................... 52
Figure 4-3. Main components of Containerships VII scrubber system (Wärtsilä). ................................................................................... 53
Figure 4-4. Scrubber sulphur removal performance during scrubber certification tests as a function of engine power (fuel sulphur content 2.83% m/m). ..................................................... 57
Figure 4-5. Atmospheric emissions of Containerships VII scrubber between Södertälje and Riga. ..................................................... 58
Figure 4-6. Containerships VII scrubber alkali consumption as measured during certification tests. ............................................ 59
Figure 4-7. Containerships VII scrubber alkali consumption on the Södertälje – Riga route. .............................................................. 60
Figure 4-8. Containerships VII scrubber water balance (water content in outflowing exhaust gas minus water content in entering exhaust gas). ............................................................................... 61
Figure 4-9. Containerships VII scrubber make-up water consumption and bleed-off flow when sailing from Södertälje to Riga. ......... 62
Figure 4-10. Containerships VII scrubber bleed-off flow during Marpol tests. ............................................................................................ 63
Figure 4-11. Containerships VII scrubber effluent quality during high-sulphur fuel Marpol tests. ........................................................... 65
Figure 4-12. MV Containerships VII electricity consumption during sporadic measurements on 77% main engine load. .................... 66
Figure 5-1. Flow of substances in scrubbing processes. ................................ 71 Figure 5-2. Typical volume-based main component composition of
diesel engine exhaust gas (CIMAC). .......................................... 72 Figure 5-3. Typical volume-based minor component composition of
diesel engine exhaust gas (CIMAC). .......................................... 73 Figure 5-4. Pre-and post-scrubber oxygen and carbon dioxide content
in exhaust gas onboard MT Suula (Tikka et Lipponen, 2009, Juuti et Lipponen, 2010). .................................................. 74
Figure 5-5. Nitrogen oxide and sulphur dioxide content in exhaust gas before and after the MT Suula scrubber (Tikka et Lipponen, 2009, Juuti et Lipponen, 2010). ................................ 74
Figure 5-6. Theoretical maximum sodium sulphate solubility in water at 20 °C (Mettler Toledo, 2015) and relation between required fuel tank and sodium sulphate solution tank volumes. ..................................................................................... 81
Figure 5-7. Refining process at Neste Oil Porvoo refinery (Suominen, 2012). .......................................................................................... 83
Figure 5-8. Comparison principle for emissions from ships burning marine gas oil or heavy fuel oil. ................................................. 89
Figure 6-1. Light and heavy fuel oil prices in US dollars per ton (Finnish Petroleum and Biofuels Association, 2015). ................ 94
Figure 6-2. Estimated total fuel consumption (million tonnes) by shipping 2007 (IMO, 2009b). ..................................................... 95

XIII Figure 6-3. Numbers of ships of over 100 gross tonnage (IMO, 2009b). ...... 95 Figure 6-4. Scrubber maximum investment cost compared to annual
operating savings as a function of internal rate of interest. ........ 98 Figure 6-5. Scrubber maximum investment cost in relation to annual
operating savings as a function of internal rate of interest and ship’s remaining operational life (retrofit installations). ..... 99
Figure 6-6. Exhaust gas scrubber installation savings and expenses. .......... 101 Figure 6-7. Main engine exhaust gas scrubber installation savings and
expenses; fuel prices HFO 360 €/ton and MGO 600 €/ton. ...... 110 Figure 6-8. Main engine exhaust gas scrubber installation savings and
expenses; fuel prices MGO 600 €/ton, HFO 440 €/ton. ........... 111 Figure 6-9. Operational cost structure of main engine exhaust gas
scrubber (MGO 600 €/ton, HFO 360 €/ton). ............................ 111 Figure 6-10. Maximum relative investment cost of a main engine
exhaust gas scrubber per MW based on fuel prices of 600 €/ton for MGO and 360 €/ton for HFO. An acceptable payback time is assumed to be seven years. ............................. 112
Figure 6-11. Maximum investment cost for main engine exhaust gas scrubber in retrofit projects based on fuel prices of MGO 600 €/ton and HFO 360 €/ton and three years of payback time. .......................................................................................... 114
Figure 6-12. Maximum investment cost of main engine exhaust gas scrubber per engine power based on fuel prices of MGO 600 €/ton and HFO 360 €/ton and three years of payback time in retrofit projects. ............................................................ 115
Figure 7-1. Global oil consumption trends by product group (British Petroleum) ................................................................................. 123
Figure 7-2. Projection of global distillate supply and demand (American Bureau of Shipping) ................................................ 124
Tables
Table 2-1. Fuel oil properties. ......................................................................... 7 Table 2-2. Typical two-stroke diesel engine exhaust gas emissions
(Woodyard, 2009: 62). .................................................................. 8 Table 2-3. Typical marine four-stroke engine exhaust gas composition:
engine load follows propeller curve, 75% load, 2.2% m/m sulphur in fuel (Jürgens, 2012: 10). .............................................. 9
Table 2-4. Closed-loop scrubber tanks and fluid flows. ............................... 19 Table 3-1. Scope of MT Suula scrubber unit tests. ....................................... 27 Table 3-2. Equipment and methods used in MT Suula certification
tests (Tikka et Lipponen). ........................................................... 29 Table 3-3. Engine loads, scrubber loads and exhaust gas flows during
certification tests (Wärtsilä, 2010). ............................................. 29 Table 3-4. High sulphur test fuel analysis (Tikka et Lipponen). .................. 30

XIV
Table 3-5. Effluent chemical analysis during the certification test, high sulphur (3.4% m/m) fuel (Tikka et Lipponen). .......................... 38
Table 3-6. IMO (2009a) washwater criteria and measured effluent parameters of closed-loop scrubber tests onboard MT Suula. .......................................................................................... 41
Table 4-1. Specification of exhaust gas emission measurements during certification tests (Pöyry, 2013). ................................................ 55
Table 4-2. Specification of high-sulphur test fuel. ....................................... 56 Table 4-3. Alkali (100%) consumption compared with fuel
consumption. .............................................................................. 59 Table 4-4. Scrubber installation induced changes in weight and centres
of gravity in percentages compared with original ship (light weight). ....................................................................................... 68
Table 5-1. Measured exhaust gas carbon dioxide reduction in Suula (Tikka et Lipponen, 2009) and Containerships VII (Pöyry, 2013). .......................................................................................... 75
Table 5-2. Measured effluent parameters of hybrid scrubber on board MV Ficaria Seaways (Kjölholt et al., 2012). Fuel sulphur content 1.0-2.2% m/m. ............................................................... 77
Table 5-3. Wash water parameters of inlet water, water after scrubber and water after effluent treatment unit measured from closed-loop scrubber on board MT Suula. ................................. 78
Table 5-4. Maximum allowed pollutant concentrations for non-inland surface waters compared to measured discharge concentrations from MT Suula and MV Ficaria Seaways.......... 79
Table 5-5. Maximum allowed effluent metal content by local authorities (Wärtsilä). ................................................................. 80
Table 5-6. Neste Oil refinery emissions to atmosphere in relation to total production in 2009, 2010 and 2011 (Neste Oil, 2012). ...... 85
Table 5-7. Quality of Neste Oil refinery effluent to sea in relation to production. .................................................................................. 86
Table 5-8. Neste Oil refinery energy consumption in relation to production in 2009, 2010 and 2011 (Neste Oil, 2012) ............... 87
Table 5-9. Emissions to atmosphere from gas oil ship and from a vessel burning heavy fuel oil with a closed-loop scrubber......... 90
Table 6-1. Terms, equations and assumptions used in the scrubber saving calculations.................................................................... 103
Table 6-2. Ship categories, sizes, main engine specific fuel consumptions, average main engine powers and number of days spent at sea (IMO, 2009b). ............................................... 106
Table 6-3. Ship categories, sizes, maximum payload, ship light weight and the weight of consumables on board. ................................ 108
Table 6-4. Scrubber retrofitting cost (Klimt-Möllenbach et al., 2012). ..... 113 Table 7-1. Scrubber risks (Rajeevan, 2012: 13 and Det Norske Veritas,
2012). ........................................................................................ 126 Table 7-2. Alternative strategies for shipping companies. ......................... 127

XV Abbreviations
AWP Advanced Water Purification AWT Advanced Wastewater Treatment BTEX Benzene Toluene Ethylbenzene Xylene CARB California Air Resources Board CEMS Continuous Emission Monitoring System ECSA European Community Shipowners’ Association EPA Environmental Protection Agency EPCM Engineering, Procurement, Construction Management EU European Union GHG Greenhouse Gas GRP Glass Reinforced Plastic HFO Heavy Fuel Oil IFO Intermediate Fuel Oil IMO International Maritime Organisation LNG Liquefied Natural Gas MARPOL International Convention for the Prevention of Pollution
from Ships MBTE Methyl Tert-butyl Ether MGO Marine Gas Oil MEPC Marine Environmental Protection Committee MT Motor Tanker NPV Net Present Value NOx Nitrogen Oxides PAH Polycyclic Aromatic Hydrocarbons PAHphe Polycyclic Aromatic Hydrocarbons, phenanthrene equiva-
lence PEMS Portable Emissions Monitoring System SCR Selective Catalytic Reduction SOx-ECA Sulphur Oxides Emission Control Area SOx Sulphur Oxides USEPA United States Environmental Protection Agency
List of symbols
A Scrubber savings a Increased relative power B Scrubber additional expenses Cadm Constant d Direct scrubber costs d3 Sludge cost d4 Alkali cost d5 Service cost (aq) Water solution

XVI
CO Carbon monoxide CO2 Carbon dioxide e Low sulphur fuel oil price e1 Heavy fuel oil price e3 Sludge treatment cost e4 Alkali consumption e5 Main engine energy production e7 Time at sea e8 HFO process and heating power F Fuel cost saving G Marine gas oil cost g Cargo capacity reduction factor (g) Gas solution H Hydrogen Heavy fuel oil cost Investment cost HSO3
Bisulfite H2O Water i Indirect costs
Rate of interest i1 Resistance cost i2 Heavy fuel heating cost i3 Heavy fuel separation loss k Continuous net income l Lost income (l) Liquid M Gas oil cooling energy cost (electricity) MEPC Marine Environment Protection Committee m Mass Fuel cost factor (Chapter 6) n Load factor Na Natrium NaHSO3 Sodium bisulphite NaOH Sodium hydroxide Na2SO3 Sodium sulphite Na2SO4 Sodium sulphate O2 Oxygen OH Hydroxide P Main engine nominal power S Scrubber ship additional energy consumption SO2 Sulphur dioxide SO3 Sulphur trioxide, sulphite SO4 Sulphate r Marine gas oil average specific consumption r1 Heavy fuel oil average specific consumption r2 Fresh water consumption r3 Sludge production

XVII
r4 Alkali price r5 Maintenance costs r6 Labour costs r7 Main engine extra maintenance due to HFO use (s) Solid T Time Vs Ship speed v Volume W Ship loaded weight w Scrubber weight in operation w1 Scrubber light weight w2 Fresh water weight w3 Alkali weight w4 Ship max. payload w5 Ship light weight w6 Weight of consumables ∇ Ship hull volumetric displacement ρ Rate of interest
List of units
FNU Formazin Nephelometric Unit g Gram h Hour Hz Hertz J Joule l Litre m Meter Nm3 Normal cubic meter pH Negative logarithm of the activity of the hydrogen ion in an aqueous solution ppm Parts per million rpm Rounds per minute W Watt % Percent °C Degree Celsius


1 INTRODUCTION
1.1 Background
Sulphur dioxide (SO2) in exhaust gas is harmful for human life and for nature, agriculture and infrastructure (buildings). Therefore SO2 emissions to the atmos-phere are limited by regulation. There are also limitations for exhaust gasses orig-inating from ships.
The main ship exhaust gas emission legislation documents are: • IMO (International Maritime Organisation) Revised MARPOL (International
Convention for the Prevention of Pollution from Ships) Annex VI, Regulation 14 (IMO, 2008b)
• IMO Resolution MEPC.259(68), 2015 Guidelines for Exhaust Gas Cleaning Systems (IMO, 2015a)
• European Union Directive 2012/33/EC (EU, 2012)
These regulations mandate that the fuel sulphur limit inside Emission Control Areas for SOx Emissions is 0.10% m/m sulphur in fuel. SOx-ECA waters cover e.g. the Baltic Sea, the North Sea, North American Coasts and the US Caribbean area. Globally, the limit will be 0.50% m/m either starting from 1 January, 2020, or 1 January, 2025, depending on low sulphur fuel availability. The final date will be decided by 2018 based on fuel availability review.
Sulphur legislation is goal oriented and it allows the use of alternative methods to reach the emissions targets. One alternative for low sulphur fuels is sulphur re-moval from exhaust gas. This option known as exhaust gas scrubbing is specified in Marpol Annex VI, Regulation 4. The main motivation for installing exhaust gas cleaning systems on board is economical; abatement technology allows the ship operator to burn cheap high-sulphur fuel in ship combustion units.
1.2 Objective and outline of the study
The objective of this research was to find arguments for and against marine ex-haust gas scrubbing and to analyse scrubber applicability on board. The scrubber type in this thesis has certain limitations: the washwater circulation is a closed loop, only fresh water is used as washwater, alkali is added to the washwater to neutralise acidity, water is sprayed onto a packed bed inside the scrubber, wash-water meets the exhaust gas as a counter-flow, and exhaust gas enters the scrub-

2 Acta Wasaensia
ber through the side and exits through the top of the scrubber. Also the scrubber arrangement on board has limitations in this study: the exhaust gas source is a single main engine of a merchant ship and the vessel is expected to be operational in 2020 when the global sulphur limit is expected to have entered into force.
The objective was to find answers to the following questions: 1 Is exhaust gas scrubbing economically and environmentally a better solution
for preventing sulphur emissions into the atmosphere than the use of distilled fuels?
2 Which are the boundary conditions and drivers for the ship owner for having a scrubber system installed?
3 How challenging are the technical details when scrubber technology is inte-grated with a merchant vessel?
4 Which are the most suitable ship types for scrubbers? 5 What kind of practical experience based on the two built installations was
found? 6 Are there environmental aspects which support exhaust gas scrubbing? 7 Are there other drivers - excluding the economical, technological or environ-
mental ones - affecting the popularity of scrubber installation?
The high-level or final target of this study was to determine rough criteria for in-vesting in a scrubber. With most of the results in numerical form, the analysis of different alternatives are facilitated. The selection criteria are often matters of judgement dependent on personal opinions. For example, speculations concerning future fuel prices and emissions legislation are central factors affecting ship own-ers’ readiness to invest in a scrubber installation.
In Chapter 2 of this thesis, ship exhaust gas, marine fuels and scrubber operation-al principles are discussed. Chapter 3 deals with the wet scrubber installation on product tanker Suula. The experimental scrubber system was connected to one auxiliary engine and the results of these tests are analysed in Chapter 3. The Suula scrubber installation was a temporary one and it was removed from the ship after the tests. However, it was the first certified marine scrubber in the world. Con-tainer vessel Containerships VII has a commercial closed-loop scrubber system which is described in Chapter 4. Environmental aspects of scrubbers are discussed in Chapter 5 while Chapter 6 deals with economic issues. Chapter 7 comprises the concluding discussion with recommendations and Chapter 8 summarizes the the-sis.

Acta Wasaensia 3 1.3 Restrictions of the study
Ship low-sulphur fuels and sulphur removal technology have interfaces with sev-eral important issues which are not within the scope of this research. These topics and the reasons for excluding these topics are listed below: • Neither the effects of exhaust gas emissions on nature, human health and the
built infrastructure (buildings) nor the impact scrubber effluent has on sea life is analysed. The effects of these emissions have provided the background for current emissions regulations. However, the amounts of harmful substances entering the atmosphere and water from scrubbers are discussed.
• Geographical viewpoints are not discussed. This thesis is a ship based study assuming that the emissions depend only on the technology and fuel used onboard. The allowed maximum sulphur content in fuel is expected to be 0.10% m/m.
• Chemical processes inside the scrubber are excluded since the main focus of the study is on the scrubber installation on a ship, not the equipment develop-ment.
• Several types of fuels can be burnt in marine combustion units. Alternative sulphur-free fuels such as liquid biofuel, methanol, liquefied natural gas, etc., were not used in the tests and the effects of such fuels on scrubber perfor-mance are therefore excluded.
• Particle emissions from ships are a popular topic but particulates are not con-trolled by marine legislation – particulate limits does not exist - and were therefore not analysed in this research. The purpose of exhaust gas scrubbing is to remove sulphur oxides from exhaust gas, thereby also reducing particu-late content.
• Nitrogen oxides are also an important component in exhaust gas emissions. However, they have been analysed in other studies, for example in the doctor-al thesis of Magnusson (2014).
• Black carbon emissions have the same status as particulates; no rules or regu-lations for ships exist. However, in Alaskan waters, visible smoke emissions are not allowed.
• Scrubber legislation, the commissioning processes and scrubber certification are not discussed despite the importance of these issues for scrubber technol-ogy concept introduction.
• Finally, life cycle assessment of ship scrubber installations - containing mate-rials, production, utilization and final disposal - is not covered. The study set out to compare a scrubber ship with the same vessel on distillate fuel.

4 Acta Wasaensia
1.4 Methodology
In Chapter 2, general aspects of exhaust gas scrubbing are discussed, mainly at a general level and with the purpose of providing a background for more detailed data written in Chapters 3 and 4. In Chapter 3, the test results of product tanker Suula are analysed. In Chapter 4, a similar analysis of the scrubber installation onboard container vessel Containerships VII is provided. The author of this text sailed onboard Suula during the tests and also during a shorter period on Contain-erships VII. Empirical knowledge and understanding derived from practical test-ing is used to explain the phenomena behind the numerical results provided in the test reports.
Chapter 5 discusses the environmental analysis against a background of relevant literature, practical measurements and laboratory tests. In Chapter 6, the discus-sion of the economic aspect is based on calculations. However, previously meas-ured data are used as the parameter start values. Chapter 7 contains a discussion of aspects explained in all the previous chapters. However, it capitalizes on source material to support the conclusions. In the end, some recommendations are given for further measures in the context of marine scrubbing. Finally, Chapter 8 com-prises a summary of the thesis.
When the author worked as a partner in the scrubber development business, sev-eral special studies in the field of scrubber technology were produced as part of the development work. Scrubber manufacturer Wärtsilä Ltd has been active in producing new knowledge; several Bachelor’s and Master’s theses have been written for the company to support the development of exhaust gas scrubbing on ships. The author of this text has tutored some of the students: Kylänpää (2012), Lassila (2012) and Kirjonen (2013). The author has also been involved in work by the European Union within the Research and Innovation work group of the Sus-tainable Shipping Forum. All previously gained information was utilized in this attempt to construct a view of marine exhaust gas closed-loop scrubbing.

Acta Wasaensia 5 2 WET MARINE EXHAUST GAS CLOSED-LOOP
SCRUBBER
2.1 Marine fuels
At sea, exhaust gas scrubbers will mainly be installed on vessels consuming heavy fuel oil (HFO) which is a cheaper fuel than low-sulphur high-quality distil-late fuels. HFO ships are mainly large vessels equipped with powerful engines and boilers offering remarkable fuel cost saving potential. In principle, the main factors affecting fuel consumption are the vessel’s buoyancy and speed. When in harbour, the ship fuel consumption depends on the need of electricity onboard (auxiliary engine load) and on heating energy consumption (auxiliary boiler load). Consumption due to auxiliary power needs may be remarkable in some ship types such as cruise vessels while high heat consumption is typical in tank ships.
Marine fuel properties are specified in the standard ISO 8217 (2012). The distil-late fuel groups are DMX, DMA, DMZ and DMB. The main parameter which separates these fuels is viscosity. The first fuel type is the most fluid. None of the fuels are specified to have a sulphur content of less than 0.5%. Cooling is typical-ly needed when a diesel engine runs on DMA fuel to avoid poor lubrication in the fuel injection pumps caused by low fuel viscosity. However, new low-sulphur DMB-class distillate, tailored for shipping inside sulphur limit values, is nowa-days available (Neste Oil, 2014). This fuel has higher minimum viscosity, reduc-ing the need for fuel cooling. Also other comparable products are available.
The second category of marine fuels is residual fuels typically classified into the types RMA, RMB, RMD, RME, RMG and RMK. The two last fuel types have several viscosity classes. The sulphur content maximum in ships is the statutory limit 3.5% m/m. The ISO standard does not determine the minimum sulphur con-tent in fuel.
In practice, the two main classes of marine fuel oil are heavy fuel oil (HFO) and marine gas oil (MGO). In this study HFO includes a product named “intermediate fuel oil 380” with the product mark IFO380. The equivalent ISO class is RMG380. Abbreviation MGO refers to “low-sulphur marine gas oil” with the commercial name MGO and ISO class DMA 0.1%. The number in the abbrevia-tion is the maximum sulphur content (Kirjonen, 2013: 21). Heavy-duty ship en-gine distillate meets different requirements (e.g. higher viscosity and better lubric-ity) from those imposed on the traditional distillates used in high speed engines.

6 Acta Wasaensia
The global sulphur content of marine residual fuels is shown in Figure 2-1 (Wahl, 2013). The average sulphur content has ranged from 2.5 to 2.7% m/m, which is significantly higher than the future global maximum (0.50% m/m) and makes the fuel unsuitable for marine use without exhaust gas abatement technologies. In this research the fuel parameters provided in Table 2-1 were used in the calculations.
Figure 2-1. Global sulphur content in marine residual fuels based on Wahl (2013).
2,64 2,60 2,63 2,672,55
0
0,5
1
1,5
2
2,5
3
2008 2009 2010 2011 2012
Global sulphur content (%, mass) in marine residual fuels

Acta Wasaensia 7 Table 2-1. Fuel oil properties.
Parameter Unit Heavy fuel oil
Marine gas oil
Sulphur content in fuel % m/m 2.51A 0.10
Net specific energy MJ/kg 40.71B 42.93B
Carbon dioxide production tonCO2/ton 3.17C 3.17C
A IMO MEPC 65/4/9, sulphur monitoring programme for fuel oils for 2012 (IMO, 2015b)
B Range for residuals 39.6 – 42.1 and for distillates 42.2 – 43.1 (CIMAC, 2013) C Psaraftis et Kontovas, 2009
2.2 Exhaust gas
Ship exhaust gas is produced when fuel oil is burnt in diesel engines, gas turbines, auxiliary steam boilers, or thermal oil heaters. Typical compositions of diesel en-gine exhaust gas can be seen in Tables 2-2 and 2-3. If the exhaust gas contains sulphur oxides, the origin of these oxides is the sulphur in the fuel. The scrubbers studied in this thesis have been developed to remove these sulphur oxide emis-sions from the exhaust gas.
When the two tables are compared, it emerges that the exhaust gas volume is higher in the two-stroke engine as a result of higher air consumption per power (MWh). The ratio of the exhaust gas sulphur dioxide mass to the sulphur mass in the fuel is theoretically 2:1 which can be seen in Table 2-3. The sulphur oxide content in exhaust gas cannot be influenced by the combustion process and de-pends only on fuel quality (Tinschmann et al. 2010: 12).
Table 2-3 indicates the effect of sulphur on the particulate formation in exhaust gas. Roughly 60% of the particulate mass has sulphates which are sulphur-containing compounds. Kjölholt et al. (2012) refers to IMO resolution (MEPC 56/INF.5/Annex 1, 2007) and divides particles slightly differently into three dif-ferent categories: metals, sulphates, and carbons and other organic compounds. According to Lloyd’s Register (2012), particulate matter emissions depend on fuel sulphur content.

8 Acta Wasaensia
Table 2-2. Typical two-stroke diesel engine exhaust gas emissions (Wood-yard, 2009: 62).
Engine input Engine output
Air Fuel oil Lubrication oil Exhaust gas
Total mass (kg/MWh) 8 500 175 1 8676
%-vol kg/MWh kg/MWh %-vol
Nitrogen 21 75.8
Oxygen 79 13.0
Carbon dioxide 5.6
Water vapour 5.35
Hydrocarbons 170 0.970 0.018 Sulphur 5 0.005 Calcium 0.025 Nitrogen oxides 0.150
Sulphur oxides 0.060
Carbon monoxide 0.006
Particulate matter 120 mg/Nm3

Acta Wasaensia 9 Table 2-3. Typical marine four-stroke engine exhaust gas composition: engine
load follows propeller curve, 75% load, 2.2% m/m sulphur in fuel (Jürgens, 2012: 10).
Mass (kg/MWh) Exhaust gas
Gaseous emissions in exhaust gas
Particulate matter in exhaust gas
Total 6 712 Carbon dioxide 599
Gaseous emissions 20 ~20.3
Nitrogen 5029
Oxygen 799
Particulate matter 1 ~1.1 Water vapour 264
Carbon oxide 0.4
Hydrocarbon 0.1 Nitrogen oxide 15.4
Sulphur dioxide 4.4
Oxide ash (heavy metals) 0.02
Solid and organic compounds 0.47
Sulphate 0.35
Water combined with sulphate 0.28
2.3 Scrubber configurations
Exhaust gas scrubbing is well known technology onshore. However, marine in-stallations are quite rare compared to global number of vessels due to several rea-sons. The main driver for ship installations is the economy but the gradual tight-ening of the emissions regulation has not yet boosted the scrubber market alt-hough the tight (0.1% m/m) sulphur limits in emissions control areas have already entered into force. The principal differences between land-based and marine in-stallations are the more limited free space and weight onboard and the challenges of connecting the scrubber into a dynamic floating platform. Also the logistics of
10 Acta Wasaensia
fluids and other consumables needed in scrubbers must be solved in a practical way for the marine installations.
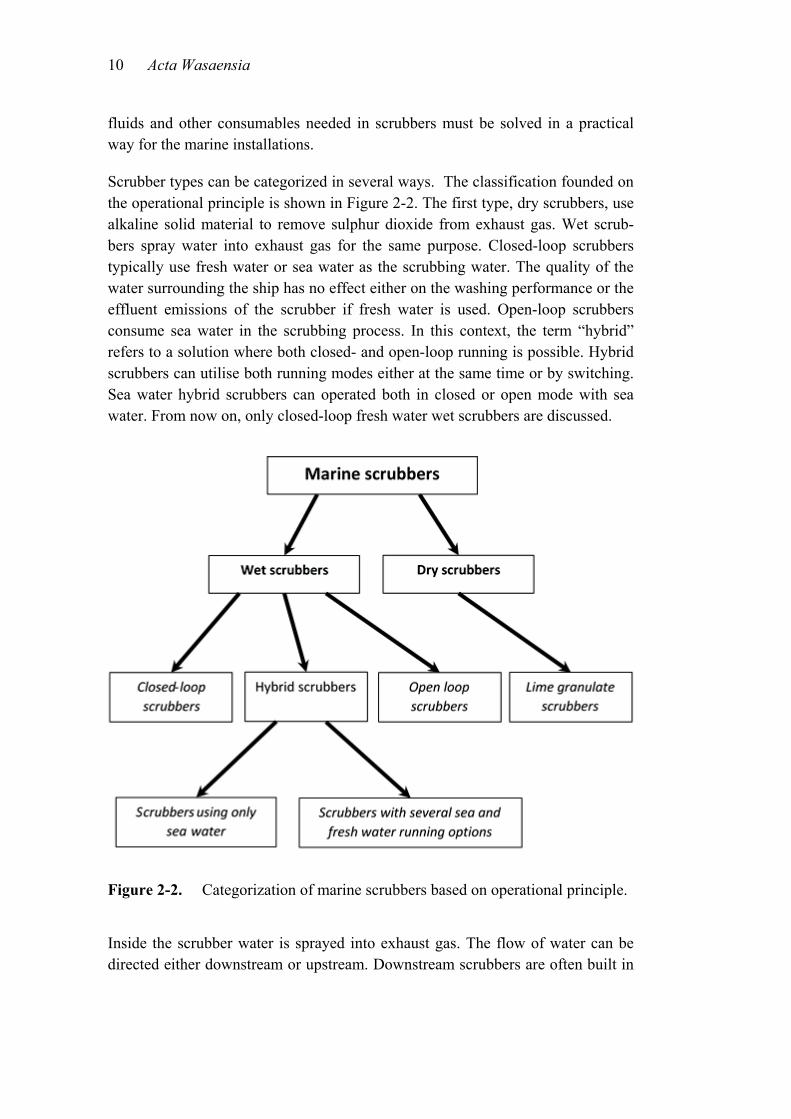
Scrubber types can be categorized in several ways. The classification founded on the operational principle is shown in Figure 2-2. The first type, dry scrubbers, use alkaline solid material to remove sulphur dioxide from exhaust gas. Wet scrub-bers spray water into exhaust gas for the same purpose. Closed-loop scrubbers typically use fresh water or sea water as the scrubbing water. The quality of the water surrounding the ship has no effect either on the washing performance or the effluent emissions of the scrubber if fresh water is used. Open-loop scrubbers consume sea water in the scrubbing process. In this context, the term “hybrid” refers to a solution where both closed- and open-loop running is possible. Hybrid scrubbers can utilise both running modes either at the same time or by switching. Sea water hybrid scrubbers can operated both in closed or open mode with sea water. From now on, only closed-loop fresh water wet scrubbers are discussed.
Figure 2-2. Categorization of marine scrubbers based on operational principle.
Inside the scrubber water is sprayed into exhaust gas. The flow of water can be directed either downstream or upstream. Downstream scrubbers are often built in
Acta Wasaensia 11 the form of a venturi where exhaust gas enters the scrubber through the top. Also, water is sprayed into the scrubber through inlets in the neck section in the high exhaust gas speed area. In upstream scrubbers the exhaust gas intake is on side or in the bottom of the lower part and water sprays are located at several levels in-side the scrubber. Quite often venturi and spray tower units are combined to in-crease both the particle removal and sulphur removal. Typically the venturi is then the first component taking in the hot exhaust gas.
If fresh water (make-up water) needs to be saved and contact time between water and gas increased, a packed bed may be installed inside the scrubber. A packed bed decelerates the vertical water flow inside the scrubber and intensifies both the exhaust gas cooling and the acidic water neutralisation process. However, exces-sive thickness and tightness of the packed bed increases the exhaust gas flow re-sistance into the opposite direction. Both dry and wet sump scrubbers are in use. In closed-loop dry sump scrubbers, a separate process tank is needed to enable circulation pump operation by preventing pump suction pressure from sinking too low.
The most common scrubber materials are corrosion resistant steels. If the hot run-ning option without scrubbing water is desired, the material must also be corro-sion resistant at high temperatures. Plastic scrubbers are used only for test pur-poses and the exhaust gas must be precooled before entering a plastic scrubber.
In the end, the sulphur flows into the sea with the scrubber effluent. This effluent flow should be avoided in sensitive sea areas and within enclosed water bodies such as estuaries. Zero emissions requirements may be set by local authorities. Effluent flow is not limited by IMO rules. The volumes of closed-loop scrubber effluent are low, which enables zero emissions operation for a limited time when effluent is pumped into a holding tank. The negative aspect of closed-loop scrub-bers is the caustic soda or other alkaline chemical consumption in the acid neu-tralisation process.
2.4 Operational principle
The alkalinity of washwater neutralizes the acidic exhaust gases and as a result, sulphur-based salts – sulphates – are produced. The final disposal site of the sul-phur is the water area surrounding the ship. The natural concentration of sulphates in sea water is more than 7.5% m/m of the salts (EGCSA, 2012: 43) and ocean sea water salinity is typically 3.2-3.8% m/m. When comparing the natural mass of

12 Acta Wasaensia
sulphates to the potential increase due to scrubber effluents, the effect can be con-sidered negligible.
In fresh water scrubbers, exhaust gas sulphur dioxide (SO2) dissolves from the gas into the water and the following chemical reaction is balanced:
SO2(g) ↔ SO2(aq) (1.)
The equilibrium between the two phases, gas and liquid, is affected by the partial pressure of SO2 (product of the combustion of the fuel sulphur), the concentration of SO2 in washwater, the temperature and the enthalpy of the solution (Andreasen & Mayer, 2007). Dissolved sulphur dioxide produces bisulphite (HSO3) (Slotte, 2010: 20):
SO2(aq)+H2O(l) ↔ HSO3-(aq)+H+(aq) (2.)
If an alkali is mixed with water, it dissolves and hydroxide ions are produced:
NaOH(s) + H2O(l) ↔ Na+(aq) + OH-(aq) + H2O(l) (3.)
Sodium reacts with sulphur trioxide (SO3), sodium bisulphite and sulphate (SO4) producing sodium sulphite (Na2SO3), sodium bisulphite (NaHSO3) and sodium sulphate (Na2SO4):
2Na+(aq) + SO32
-(aq) ↔ Na2SO3(aq) (4.)
Na+(aq) + HSO3-(aq) ↔ NaHSO3(aq) (5.)
2Na+(aq) + SO42-(aq) ↔ Na2SO4(aq) (6.)
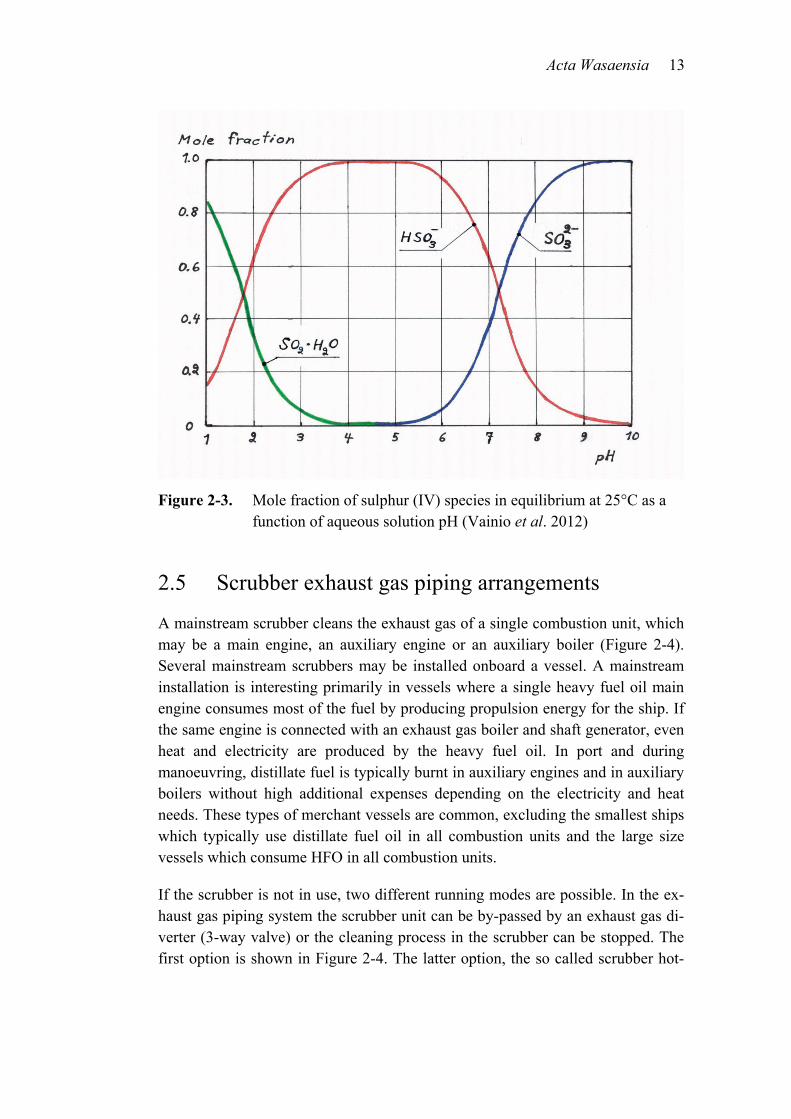
The balance between sulphur dioxide in water, bisulphite and sulphite at different pH is sketched in Figure 2-3. In acidic water, the main compound is bisulphite and in alkaline water sulphite (Vainio et al., 2012: 3). If oxygen is available in the water, sulphites oxidise further to sodium sulphate. The final concentrations of sodium bisulphite, sodium sulphite and sodium sulphate depend on the pH of the water and the degree of oxidation (EGCSA, 2012: 41). When sulphate is pro-duced, each sulphur atom needs two alkali atoms for the reaction. Acidity in the scrubber is neutralised by hydroxide ions separated from the alkali:
H+(aq) + OH -(aq) ↔ H2O(aq) (7.)
Acta Wasaensia 13
Figure 2-3. Mole fraction of sulphur (IV) species in equilibrium at 25°C as a
function of aqueous solution pH (Vainio et al. 2012)
2.5 Scrubber exhaust gas piping arrangements
A mainstream scrubber cleans the exhaust gas of a single combustion unit, which may be a main engine, an auxiliary engine or an auxiliary boiler (Figure 2-4). Several mainstream scrubbers may be installed onboard a vessel. A mainstream installation is interesting primarily in vessels where a single heavy fuel oil main engine consumes most of the fuel by producing propulsion energy for the ship. If the same engine is connected with an exhaust gas boiler and shaft generator, even heat and electricity are produced by the heavy fuel oil. In port and during manoeuvring, distillate fuel is typically burnt in auxiliary engines and in auxiliary boilers without high additional expenses depending on the electricity and heat needs. These types of merchant vessels are common, excluding the smallest ships which typically use distillate fuel oil in all combustion units and the large size vessels which consume HFO in all combustion units.
If the scrubber is not in use, two different running modes are possible. In the ex-haust gas piping system the scrubber unit can be by-passed by an exhaust gas di-verter (3-way valve) or the cleaning process in the scrubber can be stopped. The first option is shown in Figure 2-4. The latter option, the so called scrubber hot-

14 Acta Wasaensia
running option, sets high standards for wet scrubber construction and materials because of heat and temperature stresses and the risk of metal corrosion. Especial-ly the transitions between the scrubber run and stop modes may be challenging to operate.
Figure 2-4. Typical mainstream scrubber exhaust gas piping arrangement
(Wärtsilä).
Large vessels typically have several combustion units. If mainstream scrubbers are used, a multi-scrubber installation on board is needed. In such an arrange-ment, the increased weight, price, volume and complexity may result in an unin-teresting exhaust gas cleaning concept and to avoid these challenges, an integrat-ed scrubber system may be attractive. The principle of the system is shown in Figure 2-5. All the exhaust gas produced by combustion units is fed into one scrubber unit only, capable of cleaning all gases.
Depending on the actual combustion unit load, the exhaust gas flow into the scrubber may alternate rapidly. An exhaust gas fan may be installed into the sys-tem to create a suitable atmospheric pressure level inside the exhaust gas mani-fold. The pressure level in the manifold can be controlled by the exhaust gas fan. In the case of scrubber malfunction, by-pass valves are opened into the atmos-phere and the exhaust gas system operates in the traditional way without scrub-bing. An exhaust gas fan may also be located upstream of the scrubber unit to operate in dry but at the same time hotter conditions.

Acta Wasaensia 15 Merchant ship closed-loop scrubbers are typically designed for conditions where the maximum fuel sulphur content may be as high as 3.5% m/m, the sulphur re-moval capacity is equal to 0.10% m/m sulphur fuel, maximum continuous com-bustion unit power is allowed (no power limits), and global operation is possible (no sea water temperature, atmosphere temperature or humidity limits).
Figure 2-5. Typical integrated scrubber exhaust gas piping arrangement (Wärt-silä).
2.6 Scrubber installation
In a scrubber installation, the scrubber itself and possible by-pass valve(s) and exhaust gas fan(s) are the main components. Typically, the installation includes subsystems. The main components of a washwater (scrubbing water) system are washwater pumps and coolers while the main components of a sea water system are sea water pump(s). An effluent system includes effluent treatment unit(s) and effluent tanks. An alkali system takes care of the correct acidity of the washwater and contains alkali feed unit(s) and storage tank(s). Fresh water feed systems compensate water loss in the scrubber. Compressed air systems are needed as a supporting system. Electricity and automation systems are an essential part of the installation.

16 Acta Wasaensia
2.6.1 Scrubber loads
Exhaust gas scrubber components are stressed by static and dynamic loads. Static loads consist mainly of the scrubber’s own weight and the weight of the liquid inside the scrubber, tanks and piping. Inclined gravity force results from the ves-sels’ heel and trim. These static loads dominate in the formation of the total stress when the vessel is in harbour or at calm sea. In sea-going conditions the dynamic loads are caused by the wind, waves, the ship’s structural vibrations including icebreaking impulses, exhaust gas pressure pulses generated by piston engines, water sloshing inside the scrubber (wet sump scrubbers), heat expansion stresses during the scrubber start and stop, external loads resulting from other components - typically pipes connected directly to scrubbers - and gyro forces (exhaust gas fans).
Emissions legislation does not allow pollution due to stormy sea, excluding emer-gency situations. In Figure 2-6 the main axes of the vessel are depicted. Ship hull velocities, accelerations, angular velocities and angular accelerations at sea are generally presented based on this coordinate system.

Acta Wasaensia 17
Figure 2-6. Ship main axes and terms for ship hull movements in three dimen-sions.
2.6.2 Weight and space
Scrubber unit operation is affected by four main parameters: exhaust gas velocity and flow, washwater injection rate, packing bed height in the case of packed tow-er scrubbers, and packing size (Kirjonen, 2013: 93). In practice, scrubber unit dimensions are calculated as a result of maximum exhaust gas mass flow, maxi-mum exhaust gas temperature, maximum allowed combustion unit back pressure, maximum fuel sulphur content, minimum sulphur removal efficiency, and desired fresh water consumption.
The weight of a scrubber unit depends on its dimensions and will increase the lightweight of the ship. Added weight should be as low as possible, considering the scrubber high vertical location in the exhaust gas system. The main weight groups of a scrubber installation comprise the scrubber unit, ship hull modifica-tions, scrubber auxiliary systems, piping, liquids for scrubber operation, and waste liquids.

18 Acta Wasaensia
The scrubber weight and the content of the scrubber tanks may: • reduce the cargo carrying capacity of the vessel (if cargo volume is not the
critical ship loading parameter), • generate added resistance in motion as a result of added buoyancy and bad
trim, and • reduce stability.
In addition to weight, also free space may be limited onboard. It is important to reserve extra space around the scrubbers for scrubber connections and mainte-nance. If extra steel structures are needed for the scrubber, the ship gross tonnage may increase after the installation and operating costs, e.g., port charges, fairway dues, pilotage, tug charges and certificate costs may rise assuming that the pricing is linked with the ship gross tonnage.
Thus, the volume of a scrubber installation is important, but also the footprint it requires must be considered carefully. Especially in retrofit cases, a reduced scrubber footprint is an advantage. Free deck height in superstructures is typically limited to 2 to 2.5 meters and several deck heights are normally needed for the scrubber. In engine rooms and engine casings, more free height is typically avail-able.
2.6.3 Scrubber system tanks and interfaces to ship systems
A closed-loop scrubber process is more complicated than a sea water scrubber process. A typical closed-loop system is depicted in Figure 4-2. The process tank is needed in the closed-loop system to enable scrubbing water circulation. How-ever, in some installations the scrubber wet sump can be used as a process tank. Bleed-off flowing out of the washing process is treated to obtain cleaned effluent and sludge. Normally, the scrubber sludge tank is kept separate from the ship sludge tank. If the scrubber is used in zero-effluent mode for example in ports and in especially sensitive water areas, also an effluent holding tank or a bleed-off holding tank is needed. Extra fresh water storage capacity may be reserved for fresh scrubber systems if the vessel’s own water production capacity is limited. In general, tank design capacities depend on the combustion unit average power, the maximum fuel sulphur content and the targeted independent operational range of the vessel. Scrubber system tanks, tank types, and relative capacities are indicated in Table 2-4.

Acta Wasaensia 19 Table 2-4. Closed-loop scrubber tanks and fluid flows.
Tank Fluid Typical tank type Fluid flow
Alkali storage tank Alkali content ~50% m/m Hull tank 6 litres/MWh/sulphur in
fuel (%, m/m)1
Sludge tank Water and impurities
Hull tank (capacity 0.5 m3/MW1) 2.5 litres/MWh3
Process tank (op-tional)
Scrubbing water Detached tank
Bleed-off or efflu-ent holding tank (optional)
Mainly water Hull/detached tank (6 h at full power2)
1Lloyd’s Register. “Understanding exhaust gas treatment systems, guidance for shipowners and operators” (2012)
2Hansen, J. “Exhaust gas scrubber installed onboard MV Ficaria Seaways”. (2012) 3Klimt-Möllenbach et al. Vessel emission study: comparison of various abatement technologies to
meet emission levels for ECA´s. (2012)
A scrubber interfaces with several ship machinery components and systems such as combustion units, the fresh water feed system, electrical wiring, the com-pressed air feed and the ship alarm system. Fresh water scrubbers consume a re-duced volume of sea water, mainly for cooling purposes, and therefore additional sea water intake may not be needed in the hull.
2.6.4 General operational requirements
Outflowing scrubber exhaust gas typically has 100% relative humidity, which generates a plume in the atmosphere as a function of several parameters: • exhaust gas temperature • atmospheric temperature • atmospheric humidity • exhaust gas outflow speed, and • mixing ratio of exhaust gas and outdoor air.
Exhaust plume formation can be affected by mixing warm ventilation exit air from the engine casing into the plume or by a separate exhaust gas reheating sys-tem. Engine room ventilation exit air may also form a dry layer below the exhaust gas plume, thus isolating the exhaust gas from the ship structures. The exhaust gas plume should not form water droplets or sulphate snow which could fall onto

20 Acta Wasaensia
the ship deck. Minimum plume visibility is targeted and the exhaust gas should be clearly separated from the ship structures with as much up-flow as possible
Scrubbers are installed on ships to reduce emissions into the atmosphere. Howev-er, more and more attention is paid to effluent as an unwanted result of the ex-haust gas cleaning process. The effluent parameters to be measured are the phe-nanthrene equivalence of Polycyclic Aromatic Hydrocarbons (PAHs), turbidity, pH and temperature. Local authorities may impose restrictions on effluent dis-charge from ships within their sphere of operations. Therefore the possibility to switch into zero effluent running mode is highly valuable in closed water areas and estuaries.
When operating in zero effluent running mode, waste water is normally stored in a tank to await later pumping into the sea when the ship is at a suitable location. The other option for effluent disposal is to discharge waste water into the munici-pal waste water network at a port. This is possible if the water quality is within the local effluent quality limits, whereby especially the metal and sulphate con-centrations of the effluent may present a challenge. The third option is to dry the effluent to a sufficiently reduced volume to allow storage on board and transport to waste water treatment plants. Compared with pumping the effluent into the sea, the last two alternatives incur extra costs and also cause logistic challenges. Sludge separated from dirty effluent is typically stored separately from other ship sludge. To minimize sludge volumes and the cost of sludge disposal, the water content of the sludge should be low. Efficient water separation in the effluent treatment process is therefore important.
Alkali bunkering is a logistic challenge since there is currently no comparable infrastructure for fuel oil and fresh water bunkering in ports. Especially on irregu-lar routes alkali tanker-trucks must be ordered to the quayside at the correct time. For alkali bunkering also additional arrangements on pier and on board the ship are needed. The alkali must be kept warm during bunkering to prevent its viscosi-ty from exceeding the pumping limit. On the other hand, the alkali must not be overheated. Moreover, the amount of water effluent treatment chemicals in high-power ships may grow to volumes requiring fixed pumping arrangements on board.
A scrubber installation must be safe for the ship, the cargo, human life and the environment. The health and safety aspects of scrubber operators must be at an acceptable level. These issues are normally verified by authorities and classifica-tion societies. Typically a scrubber installation is class approved and the scrubber safety concept is included in the classification documents. A number of classifica-tion societies have published their rules for scrubber installations. Major material

Acta Wasaensia 21 risks are water flooding from the scrubber to a diesel engine or boiler, sea water flooding into the ship, and scrubber overheating.
2.6.5 Retrofit installations
Ship retrofit processes have been studied by Bacher (2012). He suggests a four-phase approach starting from technical, operational, economical and fleet com-mon considerations. The first step would be choosing the right technical solution followed by tailored integration design as the second step. The third phase would consist of the detailed design of cost-effective solutions, and finally, the opti-mized installation of the system would take place. The installation options include work at yard or at dry dock, alongside or in traffic. A combination of all options is often preferred. The project may be executed on a turn-key basis, by using indi-vidual contracts or by selecting an external main contractor (EPCM).
The second challenge is to install the scrubber system economically with regard to the market value and the remaining operational age of the vessel. An economi-cal retrofit installation is connected with short docking time, a short off-hire peri-od and short commissioning time including the system certification. Good prepa-ration enables fast scrubber installation. Realistic time schedules including legis-lative compliance schedules, tabletop project execution drills, maximum prefabri-cation, sufficient labour resources, well prepared logistics and fluent transport routes inside the ship are prerequisites for successful retrofitting.
Many ships are unique and the use of standardised solutions may be difficult, which is why tailor-made designs cannot be avoided. However, many merchant ships exhibit fairly similar general arrangement and standardisation is becoming increasingly possible with the growing scrubber stock and as the most efficient working methods are being found.
To enable scrubber system installations, hull modifications such as hull rein-forcement, separate scrubber block installation, new hull tanks or tank modifica-tions and engine casing modifications may be required. Also new mounts for scrubber auxiliary systems are typically welded to ship hull. In addition, new pip-ing systems are installed and old systems modified. New electricity and automa-tion installations include automation cabinets, switchboards, instrumentation, ca-ble trays, cabling and penetrations. Scrubber retrofitting is estimated to cause an approximately one-month pause in ship operation (ECSA, 2014).

22 Acta Wasaensia
3 EXPERIMENTAL SCRUBBER INSTALLATION
3.1 Scrubbers onboard MT Suula
A scrubber system for test purposes was installed into motor tanker Suula (Figure 3-1). The installation included two different kinds of scrubber units which were connected to one of the vessel’s auxiliary engines. For the tests, the engine origi-nally running on distillate was modified for heavy fuel oil use. The maximum output power of the engine was 680 kW at 900 rpm. The installed scrubber ex-haust gas capacity was 1.25 kg/s which was equal to 90% of the engine nominal load. After completed testing, the scrubber system was removed from the vessel.
Figure 3-1. Exhaust gas scrubber system installed on board MT Suula. The units are located in front of the blue funnel (Kai Saarinen).
The test arrangement allowed the use of the two scrubbers separately or as one combined abatement unit. In the first unit, exhaust gas was washed according to the upstream principle (scrubber) as shown in Figure 3-2. After the engine, a three-way valve was installed into the exhaust gas pipe and this valve operated as

Acta Wasaensia 23 a scrubber by-pass line (safety system). The yellow lines in the mimic indicate the flow of exhaust gas.
Figure 3-2. Scrubber unit operational principle (Wärtsilä).
Scrubbing water (green lines) was sprayed into the exhaust gas system at three points. The first two sprays, called quenches, cooled down the gas temperature making it possible to use plastic materials in the scrubber. The last spray was fed with cooled washwater from the heat exchanger, using sea water as a coolant.
Sulphur - in the form of sulphate and sulphite - and other impurities were re-moved from the scrubbing water with the bleed-off flow entering the effluent treatment unit. The bleed-off line is marked with tan colour in the screenshot. The buffer tank was located between these units and allowed the maintenance of the bleed-off unit without interruptions in scrubber operation.
Acidic washwater was neutralised by alkali injection, denoted with a purple line. The make-up water line, needed to compensate evaporation and bleed-off from the scrubber, is the blue line in Figure 3-2. The scrubber unit was equipped with a

24 Acta Wasaensia
packed bed to increase exhaust gas cooling efficiency and to raise the contact time between exhaust gas and washwater.
Inside the other unit – the venturi – the situation was the opposite with exhaust gas and washwater flowing in the same direction. The venturi had no packed bed. Otherwise the operational principle was similar to that of the scrubber. The ven-turi principle is shown in Figure 3-3.
Figure 3-3. Operational principle of Venturi unit (Wärtsilä).
The two above-mentioned units could be combined as shown in Figure 3-4. Ex-haust gas was first washed in the scrubber and later in the venturi (yellow line). Changes between different running modes required some piping modifications. The scrubbing installation was fitted with an automation system controlling all subsystems except bleed-off treatment and exhaust gas monitoring which had independent control devices.

Acta Wasaensia 25 During the tests, MT Suula was in operation, transporting oil products mostly in the Baltic Sea. The auxiliary engine load could be adjusted to a specific level by balancing the total electric load between the other two auxiliary engines. Normal-ly, the vessel’s shaft generator produced the required electricity at sea and auxilia-ry machinery was used in port and during manoeuvring.
Figure 3-4. Operational principle of combination unit (Wärtsilä).
Exhaust gas quality was measured with fixed analysers before and after the scrubbing process. For more exact measurements, an accredited measurement company was employed. Particle measurements were also outsourced and water and fuel oil samples, respectively, were analysed in laboratories on shore. For exhaust gas plume observations, a camera, transmitting continuous information, was installed on the funnel top. Measured information was saved in the automa-tion system and also manual recordings were made during the tests.

26 Acta Wasaensia
3.2 Scope of tests
The MT Suula scrubber unit tests were carried out as shown in Table 3-1. The tests were grouped into certification tests, SO2 reduction tests, particle washing tests, noise tests, and sea water tests. The total number of tests was 56. The testing started with the certification process and the installation was approved - as speci-fied in the MEPC.170(57), 2008 Guidelines for Exhaust Gas Cleaning Systems (IMO, 2008a) - by two classification societies, Det Norske Veritas and German-ischer Lloyd. The certification was the first of its kind for a ship installation in the world.
The venturi unit tests were more limited, covering system start-up, particle re-moval efficiency, noise reduction, and scrubbing with sea water. The combined scrubber-venturi system was tested to determine the particle reduction efficiency. Moreove, different coatings, operation with sewage water as make-up liquid, the exhaust gas plume, sulphur trioxide emissions, scrubber dynamics and engine room air pressure were studied.
The target of the Suula tests was to accomplish “certification of the scrubber, ex-haust gas cleaning performance measurements, analysis of the scrubber effluent and other liquids, testing of effluent cleaning unit operation and analysis of gen-erated sludge, measurements of alkali and water consumption, scrubber noise attenuation and exhaust gas plume observations” (Wärtsilä, 2010).

Acta Wasaensia 27 Table 3-1. Scope of MT Suula scrubber unit tests.
Suula test table, 2010-04-20 116 testsScrubber tests
Main settings Recording8 Test name Date Generator load
(max 650 kW)Generator load (%)
Sulphur content
Scrubber automation
Manual Noise Camera Particles Samples
Certification tests1 8 % load 2009-04-21 42 6 % 1.48 x x x2 40 % load 2009-04-20 233 36 % 1.48 x x x3 70 % load 2009-04-21 413 64 % 1.48 x x x4 100 % load 2009-04-21 582 90 % 1.48 x x x5 8 % load 2009-04-21 46 7 % 3.39 x x x6 40 % load 2009-04-22 225 35 % 3.39 x x x7 70 % load 2009-04-22 421 65 % 3.39 x x x8 100 % load 2009-04-22 597 92 % 3.39 x x x
Main settings Recording10 Test name Date Generator load
(max 650 kW)Generator load (%)
Sulphur content
Scrubber automation
Manual Noise Camera Particles Samples
Scrubber SO2 reduction tests10 scrubber min. wash water test 2009-05-12 303 47 % 2.16 x x11 scrubber min. wash water test 2009-05-12 303 47 % 2.16 x x
12 A scrubber min. quench water test 2009-05-13 286 44 % 2.16 x x12 B scrubber min. quench water test 2009-05-27 175 27 % 2.16 x x13 pH test 2009-05-27 182 28 % 2.16 x x14 wash water evaporation test 2009-05-27 434 67 % 2.16 x x15 wash water evaporation test 2009-05-28 327 50 % 2.16 x x16 wash water evaporation test 2009-05-28 270 42 % 2.16 x x17 wash water density test 2009-05-29 420 65 % 2.16 x x x18 wash water max. sulphate test 2009-06-15 340 52 % 2.16 x x x
Test number Main settings Recording11 Test name Date Generator load
(max 650 kW)Generator load (%)
Sulphur content
Scrubber automation
Manual Noise Camera Particles Samples
Scrubber particle washing tests ISO-817824 10 % scrubber max load (588 kW) 2009-05-06 60 9 % 1.48 x x x x25 25% load 2009-05-06 139 21 % 1.48 x x x x26 50% load 2009-05-06 293 45 % 1.48 x x x 27 75% load 2009-05-06 450 69 % 1.48 x x x x
28 A 100% load 2009-05-06 519 80 % 1.48 x x x x28 B 100% load 2009-05-06 578 89 % 1.48 x x x 29 10% load 2009-05-06 53 8 % 2.16 x x x x30 25% load 2009-05-06 150 23 % 2.16 x x x x31 50% load 2009-05-06 293 45 % 2.16 x x x 32 75% load 2009-05-06 447 69 % 2.16 x x x x33 100% load 2009-05-06 578 89 % 2.16 x x x x
Test number Main settings Recording14 Test name Date Generator load
(max 650 kW)Generator load (%)
Sulphur content
Scrubber automation
Manual Noise Camera Particles Samples
Scrubber particle washing tests ISO-909634 75 % scrubber max load (588 kW), 7 2009-04-26 436 67 % 1.55 x x x x35 100 % load, 8 2009-04-26 582 90 % - x x x x36 10 % load, 5 2009-04-25 72 11 % 2.63 x x x x37 25 % load, 4 2009-04-24 149 23 % - x x x x38 50 % load, 3 2009-04-24 282 43 % - x x x x39 75 % load, 2 2009-04-24 451 69 % 3.27 x x x x
40 A 100 % load, 1 2009-04-24 593 91 % - x x x x40 B 100 % load, 6 2009-04-25 578 89 % 2.39 x x x220 50 % load cold 2010-01-15 274 42 % 1.47 x x x x x221 75 % load cold 2010-01-14 429 66 % 1.47 x x x x x
221 B 75 % load cold 2010-01-14 382 59 % 1.47 x x x x x222 100 % load cold 2010-01-15 568 87 % 1.47 x x x x x223 50 % load hot 2010-01-15 277 43 % 1.47 x x x x 224 75 % load hot 2010-01-14 384 59 % 1.47 x x x x 225 100 % load hot 2010-01-15 551 85 % 1.47 x x x x
Test number Main settings Recording12 Test name Date Generator load
(max 650 kW)Generator load (%)
Sulphur content
Scrubber automation
Manual Noise Camera Particles Samples
Scrubber noise test 41 Before scrubber, in duct 2009-04-07 368 57 % x x x42 Before scrubber, in duct, by-pass 2009-04-07 405 62 % x x x43 After scrubber, in duct 2009-04-07 368 57 % x x x44 On deck, open air noise 2009-04-07 420 65 % x x x45 On deck, open air noise, by-pass 2009-04-07 383 59 % x x x46 After scrubber, in duct 2009-12-01 383 59 % x x x47 Before scrubber, in duct 2009-12-01 368 57 % x x x48 Before scrubber, in duct, by-pass 2009-12-01 390 60 % x x x49 On deck, open air noise, by-pass 2009-12-01 322 50 % x x x50 On deck, open air noise 2009-12-01 330 51 % x x x51 Break out noise on deck 2009-04-07 380 58 % x x x52 Break out noise on deck 2009-12-01 345 53 % x x x
Test number Main settings Recording1 Test name Date Generator load
(max 650 kW)Generator load (%)
Sulphur content
Scrubber automation
Manual Noise Camera Particles Samples
Scrubber sea water tests56 10 -100 % scrubber max. load (588 kW) 2009-06-14 100 - 440 15 - 68 % 2.16 x x x
Test number
Test number

28 Acta Wasaensia
3.3 Test results
3.3.1 Certification tests
The main task of the scrubber was sulphur removal from exhaust gas. As speci-fied in IMO Resolution MEPC.170(57), the content of sulphur in exhaust gas was measured as the ratio of sulphur dioxide (ppm-vol) and carbon dioxide (%-vol). This ratio for fuel containing 0.10% m/m sulphur should be less than 4.3. The latest 2015 Resolution 259(68) did not exist when Suula tests were executed.
The certification measurements were performed and reported by an accredited testing laboratory TO62 of Pöyry Energy Ltd; accreditation requirement SFS-EN ISO/IEC 17025 (Tikka & Lipponen, 2009). The measurements were based on the regulations of the NOx Technical Code Chapter 5 and the IMO Resolution MEPC. 170(57) section 6.1. The measured gaseous parameters were carbon diox-ide, carbon monoxide, sulphur dioxide, nitrogen oxides such as nitrogen dioxide, and oxygen. At the same time exhaust gas velocity, temperature and moisture were measured (Table 3-2). Effluent samples were analysed as specified in Annex 4 of Resolution MEPC.170(57); also effluent flow was recorded.
The scrubber onboard Suula was MARPOL certified according to IMO Resolu-tion. The nominal test loads were 8%, 40%, 70% and 100% for two test fuels. The scrubber loads, engine loads and exhaust gas flows were not directly comparable (Table 3-3). Full scrubber load was equal to 90% engine load. An 8% nominal load, respectively, was equal to 7% engine load and 24% gas flow into the scrub-ber. Constant speed and variable speed running produce different exhaust gas flows from the same engine at same power. However, all tests were conducted during constant speed running.

Acta Wasaensia 29 Table 3-2. Equipment and methods used in MT Suula certification tests (Tik-
ka et Lipponen).
Table 3-3. Engine loads, scrubber loads and exhaust gas flows during certifi-cation tests (Wärtsilä, 2010).
Engine nominal load (%)
Engine load in the test (%) Scrubber load (%) Exhaust gas flow
(kg/s)
7 8 24 0.30
36 40 49 0.61
63 70 74 0.92
90 100 100 1.25
Exhaust gas emission levels were measured simultaneously before and after the scrubber. Scrubber effluent samples and fuel oil samples were taken for later la-boratory analyses. The two test fuels contained 1.48% and 3.39% m/m sulphur. The high-sulphur fuel analysis results are provided in Table 3-4.
/Mollier diagram

30 Acta Wasaensia
Table 3-4. High sulphur test fuel analysis (Tikka et Lipponen).
Certification test arrangement is depicted in Figure 3-5. Equipment leakage tests and gas calibrations were executed as part of the measurement procedures. In ad-dition, linearity tests were performed. The test data was recorded by Horiba data collection systems for later analyses. The exhaust gas pipe internal diameter be-fore the scrubber was 320 mm and after the scrubber 400 mm. The gas analysers and methods used in the certification tests are listed in Table 3-2.

Acta Wasaensia 31 The results of the exhaust gas certification tests were clear; all the tests indicated no sulphur dioxide in the exhaust gas. For the measurements, the absolute uncer-tainty was estimated to be ± 5 mg/Nm3 after the scrubber at a confidence level of 95%. The scrubber maximum performance was obviously too efficient for the exhaust gas flow of the test engine.
Figure 3-5. Arrangement of exhaust gas certification measurements on board MT Suula (Tikka et Lipponen).

32 Acta Wasaensia
The discharge water analyses proved that effluent turbidity was very low; 0.32 FNU when low-sulphur fuel was used and 0.22 FNU with high-sulphur fuel. These results are well below the 25 FNU approval limit. The pH of both effluents was 8.0, which was better than the minimum allowed (6.5) by the regulation. The amount of polycyclic aromatic hydrocarbons in the effluent sample, measured based on method 8310 (USEPA 1986), was smaller than 0.010 g/m3 (low-sulphur fuel). With high-sulphur fuel, the PAH content was below 0.020 g/m3. The ac-ceptance limit was 1226 g/m3.
Based on the measurements, the installation easily met the certification criteria. It should be noted that in the first tests during the certification, the scrubber was operated at full efficiency; scrubbing water pH was set at a high level (7.0-7.1) and bleed-off flow was also high. When the 3.39% sulphur fuel was burned, the scrubbing water pumps worked at a 100% speed and the quench pump speed was 76%. Obviously long-duration test period with reduced water flow would have resulted lower quality effluent.
3.3.2 Sulphur removal
In the case of the Suula certification, the cleaning result was always below the IMO limit; the measured sulphur dioxide content in exhaust gas was zero. During subsequent tests following the certification, more effort was taken to weaken the scrubbing process. Scrubber performance limits were searched by adjusting the washing parameters. Washwater inflow could be controlled by the pump speed setting and by throttling inflow valves.
For emissions control during operation, Suula exhaust gas piping was equipped with a Lloyds’ Register type approved Martek Marinox engine emissions moni-toring system, which was capable of measuring nitrogen oxides, carbon dioxide, sulphur dioxide and oxygen in exhaust gas. The measurements were based on exhaust gas sampling via heated sampling lines from the exhaust gas pipe to a measuring unit. Two sampling probes were installed, one before and one after the scrubber.
An accuracy comparison of the accredited measurements and the Martek readings are shown in Figure 3-6. The standard deviation of hot gas measurements prior to scrubber was 4.7 (ppm-v/%-v). However, the cold and humid exhaust gas read-ings after the scrubber were less accurate. The post-scrubber measurements re-quired more equipment maintenance work.

Acta Wasaensia 33 The divergence of measured scrubber sulphur removal test results is shown in Figure 3-7. Eight certification tests, 24 performance tests, 21 particulate meas-urement tests and eight other tests are covered by the data. Tests without exhaust gas quality measurements (e.g. noise tests) and the tests where system was used in abnormal conditions (e.g. sea water tests) fall beyond the scope of the testing. The three insufficient results where the SO2/CO2 ratio was above 4.3 (ppm-v/%-v) were measured under running conditions without any water spray to scrubber, using only the upper quench spray which is necessitated for plastic scrubber ex-haust gas pre-cooling. These unacceptable results required at the same time washwater pH or flow reduction. This was an interesting observation opening up the possibility of reducing scrubber size in ship installations. However, a simple smaller scrubber without a packed bed would consume a significant amount of water due to reduced exhaust gas cooling efficiency.
Figure 3-6. Accuracy of local ship engine hot exhaust gas monitoring equip-ment.
Approximately half of the tests produced a zero result, i.e., no sulphur dioxide in the exhaust gas. It should be noted that the reliability of the wet exhaust gas measurements with local equipment was not high and that more systematic maintenance work and calibrations would have been needed.
0
20
40
60
80
100
120
140
160
0 20 40 60 80 100 120 140 160
AccreditedSO2/CO2 relation
(ppm-v, %-v)
Local SO2/CO2 relation (ppm-v, %-v)
Local exhaust gas emission measurement accuracy

34 Acta Wasaensia
If the water flow into the scrubber unit is sufficiently reduced, the washwater spray is weakened. In principle, this results in bad spray coverage over the packed bed inside the scrubber. Part of the exhaust gas will be in poor contact with the washwater, increasing the SO2 content of outlet gas. At the same time the gas cooling capacity is impaired, resulting in higher water consumption. The influ-ence of the scrubbing pump speed on sulphur removal can be seen in Figure 3-8. Quench sprays, which took part in the sulphur removal work where in use. The cleaning result was slightly better when high pumping power was applied. How-ever, slow speeds should be used to save pumping energy.
Figure 3-7. Scrubber sulphur removal measurements classified according to test result.
Sufficiently high washwater pH enables efficient neutralization of the acid pro-duced when gaseous SO2 and washwater come into contact. Based on MARPOL regulations, effluent pH during discharge into the sea should be at least 6.5. Therefore, lower pH values were not used in the tests. Running at lower pH is possible but alkali addition is needed to increase the effluent pH level prior to pumping into the sea. The effects of pH on sulphur removal are shown in Figure 3-9. The general conclusion was pH values above 6.5 are not needed to reach the IMO sulphur removal limit and that a higher pH value would only increase the alkali consumption. The pH measurement point in the scrubbing water line was located just before the point of water entrance into the scrubber (Figure 3-2).

Acta Wasaensia 35 Fuel sulphur content also influences the exhaust gas quality. During the Suula tests the fuel sulphur content varied from 1.4 to 2.7% m/m. As can be seen in Figure 3-10, the quality of the exhaust gas was slightly better when low-sulphur fuels were used. On the other hand the use of high-sulphur fuel did not impede the cleaning process; zero sulphur in exhaust gas readings was reached when 2.7% fuel was used.
Figure 3-8. Effect of scrubbing water pumping speed on sulphur reduction in exhaust gas scrubber.
A large amount of washwater was not needed for efficient sulphur removal. The quench sprays, originally intended for exhaust gas cooling prior to the plastic scrubber, were efficient sulphur removers. Acceptable efficiency in cleaning a 0.8 kg per hour sulphur flow in fuel was reached with an approximately 32 m3/h washwater flow. In fact, a large scrubber unit with a packed bed is not needed if bad cooling characteristics resulting in high water consumption are acceptable.
0,0
1,0
2,0
3,0
4,0
5,0
6,0
7,0
8,0
30 40 50 60 70 80 90 100
SO2/CO2 relation(ppm-v, %-v)
Relative speed of scrubbing water pumps (%)
Scrubber sulphur removal capacity
Sulphur in exhaustgas
Linear (IMO limit for0.1 % sulphur fuel)

36 Acta Wasaensia
Figure 3-9. Influence of washwater pH on sulphur reduction in exhaust gas scrubber.
Figure 3-10. Influence of fuel sulphur content on sulphur reduction in exhaust gas scrubber.
0,0
1,0
2,0
3,0
4,0
5,0
6,0
7,0
8,0
6,0 6,5 7,0 7,5 8,0
SO2/CO2 relation(ppm-v, %-v)
Scrubbing water pH
Scrubber sulphur removal capacity
Sulphur in exhaustgas
Linear (IMO limit for0.1 % sulphur fuel)
0,0
1,0
2,0
3,0
4,0
5,0
6,0
7,0
8,0
1,0 1,5 2,0 2,5 3,0
SO2/CO2 relation(ppm-v, %-v)
Fuel sulphur content (%-m/m)
Scrubber sulphur removal capacity
Sulphur in exhaustgas
Linear (IMO limit for0.1 % sulphur fuel)

Acta Wasaensia 37 3.3.3 Sludge and effluent
In the scrubber, exhaust gas is purified by transferring sulphur and other impuri-ties into the scrubbing water. If part of this water is not continuously replaced with clean water, the amount of impurities and also the density of the scrubbing water increases excessively. Therefore a small bleed-off flow out of the scrubber is needed. There, this bleed-off flow was controlled based on washwater density which was determined mainly by engine power and fuel sulphur content. The scrubber has washwater balance, which is a result of exit flow in the form of evaporation and bleed-off and inflow in the form of fresh water feed, humidity production from fuel combustion, and humidity in the combustion air. In the wa-ter treatment unit, bleed-off is separated into sludge and effluent. The sludge is pumped into a sludge tank.
The production of sludge during the Suula tests was minimal and no proper re-sults concerning sludge quantity were received. The dry matter in the sludge con-tained ash, oil hydrocarbons and metals while the main component of the aqueous phase was sulphate (Wärtsilä, 2010: 24).
Effluent samples were taken from the pipeline to which also pH, turbidity and PAH instruments were connected together with a flow meter. However, samples were taken prior to the filter and the measured values were recorded after the fil-ter. The effluent samples were later analysed in a laboratory. The results of these analyses, when 3.4% m/m sulphur fuel was used, are provided in Table 3-5 (Tik-ka & Lipponen, 2009). In general the chemical levels were low except for some metals such as vanadium. Obviously, the selected bleed-off treatment technology – flotation – is not the optimal solution for metal removal. The other explanation could be the flowing of loose or contaminated metal inside new piping into sam-ple bottles.
IMO effluent parameter values as a function of time are shown in Figure 3-11. The rate of effluent flow during the long duration sludge test (48 hours) was on average 160 litres per sulphur mass (kg) in fuel. Washwater density was 958 kg/m3 at the beginning of the test and it increased to 1056 kg/m3 by the end of test. During the test, bleed-off flow was reduced, complicating the cleaning of the treatment unit due to more contaminated input and more reduced effluent inflow volume.
Effluent pH was very stable based on the measurement device Endress+Hauser Orbisint CPS11D digital pH electrode. However, some of the measured values in the beginning of the test were below the allowed 6.5 limit. Alkali feed was ar-ranged into the scrubber unit and also into the bleed of the treatment unit at a later

38 Acta Wasaensia
phase. To save alkali, the final pH in the effluent pumped out of the ship should be as close to the required 6.5 limit as possible. Effluent samples analysed later in a laboratory onshore showed lower pH values than the ship’s own sensors. The reason for these reduced values may be later oxidation inside the sampling bottles or inaccurate sensor calibration.
Table 3-5. Effluent chemical analysis during the certification test, high sul-phur (3.4% m/m) fuel (Tikka et Lipponen).
Parameter Unit Result
Turbidity FNU 0.24
pH (25 °C) - 7.7
PAHEPA-16 μg 4.43
Nitrite NO2 mg/l 230
Nitrate NO3 mg/l 220
Cadmium, Cd μg/l < 1.5
Copper, Cu μg/l 270
Nickel, Ni μg/l 660
Lead, Pb μg/l 2
Zink, Zn μg/l 190
Chrome, Cr μg/l < 5
Arsenic, As μg/l 5
Vanadium, V μg/l 4400
Oil hydrocarbons as sum C10-C40 μg/l 120
Aliphatic hydrocarbons as sum C5-C35 μg/l < 200
Aromatic hydrocarbons as sum C6-C35 μg/l < 170
Mineral oils μg/l < 380
BTEX compounds μg/l 2.4
MTBE μg/l < 0.30
Effluent turbidity increased rapidly when sulphites and sulphates accumulated into the scrubbing water causing higher density. Turbidity was measured by an Endress+Hauser TurbiMax W CUS 31 sensor. The measuring principle was nephelometric 90° NIR (Near Infrared) scattered light according to EN 27027 recorded turbidity values under standardised, comparable conditions. The light wavelength was in the near-infrared range (880 nm) in compliance with ISO 7027

Acta Wasaensia 39 / EN 27027. In general, scrubbing water turbidity was higher than the required limit of 25 FNU and bleed-off treatment was thus needed. Proper operation of the bleed-off treatment unit was essential to obtain low turbidity effluent. Correct chemical feed, stable inflow and proper maintenance and calibration of process instruments ensure optimal operation of the bleed-off treatment unit.
Figure 3-11. Effluent quality during bleed-off treatment unit sludge production test.
Closed-loop fresh water scrubbers are not separately mentioned in scrubber regu-lations which allow a maximum outflowing effluent turbidity of 25 FNU above the turbidity of the surrounding sea water. In sea water scrubbers, the inlet water turbidity is the same as sea water turbidity. The definition “inlet water” is rather unclear with fresh water scrubbers; it can be understood as fresh feed water into the washwater circulation or as the high-turbidity washwater itself. Furthermore, the effluent turbidity limit is not linked with effluent flow volume, as it should be; the same criteria are valid for small and large flows with totally different effects on nature.
A third important effluent parameter is the PAH (Polycyclic Aromatic Hydrocar-bons) concentration in effluent, more exactly PAHphe (phenanthrene equivalence). PAHphe is difficult to measure since phenanthrene equivalence is not defined in
0,0
0,2
0,4
0,6
0,8
1,0
1,2
0
5
10
15
20
25
30
35
0 10 20 30 40 50
Test time (h)
Scrubber sludge test
Effluent turbidity (FNU)
Effluent pH
pH limit 6.5
Effluent flow (m3/h, secondaryaxis)
Wash water density (ton/m3,secondary axis)
Turbidity limit 25 FNU

40 Acta Wasaensia
the guidelines. In principle there are three alternatives for specifying PAHphe. The first option is to measure the phenanthrene concentration in effluent alone and the second alternative is to measure several PAHs and to in some way link the result with phenanthrene. During the certification tests method 8310 was used, where 16 separate PAH compounds where measured. As shown in Table 3-6, the required PAH levels analysed from effluent samples were not challenging to reach. The limits could be reached even without using the bleed-off treatment unit.

Acta Wasaensia 41 Table 3-6. IMO (2009a) washwater criteria and measured effluent parameters
of closed-loop scrubber tests onboard MT Suula.
Parameter IMO Resolution MEPC.184(59) washwater discharge criteria
Suula measure-ments
pH Max 6.5 or max 2 units of difference between inlet and discharge during manoeuvring and transit
3.4 – 7.7
Average 6.2
Polycyclic aromatic hydrocarbon concen-tration, phenanthrene equivalence (PAHphe)
- Max 2250 µg/l for washwater flow of 0-1 tons/MWh
0.5 – 13 µg/l
- 900 µg/l for 1-2.5 tons/MWh flow - 450 µg/l for 2.5-5 tons/MWh flow - 200 µg/l for 5-11.25 tons/MWh flow - 100 µg/l for 22.5-11.25 tons/MWh flow - 50 µg/l for 22.5-45 tons/MWh flow - 25 µg/l for 45-90 tons/MWh flow For abnormal start 100% concentration exceed is allowed for 15 minutes in any 12-hour period
Turbidity as Formazin Nephlo-metric Units (FNU) or Nephlometric Turbidity Units (NTU)
Rolling average to be max 25 units above the inlet water turbidity over a 15-minute period. Limit can be exceeded by 20% for a 15-minute period in any 12-hour period.
0.2 – 67.5 FNU Average 11 FNU
Temperature No criteria
Nitrates - Max 12% of NOx in exhaust gas or 0.1 – 4.8% Average 1.6%
-Max 60 mg/l normalized for 45 tons/MWh
(whichever is greater)
0.7 – 21 mg/l
Average 8.5 mg/l
In the ship effluent system the instrument used for PAH control was Turner De-sign’s TD1000C on-line hydrocarbon in water monitor. This monitor detects ar-omatic hydrocarbons in water by using fluorometry in combination with a flow cell. When instrument readings were compared with laboratory analyses, the in-strument gave clearly higher readings.

42 Acta Wasaensia
Nitrate flow out of the ship is limited in relation to the nitrogen oxide content in the exhaust gas. The nitrogen in exhaust gas may transfer to the sea also in scrub-ber effluent. Therefore maximum nitrate concentration in effluent is mandated by IMO Resolution 184(59). Effluent samples taken during the Suula tests were on the safe side of this limit (Table 3-6). The nitrogen wash in scrubbers is expected to be limited since only NO2 is soluble and 95% of NOx emissions is NO (Den Boer & ‘t Hoen, 2015).
Effluent quality criteria by IMO Resolution 184(59) and the sample analyses based on the Suula tests are presented in Table 3-6. Part of the pH values are be-low the 6.5 limit. However, acidic effluent is quite easily counterbalanced by added alkali feed. The other parameter, turbidity, also has readings above the 25 FNU limit. Turbidity values are more challenging to control than pH. It should be noted that at least the pH and turbidity values may change during the sample transport time from ship to laboratory.
3.3.4 Chemical consumption
The chemical consumption of a scrubber should be as low as possible. In Suula chemicals were consumed mainly for acid neutralization in the scrubber (alkali) and also smaller amounts in the bleed-off treatment unit to enable the effluent cleaning process. In the running scrubber, the fuel sulphur content, the fuel con-sumption of the auxiliary engine and the pH adjustment of the wash process were the main factors affecting the alkali consumption. In theory, the neutralization of sulphur dioxide to bisulphite (low pH) requires one alkali molecule per sulphur molecule resulting in a mass ratio of 1.25 (40g/32g). The formation of sulphite and sulphate (high pH) requires two alkali molecules per sulphur molecule result-ing in a mass ratio of 2.5 (80g/32g). The sulphur-alkali mass relation as a function of pH is shown in Figure 3-12. The theoretical curve is based on Figure 2-3.
In the MS Suula case, most of the measured alkali-sulphur ratios were slightly below 2 but clearly above the theoretical level. This result may be due to inaccu-racy of alkali flow measurement on the on hand and the content of other com-pounds in the scrubbing water on the other. The consumption of 50% m/m alkali and water solution was about 10 kg per MWh and per sulphur in fuel % m/m.
The consumption of alkali in the bleed-off treatment unit was minimal as was also the flocculant consumption. The flocculant was provided in powder form. Coagu-lant consumption was higher but it was not measured during the tests.

Acta Wasaensia 43
Figure 3-12. Alkali consumption in the scrubber.
3.3.5 Water consumption
As is the case with chemicals, also fresh water consumption should be minimized. The fresh water feed, together with the water inflow with combustion air and as a result of fuel burning, should compensate for the scrubber bleed-off flow and re-moval by evaporation with exhaust gas.
As shown in Figure 3-13, the average water consumption varied between 200 and 600 litres per MWh. As expected, water consumption was dependent on the ex-haust gas exit temperature. However, the detected interdependence of scrubbing water cooling efficiency and fresh water feed was not unambiguous. There are probably several reasons for this. One main reason may be the short average dura-tion of the tests. Especially the time needed to increase wash water density to higher levels was significant. Due to test engine load variations, the process pa-rameters were often at a dynamic stage. Since bleed-off flow from the scrubber operates on the overflow principle and due to unstable manual water level setting between the two water tanks in the scrubber, the overall process was not well bal-anced. The effects of washwater density, fuel sulphur content, bleed-off flow, combustion air humidity and combustion based water were not included in the graph.
0
2
4
6
8
10
12
0,0
0,5
1,0
1,5
2,0
2,5
3,0
4 5 6 7 8 9 10pH
Alkali consumption (tests nr. 3, 4, 6, 7, 8, 31, 32, 33, 34, 39, 40B)
Measured NaOH/sulphurratio (mol/mol)
Theoretical NaOH/sulphurratio (mol/mol)
50 %m/m NaOHconsumption(kg/MWh/sulphur%),secondary axis
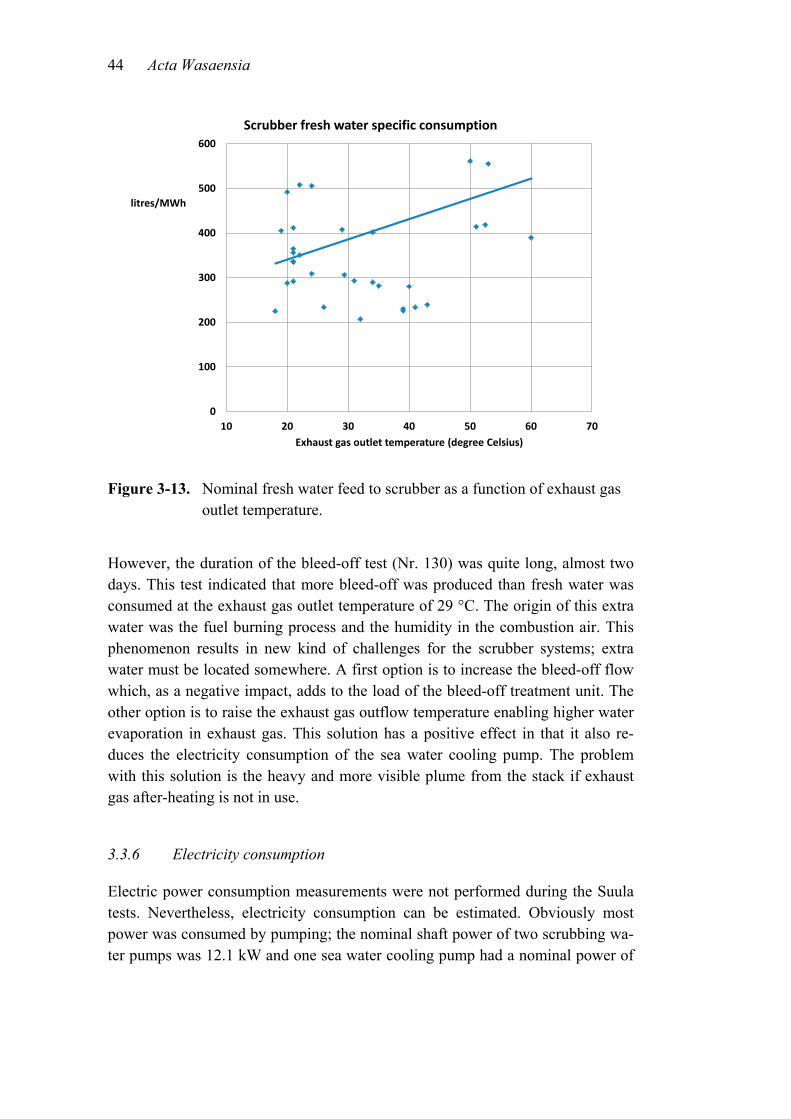
44 Acta Wasaensia
Figure 3-13. Nominal fresh water feed to scrubber as a function of exhaust gas outlet temperature.
However, the duration of the bleed-off test (Nr. 130) was quite long, almost two days. This test indicated that more bleed-off was produced than fresh water was consumed at the exhaust gas outlet temperature of 29 °C. The origin of this extra water was the fuel burning process and the humidity in the combustion air. This phenomenon results in new kind of challenges for the scrubber systems; extra water must be located somewhere. A first option is to increase the bleed-off flow which, as a negative impact, adds to the load of the bleed-off treatment unit. The other option is to raise the exhaust gas outflow temperature enabling higher water evaporation in exhaust gas. This solution has a positive effect in that it also re-duces the electricity consumption of the sea water cooling pump. The problem with this solution is the heavy and more visible plume from the stack if exhaust gas after-heating is not in use.
3.3.6 Electricity consumption
Electric power consumption measurements were not performed during the Suula tests. Nevertheless, electricity consumption can be estimated. Obviously most power was consumed by pumping; the nominal shaft power of two scrubbing wa-ter pumps was 12.1 kW and one sea water cooling pump had a nominal power of
0
100
200
300
400
500
600
10 20 30 40 50 60 70
litres/MWh
Exhaust gas outlet temperature (degree Celsius)
Scrubber fresh water specific consumption

Acta Wasaensia 45 3.0 kW. The rotating speed of these centrifugal pumps was controllable by fre-quency converters. At the operating point, the scrubbing water flow should be reduced to as low a level as possible with acceptable sulphur removal capability. However, there were also minimum pressure limitations for the pumps. Wash water had to cover the packed bed cross-sectional area with a uniform water spray distribution to enable efficient exhaust gas cooling. Similarly, the free cross-sectional area below the packed bed had to be covered by the spray to reach the required sulphur exhaust gas neutralization. In the case of the sea water cooling pump, the minimum pressure was limited by the high vertical position of the heat exchanger. Low pump rotational speed could not lift water to a sufficient height to reach the heat exchanger.
The lowest practical pumping power was estimated based on the efficiency of sulphur reduction. In test 10.1, the rotation speeds of the pumps were 39% and 27% of the nominal resulting perfect washing result at a 285 kW generator load when the auxiliary engine was burning 2.16% sulphur fuel. In this test the scrub-bing water spray pressures were low, between 13 and 23 kPa, which may mean poor spray nozzle operation.
If the target pressure for a packed bed spray is assumed to be around 50 kPa, the wash water pump should rotate at 50% speed depending on the control valve set-tings. Assuming further that flow resistance, density of scrubbing water and lift-ing height are included in total pressure estimation, the pressure at the pump would be about 110 kPa resulting in an electric power consumption of roughly 3 kW (Figure 3-14). The other similar pump feeding only the first quench before the scrubber had higher pressure and less water flow at the same pump speed. The electric power was less than 2 kW. On the sea water side the practical cooling pump speed was 80% of the nominal speed, which results in 2 kW of electric power consumption at the most. As a conclusion, the estimated total pumping electric power consumption was 7 kW and proportioned to the installed scrubbing power (612 kW), it was 1.1%. Compared to the actual engine power in use, the pumping power requirement was 2.3%.

46 Acta Wasaensia
Figure 3-14. Pressure and power curves of scrubbing water centrifugal pumps type Munch NP 65-40-200.
The other substantial electricity consumer in Suula was heating. Since the instal-lation was outdoors unlike commercial installations, many extra heating systems were used. However, in all scrubber installations the alkali tank and exhaust gas sampling lines have to be heated. The nominal heating power of these systems
Pump pressure and power at 50% RMP (1450)

Acta Wasaensia 47 was 4 kW. If the estimation for the consumption of other consumers is 2 kW, the final load would be roughly 13 kW.
Based on this assumption the Suula scrubber relative electricity consumption was 1.9% of the scrubber nominal capacity power. In practice, auxiliary engines are never heavily loaded since other auxiliary engines are automatically started to carry part of the high auxiliary load. In the case of a partially loaded engine, the scrubber relative power grows. Minor loads are rare due to the possibility of shift-ing low power to other engines and stopping the low-load auxiliary engine.
Part of the energy consumption of a scrubber is more or less constant regardless of scrubber size because automation, emission measurements and the like have quite fixed energy needs. The possibility to utilize the ship’s waste energy for heating is important and will improve scrubber energy efficiency as well as possi-bility to recover washwater cooling energy.
3.3.7 Other observations
Exhaust gas exiting the scrubber was fully saturated with wash water. The evapo-ration of the water into the atmosphere was limited due to the wash water cooling system which results in lower exhaust gas outflow temperature. This cool and moist exhaust gas may cause three kinds of problems: poor lift of exhaust gas, a clearly visible plume and acid rain onto deck. In addition, dry sulphate “snow” may land on deck.
The only detected problem was the visible plume which is mainly a cosmetic drawback. The scrubber plume was visible during cold weather and was less clear in summertime (Figure 3-15). Sulphate snow was not detected, only some flakes occasionally. Visible plume problems are normally eliminated by reheating the exhaust gas, which can be recommended, especially when waste heat at a suitable temperature is available on board.
Scrubber noise levels at the top of the chimney were also measured and compared with the original silencer properties (Figure 3-16). This measurement was enabled by a by-pass valve installation in the exhaust gas system. At low frequencies (be-low 100 Hz) and high frequencies (from 1 kHz upwards) noise levels were quite equal with the original exhaust gas system (Wärtsilä, 2010: 20). However, at mid-frequencies the original silencer was more efficient than the scrubber; the low rumble of the running scrubber could be heard on deck.

48 Acta Wasaensia
Figure 3-15. Plume of MT Suula in summer (left) and in late autumn night con-
ditions (Wärtsilä).
Figure 3-16. MT Suula scrubber noise comparison with the original silencer (Wärtsilä).
The scrubber performed well in the dynamic tests (Figure 3-17). When the load of the generator varied between zero and 450 kW (green line), the exhaust gas sul-phur was practically zero (red line). Scrubbing water pH remained stable during the test. The scrubber particle removal capacity was an interesting subject and quite much effort was invested in these measurements. In Suula, two measurement standards were used, ISO 8178 and ISO 9096. The former technique is based on dilution and is valid only for fuels with an up to 0.8% sulphur content (Niemi et al., 2006: 15). As mentioned earlier, particulates are not regulated by marine scrubber legis-lation and this subject is thus beyond the scope of this thesis.

Acta Wasaensia 49
Figure 3-17. MT “Suula” scrubber dynamic test (Wärtsilä).
3.4 Conclusions
The MS Suula marine scrubber was the first certified marine installation in the world. Certification was granted in 2009 based on IMO Resolution MEPC.184(59) requirements by the classification societies Det Norske Veritas and Germanischer Lloyd. The message of the tests was to continue working to-wards commercial scrubber installations. No technical obstacles or other show-stopper problems were encountered.
The most important result of the Suula tests was the high sulphur removal effi-ciency of the tested closed-loop scrubber. Indeed, the scrubber performance was clearly superior to what is required by IMO rules; smaller units would have had sufficient sulphur removal potential. Also the levels of discharges into the sea were below the regulated limits. However, some individual pH and turbidity
Auxiliary engine nr 3 stopped
Load of auxiliary engine nr 3
Wash water pH
CO2 in exhaust gas
SO2 content in exhaust gas (sulphur in fuel)
Auxiliary engine nr 3 loaded alone
Two auxiliary engines loaded
Shaft generator loaded alone
Auxiliary engine nr 3 running without load

50 Acta Wasaensia
measurements were not within the approved range. The main reason for these complications was unsatisfactory system tuning or testing in extreme conditions.
Effluent flow volume depends mainly on engine power, sulphur in fuel and scrubbing water density. These parameters affect also to fresh water consumption. At high densities the flows of both fluids were low, which was a good message, offering the option of long-duration zero-effluent operation. Alkali molar con-sumption compared to sulphur consumption was below 2. Electric power con-sumption was 1.9% of the installed scrubber power. Noise level on board was slightly higher than the noise of the original silencer.
When the next steps in the marine scrubber development were considered, no reasons for not producing a commercial scrubber installation were found. Over the test period many challenges in operating the system automatically were en-countered. In many cases the reason was found to lie in the temporary nature of the scrubber installation. The main components, the scrubber and the venturi, were not originally designed for the Suula auxiliary engine. Scrubber perfor-mance was excellent during auxiliary engine variable loading.
One important lesson learnt concerned the location of the discontinuously running scrubber which should never be outdoors in cold climate. In spite of trace heating, icing problems were detected when the scrubber was out of use for several weeks. The exhaust gas by-pass valve was the most beneficial piece of equipment allow-ing the stopping of the test apparatus without any interruption in the production of ship electric power. The reliability of the by-pass valve was high.
Some of the components required relatively frequent maintenance and a clear call for further scrubber development for the marine environment and uninterrupted running was detected. The plastic scrubber units and piping worked well without any danger of heat structural deformation or corrosion. Neither acid rain nor sul-phate snowing was detected on the deck. The weather conditions during the tests caused no interruptions in the scrubber operation. However, bad weather caused some interruptions in measurement work inside the funnel due to sea sickness.
It should also be noted that the scrubber installation had no effect on diesel engine operation. Electric power production onboard continued in an unchanged manner.

Acta Wasaensia 51 4 COMMERCIAL SCRUBBER INSTALLATION
4.1 MV Containerships VII scrubber introduction
4.1.1 System description
A commercial scrubber system was installed on board container vessel Container-ships VII (Figure 4-1). A closed-loop fresh water scrubber was combined with the vessel’s medium speed main engine burning heavy fuel oil. The maximum con-tinuous output power of the engine was 12.6 MW at a speed of 333 r/min.
Figure 4-1. Container vessel Containerships VII equipped with an exhaust gas scrubber.
The exhaust gas system had no by-pass valve and the gas always flowed through the scrubber whenever the main engine was running. Hot running without wash

52 Acta Wasaensia
water spray was also possible and this running mode allowed saving scrubbing expenses outside the tight sulphur emission control areas. Hot starting scrubbing was not allowed due to the thermal shock caused by cool water being sprayed onto a hot metallic structure.
The principal system installed on board is described in Figure 4-2. The wash wa-ter circulation is depicted with blue lines. Wash water pumps intake water at the bottom of the scrubber unit and spray it back into the scrubber. Some of the water flows through a sea water cooler. Sea water is marked with dark blue colour. New fresh water is added to the system to compensate for evaporation and bleed-off losses (green line). Exhaust gas sulphur is concentrated in the wash water and is removed as a bleed-off flow (violet colour lines) from the scrubber. An alkali feed into the wash water neutralizes the acidic influence of the exhaust gas; this feed into the system is indicated with red colour. Bleed-off is treated to clean effluent (tan colour) and sludge (black lines). Sludge is stored in a tank and effluent is either pumped into the sea or stored in a holding tank during zero effluent running mode.
Figure 4-2. General operational principle of closed-loop scrubber system (Wärtsilä).

Acta Wasaensia 53 4.1.2 General arrangement
The location of the main scrubber components is shown in Figure 4-3. Most of the wash water system components were arranged in a separate scrubber block behind the original funnel. The equipment container on deck contained bleed-off system components, automation, a buffer tank and a holding tank. The sea water system including heat exchangers and a cooling water pump was installed above the ship double bottom. Alkali and fresh water tanks were modified from the orig-inal ship hull tanks. The scrubber main control station was located in the engine control room.
Figure 4-3. Main components of Containerships VII scrubber system (Wärt-silä).

54 Acta Wasaensia
4.2 Scope of tests
Marpol tests (verification of the system performance as specified by IMO Resolu-tion MEPC.184(59)) were carried out by the accredited testing laboratory T062 of Pöyry Finland Oy (accreditation requirement SFS-EN ISO/IEC 17025) from 18 to 20 September, 2013 (Pöyry, 2013). The company is accredited by the Finnish Accreditation Service and it fulfils the requirements of standard SFS-EN ISO/IEC 17025 for emission tests. During the tests, the ship sailed from Helsinki, Finland, to Teesport, UK. Two different quality fuels were used; high-sulphur fuel con-taining 2.83% sulphur and low-sulphur fuel with a 1.12% sulphur content.
Exhaust gas emissions were measured simultaneously before and after the scrub-ber. The testing practices were based on the Amendments to the Technical Code on Control of Emission of Nitrogen Oxides from Marine Diesel Engines (NOx Technical Code 2008), Chapter 5 (IMO, 2008c), and Appendices and Guidelines of paragraph 6 of IMO Resolution MEPC.184(59). During the tests effluent water was sampled for later laboratory analyses, and also the fuels burnt in the main engine were sampled.
Exhaust gas composition was measured focusing on concentrations of sulphur dioxide (SO2), carbon monoxide (CO), carbon dioxide (CO2), nitrogen oxides (NOx) and oxygen (O2). Also physical parameters (gas flow, temperature and moisture content) were recorded. Gas emission tests were executed by using the test equipment and methods summarized in Table 4-1. Effluent water was studied in a laboratory onshore for the content of polyaromatic hydrocarbons (PAH, method 8310) and for pH, turbidity, oil (oil hydrocarbon fractions C11-C39), ni-trate, nitrite, cadmium, copper, nickel, lead, zinc, arsenic, chromium and vanadi-um determination. Also fuel samples were analysed to determine the carbon, hy-drogen, nitrogen, sulphur, and oxygen contents. Moreover, lower heating values, ash contents and moistures of fuels were determined.
The scrubber automation system continuously logged system data. This data was used for long-term analyses of scrubber operation. The information obtained was typically helpful in the evaluation of design parameters, for understanding scrub-ber-ship interaction, and when estimating system usability and reliability. Fur-thermore, based on the information the scrubber operational costs could be esti-mated.
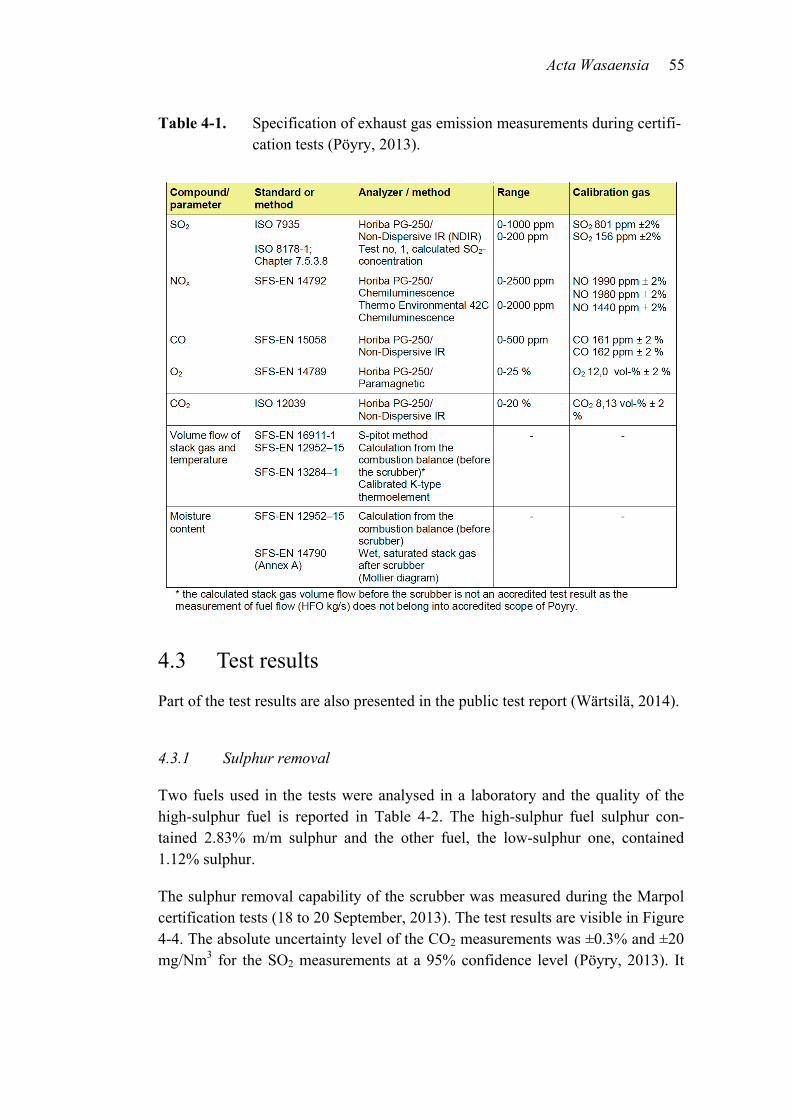
Acta Wasaensia 55 Table 4-1. Specification of exhaust gas emission measurements during certifi-
cation tests (Pöyry, 2013).
4.3 Test results
Part of the test results are also presented in the public test report (Wärtsilä, 2014).
4.3.1 Sulphur removal
Two fuels used in the tests were analysed in a laboratory and the quality of the high-sulphur fuel is reported in Table 4-2. The high-sulphur fuel sulphur con-tained 2.83% m/m sulphur and the other fuel, the low-sulphur one, contained 1.12% sulphur.
The sulphur removal capability of the scrubber was measured during the Marpol certification tests (18 to 20 September, 2013). The test results are visible in Figure 4-4. The absolute uncertainty level of the CO2 measurements was ±0.3% and ±20 mg/Nm3 for the SO2 measurements at a 95% confidence level (Pöyry, 2013). It

56 Acta Wasaensia
can be seen that the sulphur content in outgoing exhaust gas was minimal (brown line) compared to the maximum allowed level (red line). The indicated limit is valid within ECA areas since the year 2015. The scrubber cleaning capacity is slightly reduced with increasing engine power. The relative efficiency of the Con-tainerships VII scrubber was above 99% (light blue line). Relative efficiency re-fers to the amount of sulphur removed from the exhaust by the scrubber compared with the original sulphur content.
Table 4-2. Specification of high-sulphur test fuel.
The Containerships VII measurements in normal operation between Södertälje and Riga (28.4.2012-5.5.2012) also indicate excellent sulphur removal perfor-mance (Figure 4-5). When the fuel sulphur content varied from 2.16 to 2.31% m/m practically no sulphur remained in the exhaust gas at 85% engine power. The
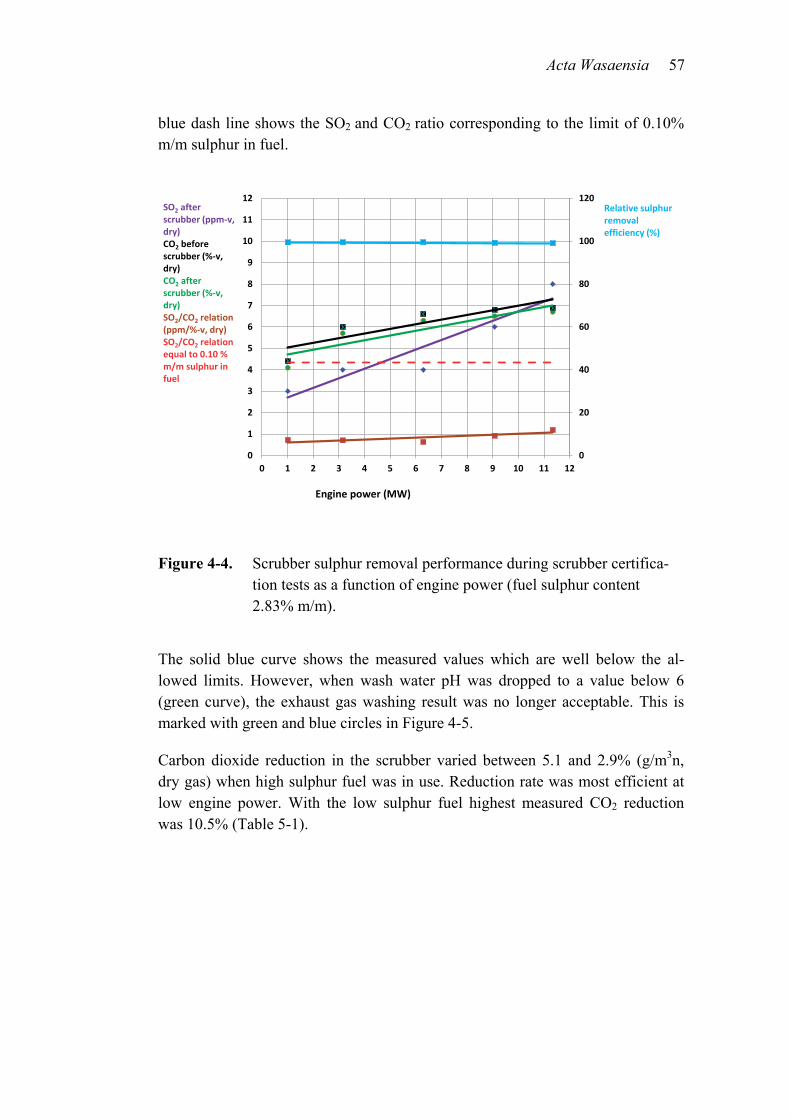
Acta Wasaensia 57 blue dash line shows the SO2 and CO2 ratio corresponding to the limit of 0.10% m/m sulphur in fuel.
Figure 4-4. Scrubber sulphur removal performance during scrubber certifica-tion tests as a function of engine power (fuel sulphur content 2.83% m/m).
The solid blue curve shows the measured values which are well below the al-lowed limits. However, when wash water pH was dropped to a value below 6 (green curve), the exhaust gas washing result was no longer acceptable. This is marked with green and blue circles in Figure 4-5.
Carbon dioxide reduction in the scrubber varied between 5.1 and 2.9% (g/m3n, dry gas) when high sulphur fuel was in use. Reduction rate was most efficient at low engine power. With the low sulphur fuel highest measured CO2 reduction was 10.5% (Table 5-1).
0
20
40
60
80
100
120
0
1
2
3
4
5
6
7
8
9
10
11
12
0 1 2 3 4 5 6 7 8 9 10 11 12
Engine power (MW)
SO2 after scrubber (ppm-v, dry)CO2 before scrubber (%-v, dry)CO2 after scrubber (%-v, dry)SO2/CO2 relation (ppm/%-v, dry)SO2/CO2 relation equal to 0.10 % m/m sulphur in fuel
Relative sulphur removal efficiency (%)

58 Acta Wasaensia
Figure 4-5. Atmospheric emissions of Containerships VII scrubber between Södertälje and Riga.
4.3.2 Alkali consumption
In the closed-loop scrubber alkali is consumed when wash water and also effluent are neutralized. Alkali flow to scrubber was measured during the certification tests on board Containerships VII and the measured consumption as a mass of 100% alkali per time and power is shown in Figure 4-6. During the tests, wash water pH at the scrubber inlet varied between 6.5 and 6.6 as shown by the green curve. Alkali flow was measured with two fuels containing 2.83 (% - m) and 1.12 (% - m) sulphur in fuel.
The specific alkali consumption was high at low loads. This can be explained by higher specific fuel consumption, as indicated by the black line. To save fuel and alkali, the ship engine should not be loaded below one third of the maximum en-gine power. Alkali and fuel specific consumptions are provided in numerical for-mat in Table 4-3. Based on the Table, it can be concluded that the alkali-fuel ratio is quite constant and relative to the fuel sulphur content.
0
10
20
30
40
50
60
70
80
0
1
2
3
4
5
6
7
8
0 20 40 60 80 100 120 140 160Time (hours)
0.1 % Sulphur in fuel limit255 per. Mov. Avg. (FE701 - Fuel flow [ton/h])225 per. Mov. Avg. (QIC203 - Scrubbing water pH)225 per. Mov. Avg. (QIC102 - SO2 concentration scrubber outlet [ppm])225 per. Mov. Avg. (QIC104 - CO2 concentration scrubber outlet [ppt])225 per. Mov. Avg. (SO2/CO2-ratio)
Klaipeda Teesport Sheerness Gent
Fuel flow (ton/h)Scrubbing water pH
SO2 (ppm)CO2 (ppt)SO2/CO2 ratio

Acta Wasaensia 59
Figure 4-6. Containerships VII scrubber alkali consumption as measured dur-
ing certification tests.
Table 4-3. Alkali (100%) consumption compared with fuel consumption.
Fuel sulphur content 2.83% m/m
Engine power (MW) 1.0 3.2 6.3 9.1 11.3
Engine power (%) 8 25 50 72 90
Alkali consumption (kg/MWh) 28 20 14 12 12
Fuel consumption (kg/MWh) 400 250 200 200 190
Alkali-fuel ratio 1:14 1:13 1:14 1:16 1:16
Fuel sulphur content 1.12% m/m
Engine power (MW) 1.3 3.2 6.3 9.5 11.1
Engine power (%) 10 25 50 75 88
Alkali consumption (kg/MWh) 11.5 6.8 5.8 5.5 6.4
Fuel consumption (kg/MWh) 380 240 210 190 200
Alkali-fuel ratio 1:33 1:35 1:36 1:35 1:30
Alkali consumption was also studied when the ship sailed from Södertälje to Ri-ga. In Figure 4-7, the zero values in the line graphs are the result of port calls
150
200
250
300
350
400
450
0
5
10
15
20
25
30
0 2 4 6 8 10 12
Alkali flow to scrubber,2.83 % sulphur in fuel(kg/MWh)Alkali flow to scrubber,1.12 % sulphur in fuel(kg/MWh)Scrubbing water pH
Fuel specific consumption(kg/MWh), secondary axes

60 Acta Wasaensia
whereby the scrubber was stopped (Klaipeda, Teesport, Sheerness and Gent). The 50% m/m alkali specific consumption as litres per engine power and per fuel sul-phur content gives a result of 6 litres per MWh at pH 6.8 in washwater which is indicated by the orange line. This result can be transformed into a molar relation (purple line in Figure 4-7) which is approximately 1.9 caustic soda molecules per 1 sulphur molecule. The theoretical value is 2 when only sodium sulphate is pro-duced from alkali and sulphur dioxide. By comparison, the MV Tor Ficaria scrubber consumed on average 1.75 moles of alkali per 1 mole of sulphur (Han-sen, 2012: 15).
Figure 4-7. Containerships VII scrubber alkali consumption on the Södertälje – Riga route.
4.3.3 Fresh water consumption
As is the case with scrubber chemicals, also the fresh water consumption should be minimized or even eliminated with the additional water which enters the scrubber as a result of fuel combustion and also the combustion air itself is hu-mid. Exhaust gas outflow from the scrubber is fully saturated and three interesting water flow options can be studied. In the first option the fresh water feed volume is greater than that of the bleed-off flow. The second option is the opposite. In the last option, no fresh water feed is needed. Extra water entering the scrubber must be dealt with by increased effluent flow or by more efficient evaporation inside
-2
0
2
4
6
8
10
0
200
400
600
800
1000
1200
0 20 40 60 80 100 120 140 160Time (hours)
Klaipeda Teesport Sheernes Gent
Scrubbing water pHAlkali flow (l/MWh/sulphur %)Fuel flow (ton/h)Sulphur-alkali molar ratio
Scrubbing water density (kg/m3)Alkali flow (l/h)

Acta Wasaensia 61 the scrubber due to elevated operating temperature. Fresh water feed and bleed-off production should be minimal. In optimal case clean water in the bleed-off can be separated and circulated back to the scrubber.
Figure 4-8 shows the measured water balance of Containerships VII during the certification tests. Exhaust gas temperature measurements showed very limited variance between high-sulphur and low-sulphur fuels. Therefore only the high-sulphur results of exhaust gas temperature is shown. Consequently, the exhaust gas flow curve is also drawn only for high-sulphur fuel.
Figure 4-8. Containerships VII scrubber water balance (water content in out-flowing exhaust gas minus water content in entering exhaust gas).
Water balance in the Figure is positive if the exhaust gas water outflow is higher than the fresh water feed to the scrubber. The accuracy of water content determi-nation in exhaust gas was poor which affects to the results (purple and green curves). However, some conclusions can be drawn: • In general, the scrubber washwater cooling capacity has conclusive signifi-
cance for water consumption. The Containerships VII scrubber water balance was positive if outflowing gas was cooler than 35 °C (high-sulphur fuel).
• Another essential parameter affecting water balance is the exhaust gas flow. The higher the engine power is, the more exhaust gas flows into the scrubber
-0,25
-0,20
-0,15
-0,10
-0,05
0,00
0,05
0,10
0,15
0,20
0,25
0
5
10
15
20
25
30
35
40
45
50
0 1 2 3 4 5 6 7 8 9 10 11 12
Engine power (MW)
Exhaust gas temperature (°C), scrubber outlet, high sulphur fuelExhaust gas flow (nm3/s), dry, high sulphur fuel
Scrubber water balance (kg/s), high sulphur fuelScrubber water balance (kg/s), low sulphur fuel

62 Acta Wasaensia
(yellow line) which imports more water as long as the scrubber temperature does not increase.
If the ship is sailing in water areas where sea water temperature is around 30 °C, it may be difficult to arrange efficient cooling and the risk of high water con-sumption grows. On the other hand, the combustion air humidity may be high, especially in tropical conditions. Humid combustion air reduces water consump-tion in the scrubber. Based on the measurement, the most water from exhaust was produced when the engine power varied between 50% and 70% and the measured maximum values varied between 470 kg/h and 720 kg/h.
Once again, the Södertälje-Riga route was studied with the ship sailing at 85% power. In Figure 4-9, the bleed-off flow from the system (blue curve) has higher values than the make-up flow (fresh water feed) to the scrubber (red curve); the rest of the consumed water enters the system in the exhaust gas.
Figure 4-9. Containerships VII scrubber make-up water consumption and bleed-off flow when sailing from Södertälje to Riga.
Make-up flow is needed to maintain the correct water level in the scrubber. If minimum water consumption is aimed at, bleed-off flow should be reduced. This can be seen on the right in Figure 4-9 where the make-up water feed is near zero (red curve). It can be further estimated that at a washwater density of around 1200
0
500
1000
1500
2000
2500
0 20 40 60 80 100 120 140 160
Time (hours)
Klaipeda Teesport Sheerness Gent
Scrubbing water density (kg/m3)Make-up water flow (l/h)Bleed-off flow (l/h)Fuel flow (kg/h)

Acta Wasaensia 63 kg/m3, no external water feed is needed with 85% engine power, 20 °C sea water temperature and 2.2 -2.3% fuel sulphur content. In that operational point scrubber is not anymore a “fresh water scrubber” since it does not consume fresh water.
4.3.4 Bleed-off
Bleed-off flow transports sulphur out of the scrubber and therefore at least mini-mum flow is always needed to keep washwater density at the pre-set value. In the case depicted in Figure 4-10, bleed-off flow from the scrubber is visualised when the sulphur flow to the scrubber in exhaust gas was 47 kg/h. As can be expected, the flow correlated almost linearly with engine power and the relation between the bleed-off flow and the sulphur feed was constant as a function of engine pow-er.
Figure 4-10. Containerships VII scrubber bleed-off flow during Marpol tests.
0,0
0,1
0,2
0,3
0,4
0,5
0,6
0,7
0
10
20
30
40
50
60
70
0 2 4 6 8 10 12
Bleed-off discharge flow per sulphur flow in fuel (l/kg), low sulphur fuelBleed-off discharge flow per sulphur flow in fuel (l/kg), high sulphur fuel
Bleed-offdischarge flow (l/s), high sulphur fuelBleed-off discharge flow (l/s), low sulphur fuel

64 Acta Wasaensia
4.3.5 Effluent
During the high-sulphur fuel Marpol tests, effluent pH varied between 6.7 and 7 which was an acceptable result, well above the minimum 6.5 (Figure 4-11). The other important parameter, turbidity, had a fluctuation range between 24 and 5 FNU. These values are also below the allowed highest limit of 25 FNU. In this context it should be noted that turbidity limits do not interface with effluent flow and therefore closed-loop scrubbers with reduced outflows suffer unreasonably from regulation.
The amount of polycyclic aromatic hydrocarbons (phenanthrene) varied within a range from 0.78 to 1.74 µg/l. With the effluent flow during the tests the maximum PAHphen equivalence based on IMO rules could have been 2250 µg/l. PAHphen equivalence is an unclear parameter not specified in the rules. In Figure 4-11 only phenanthrene is included.
The last Marpol parameter for effluent to be analysed was nitrate which has to be beyond 60 mg/l normalized for a wash water discharge rate of 45 tons/MWh. In the case of Containerships VII, the discharge rate was between 0.1 and 0.4 tons/MWh and the maximum nitrate limit for the highest flow was 6 g/l. Contain-erships VII was below the limit by a large margin. The other criterion for nitrates requires effluent to remain below 12% of nitrogen oxides in exhaust gas. Here, the maximum nitrate content in the effluent was less than 0.4% of the content of nitrogen oxides in exhaust gas. As a conclusion, the effluent parameters met the quality requirements of the IMO regulation. The original bleed-off treatment sys-tem was improved and partly rebuilt during the commissioning period.

Acta Wasaensia 65
Figure 4-11. Containerships VII scrubber effluent quality during high-sulphur fuel Marpol tests.
4.3.6 Energy consumption
Most of the scrubber system electrical power is not main engine load dependent which means higher relative energy consumption during ship slow steaming. In the case of retrofit installations like Containerships VII, energy consumption may be critical for the scrubber installation if free auxiliary power reserves are mini-mal.
Actual electric power consumption was measured on board Containerships VII and the results of these measurements are depicted in Figure 4-12. As shown, scrubbing water pumping energy is the main consumer with a 66% proportion. The sea water cooling pump consumes one third of the scrubbing power. In addi-tion to pumping power, electrical trace heating also has some importance. Minor consumers not shown in Figure 4-12 spend 5% of the electric power. The energy needed for fresh water evaporation and water feed into the scrubber was not in-cluded in the calculations and indeed it is debatable whether such components are part of the scrubber system. In regular line traffic fresh water can be bunkered also in port.
0,0
0,2
0,4
0,6
0,8
1,0
1,2
1,4
1,6
1,8
2,0
0
6
12
18
24
30
0 2 4 6 8 10 12
Discharge pHlimit
Dischargeturbidity limit(FNU)
PAH (Phenanthrene, µg/l)
Discharge pH
Discharge turbidity (FNU)

66 Acta Wasaensia
If the thermal oil heating system of the ship is not available for the heating needs of the scrubber system, electricity consumption may constitute a heavy load for the ship generators. In Containerships VII, electricity consumption was 0.7% and the total pumping energy 0.6% of the main engine maximum continuous power.
Figure 4-12. MV Containerships VII electricity consumption during sporadic measurements on 77% main engine load.
By comparison, the sea water feed pump (180 kW) installed on board MV Tor Ficaria consumed 1% of the main engine power at the most. Sea water spray in-creased back pressure by 300 Pa in the exhaust gas system resulting in roughly 0.4% more energy consumption in the main engine (Hansen, 2012: 16). Based on that information, closed-loop scrubber electricity consumption was clearly lower than that of a sea water scrubber.
If energy consumption needs to be optimized, special attention should be paid to the scrubbing water pump energy efficiency and the flow resistance of the piping. Based on experience from MT Suula, a reduction in scrubbing water flow from nominal set point may not remarkably weaken the sulphur removal efficiency and therefore the installation of pump motor frequency converters and separate quench sprays prior to scrubber should be considered. Also continuous electricity consumption meters in the scrubber installation would facilitate the monitoring of energy efficiency during operation.
Total power: 86,7 kW
Trace heating & ventilation: 5,5 kW
Bleed-off treatment unit: 2,3 kW
Scrubbing water pump (1): 29,1 kW
Scrubbing water pump (2): 27,9 kW
Aeration blower:3,0 kW
Sea water pump: 14,2 kW
Electricity consumption
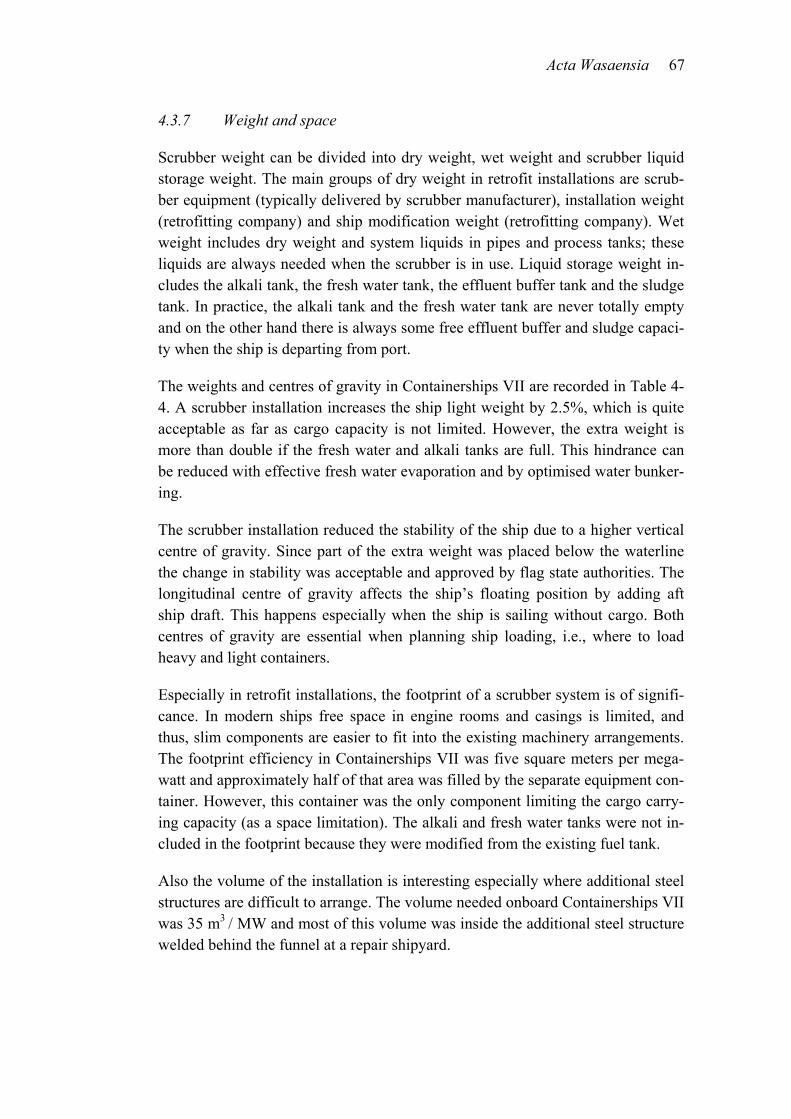
Acta Wasaensia 67 4.3.7 Weight and space
Scrubber weight can be divided into dry weight, wet weight and scrubber liquid storage weight. The main groups of dry weight in retrofit installations are scrub-ber equipment (typically delivered by scrubber manufacturer), installation weight (retrofitting company) and ship modification weight (retrofitting company). Wet weight includes dry weight and system liquids in pipes and process tanks; these liquids are always needed when the scrubber is in use. Liquid storage weight in-cludes the alkali tank, the fresh water tank, the effluent buffer tank and the sludge tank. In practice, the alkali tank and the fresh water tank are never totally empty and on the other hand there is always some free effluent buffer and sludge capaci-ty when the ship is departing from port.
The weights and centres of gravity in Containerships VII are recorded in Table 4-4. A scrubber installation increases the ship light weight by 2.5%, which is quite acceptable as far as cargo capacity is not limited. However, the extra weight is more than double if the fresh water and alkali tanks are full. This hindrance can be reduced with effective fresh water evaporation and by optimised water bunker-ing.
The scrubber installation reduced the stability of the ship due to a higher vertical centre of gravity. Since part of the extra weight was placed below the waterline the change in stability was acceptable and approved by flag state authorities. The longitudinal centre of gravity affects the ship’s floating position by adding aft ship draft. This happens especially when the ship is sailing without cargo. Both centres of gravity are essential when planning ship loading, i.e., where to load heavy and light containers.
Especially in retrofit installations, the footprint of a scrubber system is of signifi-cance. In modern ships free space in engine rooms and casings is limited, and thus, slim components are easier to fit into the existing machinery arrangements. The footprint efficiency in Containerships VII was five square meters per mega-watt and approximately half of that area was filled by the separate equipment con-tainer. However, this container was the only component limiting the cargo carry-ing capacity (as a space limitation). The alkali and fresh water tanks were not in-cluded in the footprint because they were modified from the existing fuel tank.
Also the volume of the installation is interesting especially where additional steel structures are difficult to arrange. The volume needed onboard Containerships VII was 35 m3 / MW and most of this volume was inside the additional steel structure welded behind the funnel at a repair shipyard.

68 Acta Wasaensia
Table 4-4. Scrubber installation induced changes in weight and centres of gravity in percentages compared with original ship (light weight).
Weight group Weight change
Vertical centre of gravity
change from baseline
Longitudinal centre of gravity change from aft
perpendicular
Scrubber installation +2.5% +2.7% -1.8%
Scrubber installation and 10% fresh water and alkali storages
+2.9% +2.5% -1.8%
Scrubber installation and 100% fresh water and alkali storages
+6.3% +1.4% -2.0%
4.4 Conclusions
The tests executed on board Containerships VII confirmed that a closed-loop scrubber system efficiently removes the sulphur from the exhaust gas. The main result of the tests was that the scrubber works in full-scale operation and fulfils ECA requirements. Effluent quality and as well as quantity passed the limits set in IMO scrubber guidelines.
The most challenging part of the project was the development of the bleed-off treatment system which exploited flotation technology to remove impurities from the bleed-off. In future, more development work will be needed in this field (wa-ter treatment) and alternative technologies should be tested. A main objective for further development is to achieve improvement in the effluent issue more exactly in effluent turbidity and sludge volume. Tests indicated that fresh water consump-tion can be minimized, as can effluent production. This opens positive views for continuous zero-effluent solutions without any sea water pollution.
Energy consumption was well below 1% of the installed main engine power, which is a low value. During the certification tests, the scrubber reduced exhaust gas carbon dioxide emissions by between 2.9 and 10.5% m/m (dry gas).
The scrubber installation had an effect on the ship weight and centre of gravity. However, these issues did not become threshold issues for the project. The ship stability analysis was accepted by the authorities. Some cargo capacity had to be

Acta Wasaensia 69 reserved for the scrubber auxiliary systems since part of the equipment was locat-ed in a special container on the cargo deck.
The duration of the retrofit installation process should be speeded up in future retrofit projects. This is possible by utilising the pioneer installation experiences and by improving the process itself. The scrubbers in use are data recording plat-forms and earlier experiences combined with new data should be utilized effi-ciently in future scrubber installations.

70 Acta Wasaensia
5 COMPARISON OF EMISSIONS AND DISCHARGES OF SOX REDUCTION ALTERNATIVES
When an exhaust gas scrubber ship installation is estimated from different per-spectives, one important viewpoint is the scrubber environmental load. In this chapter the burning of heavy fuel oil combined with an exhaust gas scrubber is compared with marine gas oil ship emissions on the basis of information from MT Suula and MV Containerships VII. Marine gas oil is produced in refineries and as a basic assumption, part of the refinery emissions are included in the envi-ronmental load of a gas oil burning ship. Heavy fuel oil is seen as an unwanted by-product. Lubrication oil used in diesel engines also participates in the burning process but due to minor volume it is not included in the calculations.
Figure 5-1 shows the flow of substances in the combustion process combined with exhaust gas fresh water scrubbing. As regards pollution caused by the pro-cess, the atmosphere is mainly burdened by exhaust gas. In addition, sludge sepa-rated from scrubber bleed-off is typically destroyed in the processes of waste treatment plants on land. The lower water content in sludge is the more attractive product sludge is for the treatment plant processes.
Effluent is typically pumped into the sea. Oceans resist effluent pumping out of ships better than limited water basins such as inland waters, estuaries and river basins. The zero effluent mode of the scrubber, if available in the system, should be used inside these sensitive water areas. Effluent is efficiently diluted into the water when the ship is moving. It is estimated that a dilution of 1:2 000 is achieved 50 meters after the ships’ stern (Niemi et al., 2006: 21).
Alternative effluent technologies such as pumping into municipal sewage systems or effluent water recirculation onboard should be considered. Municipal sewage systems can be used if the effluent quality fulfils the local acceptance criteria; the challenge is typically the high metal and sulphate concentration.
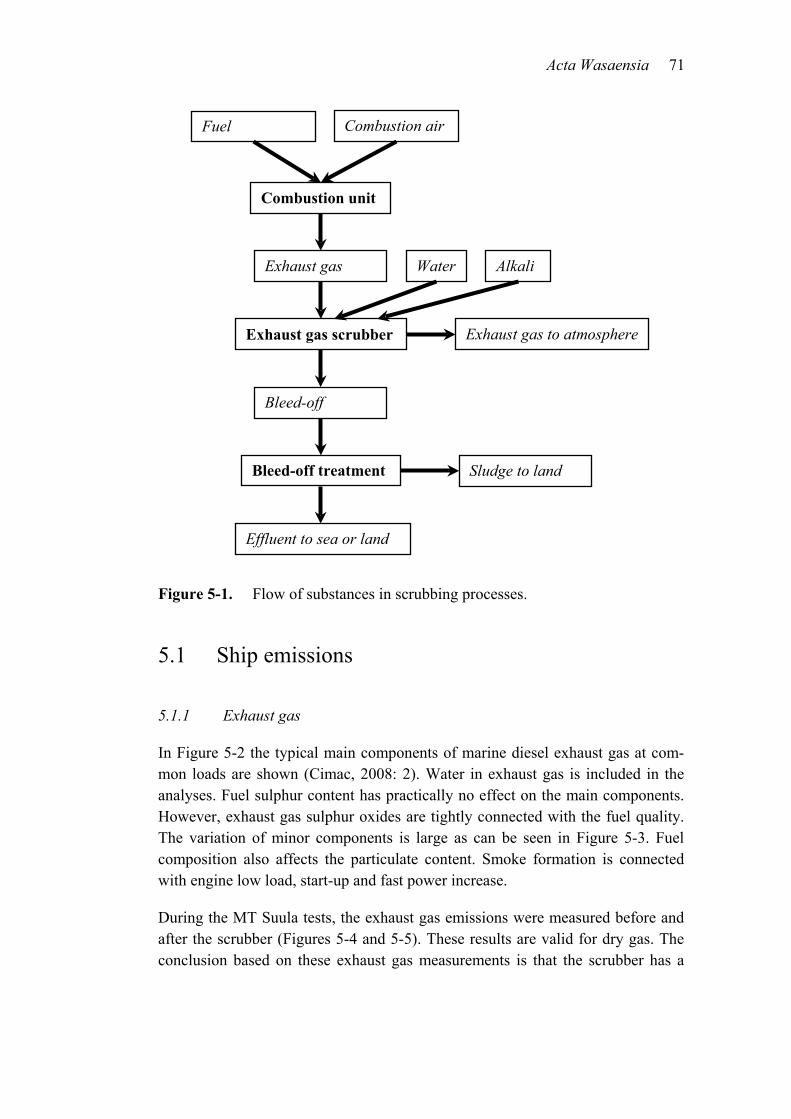
Acta Wasaensia 71
Figure 5-1. Flow of substances in scrubbing processes.
5.1 Ship emissions
5.1.1 Exhaust gas
In Figure 5-2 the typical main components of marine diesel exhaust gas at com-mon loads are shown (Cimac, 2008: 2). Water in exhaust gas is included in the analyses. Fuel sulphur content has practically no effect on the main components. However, exhaust gas sulphur oxides are tightly connected with the fuel quality. The variation of minor components is large as can be seen in Figure 5-3. Fuel composition also affects the particulate content. Smoke formation is connected with engine low load, start-up and fast power increase.
During the MT Suula tests, the exhaust gas emissions were measured before and after the scrubber (Figures 5-4 and 5-5). These results are valid for dry gas. The conclusion based on these exhaust gas measurements is that the scrubber has a
Combustion air Fuel
Combustion unit
Exhaust gas
Exhaust gas scrubber Exhaust gas to atmosphere
Water Alkali
Bleed-off
Bleed-off treatment Sludge to land
Effluent to sea or land

72 Acta Wasaensia
minor effect on the oxygen, carbon dioxide and nitrogen oxide contents in ex-haust gas. On the other hand, sulphur dioxide could be removed effectively; as discussed in Chapter 4, the exhaust gas contained practically zero sulphur after the scrubber. The ratio of sulphur dioxide and carbon dioxide is a calculated val-ue. The fuel sulphur content in the test was 1.47-3.39% m/m.
Figure 5-2. Typical volume-based main component composition of diesel en-gine exhaust gas (CIMAC).
The maximum scrubber emissions to the atmosphere are regulated by the IMO. The only parameter to be monitored is the ratio of sulphur dioxide (ppm-vol) and carbon dioxide (%-vol). Fuel containing 0.10% m/m sulphur corresponds to value 4.3 and 0.50% m/m sulphur fuel has a value of 21.4. The measurements on board MT Suula indicated that oxygen levels were within CIMAC variation. However, the maximum carbon dioxide readings (7%-vol) were slightly above the highest CIMAC values (6.5%-vol). CIMAC values are for wet gas which probably ex-plains the difference. The highest nitrogen oxide and sulphur dioxide values were within CIMAC variation; however, very low NOx readings were measured during the tests.

Acta Wasaensia 73
Figure 5-3. Typical volume-based minor component composition of diesel engine exhaust gas (CIMAC).
Carbon dioxide reduction in scrubbers is expected to vary between 3 and 8% in closed-loop scrubbers (Reynolds, 2011). The Suula test results do not indicate such a clear reduction. As mass instead of volume Suula results are shown in Ta-ble 5-1. Opposite results were measured during Containerships VII tests which show carbon dioxide reduction in each measured point as discussed earlier. The reason for this difference might be variation in washwater alkalinity. Better car-bon dioxide capture may be reached with higher pH. However, this unclear issue should be studied further.
As a conclusion, the exhaust gas qualities of heavy fuel oil and gas oil were prac-tically equal when a scrubber was used. From this viewpoint, there is no need to compare the environmental impact of scrubber ship and gas oil ship exhaust gas. Particulates in exhaust gas are not considered here.

74 Acta Wasaensia
Figure 5-4. Pre-and post-scrubber oxygen and carbon dioxide content in ex-haust gas onboard MT Suula (Tikka et Lipponen, 2009, Juuti et Lipponen, 2010).
Figure 5-5. Nitrogen oxide and sulphur dioxide content in exhaust gas before and after the MT Suula scrubber (Tikka et Lipponen, 2009, Juuti et Lipponen, 2010).
369

Acta Wasaensia 75 Table 5-1. Measured exhaust gas carbon dioxide reduction in Suula (Tikka et
Lipponen, 2009) and Containerships VII (Pöyry, 2013).
Suula Scrubber nominal load (%) 8 40 70 100
Fuel sulphur content (% m/m) 1.5 1.5 1.5 1.5
Carbon dioxide content in exhaust gas before scrubber (g/m3n, dry) 93.4 116.6 126.6 132.4
Carbon dioxide content in exhaust gas after scrubber (g/m3n, dry) 92.9 120.1 128.5 130.4
Carbon dioxide reduction (%) 0.5 -3.4 -1.5 -1.5
Scrubber nominal load (%) 8 40 70 100
Fuel sulphur content (% m/m) 3.3 3.3 3.3 3.3
Carbon dioxide content in exhaust gas before scrubber (g/m3n, dry) 89.0 116.6 130.4 130.4
Carbon dioxide content in exhaust gas after scrubber (g/m3n, dry) 90.9 118.6 126.5 132.5
Carbon dioxide reduction (%) -2.1 -1.7 3.0 -1.6
Containerships VII
Engine load (%) 8 25 50 72 90
Fuel sulphur content (% m/m) 2.83 2.83 2.83 2.83 2.83
Carbon dioxide content in exhaust gas before scrubber (g/m3n, dry) 86 118 130 133 136
Carbon dioxide content in exhaust gas after scrubber (g/m3n, dry) 82 112 125 129 132
Carbon dioxide reduction (%) 4.7 5.1 3.8 2.9 2.9
Scrubber load (%) 8 25 50 75 88
Fuel sulphur content (% m/m) 1.12 1.12 1.12 1.12 1.12
Carbon dioxide content in exhaust gas before scrubber (g/m3n, dry) 95 115 127 131 134
Carbon dioxide content in exhaust gas after scrubber (g/m3n, dry) 85 107 120 124 128
Carbon dioxide reduction (%) 10.5 7.0 5.5 5.3 4.5

76 Acta Wasaensia
5.1.2 Effluent
Based on the IMO regulation the monitored parameters of discharge water are pH, concentration of polycyclic aromatic hydrocarbons (PAH), turbidity and tem-perature. More precisely, the PAH concentration is specified as PAHphe which stands for PAH phenanthrene equivalence. However, as said earlier, no exact def-inition of this phenanthrene equivalence is provided in the guidelines. The Ex-haust Gas Cleaning Systems Association (EGCSA, 2012: 145) proposes using the phenanthrene calibration point of ultraviolet light instruments for PAH indication. The reason for this would be the difficulty of measuring individual PAH com-pounds with online instruments. Based on the Suula experience and Container-ships VII measurements (Table 3-6 and Chapter 4.3.5), this discussion remains somewhat irrelevant since the measured PAH values (only phenanthrene concen-trations included) could have been multiplied by 170 without exceeding the limit.
The chemical oxygen demand of waste water is not limited. Oxygen is typically consumed when effluent sulphites are converted to sulphates. If effluent is pro-cessed with air feed in the effluent treatment unit – which is typical in flotation based processes – the quality of the effluent is improved and the oxygen con-sumption in sea water is reduced.
By comparison, effluent parameters measured for MV Ficaria Seaways (Kjölholt et al., 2012) are shown in Table 5-2. This scrubber was a hybrid model allowing running both in sea and fresh water mode. In sea water mode, alkali feed is not used and acid neutralisation is seen to by large sea water volumes flowing through the scrubber. The measured pH was below 6.5 but the rules allow the measurement point to be 4 m from the discharge outlet. This extra distance allows acidic discharge to mix with sea water resulting in a pH increase to an acceptable level.
The concentration of polycyclic aromatic hydrocarbons (PAH) in outflowing seawater effluent was acceptable. The measurement result in Table 5-2 follows the Method 8310 (16 USEPA) were the concentrations of sixteen different PAHs are studied, one being phenathrene. PAH limits are connected to effluent flow and lower margins are a result of running the scrubber in sea water mode.
When fresh water mode was applied, the control of pH with alkali was quite straightforward compared with high-volume flows of sea water through the scrubber. Ficaria Seaways had similar large margins in PAH concentration to Suula and Containerships VII. Reduced bleed-off flow from closed-loop scrub-bers enables the installation of efficient and reasonable size water treatment units
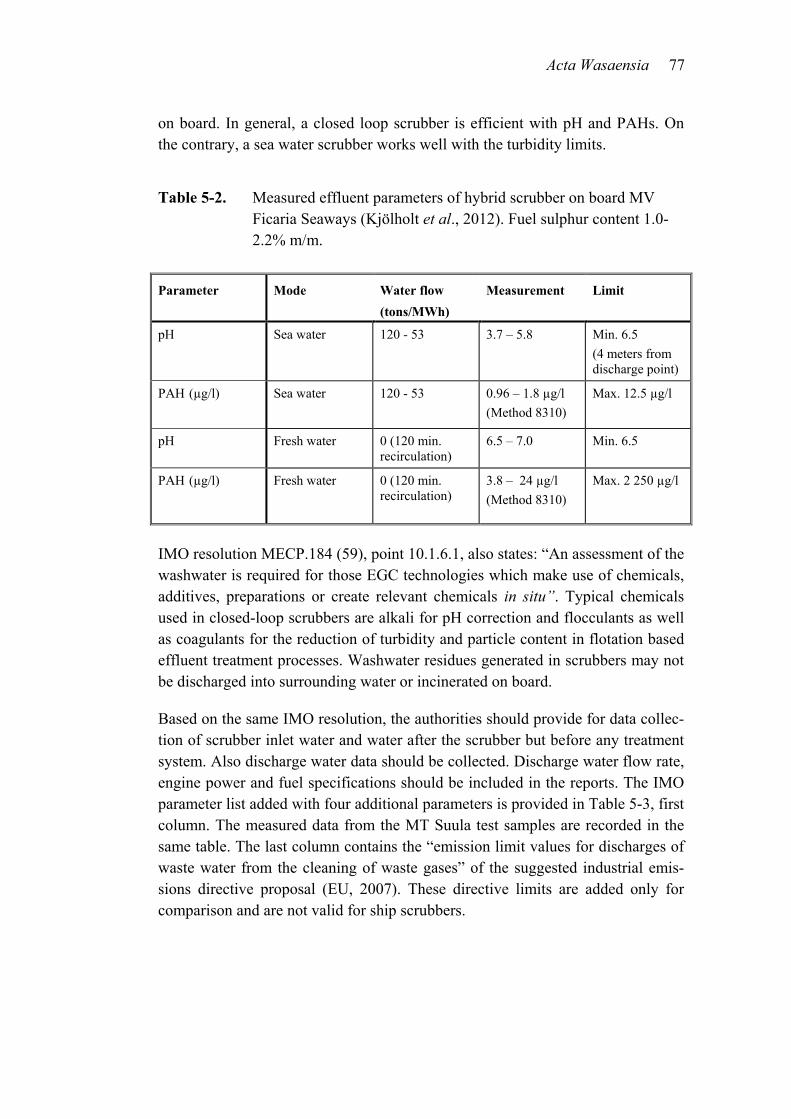
Acta Wasaensia 77 on board. In general, a closed loop scrubber is efficient with pH and PAHs. On the contrary, a sea water scrubber works well with the turbidity limits.
Table 5-2. Measured effluent parameters of hybrid scrubber on board MV Ficaria Seaways (Kjölholt et al., 2012). Fuel sulphur content 1.0-2.2% m/m.
Parameter Mode Water flow (tons/MWh)
Measurement Limit
pH Sea water 120 - 53
3.7 – 5.8 Min. 6.5 (4 meters from discharge point)
PAH (µg/l) Sea water 120 - 53 0.96 – 1.8 µg/l (Method 8310)
Max. 12.5 µg/l
pH Fresh water 0 (120 min. recirculation)
6.5 – 7.0 Min. 6.5
PAH (µg/l) Fresh water 0 (120 min. recirculation)
3.8 – 24 µg/l (Method 8310)
Max. 2 250 µg/l
IMO resolution MECP.184 (59), point 10.1.6.1, also states: “An assessment of the washwater is required for those EGC technologies which make use of chemicals, additives, preparations or create relevant chemicals in situ”. Typical chemicals used in closed-loop scrubbers are alkali for pH correction and flocculants as well as coagulants for the reduction of turbidity and particle content in flotation based effluent treatment processes. Washwater residues generated in scrubbers may not be discharged into surrounding water or incinerated on board.
Based on the same IMO resolution, the authorities should provide for data collec-tion of scrubber inlet water and water after the scrubber but before any treatment system. Also discharge water data should be collected. Discharge water flow rate, engine power and fuel specifications should be included in the reports. The IMO parameter list added with four additional parameters is provided in Table 5-3, first column. The measured data from the MT Suula test samples are recorded in the same table. The last column contains the “emission limit values for discharges of waste water from the cleaning of waste gases” of the suggested industrial emis-sions directive proposal (EU, 2007). These directive limits are added only for comparison and are not valid for ship scrubbers.

78 Acta Wasaensia
Table 5-3. Wash water parameters of inlet water, water after scrubber and water after effluent treatment unit measured from closed-loop scrubber on board MT Suula.
Parameter Unit Method Inlet water (technical fresh water)
Washwater after scrubber
Discharge water
EU Directive COM(2007) 844 final
pH - SFS 3021,1979 6.8 - 7.2 6.5 - 7.3 Aver. 6.9
3.4 - 7.7 Aver. 6.2
-
PAH16 µg/l Eurofins 0.05 – 0.073 77 – 460 Aver. 290
4.4 - 57 Aver. 11
-
Oil mg/l Mod. ISO 9377-2:2000
Less than 0.05 27 – 2 000 Aver. 290 000
0.480 -150 Aver. 85
-
Nitrate mg/l Eurofins Less than 0.065 120 - 310 Aver. 230
11 – 220 Aver. 140
-
Nitrite mg/l Eurofins less than 8.5 2.1-360 Aver. 120
0.01 - 230 Aver. 120
-
Cadmium µg/l ICP-MS/ NEN-EN-ISO 17294-2
Less than 0.3 Less than 0.46 Less than 0.46 -1.5
50
Copper µg/l ICP-MS/ NEN-EN-ISO 17294-2
Less than 0.02 Less than 0.05 – 260
0.072 - 2 100 Aver. 230
500
Nickel µg/l ICP-MS/ NEN-EN-ISO 17294-2
Less than 10 2 800 - 5 600 Aver. 3 800
320 - 3 000 Aver. 910
500
Lead µg/l ICP-MS/ NEN-EN-ISO 17294-2
1.8 – 2.3 Less than 3 – 40 Aver. 9.6
2 - 27 Aver. 4.6
200
Zinc µg/l ICP-MS/ NEN-EN-ISO 17294-2
450 - 530 700 - 3 800 Aver.1500
130 - 3 400 Aver. 620
1 500
Arsenic µg/l ICP-MS/ NEN-EN-ISO 17294-2
Less than 0.8 Less than 10 – 20
0.83 - 8.9 Aver. 4.7
150
Chromium µg/l ICP-MS/ NEN-EN-ISO 17294-2
Less than 5 18 – 94 Aver. 47
5 -1 500 Aver. 160
500
Vanadium µg/l ICP-MS/ NEN-EN-ISO 17294-2
Less than 20 6 800 - 19 000 Aver. 13 000
2 600 - 5 600 Aver. 3 300
-
Mercury (not specified by IMO)
µg/l NEN-EN-ISO 17294-2
- Less than 10 Less than 10 30
Thallium (not specified by IMO)
µg/l - - - 50
Total suspended solids (not speci-fied by IMO)
mg/l DIN EN 872 (H33):2005
- 170 – 360 Aver. 290
0.55 – 120 Aver. 63
30 - 45
Dioxins and furans (not specified by IMO)
ng/l - - - 0.3
It can be seen that all the cadmium, lead, arsenic and mercury concentrations in discharge water measured on board MT Suula were below the directive limits. The average copper, zinc and chromium concentrations were also below the man-dated limits. However, average nickel (182%) and total suspended solid values (210%) were too high in this context (max. 100%). Thallium, dioxins and furans

Acta Wasaensia 79 were not measured in the ship. The quality of closed-loop scrubber effluent is comparable with industrial effluent. Since the ship is moving at high main engine loads, most of the effluent is spread into a large water area which minimizes the negative effects of the scrubber effluent.
Scrubber effluent quality can also be compared with surface water quality criteria. Table 5-4 presents the pollutant concentrations of Suula and Ficaria Seaways ef-fluents and EU Directive 2008/105/EC limits for non-inland surface waters (EU, 2008b, Environmental quality standards for priority substances and certain other pollutants, part a). This directive does not specify the flows of harmful substanc-es, only the allowed concentrations in the water into which effluent is pumped. The directive covers several chemicals which are not typically measured in ship effluents: alachlor, atrazine, C10-13 chloroalkanes, chlorfenvinphos, chlorpyrifos, diuron, endosulfan, hexachloro-benzene, hexachloro-butadiene, hexachloro-cyclohexane, isoproturon, nonylphenol (4-nonylphenol), pentachloro-phenol, si-mazine and tributyltin compounds (tributhyltin-cation). Inside the mixing area effluent discharge concentrations are allowed to exceed the maximum values mentioned in the directive. Outside the specified mixing zone environmental quality standards shall not be exceeded.
Table 5-4. Maximum allowed pollutant concentrations for non-inland surface waters compared to measured discharge concentrations from MT Suula and MV Ficaria Seaways.
Parameter (µg/l)
Suula Ficaria Sea-ways, sea water mode
Ficaria Sea-ways, fresh water mode
EU Directive 2008/105/EC
Antracene <0.01 – 0.52 < 2.0 16 50
Benzo(a)pyrene <0.01 – 1.2 < 0.01 < 0.01 0.10
Cadmium and its compounds
< 1.5 < 0.20 0.094 0.45 – 1.5
Fluoranthene 0.83 – 3 1
Mercury and its com-pounds
< 10 0.086-0.092 < 0.05 0.07
Table 5-4 shows five directive chemicals which were measured. The Ficaria Sea-ways scrubber fresh water running mode passes the directive criteria when the test time was 120 minutes (Kjölholt et al. 2012). Suula scrubber had too high values in part of the samples. In some samples the analysing accuracy could have been been better.

80 Acta Wasaensia
Local authorities also have limits for effluent metal content, as indicated in Table 5-5. Inside these water areas a closed-loop scrubber can normally fulfil the limits in zero-effluent mode without any water pollution.
Table 5-5. Maximum allowed effluent metal content by local authorities (Wärtsilä).
Parameter Unit HSY1) Svenskt vatten2) ADEC3)
Nickel, Ni mg/l 0.5 0.05 0.0434) 0.0435)
Lead, Pb mg/l 0.5 0.05 - -
Zink, Zn mg/l 3 0.2 0.36 0.36
Chrome, Cr mg/l 0.1 0.05 - -
Copper, Cu mg/l 2.0 0.2 0.087 0.13
1) HSY Helsinki Region Environmental Services Authority 2) Guidelines according to Svenskt vatten’s Publication P95 3) The Alaska Department of Environmental Conservation. These limits concern discharge of treated sewage and
treated grey water. There are technology based effluent limits. The presented values are from limits category “Other Treatment System”.
4) These effluent limits apply to wastewater discharge while docked, anchored, or moving at a speed below 6 knots.
5) These effluent limits apply to wastewater discharge while underway travelling at a speed of 6 knots or greater.
As shown in Figure 5-6, the theoretical bleed-off volume on board during zero-effluent operation may grow to equal volumes with the fuel bunker when the ef-fluent density is 1150 kg/m3 and fuel sulphur content 3.5% m/m. However, meas-ured values in Figure show lower tank capacity needs. Real bleed-off naturally contains several other chemical compounds, not only sodium sulphate. At higher densities the bleed-off volume is smaller than the fuel volume. In newbuilding ships this capacity is needed for effluent for continuous zero-effluent mode opera-tion. The possibility of using empty fuel tanks as dirty effluent buffer tanks during the voyage should be considered. In such an arrangement, fuel would be replaced tank by tank with dirty effluent during the voyage. The double-acting fuel tank concept requires an innovative approach; “effluent-in-oil” and “oil-in effluent” contamination after the liquid swap should be solved. However, dirty effluent always contains some oil, and, correspondingly, bunker fuel always contains some water.

Acta Wasaensia 81
Figure 5-6. Theoretical maximum sodium sulphate solubility in water at 20 °C (Mettler Toledo, 2015) and relation between required fuel tank and sodium sulphate solution tank volumes.
5.1.3 Energy consumption
An exhaust gas scrubber ship consumes more energy than a traditional heavy fuel oil ship. This additional energy consumption can be divided into direct and indi-rect consumption. Direct energy allows continuous running of the scrubber sys-tem and it is constituted mainly by electricity consumption. It should be noted that most direct energy is consumed independent of whether the combustion unit full power is in use, which makes ship low power steaming inefficient from the scrubber energy consumption viewpoint.
When heavy fuel oil is used instead of marine gas oil, fuel heating is also needed. Sea water temperature greatly influences the heat consumption of double bottom fuel tanks. Fuel heating in the engine room is required for fuel separation and for fuel feed prior to injection into the engine. Although most of the scrubber’s ener-gy consumers are electric, exhaust gas energy and other waste heat are available for heating purposes.
In addition, a marine gas oil ship also consumes extra energy compared with an HFO ship since gas oil is normally cooled to avoid too low viscosity in the fuel
0,00
1,00
2,00
3,00
4,00
5,00
0
50
100
150
200
250
950 1000 1050 1100 1150 1200 1250
Rela
tive
volu
me
Mas
s (kg
)
Density (kg/m3)
Theoretical maximum sodium sulphate solubility in water (20 °C) and theoretical bleed-off/fuel volume as a function of liquid density
Sodium sulfate mass (kg)
Theoretical liquid/fuel volumerelation (3.5 % sulphur in fuel)
Measured effluent/fuel volumerelation (1.2 % sulphur in fuel)
Theoretical liquid/fuel volumerelation (2 % sulphur in fuel)
Theoretical liquid/fuel volumerelation (0.5 % sulphur in fuel)
"Measured effluent/fuelvolume relation (2.3 % sulphurin fuel)

82 Acta Wasaensia
injection system. The cooling system typically consists of two main consumers, the chilling unit and the cooling water pump. Marine gas oil cooling power is roughly 0.4% of the engine power and the total electricity load is on average 1.7 kW per MW (Ahola, 2013). When low-sulphur “hybrid” fuels with higher viscos-ity are used, cooling is not needed.
In the case of fresh water closed-loop scrubbers, fresh water is consumed in the scrubbing process. If this water is produced from sea water on board, the evapora-tion or reverse osmosis energy should be included in the total energy need. How-ever, fresh water bunkering from shore is possible and eliminates energy con-sumption. In this case the ship fresh water tank capacity should be large enough for the transport route.
Scrubber indirect energy consumption is made up of extra weight, which burdens the ship propulsion machinery. The scrubber system increases the light weight of the vessel. Since extra fresh water and alkali must be transported at sea, the aver-age weight of these liquids must be added to the total weight. Also sludge is con-tinuously produced during running and in some cases extra ballast water is needed to compensate for the effects of the scrubber installation on the ship’s centre of gravity and to avoid an unwanted ship floating position. The calculation princi-ples of energy consumption on board are shown in Chapter 6.3.2.
5.2 Emissions from oil refineries and alkali production
The emissions and energy required by the marine gas oil and alkali production processes should be considered when closed-loop fresh water scrubbers are com-pared with MGO fuelled ships. Oil refinery process is a burden for MGO ships and alkali production for scrubber vessels.
5.2.1 Refinery process
In oil refineries crude oil is processed to oil products. Typical end products start-ing from light distillates towards the heavy ones are fuel gas, liquid gas, petro-chemicals, motor gasoline, naphtha, jet fuel, diesel fuel, heating oil (marine gas oil), base oils, heavy fuel oil, bitumen and sulphur (Figure 5-7). In addition to crude oil, typical raw materials for the refinery processes are condensates. Also bitumen and distillates from other refineries may be used.
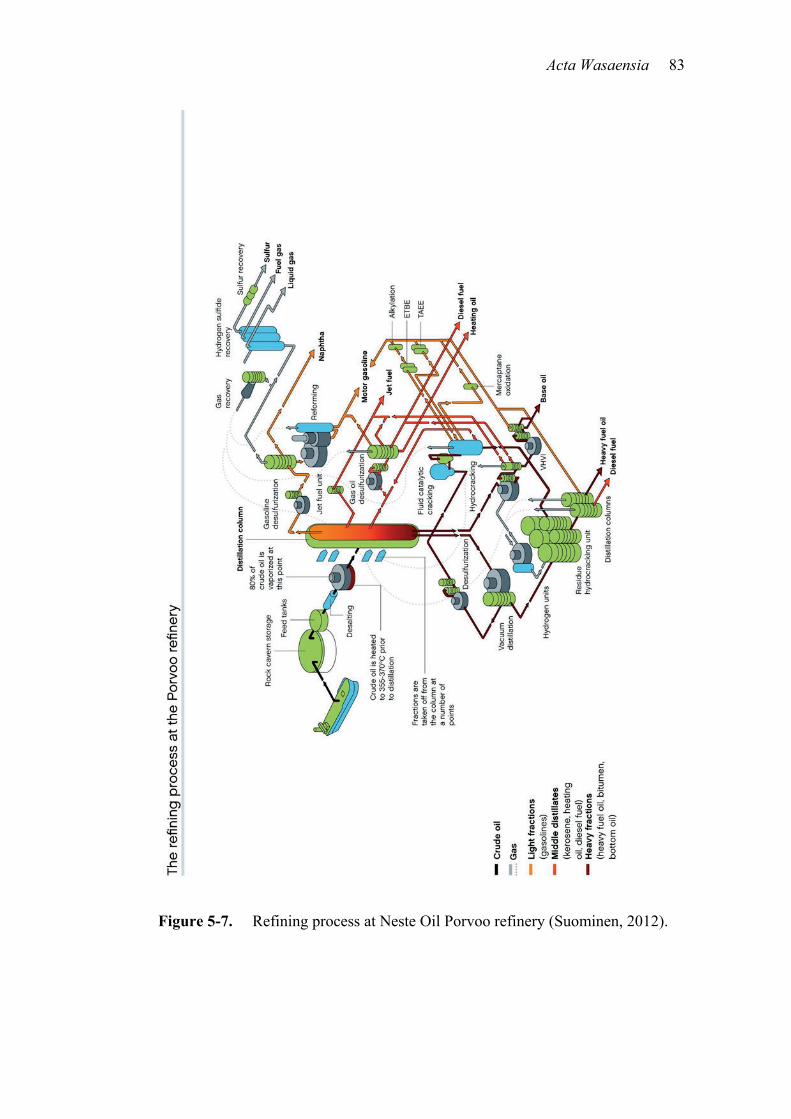
Acta Wasaensia 83
Figure 5-7. Refining process at Neste Oil Porvoo refinery (Suominen, 2012).

84 Acta Wasaensia
As an example, the diesel oil production process of the Neste Oil Porvoo refinery is described in Figure 5-7 (Suominen, 2012). The first step is the removal of salt and impurities from crude oil feedstock with water wash. In the next phase crude oil is heated to 355-370 °C resulting in 80% evaporation. The main refinery pro-cess for the cleaned and heated feed oil is overpressure distillation. Diesel oil is condensed to liquid inside the distillation column at a temperature of 360 °C. Also heavy fractions are used for diesel oil production after vacuum distillation, desul-furization and cracking. The cracking processes exploited are heat conversion, hydrocracking and fluid catalytic cracking. Sulphur, nitrogen and other harmful products are removed from feed products in hydrogenating processes at 300-400 °C. When sulphur is converted to hydrogen sulphide (gas), additional hydrogen is needed and it is produced from natural gas in hydrogen units. Elementary sulphur is recovered in liquid form from hydrogen sulphide. The resulting final diesel oil is mixed from various refinery products and additives.
The sulphur content of crude oils depends on the geographical origin of the crude oil. Removal of sulphur from large hydrocarbon molecules (heavy fuels) is a complex and sensitive process which requires high pressures and added invest-ment costs. The end product from such a process would economically compete with distillates. According to Lemper (2010: 3-6) it is practically impossible to remove sulphur from HFO by current methods because metal (vanadium and nickel) contamination in HFO poisons the catalysts in the refinery process. Resid-ual conversion to distillates as a process is in principle similar to desulphuration, except that the conditions are harder during sulphur removal. Full or partial con-versions are alternatives to desulphuration. Avis & Birch (2009: 8) assume that the number of processes increasing the yield of middle distillates will be growing; such processes are hydrocracking and delayed coking. The conversion efficiency of distillation residues to light products can be used for refinery complexity clas-sification.
5.2.2 Emissions to atmosphere
Oil refining releases carbon dioxide emissions to the atmosphere (Dastillung et al. 2006). The main sources in the process are combustion of fuels, fluid catalytic cracking, and hydrogen production (Avis & Birch, 2009: 9). In Table 5-6, emis-sions from Neste Oil refineries are estimated (Neste Oil, 2012). In the first col-umn the emissions are provided in proportion to total refinery production. The second column is based on the hypothesis that refineries aim to manufacture only high value light products; bitumen, heavy fuel oil and sulphur are more or less considered waste products.

Acta Wasaensia 85 Table 5-6. Neste Oil refinery emissions to atmosphere in relation to total pro-
duction in 2009, 2010 and 2011 (Neste Oil, 2012).
Compound Unit Refinery emissions compared with total production
Bitumen, heavy fuel oil and sulphur production excluded
Sulphur dioxide ‰ m/m
0.61 – 0.84 0.68 – 0.96
Sulphur ‰ m/m
0.3 – 0.4 0.3 – 0.5
Nitrogen oxides ‰ m/m
0.66 – 1.03 0.74 – 1.18
Volatile organic compounds
‰ m/m
0.28 – 0.41 0.32 – 0.46
Carbon dioxide ‰ m/m
240 – 280 270 - 320
Kjölholt indicates that refinery carbon dioxide emissions are at a level of 10 kg per GJ energy in fuel (Kjölholt et al., 2012: 42). If a lower caloric heat value of 42.9 MJ/kg is used for marine gas oil, 23.3 kg of fuel is needed to produce one gigajoule energy. This estimation produces a result of 43% carbon dioxide mass in relation to fuel mass. In Table 5-6, carbon dioxide emissions are 24 – 28% of total refinery production and 27 – 32% of the high end products. In this context attention should be paid to the fact that refineries worldwide are not alike and therefore differences in process efficiency exist.
Avis and Birch have studied “Impacts on the EU Refining Industry & Markets of IMO Specification Changes & Other Measures to Reduce the Sulphur Content of Certain Fuels” (2009). Their conclusion is that additional carbon dioxide emission in the EU to produce low-sulphur fuels would approximately amount to 5 million tons per year in 2020, which means a 3% increase.
5.2.3 Effluents to sea
Refinery industrial effluent is typically purified in a treatment plant. The main sources of dirty water are typically oily waters originating from processes, storage tanks, harbour operations and maintenance. In addition, salt removal from crude oil by washing produces oily waters. Moreover, rain waters from process areas are typically oil contaminated. In refineries other typical components in industrial effluents are hydrogen sulphide, sulphides, mercaptanes, ammonia, phenols,

86 Acta Wasaensia
heavy metals and phosphorus compounds. Emissions from Neste Oil refineries to water are specified in Table 5-7.
Table 5-7. Quality of Neste Oil refinery effluent to sea in relation to produc-tion.
Matter Unit Refinery emissions com-pared to total produc-tion
Bitumen, heavy fuel oil and sulphur excluded
1 Wastewater m3/ton 0.55 – 0.66 0.61 – 0.76 1 Oil g/ton 0.08 – 0.17 0.09 – 0.20 2 Nitrogen g/ton 2.7 – 7.9 3.6 – 10.2 1 Chemical oxy-gen demand g/ton 25 – 32 29 – 36
1 Neste Oil Annual Report 2011 (data from the years 2009, 2010 and 2011) 2 Länsi-Suomen ympäristölupavirasto, 2007 (data from the years 2003 to 2006)
5.2.4 Energy consumption
In refinery processes, energy is needed for heating, pressurizing, etc. This energy can be produced from the incoming crude oil or it can be purchased outside. Also hydrogen for the refining processes is produced from energy sources, typically from natural gas.
In Table 5-8 energy consumption is compared with total refinery production. The consumption of oil for energy production is less than 1% m/m of the production. For comparison purposes, refinery electricity and natural gas consumption are converted to oil consumption. If a fuel oil specific consumption of 200 kg per MWh, which is a typical value for diesel engines, is used in the calculations, the electricity consumption is equal to 18 to19 kg of oil per produced refinery ton. Respectively, gas consumption is equal to 29 to 32 kg of oil per produced refinery ton if a heat value of 36 MJ/Nm3 is used for gas and 40.7 MJ/kg for oil. The result means 5 to 6% m/m additional oil consumption in a refinery.
When low-value products are excluded, the oil refinery energy consumption as oil is from 6 to 7% m/m per produced ton. Hansen (2012) has estimated the addition-al energy requirement at land to be 15%. It should be noted that natural gas is the

Acta Wasaensia 87 source of hydrogen in the refining process, which means that part of total gas consumption is for raw material purposes.
Table 5-8. Neste Oil refinery energy consumption in relation to production in 2009, 2010 and 2011 (Neste Oil, 2012)
Source of energy
Unit Refinery energy need com-pared with total production
Bitumen, heavy fuel oil and sulphur excluded
Electricity kWh/ton 92 – 97 105 – 110
Oil kg/ton 5.8 – 7.1 6.5 – 8.0
Natural gas Nm3/ton 33 – 36 37 – 41
Sum as oil kg/ton 53 – 59 60 – 66
5.2.5 Alkali production energy
Closed-loop scrubbers consume alkali mainly for the neutralization of the acidic scrubbing water in the closed-loop washing process. Three different technologies are used in the combined alkali and chlorine production: amalgam technology, asbestos diaphragm technology, and membrane technology (European Commis-sion, 2001: 37). The energy consumed in these processes varies between 3.0 and 3.6 MWh per produced chlorine gas ton when 50% caustic soda is produced. Al-kali with a 100% concentration is produced at a fixed ratio of 1.128 kg per pro-duced chlorine kilogram. If the energy consumption is divided by the combined mass of chlorine and 100 % alkali, the production of 1 kg of caustic soda (50%-m/m) consumes 0.8 – 1.0 MJ/kg. When 9.0 kg alkali (50%-m/m) per MWh and per % sulphur in fuel is used in calculations the additional alkali production ener-gy is equal to 1.8 -2.1% of the diesel engine output consuming 2.51% m/m sul-phur fuel. Hansen (2012: 16) uses the value 2% for the same energy consumption.
Emissions from the alkali production processes are not included in this thesis since energy production process emissions depend on the factory where the alkali is produced. However, it should be noted that some mercury, which is a toxic substance, is released to the environment if amalgam process technology is used.
88 Acta Wasaensia
5.3 Scrubber environmental analysis
In this environmental analysis two similar ships are presumed to be burning ma-rine gas oil and heavy fuel oil, respectively. The heavy fuel oil ship is combined with a scrubber. The comparison principle of these two alternatives is visualised in Figure 5-8. As a basic assumption, oil refineries will produce valuable high end oil products to the market. In the production process heavy fuel oil is assumed to be an obligatory by-product with less economic value and no capacity for upgrad-ing economically. Due to this assumption the emissions from refineries are in-cluded as a relative proportion in the gas oil ship emissions.
Both the refinery process and the alkali process need energy. Electric energy pro-duction may cause emissions, depending on the production method. However, in this study electricity production emissions are not taken into account.
Emissions were studied as kilograms per engine output work (MWh). In the com-parison the following assumptions were made: • MGO ship fuel specific consumption was based on Table 6-2 and corrected
with fuel cooling energy. • HFO ship fuel specific consumption was based on Table 6-3 and it included
scrubber energy and HFO heating energy. • Carbon dioxide production was 3.169 kg per kg fuel for distillate and 3.168
for HFO • Carbon dioxide reduction in scrubber was 3% m/m based on Containership
VII high sulphur fuel certification tests (Table 5-1). • Carbon dioxide emission on land in energy production was assumed to be zero
which may not be correct; emissions depend on the power plant type feeding the refinery and caustic soda factory.
• The sulphur content of HFO was assumed to be 2.51% m/m and the same pa-rameter for MGO was 0.1% m/m
Numerical atmospheric emissions are shown in Table 5-8. Refinery emissions calculation is based on the assumption that MGO is a product and the higher val-ue expects HFO to be “waste”. First, sulphur flow to the atmosphere is shown. Refinery emissions are clearly below the IMO limits for ships (sulphur 0.10% m/m in fuel). Based on the figures, the combined sulphur emission overrun from a gas oil ship is 22 to 38% m/m higher than the heavy fuel oil ship emission. Refin-ery nitrogen oxide emissions are also low and contribute slightly to ship nitrogen emissions by causing a mild increase.

Acta Wasaensia 89
Figure 5-8. Comparison principle for emissions from ships burning marine gas oil or heavy fuel oil.
Carbon dioxide emissions from oil refineries are considerable compared to diesel engine emissions. The carbon dioxide emission value seems to be, on average, 5% higher in a gas oil ship installation (Table 5-9). This study indicates 27 to 32% m/m CO2 emissions for refineries per produced ton when low quality prod-ucts are excluded (Table 5-6). If refinery CO2 emissions are excluded scrubber ship emissions are 4 % higher compared to MGO ships. As mentioned earlier alkali production energy and refinery imported electric energy were not included in the emissions because the emissions released in energy production for alkali process are not known. Den Boer & ‘t Hoen (2015) estimate greenhouse gas re-finery emissions to grow by 6.5% due to upgraded MGO production.
Ship CO2 emissions are not directly limited by any rules; however, IMO resolu-tions MEPC.203(62), MEPC.212(63) and MEPC.224(64) limit the energy con-
Crude oil
Refinery process
Marine gas oil
Gas oil ship
Emissions to air and sea
Marine gas oil ship emissions
Heavy fuel oil
Heavy fuel oil ship
Scrubber ship emissions
Salt
Alkali process
Emissions to air and sea
Emissions to air and sea
Emissions to air
Alkali

90 Acta Wasaensia
sumption of new ships and their carbon dioxide emissions (Bacher et Albrecht, 2013:4).
Table 5-9. Emissions to atmosphere from gas oil ship and from a vessel burn-ing heavy fuel oil with a closed-loop scrubber.
Parameter Unit Gas oil ship emissions Scrubber ship emissions
Difference (%) MGO/HFO
Ship Refinery Total
Sulphur di-oxide kg/MWh 0.33-
0.40 0.10 – 0.19
0.43 – 0.60 0.36 – 0.43 22 – 38
Nitrogen oxides kg/MWh 2.0 –
3.4A 0.11 – 0.24
2.1 – 3.6 2.0 – 3.4 6 – 7
Carbon diox-ide
kg/MWh 527 - 641 45 – 65 572 –
706 546 – 665 5 – 6
AIMO Tier III limit for ships built 2016 onward (IMO, 2014)
The lowest carbon dioxide specific emissions were calculated for high power large size container vessels equipped with economical engines. The highest spe-cific carbon dioxide production, on the other hand, was found for small product tankers. It should be noted that this exercise is mainly only relevant in the case of Containerships VII type ships. Many different approaches are possible when emissions and energy efficiency are discussed.
Comparison of effluents originating from oil refineries and from scrubber ships is difficult due to several reasons. For instance, the emission parameters typically measured are different and an oil refinery is not mobile (local pollution). Effluent flow volumes are also not comparable.
5.4 Conclusions
In this chapter scrubber environmental aspects were studied. First, ship exhaust gas pre- and post-scrubber composition was discussed, and next, scrubber effluent was dealt with. In general sulphur removal in scrubbers works well and environ-mental discussion is strongly focused on effluents flowing from ship to sea.
Closed-loop scrubber effluents have minor volumes. However, in the case of tur-bidity they are subject to equally tight limits as high flow volume sea water scrubbers. Closed-loop low volume effluent streams enable easy pH setting chem-
Acta Wasaensia 91 ically. The measured polycyclic aromatic hydrocarbon levels were low inde-pendently of the unclear parameter definition in the legislation.
Compared with open-loop sea water scrubber technology, zero effluent operation is one of the main advantages of closed-loop scrubbers. Non-polluting operation is possible due to reduced effluent production in a closed-loop scrubber. This en-ables effluent storage onboard in future and zero effluent running leaves the sea unaffected during ship operation. Effluent criteria are not valid and effluent treatment equipment is not needed on board; from this point of view, zero effluent mode is equal with dry scrubbing technology. Furthermore, the scrubbing process may consume less alkali in zero mode since effluent stored on board has no pH limit.
The dirty effluent volume to be stored on board depends on fuel consumption during the voyage, on fuel sulphur content and on the effluent density in the stor-age tanks. High density reduces the required tank capacity as shown in Figure 5-6. Equal volume between the fuel and effluent tanks can be reached. The lines in the figure were drawn based on the assumption that all sulphur in fuel produces sodium sulphate in the end, which is not exactly true. In reality, dirty wash water contains sulphites with lighter molecular weight and many different compounds removed from the exhaust gas. Nevertheless, after oxidation sulphites form sul-phates.
In port, offloaded dirty effluent should be treated to a level of quality which ful-fils the acceptance criteria of the municipal waste water system. The metals and sulphate in the effluent may require measures. An option is to transport the efflu-ent to a waste disposal plant by tank trucks and another option is to dry the efflu-ent into a powder. The dry waste recycling option should be studied. Sodium sul-phate – the main component in dry effluent – is typically used in the pulp, glass and textile industries. Effluent processing requires additional investments and costs but allows sea water to remain free from all pollutants.
While burning fuel is a source of pollution, so are fuel refining and also alkali production. These refining emissions should be included in the total distillate burning emissions if HFO is seen as an unwanted by-product. The main pollutant from refineries is carbon dioxide. As regards effluents, the quality parameters used in refineries differ from the IMO scrubber parameters. Therefore, proper comparison was difficult.
Energy consumption on board is an important issue and it can be analysed from various viewpoints. In this study scrubber energy was categorized to direct and indirect segments. The result calculated on the basis of Containerships VII indi-

92 Acta Wasaensia
cated that a traditional heavy fuel ship with a closed-loop scrubber is on average more environmentally friendly than an MGO ship. In conclusion, a scrubber ship is not the most “green” vessel type but it is greener than a marine gas oil ship.
Acta Wasaensia 93 6 ECONOMIC ANALYSIS
In general goods and materials are transported along the most economical transport routes and by the most economical means of transport. Furthermore, an important parameter affecting logistics is transport time, especially in the case of high value cargos. Transport mode is typically selected based on cargo type (state, volume, mass and possible packing), transport distance and required transport speed. The decision to use a certain mode of transport may also be influenced by regulations which may favour one preselected method of transport by economical subventions or make it unprofitable by additional costs.
The total sea freight cost based on Oksanen (2004) is a sum of capital costs, oper-ating costs, voyage costs, cargo handling costs and running costs (Hirsso, 2010). A scrubber installation in a ship affects all of the previous except the cargo han-dling costs. Voyage costs include direct variable costs such as fuel cost and har-bour, fairway, pilotage and towing fees.
6.1 Marine fuel price development and scrubber market potential
Price curves for distillates and heavy fuels are shown in Figure 6-1 (Finnish Pe-troleum and Biofuels Association, 2015). The source of statistics has been The Oil Market Journal, Thomson Reuters. The general trend for both fuels indicates increasing prices from the year 2000 to the beginning of year 2011. Beginning in middle of 2014, a strong downward trend in the prices of is visible. As a rough estimate low sulphur distillate fuel has been 50% more expensive than high sul-phur heavy fuel oil during the years 2010-2015.
When bunker prices are analysed also the difference in effective heat values should be noted, as discussed above. In this thesis, lower values of 40.7 MJ/kg for heavy fuel oils and 42.9 MJ/kg for marine gas oils are used. Separation losses should also be taken into consideration. Extra heavy fuel oil loss is created as wa-ter, sediments and oily sludge are purified from fuel. The water typically origi-nates from the fuel itself or it may enter the tanks as a result of condensation. The maximum water content is to be limited to 0.3% of the fuel. Heavy fuel oil purify-ing losses vary between 0 and 4%, sometimes even more, but typical values are between 1 and 1.5% (Sirkiä, 2013). Separator manufacturer Westfalia uses 2.5% separation losses of the fuel consumption (Westfalia, 2012: 17). The distillate separation process produces less sludge and it is expected to be mainly water.

94 Acta Wasaensia
Figure 6-1. Light and heavy fuel oil prices in US dollars per ton (Finnish Pe-troleum and Biofuels Association, 2015).
Global fuel consumption in marine traffic was estimated by IMO (IMO, 2009b: 209) and the estimated consumption in 2007 is shown in Figure 6-2. The residual fuel demand was 3.4 times higher than the distillate market volume. After the year 2020 (or alternatively 2025) most heavy fuel oil will not meet the sulphur limits, which may open a large market for sulphur removal technology.
In the same study the entire world fleet was analysed and as a result a total of 99 000 ships of over 100 gross tonnage was found. The distribution of this fleet into different ship categories is seen in Figure 6-3. Large ships typically use HFO and in smaller size categories the use of both HFO (main engines) and distillate (aux-iliary engines) is typical. In the IMO study a fraction of small ships is expected to use only distillate. If even a small part of these vessels could be retrofitted with scrubbers, the market potential for the technology would be enormous. Obviously older ships would not be retrofitted but scrubber installation offers an attractive option for the newbuilding shipyards.
0
200
400
600
800
1 000
1 200
1 40020
00-J
an
2001
-Jan
2002
-Jan
2003
-Jan
2004
-Jan
2005
-Jan
2006
-Jan
2007
-Jan
2008
-Jan
2009
-Jan
2010
-Jan
2011
-Jan
2012
-Jan
2013
-Jan
2014
-Jan
2015
-Jan
Light fuel oil and heavy fuel oil prices (US dollars per ton)
LFO
HFO

Acta Wasaensia 95
Figure 6-2. Estimated total fuel consumption (million tonnes) by shipping 2007 (IMO, 2009b).
Figure 6-3. Numbers of ships of over 100 gross tonnage (IMO, 2009b).
6.2 Scrubber investment calculations
A scrubber investment in a newbuilding ship typically includes the following cost sections: scrubber unit and auxiliary components, outfitting material, outfitting
257
76
215
110
8
Residual fuel Distillate Fuel Slow-speedengines
Medium-speedengines
Boilers
Fuel consumption (million tonnes)
12930
7392
18475
4138 5767 4 440 4813
40819
Tanker Bulker Dry cargo Container Roro Passenger Offshore Other
Number of ships

96 Acta Wasaensia
work and supervision, docking costs, commissioning, system design, classifica-tion and administration, project management, crew training, documentation, and spare parts. A scrubber investment on board is comparable with other ship ma-chinery installations in newbuilding ships.
A typical parameter for scrubber investment cost estimation is the system price per maximum washed power (€/MW). This parameter may be sufficiently exact only for the comparison of similar ship types and ship sizes. In the case of new ships, series production allows for lower prices compared with one-off produc-tion. The cost of a retrofit scrubber installation also differs from a newbuilding installation, as discussed earlier.
A suppliers’ scrubber system delivery to the shipyard may be comprehensive or limited. A limited package only includes the key components leaving all the ma-terials for the interface between the scrubber and ship (piping material, electrical equipment, accessories, etc.) to be purchased by the shipyard. The other extreme is a turnkey delivery by the scrubber manufacturer.
The two major cost pools are firstly the scrubber system price, including all the components, and secondly, the installation cost. In more detailed analysis the pip-ing system was found to be an important factor in the cost structure. Based on the observations, pipe materials, pipe package prefabrication and the execution of the pipeline operations must be planned carefully especially in all retrofit installa-tions. Short docking and off-hire times save money both for the shipyard and for the shipowner.
In this thesis, cargo ship main engine closed-loop scrubber investment calcula-tions are executed. The target of the study was to find the maximum acceptable price for the scrubber installation. This investment is expected to be paid back later by operational savings due to cheaper fuel. The shorter the pay-back time is, the higher the expected annual savings. The third parameter used is the rate of interest which is usually low if funding and collaterals for the scrubber investment are readily available. However, the internal rate of interest can be selected freely and it is typically higher than the market rate. The investment volume, the annual pay-back sum, the payback time and the internal rate of investment are interrelat-ed. The calculation process includes several ship related parameters without exact values. Therefore, many parameters have a fluctuation range which also causes the final results to have a range of variation.
Acta Wasaensia 97 6.2.1 Newbuilding ships
The internal rate of return on an investment method (Laaksonen, 2010) is used for the scrubber investment analysis. The investment’s net present value NPV can be calculated
)1( TekHNPV ρ
ρ−−+−= (8.)
where H is investment cost, k is continuous net income and T is time. Rate inten-sity ρ is calculated:
)1ln( i+=ρ (9.)
In Equation 9, i is rate of interest (i > 0). The maximum possible scrubber invest-ment price can be calculated by assuming the net present value to be zero in Equation 8. The shipping company is then expected to pay the ship price, includ-ing the scrubber, to the shipyard immediately after the ship delivery. This as-sumption is not prevailing practice since a ship building process is typically fund-ed by the shipyard. However, the funding arrangements of a ship project are be-yond the scope of this thesis.
A scrubber investment covers all the scrubber costs: system components, auxilia-ry systems, spare parts, installation, start-up, testing, certification, and training. Based on Equations 8 and 9, the highest value Hmax of the investment is:
[ ]Tii
kH −+−+
= )1(1)1ln(max (10.)
The ship’s operating life is supposed to be equal with the scrubber service life. The residual value of the investment is assumed to be zero at the moment of ship scrapping. However, it should be noted that special stainless steels are typically used in scrubbers and therefore the relative scrapping value of the scrubber is high compared with that of other ship steel structures. The average lifetime of different ship types varies between 25 and 27 years (Kalli, 2012: 10). As an ex-ception, the scrapping age of liquefied natural gas tankers is higher, typically 29 years.
In Figure 6-4, the maximum investment cost compared to annual savings is shown as a function of the internal rate of interest. It is recommended that this rate be around 15% as a minimum value for investments aiming at operating cost reductions (Jadelcons, 2013) which is also the purpose of a scrubber installation.

98 Acta Wasaensia
If this recommendation applies, the investment value should be less than seven-fold the annual operating savings (green line in Fig. 6-4).
Figure 6-4. Scrubber maximum investment cost compared to annual operating savings as a function of internal rate of interest.
6.2.2 Retrofit installations
Scrubber retrofitting differs from newbuilding installations. The main difference is the shorter remaining operational age of the ship which means more savings are required within a shorter time. Figure 6-5 shows that vessels with five remaining operational years after the scrubber installation are the most challenging for scrubber retrofitting; this fleet is able to reach a 15% internal rate of interest only if the maximum investment cost is three times the annual savings. In practice, the maximum investment cost does not differ considerably from that required by newbuildings if the remaining service life of the old ship is expected to exceed 15 years.
It should also be noted that retrofit installation is more complicated and more ex-pensive since new additional systems must be installed onboard the existing ship. Jiang et al. (2014) estimate retrofitting costs in average 40% more. During the scrubber retrofitting process, the docking period is longer than the time needed for normal periodical dockings. This extra off-hire results in lost income to be
0
5
10
15
20
25
30
35
0 5 10 15 20 25Internal rate of interest (%)
Max investment/annual saving ratio for a 25 year period
Max investment/annual saving ratio for a 29 year period
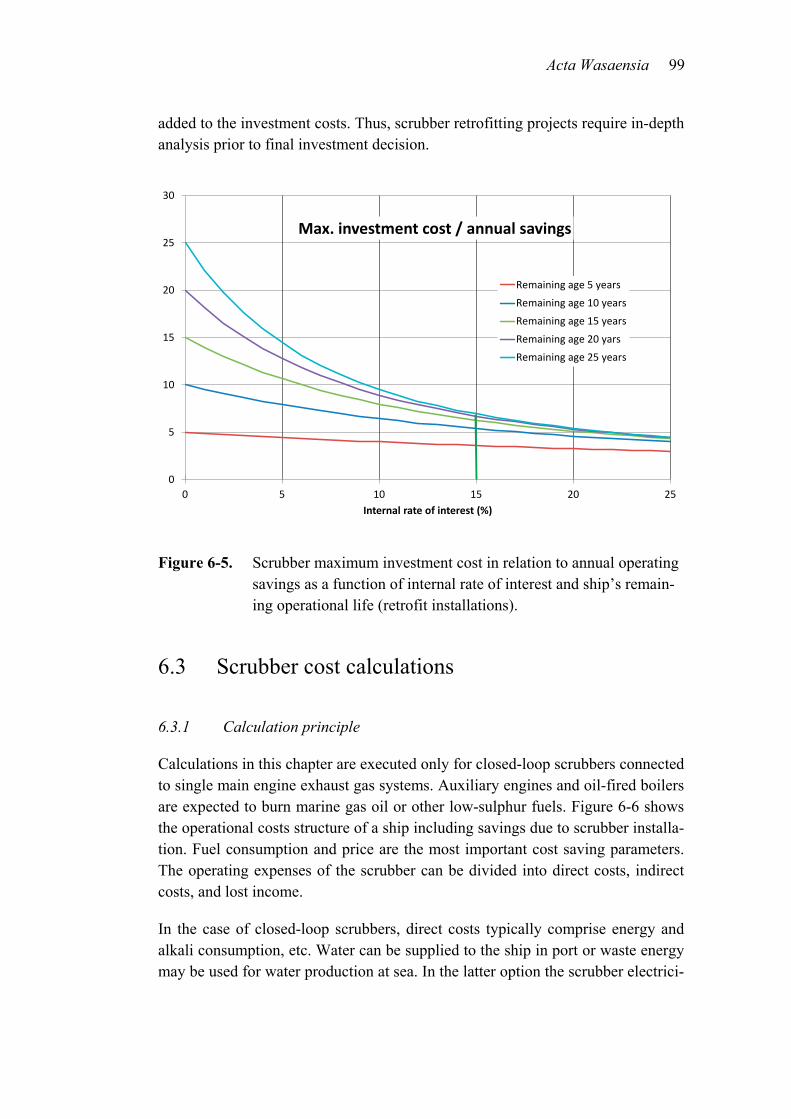
Acta Wasaensia 99 added to the investment costs. Thus, scrubber retrofitting projects require in-depth analysis prior to final investment decision.
Figure 6-5. Scrubber maximum investment cost in relation to annual operating savings as a function of internal rate of interest and ship’s remain-ing operational life (retrofit installations).
6.3 Scrubber cost calculations
6.3.1 Calculation principle
Calculations in this chapter are executed only for closed-loop scrubbers connected to single main engine exhaust gas systems. Auxiliary engines and oil-fired boilers are expected to burn marine gas oil or other low-sulphur fuels. Figure 6-6 shows the operational costs structure of a ship including savings due to scrubber installa-tion. Fuel consumption and price are the most important cost saving parameters. The operating expenses of the scrubber can be divided into direct costs, indirect costs, and lost income.
In the case of closed-loop scrubbers, direct costs typically comprise energy and alkali consumption, etc. Water can be supplied to the ship in port or waste energy may be used for water production at sea. In the latter option the scrubber electrici-
0
5
10
15
20
25
30
0 5 10 15 20 25Internal rate of interest (%)
Max. investment cost / annual savings
Remaining age 5 years
Remaining age 10 years
Remaining age 15 years
Remaining age 20 yars
Remaining age 25 years

100 Acta Wasaensia
ty consumption grows although heat energy itself is free. The increasing electric load combined with small auxiliary reserves is an additional burden especially for retrofit scrubber installations. Alkali is needed for wash water neutralisation and additionally effluent cleaning chemicals are consumed if flotation-based effluent treatment processes are used. Sludge is produced in all effluent treatment process-es and therefore sludge disposal costs must be taken into account. If untreated effluent pumping onshore into the municipal sewage system is allowed and used, it must also be included in the direct costs; however, onshore pumping eliminates all treatment and sludge costs on board. Moreover, scrubber maintenance, spare part and labour costs should be added to the direct costs.

Acta Wasaensia 101
Figure 6-6. Exhaust gas scrubber installation savings and expenses.
Scrubber installations burden ship economy also by adding indirect costs. Added ship lightweight is a result of extra equipment installed on board. Greater weight results in increased resistance and higher fuel consumption at the original sailing speed. In addition to the increased weight, also the ship’s volume may grow due to the scrubber installation. This happens if additional deck structures are needed for scrubbers and it will lead to increased ship gross tonnage and possibly higher gross tonnage dependent costs.
Combustion unit load Combustion unit run-ning time
Fuel consumption
TOTAL ANNUAL SAVINGS
Additional expenses
Direct costs: Energy, water, sludge,
chemicals, mainte-nance, etc.
Heavy fuel oil and marine gas oil price difference
Fuel cost savings
Indirect costs: Added resistance,
heavy fuel oil heating, etc.
Lost income: Less cargo, off-hire
during scrubber retro-fit installation
Combustion unit spe-cific fuel consumption
102 Acta Wasaensia
In gas oil fuelled ships, fuel heating needs are low since the fuel viscosity is be-low the pumping limit at room temperature. On the contrary, low viscosity fuels require cooling to ensure efficient lubrication in the fuel injection pumps. This fuel cooling energy is added to the MGO ship’s total energy consumption.
Heavy fuel oil requires heating to maintain storage tank temperature above the pour point and to raise tank temperature in sufficient time prior to pumping. HFO is typically heated also in settling tanks, day tanks, fuel oil separators, and fuel feed units. It is assumed that fuel heating energy is recovered from main engine waste heat and from exhaust gas when the ship is sailing. It is further assumed that fuel heating energy is produced in port by auxiliary boilers, which gives rise to additional MGO consumption.
Cargo limitations on board may originate from scrubber weight, scrubber volume, low stability, or unfavourable trim in buoyancy. This results in reduced freight income for the shipping company. If the ship load factor is low, lost income may be ignored. Scrubber extra weight can be compensated for by a reduced need of ballast water as far as ship stability is not critical. If scrubber retrofit installation work in repair yard is combined with a periodical ship docking, proceeds are also lost since the docking time is longer than the typical duration of a conventional ship periodical docking.
6.3.2 Calculation parameters and functions
It is challenging to conduct an economic analysis of scrubber savings due to the large number of variable costs. The real values of these parameters is difficult to predict. Savings in this thesis are calculated as euros per MWh, which result can be further developed to real savings and finally the savings can be compared with the investment cost. When ship main engine total annual power output is calculat-ed, the annual savings and scrubber maximum cost can be calculated as money. The maximum allowed cost is the target value for scrubber suppliers. The equa-tions and parameters used in the calculations are listed in Table 6-1.

Acta Wasaensia 103 Table 6-1. Terms, equations and assumptions used in the scrubber saving cal-
culations.
Term Symbol Unit Formula Note
Scrubber savings A €/MWh BFA −= Savings minus ex-
penses
Fuel cost savings F €/MWh HGF −= MGO-HFO
Marine gas oil cost G €/MWh 𝐺 = 𝑟𝑟(1 +𝑀
100) -
Marine gas oil average specific consumption r kg/MWh 𝑟 =
40.7142.93
𝑟1 Heat value correc-
tion
Low sulphur fuel oil price e €/kg - 0.4-0.8 €/kg
Gas oil cooling energy cost (electricity) M % - 0.18% of the MGO
cost
Heavy fuel oil cost H €/MWh 11erH = (1+S/100) -
Heavy fuel oil average spe-cific consumption r1 kg/MWh - Table 6.3
Heavy fuel oil price e1 €/kg - 0.2-0.52 €/kg
Scrubber ship additional energy consumption (elec-tricity)
S % - 1,08% of the HFO consumption
Additional expenses B €/MWh lidB ++= -
Direct costs d €/MWh 𝑑 = 𝑑3 + 𝑑4 + 𝑑5 -
Sludge cost d3 €/MWh 333 erd = -
Sludge production r3 kg/MWh - 0.24 kg/MWh
Sludge treatment cost e3 €/kg - 0.2 €/kg including truck transport
Alkali cost d4 €/MWh 𝑑4 = 𝑟4𝑟4 -
Alkali price r4 €/kg - 0.36 €/kg
Alkali consumption e4 kg/MWh - 12 kg/MWh
Service cost d5 €/MWh 𝑑5 = (𝑟5 + 𝑟6)/𝑟5 + 𝑟7
Maintenance costs r5 € - 20 000 € per year
Labour costs r6 € - 25 000 € per year
Main engine energy pro-duction per year e5 MWh - 4 270-163 000
MWh
Main engine extra mainte-nance due to HFO use r7 €/MWh - 0.19 €/MWh
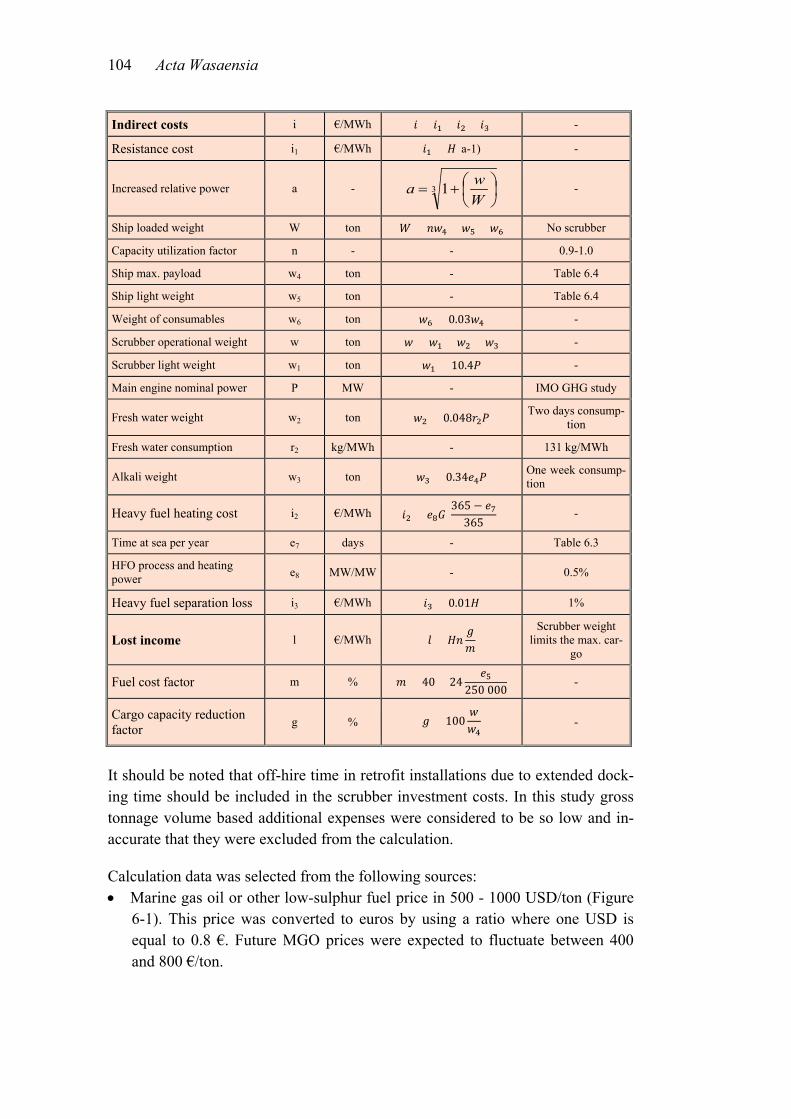
104 Acta Wasaensia
Indirect costs i €/MWh 𝑖 = 𝑖1 + 𝑖2 + 𝑖3 -
Resistance cost i1 €/MWh 𝑖1 = 𝐻(a-1) -
Increased relative power a - 3 1
+=Wwa -
Ship loaded weight W ton 𝑊 = 𝑛𝑛4 + 𝑛5 + 𝑛6 No scrubber
Capacity utilization factor n - - 0.9-1.0
Ship max. payload w4 ton - Table 6.4
Ship light weight w5 ton - Table 6.4
Weight of consumables w6 ton 𝑛6 = 0.03𝑛4 -
Scrubber operational weight w ton 𝑛 = 𝑛1 + 𝑛2 + 𝑛3 -
Scrubber light weight w1 ton 𝑛1 = 10.4𝑃 -
Main engine nominal power P MW - IMO GHG study
Fresh water weight w2 ton 𝑛2 = 0.048𝑟2𝑃 Two days consump-tion
Fresh water consumption r2 kg/MWh - 131 kg/MWh
Alkali weight w3 ton 𝑛3 = 0.34𝑟4𝑃 One week consump-tion
Heavy fuel heating cost i2 €/MWh 𝑖2 = 𝑟8𝐺(365 − 𝑟7
365 ) -
Time at sea per year e7 days - Table 6.3
HFO process and heating power e8 MW/MW - 0.5%
Heavy fuel separation loss i3 €/MWh 𝑖3 = 0.01𝐻 1%
Lost income l €/MWh 𝑙 = 𝐻𝑛𝑔𝑚
Scrubber weight limits the max. car-
go
Fuel cost factor m % 𝑚 = 40 + 24𝑟5
250 000 -
Cargo capacity reduction factor g % 𝑔 = 100
𝑛𝑛4
-
It should be noted that off-hire time in retrofit installations due to extended dock-ing time should be included in the scrubber investment costs. In this study gross tonnage volume based additional expenses were considered to be so low and in-accurate that they were excluded from the calculation.
Calculation data was selected from the following sources: • Marine gas oil or other low-sulphur fuel price in 500 - 1000 USD/ton (Figure
6-1). This price was converted to euros by using a ratio where one USD is equal to 0.8 €. Future MGO prices were expected to fluctuate between 400 and 800 €/ton.

Acta Wasaensia 105 • Marine gas oil cooling consumes electricity and this consumption was esti-
mated as 1.7 kW per main engine megawatt power (Ahola, 2013). This energy was converted to additional MGO flow to the main engine; electricity was as-sumed to be produced by a shaft generator connected to the main engine. In-cluding the efficiency in electricity production the cost is 0.18%.
• Heavy fuel oil specific consumptions were based on the Second IMO GHG study (IMO, 2009b). Fuel consumptions are shown in Table 6-2. By compari-son, Bachér and Albrecht (2013) calculate with a 200 kg/MWh average fuel consumption assuming 50% operational time and 80% of maximum engine power in use.
• Heavy fuel oil price (IFO380) future price was expected to fluctuate between 0.25 and 0.65 USD/kg which is equal to 200 to 520 €/ton.
• The scrubber system electricity consumption in the calculations followed the Containerships VII measurements and this energy produced by a shaft genera-tor was converted to extra HFO consumption (1.08%). Fresh water was as-sumed to be produced on board by evaporators and this electricity consump-tion was also within the scope of the calculations.
• Sludge production was based on EGCSA Handbook 2012 data (page 96), which gives a value of 0.2 l/MWh (0.24 kg/MWh) for an Alfa Laval scrubber in freshwater mode.
• Scrubber sludge disposal price (200 €/ton) was estimated and it includes transport from ship to disposal plant.
• The alkali price (360 €/ton) source was ICIS Services, Caustic Soda price re-port 10.01.2014. An extra 10% per ton was added for alkali delivery to ship. The alkali concentration was 50% m/m.
• The alkali consumption was the Containership VII measured value for 2.83% m/m sulphur fuel (world average value around 2.7%)
• Other chemical costs were assumed to be included in the alkali costs. • Maintenance cost including wearing parts was presumed to have a fixed price,
20 000 €/year. • In this study the man-year cost was estimated to amount to 100 000 €. Addi-
tional onboard and onshore office work was estimated to account for 25% of the yearly man-hours (Jussila, 2012: 73) and the same estimation was used here. As a comparison Reynolds (2011) calculated the operating engineer cost to be 292 000 USD where half of this cost would be allocated to scrubber use. Operation and maintenance cost is also estimated to be at a level of 1-3% of the investment cost, 28 000 € per year and 0.3-2.5 €/MWh (Den Boer & ‘t Hoen, 2015). Crew training was assumed to be part of the scrubber investment and it was not calculated as operating cost.
• Main engine propulsion energy was based on the Second IMO GHG study, (IMO, 2009b).

106 Acta Wasaensia
Table 6-2. Ship categories, sizes, main engine specific fuel consumptions, average main engine powers and number of days spent at sea (IMO, 2009b).
Category Size/ type
Ave. ME
power (MW)
HFO cons. (kg/MWh)
Days at sea Category Size/
type
Ave. ME
power (MW)
HFO cons. (kg/MWh)
Days at sea
Crude oil tanker
200,000+ dwt 18,0 185 274 Bulk
35,000–59,999
dwt 5,7 194 262
Crude oil tanker
120,000–199,999
dwt 13,7 186 271 Bulk
10,000–34,999
dwt 4,5 194 258
Crude oil tanker
80,000–119,999
dwt 10,2 197 254 Bulk 0–9,999
dwt 1,0 209 180
Crude oil tanker
60,000–79,999
dwt 7,4 195 238 General
cargo 10,000+
dwt 4,7 196 260
Crude oil tanker
10,000–59,999
dwt 5,5 197 238 General
cargo 5000–
9999 dwt 2,4 202 272
Crude oil tanker
0–9,999 dwt 1,4 188 180 General
cargo 0–4999
dwt 0,6 205 180
Products tanker
60,000+ dwt 10,1 185 171 General
cargo
10,000+ dwt, 100+
TEU 5,1 197 240
Products tanker
20,000–59,999
dwt 5,6 196 171 General
cargo
5000--9999 dwt, 100+ TEU
2,4 201 180
Products tanker
10,000–19,999
dwt 3,2 203 183 General
cargo
0--4999 dwt, 100+
TEU 1,2 211 180
Products tanker
5000–9,999 dwt 2,0 210 177 Container 8,000+
TEU 45,9 175 241
Products tanker
0–4,999 dwt 0,7 213 175 Container
5,000–7,999 TEU
36,2 175 247
Chemical tanker
20,000+ dwt 7,2 195 251 Container
3,000–4,999 TEU
22,7 185 250
Chemical tanker
10,000–19,999
dwt 4,1 193 246 Container
2,000–2,999 TEU
14,0 186 251
Chemical tanker
5000–9,999 dwt 2,5 206 246 Container
1,000–1,999 TEU
8,0 194 259
Chemical tanker
0–4,999 dwt 0,8 198 180 Container 0–999
TEU 3,7 194 180
Bulk 200,000+ dwt 12,2 184 281 Ro-Ro 2,000+ lm 10,2 186 219
Bulk 100,000–199,999
dwt 10,6 185 279 Ro-Ro 0-1999 lm 1,9 197 189
Bulk 60,000–99,999
dwt 6,9 195 271

Acta Wasaensia 107 • Main engine extra maintenance cost due to heavy fuel oil use was 0.19
€/MWh (Bachér et Albrecht, 2013). • The capacity utilization factor indicated how fully loaded the ship was. Crude
oil tankers were expected to be fully loaded and the scrubber system weight was assumed to reduce payload without changes in total buoyancy. When the same ship sailed in ballast condition, scrubber weight was supposed to reduce the amount of ballast water on board without any increase in buoyancy. In the case of other cargoes, the average cargo utilization factor was assumed to be 0.9 and scrubber weight was expected to increase sailing buoyancy. Magnus-son (2014) uses value 0.88 for a 14.7 MW RoRo ship and Jiang et al. (2015) value 0.7 for a 5000 TEU container vessel. Low cargo capacity utilization is beneficial for a scrubber installation without payload limitations onboard.
• Ship average payloads used in calculations are provided in Table 6-3 • Ship light weights (Table 6-4) were estimated based on weight statistics in
“Introduction to merchant ship design” (Alanko, 2007). • The weight of consumables on board was estimated at 3% of the ship dead
weight (Table 6-3). • The scrubber system extra light weight followed the Containerships VII
weight calculations where system liquids were included. • Fresh water specific consumption depends on weather conditions, sea water
temperature and the main engine power in use. The water weight in the fresh water tanks was estimated for two days’ consumption as measured in the Con-tainerships VII tests.
• The alkali volume on board was estimated for one-week consumption based on the Containerships VII test results
• Ship sailing days at sea are visible in Table 6-2 (Second IMO GHG study, 2009b).
• The trafficking area affects the HFO heating needs. The MGO consumption in the auxiliary boiler for HFO heating was estimated to be on average 0.5% of the HFO consumption in Baltic waters (Bachér et Albrecht, 2013). Reynolds (2011) calculates process and heating costs to be 0.8% of the fuel cost. In this study the MGO consumption for HFO heating was assumed to be 0.5% of the HFO consumption. Auxiliary boilers were expected to be in use only in ports and at sea heating energy was supposed to be recovered from the exhaust gas boiler. Possible electric fuel heaters were not included in the calculation.
• Heavy fuel oil separation loss was assumed to be 1% of the total fuel con-sumption (marine gas oil separation loss was assumed to be zero). Fuel filter-ing losses were presumed zero.

108 Acta Wasaensia
Table 6-3. Ship categories, sizes, maximum payload, ship light weight and the weight of consumables on board.
Catego-ry
Size/ type
Pay-load (ton)
Light weight (ton)
Consuma-bles (ton)
Catego-ry
Size/ type
Pay-load (ton)
Light weight (ton)
Consuma-bles (ton)
Crude oil tanker
200,000+ dwt 242 500 36 300 7 500 Bulk
35,000–59,999
dwt 46 100 11 500 1 400
Crude oil tanker
120,000–199,999
dwt 155 200 25 800 4 800 Bulk
10,000–34,999
dwt 21 800 6 300 700
Crude oil tanker
80,000–119,999
dwt 97 000 18 000 3 000 Bulk 0–
9,999 dwt 4 900 1 900 200
Crude oil tanker
60,000–79,999
dwt 77 600 15 200 2 400 General
cargo 10,000
+ dwt 12 100 4 700 400
Crude oil tanker
10,000–59,999
dwt 34 000 8 100 1 100 General
cargo 5000–
9999 dwt 7 300 2 900 200
Crude oil tanker
0–9,999 dwt 4 900 1 800 200 General
cargo 0–4999 dwt 2 400 1 000 100
Products tanker
60,000+ dwt 72 800 15 300 2 300 General
cargo
10,000+ dwt, 100+ TEU
12 100 4 700 400
Products tanker
20,000–59,999
dwt 38 800 9 600 1 200 General
cargo
5000--9999 dwt,
100+ TEU
7 300 2 900 200
Products tanker
10,000–19,999
dwt 14 600 4 600 500 General
cargo
0--4999 dwt, 100+
TEU 2 400 1 000 100
Products tanker
5000–9,999 dwt 7 300 2 800 200 Container 8,000+
TEU 99 200 39 100 3 100
Products tanker
0–4,999 dwt 2 400 1 200 100 Container
5,000–7,999 TEU
67 300 27 200 2 100
Chemical tanker
20,000+ dwt 24 300 8 400 800 Container
3,000–4,999 TEU
43 500 18 000 1 300
Chemical tanker
10,000–19,999
dwt 14 600 5 600 500 Container
2,000–2,999 TEU
28 500 12 118 900
Chemical tanker
5000–9,999 dwt 7 300 3 200 200 Container
1,000–1,999 TEU
18 000 7 900 600
Chemical tanker
0–4,999 dwt 2 400 1 300 100 Container 0–999
TEU 6 700 3 100 200
Bulk 200,000+ dwt 242 500 43 100 7 500 Ro-Ro 2,000+
lm 9 300 8 800 300
Bulk 100,000
–199,999 dwt
145 500 28 700 4 500 Ro-Ro 0-1999 lm 5 100 3 800 200
Bulk 60,000–
99,999 dwt
77 600 17 400 2 400

Acta Wasaensia 109 • The fuel cost factor estimates the fuel cost compared with cargo transport in-
voicing. This estimation is needed for lost cargo capacity and lost cargo in-come estimation. The fuel cost share was expected to grow with ship installed power. Net profit was expected to be 25% and fuel cost variation 49 to 80% of the overall costs. Karvonen & Lappalainen (2014) estimate fuel costs at a 49 to 73% level for Baltic Sea traffic.
• Possible tonnage bound costs were not included in the calculations.
The influence of added weight on engine power, fuel consumption and costs was calculated by applying the Admiralty Equation (Bergholtz & Wiström, 2012):
PME = VS3∇
23
CAdm (11.)
Where PME is propulsion power, VS is service speed, ∇ is ship hull volumetric displacement and CAdm is a constant.
6.4 Scrubber cost analysis
In Figure 6-7 scrubber costs and savings are calculated, the prices used for the fuels being HFO 360 €/ton and MGO 600 €/ton. The results indicate that a scrub-ber saves money in all ship categories (the blue lines have positive values). The saving rate is roughly 30 €/MWh.
An important factor affecting the results is the price gap between high and low sulphur fuels. This difference is not known and only theoretical future scenarios are available. If the difference between high and low sulphur fuel prices is re-duced to 160 €/ton (MGO 600 €/ton, HFO 440 €/ton), the result differs from the above (Figure 6-8). A scrubber investment seems to be unprofitable in small size general cargo ships where net savings are just below zero line. This indicates that a scrubber is not an option for low power ships if the price of HFO increases. In the case of a considerable fuel price gap, the total saving between different ship types becomes more uniform; all scrubbers earn money.

110 Acta Wasaensia
Figure 6-7. Main engine exhaust gas scrubber installation savings and expens-es; fuel prices HFO 360 €/ton and MGO 600 €/ton.
The scrubber operating cost structure (MGO 600 €/ton, HFO 360 €/ton) is shown in Figure 6-9. The importance of sludge logistics is minor due to the low sludge production used in the calculations. Alkali consumption and scrubber energy cost are assumed constant in all ship categories. Maintenance is a major burden for low power ships since maintenance costs were expected to be the same, mainly labour expenditure, for all vessels regardless of engine power. The added re-sistance caused by a scrubber installation is neglected in the context of crude oil tankers, as discussed earlier. Added resistance has minor influence also for other ship types. Heavy fuel oil heating cost was assumed constant for all ship types. Here, it is quite low but in reality cold weather conditions will change the result. Lost income due to reduced cargo capacity has the most effect on small ships, container ships and Roro ships. Large vessels with high engine power have the lowest scrubber operating costs.

Acta Wasaensia 111
Figure 6-8. Main engine exhaust gas scrubber installation savings and expens-es; fuel prices MGO 600 €/ton, HFO 440 €/ton.
Figure 6-9. Operational cost structure of main engine exhaust gas scrubber (MGO 600 €/ton, HFO 360 €/ton).
-5
0
5
10
15
20
25
30
Crud
e oi
l tan
ker 2
00,0
00+
dwt
Crud
e oi
l tan
ker 1
20,0
00–1
99,9
99 d
wt
Crud
e oi
l tan
ker 8
0,00
0–11
9,99
9 dw
tCr
ude
oil t
anke
r 60,
000–
79,9
99 d
wt
Crud
e oi
l tan
ker 1
0,00
0 –59
,999
dw
tCr
ude
oil t
anke
r 0–9
,999
dw
tPr
oduc
ts ta
nker
60,
000+
dw
tPr
oduc
ts ta
nker
20,
000–
59,9
99 d
wt
Prod
ucts
tank
er 1
0,00
0–19
,999
dw
tPr
oduc
ts ta
nker
500
0–9,
999
dwt
Prod
ucts
tank
er 0
–4,9
99 d
wt
Chem
ical
tank
er 2
0,00
0+ d
wt
Chem
ical
tank
er 1
0,00
0–19
,999
dw
tCh
emic
al ta
nker
500
0–9,
999
dwt
Chem
ical
tank
er 0
–4,9
99 d
wt
Bulk
200
,000
+ dw
tBu
lk 1
00,0
00–1
99,9
99 d
wt
Bulk
60,
000–
99,9
99 d
wt
Bulk
35,
000–
59,9
99 d
wt
Bulk
10,
000–
34,9
99 d
wt
Bulk
0–9
,999
dw
tGe
nera
l car
go 1
0,00
0+ d
wt
Gen
eral
car
go 5
000–
9999
dw
tG
ener
al c
argo
0–4
999
dwt
Gene
ral c
argo
10,
000+
dw
t, 10
0+ T
EUGe
nera
l car
go 5
000-
-999
9 dw
t, 10
0+ T
EUGe
nera
l car
go 0
--499
9 dw
t, 10
0+ T
EUCo
ntai
ner 8
,000
+ TE
UCo
ntai
ner 5
,000
–7,9
99 T
EUCo
ntai
ner 3
,000
–4,9
99 T
EUCo
ntai
ner 2
,000
–2,9
99 T
EUCo
ntai
ner 1
,000
–1,9
99 T
EUCo
ntai
ner 0
–999
TEU
Ro-R
o 2,
000+
lmRo
-Ro
0-19
99 lm
Scrubber operating costs and savings (€/MWh)
Scrubber netsavings
Fuel costsavings
Scrubberoperatingcosts

112 Acta Wasaensia
Maximum scrubber investment cost per main engine power was calculated with the same fuel prices (Figure 6-10). The used internal rate of interest was 15%. As shown in the figure, scrubbers should primarily be installed on large vessels: crude oil tankers larger than 80 000 dwt, chemical tankers above 5 000 dwt, bulk carriers above 35 000 dwt, and general cargo ships above 5 000 dwt, assuming one million € per MW as a limit value for the investment. Small size low power ships have lower key figures. It should be noted that the scrubber price per MW typically decreases as the scrubber size increases. This means that a scrubber in-vestment in a high-power ship easier reach the scrubber target prize.
Figure 6-10. Maximum relative investment cost of a main engine exhaust gas scrubber per MW based on fuel prices of 600 €/ton for MGO and 360 €/ton for HFO. An acceptable payback time is assumed to be seven years.
If the lowest fuel prices (MGO 400 €/ton and HFO 200 €/ton) are used in the cal-culations, a scrubber investment looks slightly less profitable due to the narrower fuel price gap. Correspondingly, high prices (MGO 800 €/ton and HFO 520 €/ton) improve the situation.
Table 6-4 gives some indication on scrubber installation costs. In a retrofit instal-lation, the scrubber equipment cost is roughly equal to the installation cost. Den

Acta Wasaensia 113 Boer & ‘t Hoen (2015) estimate the typical installation cost to lie within a range from 0.1 to 0.2 M€/MW for newbuildings and from 0.2 to 0.4 €/MW for retrofit installations. However, older studies indicate smaller numbers. Shorter payback time is typically required for retrofitting projects. By comparison, instead of the seven years for newbuilding ships, the maximum scrubber installation prices for retrofit installations are calculated for three years of payback time. The results are shown in Figure 6-11 (MGO 600 €/ton, HFO 360 €/ton). The graph indicates that the scrubber price for low-power ships should be unrealistically low to allow the investment. The importance of an efficient retrofitting process with standardised scrubbers and modular production is obvious. Naturally, high cost MGO relieves the cost pressure. High-power containerships, on the other hand, are optimal plat-forms the scrubber retrofit installations. The maximum price of a scrubber instal-lation per MW (Figure 6-12) varies between 0.15 and 0.5 M€/MW in retrofit pro-jects. This result can be compared with the 0.35 M€/MW cost in Table 6-4. The conclusion is that three years of pay-back time is realistic only for large vessels where the cost per MW can be high.
Table 6-4. Scrubber retrofitting cost (Klimt-Möllenbach et al., 2012).
Manufacturer and type
Operating principle Installation Price (€/MW)
Alfa-Laval Sea-/freshwater, integrated Retrofit 350 000
- Scrubber machinery and equipment 160 000
- Steel (150t) / pipe / electrical installations and modifi-cations
140 000
- Design cost & Classification costs 30 000
- Off-hire cost (installation time) 20 days 20 000
Until the year 2020, emission control areas will be playing a determining role in scrubber installation projects. When ship operators evaluate their SOx policy, the factors to be analysed are fleet size, type and age, sailing time inside an SOX-ECA, potential new SOX-ECAs in future, etc. (Lloyds Register, 2012). It is es-sential to estimate the fuel consumption inside the different control zones. A scrubber earns money only within control areas where the use of high-sulphur fuels is not allowed. In some cases, route optimisation, based on maximum sailing distance outside the control areas, offers options for cost-saving. Since the sul-phur limits are tied to calendar days, 1.1.2020 or 1.1.2025 the vessel’s remaining
114 Acta Wasaensia
operational life is an important parameter when a retrofit investment is consid-ered.
Figure 6-11. Maximum investment cost for main engine exhaust gas scrubber in retrofit projects based on fuel prices of MGO 600 €/ton and HFO 360 €/ton and three years of payback time.
In the above calculations, only main engine scrubbers were studied. If diesel-electric machinery is installed on board or auxiliary power consumption is other-wise high, total installation with separate scrubbers or an integrated scrubber is an option. Typically, crude oil tankers have high-capacity auxiliary steam boilers and also these combustion units should be connected to scrubbers to save money. In addition, vessels navigating in ice and also ocean-going tugs typically consume plenty of energy making them attractive scrubber platforms in future.

Acta Wasaensia 115
Figure 6-12. Maximum investment cost of main engine exhaust gas scrubber per engine power based on fuel prices of MGO 600 €/ton and HFO 360 €/ton and three years of payback time in retrofit projects.
6.5 Conclusions
In this chapter, a merchant ship closed-loop fresh water scrubber investment was analysed at a general level by using the internal rate of return method. The fol-lowing assumptions were made prior to calculation: • a 15% internal rate of interest • Scrubber age equal to the ship’s age • Ship and fuel data based on IMO GHG study 2009 (IMO, 2009b) • Parameters used in the calculations: ship deadweight, payload, light weight,
average main engine power, main engine specific fuel consumption, fuel pric-es, MGO cooling energy, HFO heating energy, scrubber energy consumption, scrubber sludge cost, scrubber alkali cost, scrubber maintenance cost, scrub-ber system weights including liquid storage and fuel cost in relation to freight income
• Fresh water production on board from sea water
For newbuilding ships, the findings were as follows: • A scrubber installation saves money in all newbuilding ship categories as far
as the fuel price difference is at least 160 €/ton
116 Acta Wasaensia
• Alkali costs constitute a dominant part of scrubber expenses • Added resistance cost has minor importance • Maintenance cost burdens low-power ships • Lost income due to scrubber is of greater importance in small ships • Scrubber installations are profitable, however, the greatest profits are gained
in large and medium size vessels • Future fuel price development is an essential scrubber population growth driv-
er; cheap low-sulphur high quality fuel is the greatest threat for scrubber in-stallations
Calculations indicate that scrubber investments were not viable for small ships. For retrofit installations, shorter payback time is required which adds price pres-sure for the organisations executing such installations. A lengthy docking period, outfitting work onboard a moving ship and commissioning processes must be included in the retrofit installation costs. Vessel age is an important factor; modi-fications in ship machinery systems are not attractive during the latter half of the ship’s service life. No scrubber investments will be made into old fleet; thus, these vessels will disappear first from SOx-ECA waters if the price of MGO rises.
Jiang et al. (2015) estimated the required price difference between MGO and HFO to be at least 231 €/ton for a viable scrubber investment when also social environmental benefits are calculated. For retrofit installations the value was 233 €/ton. In this thesis the price difference was 160 €/ton for newbuilding ships. Kjölholt et al. (2012: 46) estimate that sea water scrubbing cost for a reduced ton of sulphur dioxide inside SOx-ECA is 1.5 to 1.6 times more expensive in retrofit installations than in newbuildings. Maersk Maritime Technology finds scrubber vessels an attractive option in 2020 if the ship’s daily fuel consumption is 100 tonnes or more (Sustainable shipping, 2012-09-17).
This economic analysis has the following limitations: • The calculations are at a general level and precise ship-specific studies may
lead to different results. • Plenty of assumptions were needed to enable these calculations. • Future fuel prices are unknown while, however, it is possible to purchase ship
fuel at a fixed price as an option with the delivery years ahead, which elimi-nates the unpredictability of this factor.
• The years before the global emissions limits enter into force (2020) are not included in the study.
• This cost analysis is calculated only for traditional cargo ships: ferries, cruise vessels, yachts, offshore ships, service vessels, fishing vessels, military fleet and other special ships are excluded.

Acta Wasaensia 117 7 DISCUSSION, CONCLUDING REMARKS AND
RECOMMENDATIONS
7.1 Scrubber performance
The operational performance of a closed-loop scrubber was validated during the MT Suula tests. The scrubber unit and part of the auxiliaries on board were not originally designed for Suula and the system was partly oversized with regard to the auxiliary engine to which it was connected. In general, the exhaust gas clean-ing efficiency was impressive; the system had to be operated wrongly (e.g. close part of the washwater spray nozzles) to reach exhaust gas quality at an unaccepta-ble level. Effluent quality also passed the acceptance criteria and the scrubber system was certified as the first marine installation in the world. The conclusion drawn from the tests was that the technology was ready for commercial installa-tions. However, the operational reliability of the system was not at a level typical-ly required of ship systems due to the temporary nature of the installation. After the tests, the scrubber was removed from the ship.
The commercial scrubber installation on board Containerships VII confirmed the previous good exhaust gas cleaning results. The challenges of the installation were found to lie in effluent treatment which required further improvements to attain an acceptable level of turbidity in effluent.
The production of clean fuels in refineries releases predominantly carbon dioxide emissions to the atmosphere in the refinery location area. These emissions com-bined with MGO ship emissions are more significant than the emissions output of a heavy fuel oil scrubber ship. The focus of the scrubber pollution debate is on effluent discharges from ship to sea although the effluent quality and quantity fulfils the IMO criteria. This water stream is spread into a wide water area when the ship is moving. However, in ports, estuaries, rivers or lakes, effluent discharge is diluted to a lesser extent.
7.2 Operational issues
In this thesis rough economic calculations were made. As a result, most merchant ships, excluding the small ones, should consider scrubber installation. Scrubbers save money if fuel consumption multiplied by the fuel cost difference between high- and low-sulphur fuels is sufficient. The most common method to save fuel is slow steaming. The disadvantage of slow steaming is reduced haulage volume

118 Acta Wasaensia
and cash flow per ship. Slow steaming has been criticized since it favours under-powered ships. These ships are inefficient in ice conditions and are considered unsafe in stormy weather conditions. For the same transport task, the number of slow-speed ships is greater than that of traditional faster ships, which means in-creased investments in fleet. If scrubbers are used savings are possible to attain without slow speed. Scenarios concerning the other parameter, fuel price, are dis-cussed in Chapter 7.3.3
Due to alkali bunkering needs, port logistics is important for closed-loop scrub-bers. Furthermore, fresh water supply to ship may be required as an option to sea water evaporation at sea. Scrubber outputs, mainly sludge and possibly dirty ef-fluent, need to be pumped onshore. The port logistic system for ship fluids may be a permanent installation with pipelines for line traffic or it may be based on tank trucks. In the latter case, timing is important; ship and trucks must be in port in tandem. MARPOL Annex VI Regulation 17 states that reception facilities for exhaust gas cleaning residues from ships must be ensured in ports “without caus-ing undue delay to ships”. Based on this, effluent logistics should not be a prob-lem for closed-loop scrubber ships. However, alkali supply to ports must be ar-ranged by the ship operators.
7.3 Scrubber investment
7.3.1 Scrubber installation
For shipping companies, the most appreciated scrubber features are user-friendliness, considered health and safety aspects, simple installation, reliability in operation, the zero-effluent option, and low price. Furthermore, operation without chemicals is of significance for ship-owners. Rajeevan finds retrofit installations a major challenge for scrubbers (2012: 15). Operators are happy with emissions low enough to attain legal limits; enthusiasm for extremely low emissions levels is not common.
In other sources, ship-owners are said to find several reasons which make scrub-ber investments unattractive: • Scrubbing technology development is considered untested and not ready for
commercial investments (Sustainable Shipping News, 2012-06-01), which means a higher investment risk.
• Scrubbing technology is new for shipowners (Sweco, 2012: 21) and for the majority of the people working in the engine room. Readiness for a change may be low.

Acta Wasaensia 119 • The scrubber retrofitting period is long, up to eight months during which the
vessel is out of operation for three weeks (Sweco, 2012: 22). Outfitting work on a sailing ship is an extra burden for the crew.
• Effluent contains higher amounts of sulphur compounds than allowed in mu-nicipal sewage systems and sludge may be classified as hazardous waste, in-creasing disposal costs (Franck, 2013). If the vessel is sailing in line traffic sewage logistics can be organized quite easily; by contrast, in tramp traffic the challenges are greater as long as the global population of scrubbers is scarce.
• There is uncertainty about future legislation (Den Boer & ‘t Hoen, 2015). Shipowners are not willing to invest in technology which may be subject to operational restrictions in future.
However, the number of scrubbers is growing at an accelerating speed. In June 2014, a total of 83 ships were furnished with scrubbers and another 42 were to be installed (ShippingWatch, 2014-06-18). National subsidies for shipping compa-nies to support scrubber installations are in use to speed up investments (Enkvist, 2013) and European Union has started similar actions.
Scrubber investment conditions are different for newbuilding ships and for retrofit installations. In newbuildings, a scrubber system is simply one additional system among other machinery systems on board. The shipyard performs the scrubber installation and tests as part of the complete newbuilding project. The ship guar-antee covers all the ship systems which minimizes the shipowner’s risks. In gen-eral, the investment conditions are quite clear and easy to specify. Technically speaking, a new ship is the optional platform for a scrubber installation.
Scrubber retrofitting into old ships is more complicated and more expensive and technical challenges are often faced (ECSA, 2014). A major limiting condition is the remaining operational lifetime of the ship; if scrapping is expected in the near future, new investments are not an option for the specific ship. Another difference compared with new ships is higher investment cost due to the more challenging installation. Space for the scrubber system must be found or created on board. Traditional merchant vessel architecture - main engine in aft part of the ship, fun-nel above engine room, deckhouse in front of funnel and cargo spaces in the mid-dle plus the fore part of the ship – is quite well suited for the scrubber. An addi-tional steel structure for the scrubber can often be installed behind the funnel without losing cargo capacity. This quite homogenous merchant fleet is the best market for standardised scrubber installations. As the number of installations grows, the best technical solutions and practises will be found and scrubber turn-key delivery prices may be reduced. If a part of the cargo space needs to be modi-fied for the scrubber system, the shipping company’s cash flow may be reduced

120 Acta Wasaensia
due to the decreased cargo capacity. Also the out of service time at dry-dock dur-ing the scrubber installation will be longer than normally during the standard pe-riodical dockings, which results in lost freight income. A fifth point is the liability for the installation. If the shipowner orders the scrubber system as a turn-key de-livery with comprehensive penalty clauses, the liability issue is quite clear. In the case of a delivery split between several contractors, the risk of conflicts is greater.
Rajeevan (2012) notes the negative but still acceptable issues regarding scrubber installation: loss of cargo space, weight and stability challenges, effluent dis-charge to sea, and operational matters. However, scrubber technology offers to-day a tested robust option for conducting more profitable business.
7.3.2 Legislation development and enforcement
The development of emissions legislation should be predictable, persevering and globally harmonised as far as possible. Survey results indicate that a majority (83%) of European ship operators find that there is lack of regulatory clarity in the scrubber effluent discharge issue. If more regulation causing complications for scrubber use is expected, shipowners’ interest in this technology will decrease. In practice, there are three aspects to regulation. The first one is the rules them-selves, i.e., how the text is written. The second aspect is the interpretation, that is, what the written rule means in a technical or administrational context. The third and most important viewpoint is the practical implementation of the rules. The practices and standards related to scrubber technology are not fully established yet. In the following, items to be improved further are listed (ESSF, 2014): • Trials and commissioning in general • Possibility to use non-compliant heavy fuel oil during scrubber system com-
missioning • Washwater discharge pH value and washwater plume verification (sea water
scrubbers) • Scrubber use in ports (if zero effluent mode is not possible) • Scrubber sludge reception in ports • Fuel quality specifications • Scenarios for non-compliance operation • Alkali bunkering • Port reception facilities
So far, scrubbers are not widely used in ships. As far as the scrubber regulation is not harmonized or the interpretation is unclear, shipowners find scrubber invest-ments less attractive. The strictness of the rules may vary but the most difficult conditions are created if separate rules conflict with each other without a clear

Acta Wasaensia 121 view of how to solve the problem. Examples of possibly conflicting rules are the European Union Water Framework Directive (EU, 2013), the Marine Strategy Framework Directive (EU, 2008a), and the Sulphur Directive (EU, 2012). The shipping industry demands predictable regulation.
In addition to clear scrubber legislation, also efficient enforcement is needed. Emission rules are of no importance if ship fuel compliance is not controlled ef-fectively by the authorities and the penalties for the use of illegal fuel onboard are not high enough to eliminate cheap fuel profits. Ship compliance with the rules can be controlled by emission measurements on board combined with tamper-proof recording, by measurements outside the ship (e.g. sensors installed in ports, on airplanes and on bridges along the ship routes etc.), or by port control fuel samples. The fuel sample method is challenging if the ship is crossing water areas with different sulphur limits and different fuels are used.
It appears unlikely that fuel malpractices in regular traffic would be common in-side emission control areas; sanctions will be tuned to a sufficient level to prevent this. However, ships visiting the control area rarely are in a different position. The temptation of using illegal cheap fuel may grow. In some cases the bunker deliv-ery note has not corresponded to the fuel in use and the ship has not been aware of this bunker non-compliance. Some ship operators consider the detention of a vessel carrying noncompliant fuel the most significant cost for the company (Sus-tainable Sipping News, 2012-11-07). Norwegian authorities have fined 3% of the vessels arriving to SOx-ECA ports. Fuel sulphur level, trading time inside control area and ship size (profit) have been considered when the fines were issued (Sus-tainable Shipping News, 2015-07-30).
To accelerate scrubber installations, the enforcement of sulphur legislation includ-ing penalty scale standards should be clarified. IMO sulphur regulation was im-posed in 2008. However, the practical methods, standards and instructions have not been cemented yet. The work at IMO should be speeded up and its global weight in relation to lower level legislation (national restrictions) should be in-creased, which is a political issue.
7.3.3 Low-sulphur fuel price and availability
High-sulphur residual fuels in general are cheap since they are normally not pro-cessed after segregation. The EU-27 model calculates that the price of low-sulphur (0.50% m/m) residual marine fuel is close to that of distillate fuel (Das-tillung et al. 2006). The reason for this lies in the investment costs of desulphura-tion facilities which are only marginally higher than the investments required by
122 Acta Wasaensia
residual conversion technology producing distillate fuel. If the extra price of low-sulphur residuals is not sufficient, residual conversion to distillates or exportation would be economically more attractive.
Major upgrade projects at oil refineries are estimated to have lead-times from four to five years meaning that low-sulphur fuel production reacts slowly to active changes in demand. A clear signal is needed that the 2020 sulphur cap date is binding and sulphur abatement technologies will not be widely used to launch refinery investments for MGO production. The European Union has already de-cided not to accept the use of the later 2025 option. However, the marine fuel market is assumed to have minor impact on refinery investments in general.
Global fuel price development in future cannot be predicted; price formation is too complex. In general, such bunker fuels are supplied by oil refineries for which there is demand on the market. In case of unexpected demand peaks, there may be shortage of specific fuel types, which normally means higher prices. On the other hand, overproduction of crude oil reduces oil product prices, which was the case at the end of 2014. For scrubber investments, a critical parameter is the price dif-ference between high- and low-sulphur fuels. During the past years this difference has been sufficient to ensure profitable scrubber investment.
British Petroleum Statistical Review of World Energy (2014) data is used in Fig-ure 7-1 to indicate the consumption trends of different oil products. Marine gas oil is one of the middle distillates and marine heavy fuel oils are categorized as fuel oils. It can be seen that the relative consumption of middle distillates has grown quite steadily since 1965. On the contrary, the relative share of fuel oil has been decreasing since the end of the 1970s. In total, global heavy fuel oil consumption was 475 million tonnes in 2007.
Det Norske Veritas (2012) estimates in their simulations that the annual demand for marine distillates will be 45 million tonnes in 2015 when 40% of the world fleet visit SOx-ECA waters. In 2012, distillate consumption was 30 million tonnes. According to the prediction, this market will grow further to 200 to 250 million tonnes by 2020. Heavy fuel oil consumption is supposed to remain stable at 290 million tons annually until the year 2019, accounting for over 80% of total marine fuel use. Within emission control areas, the demand for high-sulphur fuel (3.5%) will decrease and availability will be low.

Acta Wasaensia 123
Figure 7-1. Global oil consumption trends by product group (British Petrole-um)
Robin Meech (2013) has studied marine fuel availability and future price. His conclusions are listed below: • Global bunker demand growth will be moderate until 2025 after which it will
start to decline slowly. • Consumption of maximum 0.10% m/m sulphur distillate will triple in 2015.
The consumption will then be steady until 2025, after which it will decrease slowly.
• In 2020, the consumption of 0.10 - 0.50% m/m sulphur distillate will start in Europe and there will be a major increase in demand in 2025 when the global sulphur cap is assumed to enter into force globally.
• Residual fuel demand will be stable (around 200 million ton annually) until 2025 after which demand will start to decrease.
• High-sulphur fuel will be 20% cheaper after 20 years and 0.5% sulphur fuel price will increase by 30 % compared to high-sulphur fuel in 2013. MGO price will not climb steeply in 2015.
• The availability of 0.1% distillate will be sufficient in 2015 but that of 0.5% fuel will be a problem if the global sulphur cap enters into force in 2020. Bal-ance is possible before 2025, however, exploitation of scrubbers and LNG bunkers is needed to reduce the demand for 0.5% fuel.
0 %
10 %
20 %
30 %
40 %
50 %
60 %
70 %
80 %
90 %
100 %
1965
1967
1969
1971
1973
1975
1977
1979
1981
1983
1985
1987
1989
1991
1993
1995
1997
1999
2001
2003
2005
2007
2009
2011
2013
World volumetric oil consumption by product group
Others
Fuel oil
Middle distillates
Light distillates

124 Acta Wasaensia
A different opinion is presented by Turner, Mason & Company consultant John Meyes (Sustainable Shipping, 2013-12-23). His conclusion is that it will not be a problem for refiners to meet the demand for 0.5% sulphur fuel already in 2020. The solution would consist of blending heavy fuel oil produced from low-sulphur crude oil with distillates. Meyes points out that one third of world crude oils have a sulphur content of below 0.55% and residuals made of this crude oil have sul-phur levels of up to 1.25%. After blending with distillates, the 0.5% sulphur cap can be reached. Major impact on prices may be expected.
Global distillate demand and supply are shown in Figure 7-2 (American Bureau of Shipping, 2013). Inland demand plays a major role in consumption. No re-markable changes in the fuel market were expected in 2015 when SOx-ECA limits enter into force. The IMO fuel oil availability study 2018 will be important doc-ument when the global sulphur limit deadline date is decided. The later date of 2025 instead of 2020 seems to be the favourite. After the deadline, the consump-tion of low-sulphur fuels will grow. The possible success of scrubber technology in near future will be based on cheap prices of high-sulphur fuels – not so much on the low-sulphur availability issue.
Figure 7-2. Projection of global distillate supply and demand (American Bu-reau of Shipping)
19 50 48
164221
72 71 7527 7
1134 11251234
12771357
1225 1246
13571468
1585
1199 1226
1336
14261530
0
200
400
600
800
1000
1200
1400
1600
1800
2014 2015 2020 2025 2030
Global middle distillate demand and supply per year (million tons)
Marine (S<0.5 %)
Marine (higher sulphur)
Inland
Total consumption
Supply
Acta Wasaensia 125 7.3.4 Investment risks
At least four types of scrubber risks exist; there are economical risks, technical risks, political risks, and a ship safety related risks. The risk categories have some overlap: an accident which is caused by technical reasons will often have eco-nomic consequences. Scrubber systems must be reliable in operation. Operational safety is often connected with shipping company standards, human action, crew training, operational procedures, maintenance, and the like. Ship technology and safety can be improved but some financial risk factors, such as future prices of fuel oil, are not manageable by the owner, nor are the political decisions affecting markets and regulation. Investments in alternative solutions also carry risks and therefore scrubber risks should be compared with other existing low-sulphur technologies.
Some scrubber investment risks are classified in Table 7-1. Three different risk groups – technical, financial and political – are presented. In the table, health and safety risks are seen as technical risks. Safety issues are closely connected to alka-li and other new chemicals on board. The fuel price development risk strongly affects the scrubber pay-back time. Regulation is subject to political risks. Some uncertainty towards possible future scrubber operational limitations exists. The human element is seen as a potential “other” risk. This risk category may also include the shipping company public image. For passenger ship operators in par-ticular, a good reputation is important; green and blue ships have high market value.
Scrubber risks should be analysed. A typical method is the use of a probability-consequence map where scrubber risks are first identified at first, the probability of each risk is estimated, and the consequences are evaluated. High scrubber risks are typically found in bleed-off treatment systems, upscaling and dimensioning of the systems, alkali operations, crew training, and a delayed commissioning peri-od. Classification societies are interested in safety related risks as part of their technology qualification processes. Typically, system requirements are set, threads assessed and qualification methods selected, evidence is collected and compliance with the requirements estimated. Modifications in the scrubber sys-tem may be needed as a result of the qualification process. In general, the risks of an exhaust gas scrubber should be analysed similarly to the risks of any other new ship system.
The need for analyses will be reduced as the population of scrubber units grows. Feedback from running systems will lead to technical improvements and invest-ment affecting operational data shall be more readily available. A scrubber as part of the ship exhaust gas system is not essential for ship operation as long as ex-

126 Acta Wasaensia
haust gas flow from running combustion units into the atmosphere is secured and propulsion power production is not interrupted. So far, serious accidents caused by scrubbers are not known.
Table 7-1. Scrubber risks (Rajeevan, 2012: 13 and Det Norske Veritas, 2012).
Risk classification Risk
Technical risks Availability and redundancy Exhaust gas backpressure System complexity Emission performance Fitting in the ship Installation challenges Maintenance and system downtime Noise Safety issues Scrubber operational uncertainties Scrubber sludge reception possibilities Financial risks Energy efficiency Retrofit installation cost & payback time Life cycle costs Price gap MGO / HFO development Political risks, rules and regula-tions
Compliancy with the rules Limits for the use of scrubbers Local limitations in scrubber use Unfavourable revision of IMO guidelines or EU sul-phur directive
Other risks Human element
7.4 Shipping company options and scrubber market
A shipping company has at least the following alternative strategies for proceed-ing with the strict sulphur limits (Table 7-2): scrubber investment, no measures, use of expensive low sulphur-fuel combined with extra cargo surcharges, opera-tion on alternative fuels, investments in new energy efficient fleet and, as an ex-treme solution, abandoning the business. Continuous operation on illegal fuel is not seen as an option, or it should not be an option.

Acta Wasaensia 127 Shipowners may lobby for the postponing of the enforcement of the 2020 (2025) sulphur legislation as far to the future as possible. One common argument pre-sented in support of the continued use of high-sulphur fuel is the increased cost to the industry resulting in loss of jobs due to the expensive distillate fuel. An oppo-site economic view is represented by the European Commission which has esti-mated the costs of sulphur limits for the shipping industry as amounting to 3.3 to 4 billion dollars. Simultaneously, public health savings would amount to as much as 38 billion dollars due to the reductions in ship-generated emissions (Sustaina-ble Shipping News, 2012-05-25). Environmental arguments are also used against the sulphur limits. Sulphur is expected to create clouds in the atmosphere which reflect heat back to space. This would reduce general climate warming. High-sulphur fuel should be avoided in ports but the same fuel is recommended for open seas (Kivimäki, 2012). At the moment, the 2015 to 2025 sulphur regulation schedules do not seem to be subject to postponing.
Table 7-2. Alternative strategies for shipping companies.
Strategy Target
1. Scrubber investment Cost savings by using cheap fuel and possible public subventions for the investment
2. No measures Confidence in sulphur legislation retardation from 2020/2025 or IMO resolution write-off
3. Low-sulphur fuel sur-charge
Better income by applying sulphur surcharges or higher freight rates in general
4. Alternative fuels Fuel cost savings, possibility to obtain subven-tion for the investments
5. Investment in new ships Higher ship energy efficiency, lower fuel costs
6. Abandoning the business Profitable operating strategy found in other sea routes or selling out the existing fleet
If sulphur limits are not delayed, the first technical step for existing fleet is to start using marine gas oil or other low-sulphur mineral oil fuels. Higher fuel costs may be compensated for by increasing freight rates. A survey by the European Com-munity Shipowners’ Associations (ECSA, 2014) concludes that 43.6% of the re-spondents – ship operators wholly or partly active in European SOx-ECAs – are planning to increase freight rates. The rate increase varied between 1 and 15%. Year 2015 low global crude oil prices will smooth out this effect. A shipping company can try to protect itself against the high prices by implementing addi-

128 Acta Wasaensia
tional surcharges for the cargoes, i.e., the so-called MARPOL fee. Depending on the allowed fuel sulphur contents in different sea areas prior to 2020 (2025), fuel type may be switched from distillate to heavy fuel and back during the trip. In some cases, ship route optimisation outside emission control areas is also possi-ble.
Today, environmental image is of importance to a company. Mitsui O.S.K. Lines Ltd. have decided to regularly publish the containership service key performance indicators. One of the environmental parameters to be followed is the sulphur oxides emission reduction ratio. The company aims at transparency towards cus-tomers and the achieved results will be published on the Internet (Sustainable Shipping News, 2012-03-03).
Alternative fuels, mainly liquefied natural gas (LNG), are in use. As long as the availability and acceptable price of the fuels are in order, new fuels are an attrac-tive option for newbuilding ships. For retrofitting, LNG technology is not widely installed due to high costs. Other fuels, alcohols (methanol, ethanol), liquefied petroleum gas (LPG), dimethyl ether (DME) and equivalent are mentioned as possible sulphur-free options in future. Diesel fuels originating from non-conventional feedstocks are burned in some ships. In general, the production costs of new diesel fuels should be less than the price of mineral oil fuels to increase the competitiveness of the shipping company.
By selling old ships and ordering new ones, the overall efficiency of the fleet can be improved. However, funding may be a challenge. In the worst case the ship-ping company’s operations are terminated due to unprofitable business (Sustaina-ble Shipping News, 2014-02-28).
Which are the shipping company’s options? • Sulphur legislation will enter into force as planned, passivism is no option. • Use of low-sulphur fuels is an option for modern small-scale high energy effi-
ciency ships. High quality fuels can also be used if the general fuel price trend is low.
• Today, scrubber investments are made within SOx-ECA waters and starting from 2020 also within other EU waters. Scrubbers and HFO will be the main exhaust gas cleaning technology after the year 2020 or 2025 due to the high cost saving potential.
• The use of alternative fuels, mainly LNG, will grow. If there is public subven-tion to support other alternative fuels and fuel delivery logistics, these fuels will enjoy a growing volume.

Acta Wasaensia 129 • Cargo shipping companies will most probably not be paid extra due to a
“green” image. However, this image can be valuable for passenger ship com-panies.
• Variable and flexible (Rajeevan, 2012:25) technical solutions to fulfil sulphur regulation will be seen in future.
Quite obviously, exhaust gas scrubbing will be the leading technology employed to reach low-sulphur emissions in European Union waters after the year 2020 and globally 2025 due to the low operating cost. The bottleneck, investment funding, should be more relieved by using part of the expected healthcare savings (due to clean air). This would speed up atmosphere self-purification and at the same time enable low-cost sea traffic.
The European Sustainable Shipping Forum (ESSF) sub-group on financing has analysed the investment situation, concluding with the following findings (ESSF, 2014): • Abatement technologies may be economical. • Scrubber price is estimated at four million euros on purchase. • Installation cost may extend to 15 million euros. • In shipping business, margins are low and access to maritime loans is narrow. • Commercial banks require low risks before granting loans (new EU banking
regulations). • Unclear bunker price prospects and insufficient feasibility analyses freeze the
investors. • State aid can be granted to scrubbers.
European Union has started to support the projects improving environmental per-formance and infrastructure as a part of Connect Europe Facility programme. Part of the money will be used for scrubber retrofitting (Marine propulsion & auxiliary machinery, 2015).
The total world merchant fleet comprised 79 074 ships in the year 2012 (Kirjo-nen, 2013; 63). This fleet included 47 460 general cargo ships, specialized cargo ships, container ships, ro-ro ships, bulk carriers, oil and chemical tankers, gas tankers and other tankers. If small ships with a volume of less than 500 gross ton-nage equipped with low-power engines are excluded, the remaining fleet size was 40 254 merchant vessels. The trend towards higher installed engine power in ships has been dominant since the 1990s (Kirjonen, 2013; 109). Ships with con-siderable fuel consumption are the target group for scrubber installations. This ship population offers numerous opportunities to manufacturers for offering more standardised scrubber solutions to customers. Standardisation reduces system price and risks, shortens delivery time and improves system quality.

130 Acta Wasaensia
Det Norske Veritas (2012) predicts potential for several thousand scrubber instal-lations for the year 2020 when the global sulphur limit enters into force, at least within European Union waters. Purvin & Gertz (2010) estimate that half of the global HFO bunker is consumed by six thousand high power ships; the total fleet is approximated at 100 000 vessels. Before 2020, scrubber installations will be rare outside SOx-ECA waters since only a minority of the global fleet operates continuously within the areas.
7.5 Concluding Remarks
This is a study on two fresh-water closed-loop scrubber installations and use based on measured data. The analysis covers technical, environmental and eco-nomic aspects. Scrubber properties were evaluated by using engine power (MW) as a parameter.
The objective was to find answers to the following questions: 1 Is exhaust gas scrubbing economically and environmentally a better solution
for preventing sulphur emissions into the atmosphere than the use of distilled fuels?
2 Which are the boundary conditions and drivers for the ship owner to order a scrubber system to his ship?
3 How challenging are the technical details when scrubber technology is inte-grated with a merchant vessel?
4 Which are the most suitable ship types for scrubbers? 5 What kind of practical experience based on the two built installations was
found? 6 Are there environmental aspects which support exhaust gas scrubbing? 7 Are there other drivers - excluding the economical, technological and envi-
ronmental ones - affecting the popularity of scrubber installations?
Based on the research conducted during this thesis project the answers are: 1 From the economical perspective, a closed-loop exhaust gas scrubber is a bet-
ter solution for merchant ships which have at least 2 MW main engine power than the use of distillate fuel. High fuel consumption favours scrubbers. Envi-ronmentally, the use of scrubbers is a slightly less favourable option at sea than the use of high quality fuels. If heavy fuel oil is seen as waste with lim-ited use elsewhere in society and if refinery emissions due to distillate manu-facturing are expected to burden only high quality products, the use of scrub-bers offers a 5 to 6% m/m reduction in CO2 emissions compared with marine gas oil. As regards effluents, a closed-loop scrubber operating in zero-effluent

Acta Wasaensia 131
mode is equal to an MGO ship. In all closed-loop running modes, effluent flow out of ship is nonacidic and it has low volume compared with sea water scrubbing.
2 An investment always contains risks which can be divided into risks related to future price development, technical risks, safety risks, and regulation-linked risks. In general, scrubber investments are attractive if the difference between HFO and MGO prices is at a level where MGO is at least 25% more expen-sive than HFO. Also, the general fuel price trend should be at a fairly regular level with regard to other ship operating costs. At the moment there are no signs indicating that this price difference would disappear between the two fuels. Also the absolute fuel cost difference has importance. Scrubber saves money in all ship categories if the fuel cost difference is at least 26 €/MWh. Technically, scrubbers work well and remove sulphur from exhaust gas with-out problems. Challenges have been found in scrubber subsystems; however, these question marks will disappear as part of technical development. Unclear future legislation, harmonisation challenges and unestablished certification processes restrict the scrubber expansion. Encouraging references are psycho-logically important and attractive funding possibilities would increase the market activity.
3 Technical details are challenging in retrofit installations, which is seen as a higher investment price. The greatest challenge is to find the required space for the equipment inside a small ship. Also tank modifications may be com-plicated. In the worst case, no investment will be made due to the long pay-back time.
4 The merchant vessels best suited for scrubber installations are the big ones with high fuel consumption; large tankers, bulkers, general cargo ships and container vessels. Also special ships consuming large volumes of fuel, such as ocean-going tugs and ice-breakers, are good platforms for scrubbers.
5 The main observation during the MT Suula and MV Containerships VII tests was that the sulphur removal of a closed-loop scrubber works extremely well, showing sulphur removal efficiencies of almost 100%. The other important finding was that a scrubber retrofitting process is a demanding task. The pro-ject planning and execution needs to be upgraded to a higher level than the present state of the art. The repeatability of good practices beginning from contract and ending at final approval should be ensured.
6 Regulation sets the criteria for the emissions. The carbon dioxide footprint of the scrubber option is less than the emissions of an MGO ship if the refinery emissions of MGO production are taken into account. As regards effluent, a closed-loop scrubber operating in zero-effluent mode is equal to an MGO ship. In all closed-loop scrubber running modes, effluent flow is nonacidic and flow volume is low compared with sea water scrubbing.

132 Acta Wasaensia
7 In general market forces will not pay extra for “green transport” and the cost of expensive low-sulphur fuel will end up being added to cargo charges by shipping companies operating non-scrubber vessels. Fuel prices are subject to fluctuation, which may relieve or aggravate the cost pressure. However, pub-lic opinion appreciates clean technology; any extra pollution especially to sea is considered unacceptable in developed countries. Authorities prepare the regulation for political decision-making processes under political guidance and also the regulation enforcement is in the hands of authorities. Politicians can play an important role in advancing the harmonisation of legislation in-stead of creating more local or national rules. The authority of the IMO should be respected and at the same time the decision-making process in the organi-sation should be speeded-up. The shipping industry as a global business needs predictability for scrubber investments. Funding instruments to help clean technology investments are equally important for the shipowners.
As the final result of this study, the following theses were formulated: • A closed-loop scrubber works well on ships and it is a potential and attractive
solution for sulphur removal from exhaust gas. • Zero-effluent scrubbing is the cleanest way to operate a ship with heavy high-
sulphur fuel oil. • Zero-effluent scrubbing offers the possibility of removing effluent treatment
apparatus from the ship and effluent quality criteria can be disregarded. • The merchant fleet, 40 000 ships, constitutes the large market for scrubbers,
with possibilities for standardised scrubber solutions. • A scrubber installation ensures profitable ship operation in a situation where
marine gas oil is more expensive than heavy fuel oil and alternative fuel price development and availability is unclear.
• In newbuilding ships, scrubber investment payback times are short. • In retrofit installations, an efficient installation process ensures project profit-
ability for the ships with more than ten years of remaining lifetime.
7.6 Recommendations
Based on this study the following recommendations are made: • Scrubbers offer an option for using high-sulphur heavy fuel oil in ships in fu-
ture. Scrubbing technology applications should be promoted. Without demand HFO will become a low-value product, practically waste, in advanced socie-ties.

Acta Wasaensia 133 • Closed-loop scrubber installations on merchant ships should be studied care-
fully by shipping companies as an option to meet the requirements of sulphur regulation.
• Instead of pumping effluent into the sea, non-polluting zero effluent scrubbing solutions should be developed. Effluent storage on board, treatment on board, port reception facilities and land based wash water treatment technologies should be improved to enable this scrubbing mode.
• Scrubber installation standardisation including the equipment, onboard lay-outs and outfitting processes should be improved. This will increase the lucra-tiveness of scrubbing, especially in scrubber retrofitting projects.
• In future, prefabricated and tested exhaust gas treatment units should be in-stalled into ships. These units would include exhaust gas cleaning, exhaust gas energy recovery, and noise attenuation. Exhaust gas units would offer a modular solution for the large population of single-engine merchant ships. The final target could be a standardised exhaust gas funnel delivered to the shipyard as a tested component ready to take in exhaust gas immediately after installation into ship.
• Scrubber installations into existing fleet are more expensive than fitting new-buildings with scrubbers. Therefore, retrofitting processes should be in the fo-cus of future ship machinery research projects.
134 Acta Wasaensia
8 SUMMARY
The objective of the study was to estimate the suitability of closed-loop fresh wa-ter exhaust gas scrubbers for fuel sulphur removal in ships. The main criteria were technical, environmental and economic.
Basic information was collected and data measured during the scrubber installa-tion work, start-up, testing and certification on motor tanker Suula and on con-tainer vessel Containerships VII. The Suula scrubber was the first certified marine scrubber installation in the world. In the case of Suula the installation was tempo-rary, only for test purposes, and the main focus was on finding out how mature this closed-loop technology - completely new in ships - was in marine conditions. Exhaust gas was produced by a single heavy-fuel medium speed auxiliary engine. During the tests information was collected especially on sulphur removal capabil-ity from exhaust gas, on effluent quality and quantity, and on energy consump-tion. The main conclusions were that extremely efficient sulphur removal is achieved and that the technology is ready for commercial ship installations. The scrubber installation was certified by the classification societies Det Norske Veri-tas and Germanischer Lloyd. After the tests scrubber system was removed from the ship.
The Containerships VII main engine exhaust gas scrubber installation was a per-manent one. The scope of the tests quite closely corresponded to the previous Suula tests. Again, the most important finding was the efficient sulphur removal from exhaust gas. However, challenges were found in the effluent treatment pro-cess regarding the turbidity level and therefore the process was improved during the tests. Energy consumption as electricity was less than 1% of the installed main engine power. The scrubber was also found to slightly reduce carbon dioxide emissions.
Next, the scrubber emissions were compared with burning low-sulphur fuel on board. The basic assumption was that the refinery environmental load burdens clean oil products; heavy fuel oil and bitumen were classified as waste. SOx emis-sions to the atmosphere were lower in the case of a scrubber ship due to refinery output. With NOx both ships should follow IMO Tier III limits. Also refinery NOx emissions are low. In the case of carbon dioxide the difference was larger. As regards effluent, the comparison between refinery and ship pollution was difficult because the quality parameters are different. The other disparity is that a ship moves and the effluent effects are not local. If the scrubber ship is steaming in zero-effluent mode, the water surrounding the ship is not subject to any difference between a scrubber ship and a marine gas oil ship.

Acta Wasaensia 135 The economy of a scrubber installation in newbuilding ships was studied at a general level. The rough result of the study was that investments should be made in all cargo newbuilding ship categories as long as the difference in price between low- and high- sulphur fuels is expected to be at a level of above 160 €/ton. Large vessels with high engine power offer the best platform for scrubbers. A retrofit-ting installation is more challenging for two reasons: ship operational lifetime is shorter and the installation cost is greater. In old fleet, no space is reserved for scrubbers. Outfitting modifications may be significant and large hull steelwork may be close to unavoidable. Low oil prices can be expected to postpone scrubber investments.
Furthermore, issues such as installation difficulty, regulation development, fuel availability and installation risks need to be estimated by the shipping company prior to the investment decision. The scrubber installation should not limit ship operation in terms of reduced cargo capacity, whereby scrubber location outside the original engine casing or funnel is often the solution. Since marine traffic is global, scrubber installations should also be globally regulated. If legislation is not predictable and national rules are generated overriding the global ones, the population of scrubbers will grow slowly. Scrubber connected risks will be miti-gated as more good references and standardised solutions emerge.
As the final conclusion, heavy fuel oil burning in ships combined with scrubbers should be considered in all medium and large size cargo ships. Zero-effluent technology should be exploited and developed in future. To this end, large hold-ing tanks in ships and port reception facilities for effluent should be arranged. Scrubber retrofitting into vessels in traffic is more complicated and more expen-sive. Therefore, advanced retrofitting processes and standardised installation solu-tions should be developed for the industry. The general arrangements of most common cargo ship types made in series are quite alike, reducing the need for tailoring. The number of these cargo ships is high and ship operators are waiting for proven low-cost solutions to reduce the environmental load caused by sea traf-fic. Call for scrubbers has arisen.

136 Acta Wasaensia
References Ahola, A. (2013). Personal e-mail. 2013-01-11.
Alanko, J. (2007). Introduction to merchant ship design. Turku 2007. ISBN 978-952-92-1542-3 (in Finnish).
American Bureau of Shipping (2013). Exhaust Gas Scrubber Systems Status and Guidance. ABS exhaust gas scrubber systems advisory. http://www.eagle.org/eagleExternalPortalWEB/ShowProperty/BEA%20Repository/References/Capability%20Brochures/ExhaustScrubbers. Citated 2015-03-15.
Andreasen, A. & Mayer, S. (2007). Use of Seawater Scrubbing for SO2 Removal from Marine Engine Exhaust Gas. Energy Fuels 2007, 21, 3274-3279. 2007-10-19.
Avis, M. & Birch, C. (2009) Impacts on the EU refining industry & markets of IMO specification changes & other measures to reduce the sulphur content of certain fuels. Purvin & Gertz Inc. 30 June 2009.
Bacher, H. (2012). Four phases to success – optimizing ship retrofit projects. Elomatic News –Spring 2012.
Bacher, H. et Albrecht, P. (2013). Evaluating the costs arising from new maritime environmental regulations. Trafi Publications 24/2013.
Bergholtz, J. & Wiström, A. (2012). A Swedish proposal for the inclusion of the Ro-Ro ship segment. IMO energy efficiency regulatory framework. 2012.
British Petroleum (2014). BP Statistical Review of World Energy June 2014. bp.com/statisticalreview, #BPstats. http://www.bp.com/content/dam/bp/pdf/Energy-economics/statistical-review-2014/BP-statistical-review-of-world-energy-2014-full-report.pdf. Citated 2014-03-15.
CIMAC (2008). Guide to diesel exhaust emissions control of NOx, SOx, particu-lates, smoke and CO2. Seagoing ships and large stationary diesel power plants. The international council on combustion engines. 2008.
CIMAC (2013). Guideline for the Operation of Marine Engines on Low Sulphur Distillate Diesel. The international council on combustion engines. 2013
Dastillung et al. (2006). Dastillung, M. Bottino, S. Garcia Ocaña, J. Gardzinski, W. Gudde, N. Lyde, C. Mackenzie, A. Nuñez, P. Reyes, M. S. Sinnen, H-D, Sin-nen, R. Struck, G. Techno-economic analysis of the impact of the reduction of

Acta Wasaensia 137 sulphur content of residual marine fuels in Europe. Prepared by the CONCAWE Refinery Technology Support Group (RTSG). Report no. 2/06. Brussels 2006.
Den Boer & ‘t Hoen. (2015). Scrubbers – An economic and ecological assess-ment. Delft. CE Delft, March 2015. Publication code 15.4F41.20.
Det Norske Veritas (2012). DNV report. Shipping 2020. Executive summary. http://www.dnvusa.com/Binaries/1Shipping%202020%208%20pages%20summary%202012%2006%2004_tcm153-518883.pdf. Cited 2012-10-24.
ECSA (2014). Monitoring Economic Impact of Low Sulphur Norms. European Community Shipowners’ Assosiations. ECSA-ESSF survey for ship operators – First edition November 2014. Final report 23.12.2014.
EGCSA (2012). A practical guide to exhaust gas cleaning systems for the mari-time industry. EGCSA Handbook 2012. Exhaust Gas Cleaning Systems Associa-tion.
Enkvist, L. (2013). Environmental support for old ships also. Turun Sanomat 2013-03-15. (In Finnish).
European Commission (2001). Integrated pollution prevention and control (IPPC), reference document on best available techniques in the chlor-alkali man-ufacturing industry. December 2001.
EU (2007). Proposal for a Directive of the European Parliament and of the Council on Industrial Emissions (integrated pollution prevention and control). COM(2007) 844 final. 2007/0286 (COD). Brussels, 21.12.2007
EU (2008a). Directive 2008/56/EC of the European Parliament and of the Coun-cil of 17 June 2008 establishing a framework for community action in the field of marine environmental policy (Marine Strategy Framework Directive). 2008-06-25.
EU (2008b). Directive 2008/105/EC of the European Parliament and of the Council on environmental quality standards in the field of water policy, amending and subsequently repealing Council Directives 82/176/EEC, 83/513/EEC, 84/156/EEC, 84/491/EEC, 86/280/EEC and amending Directive 2000/60/EC of the European Parliament and of the Council of 16 December 2008.
EU (2012). Directive 2012/33/EU of the European Parliament and of the Council of 21 November 2012 amending Council Directive 1999/32/EC as regards the sulphur content of marine fuels. Official Journal of the European Union. 27.11.2012.
EU (2013). Directive 2013/39/EU of the European Parliament and of the Council of 12 August 2013 amending Directives 2000/60/EC and 2008/105/EC as regards priority substances in the field of water policy. 2013-08-24.

138 Acta Wasaensia
ESSF (2014). European Sustainable Shipping Forum. 3rd Plenary Meeting Brus-sels, 04 December 2014. Final Report Submission from the ESSF Sub-Groups. Submission from: ESSF sub-group on EGCS. http://ec.europa.eu/transparency/regexpert/index.cfm?do=groupDetail.groupDetailDoc&id=17035&no=3. Citated 2015-03-11.
Finnish Petroleum and Biofuels Association (2015). World market prices of pe-troleum products. https://docs.google.com/spreadsheets/d/1pr-bV2TMYzn Kk5k7qu 1IcR0IzNOzsYxzXv7um2EEyJg/pub?single=true&gid=6&output=html. Citated 2015-12-18.
Franck, T. (2013). Reliable scrubbers does not exist yet. http://www.hs.fi/paivanlehti/. 2013-02-26 (in Finnish).
Hansen, J. (2012). Exhaust Gas Scrubber Installed Onboard MV Ficaria Sea-ways. Public test report. Environmental project no. 1429, 2012. 2011. Copenha-gen.
Hirsso. J. (2010). The change in the cost of delivery in years 2010 and 2015 due to the Marpol 73/78. Bachelor´s Thesis. Jamk University of Applied Sciences. 04-06-2010. (In Finnish).
ICIS (2014). Caustic soda price report. http://www.icis.com/chemicals/caustic-soda/. Citated 2014-01-10.
IMO (2007). Prevention of air pollution from ships, washwater discharge criteria for exhaust gas-SOx cleaning systems. Marine Environment Protection Commit-tee, 56th session, agenda item 4. MEPC 56/INF.5. 6 April 2007.
IMO (2008a). Resolution MEPC.170(57). Guidelines for Exhaust Gas Cleaning Systems. Annex 4. Adopted on 4 April 2008.
IMO (2008b). Resolution MEPC.176(58). Amendments to the Annex of the Proto-col of 1997 to Amend the International Convention for the Prevention of Pollution from Ships, 1973, as Modified by the Protocol of 1978 Relating thereto, (Revised MARPOL Annex VI). Annex 13. Adopted on 10 October 2008.
IMO (2008c). Resolution MEPC.177(58). Amendments to the Technical Code 0n Control of Emission of Nitrogen Oxides from Marine Diesel Engines, (NOx Tech-nical Code 2008). Annex 14. Adopted on 10 October 2008.
IMO (2009a). Resolution MEPC.184(59). 2009 Guidelines for Exhaust Gas Cleaning Systems, adopted on 17 July 2009), Annex , 2009 Guidelines for Ex-haust Gas Cleaning Systems, Appendix II, Proof of the SO2/CO2 Ratio Method.
IMO (2009b). Prevention of air pollution from ships, second IMO GHG Study 2009,update of the 2000 IMO GHG Study, final report covering Phase 1 and

Acta Wasaensia 139 Phase 2. Marine environment protection committee, 59th session, agenda item 4. MEPC 59/INF.10. 9 April 2009
IMO (2011). Resolution MEPC.203(62). Amendments to the Annex of the Proto-col of 1997 to Amend the International Convention for the Prevention of Pollution from Ships, 1973, as Modified by the Protocol of 1978 Relating Thereto. Marine environment protection committee, MEPC 62/24/Add.1 Annex 19. Adopted on 15 July 2011.
IMO (2012a). Resolution MEPC.212(63). 2012 Guidelines on the Method of Calcu-lation of the Attained Energy Efficiency Design Index (Eedi) for New Ships. Ma-rine environment protection committee, Annex 8. Adopted on 2 March 2012.
IMO (2012b). Resolution MEPC.224(64). Amendments to the 2012 Guidelines on the Method of Calculation of the Attained Energy Efficiency Design Index (Eedi) for New Ships. Marine environment protection committee. Annex 8. Adopted on 5 October 2012.
IMO (2014). Annex 12. Resolution MEPC.251(66), Amendments to the annex of the protocol of 1997 to amend the international convention for the prevention of pollution from ships, 1973, as modified by the protocol of 1978 relating thereto. Adopted on 4 april 2014. Amendments to MARPOL Annex VI and the NOX Technical Code 2008.
IMO (2015a). Annex 1. Resolution MEPC.259(68), 2015 Guidelines for Exhaust Gas Cleaning Systems. Adopted on 15 May 2015.
IMO (2015b). MEPC 68/3/2. Air Pollution and Energy Efficiency, Sulphur moni-toring for 2014. 68th session, Agenda item 3. Note by the secretariat. 9 February 2015.
ISO 8217:2012. Petroleum products, Fuels (class F), Specifications of marine fuels. International Organization for Standardization.
Jadelcons (2015). YT22 Guide to Investment calculations. http://www.yritystulkki.fi/files/yt22_investoinnin_laskenta_seek.pdf. Citated 2015-02-12. (In Finnish).
Jiang, L., Kronbak, J., Cristensen, L. (2014). The costs and benefits of sulphur reduction measures: Sulphur scrubbers versus marine gas oil. Transportation Research Part D 28 (2014)19-27.
Jussila M. (2012). Adapting a Finnish Tanker Fleet to Tightening Fuel Oil Sul-phur Regulations. Master's thesis. Department of Applied Mechanics. Aalto Uni-versity. 2012-02-11. (In Finnish).

140 Acta Wasaensia
Juuti, P., Lipponen, J. (2010). Marine exhaust gas scrubber tests at M/T “Suula”. January 14-15-2010. Report 16EPF0001.10.Q850-001. February 5, 2010. Pöyry Finland Oy.
Jürgens, R. (2012). Emission abatement technologies for HFO fuelled marine diesel engines. SAE 2012 Emission Control from Large Ships Symposium. Sep-tember 13 - 14, 2012. Gothenburg, Sweden.
Kalli, J. (2012). Uppdate. Sulphur content of ship fuels 2015, report of the impact of new IMO rules to shipping costs. Merenkulkualan koulutus- ja tutkimuskeskus, Turun yliopisto. (In Finnish).
Karvonen, T. Lappalainen, A. (2014). Unit costs of ship traffic 2013. Liikennevi-raston tutkimuksia ja selvityksiä 41/2014. (In Finnish).
Kirjonen, A. (2013). Efficient dual water hybrid scrubber design parameters – for merchant ships. Master´s thesis. Turku University of Applied Sciences, Environ-mental technology.
Kivimäki, A. (2012). Sulphur repairs climate. Seura. Nr 29. 2012-07-19. (In Fin-nish).
Kjölholt, J. Stian, A. Jürgensen, C. Lauridsen, J. (2012). Assessment of possible impacts of scrubber water discharges on the marine environment. Environmental Project No. 1431. Miljöstyrelsen. Copenhagen. ISBN 978-87-92903-30-3.
Klimt-Möllenbach, C. Schack, C. Eefsen, T. De Kat, J. (2012). Vessel emission study: comparison of various abatement technologies to meet emission levels for ECA´s. Technical report. Green Ship of the future.
Kylänpää, A. (2012). Installation of closed loop fresh water wet scrubber system on M/S Gabriella. Turku University of Applied Sciences. Bachelor’s Thesis. Me-chanical Engineering. Naval Architecture. 19.4.2012.
Laaksonen, M. (2010). Continuous indicators of profitability. ORMS1030, Talousmatematiikan perusteet. Lecture material K8. University of Wasa. http://lipas.uwasa.fi/~mla/orms1030/orms1030k09_IKmittarit.pdf. Citated 2015-02-12. (In Finnish).
Lemper, B. Hader, A. Hübscher, A. Maatsch, S. Tasto, M. (2010). Reducing the sulphur content of shipping fuels further to 0.1 % in the North Sea and Baltic Sea in 2015: Consequences for shipping in this shipping area. Final report. September 2010. Bremen.
Lloyd’s Register (2012). June. Understanding exhaust gas treatment systems, Guidance for shipowners and operators. London.

Acta Wasaensia 141 Länsi-Suomen ympäristölupavirasto. (2007). Neste Oil Ltd oil refinery environ-mental licence application. LUPAPÄÄTÖS. Nro 45/2007/2. Dnro LSY2004Y362. 20.11.2007. (In Finnish).
Magnusson, M. (2014). NOx abatement technique for marine diesel engines. Im-proved Marine SCR Systems. Thesis for the degree of doctor of philosopy. De-partment of shipping and marine technology. Chalmers University of technology. Gothenburg Sweden 2014.
Marine Propulsion & Auxiliary Machinery. (2015-07-28). EU aid for ferry scrub-ber projects. http://www.mpropulsion.com/news/view,eu-aid-for-ferry-scrubber-projects_38755.htm
Meech, R. (2013). Will there be sufficient fuel to comply after 2014? The 34th International Bunker Conference. 26 April 2013. Gothenburg.
Mettler Toledo (2015). Sodium Sulfate Density concentration tables (+20°C). http://us.mt.com/us/en/home/supportive_content/application_editorials/Sodium_Sulphate_de_e.html. Citated 2015-12-29.
Neste Oil (2012). http://www.2011.nesteoil.com/sustainability/environmental-responsibility/material-and-energy-balance. Citated 2012-04-18.
Neste Oil (2014). Product data sheet MDO DMB. 19.9.2014.
Niemi, S. Mäkelä, K. Hänninen, S. Haahti, H. Kankaanpää, H. Mäkelä, K. (2006). Environmental effects of caustic soda and sea water scrubbers. VTT-R-08868-06. Espoo 23 November, 2006. Confidential research report (in Finnish).
Oksanen, R. (2004). Activity accounting of transportation services. Tampere: Aaltospaino Oy. (In Finnish).
Psaraftis, H. et Kontovas, C. (2009). CO2 Emission Statistics for the World Com-mercial Fleet. WMU Journal of Maritime Affairs.
Purvin & Gertz. (2010). Bunker Fuel: Supply, Demand and Pricing. Bunkerworld Business Exchange. 10 March 2010. Houston.
Pöyry (2013). Marine Exhaust Gas Scrubber Tests at M/S Containerships VII” on September 18 – 20, 2013. Confidential report.
Rajeevan, T. (2012). Developing a SOx compliance strategy. Proceedings of the SAE 2012 Symposium on Emission Control from Large Ships. Gothenburg, Swe-den. September 13-14, 2012. https://sftp.sae.org/login.html. Citated 2012-09-19
Reynolds, K. (2011), Exhaust Gas Cleaning Systems Selection Guide. File No. 10047.01. 22 February 2011. Rev. A.

142 Acta Wasaensia
ShippingWatch (2014-06-18). This is how many scrubbers are installed. http:/www.shippingwatch.com/secure/carriers/article6812550.ece.
Slotte, M. (2010). A design tool for SO2 scrubbers for marine applications. Mas-ter’s thesis. Åbo Akademi University, Department of Chemical Engineering. Tur-ku June 2010.
Sirkiä, I. (2013). Telephone discussion 6.3.213.
Suominen, M. (2012). Personal e-mail. 2012-03-26.
Sustainable Shipping News (2012-03-03). MOL launches performance measure-ment programme. http:/www.sustainableshipping.com/news/.
Sustainable Shipping News (2012-03-10). Sulphur regulations putting thousands of UK seafaring jobs “in jeopardy”. http:/www.sustainableshipping.com/news/.
Sustainable Shipping News (2012-05-25). Scrubber technology 'big unknown out there'. http:/www.sustainableshipping.com/news/.
Sustainable Shipping News (2012-06-01). Investment decisions a 'headache' for shipowners. http:/www.sustainableshipping.com/news/.
Sustainable Shipping News (2012-09-17). Opinions split on solutions for low sulphur future. http:/www.sustainableshipping.com/news/.
Sustainable Shipping News (2012-11-07). Sulphur non-compliance: 'Fines are not the real cost'. http:/www.sustainableshipping.com/news/.
Sustainable Shipping News (2013-12-23). Refineries could meet 2020 sulphur limit through blending, says consultant. http:/www.sustainableshipping.com/news/.
Sustainable Shipping News (2014-02-28). As many as seven routes at risk of be-ing closed. http:/www.sustainableshipping.com/news/.
Sustainable Shipping News (2015-07-30). Vessel caught using HFO inside ECA. http:/www.sustainableshipping.com/news/.
SWECO (2012). Consequences of the Sulphur Directive. October 2012.
Tikka, O., Lipponen, J. (2009). Marine exhaust gas scrubber tests at M/T “Suula”. April 20-22 and 24-26, 2009. Report 60O60184.01.Q850-001. Rev01 July 13, 2009. Pöyry Energy Oy.
Tinschmann, G, Dirk, T. Stephan, S. Petar, P. (2010). Sailing towards IMO Tier III – Exhaust Aftertreatment versus Engine-Internal Technologies for Medium Speed Diesel Engines. Paper no.: 274. International council on combustion en-gines. CIMAC Congress 2010, Bergen.

Acta Wasaensia 143 USEPA (1986). Method 8310, Polynuclear Aromatic Hydrocarbons. United States Environmental Protection Agency. Revision 0, September 1986.
Vainio, E., Lindberg, D., Hupa, M. (2012). Oxidation of sulfite to sulfate in FGD conditions. Technical report prepared for Wärtsilä Oyj Abp. Åbo Akademi Uni-versity. Confidential report. August 2012.
Wahl, H. (2013). North American ECA - regulations vs reality. Green Tech con-ference, Vancouver. May 30, 2013.
Westfalia (2012). Energy system technology, high performance equipment for steam and gas turbine power plants. GEA Mechanical Equipment / GEA West-falia Separator Group. http://www.westfalia-separator.com/fileadmin/Media/PDFs/Brochures/energy-system-technology-steam-gas-turbine-power-plants-.pdf. Citated 2012-11-13.
Woodyard, D. (2009). Pounder’s Marine Diesel Engines and Gas Turbines. 9th ed. Great Britain. Elsevier Ltd. 2009. ISBN 978-0-7506-8984-7.
Wärtsilä (2010). Exhaust gas Scrubber Installed onboard MT “Suula”. Public test report. 20 June, 2010.
Wärtsilä (2014). Exhaust gas Scrubber Installed onboard M/S Containerships VII. Public test report. 26.5.2014.