closed-loop experiences in europe - university of … · 2011-07-18 · closed-loop experiences in...
TRANSCRIPT

Closed-Loop Experiences in Europe
Professeur Eric Renard
Centre Hospitalier Universitaire & Université de Montpellier, INSERM CIC 1001, France

Presenter Disclosure
Eric Renard, MD, PhD, FRCP Edin
Consultant: A. Menarini Diagnostics, Abbott, Eli-Lilly, Johnson &
Johnson, Medtronic, Novo-Nordisk, Roche Diagnostics, Sanofi-
Aventis.
Research Support: Abbott, DexCom Inc., Insulet Inc.

Normal Range of Glucose Control
Time of day
Normal glucose
tolerance
(n = 16)
Me
an
glu
co
se
mg
/dl
(mm
ol/l)
0
100
200
300
400
6:00 10:00 14:00 18:00 22:00 2:00 6:00
(22.2)
(16.7)
(11.1)
(5.6)
140 (7.8)
= administration of meal
Polonsky KS et al. N Engl J Med 1988; 318:1231-9.
70 (3.9)
Near-Euglycemia
Target: 70-180 mg/dl
Tight Glucose Control
Target: 80-140 mg/dl
No
Hypoglycemia

The Closed-Loop Insulin
Delivery Concept
5
6
7
8
9
0 2 4 6 8 10 12 14 16 18 20 22 240.9
HbA1c < 6.5%
1.4
Continuous
Glucose
Monitoring
Control
Algorithm
Insulin
Delivery
Closed-Loop
mmol/l g/l

Bedside Artificial Pancreas :
A ‘miracle’ in the 1970s in US and Europe
Pfeiffer et al, 1974
Albisser et al, 1977
Mirouze et al, 1977

Ambulatory Artificial Pancreas:
How should insulin be delivered?
Hovorka R. Diabet Med 2006;23:1–12.Steil GM, et al. Adv Drug Deliv Rev 2004;56:12–44.
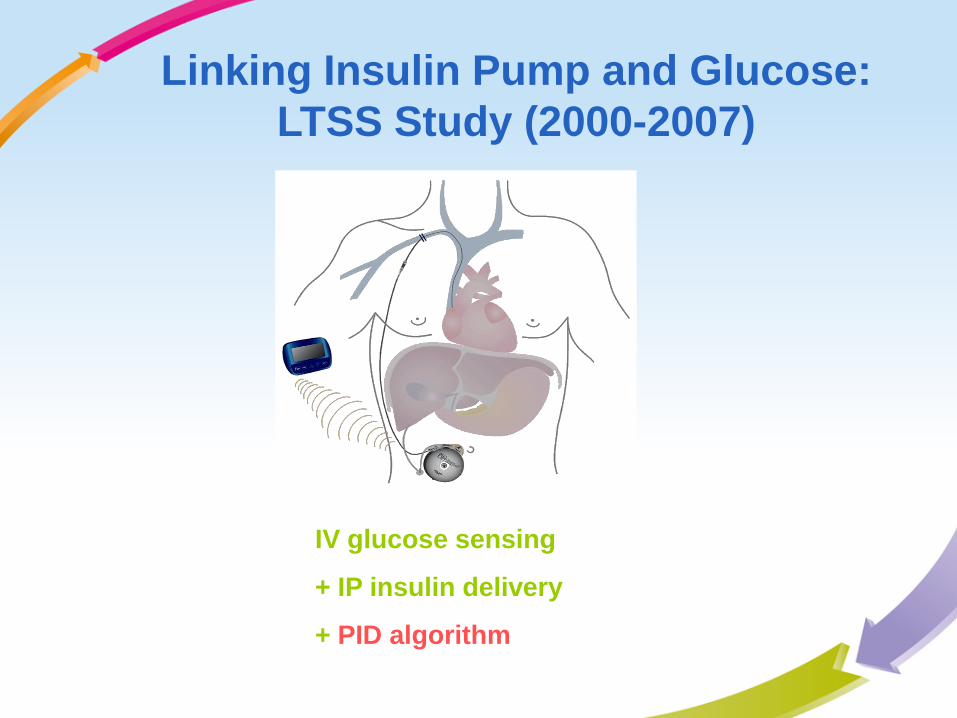
Linking Insulin Pump and Glucose:
LTSS Study (2000-2007)
IV glucose sensing
+ IP insulin delivery
+ PID algorithm

Analysis of Insulin Levels Following IP Insulin Bolus from
Implantable Pumps
-60 0 60 120 1800
10
20
30
40
50
Insulin ( U/ml)
BioexponentialModel fit
R2=0.79 0.04, τ1=49.2 10.9 min, τ2=14.8 3.0 min
0.0
2.5
5.0
7.5
10.0
Time (min)
Insu
lin (
U/m
l)
Basal R
ate (U/h) / B
olus (U)
Time constants
1 2 TTP0
25
50
75
1=49.3 10.9 min
2=14.8 3.0 min
TTP=23.3 3.1 min
Tim
e (m
in)
Intraperitoneal deliveryclearance
0
10
20
30
40
50
60
70
80
CL=38.0 11.7 ml/min/kg
Cle
aran
ce (m
l/min
/kg)
Renard E, et al. Personal data.

Long-term Accuracy of
Glucose Sensing with LTSS
Renard E, et al. Personal data.

What Kind of Algorithm ?
Feedback Control (PID)
Well adapted for closed-loop
control using reactive systems
Insulin delivery is modulated
according to :
The difference between
current glucose level and
target glucose level
(proportional component)
The time during which current
glucose level is different from
target glucose level (integral
component)
The variation of blood glucose
on short-term (derivative
component)
Insulin infusion Plasma Glucose
Glucose sensor
0 60 120 1800
1
2
3
4
TIME (min)
NILUSNI
(U/h)

0
5 0
1 0 0
1 5 0
2 0 0
2 5 0
3 0 0
2 0
3 0
4 0
5 0
6 0
7 0
8 0
0 . 0
2 . 5
5 . 0
3 0 T h uA u g 2 0 0 1
3 A M 6 A M
CLOS E D LOOP # 3 P a tien t A X M --- S /N 7037
Gl
uc
os
e
(m
g/
dL
)
In
su
li
n
As
sa
y
(u
U/
mL
)
In
su
li
n
(U
ni
ts
)
Renard E, et al, Diabetes Metab 2006;32:497–502.
Closed-loop glucose control using
LTSS overnight (12 AM – 6 AM)

1 5 g 7 5 g 7 5 g 1 0 g
0
5 0
1 0 0
1 5 0
2 0 0
2 5 0
3 0 0
2 0
3 0
4 0
5 0
6 0
7 0
8 0
0 . 0
2 . 5
5 . 0
1 2 P M2 9 W e d A u g 2 0 0 1
3 P M 6 P M 9 P M 3 0 T h u
CLOS E D LOOP # 3 P a tien t A X M --- S /N 7037
Gl
uc
os
e
(m
g/
dL
)I
ns
ul
in
A
ss
ay
(
uU
/m
L)
In
su
li
n
(U
ni
ts
)
Closed-loop glucose control using
LTSS between noon and midnight
Renard E, et al, Diabetes Metab 2006;32:497–502.

Steil GM, et al. Adv Drug Deliv Rev 2004;56:12–44.
Better PK with IP insulin is offset by
internal delay in IV glucose sensor

Steil GM, et al. Adv Drug Deliv Rev 2004;56:12–44.
What About Better PK with IP insulin and
Shorter Sensing Delay with SC Glucose
Sensor ?

Linking Insulin Pump and Glucose:
HyPID Study (2007-2008)
SC glucose sensing
+ IP insulin delivery
+ PID algorithm

HyPID study: Night-time and post-
prandial control of blood glucose
Renard E, et al. Diabetes Care 2010;33:121–7.
0 60 120 1800
20
40
60
80
100
TIME (min)
INS
UL
IN (
U/m
l)
Derivative component of PID
algorithm can hardly mimic
physiology

Linking Insulin Pump and Glucose:
JDRF-sponsored Studies (2008-2010)
SC glucose sensing
+ SC insulin delivery
+ MPC algorithm
OmniPod®, Insulet Inc.
STS®, DexCom

Model Predictive
Control (MPC)
Well adapted for semi-
closed-loop control
using poorly reactive
systems
Insulin delivery is modulated
according to:
observed relationships
between amount of
delivered insulin and
associated blood
glucose variations
+/- physiological model
What Kind of Algorithm ?

The Cambridge Experience of Closed-
Loop Experience at Night-Time in Type 1
Diabetic Children and Adolescents:
Minimized Time Spent in Hypoglycaemia
R. Hovorka et al, Lancet 2010

Subcutaneous Glucose Sensing, Algorithm
Management, and Subcutaneous Insulin Delivery
Study
Participant
PC running
Model Predictive Control
OmniPod Insulin
Management System
time reference BGFrequent YSI provides
reference BG
Attending
Physician
UCSB/Sansum APS ©
Artificial Pancreas System

Multi-national UVA/Padova/Montpellier Study
(2008-2009, n = 24)
B. Kovatchev, C. Cobelli, E. Renard et al,
J Diabetes Sci Technol 2010

Multi-National Study of Subcutaneous Model-
Predictive Closed-Loop Control in Type 1 Diabetes
Five-Fold Reduction in nocturnal hypoglycemia
with better overall glucose control within target range
Overnight % time within the
target range of 70-140 mg/dl
Nocturnal hypoglycemic
episodes (BG<70 mg/dl)
6478
23
5
B. Kovatchev, C. Cobelli, E. Renard, et al. J Diabetes Sci Technol 2010

J Diabetes Sci Technol, 2009
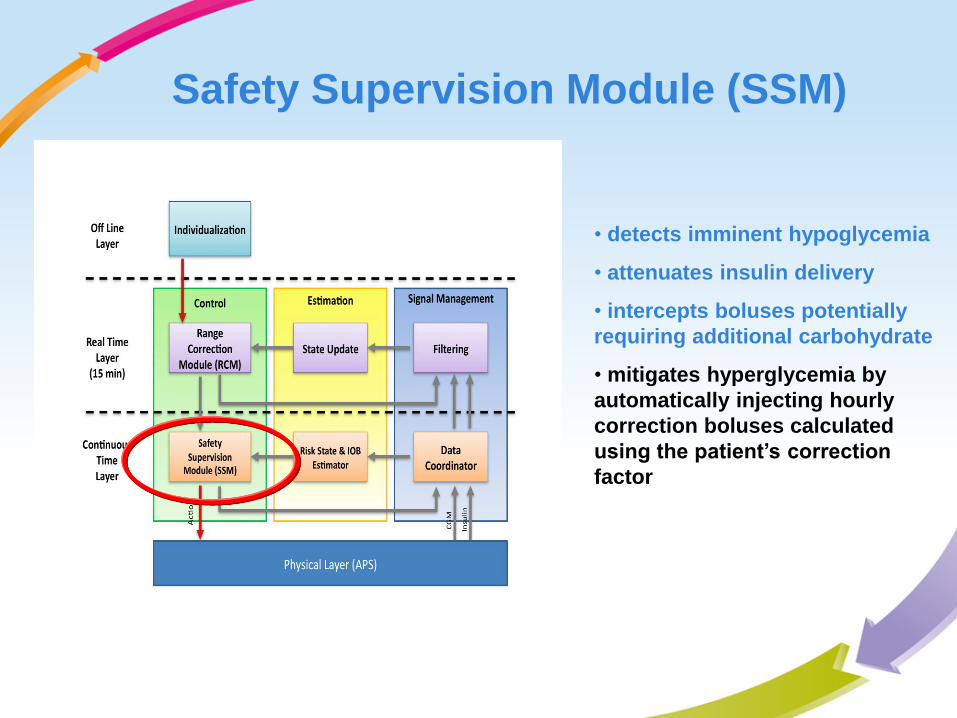
Safety Supervision Module (SSM)
• detects imminent hypoglycemia
• attenuates insulin delivery
• intercepts boluses potentially
requiring additional carbohydrate
• mitigates hyperglycemia by
automatically injecting hourly
correction boluses calculated
using the patient’s correction
factor

Investigational Trial Assessing SSM
(2009-2010)
Trial performed at CIC INSERM 1001, Montpellier, France

0
1
2
3
4
5
6
7
Total Trial Exercise Night-time
Results: Time spent out of safe range (%)
% time < 70 mg/dl
0
5
10
15
20
25
30
35
Total Trial Exercise Night-time
% time > 180 mg/dl
Twice less time spent in hypo- and in hyperglycemia
during closed-loop
Renard E, et al. EASD 2010

International Artificial Pancreas
Multi-Modular Approach: MPC2R
RCM
• computes the optimal insulin
infusion to control glucose
• takes into account the trade-off
between reaching the target as
fast as possible and using less
insulin as possible
• works using information of the
individual conventional therapy
Hardware Interface
Insulin Pump CGM
CGM &insulin data
Output to pump & CGM

18:00 20:00 22:00 00:00 02:00 04:00 06:00 08:0050
70
100
150
180
200
250
300
Pla
sma
glu
cose
[m
g/d
l]
Standard CSII Closed loop system
EX
16:00
dinner snack
Results:
SSM + RCM Trial Primary End Points
(2010)
Mean + SD
Renard E, et al. ADA 2011

50
55
60
65
70
75
80
85
90
95
Total Trial Day-time Night-time
% time b/w 70 & 180 mg/dl
40
45
50
55
60
65
70
75
80
Total Trial Day-time Night-time
% time b/w 80 & 140 mg/dl
Significantly improved time in Target
Ranges during closed-loop
Results:
SSM + RCM Trial Primary End Points
P < 0.05
Standard CSII Closed loop system

Results: Mean BG and BG Variability
70
90
110
130
150
170
Total Trial Night-time
0
0,5
1
1,5
2
2,5
3
3,5
4
4,5
5
Total Trial Day-time Night-time
Mean BG (mg/dl) Glucose Risk Index
Significantly lower glucose
excursions at night-time
P < 0.05P = 0.005 P < 0.05
Significantly lower average
glucose levels
Standard CSII Closed loop system

Project FP7 n 247138
WP leader 3.1: Clinical validation of the AP systems
The European Project AP@home (2010-2014)

Bringing the Artificial Pancreas @ home:
Testing of one-port systems

Comparison of two Artificial pancreas
systems in T1D
(CAT Trial, n=48, 6 EU centres)

Comparison of two Artificial pancreas
systems in T1D
(CAT Trial, n=48, 6 EU centres)

CAT Trial in Progress
CAT Trial - MTP-05 - Global
80
5060
0
20
40
60
80
100
120
140
160
180
200
220
240
260
280
300
320
340
360
380
400
16:00 18:00 20:00 22:00 00:00 02:00 04:00 06:00 08:00 10:00 12:00 14:00 16:00 18:00 20:00
Time
Glu
co
se
(m
g/d
L)
YSI CAM YSI iAP YSI OL Hypo limit Hyper limit Meal carbs

Closed-Loop Experiences:
A New World in Diabetes Care