cluster cities - bwebprod.blob.core.windows.net
TRANSCRIPT
Cluster Cities: A CHINESE EXPERIMENT IN THE
FUTURE OF URBANISATION
June 2019
By Gary Smith

B A R I N G S I N V E ST M E N T I N ST I T U T E .C O M | 2
China’s decision to promote city clusters of previously unimaginable size may be the most
significant story in urbanisation today. Cities themselves have long been recognised for their
role in boosting productivity, but interaction amongst clusters of cities might further enhance
these benefits.
China has been nudged to adopt this plan by two factors. Firstly, it is still experiencing
significant rural to urban migration. Secondly, urbanisation should deliver a labour market
productivity dividend. In a unique policy experiment China has embraced cluster cities as a
key element in its efforts to manage a slowing economy.
Perhaps the most eye-catching cluster is the Greater Bay Area (GBA), which encompasses
Guangzhou, Shenzhen, Hong Kong and Macau, and is poised to have a larger population
than the UK. Even with President Xi Jinping championing the model, however, its success
will depend on the government’s ability to fully integrate the factors of production. This will
involve ensuring that labour and capital can move across the different jurisdictions in order to
capitalize on what each city can offer.
There will be winners and losers amid these new urban dynamics. Investors should keep a
keen eye on the consequences of the massive infrastructure plans, which will have an impact
on real estate prices, as well as on the expanded services that an integrated cross-city cluster
workforce will demand.
“CHINA HAS COORDINATED PLANNING ACROSS LOCAL ADMINISTRATIVE
BOUNDARIES, WITHIN A FRAMEWORK OF A NATIONAL POLICY GOAL. IN THE
WEST COMPARABLE COORDINATED GOVERNANCE IS RARELY OBSERVED.”
CHINA’S URBAN STRATEGY
As cities grow—and grow closer together—economists and urban planners have explored how
they can interact with one another, for better and for worse. Prominent examples of city clusters
include Tokyo Bay and Greater New York, as well as regional groupings like Randstad, which covers
Holland’s four largest cities, and Germany’s Rhine-Ruhr, which stretches from Bonn to Dusseldorf
to Dortmund. In the West, governments have encouraged clusters where population growth has
slowed, tapping the benefits of agglomeration in the absence of individual city growth.1 In Asia,
many cities are still growing due to migration from rural hinterlands, but the integration of new
arrivals is often hampered by inadequate infrastructure, which leads to urban sprawl.
B A R I N G S I N V E ST M E N T I N ST I T U T E .C O M | 3
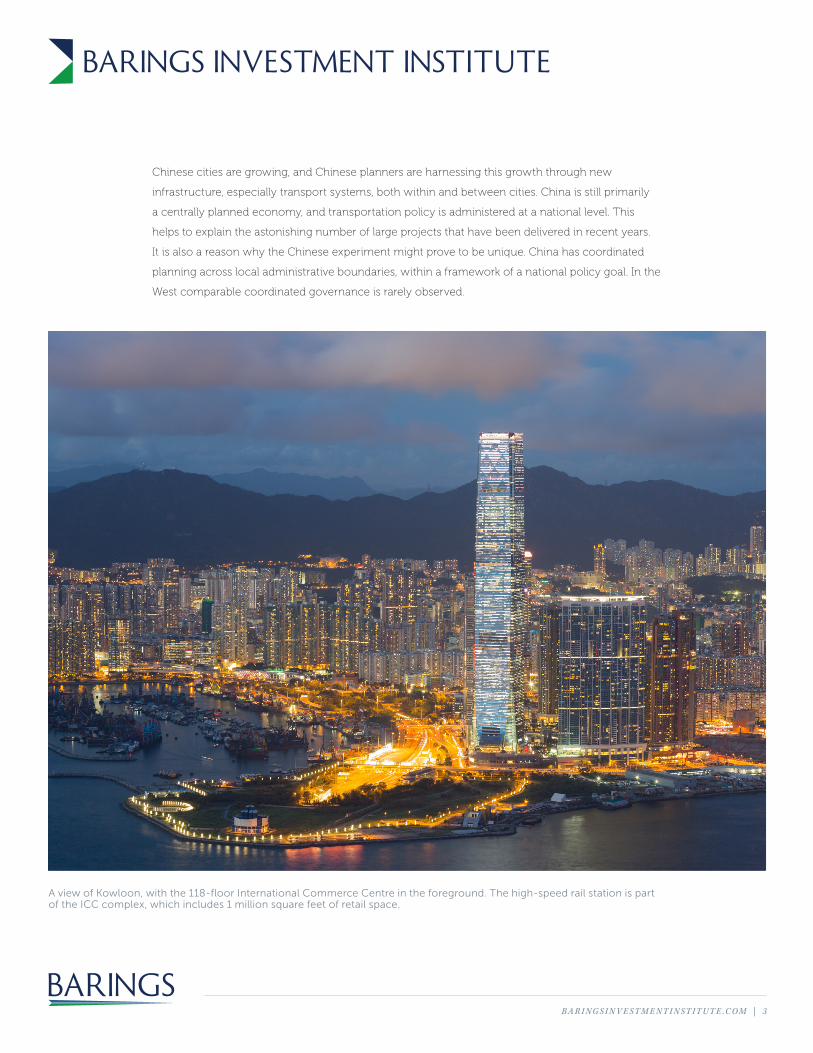
Chinese cities are growing, and Chinese planners are harnessing this growth through new
infrastructure, especially transport systems, both within and between cities. China is still primarily
a centrally planned economy, and transportation policy is administered at a national level. This
helps to explain the astonishing number of large projects that have been delivered in recent years.
It is also a reason why the Chinese experiment might prove to be unique. China has coordinated
planning across local administrative boundaries, within a framework of a national policy goal. In the
West comparable coordinated governance is rarely observed.
A view of Kowloon, with the 118-floor International Commerce Centre in the foreground. The high-speed rail station is part of the ICC complex, which includes 1 million square feet of retail space.
B A R I N G S I N V E ST M E N T I N ST I T U T E .C O M | 4
HOW WE GOT HERE
Historically, many Asian governments have tried to resist urbanisation because the provision of adequate services to
meet the needs of migrants was often overwhelming. Nations such as India, Indonesia, Thailand and Malaysia have
engaged policies to deflect (or even evict) migrants from city centres and have even restricted basic services, such as
electricity provision in slum areas, in order to discourage further migration.2
Additionally, in China during the Cultural Revolution from the mid-60s to mid-70s, the peasant lifestyle was
championed.3 Chinese authorities long restricted urbanisation through the household registration system known as
Hukou, which limited access to city jobs, housing and social benefits.
Deng Xiaoping’s Open Door Speech of December 1978 signaled a change of direction, launching what he called
“socialism with Chinese characteristics”, creating an environment allowing market forces to drive economic growth.4
Since then, some 600 million people moved from the countryside to cities, and China now has 12 cities with a
population of over 7 million.5 China also has eight of the world’s 20 largest buildings,6 when at the time of Deng’s speech
it had none. In 1981, Deng designated Shenzhen as China’s first special economic zone—and so began an astonishing
increase in the population from 500,000 to around 12 million today.
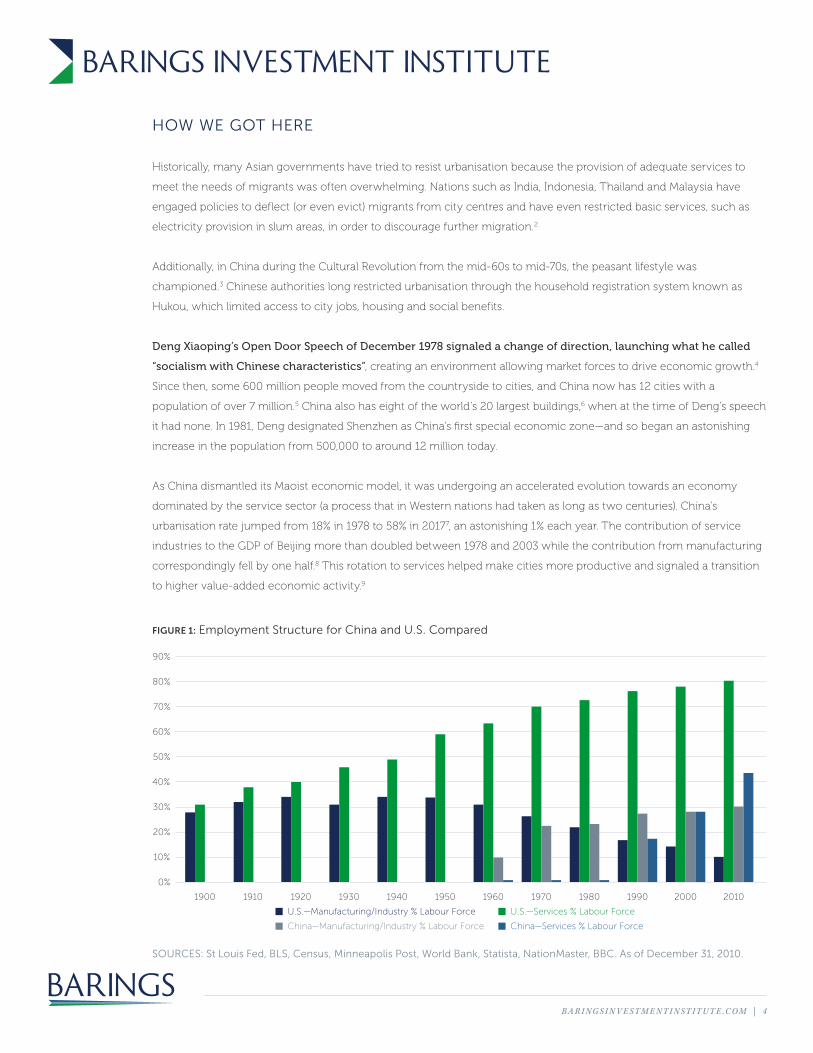
As China dismantled its Maoist economic model, it was undergoing an accelerated evolution towards an economy
dominated by the service sector (a process that in Western nations had taken as long as two centuries). China’s
urbanisation rate jumped from 18% in 1978 to 58% in 20177, an astonishing 1% each year. The contribution of service
industries to the GDP of Beijing more than doubled between 1978 and 2003 while the contribution from manufacturing
correspondingly fell by one half.8 This rotation to services helped make cities more productive and signaled a transition
to higher value-added economic activity.9
U.S.—Manufacturing/Industry % Labour Force
China—Manufacturing/Industry % Labour Force
U.S.—Services % Labour Force
China—Services % Labour Force
1900 1910 1920 1930 1940 1950 1960 1970 1980 1990 2000 2010
90%
80%
70%
60%
50%
30%
40%
20%
0%
10%
SOURCES: St Louis Fed, BLS, Census, Minneapolis Post, World Bank, Statista, NationMaster, BBC. As of December 31, 2010.
FIGURE 1: Employment Structure for China and U.S. Compared
B A R I N G S I N V E ST M E N T I N ST I T U T E .C O M | 5
CHINA’S CITY CLUSTER PLAN
A key policy objective has been to institutionalize coordination and cooperation mechanisms across local administrations.
Installing a centralized governance process has been critical.10
Clustering was already underway when President Xi presided over the announcement that cluster cities would form part of the National
New Urbanisation Plan in March 2014.11 It was described at the time as China’s first ever urbanisation plan, which included “comprehensive
accommodating capacity,” an endorsement of the infrastructure build-out that was already happening. These projects include high
speed railways and highways, but also waterways, power transmission, and water diversion from the south to the north of the country.
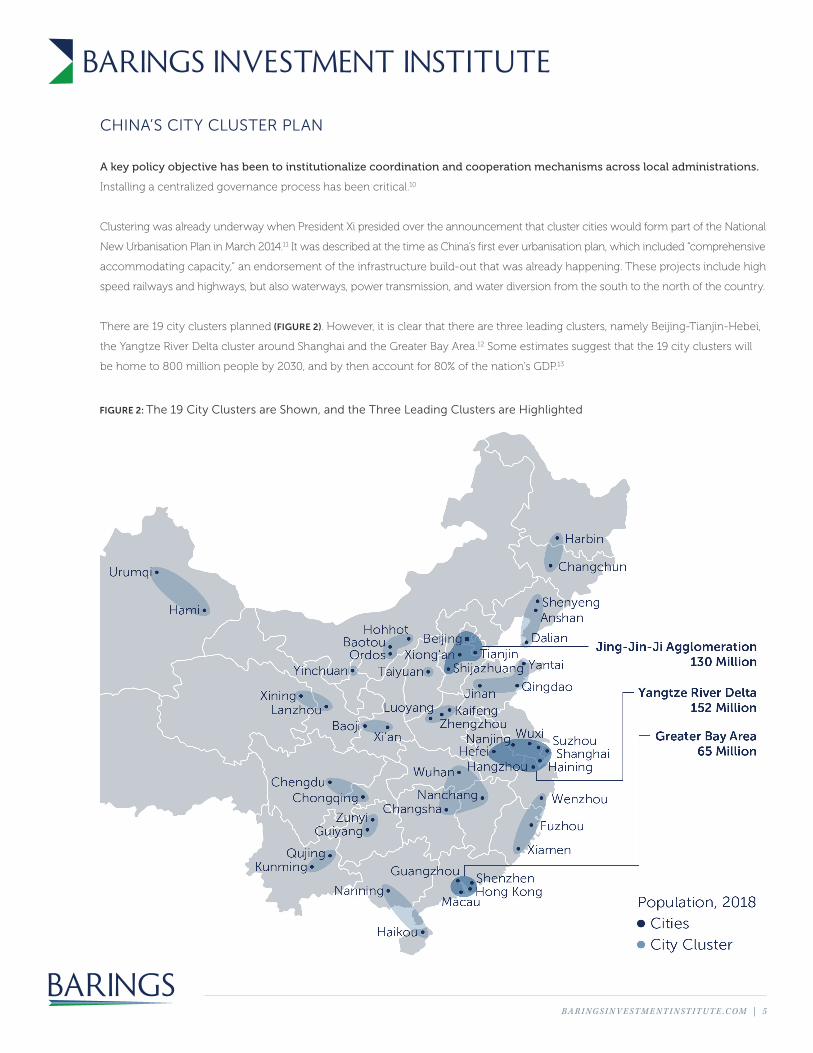
There are 19 city clusters planned (FIGURE 2). However, it is clear that there are three leading clusters, namely Beijing-Tianjin-Hebei,
the Yangtze River Delta cluster around Shanghai and the Greater Bay Area.12 Some estimates suggest that the 19 city clusters will
be home to 800 million people by 2030, and by then account for 80% of the nation’s GDP.13
FIGURE 2: The 19 City Clusters are Shown, and the Three Leading Clusters are Highlighted
B A R I N G S I N V E ST M E N T I N ST I T U T E .C O M | 6
The Greater Bay Area represents a massive urban agglomeration that would on its own be one of the largest 20
nations in the world. It has also been lavished with political attention from the very top and cited as a national priority
in President Xi’s 2019 New Year’s message. The plan released the following month described a need to “coordinate the
productivity of the GBA, and foster development in nearby areas at a faster pace.”14 Reflecting the high profile nature of
the project, the agencies involved in delivering the GBA development plan will report directly to the Central Committee
of the Party, which is chaired by President Xi himself. This includes nominally autonomous administrators based in
Hong Kong and Macau.
Chinese policymakers have recognised the need for urban planning to be flexible and responsive.15 They are
also setting trends with important consequences for economic productivity, urban planning and social welfare.
The Chinese city cluster plan, and the Greater Bay Area in particular, will test where the beneficial limits to
agglomeration might be. As China’s economic growth rate naturally slows during the transition from low to middle
income status, any productivity benefit will become even more valuable.
In the long term it will be necessary to plan for rural measures that will protect the natural environment, biodiversity
habitats, wetlands, water sources, farmland, and cultural heritage. The ADB have argued that both urban and rural plan-
ning are essential for competitiveness and well-being, and for climate resilience and low-carbon development. As China
becomes increasingly divided into urban and rural areas, trade-offs in terms of an equitable sharing of both natural
resources and fiscal receipts may be required.16
THEORIES OF URBANISATION AND OF CITY CLUSTERS
THEORY OF URBANISATION: Cities foster growth, and bigger cities foster faster growth. The share of global
population in metropolitan areas has grown from 29% in 1950 to well over 50% today, and it is predicted to reach 66% by
mid-century.17 By current estimates, the 50% of the world’s population that lives in urban areas produces roughly 80% of
the world’s total output.18
Economists have long recognized the advantages of grouping economic activity together. Proximity provides incentive
for suppliers to locate closer together, which means they can offer a more diverse and less expensive range of products.
Common infrastructure and transportation framework costs can be shared. Cities can also draw upon a larger and
more diverse labour pool, which helps firms and workers find a better match for one another. Pools of specialized
workers raise the levels of their own skills, while innovations are shared more easily and diffused more quickly.19 An
OECD estimate suggests that a doubling of a city’s population should boost productivity by 2–5%.20
THEORIES OF CLUSTER CITIES: If concentrations of urban activity produce synergies that drive growth, can
concentrations of cities deliver bigger benefits? The answer is an unequivocal “sometimes.”
Academics traditionally describe two conflicting forces. The theory of “borrowed size” argues that closer links among
urban areas can offer mid-sized cities the chance to achieve performance levels normally associated with larger
peers.21 Two small cities operating independently might not be large enough to support a big factory or university or
blockbuster entertainment arena. Together, however, their pooled appeal might stand a chance of success.

B A R I N G S I N V E ST M E N T I N ST I T U T E .C O M | 7
A high-speed train at rest at West Kowloon station.
On the other hand, competition among connected cities can also create “agglomeration shadow effects.” Economist Paul
Krugman has argued that being located within a multi-pole urban area might negatively affect growth.22 The implication
is that sometimes locating within the shadow of other cities can limit growth, as competition effects may dominate.
Both effects co-exist in the real world, but which is the stronger? Recent work by Chinese academics23 has supported
the argument that “borrowed size” benefits have been more powerful than “shadow effects” in China’s cluster cities.24
Better governance and expansive investment in physical infrastructure may boost the chances of success according to
Stefan Rau of the Asian Development Bank.25
Still, not all city clusters are created equal. An OECD-sponsored study26 has argued that supporting urban development
in Chinese city clusters with transport investments that reinforce existing urban development patterns is a good idea.
However, they also caution against using public investment to try and create momentum where “natural affinities
do not exist.” They describe the Chengdu-Chongqing cluster in the middle of the nation as “forced,” with two largely
independent cities separated by 300 km of largely unoccupied and hilly land.
TRANSPORTATION INFRASTRUCTURE AND LABOUR MARKETS: A major responsibility of planners is the
provision of appropriate transportation links. As cities have become dominated by service industries, reducing the time
that workers spend commuting has become critical to unlocking productivity gains. New York University Professor Alain
Bertaud has gone so far to suggest that planners, influenced by developments in China, should be designing cities to
cater for populations as large as 100 million people spread across 20,000 square kilometres (a landmass similar in size to
the nation of Wales, or the state of New Jersey).27
B A R I N G S I N V E ST M E N T I N ST I T U T E .C O M | 8
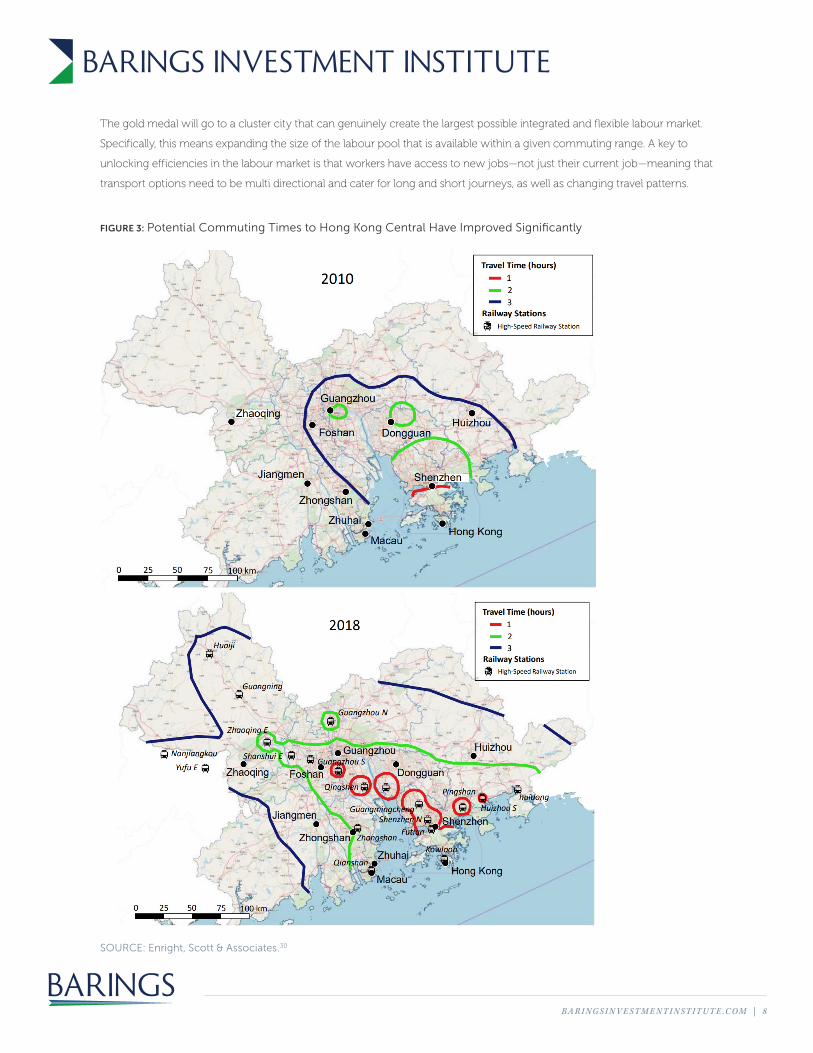
The gold medal will go to a cluster city that can genuinely create the largest possible integrated and flexible labour market.
Specifically, this means expanding the size of the labour pool that is available within a given commuting range. A key to
unlocking efficiencies in the labour market is that workers have access to new jobs—not just their current job—meaning that
transport options need to be multi directional and cater for long and short journeys, as well as changing travel patterns.
SOURCE: Enright, Scott & Associates.30
FIGURE 3: Potential Commuting Times to Hong Kong Central Have Improved Significantly
B A R I N G S I N V E ST M E N T I N ST I T U T E .C O M | 9
Above all, this requires sufficient transportation infrastructure, labour force support and administrative flexibility. The critical test
will be whether the Chinese city clusters deliver incremental benefits (such as access to a larger labour pool) that outweigh any
new challenges (such as increased congestion, which, through wasted time, effectively shrinks the size of the labour pool).
High-speed trains alone do not guarantee success, but they should help increase the size of the available pool. Evidence
from Germany suggests that for intermediate stations on a high-speed link, the positive effect can be significant.28
Nevertheless, transport infrastructure improvements should also include buses as well as private modes of travel, including
cars and bicycles. The first and last 5 km of the journey are crucial in determining the viability of the commute. In the final
analysis, proximity in the labour market should be measured in commuting time, not in simple point-to-point distance.29
FIGURE 3 illustrates how commuting possibilities have been increased in the GBA, due to the massive investment in
transport infrastructure between 2010 and 2018. FIGURE 3 measures commuting times from Hong Kong central, and
show that a one-hour commute is now possible from several cities in the GBA.
CLUSTER CITY DYNAMICS ELSEWHERE IN ASIA
Many Asian megacities have swallowed up surrounding towns and small cities, to take on the appearance of
clusters with mixed results. Success depends primarily on infrastructure investment, sound planning, administration
and logistics that can tap skilled labour for economies of scale.
SUCCESSFUL EXECUTION IN TOKYO: Tokyo is one of the world’s first city clusters and demonstrates how a concerted
infrastructure plan across several urban areas can unlock hidden potential and multiplier effects. A key trigger was the award of the
1964 Olympic Games, which provided a cause for an array of infrastructure improvements.31 Crucially, it included the development
of the iconic Shinkansen high-speed railway, which connects Tokyo to Yokohama, Nagoya, Osaka and Kyoto, and a total population
of 65 million. From 1965 to 1990, the economies of these cities grew at almost 1% faster per year than the nation as a whole.32
The Shinkansen project was part of a holistic approach to urban planning that flowed from the establishment in 1956
of the National Capital Region Development Law. This initiative was designed to control development of a region by
influencing the location and mobility of workers and deal with the then-growing problem of traffic congestion.
Today, Japan is grappling with the challenges presented by a shrinking total population, but Tokyo’s is still rising courtesy of
continued rural-to-urban migration.33 Clustering, as a result, has helped counteract the effects of Japan’s broader challenge
of a declining population.
China is heading down a similar path. For the year 2100, the United Nations predicts that the total population will decline
from the current 1.4 billion to between 0.7 and 1.1 billion. China’s National plans and city cluster plans will need to be
regionally differentiated to be strategic, robust, and flexible enough to adjust to these scenarios.34
JAKARTA—STILL WAITING FOR THE TRAIN: The greater metropolitan area is known as Jabodetabek, a compound
word to identify the urban sprawl that includes nearby Bogor, Depok, Tangerang and Bekasi. In total, the population is three
times the 11 million residents of Jakarta itself. A key issue has been the inability to cope with worsening traffic congestion,
making it the third-most congested city in the world according to one ranking.35
B A R I N G S I N V E ST M E N T I N ST I T U T E .C O M | 10
The city has been planning a Mass Rail Transit project since the 1980s, but construction didn’t commence until 2013 and
a scheduled opening in 2019 may only deliver an initial 16 km link. Two of the planned 13 stations have been delayed by a
complex land-acquisition process and, ironically, traffic congestion at street level.36
Plans for a first intercity passenger high-speed rail link appear to be still alive, but construction is a long way behind
schedule on the initial 141 km link between Jakarta and Bandung.38 Indonesia overall has a similar total expressway
build-out as Malaysia, but has a population nine times larger.39 If the area has failed to reap the benefits of clustering,
it may be a failure of planning and administrative integration, since the city crosses different and decentralised municipal
jurisdictions.35 The contrast to how urban planning has been implemented in China is stark.
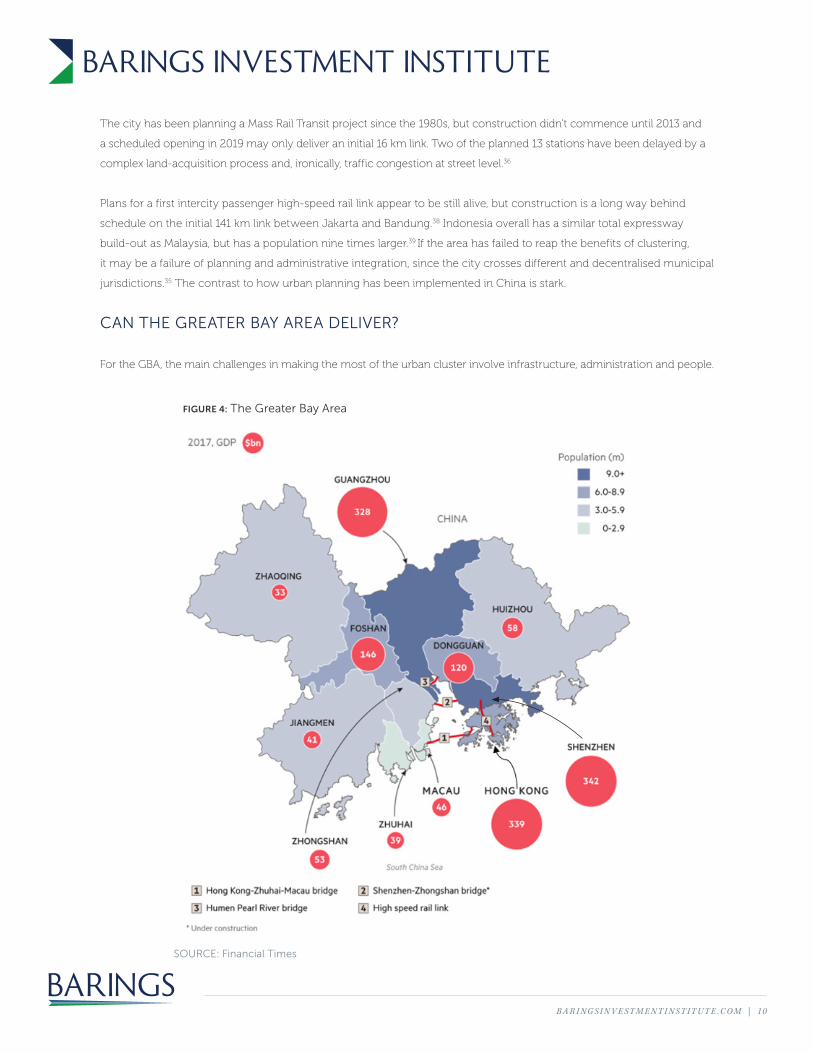
CAN THE GREATER BAY AREA DELIVER?
For the GBA, the main challenges in making the most of the urban cluster involve infrastructure, administration and people.
SOURCE: Financial Times
FIGURE 4: The Greater Bay Area
B A R I N G S I N V E ST M E N T I N ST I T U T E .C O M | 11
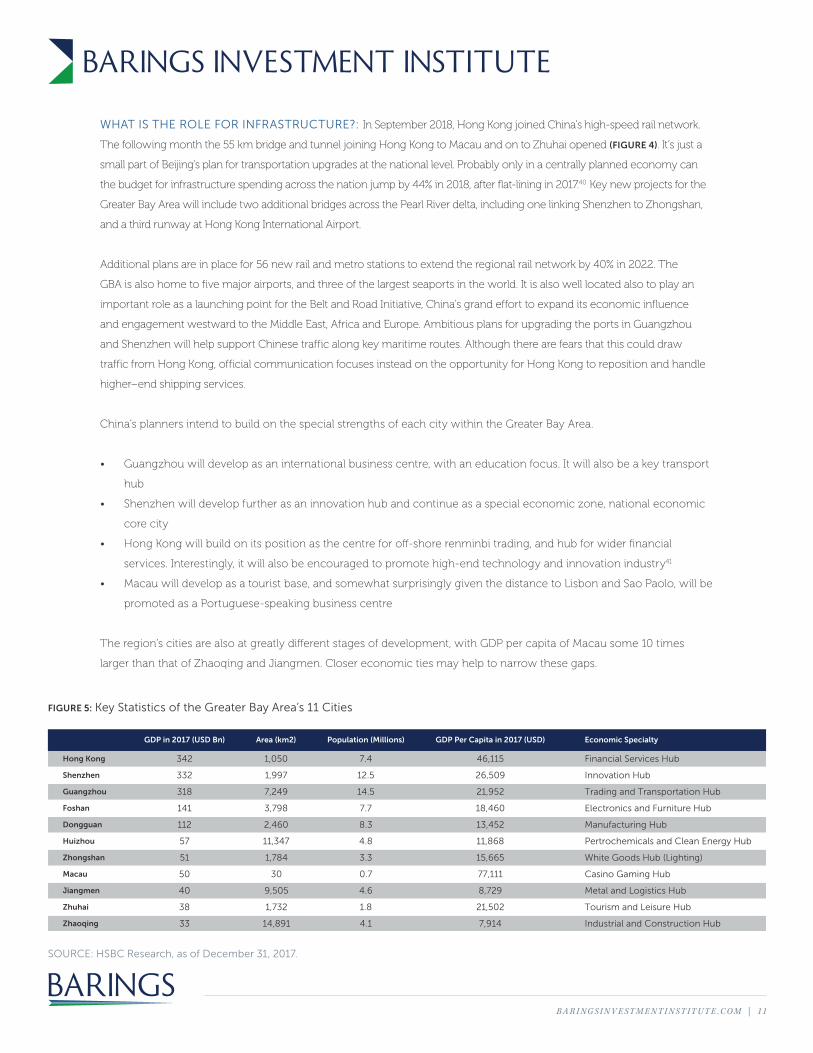
SOURCE: HSBC Research, as of December 31, 2017.
FIGURE 5: Key Statistics of the Greater Bay Area’s 11 Cities
Hong Kong
Shenzhen
Guangzhou
Foshan
Dongguan
Zhongshan
Macau
Jiangmen
Zhuhai
Zhaoqing
Huizhou
GDP in 2017 (USD Bn)
342
332
318
141
112
51
50
40
38
33
57
Area (km2)
1,050
1,997
7,249
3,798
2,460
1,784
30
9,505
1,732
14,891
11,347
Population (Millions)
7.4
12.5
14.5
7.7
8.3
3.3
0.7
4.6
1.8
4.1
4.8
GDP Per Capita in 2017 (USD)
46,115
26,509
21,952
18,460
13,452
15,665
77,111
8,729
21,502
7,914
11,868
Economic Specialty
Financial Services Hub
Innovation Hub
Trading and Transportation Hub
Electronics and Furniture Hub
Manufacturing Hub
White Goods Hub (Lighting)
Casino Gaming Hub
Metal and Logistics Hub
Tourism and Leisure Hub
Industrial and Construction Hub
Pertrochemicals and Clean Energy Hub
WHAT IS THE ROLE FOR INFRASTRUCTURE?: In September 2018, Hong Kong joined China’s high-speed rail network.
The following month the 55 km bridge and tunnel joining Hong Kong to Macau and on to Zhuhai opened (FIGURE 4). It’s just a
small part of Beijing’s plan for transportation upgrades at the national level. Probably only in a centrally planned economy can
the budget for infrastructure spending across the nation jump by 44% in 2018, after flat-lining in 2017.40 Key new projects for the
Greater Bay Area will include two additional bridges across the Pearl River delta, including one linking Shenzhen to Zhongshan,
and a third runway at Hong Kong International Airport.
Additional plans are in place for 56 new rail and metro stations to extend the regional rail network by 40% in 2022. The
GBA is also home to five major airports, and three of the largest seaports in the world. It is also well located also to play an
important role as a launching point for the Belt and Road Initiative, China’s grand effort to expand its economic influence
and engagement westward to the Middle East, Africa and Europe. Ambitious plans for upgrading the ports in Guangzhou
and Shenzhen will help support Chinese traffic along key maritime routes. Although there are fears that this could draw
traffic from Hong Kong, official communication focuses instead on the opportunity for Hong Kong to reposition and handle
higher–end shipping services.
China’s planners intend to build on the special strengths of each city within the Greater Bay Area.
• Guangzhou will develop as an international business centre, with an education focus. It will also be a key transport
hub
• Shenzhen will develop further as an innovation hub and continue as a special economic zone, national economic
core city
• Hong Kong will build on its position as the centre for off-shore renminbi trading, and hub for wider financial
services. Interestingly, it will also be encouraged to promote high-end technology and innovation industry41
• Macau will develop as a tourist base, and somewhat surprisingly given the distance to Lisbon and Sao Paolo, will be
promoted as a Portuguese-speaking business centre
The region’s cities are also at greatly different stages of development, with GDP per capita of Macau some 10 times
larger than that of Zhaoqing and Jiangmen. Closer economic ties may help to narrow these gaps.
B A R I N G S I N V E ST M E N T I N ST I T U T E .C O M | 1 2
ADMINISTRATIVE FLEXIBILITY: A very specific challenge will be encouraging the free
movement of people and capital across distinct legal systems and currency areas. As a
Special Administered Region, Hong Kong is not due to be incorporated to the mainland
until 2047, with Macau joining two years later.42 In this respect, there is no similarity to the
other Chinese clusters—and no global precedent.
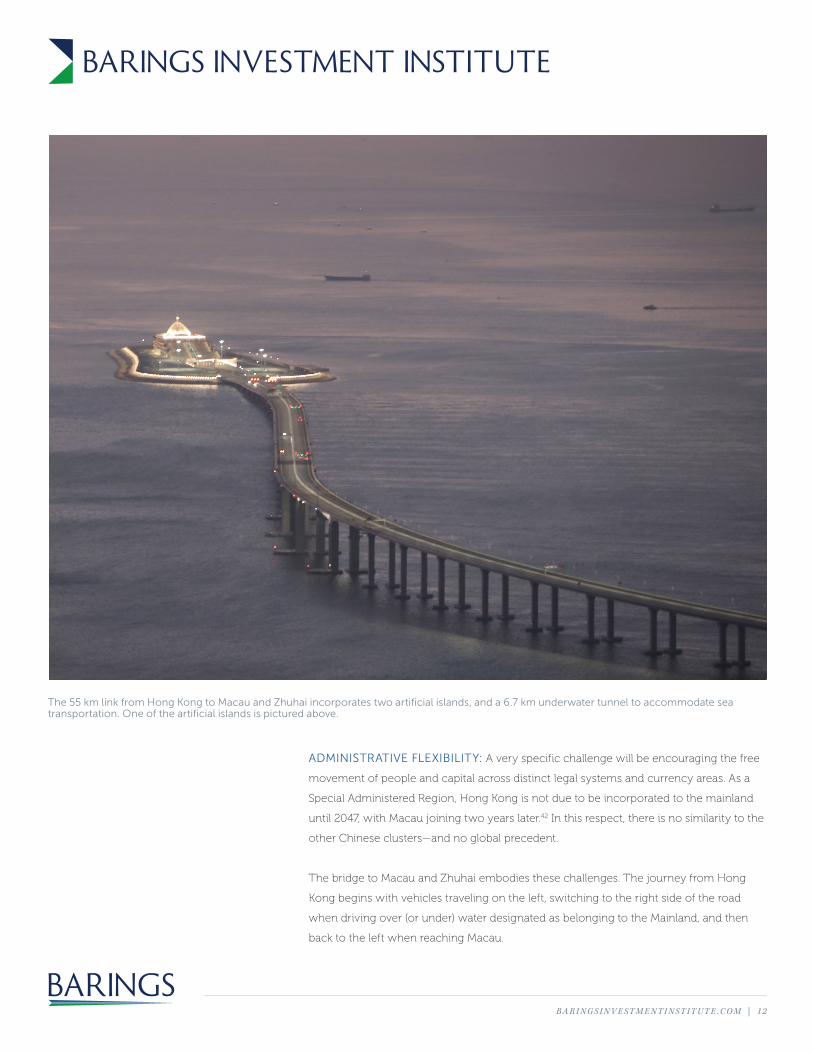
The bridge to Macau and Zhuhai embodies these challenges. The journey from Hong
Kong begins with vehicles traveling on the left, switching to the right side of the road
when driving over (or under) water designated as belonging to the Mainland, and then
back to the left when reaching Macau.
The 55 km link from Hong Kong to Macau and Zhuhai incorporates two artificial islands, and a 6.7 km underwater tunnel to accommodate sea transportation. One of the artificial islands is pictured above.
B A R I N G S I N V E ST M E N T I N ST I T U T E .C O M | 13
At the grand opening, a driver was required to have three separate insurance documents and three driving licenses or
permits to complete the journey from Hong Kong to Macau and on to Zhuhai.43 Mercifully, the tolls are in one single
currency, the mainland’s Yuan. Vehicle usage numbers for the bridge have been modest to date.
It is premature to describe the bridge as a White Elephant, and road traffic numbers will increase as regulations are
eased, and the two border crossings are made more efficient. However, the pictures of a bridge with few vehicles
underlines the point that only in a centrally planned economy can such a massive project be built on the expectation of
(distant?) future usage levels.
By contrast, the high-speed rail link from West Kowloon station to Shenzhen, and beyond to Shanghai and Beijing, has
been an immediate success.44
LABOUR FORCE INTEGRATION: Beyond the challenges of providing infrastructure and aligning administration, the
Greater Bay Area must create incentives to encourage greater movement of its massive labour force. Although some
labour market mobility measures are being implemented, employment policies and visa requirements differ. This will
slow the integration of the larger workforce. Nevertheless, the GBA development plan does outline market liberalisation
in sectors such as legal, logistics and finance. It also foresees co-operation in mutual recognition of professional
qualifications and the eventual development of “one examination, three certifications”.
Different standards of living and cultural preferences, and in particular different regulations, mean that easy flows of
labour are neither immediate nor automatic. Hong Kong residents, for example, should welcome the opportunities to
find work where living costs are not sky high. At the same time, they enjoy much lower income taxes (15%) than their
counterparts on the mainland (an average of 35%).45 Although Hong Kong residents working in Zhuhai receive a rebate
on income tax paid that exceeds the lower Hong Kong rate, this rebate scheme does not apply throughout the GBA.
Labour mobility, and the unlocking of productivity gains, will require a simplification of border-crossing procedures.
Differing levels of healthcare quality also create barriers. The elderly in Hong Kong can now use healthcare vouchers to
pay for outpatient services on the mainland, which may encourage them to explore lower-cost housing there. However,
this is only one step on the road to making all social benefits portable. Similarly, there are differences in professional
licensing. Although healthcare workers registered in Hong Kong can now practice on the mainland, many other
professional qualifications are not recognised, including for architects, structural engineers, lawyers and doctors.
The quality of education brings challenges but also opportunities. For instance, Hong Kong schools are viewed
by many Shenzhen parents as offering a superior education compared to local ones, and today more than 13,000
children cross the border every day to attend Hong Kong schools.46 As the Hong Kong birth rate is low, this daily inflow
has helped to fill classrooms.
There must be labour and capital mobility for agglomeration benefits to be fully unlocked. At the outset we must
recognise that full liberalisation of the capital account is not likely in the near future. However, in 2018 the mainland made
it easier for Hong Kong and Macau citizens to apply for residency status. There have also been discussions relating to a
GBA residency card, which would help equalise the provision of social services.
B A R I N G S I N V E ST M E N T I N ST I T U T E .C O M | 14
INVESTMENT OPPORTUNITIES
Any urban project on such a massive scale as the GBA will create significant investment
opportunities. Even if Chinese authorities are slow to address current administrative
and legal differences, the expansion of infrastructure will in itself inject new dynamism
across this massive region. Obvious beneficiaries will be the companies involved in
building bridges, tunnels and transportation networks. There will also be upgrades in
telecommunications networks, including 5G technology, and power grids.
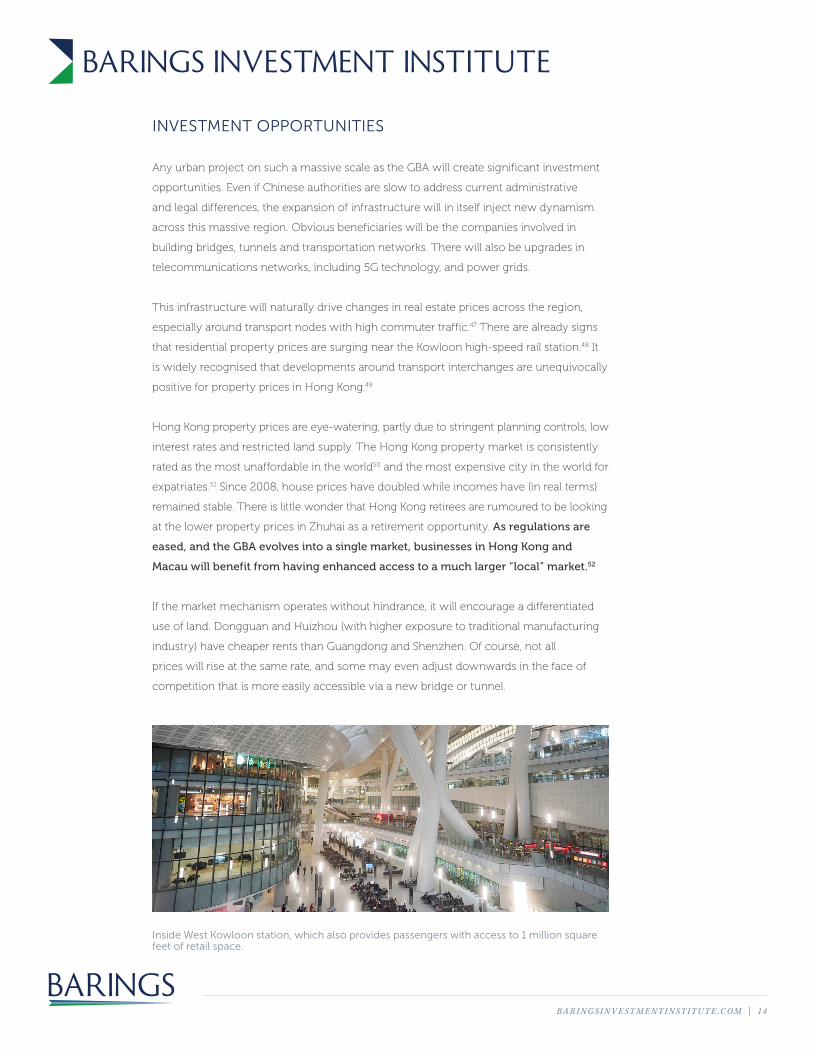
This infrastructure will naturally drive changes in real estate prices across the region,
especially around transport nodes with high commuter traffic.47 There are already signs
that residential property prices are surging near the Kowloon high-speed rail station.48 It
is widely recognised that developments around transport interchanges are unequivocally
positive for property prices in Hong Kong.49
Hong Kong property prices are eye-watering, partly due to stringent planning controls, low
interest rates and restricted land supply. The Hong Kong property market is consistently
rated as the most unaffordable in the world50 and the most expensive city in the world for
expatriates.51 Since 2008, house prices have doubled while incomes have (in real terms)
remained stable. There is little wonder that Hong Kong retirees are rumoured to be looking
at the lower property prices in Zhuhai as a retirement opportunity. As regulations are
eased, and the GBA evolves into a single market, businesses in Hong Kong and
Macau will benefit from having enhanced access to a much larger “local” market.52
If the market mechanism operates without hindrance, it will encourage a differentiated
use of land. Dongguan and Huizhou (with higher exposure to traditional manufacturing
industry) have cheaper rents than Guangdong and Shenzhen. Of course, not all
prices will rise at the same rate, and some may even adjust downwards in the face of
competition that is more easily accessible via a new bridge or tunnel.
Inside West Kowloon station, which also provides passengers with access to 1 million square feet of retail space.
B A R I N G S I N V E ST M E N T I N ST I T U T E .C O M | 15
Despite having the smallest land mass amongst the Chinese city clusters, the GBA is the wealthiest, and a more mobile
labour force might begin to look for new to live and work across the cluster. The initial population of 70 million has
been forecast to grow to 85 million by 2025.53 This will support retail sales in the GBA, which have already quadrupled
in the last 10 years and are forecast to double again by 2025.54 There will also be more specific increased demand for
healthcare, education and leisure activities.
Shenzhen accounted for 22% of China’s high tech exports over the last five years and its designation as an innovation
centre should encourage more research and development spending. By one forecast, it may account for 40% of high-
tech exports by 2025, while 45% of China’s high-tech firms will be based in the Guangdong region.55
There will also be expanded opportunities in the field of finance, building out Hong Kong’s strengths across the region.
The plan will eventually allow Hong Kong banks and insurance companies to set up on the mainland.
Macau will cement its role as a tourist destination, helped by the new bridge to Zhuhai, which will allow an alternative
traditional coastal tourist offering, in addition to the casino business. Visitor rates to Macau from Guangdong are
only 10% of those from Hong Kong. Under the assumption that visa rules for mainland residents will be simplified or
removed, there is considerable upside potential for visitor numbers.
Rising levels of government debt, and the continued official level of commitment to the Greater Bay Area project, might
in the future lead to participation opportunities from the private sector in funding these projects.
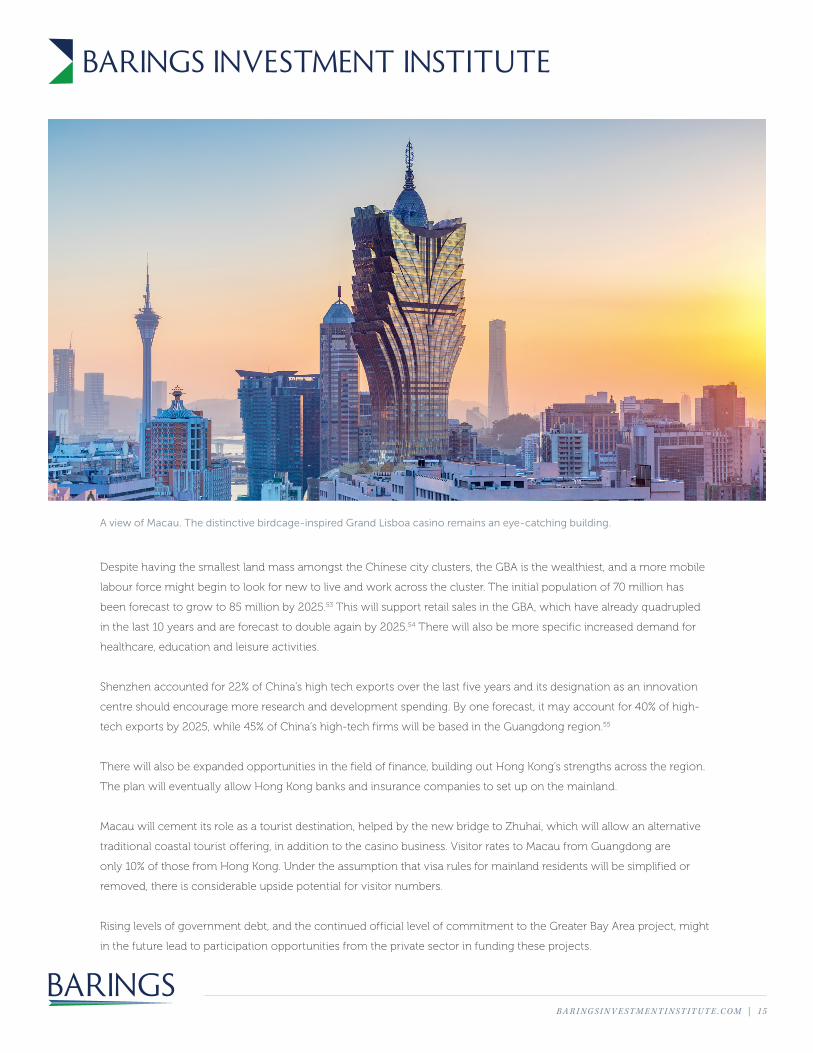
A view of Macau. The distinctive birdcage-inspired Grand Lisboa casino remains an eye-catching building.
B A R I N G S I N V E ST M E N T I N ST I T U T E .C O M | 16
IN CONCLUSION
The Chinese city cluster plan is intended to manage on-going rural-to-urban migration that is both
difficult to resist, but which might also bring macroeconomic benefits. There is an expectation that
a labour market productivity dividend will be delivered at a time when the national economy is
entering a slowdown that is typical of the transition to middle income nation status. However, there
are also costs, and urbanisation has led to increased social disparity between urban and rural areas,
and to significant environmental consequences.
Many nations have urban regions of comparable scale to those in China, but they do not have
governance coordination that is as centralized as in China. This has been a key factor in the
implementation of a successful national industrial policy, and the build-out of the extensive public
infrastructure projects. Perhaps this is a lesson for other nations, not least Western nations who
would benefit from the type of large infrastructure projects. However, China could also benefit
from adopting Western style market pricing approach to future projects in order to guard against
wasteful spending.
The demographic circumstances that have encouraged the adoption of the Chinese city cluster
plan also exist in other Asian and African nations, but it is difficult to see which other countries
might have the appetite and administrative tools to replicate the policies that China has put in place.
This Chinese experiment might turn out to be unique.
All the Chinese city clusters are different. Increasingly differentiated policies will be required to
ensure their individual future success. Nowhere are the differences more obvious than in the
Greater Bay Area where the Chinese authorities face the challenge of incubating and expanding
economic activity across distinct legal and administrative borders.
The political need for success in the Greater Bay Area is high, and sponsorship from Beijing means
there will be expansive resources allocated to make it work. Beyond waiting for the broader
numbers on growth and productivity, however, signs of success may be as simple as watching
rising traffic levels on the dramatic Hong Kong-Macau-Zhuhai Bridge.
B A R I N G S I N V E ST M E N T I N ST I T U T E .C O M | 17
GARY SMITHMANAGING DIRECTOR
Gary Smith is a member of the Barings Investment Institute, and has been with Barings
since 2013. He previously worked at BNP Paribas Investment Partners, having been
appointed Global Head of Official Institutions in 2008. Between 2004 and 2008 he held
a senior management position in the fixed income division of BNP Paribas CIB, and
from 1995 to 2004 he managed a fixed income sales team at Morgan Stanley. He began
his career in the fixed income research department of Greenwell Montagu (now part of
HSBC), and then the macroeconomic and geopolitical research team at Merrill Lynch.
Gary has been a trustee of a UK pension fund and serves on the advisory board of the
Official Monetary and Financial Institutions Forum (OMFIF). He has had numerous articles
published on topics specific to sovereign funds, as well as wider macroeconomic and
geopolitical issues. Gary holds a BSc in Economics and Geography from UCL.
With thanks to Max Bennett, Christian Floro, Colin Gordon, William Fong, Paul Stewart,
Pius Ho, PX An, Colin Moar and Christopher Smart for their helpful comments and
research assistance.

B A R I N G S I N V E ST M E N T I N ST I T U T E .C O M | 18
1. Global Cities Outlook 2018. Mendoza Pena, Hales, Peterson. AT Kearney.
2. Choe K, and Laquin, A. City Cluster Development, ADB, 2008.
3. The ADB identified such measures in China, Vietnam, India, Pakistan, Bangladesh, Indonesia, the Philippines, Thailand, Malaysia and
even South Korea. Choe K, and Laquin, A. City Cluster Development, ADB, 2008.
4. Brown, Dr Kerry. 2018. Thirty Years On—China Celebrates the Reform Process. Chatham House.
5. Economist Pocket World in Figures 2019. These 12 cities mean that China now has 12 entries in the largest 50 cities global list.
6. Economist Pocket World in Figures, 2019.
7. Yiping Xiao, Yan Song, Xiadong Wu. 2018. How Far Has Urbanization Gone? MDPI. National Bureau of Statistics China. China
Statistical Yearbook.
8. Roberts, Brian H, and Choe Kyeong Ae. 2011. Competitive Cities in the 21st Century: Cluster-Based Local Economic Development.
Asian Development Bank.
9. Patricia Buckley and Rumki Majumdar. The Services Powerhouse: https://www2.deloitte.com/insights/us/en/economy/issues-by-
the-numbers/trade-in-services-economy-growth.html.
10. Groff, S, and Rau, S, China’s City Clusters: Pioneering Future Mega-Urban Governance, May 20 2019, American Affairs.
11. WSJ. 2014. China Unveils Urbanization Plan.
12. President Xi New Year address. As of December 31, 2018.
13. HSBC 26 July https://www.gbm.hsbc.com/insights/economics/china-creates-19-super-city-clusters.
14. Greater Bay Development Plan. As of February 19, 2019.
15. Geng Xiao, and Sheng Andrew.2018. How Cities Are Saving China. Project Syndicate. Accessed 2019. https://www.project-
syndicate.org/commentary/china-urban-clusters-fuel-growth-by-andrew-sheng-and-xiao-geng-2018-08?barrier=accesspaylog.
Authors describe a process in which policy makers browse, research, experiment, evaluate and then push forward what works.
16. Groff, S, and Rau, S, China’s City Clusters: Pioneering Future Mega-Urban Governance, May 20 2019, American Affairs.
17. Habitat, UN. 2016. “Urbanization and Development: Emerging Futures.” World Cities Report.
18. Dobbs, Richard. 2011. Urban World: Mapping the Economic Power of Cities. San Francisco: McKinsey Global Institute.
19. Gill, S. 2009. “Reshaping Economic Geography. Et al. and Brookings, Redefining Global Cities, p 52. World Bank Development
Report. . Accessed 2019. https://www.brookings.edu/wpcontent/uploads/2016/09/metro_20160928_gcitypes.pdf.
20. Ahrend, Rudiger. 2019. Spatial Governance. OECD.
21. Evert Meijers and Martijn Burger. Stretching the concept of “borrowed size”. Urban Studies 2017, Vol.54(1) 269–291.
22. Krugman. P, 1993. On the Relationship between Trade Theory and Location Theory. Review of International Economics.
23. Sheng Andrew, and Geng Xiao. 2018. How Cities Are Saving China. Project Syndicate. Accessed 2019. https://www.project-
syndicate.org/commentary/china-urban-clusters-fuel-growth-by-andrew-sheng-and-xiao-geng-2018-08?barrier=accesspaylog.
24. Liu, Wang, Wu. 2011. Do bigger cities contribute to economic growth in surrounding areas? Evidence from county level data in
China. Fudan University. As of November 2011.
25. Rau Stefan. Boao Forum 2018, quoted in the China Daily. As of May 2, 2018.
26. OECD International Transport Forum.
27. Bertaud, Alain. 2018. Order without Design. The MIT Press.
28. Feddersen, Gabriel Ahlfeldt and Arne. 2010. Periphery to Core: Economic Adjustments to High Speed Rail. London: LSE Research.
29. Bertaud, Alain. 2018. Order without Design. The MIT Press.
30. “Creating the Greater Bay Area of the Future—Opportunities for Hong Kong”. Published by the 2022 Foundation.
31. Hill, Kuniko Fujita and Richard Child. 2005. Innovative Tokyo. Tokyo: World Bank Policy Research.
32. Measured in terms of GDP the Tokyo Bay cluster posted a CAGR of 12.7% versus 11.8% for the nation as a whole, over the 1955–
1990 period.
33. Desmet, Klaus and Esteban Rossi-Hansberg. 2014. Analyzing Urban Systems: Have Megacities Become too Large? Policy Research
Working Paper Series 6872, The World Bank.
34. WEF, https://www.weforum.org/agenda/2018/02/these-will-be-the-worlds-most-populated-countries-by-2100/.
35. From Bloomberg, quoting Satellite Data Provider TomTom in 2016
36. Elyda, Corry. 2017. Faced with Land Acquisition Problems, MTR Likely Delayed—Jakarta Post. Accessed 2019. https://www.
thejakartapost.com/news/2015/03/19/faced-with-land-acquisition-problems-mrt-likely-delayed.html.
37. “Indonesia’s China Financed High-Speed Rail Project off Track.” China Biz. As of October 11, 2018.
38. Fact set.
39. 2015. East Asia’s Changing Landscape. The World Bank.
40. TS Lombard March 7 2019, quoting CEIC data.
ENDNOTES
B A R I N G S I N V E ST M E N T I N ST I T U T E .C O M | 19
41. The authors argue that Hong Kong may be encouraged to develop these tech industries as a complement to Shenzhen, offering a
separate jurisdiction that may help circumvent U.S. trade measures. Leung, C. Understanding Chin—Self Sufficiency 2.0. DBS Research.
42. Hong Kong was a British dependency until 1997, when it became a Special Administered Region. It will formally become part of the
Peoples Republic of China in 2047.
43. The authorities have relaxed the rule for dual licence holders. https://www.info.gov.hk/gia/general/201901/08/P2019010800425.
htm?fontSize=1.
44. China Daily, “Guangzhou-Shenzhen-HK Express Rail Proves Popular with Spring Festival Travelers.” As of February 18, 2019.
45. BAML Sept 20 2017, Greater Bay Area: pushing growth frontier outward; thematic stock and bond picks.
46. https://en.wikipedia.org/wiki/Shenzhen%E2%80%93Hong_Kong_cross-boundary_students.
47. Shinjuku in Tokyo commands premium rents in part because it is the busiest railway station in the world and sees 3.5 million
passengers pass through its 200 exits each day. Based on (April to June) 2015 data from the Real Estate Information Network
System (REINS) for Eastern Japan.
48. South China Morning Post. https://www.scmp.com/property/hong-kong-china/article/2144127/mong-kok-properties-expected-
benefit-new-hub-status-express.
49. Quule Xue, Charlie and Sun Cong. How much development can a rail station lead? City University of Hong Kong 2018.
50. Annual Demographia International Housing Affordability Survey: 2019.
51. Mercer’s 2018 Cost of Living Survey.
52. 2022 Foundation. Creating the Greater Bay Area of the Future. As of March 29, 2019.
53. HSBC/CEIC. China’s Greater Bay Area. As of August 2018.
54. HSBC/CEIC. China’s Greater Bay Area. As of August 2018.
55. HSBC. China’s Greater Bay Area. As of August 2018.
IMPORTANT INFORMATION
Any forecasts in this document are based upon Barings opinion of the market at the date of preparation and are subject
to change without notice, dependent upon many factors. Any prediction, projection or forecast is not necessarily
indicative of the future or likely performance. Investment involves risk. The value of any investments and any income
generated may go down as well as up and is not guaranteed by Barings or any other person. PAST PERFORMANCE IS
NOT NECESSARILY INDICATIVE OF FUTURE RESULTS. Any investment results, portfolio compositions and or examples
set forth in this document are provided for illustrative purposes only and are not indicative of any future investment
results, future portfolio composition or investments. The composition, size of, and risks associated with an investment
may differ substantially from any examples set forth in this document. No representation is made that an investment will
be profitable or will not incur losses. Where appropriate, changes in the currency exchange rates may affect the value
of investments. Prospective investors should read the offering documents, if applicable, for the details and specific risk
factors of any Fund/Strategy discussed in this document.
Barings is the brand name for the worldwide asset management and associated businesses of Barings LLC and its global
affiliates. Barings Securities LLC, Barings (U.K.) Limited, Barings Global Advisers Limited, Barings Australia Pty Ltd, Barings
Japan Limited, Barings Real Estate Advisers Europe Finance LLP, BREAE AIFM LLP, Baring Asset Management Limited,
Baring International Investment Limited, Baring Fund Managers Limited, Baring International Fund Managers (Ireland)
Limited, Baring Asset Management (Asia) Limited, Baring SICE (Taiwan) Limited, Baring Asset Management Switzerland
Sarl, and Baring Asset Management Korea Limited each are affiliated financial service companies owned by Barings LLC
(each, individually, an “Affiliate”).
NO OFFER: The document is for informational purposes only and is not an offer or solicitation for the purchase or sale
of any financial instrument or service in any jurisdiction. The material herein was prepared without any consideration of
the investment objectives, financial situation or particular needs of anyone who may receive it. This document is not, and
must not be treated as, investment advice, an investment recommendation, investment research, or a recommendation
about the suitability or appropriateness of any security, commodity, investment, or particular investment strategy, and
must not be construed as a projection or prediction.
Unless otherwise mentioned, the views contained in this document are those of Barings. These views are made in
good faith in relation to the facts known at the time of preparation and are subject to change without notice. Individual
portfolio management teams may hold different views than the views expressed herein and may make different
investment decisions for different clients. Parts of this document may be based on information received from sources we
believe to be reliable. Although every effort is taken to ensure that the information contained in this document is accurate,
Barings makes no representation or warranty, express or implied, regarding the accuracy, completeness or adequacy of
the information.
Any service, security, investment or product outlined in this document may not be suitable for a prospective investor or
available in their jurisdiction.
Copyright in this document is owned by Barings. Information in this document may be used for your own personal use,
but may not be altered, reproduced or distributed without Barings’ consent.
Barings is a $317+ billion* global financial services firm dedicated to meeting the evolving investment and
capital needs of our clients and customers. Through active asset management and direct origination, we provide
innovative solutions and access to differentiated opportunities across public and private capital markets.
A subsidiary of MassMutual, Barings maintains a strong global presence with business and investment
professionals located across North America, Europe and Asia Pacific.
*As of March 31, 2019
19-847812
LEARN MORE AT BARINGS.COM