cluster interconnection in 802.15.4 beacon enabled networks · cluster interconnection in 802.15.4...
TRANSCRIPT

Cluster interconnection in 802.15.4 beacon
enabled networksJelena Misic, and Ranjith Udayshankar
Department of Computer Science
University of Manitoba, Winnipeg, Manitoba, Canada
Abstract
In this Chapter, we consider interconnection of IEEE 802.15.4 beacon enabled network clusters. We
discuss two types of interconnections. One type can be achieved by using PAN coordinator node as the
bridging device and the other type is achieved by using ordinary network nodes as bridge nodes. We
discuss design and performance issues of both kind of interconnections.
I. I NTRODUCTION
The recent IEEE 802.15.4 standard [1] for low rate wireless personal area networks supports small,
cheap, energy-efficient devices operating on battery power that require little infrastructure to operate
[2], [3]. It is considered as enabling technology for home networks and wireless sensor networks. IEEE
802.15.4 networks can appear in star topology where all communications are routed through the PAN
coordinator or in peer-to-peer topology where nodes can communicate with each other directly while the
PAN coordinator is still needed for cluster management [1]. Networks with peer-to-peer topology have
homogeneous nodes with the same initial energy, computational resources and link capacity, while in
star topology PAN coordinator can have higher energy, computational resources and potentially higher
capacity of inter-coordinator links than ordinary nodes in the cluster.
In the recent period, several evaluations related to the performance of IEEE 802.15.4 networks either
in peer to peer or in cluster topology have been conducted and results have been reported in [4], [5], [6],
[7], [8], [9], [10], [11], [12], [13]. The choice of topology for IEEE 802.15.4 standard is still an open
question. However, it seems that the choice of topology is an issue of tradeoff between the node simplicity
and homogeneity versus the duration of network lifetime. For sensor networks covering large geographic
areas it is difficult to replace sensor’s batteries when they are exhausted, and therefore, when nodes close

to sink die the whole network is unavailable. It was shown in [14] that in the homogeneous network
case, nodes close to the sink die first since their batteries are exhausted due to excessive packet relaying.
The concept of power heterogeneity enhanced with link heterogeneity was further considered in [15] and
it was proven that modest number of nodes with higher power can provide 5-fold increase of network
life-time. For this reason we choose cluster with star topology as the basic network building block and
explore the ways to achieve efficient cluster interconnection in order to implement larger networks.
In this Chapter, we consider two 802.15.4 clusters operating in beacon enabled, slotted CSMA-CA
mode; the clusters will be referred to as the source and sink cluster. The clusters can be interconnected
in two ways:
• In Master-Slave (MS) fashion, with the coordinator node of the source cluster acting as the bridge.
• In Slave-Slave (SS)fashion where bridge is ordinary node in both clusters.
The bridge periodically visits the sink cluster in order to deliver the data gathered from the sensor
nodes in the source cluster. Bridge visits are made possible by the existence of active and inactive
parts of the superframe, i.e., the bridge visits the sink cluster during the inactive period of the source
cluster superframe. The bridge delivers its data either by competing with other nodes in the sink cluster
using the CSMA-CA access mode, or by using the guaranteed time slots (GTS) allocated by the sink
cluster coordinator. Also, standard [1] allows transmissions in the CSMA part of the superframe to
be acknowledged giving base for the reliable MAC with re-transmissions or non-acknowledged which
has applications in sensor networks where packets’ content is correlated. In this Chapter, we discuss and
compare the performance of MS and SS based bridges. At this point we don’t consider power management
algorithms explicitly since we target applications of both Personal Area Networks where reliable MAC
is needed and Sensor Networks which can demand either reliable or non-reliable MAC. However, our
framework is open for power management algorithms either through control of inactive superframe part
or through individual power control for each node.
The rest of the Chapter is organized as follows. In section II we review the properties of 802.15.4 beacon
enabled MAC related to the operation of bridges. In Section III, we present the details of Master-Slave
(MS) bridge operation. In Section 6 the operation of Slave-Slave (SS) bridge is described. In Section V,
we discuss comparative performance issues of MS bridges and SS bridges. Finally, Section VI concludes
the Chapter.
II. BASIC PROPERTIES OFIEEE STD 802.15.4 MAC
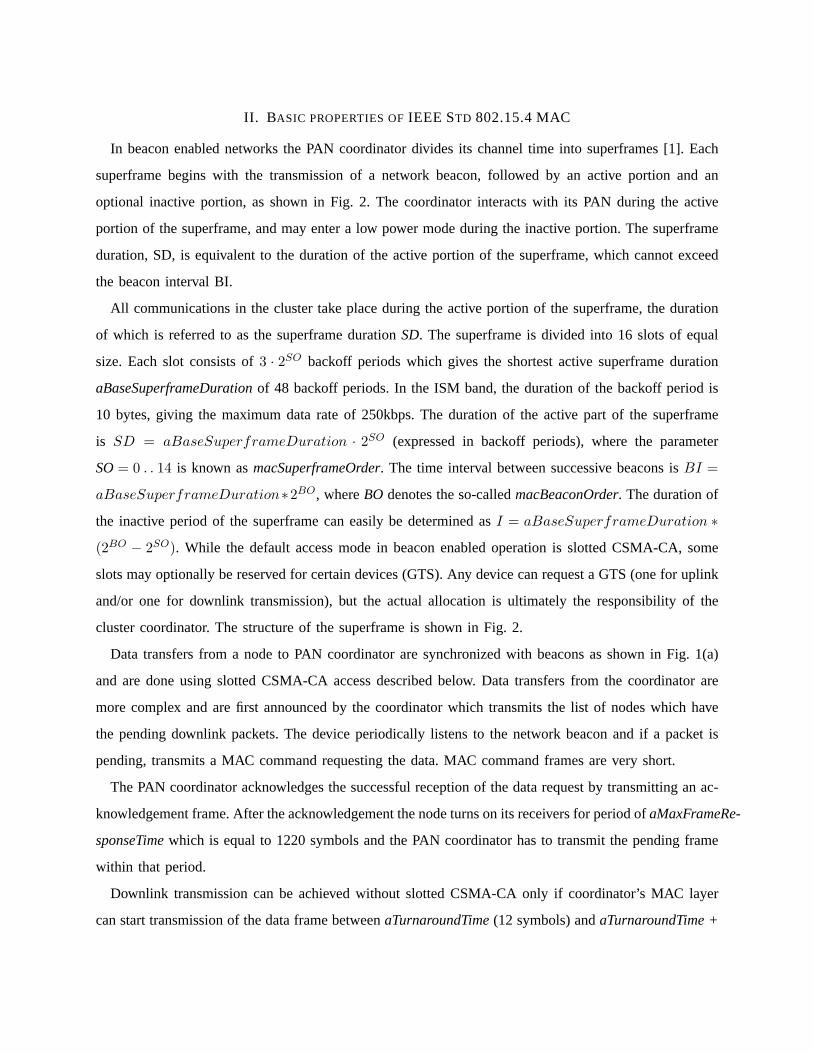
In beacon enabled networks the PAN coordinator divides its channel time into superframes [1]. Each
superframe begins with the transmission of a network beacon, followed by an active portion and an
optional inactive portion, as shown in Fig. 2. The coordinator interacts with its PAN during the active
portion of the superframe, and may enter a low power mode during the inactive portion. The superframe
duration, SD, is equivalent to the duration of the active portion of the superframe, which cannot exceed
the beacon interval BI.
All communications in the cluster take place during the active portion of the superframe, the duration
of which is referred to as the superframe durationSD. The superframe is divided into 16 slots of equal
size. Each slot consists of3 · 2SO backoff periods which gives the shortest active superframe duration
aBaseSuperframeDurationof 48 backoff periods. In the ISM band, the duration of the backoff period is
10 bytes, giving the maximum data rate of 250kbps. The duration of the active part of the superframe
is SD = aBaseSuperframeDuration · 2SO (expressed in backoff periods), where the parameter
SO= 0 . . 14 is known asmacSuperframeOrder. The time interval between successive beacons isBI =
aBaseSuperframeDuration∗2BO, whereBO denotes the so-calledmacBeaconOrder. The duration of
the inactive period of the superframe can easily be determined asI = aBaseSuperframeDuration ∗(2BO − 2SO). While the default access mode in beacon enabled operation is slotted CSMA-CA, some
slots may optionally be reserved for certain devices (GTS). Any device can request a GTS (one for uplink
and/or one for downlink transmission), but the actual allocation is ultimately the responsibility of the
cluster coordinator. The structure of the superframe is shown in Fig. 2.
Data transfers from a node to PAN coordinator are synchronized with beacons as shown in Fig. 1(a)
and are done using slotted CSMA-CA access described below. Data transfers from the coordinator are
more complex and are first announced by the coordinator which transmits the list of nodes which have
the pending downlink packets. The device periodically listens to the network beacon and if a packet is
pending, transmits a MAC command requesting the data. MAC command frames are very short.
The PAN coordinator acknowledges the successful reception of the data request by transmitting an ac-
knowledgement frame. After the acknowledgement the node turns on its receivers for period ofaMaxFrameRe-
sponseTimewhich is equal to 1220 symbols and the PAN coordinator has to transmit the pending frame
within that period.
Downlink transmission can be achieved without slotted CSMA-CA only if coordinator’s MAC layer
can start transmission of the data frame betweenaTurnaroundTime(12 symbols) andaTurnaroundTime +

coordinator
Data
networkdevice
(optional)Acknowledgment
Beacon
(a) Uplink transmission.
coordinatornetworkdevice
Data Request
Beacon
Data
Acknowledgment
Acknowledgment
(b) Downlink transmission.
Fig. 1. Uplink and downlink data transfers in beacon enabled PAN.
aUnitBackoffPeriodand there is time remaining in the Contention Access Part for the packet appropriate
inter-frame spacing and acknowledgement. If this is not possible transmission is done using slotted
CSMA-CA. We consider that downlink transmissions without CSMA-CA mechanism are detrimental for
network performance since they will cause additional collisions and we assume that all transmissions
will be achieved using slotted CSMA-CA.
If the transmission was correctly received within the time limit, the node will acknowledge it. If not,
the whole process of announcement through the beacon has to be repeated. The standard allows for
informing the device that there are more frames waiting at the PAN coordinator’s queue by using the
frame pending subfield of the data frame received from the coordinator (amore bit). If more bit is set
to 1, the device still has frames with the coordinator and it has to send new data request frame in order
to retrieve it. The cycle of downlink transmission is shown in Fig. 1(b). According to the standard,
maximally 7 devices can be advertised in the beacon. In this work we assume that PAN will advertise
nodes in round-robin xfashion in the case if it has more than 7 pending downlink packets.
The active portion of each superframe is divided into equally sized slots; the beacon is transmitted at
the beginning of slot 0, and the contention access period (CAP) of the active portion starts immediately
after the beacon. In each slot, the channel access mechanism is contention based, using the CSMA-CA
access mechanism (more details are given below). A device must complete all of its contention based
transactions within the contention access period (CAP) of the current superframe.
Within the time slots of the active portion of the superframe, the PAN coordinator may reserve slots
to allow dedicated access to some devices. These slots are referred to as guaranteed time slots (GTS),
and together they comprise the so-called contention-free period (CFP). In this work we do not consider
the impact of the GTS, although their presence will clearly decrease the usable bandwidth of the PAN
for other devices.
0 1 2 3 4 5 6 7 8 9 10 11 12 13 14 15
guaranteed time slots(GTS)
beacon contention-access period(CAP)
contention-free period(CFP)
superframe duration (SD) - active period
beacon interval (BI)
beacon
inactive period
Fig. 2. The composition of the superframe (adapted from [1]).
The basic time unit of the MAC protocol is the duration of the so-called backoff period. Access to the
channel can occur only at the boundary of the backoff period. The actual duration of the backoff period
depends on the frequency band in which the 802.15.4 WPAN is operating. Namely, the standard allows
the PAN to use either one of three frequency bands: 868-868.6MHz, 902-928MHz and 2400-2483.5MHz.
In the two lower frequency bands, BPSK modulation is used, giving the data rate of 20kbps and 40kbps,
respectively. Each data bit represents one modulation symbol which is further spread with the chipping
sequence. In the third band, the O-QPSK modulation is used before spreading; in this case, four data
bits comprise one modulation symbol which is further spread with the 32-bit spreading sequence. Table I
summarizes the basic timing relationships in the MAC sub-layer. Note that the constants and attributes
of the MAC sub-layer, as defined by the standard, are written in italics. Constants have a general prefix
of ”a”, e.g. aUnitBackoffPeriod, while attributes have a general prefix of ”mac”, e.g.macMinBE.
A. CSMA-CA algorithm
This algorithm is comprised of the downlink data transmission, uplink data transmission and uplink
request transmission states. As is the case with other contention-based access control schemes, transmis-
sion will be attempted only when the medium is clear, but withheld if there is channel activity, or when
contention occurs. The CSMA-CA protocol, shown as a flowchart in Fig. 3, is invoked when a packet is
ready to be transmitted. In this algorithm, three variables are maintained for each packet:
1) NB is the number of times the algorithm was required to backoff due to the unavailability of the
medium during channel assessment;

packet arrives
set i =0, c =2
macBattLifeExt?
set BE=macMinBE
Yes
No
set BE tomin(2, macMinBE)
locate boundary of thebackoff period
wait for a random numberof backoff periods
perform CCA on backoffperiod boundary
channel idle?Yes
No
set c =2, i =i +1,BE=min(BE+1, aMaxBE) set c = c -1
c =0?
Yes
No
successproceed with transmission
i > macMaxCSMABackoffs?
Yes
report failure
No
step (1)
step (2)
step (3)
step (4) step (5)
Fig. 3. Operation of the slotted CSMA-CA MAC algorithm in the beacon enabled mode (adapted from [1]).

Type of time period Duration MAC constant
Modulation symbol 1 data bit in 860MHz and 915MHz
bands, 4 data bits in 2.4GHz band
N/A
Unit backoff period 20 symbols aUnitBackoffPeriod
Basic superframe slot (SO =
0)
three unit backoff periods (60
symbols)
aBaseSlotDuration
Basic superframe length (SO
= 0)
16 basic superframe slots (960
symbols)
aBaseSuperframeDuration
= NumSuperframeSlots·aBaseSlotDuration
(Extended) superframe dura-
tion SD
aBaseSuperframeDuration·2SO macSuperframeOrder, SO
Beacon interval BI aBaseSuperframeDuration·2BO macBeaconOrder, BO
Maximal time to wait for
downlink transmission
1220 symbols aMaxFrameResponseTime
Rx-to-Tx or Tx-to-Rx maxi-
mum turnaround time
12 symbols aTurnaroundTime
Time-out value to wait for the
acknowledgement.
54 symbols macAckWaitDuration
TABLE I
TIMING STRUCTURE OF THE SLOTTED MODEMAC PROTOCOL. (NOTE THAT THE VALUES OF BOTHBO AND SOMUST BE
LESS THAN 15 IN THE BEACON ENABLED MODE.)
2) CW is the contention window, i.e., the number of backoff periods that need to be clear of channel
activity before the packet transmission can begin; and
3) BE is the backoff exponent which is related to the number of backoff periods a device should wait
before attempting to assess the channel (see below for a detailed explanation).
In step (1), the algorithm begins by settingNB to zero andCW to 2. If the device operates on battery
power (as determined by the attributemacBattLifeExt), BE is set to 2 or to the constantmacMinBE,
whichever is less; otherwise, it is set tomacMinBE(the default value of which is 3). The algorithm then
locates the boundary of the next backoff period.
In step (2), the algorithm attempts to avoid collisions by generating random waiting time in the range
0 . .2BE−1 backoff periods. When the wait period is over, the MAC sub-layer needs to performCW clear
channel assessment (CCA) procedures, transmit the frame, and optionally wait for acknowledgment.

The time to wait for an acknowledgment,macAckWaitDuration, is equivalent to 54 or 120 symbols,
depending on the currently selected physical channel. If the remaining time within the CAP area of the
current superframe is sufficiently long to accommodate all of these, the MAC sublayer will proceed with
step (3) and perform the first CCA to see whether the medium is idle. If the remaining time is not
sufficient, the MAC sublayer will pause until the next superframe.
If the channel is busy, the values ofNB andBE are increased by one (butBE cannot exceedmacMaxBE,
the default value of which is 5), whileCW is reset to 2; this is step (4) in the flowchart. If the number
of retries is below or equal tomacMaxCSMABackoffs(the default value of which is 5), the algorithm
returns to step (2), otherwise the algorithm terminates with a channel access failure status. Failure will
be reported to the higher protocol layers, which can then decide whether to re-attempt the transmission
as a new packet or not.
If the channel is idle, step (5), the value ofCW is decreased by one, and the channel is assessed again.
When CW becomes zero, the transmission of the packet may begin, provided the remaining number
of backoff periods in the current superframe suffices to handle both the packet and the subsequent
acknowledgment. If this is not the case, the standard requires that the transmission is deferred until the
beginning of the next superframe.
Note that the backoff unit boundaries of every device should be aligned with the superframe slot
boundaries of the PAN coordinator, i.e., the start of first backoff unit of each device is aligned with the
start of the beacon transmission. The MAC sub-layer should also ensure that the PHY layer starts all of
its transmissions on the boundary of a backoff unit.
III. M ASTER-SLAVE BRIDGING ALGORITHM
We consider two interconnected clusters operating in the ISM band around 2.4GHz. Each cluster
operates in different frequency sub-band so that inter-cluster interference is avoided (standard prescribes
16 distinct cluster channels). We assume that both clusters operate in beacon enabled CSMA-CA mode.
control of their respective cluster (PAN) coordinators. In each cluster, the channel time is divided into
superframes which are bounded by beacon transmissions from the coordinator [1]. For clarity, variables
pertaining to the source and sink cluster will be labeled with subscriptssrc andsnk, respectively, while
the variables linked to the bridge will have the subscriptbri.
During the inactive portion of the superframe shown in Fig 2, any device may enter a low power
mode or perform other functions, including the interconnection function. This facilitates the creation of
larger networks through bridging, with the cluster coordinator of the source cluster acting as the bridge.

When the active part of the superframe is completed in the source cluster, its cluster coordinator/bridge
switches to the sink cluster. The bridge has stored the packet(s) that need to be delivered to the sink
cluster coordinator (which acts as the network sink), and it waits for the beacon so that it can deliver its
data to the sink cluster coordinator.
In case the bridge has been allocated GTS access, it will wait until its slot arrives and then transmit the
data without any backoff countdown; otherwise, it will execute the CSMA-CA transmission procedure
just like any other node in sink cluster. In the latter case, should the bridge be unable to transmit its data
when the (active portion of the) superframe in the sink cluster ends, it will freeze its backoff counter
and leave the sink cluster. The bridge will resume the backoff countdown upon returning to the sink
cluster for the next superframe. Also, if bridge’s buffer becomes empty before the end of sink’s active
superframe part, bridge will immediately return to the source cluster and wait for the time to transmit
the beacon denoting the beginning of the next superframe, and the source cluster continues to operate.
Bridge operation in both access modes is presented in Fig. 4; in the discussions that follow, we will refer
to those modes as the CSMA-CA and GTS mode, respectively.
beacon frame inthe source cluster
sinkcluster
coordinator+ bridge
sink
sourcecluster
inactive part ofthe superframe
beacon frame inthe sink cluster
inactive part ofthe superframe
active part ofthe superframe
coordinator switches from one cluster to another
CSMA access
beacon frame inthe source cluster
sinkcluster
coordinator+ bridge
sink
sourcecluster
inactive part ofthe superframe
beacon frame inthe sink cluster
inactive part ofthe superframe
active part ofthe superframe
coordinator switches from one cluster to another
GTS access
(a)
(b)
Fig. 4. Bridge switching in CSMA-CA and GTS mode, respectively.
We will assume that all the traffic from the source cluster occurs in the uplink direction, and that the
bridge actually delivers it to the sink cluster coordinator. The sink cluster has some local traffic as well.

(In more complex networks, the sink cluster may contain several bridges, each with its own ‘source’
cluster.) This is a reasonable assumption in sensor networks, where the most, if not all, of the traffic will
be directed toward the network sink. All ordinary nodes in either cluster use CSMA-CA access mode.
A. Queuing model of MS bridge exchange
Let us now consider the source cluster and calculate the amount of traffic that reaches the sink cluster.
The source cluster containsn ordinary sensor nodes which have the packet arrival rate ofλi during
inactive and active parts of the superframe. Coordinator in the source cluster also functions as the bridge.
During the active part of the superframe nodes send packets to the bridge. However, not all generated
packets make it to the transmission medium because of packet blocking at the source nodes. Namely,
ordinary sensor node is assumed to have finite input buffer with the capacity ofL packets; once the buffer
is full, packets will be simply dropped. This poses little problems in sensing applications as redundant
information is available from other nodes. The coordinator/bridge has a finite buffer as well; this buffer
has the capacity ofLbri packets. In case this buffer is full, new packets will not be admitted and the
coordinator/bridge will not send the acknowledgment. Let us denote the blocking probabilities at ordinary
nodes in the source cluster and at the bridge asPbsrc andPbbri, respectively.cluster node λi(1 - Pbsrc)λi cluster nodeλi nλi(1 - Pbsrc)λsrc(1-Pbbri)source cluster bridge node sink clusterblocked packets are lostblocked packets are lost λi(1 - Pbsrc)LL Lbri[corrupted, blocked, and collided packets are lost]
(a) Non-acknowledged transfer.
cluster node λi(1 - Pbsrc)λi cluster nodeλi nλi(1 - Pbsrc)source cluster bridge node sink clusterblocked packets are lostblocked packets are lost corrupted, blocked, and collided packets are retransmittedλ (1 − Πβ )LL Lbri
(b) Acknowledged transfer.
Fig. 5. Queuing model of the bridging process between source and sink cluster.
1) Non-acknowledged transfer:In the case of non-acknowledged transmission, the cluster coordinator
does not acknowledge the packets which are successfully received and stored in its buffer. Without
acknowledgements, packets transmitted towards the bridge which are lost due to the noise at the physical
layer, collisions or blocking will not be re-transmitted.

The amount of traffic admitted in the source cluster isnλi(1−Pbsrc) and the total packet arrival rate
offered to the bridge isλbri = nλi(1 − Pbsrc)γsrcδsrc, whereγsrc denotes probability that no collision
has occurred for particular packet in source cluster andδsrc denotes the probability that packet is not
corrupted by the noise. Given the bit error rate of the physical medium and the total packet length,δsrc
can be calculated as the probability that none of the bits in the packet is corrupted by the noise. The
graphical representation of the queuing, blocking and bridging between the two clusters is shown in
Fig. 5(a).
2) Acknowledged transfer:The purpose of acknowledged transfer is to achieve reliable packet transfer
at the MAC layer. All successful packet transmissions which are received by the respective cluster
coordinator and placed in its buffer are acknowledged. However, when the incoming packet reaches the
coordinator/bridge when its buffer is full it will not send the acknowledgment even if the transmission
was successful. The lack of acknowledgment may also be due to a collision or noise at the physical layer.
If the acknowledgment is not received within the time prescribed by the standard [1], the sending node
will repeat the transmission. In our model, the ordinary node will repeat the packet transmission until it
receives the acknowledgement. (The standard prescribes maximum number of transmission re-tries but
in that case the final reliability of transmission has to be achieved at higher protocol layers which is
equivalent to our approach.)
In this case, we can say that traffic blocked by the bridge ‘stays’ in the network, and contributes to an
increase in traffic, as well as the number of collisions, in the source cluster. The graphical representation
of the queuing, blocking and bridging between the two clusters is shown in Fig. 5(b).
The amount of traffic admitted in the source cluster isnλi(1−Pbsrc). Since the transfer is reliable, the
total arrival rate offered to the bridge satisfies the following equalitynλi(1− Pbsrc) = λbri(1− Pbbri),
which gives the offered bridge packet arrival rate as
λbri =nλi(1− Pbsrc)
1− Pbbri(1)
Since the number of nodesn is relatively large and events of packet blocking by the bridge, collisions
and corruptions by noise are non-correlated we will assume that packet arrival process to the bridge is
Poisson with average rateλbri.
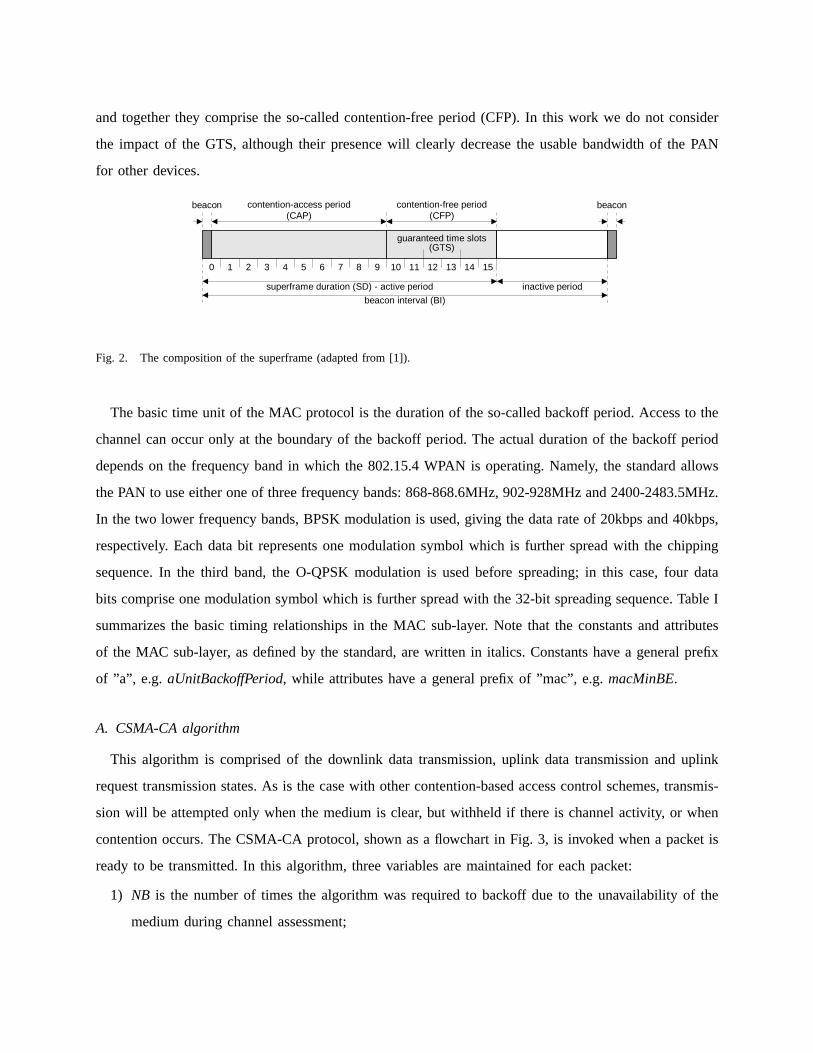
IV. SLAVE -SLAVE BRIDGING ALGORITHM
Slave-Slave bridge is an ordinary node in both the source and sink cluster. It visits both clusters in
time-division basis as shown in Fig. 6
source cluster coordinatorsink cluster coordinator + network sink bridge switches to sink cluster,waits for the beaconslave/slave bridge bridge switches to source cluster,waits for the beaconsink clustersource cluster beacon frame CAP period(CSMA-CA access)Fig. 6. Bridge switching between the source and sink cluster.
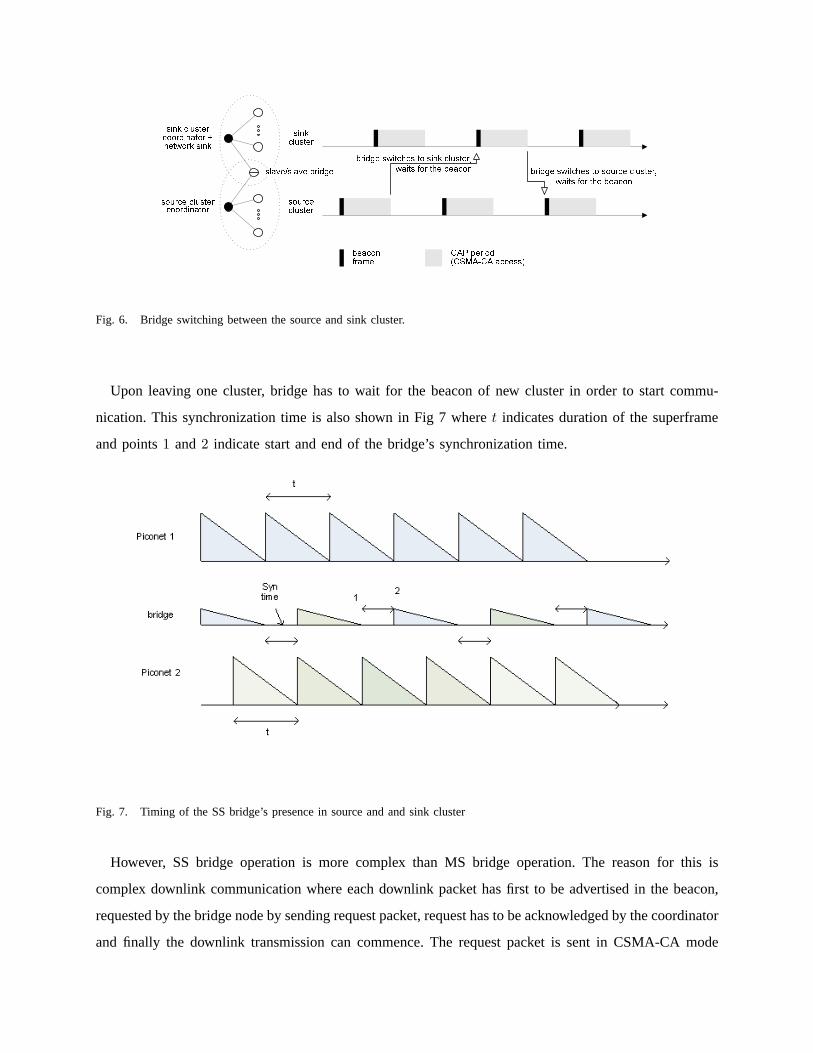
Upon leaving one cluster, bridge has to wait for the beacon of new cluster in order to start commu-
nication. This synchronization time is also shown in Fig 7 wheret indicates duration of the superframe
and points1 and2 indicate start and end of the bridge’s synchronization time.
Fig. 7. Timing of the SS bridge’s presence in source and and sink cluster
However, SS bridge operation is more complex than MS bridge operation. The reason for this is
complex downlink communication where each downlink packet has first to be advertised in the beacon,
requested by the bridge node by sending request packet, request has to be acknowledged by the coordinator
and finally the downlink transmission can commence. The request packet is sent in CSMA-CA mode

and can collide with other uplink data packets. Downlink data packet is also sent in CSMA-CA mode
and can collide with the other packets. Standard also prescribes that downlink transmission has to be
completed within 61 backoff periods, and if it comes later due to many backoff attempts it will not be
acknowledged by the bridge. The diagram which shows interaction among the all the nodes involved in
operation of source and sink cluster is shown in Fig. 8. Note that this figure inicates operations in active
superframe parts from Figs. 6 and 4. As mentioned in Section III, clusters operate in different frequency
bands and inter-cluster interference is not present.
From the discussions presented above, the following states can be identified for the source or sink
PAN coordinator node:
1) The source or sink coordinator may be transmitting the beacon.
2) The source coordinator may be listening to its nodes and receiving data packets from ordinary
nodes or request packets from the bridge node. The sink coordinator only receives data packets
from bridge and its local nodes.
3) The source coordinator may be transmitting the downlink data packet as a result of previously
received request packet. As soon as downlink transmission is finished source coordinator switches
to the listening mode.
Similarly, ordinary or bridge node in the source cluster can be in one of the following states:
1) The ordinary node may be transmitting an uplink data packet.
2) The bridge node may be transmitting an uplink request packet.
3) The bridge node may be in an uplink request synchronization state, which is a virtual state that lasts
from the moment of new downlink packet arrival at the coordinator (or the failure of the previous
downlink reception) up to the beginning of the CSMA-CA procedure for the uplink request. Note
that the arrivals of downlink packets at the coordinator follow the Poisson process, whereas the
corresponding announcements in the beacon (from which the target node finds out about those
packets) do not.
4) The bridge node may be waiting for a downlink packet.
5) The ordinary or bridge node may also be in an idle state, without any downlink or uplink trans-
mission pending or in progress.
In sink cluster, ordinary or bridge node may be transmitting uplink data packets to the coordinator.

source cluster coordinator sink cluster coordinator + network sinkslave/slave bridgeordinary nodes in the source cluster ordinary nodes in the sink clusterbeacon frame;advertises downlink packets for the bridgeu_datau_ack d_requestd_datad_ackbridge switches to sink cluster,waits for the beacon u_datau_acku_datau_ackbeacon frameu_datau_ackbridge switches back to source cluster, waits for the beacon
u_datau_ack u_datau_ackbeacon frame
u_datau_ack beacon frameFig. 8. Interactions between the SS bridge, coordinator and ordinary nodes in source and sink cluster
A. Queuing Model of SS Bridge Exchange
Let us now consider the source WPAN cluster and calculate the amount of traffic that reaches the
sink WPAN cluster. The source WPAN cluster containsn ordinary sensor nodes which have the packet

Fig. 9. Queuing model of the SS bridging process without packet acknowledgments
arrival rate ofλi packets per second during inactive and active time of the superframe. During the active
period of the superframe nodes send packets to the coordinator and further route the packets to the bridge
during its stay. However, not all generated packets make it to the transmission medium because of packet
blocking at the source nodes which we discussed in the case of MS bridge. Moreover, the coordinator
and the bridge also have a finite buffer; these buffers have the capacity ofLc and Lb packets. If the
buffer is full, new packet will not be admitted and the node (coordinator or the bridge) will not send
the acknowledgment. Let us denote the blocking probabilities at ordinary nodes in the source cluster, the
coordinator and at the bridge arePbsrc, P bc andPbb, respectively.
1) Non-acknowledged transfer:In the case of non-acknowledged transmission, the WPAN cluster
coordinator does not acknowledge the packets which are successfully received and stored in its buffer.
Without acknowledgment, uplink packets which are lost due to the noise at the physical layer, collisions
or blocking will not be re-transmitted. However, request packets sent from the bridge as a result of the
coordinator’s advertisement of downlink packets have to be acknowledged.
The amount of traffic admitted in the source WPAN cluster isnλi(1−Pbsrc) and the successful packet
arrival rate offered to the coordinator isλc = nλi(1−Pbsrc)γsrcδsrc, whereγsrc denotes probability that
no collision has occurred for particular packet in source cluster andδsrc denotes the probability that
packet is not corrupted by the noise. Further, the successful packet arrival rate offered to the bridge is

λb = λc(1−Pbc)γcδsrc, whereγc denotes probability that no collision has occurred for particular packet
from coordinator in source cluster.
Given the bit error rate of the physical medium and the total packet length,δsrc is calculated as the
probability that none of the bits in the packet is corrupted by the noise. The graphical representation of
the queuing, blocking and bridging between the two WPAN clusters is shown in Figure 9.
2) Acknowledged transfer:Acknowledged transfer within 802.15.4 beacon enabled MAC was dis-
cussed in Section III-A.2 and in this Section we only discuss its implications on the operation of SS
bridge. Queuing model of bridging between the two WPAN clusters using the SS bridge is shown in
Fig. 10.
Since the transfer is reliable, the total data arrival rate offered to the coordinator satisfies the following
equality :nλi(1−Pbsrc) = λc(1−Pbc), which gives the offered data packet arrival rate to the coordinator
as
λc =nλi(1− Pbsrc)
(1− Pbc)
Similarly, the offered data packet arrival rate to the bridge satisfies the following equalityλc = λb(1−Pbb), which gives the offered bridge packet arrival rate as
λb =nλi(1− Pbsrc)
(1− Pbc)(1− Pbb)
Since the number of nodes n is relatively large and events of packet blocking by the bridge, collisions
and corruptions by noise are non-correlated we will assume that packet arrival process to the coordinator
is Poisson with average rateλc.
V. COMPARATIVE PERFORMANCE EVALUATION
In this section we compare performance of MS and SS bridge under CSMA-CA acknowledged bridge
access. In the evaluation environment built using the Artifex simulation engine by RSoft Design, Inc. [16]
network consists of one source and sink cluster. Clusters operate on different channels in the ISM band
with raw data rate of 250kbps, which means thataUnitBackoffPeriodhas 10 bytes andaBaseSlotDuration
has 30 bytes, and bit error rate ofBER = 10−4. Both source and sink cluster hadn ordinary nodes,
with n varying between 5 and 30. The packet arrival rate to each ordinary node was varied between 30
packets per minute and 3 packets per second for MS bridge. For SS bridge packet arrival rate was varied
between 80 packets per minute to 280 packets per minute.

Fig. 10. Queuing model of the SS bridging process with reliable packet transmission
Data packet size was fixed at 3 backoff periods and request packet size was 2 backoff periods. Ordinary
nodes had buffers that can holdL = 3 packets, while the bridge buffer capacity wasLbri = 6 packets.
The superframe size in both clusters was controlled withSO= 0, BO = 1; as the value ofaNumSu-
perframeSlotsis 16, theaBaseSuperframeDurationis exactly 480 bytes. The minimum and maximum
values of the backoff exponent,macMinBEandaMaxBE, were set to three and five, respectively, while
the maximum number of backoff attempts was five.
For both MS and SS bridge, the bridge residence time in source and sink cluster was equal to the
active superframe time (48 backoff periods). During residence in sink cluster bridge was trying to deliver
as many packets as possible. If the bridge’s buffer was emptied before the end of superframe, bridge has
returned to the source cluster. If the bridge was in the process of backoff countdown when the end of
active superframe part occurred, it has frozen the backoff counter and resumed it upon next visit to the
sink cluster.
Figure 11 shows probability that medium is idle at first Clear Channel Assessment (CCA) for source
nodes, sink nodes and bridge. By comparing figures 11(a) and 11(d) we observe that nodes in source
cluster will observe less activity on first CCA with the presence of SS bridge. Therefore, source cluster

will enter saturation condition where this probability is low (around 0.4) and flat later when it operates
with SS bridge. This is due to the fact that large portion of packets in source cluster with SS bridge are
request packets from the bridge which backoff countdown is started immediately after the beacon with
backoff window equal to 8. Therefore, many request packets from bridge will choose small backoff value
like 0 or 1 and pass the first CCA successfully (first two backoff periods after the beacon are idle). By the
same token, SS bridge will start backoff countdown immediately after joining the sink cluster and sense
the idle channel if it gets small backoff value. Similar reasons explain Figure 12 also. Milder probability
that second CCA is successful is just a result of the fact that bridge’s request packets will obtain small
backoff values and test the medium in the second or third backoff period after the beacon. Also, when
bridge returns to the sink cluster after being emptied in the previous visit, it will start the backoff count
immediately after the beacon and very likely sense that the medium is idle after the beacon. However,
the price for somehow unrealistic feeling about the activity on the medium in the source cluster is high
level of collisions which is shown in Fig. 13. Indeed, many packets from the bridge which pass the first
and second CCAs. However, according to the standard, data packets from the previous superframe which
did not have enough room to conduct two CCAs, send packet and receive acknowledgement, will have to
wait to the next beacon, conduct two CCAs and transmit. Therefore, request packets from the SS bridge
will collide with many delayed packet from the previous superframe which results in the worse success
probability for the source cluster with SS bridge than with MS bridge. Large number of collisions of
request packets will in turn result in repeated advertisements of downlink transmissions in the beacon
and flow of downlink packets to the bridge will slow down until it finally stops. Therefore, relatively
good success probabilities for SS bridge in the sink cluster are a result of very few packets which are
transferred to the sink cluster and transmitted successfully due to lower congestion in the medium. All
these observations are nicely confirmed with throughput values shown in Fig. 14. By comparing Figs.
14(a) and 14(d) we see that throughput in the source cluster reaches higher maximum value for SS bridge
but this is just due to the throughput of request packets. Bridge throughput in sink cluster is actually
higher for MS bridge as shown in Figs. 14(c) and 14(f).
VI. CONCLUSION
In this Chapter we have described design and performance issues of cluster interconnection for beacon
enabled 802.15.4 clusters. Our discussion shows that there are pros and cons for both approaches. SS
bridge removes the task of bridging from the WPAN coordinator but it generates more traffic in the source
cluster. MS bridge efficiently uses the inactive superframe period where all nodes sleep and utilizes uplink

51015202530n
40 60 80 100120140160lambda_i
0.4
0.5
0.6
0.7
0.8
0.9
alpha
(a) First CCA probability for node in
source cluster (MS)
51015202530n
40 60 80 100120140160lambda_i
0.4
0.5
0.6
0.7
0.8
0.9
alpha
(b) First CCA probability for node in
sink cluster (MS)
51015202530n
40 60 80 100120140160lambda_i
0.4
0.5
0.6
0.7
0.8
0.9
alpha
(c) First CCA probability for bridge in
sink cluster (MS)probability that medium is idle on first CCA in src.cluster
50100
150200
250Lambda
510
1520
2530
N
0.4
0.5
0.6
0.7
0.8
alfa
(d) First CCA probability for node in
source cluster (SS)
probability that medium is idle on first CCA in sink.cluster
50100
150200
250Lambda
510
1520
2530
N
0.6
0.7
0.8
0.9
alfa
(e) First CCA probability for node in
sink cluster (SS)
probability that medium is idle on first CCA of bridge in sink.cluster
50100
150200
250
Lambda
510
1520
2530
N
0.75
0.8
0.85
0.9
0.95
alfa
(f) First CCA probability for bridge in
sink cluster (SS)
Fig. 11. Probability that medium is idle on first CCA. Top row shows results for MS bridge, bottom row shows results for SS
bridge.
data transmissions, but it becomes a single point of failure and target for security attacks.
REFERENCES
[1] “Standard for part 15.4: Wireless MAC and PHY specifications for low rate WPAN,” IEEE, New York, NY, IEEE Std
802.15.4, Oct. 2003.
[2] J. A. Gutierrez, E. H. Callaway, Jr., and R. L. Barrett, Jr.,Low-Rate Wireless Personal Area Networks. New York, NY:
IEEE Press, 2004.
[3] E. H. Callaway, Jr.,Wireless Sensor Networks, Architecture and Protocols. Boca Raton, FL: Auerbach Publications, 2004.
[4] G. Lu, B. Krishnamachari, and C. Raghavendra, “Performance evaluation of the IEEE 802.15.4 MAC for low-rate low-
power wireless networks,” inProc. Workshop on Energy-Efficient Wireless Communications and Networks EWCN’04,
Phoenix, AZ, Apr. 2004.
[5] J.-S. lee, “An experiment on performance study of IEEE 802.15.4 wireless networks,” in10th IEEE Conference on Emerging
Technologies and Factory Automation ETFA 2005, vol. 2, Catania, Italy, Sept. 2005, pp. 451–458.
[6] B. Bougard, F. Catthoor, D. C. Daly, A. Chandrakasan, and W. Dehaene, “Energy efficiency of the IEEE 802.15.4 standard
in dense wireless microsensor networks: Modeling and improvement perspectives,” inDATE ’05: Proceedings of the
conference on Design, Automation and Test in Europe, vol. 1, Munich, Germany, Mar. 2005, pp. 196–201.

51015202530n
40 60 80 100120140160lambda_i
0.7
0.75
0.8
0.85
0.9
0.95
1
beta
(a) Second CCA probability for node in
source cluster (MS)
51015202530n
40 60 80 100120140160lambda_i
0.7
0.75
0.8
0.85
0.9
0.95
alpha
(b) Second CCA probability for node in
sink cluster (MS)
51015202530n
40 60 80 100120140160lambda_i
0.7
0.75
0.8
0.85
0.9
0.95
beta
(c) Second CCA probability for bridge
in sink cluster (MS)probability that medium is idle on second CCA in src.cluster
50100
150200
250Lambda
510
1520
2530
N
0.70.75
0.80.85
0.90.95
beta
(d) Second CCA probability for node in
source cluster (SS)
probability that medium is idle on second CCA in sink.cluster
50100
150200
250Lambda
510
1520
2530
N
0.880.9
0.920.940.960.98
beta
(e) Second CCA probability for node in
sink cluster (SS)
probability that medium is idle on second CCA of bridge in sink.cluster
50100
150200
250Lambda
510
1520
2530
N
0.930.940.950.960.970.980.99
beta
(f) Second CCA probability for bridge
in sink cluster (SS)
Fig. 12. Probability that medium is idle on second CCA. Top row shows results for MS bridge, bottom row shows results for
SS bridge.
[7] I. Howitt, R. Neto, J. Wang, and J. M. Conrad, “Extended energy model for the low rate WPAN,” inProc. IEEE Int. Conf.
on Mobile Ad-hoc and Sensor Systems MASS2005, Washington, DC, Nov. 2005, pp. 315–322.
[8] T. H. Kim and S. Choi, “Priority-based delay mitigation for event-monitoring IEEE 802.15.4 LR-WPANs,”IEEE
Communication Letters, vol. 10, no. 3, pp. 213–215, Mar. 2006.
[9] N. F. Timmons and W. G. Scanlon, “Analysis of the performance of IEEE 802.15.4 for medical sensor body area
networking,” in First Annual IEEE Communications Society Conference on Sensor and Ad Hoc Communications and
Networks SECON 2004, Santa Clara, CA, Oct. 2004, pp. 16–24.
[10] A.-C. Pang and H.-W. Tseng, “Dynamic backoff for wireless personal networks,” inIEEE GLOBECOM 2004, vol. 3,
Dallas, TX, Dec. 2004, pp. 1580–1584.
[11] M. Neugebauer, J. Plonnigs, and K. Kabitzsch, “A new beacon order adaptation algorithm for IEEE 802.15.4 networks,” in
Proceeedings of the Second European Workshop on Wireless Sensor Networks, Istanbul, Turkey, Feb. 2005, pp. 302–311.
[12] J. Misic, S. Shafi, and V. B. Misic, “The impact of MAC parameters on the performance of 802.15.4 PAN,”Ad hoc
Networks, vol. 3, no. 5, pp. 509–528, Sept. 2005.
[13] ——, “Performance of beacon enabled ieee 802.15.4 cluster with downlink and uplink tarffic,”IEEE Transactions on
Parallel and Distributed Systems, vol. 17, no. 4, pp. 361–377, Apr. 2006.
[14] V. P. Mhatre, C. Rosenberg, D. Kofman, R. Mazumdar, and N. Shroff, “A minimum cost heterogeneous sensor network
with a lifetime constraint,”IEEE Transactions on Mobile Computing, vol. 4, no. 1, pp. 4–15, Jan-Feb 2005.

51015202530n
40 60 80 100120140160lambda_i
0
0.2
0.4
0.6
0.8
1
gama
(a) Success probability for node in
source cluster (MS)
51015202530n
40 60 80 100120140160lambda_i
0.2
0.4
0.6
0.8
1
gama
(b) Success probability for node in sink
cluster (MS)
51015202530n
40 60 80 100120140160lambda_i
0.2
0.4
0.6
0.8
1
gama
(c) Success probability for bridge in
sink cluster (MS)probability of success in src.cluster
50100
150200
250
Lambda
510
1520
2530
N
0.2
0.4
0.6
0.8
1
gama
(d) Success probability for node in
source cluster (SS)
probability of success in sink.cluster
50100
150200
250Lambda
510
1520
2530
N
0.75
0.8
0.85
0.9
0.95
gama
(e) Success probability for node in sink
cluster (SS)
probability of success of bridge in sink.cluster
50100
150200
250Lambda
510
1520
2530
N
0.8
0.85
0.9
0.95
gama
(f) Success probability for bridge in
sink cluster (SS)
Fig. 13. Probability of successful transmission. Top row shows results for MS bridge, bottom row shows results for SS bridge.
[15] M. Yarvis, N. Kushalnagar, H. Singh, A. Rangarajan, Y. Liu, and S. Singh, “Exploiting heterogeneity in sensor networks,”
in Proc. INFOCOM05, vol. 2, Miami, FL, Mar. 2005, pp. 878–890.
[16] RSoft Design, Inc.,Artifex v.4.4.2, San Jose, CA, 2003.

5 10 15 20 25 30
n406080100120140160180
lambda_i
0.005
0.01
0.015
0.02
th
(a) Throughput in source cluster (MS)
5 10 15 20 25 30
n406080100120140160180
lambda_i
0.005
0.01
0.015
0.02
0.025
0.03
th
(b) Local throughput in sink cluster
(MS)
5 10 15 20 25 30
n406080100120140160180
lambda_i
0.01
0.02
0.03
0.04
th
(c) Bridge throughput in sink cluster
(MS)
throughput in src.cluster
50100
150200
250
Lambda
510
1520
2530
N
0.01
0.02
0.03
0.04
Th
(d) Throughput in source cluster (SS)
throughput in sink.cluster
50100
150200
250
Lambda
510
1520
2530
N
0.0050.01
0.0150.02
0.0250.03
Th
(e) Local throughput in sink cluster
(SS)
throughputof bridge in sink.cluster
50100
150200
250
Lambda
510
1520
2530
N
0.0050.01
0.0150.02
0.0250.03
Th
(f) Bridge throughput in sink cluster
(SS)
Fig. 14. Throughput. Top row shows results for MS bridge, bottom row shows results for SS bridge.