cm3007 chromatography: theory, sampling and detection dr. alan o’riordan nanotechnology group...
Post on 18-Dec-2015
217 views
TRANSCRIPT

CM3007
Chromatography: Theory, Sampling and
Detection
Dr. Alan O’Riordan
Nanotechnology Group
Tyndall National Institute.
Email: [email protected]

Learning Outcomes
• Define and explain the theory underpinning chromatography.
• To be able to explain how partition of an analyte between stationary phase and mobile phase effects separation.
• To be able to identify and explain the factors influencing chromatographic separation in terms of resolution and specificity.
• Identify the factors influencing different sample injection techniques and be able to discuss the advantages and disadvantages of each type.
• Identify the factors influencing different analyte detection systems and be able to discuss the advantages and disadvantages of each type.

Classification of Chromatography Methods

Introduction to Chromatography
Separation of a mixture of components A and B by column elution chromatography.
The detector signal at each stage is shown.
The effectiveness of a column in separating two analytes depend in part on the relative rates at which the two components are eluted.
These rates are determined by the magnitude of the equilibrium constants for the components partioned between the stationary phase and mobile phase.
A mobile ⇆ A stationary
Detector
Column
Sample M obile phase
Time

Mechanisms of Partition to Stationary Phase

Equipment Overview
Mobilephase
Sample injection
Detector
Chem station
Packed column GC & HPLC
Capillary column GC only

Partition in Chromatography
• Stationary phase, mobile phase, & analyte form a ternary system.
• Each analyte is distributed between the two phases (in
equilibrium):
– Partition Coefficient
– CS: concentration of analyte on the stationary phase
– CM: concentration of analyte on the mobile phase
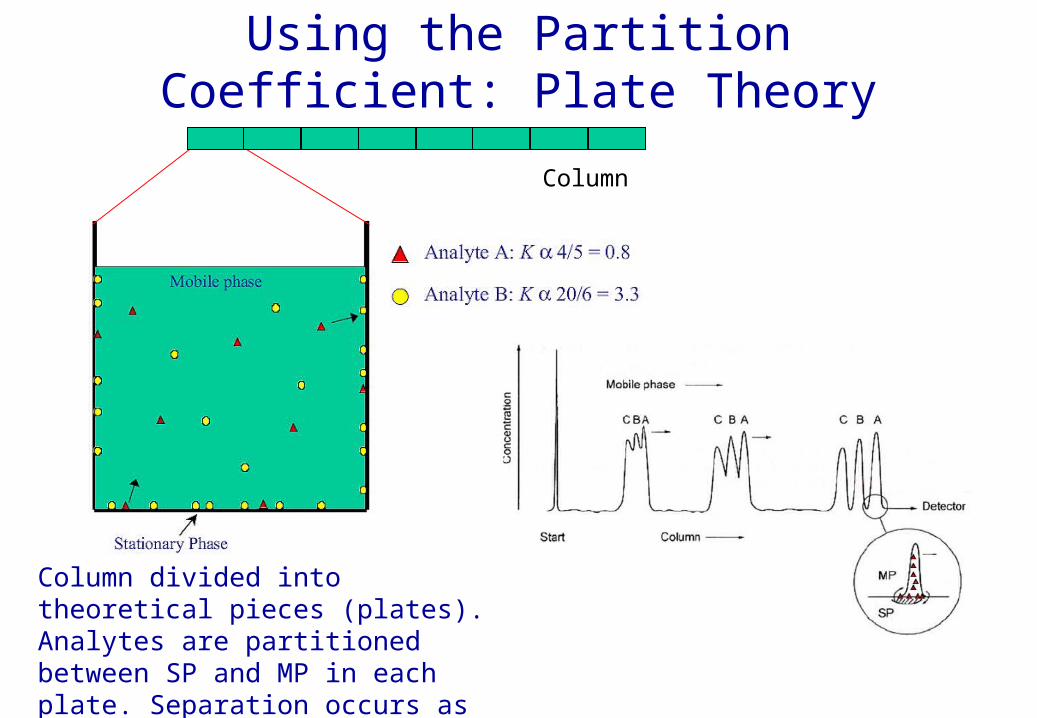
Using the Partition Coefficient: Plate Theory
Column divided into theoretical pieces (plates). Analytes are partitioned between SP and MP in each plate. Separation occurs as analytes move down the column.
Column

Definitions: Prototype Chromatogram
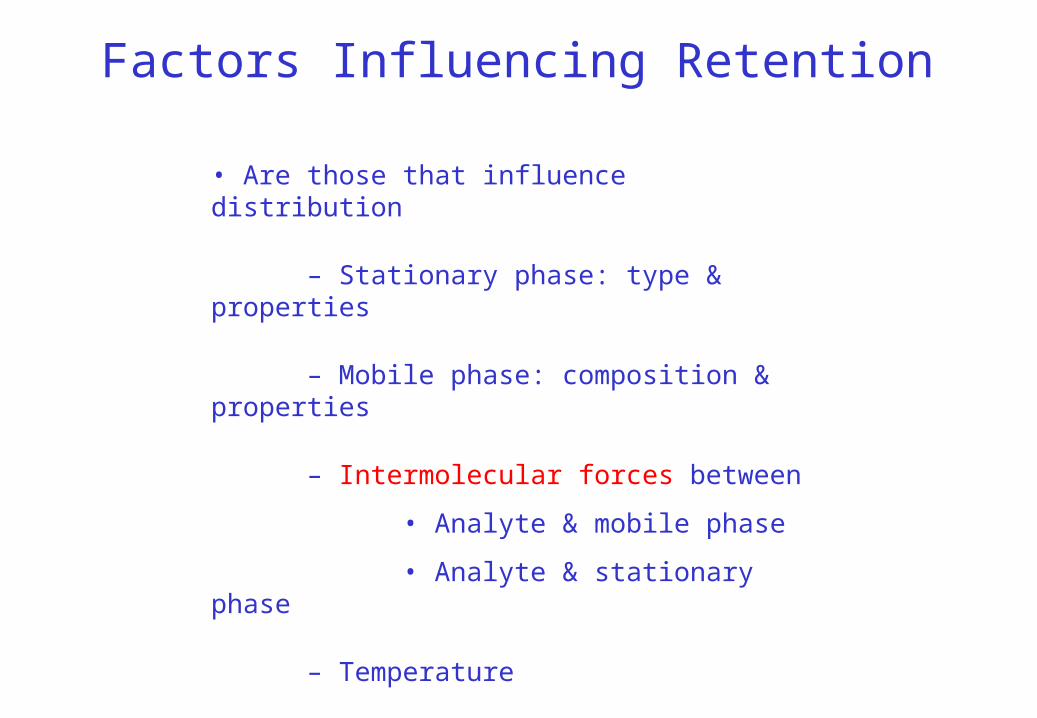
Factors Influencing Retention
• Are those that influence distribution
– Stationary phase: type & properties
– Mobile phase: composition & properties
– Intermolecular forces between
• Analyte & mobile phase
• Analyte & stationary phase
– Temperature
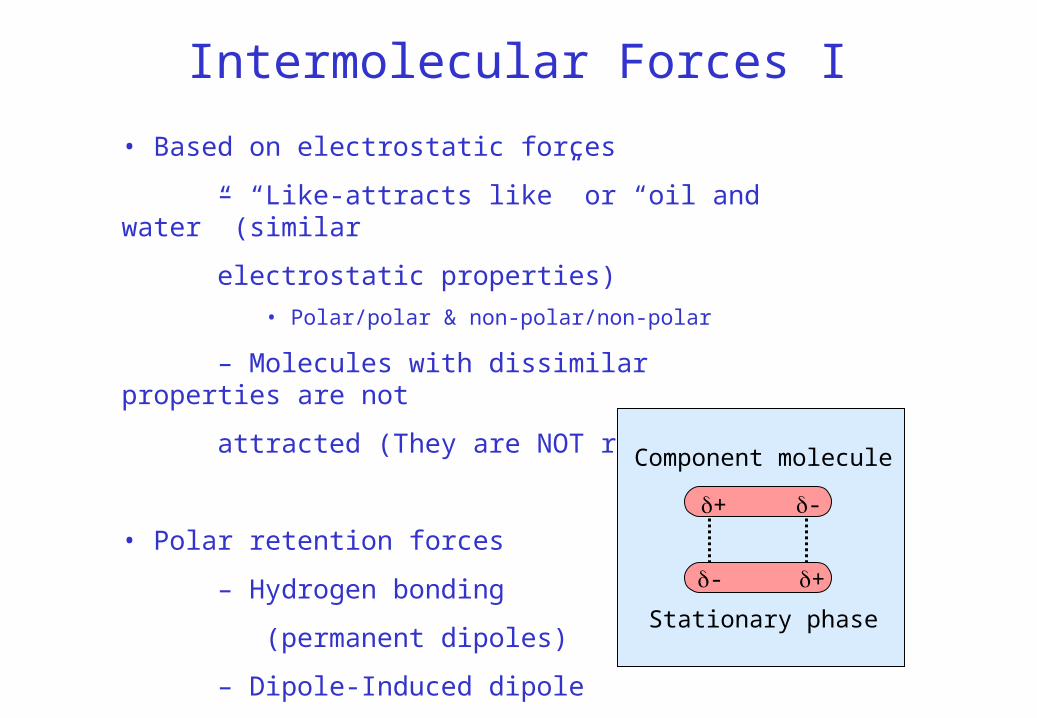
Intermolecular Forces I
• Based on electrostatic forces
– “Like-attracts like” or “oil and water” (similar
electrostatic properties)
• Polar/polar & non-polar/non-polar
– Molecules with dissimilar properties are not
attracted (They are NOT repelled)
• Polar retention forces
– Hydrogen bonding
(permanent dipoles)
– Dipole-Induced dipole
-
- +
+
Component molecule
Stationary phase

Intermolecular Forces II
Polar forces (cont.):
– Energy of dipole-dipole interaction
– Factor of 10 variation on permanent dipole moment
Factor of 104 variation on interaction energies
– As r6 => mainly at the surfaces of stationary phase
dipole moment, A: analyte,
S: stationary phase

London’s Dispersion Forces (Van Der Waals)
– Most universal interaction between molecules
– Only one for non-polar species
– Relatively weak
– Energy of interaction:
:is the polarisability, I: ionisation potential, A:analyte,
S: stationary phase
Intermolecular Forces III (London)
– As r6 => mainly at the surfaces of stationary phase
How do Van Der Waal forces occur?

Definitions I
•VR, Retention Volume – Volume required to carry a band of component molecules – Primary quantity, but hard to measure!
•tR, Retention Time
• FC, volume flow rate of mobile phase– Calculated from cross section of column (dC), average velocity of mobile phase (u), and term to account for particle volume in columns (εT ; =1 if no particles)

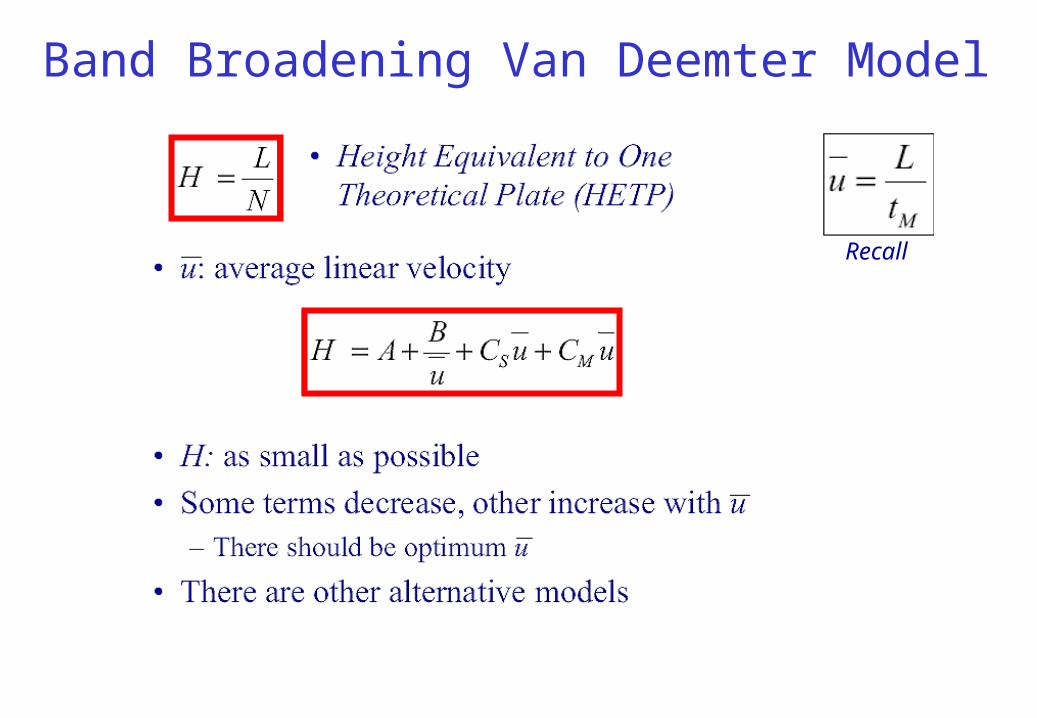
Definitions II• u, linear velocity of the mobile phase:
– L: length of the column– tM: flow time of mobile phase
• Measure with non-retained componente.g. CH4 in GC
• Correction for dead volume– Retention time is measured since injection– Correct for mobile phase in column at injection ( VM)
t´R

RetardationRecall partition coefficient
RF, retardation:
Substituting:
– 0 < RF < 1– If RF = 1, analyte is not retained at all– If RF = 0, analyte is completely retained

Retention (or Capacity) Factor• k is like K except:
– k is the ratio of total amounts, rather than of concentrations
– Describes the ability of the stationary phase to retain components (same as K)
– But it is a measure of actual retention properties

Separation Factor

Separation Efficiency – Peak Width
Peak heights of a Gaussian peak and width as a function of standard deviation

Separation Efficiency – Column Efficiency

Peak Band Broadening Processes
Initial Time, t1 Time, t2
What physical or chemical processes cause broadening of the peaks in chromatography

Peak Band Broadening Processes II
Recall
Band Broadening Van Deemter Model
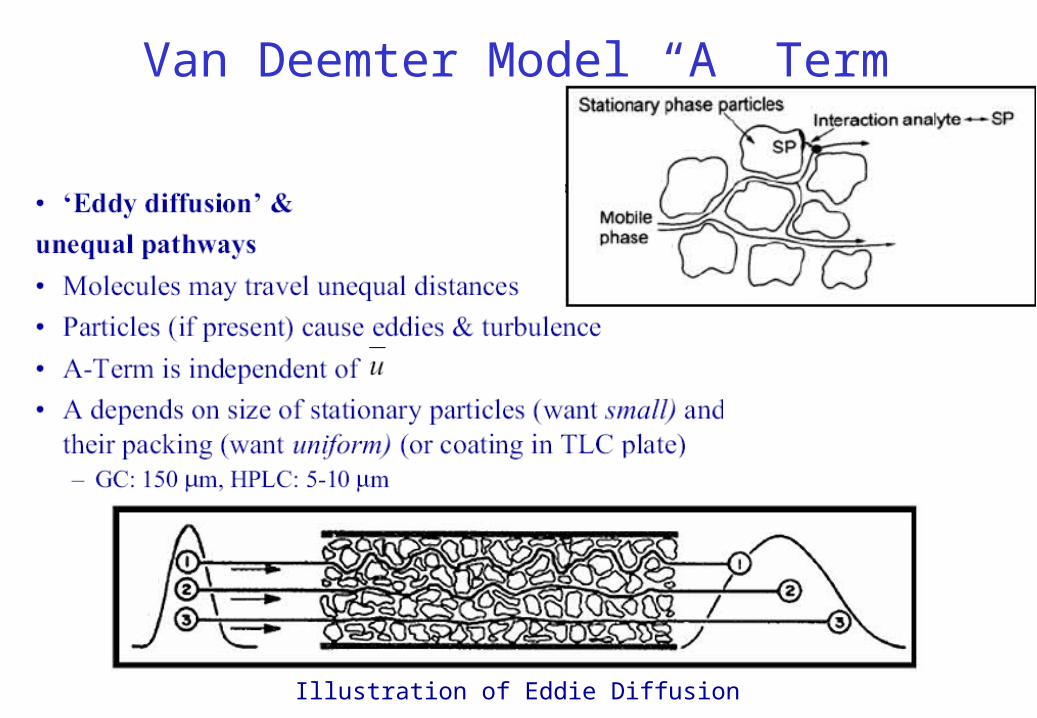
Van Deemter Model “A” Term
Illustration of Eddie Diffusion

Van Deemter Model “B” Term
Illustration of band broadening due to molecular diffusion. T3 > T2 > t1

Van Deemter Model “B” Term
D gas ≥ 104 D liquid

Van Deemter Model “C” Term

Van Deemter Model “C” Term II
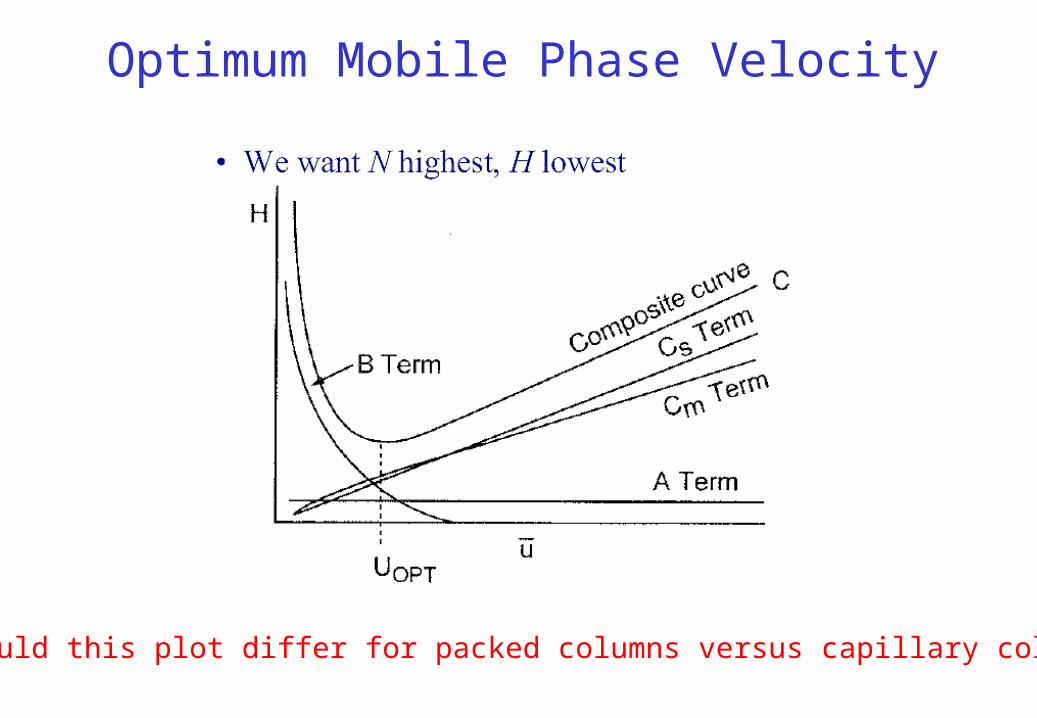
Optimum Mobile Phase Velocity
How would this plot differ for packed columns versus capillary columns?
Gas Chromatography:

Gas Chromatography – Overview• Sample is vaporised and injected onto head
of a chromatography column.
• Elution is effected by the flow of an inert gaseous mobile phase.
• Separation is based upon the partition of the analyte between a gaseous mobile phase and a liquid phase immobilised on the surface of an inert solid (GLC) at a temperature above boiling point of analyte (multi-analyte: temperature programming).
• Mobile phase does not interact with molecules of the analyte.
• Eluted analyte detected by a detector and recorded by PC – Chemstation.
• GC columns are either packed (with silica particles coated in stationary) or capillary in nature.

Sample Injection
• GC column efficiency requires that the sample be of suitable size (to prevent column over loading) and be introduced as a plug of vapour.
• Two common approaches include for introduction of 0.01 – 50 l include: Microsyringe and valve loop.
• The syringe technique is most common and can be used with both gas and low viscosity liquid samples by inserting the needle through a rubber septum to the column inlet port.
• The region into which the needle projects must be heated in order to flash vaporise the sample.
• However, overheating of the rubber septum must be avoided to prevent out gassing.
• The most popular inlet for capillary GC is the split/splitless injector.
• If this injector is operated in split mode, the amount of sample reaching the column is reduced (to prevent column overloading) and very narrow initial peak widths can be obtained.
• For maximum sensitivity, the injector can be used in so-called splitless mode, then all of the injected sample will reach the column.
• Injection may be manual or automated.

Split – Splitless Injection• Septum purge outlet prevents components of previous
injections from entering the column and minimizes the effect of septum bleed (low flow rate ~3 ml/min).
• The sample is injected into the liner region where it is completely vaporised. Mostly glass liners – zero dead volume
• The sample volume is then split between the column and the split outlet. Split injection is employed to dilute the sample and prevent column overloading. Typically 1:100 split ratios are employed with 99% of sample being vented to atmosphere.
• Method development: Some parameters of split/splitless injection that require optimisation, apart from instrumental design, are injector temperature, split ratio, split delay, injection volume, sample solvent and initial temperature of the column.

Sample Valve Injection
(a) Sample mode
(b) Inject mode
• Sample valves are convenient for on-line gas stream analysis.
• In position (a) the stream to be sampled flows through a loop of calibrated volume while the carrier gas alone passes through the column.
• In position (b) the loop is placed in the carrier gas stream and the entrapped sample is swept along to the column.
• Sample valves are becoming more prevalent for quantitative work employing both liquids and gases to introduce a reproducible volume of sample onto a column.
• They are typically employed for smaller volumes, e.g., to prevent over loading of a column > 0.01 l of a liquid sample is preferred volume - a precision syringe for this volume is both expensive and fragile.
• Valves may also be used in split – splitless mode.

Pyrolysis Gas Chromatography (PGC)
• A version of reaction chromatography in which a sample is thermally decomposed to simpler fragments before entering the column. 1993, 65, 827
IUPAC Compendium of Chemical Terminology
• Many non-volatile solids can be decomposed thermally to produce characteristic gaseous products that can be chromatographed.
• Samples are placed directly on a small coil of Pt wire where it can be heated to several hundred degrees in a few milliseconds while the carrier gas is flowing over it.
• The pyrolysis products are swept directly onto the column.
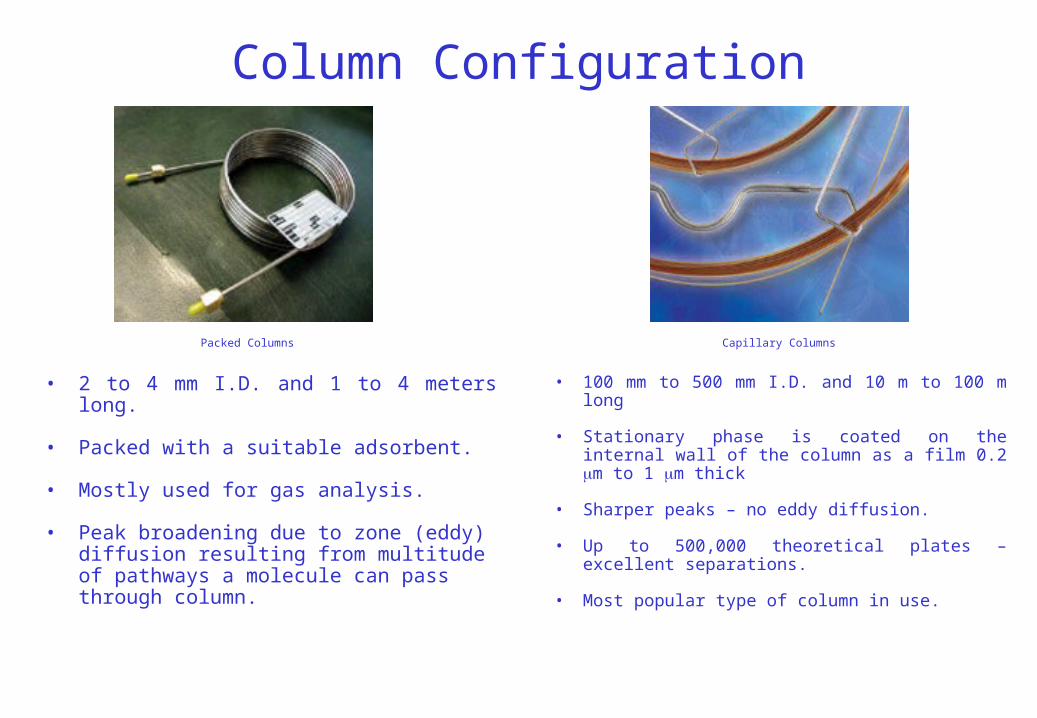
Column Configuration
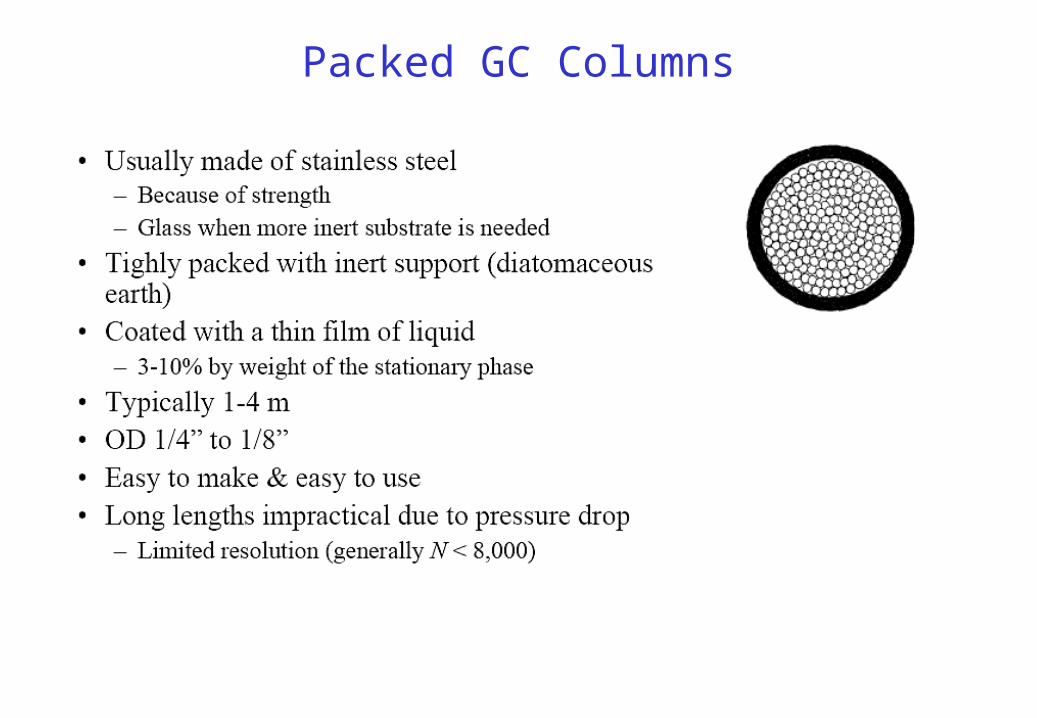
• 2 to 4 mm I.D. and 1 to 4 meters long.
• Packed with a suitable adsorbent.
• Mostly used for gas analysis.
• Peak broadening due to zone (eddy) diffusion resulting from multitude of pathways a molecule can pass through column.
Packed Columns Capillary Columns
• 100 mm to 500 mm I.D. and 10 m to 100 m long
• Stationary phase is coated on the internal wall of the column as a film 0.2 m to 1 m thick
• Sharper peaks – no eddy diffusion.
• Up to 500,000 theoretical plates – excellent separations.
• Most popular type of column in use.

Characteristics of Ideal GC Detector
• Good stability and reproducibility.
• Linear response to analytes that extends over several orders of magnitude.
• Similarity in response toward all analytes.
• Temperature range from room temperature to 400 ºC.
• A short response time that is independent of flow rate.
• Non-destructive.
• High reliability and ease of use.
• No one detector exhibits all of these characteristics

Thermal Conductivity Detector• Exploits the changes in the thermal conductivity of a gas
stream brought about by the presence of analyte molecules.
• The resistance of either a heated platinum wire or a heated semiconductor thermistor gives a measure of the thermal conductivity of the gas.
• Twin detector pairs are typically incorporated into two arms of a Wheatstone bridge.
• In the presence of a relatively small concentration of analyte a large decrease in thermal conductivity of carrier gas occurs resulting in a temperature rise in detector.
• Thermal conductivities of He and H2 are ~ 6 – 10 times higher than most organic compounds. Necessitates the use of these gases as carrier gas.
• Linear range of 105 and is suitable for organic and inorganic samples.
• Non-destructive and allows collection of sample after detection but low sensitivity ~ 10-8 g/s analyte/gas
Flame Ionisation Detector
Air
H2
Insulator
Connector nut
Grounded jet
H2-air flame
Inside oven wall
Exit endof column
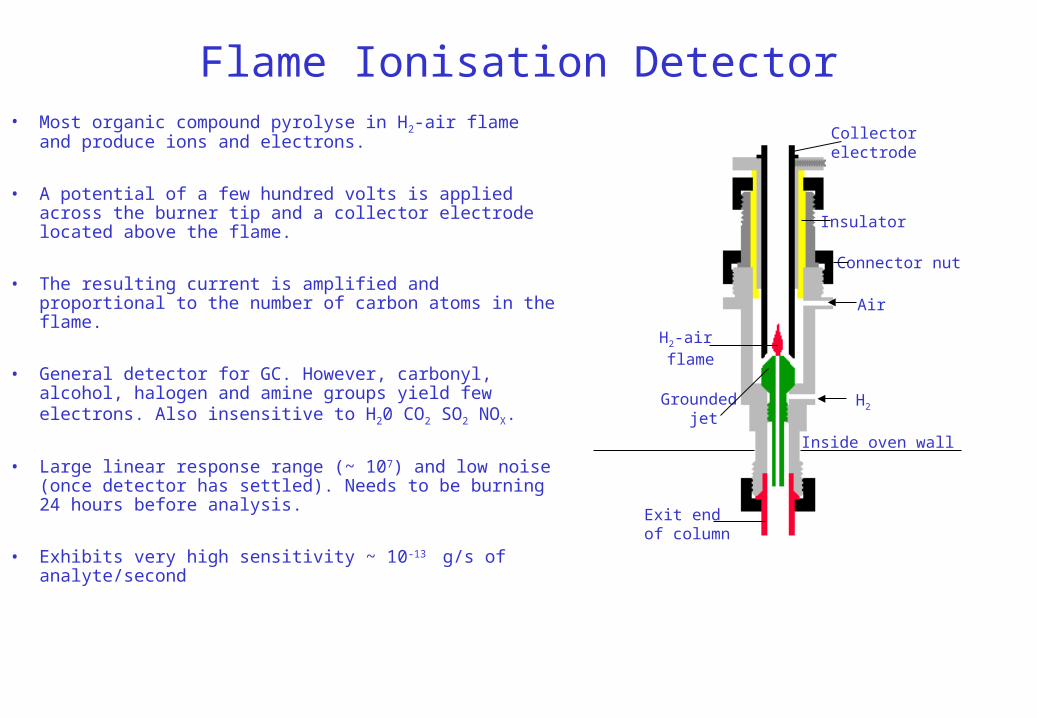
• Most organic compound pyrolyse in H2-air flame and produce ions and electrons.
• A potential of a few hundred volts is applied across the burner tip and a collector electrode located above the flame.
• The resulting current is amplified and proportional to the number of carbon atoms in the flame.
• General detector for GC. However, carbonyl, alcohol, halogen and amine groups yield few electrons. Also insensitive to H20 CO2 SO2 NOX.
• Large linear response range (~ 107) and low noise (once detector has settled). Needs to be burning 24 hours before analysis.
• Exhibits very high sensitivity ~ 10-13 g/s of analyte/second
Collectorelectrode

Advantages and Disadvantages of GC
• Fast analysis– Typically minutes (even sec.)
• High Resolution– Record N~1.3 x 10⁶
• Sensitive detectors (easy ppm, often ppb)• Highly accurate quantification (1-5 % RSD)• Automated systems • Non-destructive
– Allows online coupling to Mass Spec.
• Small sample (L)• Reliable and relatively simple• Low cost (~€20,000)
• Limited to volatile samples– T limited to ~ 380 °C
• Need Pvap ~ 60 Torr at that temperature
• Not suitable for thermally labile samples
• Some samples may require extensive preparation
• Requires spectroscopy (usually MS) to confirm peak identify
Dr. Alan O’Riordan
Nanotechnology Group
Tyndall National Institute.
Email: [email protected]
CM3007
Gas Chromatography:
Method Development and Validation
Learning Outcomes
• Be able to differentiate between different GC column types.
• Explain how mobile phase flow rate, temperature and type of column can affect column resolution and sensitivity.
• Determine/identify suitable stationary phase for analytes.
• Distinguish between different quantitative approaches to GC.
• Specify and explain the eight requirements necessary for method validation.
• Identify and explain the different approaches to analyte sampling and injection.
• Identify two application areas for GC.

Choice of GC Columns
Packed GC Columns

Open (capillary) GC Columns
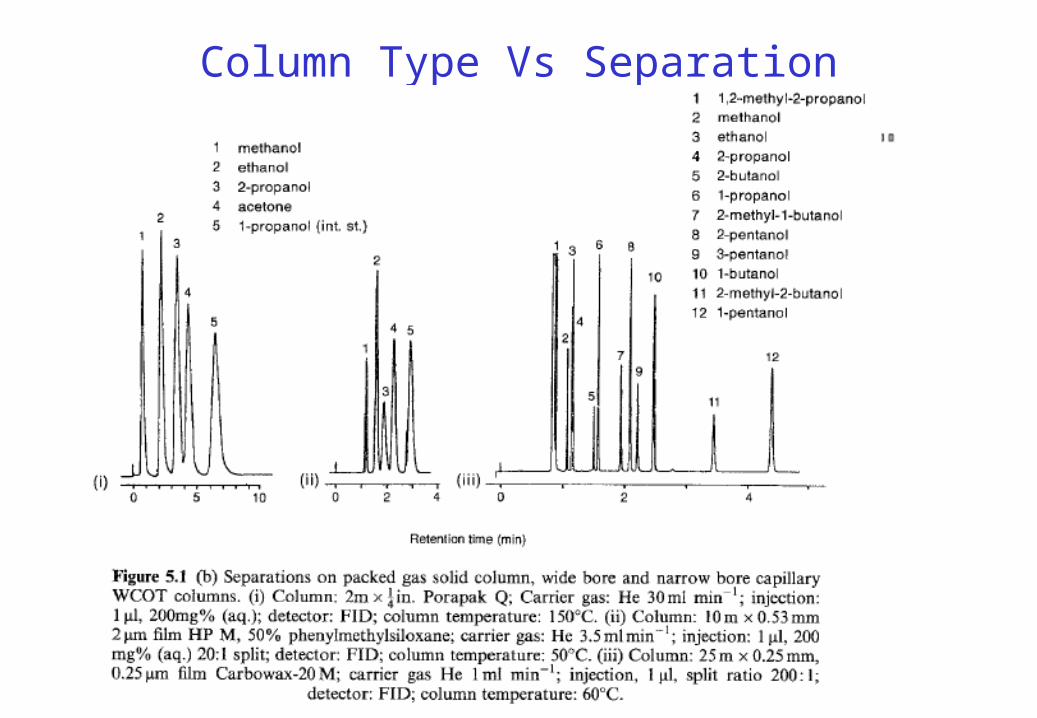
Column Type Vs Separation

Comparison of Columns

Effect of Column Diameter & Film Thickness

Optimum Mobile Phase Velocity
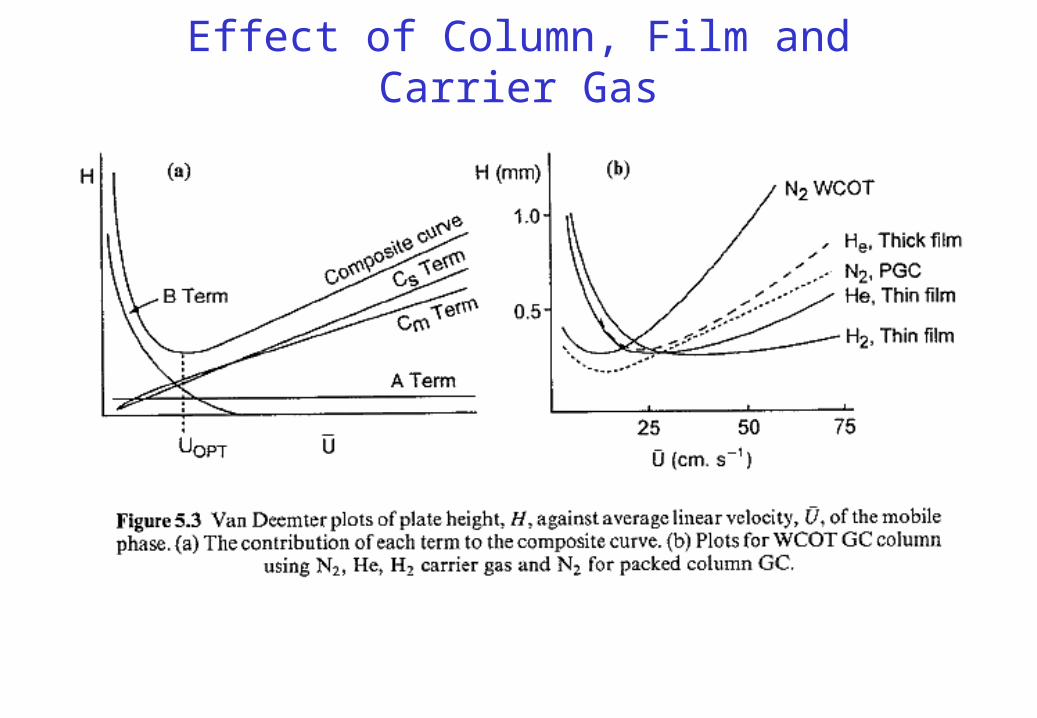
Effect of Column, Film and Carrier Gas

Effect of Temperature on Retention Time
Two Decisions

How to Choose a Stationary Phase
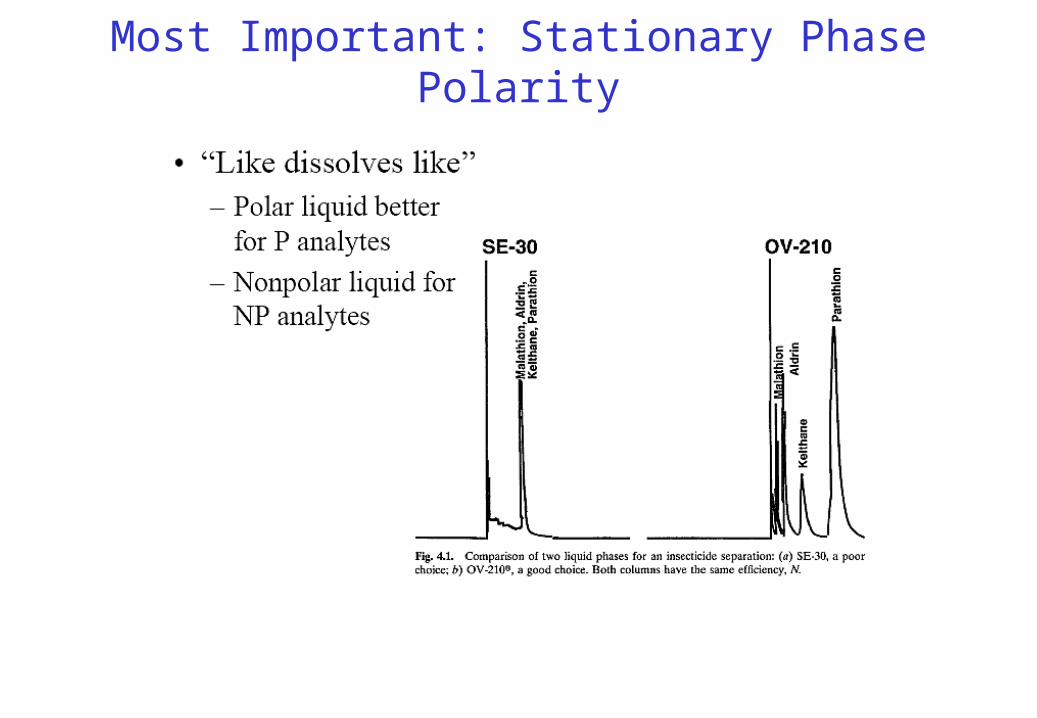
Most Important: Stationary Phase Polarity
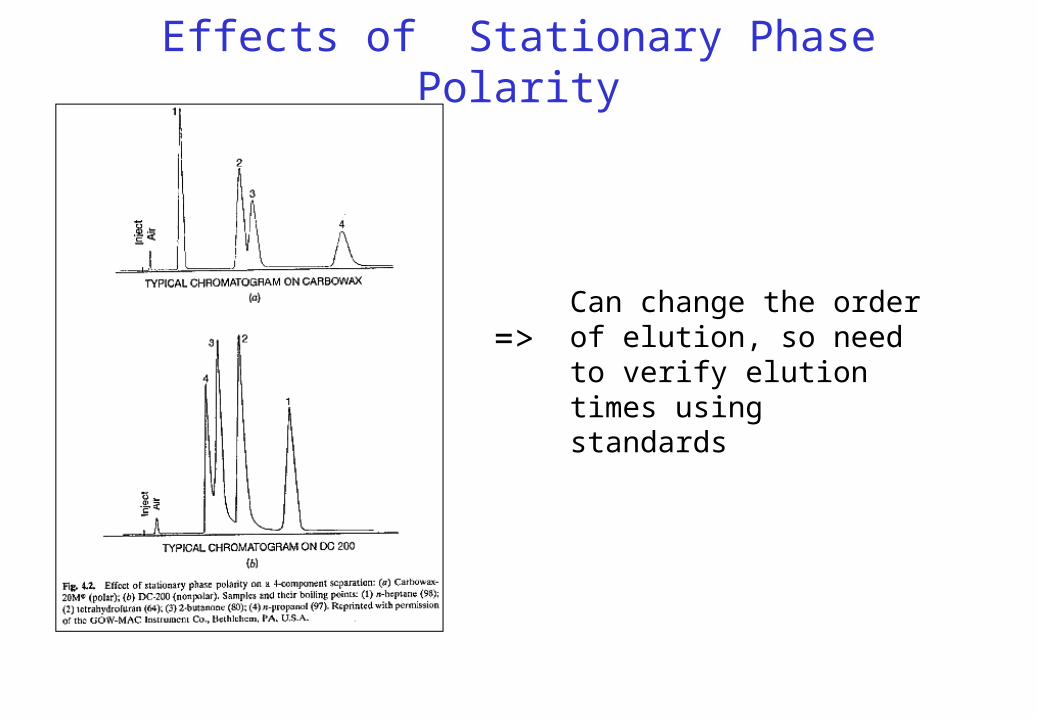
Effects of Stationary Phase Polarity
=>Can change the order of elution, so need to verify elution times using standards
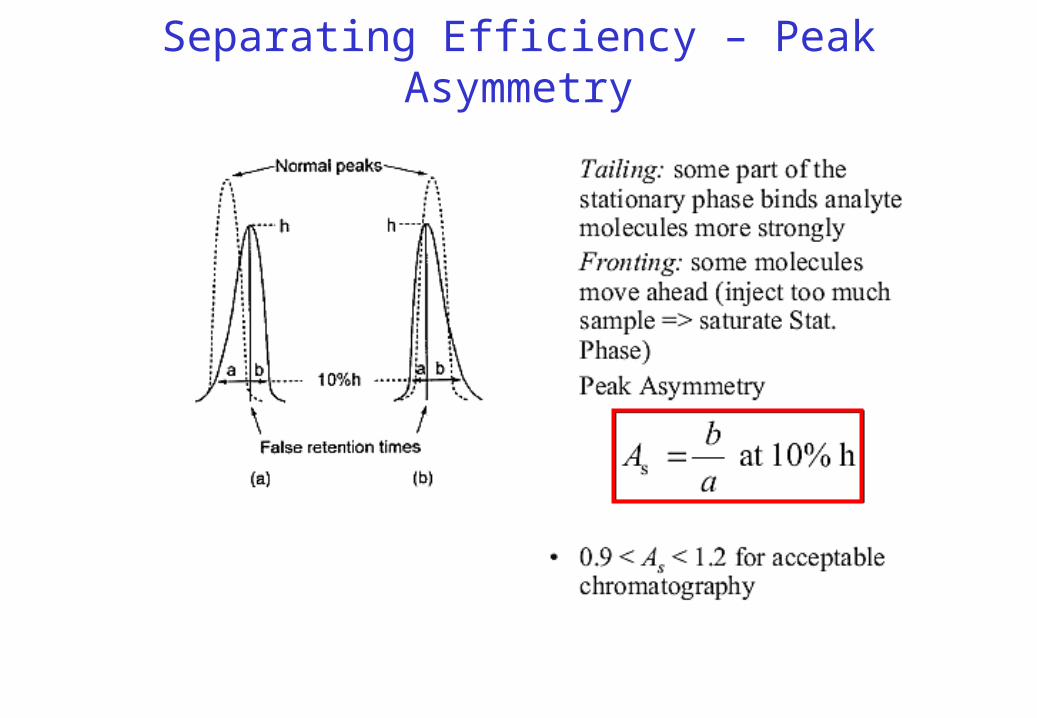
Separating Efficiency – Peak Asymmetry

Resolution
• Objective: accurate measurement of individual peak areas

Can One Have Too Much Resolution
RS = 2.5

Resolution and Selectivity

Quantification in GC

Quantification: Normalizing Peak Areas
Requires identical samples – not very robust
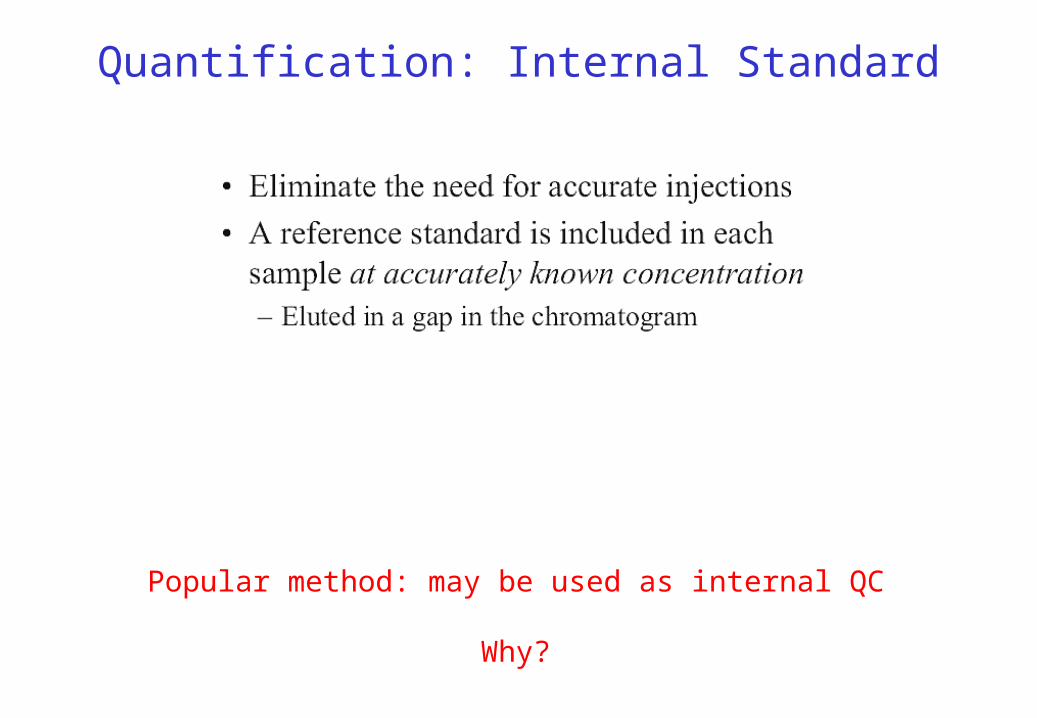
Quantification: Internal Standard
Popular method: may be used as internal QC
Why?

Quantification: External Standard
Normally performed in conjunction with internal standard

Quantification: Standard Addition
• Different concentrations of standard are added to ` sample aliquots.• Samples are analysed• Can be used to verify linearity
Q: why are separate sample aliquots prepared?
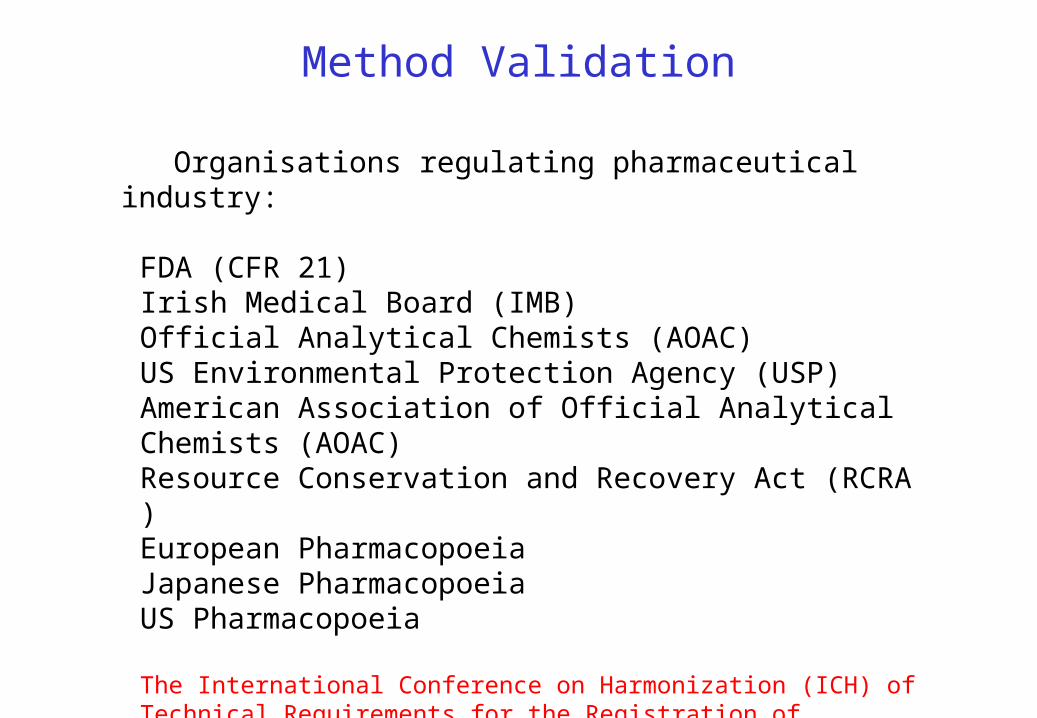
Method Validation
Organisations regulating pharmaceutical industry:
FDA (CFR 21)Irish Medical Board (IMB)Official Analytical Chemists (AOAC)US Environmental Protection Agency (USP) American Association of Official Analytical Chemists (AOAC)Resource Conservation and Recovery Act (RCRA )European Pharmacopoeia Japanese Pharmacopoeia US Pharmacopoeia
The International Conference on Harmonization (ICH) of Technical Requirements for the Registration of Pharmaceuticals for Human Use has developed a consensus text on the validation of analytical procedures (1995)

ICH Guidelines
Validation requirements include:
1. Specificity: Ability to measure desired analyte in complex mixture.2. Accuracy: agreement between measured and real value.3. Linearity: proportionality of measured value to the concentration.4. Precision: agreement between a series of measurements.5. Range: concentration interval where method is precise accurate and linear.6. Detection limit: lowest amount of analytes that can be detected (LOD).7. Quantitation limit: lowest amount of analyte that can be measured (LDQ).8. Robustness: reproducibility under normal but variable laboratory conditions.
What is the difference between repeatability and reproducibility?
What is GMP?

Selectivity in chromatography is obtained by choosing optimal columns and setting chromatographic conditions, such as mobile phase composition, column temperature and detector wavelength. UV-vis spectroscopy may be used to identify pure peaks
Specificity

Accuracy and Recovery
Active Ingred. [ %] Analyte ratio Unit Mean recovery [%]
100 1 100% 98-102
>=10 10-1 10% 98-102
>=1 10-2 1% 97-103
>=0.1 10-3 0.1 % 95-105
0.01 10-4 100 ppm 90-107
0.001 10-5 10 ppm 80-110
0.0001 10-6 1 ppm 80-110
0.00001 10-7 100 ppb 80-110
0.000001 10-8 10 ppb 60-115
The accuracy of an analytical method is the extent to which test results generated by the method and the true value agree. Accuracy can be assessed by analyzing a sample with known concentrations, e.g., a certified reference material
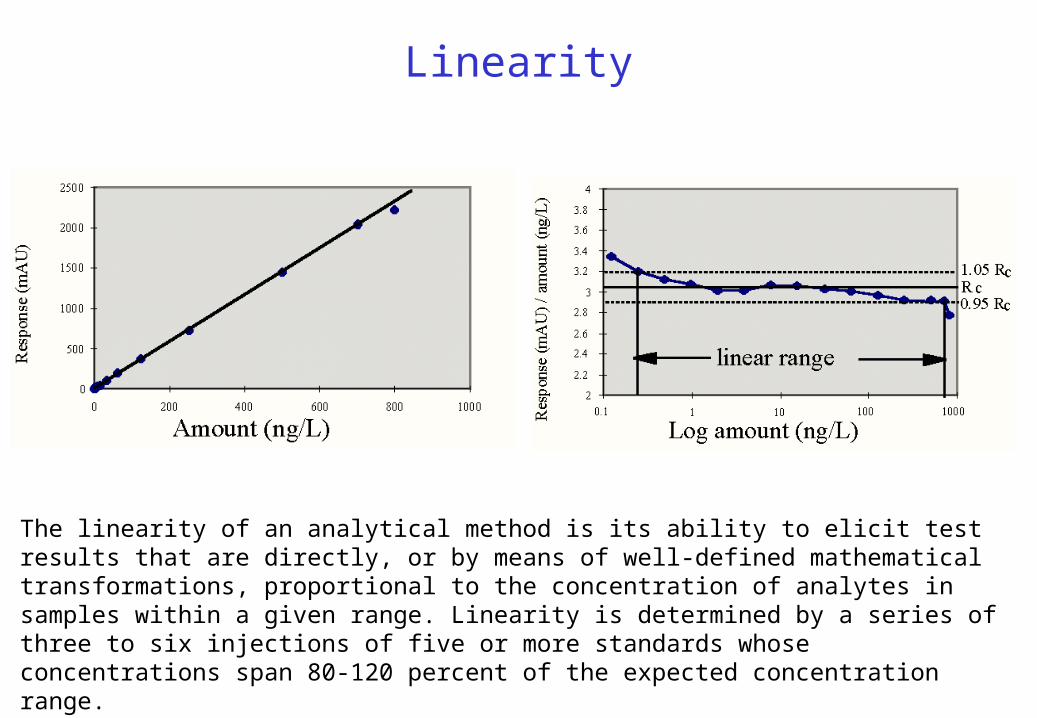
Linearity
The linearity of an analytical method is its ability to elicit test results that are directly, or by means of well-defined mathematical transformations, proportional to the concentration of analytes in samples within a given range. Linearity is determined by a series of three to six injections of five or more standards whose concentrations span 80-120 percent of the expected concentration range.
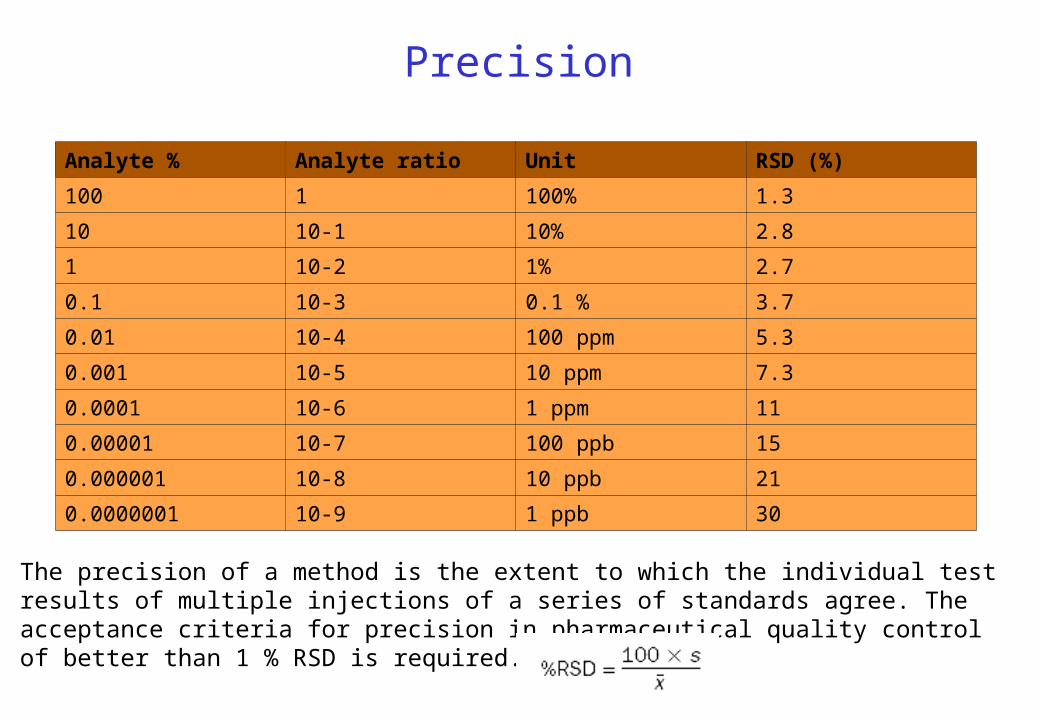
Analyte % Analyte ratio Unit RSD (%)
100 1 100% 1.3
10 10-1 10% 2.8
1 10-2 1% 2.7
0.1 10-3 0.1 % 3.7
0.01 10-4 100 ppm 5.3
0.001 10-5 10 ppm 7.3
0.0001 10-6 1 ppm 11
0.00001 10-7 100 ppb 15
0.000001 10-8 10 ppb 21
0.0000001 10-9 1 ppb 30
Precision
The precision of a method is the extent to which the individual test results of multiple injections of a series of standards agree. The acceptance criteria for precision in pharmaceutical quality control of better than 1 % RSD is required.
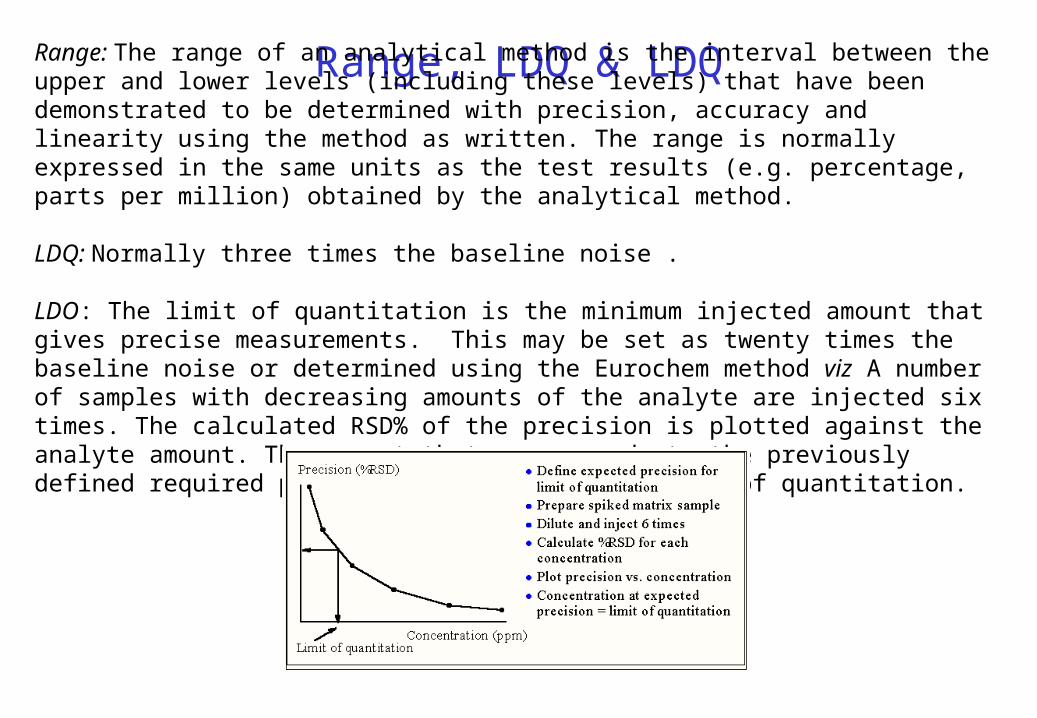
Range, LDQ & LDQRange: The range of an analytical method is the interval between the upper and lower levels (including these levels) that have been demonstrated to be determined with precision, accuracy and linearity using the method as written. The range is normally expressed in the same units as the test results (e.g. percentage, parts per million) obtained by the analytical method.
LDQ: Normally three times the baseline noise .
LDO: The limit of quantitation is the minimum injected amount that gives precise measurements. This may be set as twenty times the baseline noise or determined using the Eurochem method viz A number of samples with decreasing amounts of the analyte are injected six times. The calculated RSD% of the precision is plotted against the analyte amount. The amount that corresponds to the previously defined required precision is equal to the limit of quantitation.


Head Space Analysis
• Head space analysis is a technique where the vapours in the gas above, and in equilibrium with, a solid or liquid is sampled.
• The advantage of this approach is that GC can be used instead of HPLC, thus providing four to five orders of magnitude greater sensitivity.
• Procedure involves the extraction of a volume of the equilibrium gas over the sample (usually about 10 ml) by a syringe through either a vial containing a bed of an appropriate absorbent or a cryogenic trap.
• The vial/trap is the placed in line with a GC column, heated and the vaporised sample swept onto the column and the components separated.
• Used to identify spoiled food, fragrances from botanical material, the determination of plasticizers in plastics and for forensic samples involving arson.

Purge and Trap – EPA method 5030C
• 5030C can be used for most volatile organic compounds that boiling points below 200 ºC and are insoluble or slightly soluble in water.
• Multiple sample aliquots are collected in sealed containers with minimum headspace and stored at 4 ºC or less in solvent free area.
• An inert gas is bubbled through aqueous sample and room or elevated temperature depending on the target analytes.
• The vapour is swept through a sorbent column where the analytes are captured.
• After purging, the sorbent column is heated (thermal extraction) and back-flushed with inert gas to desorb the components onto a GC column.

Solid Phase Microextraction
• Solid phase microextraction (SPME) is suitable for sampling environmental contaminants with a wide range of physical properties in air, water and soil.
• A fused silica fibre with a polymer coating is exposed to the sample or the headspace above the sample.
• Organic analytes adsorb to the coating on the fibre. After adsorption equilibrium is attained, usually in 2 to 30 minutes, the fibre is withdrawn.
• The fibre is introduced into a GC injector, where the adsorbed analytes are thermally desorbed and delivered to the GC column.
• The amount of analyte adsorbed by the fibre depends on the thickness of the polymer coating and on the distribution constant for the analyte.
• Fibres with a range of different polarities are now commercially available.

Direct Thermal Extraction• Permits the direct thermal extraction of volatile and
semi-volatile organics directly from small sample sizes (mg) without the need for solvent extraction or other sample preparation requirements.
• The sample is maybe trapped on sorbent resisn or placed inside a preconditioned glass-lined stainless steel desorption tube.
• The desorption tube containing the sample is then connected to a short path thermal desorption system.
• The desorption tube is ballistically heated and carrier gas carries the analytes through the injection port and onto the GC column for analysis.
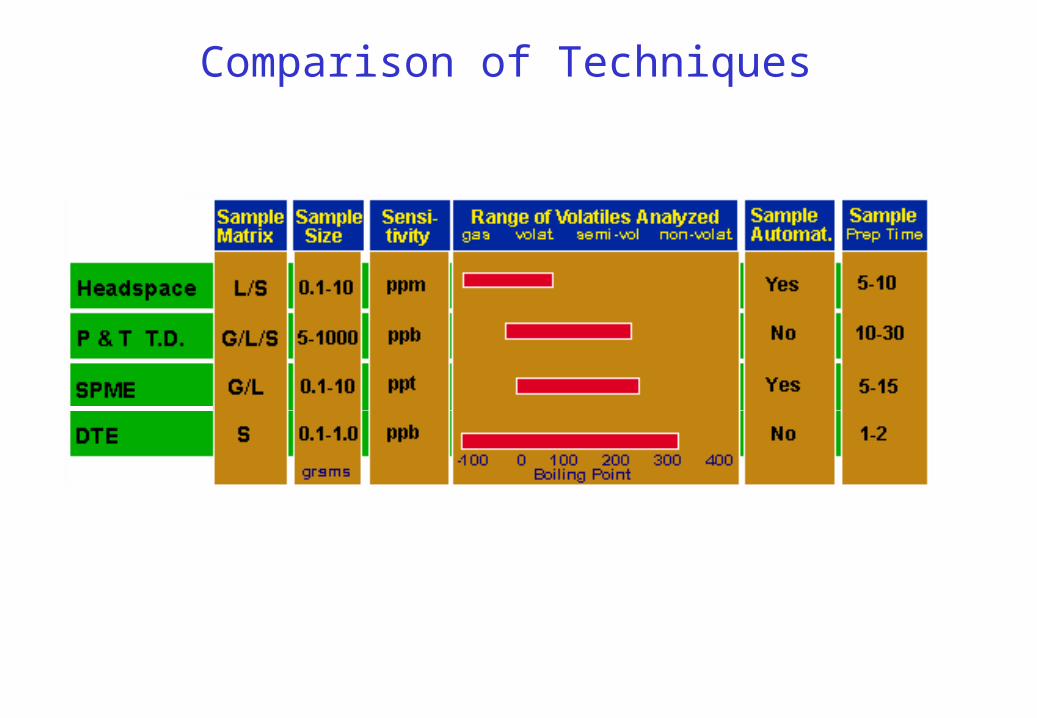
Comparison of Techniques
Gas Chromatography – Mass Spectrometry
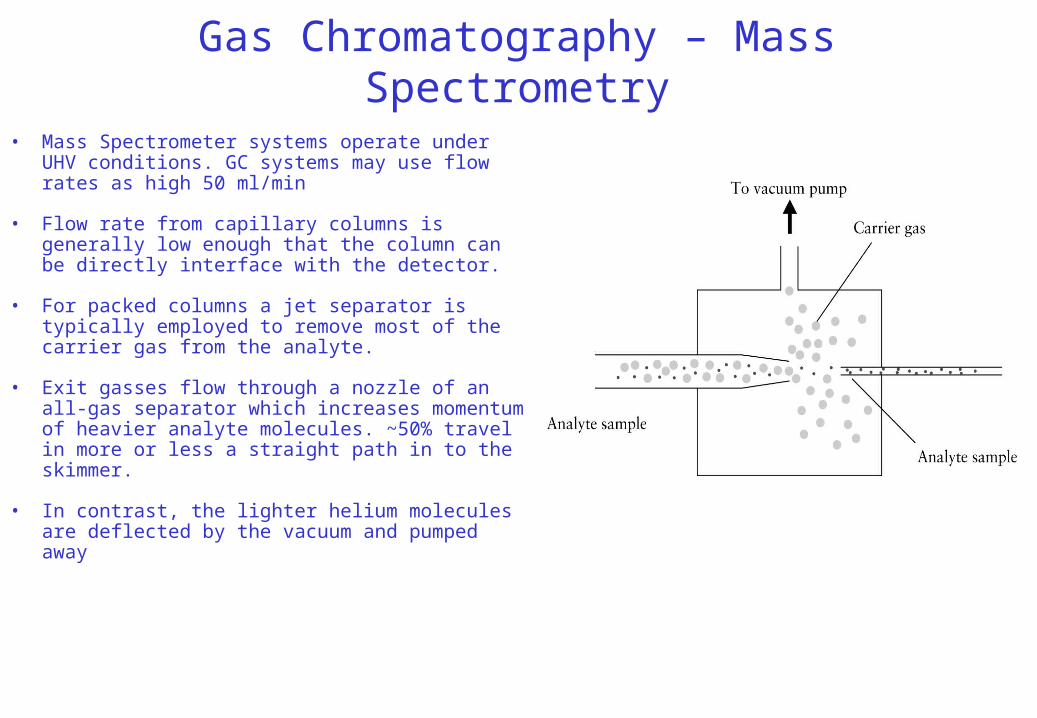
• Mass Spectrometer systems operate under UHV conditions. GC systems may use flow rates as high 50 ml/min
• Flow rate from capillary columns is generally low enough that the column can be directly interface with the detector.
• For packed columns a jet separator is typically employed to remove most of the carrier gas from the analyte.
• Exit gasses flow through a nozzle of an all-gas separator which increases momentum of heavier analyte molecules. ~50% travel in more or less a straight path in to the skimmer.
• In contrast, the lighter helium molecules are deflected by the vacuum and pumped away

Mass Spectrometry Operation
http://www.chem.agilent.com/scripts/generic.asp?lpage=5450&indcol=N&prodcol=N
GC Environmental Applications
• Local government regulate and monitor emissions from industrial chimney stacks.
• On-site audits are performed by local authorities to police and ensure emissions are within licensing limits.
• Samples of stack emissions are taken by pumping a know volume of gas through a desorption tube packed with an appropriate sorbent material.
• A second tube is placed in series with the first tube to trap any break through analytes.
• Thermal desorption-GC-MS analysis is performed on trapped sample to:
– Determine constituents (qualitative)– Determine concentrations (quantitative)
• Hand-held and portable GC-MS systems are now becoming more prevalent for in-the-field analysis.

GC Forensic Applications
• GC-MS employed in the identification of illicit (illegal) drugs.
• GC-MS analysis of biological specimens for the presence of alcohol, drugs, and/or poisons and their corresponding metabolites.
• Pyrolysis GC employed in paint analysis especially useful in hit-and-run cases, where the paint chips are directly analysed.
• Forensic arson analysis deals with the analysis of fire debris for the presence of accelerants. Identification of hydrocarbon constituents is performed by comparison to known standards by GC-MS.
• GC detection of explosives and residues by direct head space analysis.
• Determination of carbon monoxide in postmortem blood using GC.