cmos image sensor quarterly market monitor
TRANSCRIPT

From Technologies to Markets
© 2021
From Technologies to Markets
CMOS Image SensorQuarterly Market
Monitor
Imaging Service 2021
Sample

CMOS Image Sensor Quarterly Market Monitor | Sample | www.yole.fr | © 2021
METHODOLOGY
Yole’s methodology for building market forecasts is different from other marketresearch companies' methodologies:
o Our approach is to build a coherent model where the five-year historical data from top product shipments, modulesales, and bottom sensor production, with players’ market share is collectively linked with detailed assumptions
o Forecast are performed by carefully carrying forward the five-year growth rate with the analyst appreciation of eachapplication market dynamics in mind.
We collect data from several sources, including:
o Primary information from direct contacts and surveys with equipment & materials suppliers
o Primary information from cost analysis and teardown reports conducted by System Plus Consulting
o Secondary information from Quarterly/Annual report/publications of key players
o Comparisons between publicly-available secondary data from WSTS, OICA, IFR etc.
As a result, we can present synthetic market metrics intrinsic to a specific industry:
o Our approach’s main advantage is the delivery of homogeneous data, ranging from unit shipments and system salesto players’ market share
o We quarterly update the market information presented in this monitor
3
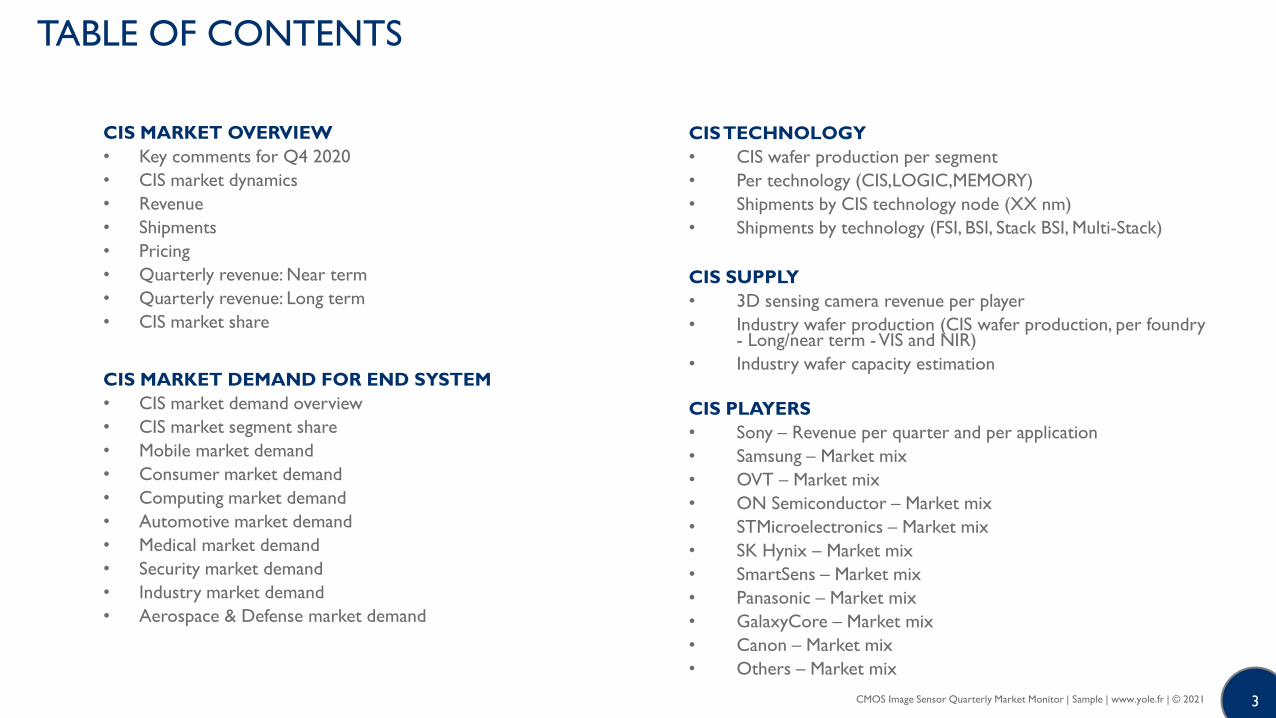
CIS MARKET OVERVIEW
• Key comments for Q4 2020
• CIS market dynamics
• Revenue
• Shipments
• Pricing
• Quarterly revenue: Near term
• Quarterly revenue: Long term
• CIS market share
CIS MARKET DEMAND FOR END SYSTEM
• CIS market demand overview
• CIS market segment share
• Mobile market demand
• Consumer market demand
• Computing market demand
• Automotive market demand
• Medical market demand
• Security market demand
• Industry market demand
• Aerospace & Defense market demand
CISTECHNOLOGY
• CIS wafer production per segment
• Per technology (CIS,LOGIC,MEMORY)
• Shipments by CIS technology node (XX nm)
• Shipments by technology (FSI, BSI, Stack BSI, Multi-Stack)
CIS SUPPLY
• 3D sensing camera revenue per player
• Industry wafer production (CIS wafer production, per foundry- Long/near term -VIS and NIR)
• Industry wafer capacity estimation
CIS PLAYERS
• Sony – Revenue per quarter and per application
• Samsung – Market mix
• OVT – Market mix
• ON Semiconductor – Market mix
• STMicroelectronics – Market mix
• SK Hynix – Market mix
• SmartSens – Market mix
• Panasonic – Market mix
• GalaxyCore – Market mix
• Canon – Market mix
• Others – Market mix
TABLE OF CONTENTS
CMOS Image Sensor Quarterly Market Monitor | Sample | www.yole.fr | © 2021

4
Pierre Cambou
Chenmeijing Liang
CMOS Image Sensor Quarterly Market Monitor | Sample | www.yole.fr | © 2021
Biographies & contacts
ABOUT THE AUTHORS
Pierre Cambou MSc, MBA, is a Principal analyst in the Photonic and Sensor Division at Yole Développement (Yole). Pierre’s mission is dedicated toimaging related activities by providing market & technology analyses along with strategy consulting services to semiconductor companies. He isresponsible for the CIS Quarterly Market Monitor while he has authored more than 15 Yole Market & Technology reports. Pierre has an Engineeringdegree from Université de Technologie de Compiègne (France) and a Master of Science from Virginia Tech. (VA, USA), Pierre also graduated with anMBA from Grenoble Ecole de Management (France).
Contact: [email protected]
Chenmeijing Liang works as a Technology & Market Analyst within the Photonics & Sensor division at Yole Développement (Yole). As part of theImaging team, Chenmeijing contributes daily to analyses of CIS markets, related technologies and market strategies of the leading semiconductorcompanies, as well as the quarterly Monitor. Prior to Yole, she was engaged in the development of R&D projects: Chenmeijing was a member of GroupPSA R&D department where she worked on Vehicle 3D Holography Imaging projects. In addition, she assisted with various technical and commercialprojects. Chenmeijing Liang holds a Master’s Degree in the field of Applied physics and Optical engineering from Paris-Saclay University and UniversityPierre and Marie Curie UPMC (Paris, France).
Contact: [email protected]

QUARTERLY MARKET MONITOR SAMPLE –CMOS IMAGE SENSOR SERVICE
CMOS Image Sensor Quarterly Market Monitor | Sample | www.yole.fr | © 2021
66
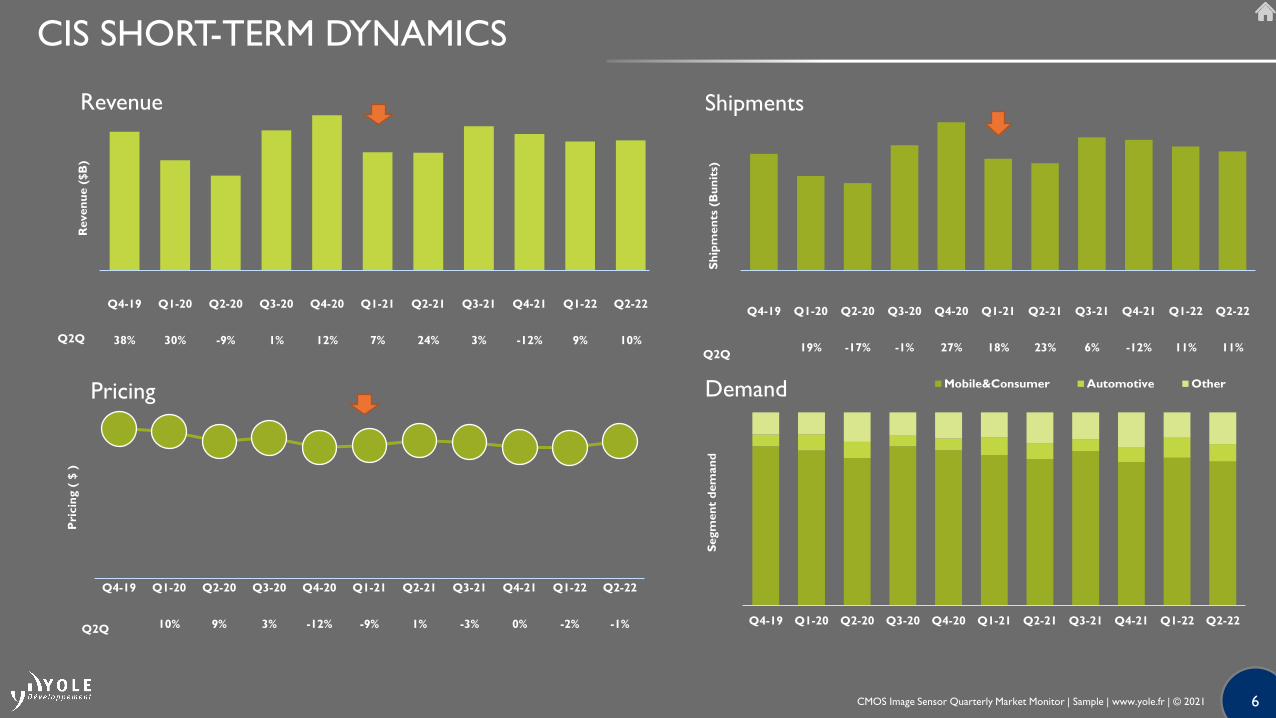
Q4-19 Q1-20 Q2-20 Q3-20 Q4-20 Q1-21 Q2-21 Q3-21 Q4-21 Q1-22 Q2-22
Pricing $3,20 $3,15 $2,94 $3,01 $2,81 $2,85 $2,96 $2,92 $2,81 $2,80 $2,94
10% 9% 3% -12% -9% 1% -3% 0% -2% -1%
Pri
cin
g (
$ )
Q4-19 Q1-20 Q2-20 Q3-20 Q4-20 Q1-21 Q2-21 Q3-21 Q4-21 Q1-22 Q2-22
Revenue $5,7 $4,6 $3,9 $5,8 $6,4 $4,9 $4,9 $6,0 $5,7 $5,3 $5,4
38% 30% -9% 1% 12% 7% 24% 3% -12% 9% 10%
Reven
ue (
$B
)
Q4-19 Q1-20 Q2-20 Q3-20 Q4-20 Q1-21 Q2-21 Q3-21 Q4-21 Q1-22 Q2-22
Shipment 1,8 1,5 1,3 1,9 2,3 1,7 1,7 2,0 2,0 1,9 1,8
19% -17% -1% 27% 18% 23% 6% -12% 11% 11%
Sh
ipm
en
ts(B
un
its)
Q4-19 Q1-20 Q2-20 Q3-20 Q4-20 Q1-21 Q2-21 Q3-21 Q4-21 Q1-22 Q2-22
Segm
en
t d
em
an
d
Mobile&Consumer Automotive Other
CMOS Image Sensor Quarterly Market Monitor | Sample | www.yole.fr | © 2021
CIS SHORT-TERM DYNAMICS
Revenue Shipments
Pricing Demand
Q2Q
Q2Q
Q2Q

77
2016 2017 2018 2019 2020 2021e 2022e 2023e 2024e 2025e 2026e
Pricing $2,37 $2,65 $2,72 $2,93 $2,96 $2,88 $2,83 $2,80 $2,83 $2,84 $2,86
YoY 8% 12% 3% 8% 1% -3% -2% -1% 1% 0% 1%
Pri
cin
g (
$)
2016 2017 2018 2019 2020 2021e 2022e 2023e 2024e 2025e 2026e
Revenue $11,6 $13,9 $15,5 $19,3 $20,7 $21,4 $23,3 $24,9 $26,2 $27,2 $28,4
YoY 13% 20% 11% 25% 7% 3% 9% 7% 5% 4% 4%
Reven
ue (
$B
)
2016 2017 2018 2019 2020 2021e 2022e 2023e 2024e 2025e 2026e
Shipment 4,9 5,2 5,7 6,6 7,0 7,4 8,2 8,9 9,3 9,6 9,9
YoY 5% 7% 8% 16% 6% 6% 11% 8% 4% 3% 4%
Sh
ipm
en
t(B
un
its)
2016 2017 2018 2019 2020 2021e 2022e 2023e 2024e 2025e 2026e
Segm
en
t d
em
an
d
Mobile&Consumer Automotive Other
CMOS Image Sensor Quarterly Market Monitor | Sample | www.yole.fr | © 2021
CIS LONG-TERM DYNAMICS
Revenue Shipments
Pricing Demand

-50%
-40%
-30%
-20%
-10%
0%
10%
20%
30%
40%
50%
$0
$5 000
$10 000
$15 000
$20 000
$25 000
$30 000
$35 000
Q4-19 Q1-20 Q2-20 Q3-20 Q4-20 Q1-21 Q2-21 Q3-21 Q4-21 Q1-22 Q2-22 2016 2017 2018 2019 2020 2021e 2022e 2023e 2024e 2025e 2027e
YO
Y G
row
th(%
)
Reve
nue (
$M
)
Sony Samsung OVT On Semi STM Panasonic Canon SK Hynix Others YoY Growth Q2Q Growth
CIS MARKET DYNAMICS
Quarterly and Yearly revenue CIS – Global and By players (in $M)
CMOS Image Sensor Quarterly Market Monitor | Sample | www.yole.fr | © 2021
• Q1-2020 to Q1-2021 showed 7% Q2Q growth. Still gradually recovering after the pandemic.
• Seasonal patterns will govern Q2Q growth in 2021 with an expected 3% YoY.

9@2021 | www.yole.fr | CIS Market Monitor | Q2-2021
-20%
0%
20%
40%
60%
80%
100%
120%
$0
$5 000
$10 000
$15 000
$20 000
$25 000
$30 000
2016 2017 2018 2019 2020 2021e 2022e 2023e 2024e 2025e 2026e
YoY
gro
wth
(%
)
Reve
nue (
$M
)
Revenue annual confirmed ($M) YOY
CIS ANNUAL REVENUE: LONG TERM
• Upper single-digit growth should resume for the CIS industry in 2022.
• CAGR2020-2026 is 5.4% currently, with new applications. We will continue to analyze the
situation.
Yearly CIS industry revenue and future growth (in $M and %)

10@2021 | www.yole.fr | CIS Market Monitor | Q2-2021
0
100
200
300
400
500
600
700
800
900
Waf
er
pro
duct
ion (
kw
pm
12''
eq.)
DRAM 32nm LOGIC 65-32nm CIS 65-45nm CIS 90nm CIS 110-140nm CIS 150-180nm LOGIC Total CIS Total
WAFER SHIPMENTS BY TECHNOLOGY
Quarterly CIS & logic and memory wafer production per technology node in kwpm and yearly average

Q1-15 Q2-15 Q3-15 Q4-15 Q1-16 Q2-16 Q3-16 Q4-16 Q1-17 Q2-17 Q3-17 Q4-17 Q1-18 Q2-18 Q3-18 Q4-18 Q1-19 Q2-19 Q3-19 Q4-19 Q1-20 Q2-20 Q3-20 Q4-20 Q1-21
QoQ -1% 10% 11% -13% -14% 11% 53% 21% -24% 1% 19% 11% -34% 30% 25% -11% -7% 16% 44% -6% -24% -12% 59% -14% -14%
Q2Q 60% 84% 40% 5% -9% -8% 28% 77% 58% 43% 11% 2% -12% 13% 19% -5% 34% 20% 39% 47% 19% -10% -1% -10% 2%
Revenue CIS Sony ($M) 905 992 1 101 963 825 915 1 403 1 704 1 300 1 306 1 554
Defense & Aerospace 1 8 6 6 -6 5 1 7 8 10 10 13 0 0
Industrial 2 2 2 2 31 40 34 22 20 21 19 54 56 60
Security 93 65 56 60 42 56 70 86 100 74 120 9 13 13
Medical 11 10 9 8 6 10 9 12 25 17 20 13 11 11
Automotive 31 41 18 19 18 40 31 31 21 28 23 53 53 52
Computing 167 156 135 122 83 119 99 170 145 128 150 183 139 150
Consumer 121 67 65 65 53 53 60 100 93 46 41 77 69 57
Mobile 1 306 793 1 190 1 563 1 417 1 203 1 468 2 128 1 996 1 501 1 213 2 128 1 830 1 517
$0
$500
$1 000
$1 500
$2 000
$2 500
$3 000
Reve
nue (
$M
)
Mobile Consumer Computing Automotive Medical Security Industrial Defense & Aerospace Q2Q QoQ
SONY – MARKET MIX
Sony CIS revenue per end-market – (in $MUSD)
CMOS Image Sensor Quarterly Market Monitor | Sample | www.yole.fr | © 2021

12
Contact our
Sales Team
for more
information
12
Contact our
Sales Team
for more
information
CMOS Camera Module Industryfor Consumer & Automotive 2020
3D Imaging & Sensing 2020Status of CMOS Image Sensor Industry 2020
Machine Vision for Industry and Automation 2021
CMOS Image Sensor Quarterly Market Monitor | Sample | www.yole.fr | © 2021
YOLE GROUP OF COMPANIES RELATED ANALYSES
Yole Développement

13
Contact our
Sales Team
for more
information
13
Contact our
Sales Team
for more
informationSmartphone Camera Module
Comparison 2020 Vol 2: Focus on Samsung
Smartphone Camera Module Comparison 2020 Vol 3: Focus on
Huawei
CMOS Image Sensor Quarterly Market Monitor | Sample | www.yole.fr | © 2021
YOLE GROUP OF COMPANIES RELATED ANALYSES
System Plus Consulting
Camera Module Comparison 2021 Vol. 2 –Apple iPhone Evolution
Camera Module Comparison2021 –Vol. 1

14CMOS Image Sensor Quarterly Market Monitor | Sample | www.yole.fr | © 2021
CONTACTS
FINANCIAL SERVICES
› Jean-Christophe Eloy - [email protected]
+33 4 72 83 01 80
› Ivan Donaldson - [email protected]
+1 208 850 3914
CUSTOM PROJECT SERVICES
› Jérome Azémar, Yole Développement -
[email protected] - +33 6 27 68 69 33
› Julie Coulon, System Plus Consulting -
[email protected] - +33 2 72 17 89 85
GENERAL
› Jean-Christophe Eloy, Marketing & Communication
[email protected] - +33 472 83 01 01
› Sandrine Leroy, Public Relations
[email protected] - +33 4 72 83 01 89
› General inquiries: [email protected] - +33 4 72 83 01 80
Western US & Canada
Steve Laferriere - [email protected]
+ 1 310 600 8267
Eastern US & Canada
Chris Youman - [email protected]
+1 919 607 9839
Europe and RoW
Lizzie Levenez - [email protected]
+49 15 123 544 182
Benelux, UK & Spain
Marine Wybranietz - [email protected]
+49 69 96 21 76 78
India and RoA
Takashi Onozawa - [email protected]
+81 80 4371 4887
Greater China
Mavis Wang - [email protected]
+886 979 336 809 +86 136 6156 6824
Korea
Peter Ok - [email protected]
+82 10 4089 0233
Japan
Miho Ohtake - [email protected]
+81 34 4059 204
Japan and Singapore
Itsuyo Oshiba - [email protected]
+81 80 3577 3042
Japan
Toru Hosaka – [email protected]
+81 90 1775 3866
Follow us on
REPORTS, MONITORS & TRACKS