cms performance and strategy evaluation report amats
TRANSCRIPT

8/9/2019 CMS Performance and Strategy Evaluation Report AMATS
http://slidepdf.com/reader/full/cms-performance-and-strategy-evaluation-report-amats 1/115

8/9/2019 CMS Performance and Strategy Evaluation Report AMATS
http://slidepdf.com/reader/full/cms-performance-and-strategy-evaluation-report-amats 2/115
ACRONYMS USED IN THE CONGESTION MANAGEMENTSYSTEM REPORT
AMATS Akron Metropolitan Area Transportation Study
CAC MIS Canton-Akron-Cleveland Interregional Travel Corridor Major Investment Study
CMS Congestion Management SystemCSI Congestion Severity Index
HCM2000 Highway Capacity Manual 2000HOV High Occupancy Vehicle
I-76 MIS I-76 Major Investment StudyISTEA Intermodal Surface Transportation Efficiency Act of 1991ITS Intelligent Transportation Systems
LOS Level of Service
MIS Major Investment StudyMPH Miles per Hour
ODOT Ohio Department of Transportation
pcpmpl Passenger cars, per mile, per lane
TEA-21 Transportation Equity Act for the 21st Century (1998) TIP Transportation Improvement ProgramTMA Transportation Management Area
V/C ratio Volume to Capacity ratioVHT Vehicle Hours Traveled
VMT Vehicle Miles Traveled

8/9/2019 CMS Performance and Strategy Evaluation Report AMATS
http://slidepdf.com/reader/full/cms-performance-and-strategy-evaluation-report-amats 3/115
CONGESTION MANAGEMENT SYSTEM
PERFORMANCE AND STRATEGY EVALUATION REPORT
AKRON METROPOLITAN AREA TRANSPORTATION STUDY806 CITICENTER BUILDING146 SOUTH HIGH STREET
AKRON, OHIO 44308
December 2004
This report is the product of a study financed (in part) by the U.S. Department of Transportation and theOhio Department of Transportation.
The contents of this report reflect the views of the Akron Metropolitan Area Transportation Study, which isresponsible for the facts and the accuracy of the data presented herein. The contents do not necessarilyreflect the official views or policy of the U.S. Department of Transportation. This report does notconstitute a standard, specification, or regulation.
Cooperative transportation planning by the Village, City, and County governments of Portage and SummitCounties and the Chippewa Township area of Wayne County; in conjunction with the U.S. Department of Transportation and the Ohio Department of Transportation.

8/9/2019 CMS Performance and Strategy Evaluation Report AMATS
http://slidepdf.com/reader/full/cms-performance-and-strategy-evaluation-report-amats 4/115
2

8/9/2019 CMS Performance and Strategy Evaluation Report AMATS
http://slidepdf.com/reader/full/cms-performance-and-strategy-evaluation-report-amats 5/115
3
TABLE OF CONTENTS
List of Maps............................................................................................................... 5
List of Tables............................................................................................................. 7
Introduction ............................................................................................................... 9
Chapter 1: Congestion Management System Procedures ....................................... 11
Chapter 2: Existing Traffic Congestion..................................................................... 17
Chapter 3: Future Traffic Congestion ....................................................................... 31
Chapter 4: Incident-Related Traffic Congestion ....................................................... 45
Chapter 5: Identifying CMS Alternatives .................................................................. 55
Chapter 6: Evaluation of CMS Alternatives .............................................................. 79
Chapter 7: CMS Recommendations......................................................................... 93

8/9/2019 CMS Performance and Strategy Evaluation Report AMATS
http://slidepdf.com/reader/full/cms-performance-and-strategy-evaluation-report-amats 6/115
4
8/9/2019 CMS Performance and Strategy Evaluation Report AMATS
http://slidepdf.com/reader/full/cms-performance-and-strategy-evaluation-report-amats 7/115

8/9/2019 CMS Performance and Strategy Evaluation Report AMATS
http://slidepdf.com/reader/full/cms-performance-and-strategy-evaluation-report-amats 8/115
6

8/9/2019 CMS Performance and Strategy Evaluation Report AMATS
http://slidepdf.com/reader/full/cms-performance-and-strategy-evaluation-report-amats 9/115
7
LIST OF TABLES
Table 2-1: 2003 Freeway Level of Service Analysis ................................................ 22
Table 2-2: 2003 Arterial Level of Service Analysis .................................................. 25Table 2-3: 2003 Intersection Capacity Analysis....................................................... 28Table 2-4: 2003 Existing Level of Service (24-Hour Period).................................... 29Table 2-5: 2003 Existing Level of Service (Peak Hour 4-5 P.M.)............................. 29Table 3-1: 2030 Freeway Level of Service Analysis ................................................ 36Table 3-2: 2030 Arterial Level of Service Analysis .................................................. 40Table 3-3: 2030 Future Level of Service (24-Hour Period) ...................................... 44Table 3-4: 2030 Future Level of Service (Peak Hour 4-5 P.M.) ............................... 44Table 3-5: CMS Performance Measures ................................................................. 44Table 3-6: Vehicle Miles of Travel (VMT) - (24-Hour Period)................................... 44Table 4-1: Incident-Related Freeway Congestion (2000-2002) ............................... 48
Table 4-2: Incident-Related Arterial Congestion (1999-2001).................................. 50Table 4-3: Incident-Related Intersection Congestion (1999-2001) .......................... 52Table 5-1: Evaluation of Congestion Management System Strategies.................... 61Table 5-2: Congestion Management System Alternatives for Freeways ................. 65Table 5-3: Congestion Management System Alternatives for Arterials.................... 69Table 5-4: Congestion Management System Alternatives for Intersections ............ 77Table 6-1: CMS Alternative Evaluation for Freeways .............................................. 83Table 6-2: CMS Alternative Evaluation for Arterials................................................. 84Table 6-3: CMS Alternative Evaluation for Intersections ......................................... 92Table 7-1: Freeway Recommendations................................................................... 93Table 7-2: Arterial Recommendations ..................................................................... 95Table 7-3: Intersection Recommendations .............................................................. 100Table 7-4: 2030 Future LOS with Recommendations (24-Hour Period) .................. 111Table 7-5: 2030 Future LOS with Recommendations (Peak Hour 4-5 P.M.) ........... 111Table 7-6: Vehicle Miles of Travel (VMT) - (24-Hour Period)................................... 112Table 7-7: CMS Performance Measures ................................................................. 112

8/9/2019 CMS Performance and Strategy Evaluation Report AMATS
http://slidepdf.com/reader/full/cms-performance-and-strategy-evaluation-report-amats 10/115
8

8/9/2019 CMS Performance and Strategy Evaluation Report AMATS
http://slidepdf.com/reader/full/cms-performance-and-strategy-evaluation-report-amats 11/115

8/9/2019 CMS Performance and Strategy Evaluation Report AMATS
http://slidepdf.com/reader/full/cms-performance-and-strategy-evaluation-report-amats 12/115
10

8/9/2019 CMS Performance and Strategy Evaluation Report AMATS
http://slidepdf.com/reader/full/cms-performance-and-strategy-evaluation-report-amats 13/115
11
CHAPTER 1
CONGESTION MANAGEMENT SYSTEM PROCEDURES
A management system is a systematic process designed to assist decision-makers in
selecting cost-effective strategies to protect the investment in the nation's transportationinfrastructure, and to improve its efficiency and safety. A management system includes:
1) Identification of performance measures2) Data collection and analysis3) Determination of needs4) Evaluation and selection of appropriate strategies to address the needs5) Evaluation of the effectiveness of the implemented strategies
The AMATS CMS is comprised of 476 miles of roadways and 38 intersections.Roadways included in the CMS are shown on Map 1-1 (on page 14). Intersections
included in the CMS are shown on Map 1-2 (on page 15). These roadways andintersections are the locations where congestion measuring and monitoring activitiesare concentrated and where congestion management techniques will be implemented.Specifically, the CMS includes:
1) All roadways included on the National Highway System;2) All roadways classified as Principal Arterials in the Federal Functional
Classification System;3) Major intersections that experience high traffic volumes;4) All roadways programmed for federal funds in the current Transportation
Improvement Program (TIP) that result in the addition of general purposetravel lanes;
5) All roadways recommended in the AMATS 2025 Regional TransportationPlan for the addition of general purpose travel lanes;
6) All roadways and intersections identified as operating at Level of Service "D","E", or "F" in AMATS congestion studies of existing or future conditions;
7) All roadways identified as potential congestion problems by the AMATSPolicy Committee;
8) Other roadways to ensure a continuous CMS highway system.
Including roadways from AMATS congestion studies or as identified by the AMATSPolicy Committee provides a dynamic CMS, which allows new roadways to enter themonitoring system as conditions warrant.
A number of performance measures are considered in the CMS process. They include:
1) Level of service2) Volume-to-capacity (V/C) ratio3) Operational Status4) Average travel speed
8/9/2019 CMS Performance and Strategy Evaluation Report AMATS
http://slidepdf.com/reader/full/cms-performance-and-strategy-evaluation-report-amats 14/115
12
5) Vehicle hours traveled6) Vehicle miles traveled7) Vehicle delay in hours8) Person delay in hours9) Congestion Severity Index
The AMATS Congestion Management System (CMS) focuses on traffic congestion thatis identified both at specific locations and at the system level by evaluating an existingbase year (2003) roadway network and an existing-plus-committed future year (2030)roadway network.
Existing traffic congestion is identified using various methods to analyze existing trafficvolumes and roadway characteristics, including:
1) The Highway Capacity Manual 2000 2) The ODOT Capacity Calculator
3) The AMATS urban transportation planning models4) ODOT’s post-processing routine, CMAQT5) Manual calculations6) Field observations
Existing traffic congestion on freeways, arterials, and intersections has been analyzed inthe AMATS 2003 Existing Highway Congestion Study that was completed in May 2003.The results of this study are summarized in Chapter 2 of this report.
Future traffic congestion is identified by assigning a future year (2030) trip table to anexisting-plus-committed (2003) network, in order to forecast future traffic volumes.These traffic volumes are then analyzed using the methods mentioned above. Futuretraffic congestion on freeways and arterials has been analyzed in the AMATS 2030Future Highway Congestion Study that was completed in July 2004. The results of thisstudy are summarized in Chapter 3 of this report.
Comparisons are also made between a base case of congestion (2003) and a futureestimate of congestion (2030). The performance measures described above are usedin this report as indicators to evaluate the performance of the highway system now andin the future. CMS Software (CMAQT), developed by the ODOT Office of TechnicalServices, is used to conduct this analysis.
A variety of strategies for reducing traffic congestion have been considered andevaluated in this report: 1) Transportation Demand Management; 2) PublicTransportation Improvements; 3) Intelligent Transportation Systems (ITS); 4) TrafficOperational Improvements; and 5) Additional System Capacity.
Evaluation of the feasibility and cost-effectiveness of each of these strategies isquantitative where possible and qualitative where necessary. Quantitative evaluationsfocus on adjusting the AMATS transportation planning models to incorporate these

8/9/2019 CMS Performance and Strategy Evaluation Report AMATS
http://slidepdf.com/reader/full/cms-performance-and-strategy-evaluation-report-amats 15/115
13
strategies. Off-line models, estimates, analyses of current and expected trends, andother qualitative techniques are used where existing models are inadequate.
In summary, the AMATS Congestion Management System Performance and Strategy Evaluation Report has been prepared to: 1) evaluate the overall performance of the
transportation system by identifying areas of existing and future traffic congestion; 2)identify congestion management alternatives; 3) evaluate congestion managementalternatives; and 4) recommend transportation improvements for managing trafficcongestion. The methodology and the procedures followed in this report are consistentwith the federal planning regulations governing management systems in 23 CFR450.320.

8/9/2019 CMS Performance and Strategy Evaluation Report AMATS
http://slidepdf.com/reader/full/cms-performance-and-strategy-evaluation-report-amats 16/115
SUGAR BUS H\KNOLLS
BRADY\LAKE
NORTHFIELD
DOYLESTOWN
MOGADORE
REMINDERVILLE
SILVER\LAKE
HIRAM
GARRETTSVILLE
NEW\FRANKL IN
LAKEMORE
MANTUA
MUNROE FALLS
WINDHAM
BOSTON\ HEIGHTS
PENINSULA
CLINTON
FAIRLAWN
RAVENNA
BARBERTON
RICHFIELD
MACEDONIA
TALLMADGE
TWINSBURG
CUYAHOGA FALLS
STREETSBORO
NORTON
STOW
AURORA
HUDSON
GREEN
AKRON
KENT
21
44
93
91
94
57
77
76
8
5
8
8
5
14
91
82
59
18
43
44
21
94
21
14
44
43
59
44
14
43
8244 88
14
59
82
43
91
21
82
18
8844
305
77
80
80
76
77
77
80
76
76
76
176
764
585
532
162
261
619
303
241
306
225
604
619
183
241
183
303
261
225
261
282
303
236
303
700
277
271
480
271
480
224
422
224224
224
224
224
Map 1-1CONGESTION MANAGEMENT SYSTEM
FREEWAYS AND ARTERIALS
August 2004
0 1 2 3 4Miles
CMS Roadways
1 4

8/9/2019 CMS Performance and Strategy Evaluation Report AMATS
http://slidepdf.com/reader/full/cms-performance-and-strategy-evaluation-report-amats 17/115
SUGAR BUS H\KNOLLS
BRADY\LAKE
NORTHFIELD
DOYLESTOWN
MOGADORE
REMINDERVILLE
SILVER\LAKE
HIRAM
GARRETTSVILLE
NEW\FRANKL IN
LAKEMORE
MANTUA
MUNROE FALLS
WINDHAM
BOSTON\ HEIGHTS
PENINSULA
CLINTON
FAIRLAWN
RAVENNA
BARBERTON
RICHFIELD
MACEDONIA
TALLMADGE
TWINSBURG
CUYAHOGA FALLS
KENT
STREETSBORO
NORTON
STOW
AURORA
HUDSON
GREEN
AKRON
8
5
8
8
5
14
91
21
82
44
59
18
43
44
21
94
21
14
44
43
59
93
91
94
44
14
43
8244
88
14
59
82
43
91
21
57
82
18
8844
305
77
77
80
80
76
76
77
77
80
76
76
76
176
764
585
532
162
261
619
303
241
306
225
604
619
183
241
183
303
261
225
261
282
303
236
303
700
277
271
480
271
480
224
422
224224
224
224
224
Map 1-2CONGESTION MANAGEMENT SYSTEM
INTERSECTIONS
August 2004
0 1 2 3 4Miles
CMS Intersection
1 5

8/9/2019 CMS Performance and Strategy Evaluation Report AMATS
http://slidepdf.com/reader/full/cms-performance-and-strategy-evaluation-report-amats 18/115
16

8/9/2019 CMS Performance and Strategy Evaluation Report AMATS
http://slidepdf.com/reader/full/cms-performance-and-strategy-evaluation-report-amats 19/115
17
CHAPTER 2
EXISTING TRAFFIC CONGESTION
In order to effectively plan for transportation improvements, it is necessary tounderstand the existing performance of the transportation system. In this chapter,existing traffic congestion is identified based on the 2003 Existing Highway CongestionStudy, which was approved by AMATS in May 2003.
The purpose of this chapter is to quantify the level of existing traffic congestion on thefreeways, arterials, and intersections that comprise the AMATS CongestionManagement System (CMS). Summary statistics regarding the overall level of congestion on the existing highway system have also been developed and will be usedin later chapters to evaluate the performance of the transportation system over time.
Freeway Level of Service Analysis
This analysis determines the extent to which there is sufficient capacity on the freewaysystem to accommodate existing peak-hour travel volumes at a reasonable level of service (LOS). Standard analytical techniques described in the Highway CapacityManual 2000 (HCM2000) were utilized to determine the level of service of each freewaysegment included in the CMS during the peak hour of travel.
The LOS of a freeway segment is determined based on the volume of traffic and thecapacity of the roadway, by direction of travel. The volume of traffic on each freewaysegment was determined using the most recent traffic count data available to AMATS.The capacity of each freeway segment was calculated using HCM2000 procedures,which examine roadway characteristics such as the number of lanes, interchangespacing, percent grade, length of grade, lateral clearance, free flow speed, and percenttrucks.
Both volume and capacity are used to calculate the density of traffic on each freewaysegment. Density is the parameter used in the HCM2000 to determine the LOS of afreeway segment. It is measured in terms of the number of passenger cars, per mile,per lane (pcpmpl). The density corresponding to each LOS is summarized below:
Level of Service Density
A 0 to 11.0
B 11.1 to 18.0C 18.1 to 26.0D 26.1 to 35.0E 35.1 to 45.0F 45.1 or greater
Freeway segments operating at a density greater than 26.0 (LOS “D”, “E”, or “F”) in thepeak hour were identified as congested. These segments are shown on Map 2-1 (on
8/9/2019 CMS Performance and Strategy Evaluation Report AMATS
http://slidepdf.com/reader/full/cms-performance-and-strategy-evaluation-report-amats 20/115
18
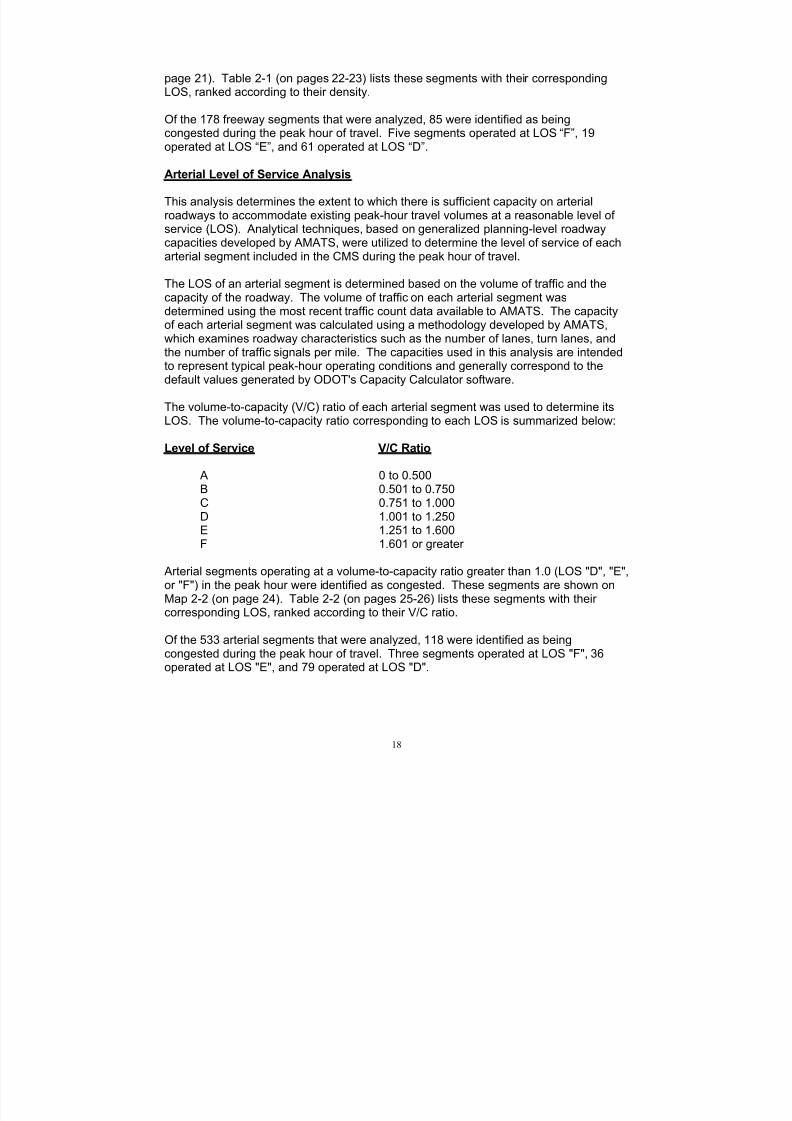
page 21). Table 2-1 (on pages 22-23) lists these segments with their correspondingLOS, ranked according to their density.
Of the 178 freeway segments that were analyzed, 85 were identified as beingcongested during the peak hour of travel. Five segments operated at LOS “F”, 19
operated at LOS “E”, and 61 operated at LOS “D”.
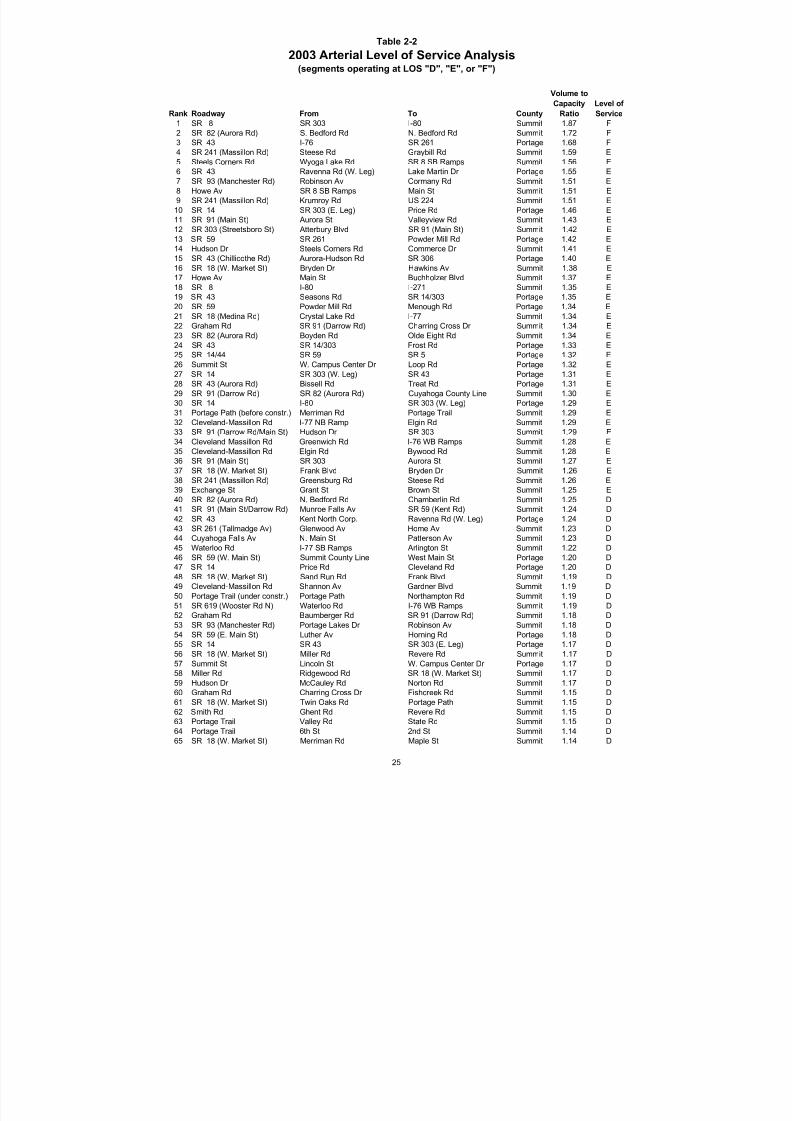
Arterial Level of Service Analysis
This analysis determines the extent to which there is sufficient capacity on arterialroadways to accommodate existing peak-hour travel volumes at a reasonable level of service (LOS). Analytical techniques, based on generalized planning-level roadwaycapacities developed by AMATS, were utilized to determine the level of service of eacharterial segment included in the CMS during the peak hour of travel.
The LOS of an arterial segment is determined based on the volume of traffic and the
capacity of the roadway. The volume of traffic on each arterial segment wasdetermined using the most recent traffic count data available to AMATS. The capacityof each arterial segment was calculated using a methodology developed by AMATS,which examines roadway characteristics such as the number of lanes, turn lanes, andthe number of traffic signals per mile. The capacities used in this analysis are intendedto represent typical peak-hour operating conditions and generally correspond to thedefault values generated by ODOT's Capacity Calculator software.
The volume-to-capacity (V/C) ratio of each arterial segment was used to determine itsLOS. The volume-to-capacity ratio corresponding to each LOS is summarized below:
Level of Service V/C Ratio
A 0 to 0.500B 0.501 to 0.750C 0.751 to 1.000D 1.001 to 1.250E 1.251 to 1.600F 1.601 or greater
Arterial segments operating at a volume-to-capacity ratio greater than 1.0 (LOS "D", "E",or "F") in the peak hour were identified as congested. These segments are shown onMap 2-2 (on page 24). Table 2-2 (on pages 25-26) lists these segments with their corresponding LOS, ranked according to their V/C ratio.
Of the 533 arterial segments that were analyzed, 118 were identified as beingcongested during the peak hour of travel. Three segments operated at LOS "F", 36operated at LOS "E", and 79 operated at LOS "D".

8/9/2019 CMS Performance and Strategy Evaluation Report AMATS
http://slidepdf.com/reader/full/cms-performance-and-strategy-evaluation-report-amats 21/115
19
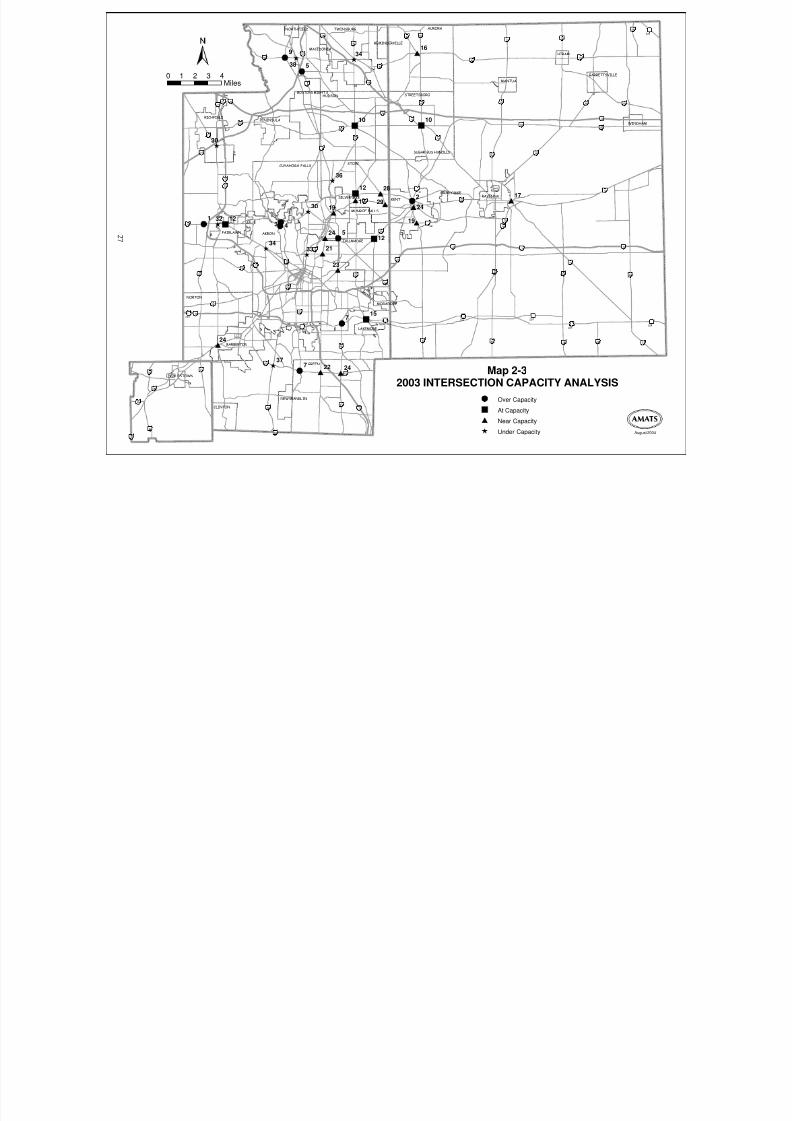
Intersection Capacity Analysis
This analysis determines the extent to which there is sufficient capacity at intersectionsto accommodate existing peak-hour traffic volumes. Standard analytical techniquesdescribed in the Highway Capacity Manual 2000 (HCM2000) were utilized to evaluate
the operational status of each intersection included in the CMS during the peak hour of travel.
The operational status of an intersection is determined based on the entering volume of traffic and the capacity of the intersection. The volume of traffic entering and turning ateach intersection was determined using the most recent traffic count data available toAMATS. The capacity of each intersection was calculated using the HCM2000 planningmethod, which examines and analyzes intersection characteristics such as laneconfiguration, intersection geometry, and a variety of information related to traffic signaltiming and operation.
The volume-to-capacity (V/C) ratio of each intersection was used to determine itsoperational status. The volume-to-capacity ratio corresponding to each operationalstatus category is summarized below:
Operational Status V/C Ratio
Under Capacity 0 to 0.85Near Capacity 0.86 to 0.95At Capacity 0.96 to 1.00Over Capacity 1.01 or greater
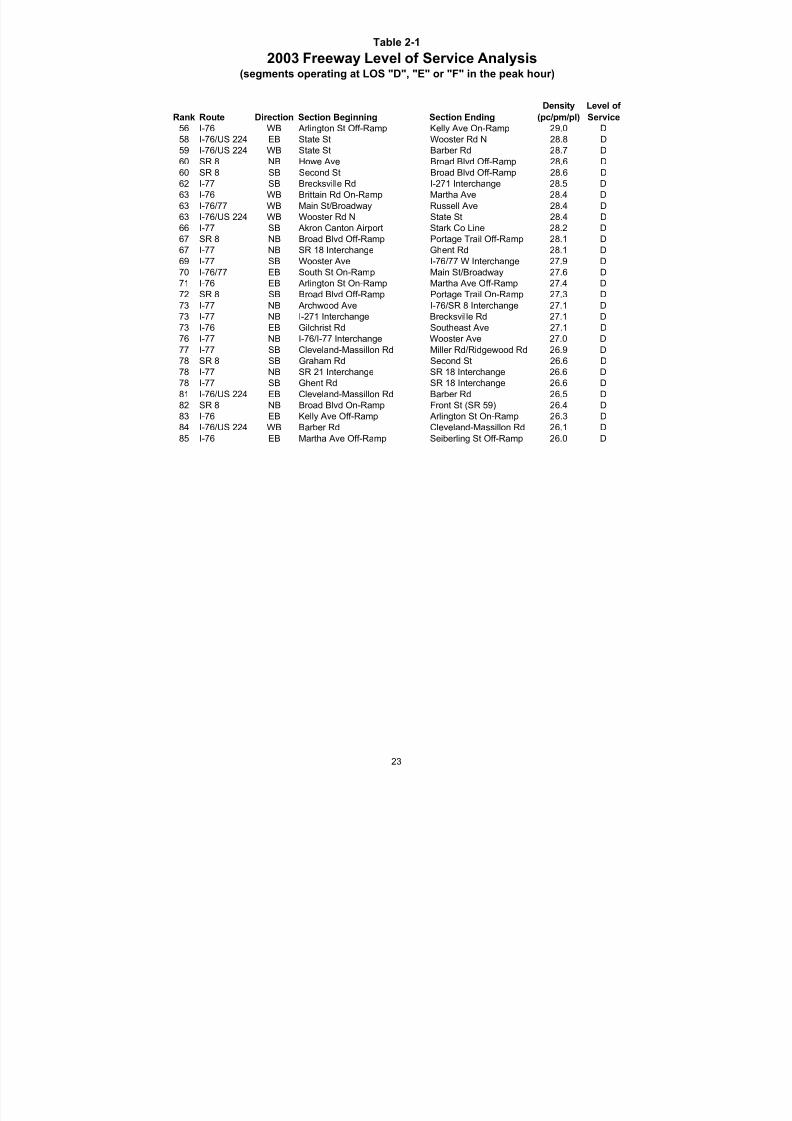
Intersections operating at a volume-to-capacity ratio greater than 0.85 (near, at, or over capacity) in the peak hour were identified as congested. These intersections are shownon Map 2-3 (on page 27). Table 2-3 (on page 28) lists these intersections and their corresponding operational status, ranked according to their V/C ratio.
Of the 38 intersections that were analyzed, 28 were identified as being congestedduring the peak hour of travel. Nine intersections operated “over capacity”, 6 operated“at capacity”, and 13 operated “near capacity”.
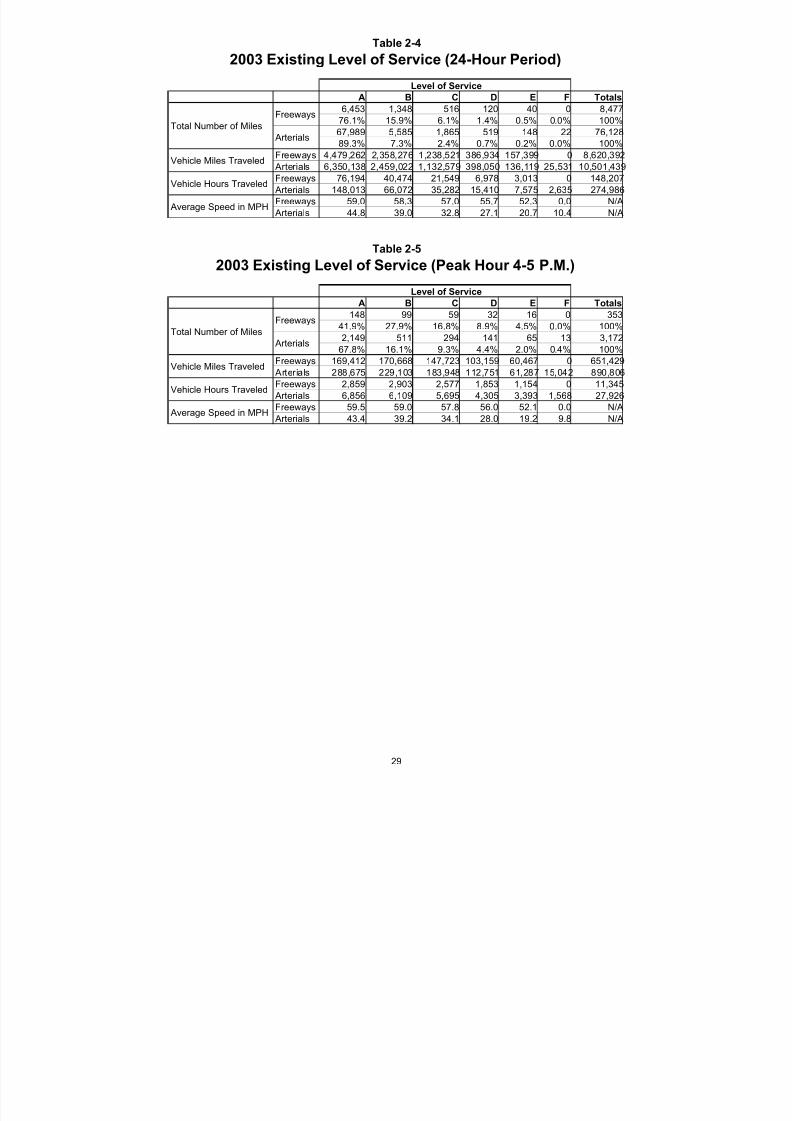
Existing System Statistics
System statistics were developed to establish the existing performance and currentlevel of congestion on the highway system in the AMATS area. AMATS urbantransportation planning models were used to estimate the total amount of travel on theexisting (2003) highway network. ODOT's post-processing routine, CMAQT, was thenused to analyze the model results and to generate various congestion statistics for freeways and arterials. These statistics include the total number of miles operating at

8/9/2019 CMS Performance and Strategy Evaluation Report AMATS
http://slidepdf.com/reader/full/cms-performance-and-strategy-evaluation-report-amats 22/115
20
each level of service, vehicle miles traveled (VMT), vehicle hours traveled (VHT), andaverage speed.
Table 2-4 (on page 29) summarizes this information for freeways and arterials during atypical 24-hour period in 2003. The table indicates that 1.9% of the freeway mileage
and 0.9% of the arterial mileage currently operates at LOS "D" or worse.
Table 2-5 (on page 29) summarizes this information for freeways and arterials duringthe peak hour (4:00-5:00 p.m.) of a typical day in 2003. The table indicates that 13.4%of the freeway mileage and 6.8% of the arterial mileage currently operates at LOS "D"or worse.

8/9/2019 CMS Performance and Strategy Evaluation Report AMATS
http://slidepdf.com/reader/full/cms-performance-and-strategy-evaluation-report-amats 23/115

8/9/2019 CMS Performance and Strategy Evaluation Report AMATS
http://slidepdf.com/reader/full/cms-performance-and-strategy-evaluation-report-amats 24/115
Table 2-1
2003 Freeway Level of Service Analysis(segments operating at LOS "D", "E" or "F" in the peak hour)
Rank Route Direction Section Beginning Section Ending
Density
(pc/pm/pl)
Level of
Service
1 SR 8 SB Glenwood Ave Perkins St - F
2 I-77 SB Archwood Ave Wilbeth Rd - F
3 I-77 SB Wilbeth Rd Waterloo Rd - F4 SR 8 SB Carroll St On-Ramp I-76/I-77 Interchange - F
5 SR 8 SB Perkins St Buchtel Ave - F
6 SR 8 NB Perkins St Glenwood Ave 42.7 E
7 SR 8 SB At Central Interchange 42.1 E
8 I-76 EB Kenmore Expressway-N.Inter. 41.6 E
9 I-76 WB Kenmore Expressway-N.Inter. 41.5 E
9 I-76 WB Kenmore Expressway-S.Inter. 41.5 E
11 SR 8 NB Buchtel Ave Perkins St 40.4 E
12 SR 8 SB Buchtel Ave Carroll St On-Ramp 39.6 E
13 I-77 SB Waterloo Rd US 224 Interchange 39.4 E
14 I-77 NB Wilbeth Rd Archwood Ave 38.8 E
15 I-76 EB At Central Interchange 38.3 E
16 SR 8 SB Tallmadge Ave Glenwood Ave 38.1 E
17 I-77 SB I-271 Interchange Wheatley Rd 37.7 E18 I-77 SB White Pond Dr Copley Rd 36.6 E
19 I-77 NB Waterloo Rd Wilbeth Rd 36.4 E
20 I-76 WB I-77 Interchange Battles Ave 35.4 E
20 SR 8 NB At Central Interchange 35.4 E
22 I-76 WB Kelly Ave On-Ramp Inman St Off-Ramp 35.2 E
23 I-77 NB Wheatley Rd I-271 Interchange 35.1 E
24 SR 8 SB Cuyahoga Falls Ave Tallmadge Ave 35.0 E
24 SR 8 NB Carroll St Buchtel Ave 35.0 D
26 I-77 NB Copley Rd White Pond Dr 34.7 D
27 I-77 SB Miller Rd/Ridgewood Rd White Pond Dr 34.5 D
28 I-77 SB I-76/SR 8 Interchange Archwood Ave 34.3 D
29 SR 8 NB Glenwood Ave Tallmadge Ave 33.9 D
30 I-77 SB At Central Interchange 33.7 D
31 I-76 WB Inman St Off-Ramp I-77 Interchange 33.6 D
32 I-77 SB Wheatley Rd Ghent Rd 33.1 D
33 I-77 NB White Pond Dr Miller Rd/Ridgewood Rd 32.8 D
34 I-76/US 224 EB Wooster Rd N I-277 Interchange 32.5 D
34 I-76 WB At Central Interchange 32.5 D
36 SR 8 SB Howe Ave Cuyahoga Falls Ave 32.4 D
36 I-76 WB Battles Ave I-277 Interchange 32.4 D
38 I-77 NB US 224 Interchange Waterloo Rd 32.1 D
39 I-77 NB Ghent Rd Wheatley Rd 32.0 D
40 I-76/77 EB East Ave South St Off-Ramp 31.8 D
41 I-76/US 224 WB I-277 Interchange Wooster Rd N 31.7 D
42 SR 8 SB Broad Blvd On-Ramp Howe Ave 31.6 D
43 I-76 EB I-277 Interchange Kenmore Blvd 31.4 D
44 I-76 EB Kenmore Blvd I-77 Interchange 31.3 D45 SR 8 NB Tallmadge Ave Cuyahoga Falls Ave 31.0 D
45 I-76/77 EB South St Off-Ramp Innerbelt (SR 59) 31.0 D
47 SR 8 NB Cuyahoga Falls Ave Howe Ave 30.3 D
48 SR 8 SB Portage Trail On-Ramp Broad Blvd On-Ramp 30.2 D
49 I-77 SB SR 241 Akron Canton Airport 30.1 D
50 I-77 NB At Central Interchange 29.9 D
51 I-76 WB Martha Ave Arlington St Off-Ramp 29.7 D
52 I-76 EB I-77 Interchange Kelly Ave Off-Ramp 29.5 D
53 I-76/US 224 EB Barber Rd State St 29.4 D
54 I-76/77 EB I-77 Interchange East Ave 29.2 D
54 I-271 NB SR 82 Cuyahoga Co Line 29.2 D
56 I-76/77 WB East Ave I-77 Interchange 29.0 D
22
8/9/2019 CMS Performance and Strategy Evaluation Report AMATS
http://slidepdf.com/reader/full/cms-performance-and-strategy-evaluation-report-amats 25/115
Table 2-1
2003 Freeway Level of Service Analysis(segments operating at LOS "D", "E" or "F" in the peak hour)
Rank Route Direction Section Beginning Section Ending
Density
(pc/pm/pl)
Level of
Service
56 I-76 WB Arlington St Off-Ramp Kelly Ave On-Ramp 29.0 D
58 I-76/US 224 EB State St Wooster Rd N 28.8 D
59 I-76/US 224 WB State St Barber Rd 28.7 D60 SR 8 NB Howe Ave Broad Blvd Off-Ramp 28.6 D
60 SR 8 SB Second St Broad Blvd Off-Ramp 28.6 D
62 I-77 SB Brecksville Rd I-271 Interchange 28.5 D
63 I-76 WB Brittain Rd On-Ramp Martha Ave 28.4 D
63 I-76/77 WB Main St/Broadway Russell Ave 28.4 D
63 I-76/US 224 WB Wooster Rd N State St 28.4 D
66 I-77 SB Akron Canton Airport Stark Co Line 28.2 D
67 SR 8 NB Broad Blvd Off-Ramp Portage Trail Off-Ramp 28.1 D
67 I-77 NB SR 18 Interchange Ghent Rd 28.1 D
69 I-77 SB Wooster Ave I-76/77 W Interchange 27.9 D
70 I-76/77 EB South St On-Ramp Main St/Broadway 27.6 D
71 I-76 EB Arlington St On-Ramp Martha Ave Off-Ramp 27.4 D
72 SR 8 SB Broad Blvd Off-Ramp Portage Trail On-Ramp 27.3 D
73 I-77 NB Archwood Ave I-76/SR 8 Interchange 27.1 D73 I-77 NB I-271 Interchange Brecksville Rd 27.1 D
73 I-76 EB Gilchrist Rd Southeast Ave 27.1 D
76 I-77 NB I-76/I-77 Interchange Wooster Ave 27.0 D
77 I-77 SB Cleveland-Massillon Rd Miller Rd/Ridgewood Rd 26.9 D
78 SR 8 SB Graham Rd Second St 26.6 D
78 I-77 NB SR 21 Interchange SR 18 Interchange 26.6 D
78 I-77 SB Ghent Rd SR 18 Interchange 26.6 D
81 I-76/US 224 EB Cleveland-Massillon Rd Barber Rd 26.5 D
82 SR 8 NB Broad Blvd On-Ramp Front St (SR 59) 26.4 D
83 I-76 EB Kelly Ave Off-Ramp Arlington St On-Ramp 26.3 D
84 I-76/US 224 WB Barber Rd Cleveland-Massillon Rd 26.1 D
85 I-76 EB Martha Ave Off-Ramp Seiberling St Off-Ramp 26.0 D
23

8/9/2019 CMS Performance and Strategy Evaluation Report AMATS
http://slidepdf.com/reader/full/cms-performance-and-strategy-evaluation-report-amats 26/115
8/9/2019 CMS Performance and Strategy Evaluation Report AMATS
http://slidepdf.com/reader/full/cms-performance-and-strategy-evaluation-report-amats 27/115
Table 2-2
2003 Arterial Level of Service Analysis(segments operating at LOS "D", "E", or "F")
Rank Roadway From To County
Volume to
Capacity
Ratio
Level of
Service
1 SR 8 SR 303 I-80 Summit 1.87 F
2 SR 82 (Aurora Rd) S. Bedford Rd N. Bedford Rd Summit 1.72 F
3 SR 43 I-76 SR 261 Portage 1.68 F
4 SR 241 (Massillon Rd) Steese Rd Graybill Rd Summit 1.59 E5 Steels Corners Rd Wyoga Lake Rd SR 8 SB Ramps Summit 1.56 E
6 SR 43 Ravenna Rd (W. Leg) Lake Martin Dr Portage 1.55 E
7 SR 93 (Manchester Rd) Robinson Av Cormany Rd Summit 1.51 E
8 Howe Av SR 8 SB Ramps Main St Summit 1.51 E
9 SR 241 (Massillon Rd) Krumroy Rd US 224 Summit 1.51 E
10 SR 14 SR 303 (E. Leg) Price Rd Portage 1.46 E
11 SR 91 (Main St) Aurora St Valleyview Rd Summit 1.43 E
12 SR 303 (Streetsboro St) Atterbury Blvd SR 91 (Main St) Summit 1.42 E
13 SR 59 SR 261 Powder Mill Rd Portage 1.42 E
14 Hudson Dr Steels Corners Rd Commerce Dr Summit 1.41 E
15 SR 43 (Chillicothe Rd) Aurora-Hudson Rd SR 306 Portage 1.40 E
16 SR 18 (W. Market St) Bryden Dr Hawkins Av Summit 1.38 E
17 Howe Av Main St Buchholzer Blvd Summit 1.37 E
18 SR 8 I-80 I-271 Summit 1.35 E
19 SR 43 Seasons Rd SR 14/303 Portage 1.35 E
20 SR 59 Powder Mill Rd Menough Rd Portage 1.34 E
21 SR 18 (Medina Rd) Crystal Lake Rd I-77 Summit 1.34 E
22 Graham Rd SR 91 (Darrow Rd) Charring Cross Dr Summit 1.34 E
23 SR 82 (Aurora Rd) Boyden Rd Olde Eight Rd Summit 1.34 E
24 SR 43 SR 14/303 Frost Rd Portage 1.33 E
25 SR 14/44 SR 59 SR 5 Portage 1.32 E
26 Summit St W. Campus Center Dr Loop Rd Portage 1.32 E
27 SR 14 SR 303 (W. Leg) SR 43 Portage 1.31 E
28 SR 43 (Aurora Rd) Bissell Rd Treat Rd Portage 1.31 E
29 SR 91 (Darrow Rd) SR 82 (Aurora Rd) Cuyahoga County Line Summit 1.30 E
30 SR 14 I-80 SR 303 (W. Leg) Portage 1.29 E
31 Portage Path (before constr.) Merriman Rd Portage Trail Summit 1.29 E
32 Cleveland-Massillon Rd I-77 NB Ramp Elgin Rd Summit 1.29 E
33 SR 91 (Darrow Rd/Main St) Hudson Dr SR 303 Summit 1.29 E
34 Cleveland-Massillon Rd Greenwich Rd I-76 WB Ramps Summit 1.28 E
35 Cleveland-Massillon Rd Elgin Rd Bywood Rd Summit 1.28 E36 SR 91 (Main St) SR 303 Aurora St Summit 1.27 E
37 SR 18 (W. Market St) Frank Blvd Bryden Dr Summit 1.26 E
38 SR 241 (Massillon Rd) Greensburg Rd Steese Rd Summit 1.26 E
39 Exchange St Grant St Brown St Summit 1.25 E
40 SR 82 (Aurora Rd) N. Bedford Rd Chamberlin Rd Summit 1.25 D
41 SR 91 (Main St/Darrow Rd) Munroe Falls Av SR 59 (Kent Rd) Summit 1.24 D
42 SR 43 Kent North Corp. Ravenna Rd (W. Leg) Portage 1.24 D
43 SR 261 (Tallmadge Av) Glenwood Av Home Av Summit 1.23 D
44 Cuyahoga Falls Av N. Main St Patterson Av Summit 1.23 D
45 Waterloo Rd I-77 SB Ramps Arlington St Summit 1.22 D
46 SR 59 (W. Main St) Summit County Line West Main St Portage 1.20 D
47 SR 14 Price Rd Cleveland Rd Portage 1.20 D
48 SR 18 (W. Market St) Sand Run Rd Frank Blvd Summit 1.19 D
49 Cleveland-Massillon Rd Shannon Av Gardner Blvd Summit 1.19 D
50 Portage Trail (under constr.) Portage Path Northampton Rd Summit 1.19 D
51 SR 619 (Wooster Rd N) Waterloo Rd I-76 WB Ramps Summit 1.19 D52 Graham Rd Baumberger Rd SR 91 (Darrow Rd) Summit 1.18 D
53 SR 93 (Manchester Rd) Portage Lakes Dr Robinson Av Summit 1.18 D
54 SR 59 (E. Main St) Luther Av Horning Rd Portage 1.18 D
55 SR 14 SR 43 SR 303 (E. Leg) Portage 1.17 D
56 SR 18 (W. Market St) Miller Rd Revere Rd Summit 1.17 D
57 Summit St Lincoln St W. Campus Center Dr Portage 1.17 D
58 Miller Rd Ridgewood Rd SR 18 (W. Market St) Summit 1.17 D
59 Hudson Dr McCauley Rd Norton Rd Summit 1.17 D
60 Graham Rd Charring Cross Dr Fishcreek Rd Summit 1.15 D
61 SR 18 (W. Market St) Twin Oaks Rd Portage Path Summit 1.15 D
62 Smith Rd Ghent Rd Revere Rd Summit 1.15 D
63 Portage Trail Valley Rd State Rd Summit 1.15 D
64 Portage Trail 6th St 2nd St Summit 1.14 D
65 SR 18 (W. Market St) Merriman Rd Maple St Summit 1.14 D
25

8/9/2019 CMS Performance and Strategy Evaluation Report AMATS
http://slidepdf.com/reader/full/cms-performance-and-strategy-evaluation-report-amats 28/115
Table 2-2
2003 Arterial Level of Service Analysis(segments operating at LOS "D", "E", or "F")
Rank Roadway From To County
Volume to
Capacity
Ratio
Level of
Service
66 SR 91 (North Av/Main St) Howe Rd Munroe Falls Av Summit 1.14 D
67 S. Main St Killian Rd Portage Lakes Dr Summit 1.13 D
68 SR 14/44 SR 88 SR 59 Portage 1.13 D
69 Exchange St Brown St Fountain St Summit 1.13 D70 Portage Trail Northampton Rd Valley Rd Summit 1.13 D
71 SR 619 (5th St NE) Fairview Av Paige Av Summit 1.12 D
72 S. Main St SR 619 (Turkeyfoot Lake Rd) Killian Rd Summit 1.12 D
73 SR 14 I-76 Tallmadge Rd Portage 1.12 D
74 SR 18 (W. Market St) Cleveland-Massillon Rd Smith Rd Summit 1.11 D
75 SR 43 (Aurora Rd) SR 82 Bissell Rd Portage 1.11 D
76 Cuyahoga Falls Av Patterson Av Front St Summit 1.10 D
77 SR 18 (W. Market St) Smith Rd Ghent Rd Summit 1.10 D
78 Cleveland-Massillon Rd Ridgewood Rd (N. leg) I-77 NB Ramp Summit 1.10 D
79 SR 91 (Darrow Rd) Middleton Rd Twinsburg Rd Summit 1.10 D
80 Prospect St Summit Rd Lake Av Portage 1.09 D
81 Cuyahoga Falls Av Front St SR 8 SB Ramps Summit 1.09 D
82 SR 18 (W. Market St) Ghent Rd Miller Rd Summit 1.09 D
83 SR 14 Cleveland Rd SR 44 Portage 1.09 D
84 Arlington Rd Moore Rd I-77 SB Ramps Summit 1.08 D
85 SR 18 (Medina Rd) I-77 Cleveland-Massillon Rd Summit 1.08 D
86 SR 18 (W. Market St) Revere Rd Sand Run Rd Summit 1.07 D
87 Fishcreek Rd Stow Rd Laurel Woods Summit 1.07 D
88 Cleveland-Massillon Rd SR 162 (Copley Rd (S. Leg)) Ridgewood Rd (N. leg) Summit 1.07 D
89 Graham Rd Hudson Dr SR 8 SB Ramps Summit 1.07 D
90 Portage Trail 2nd St SR 8 NB Ramp Summit 1.07 D
91 SR 18 (W. Market St) Portage Path S. Highland Av Summit 1.07 D
92 State Rd Portage Trail Graham Rd Summit 1.06 D
93 Triplett Blvd Hilbish Av Abington Rd Summit 1.06 D
94 SR 43 (Aurora Rd) Treat Rd Geauga County Line Portage 1.06 D
95 SR 43 Old Forge Rd Tallmadge Rd Portage 1.05 D
96 Merriman Rd/Riverview Rd Weathervane Lane Smith Rd Summit 1.05 D
97 SR 43 Lake Martin Dr Seasons Rd Portage 1.04 D
98 Prospect St SR 44 Summit Rd Portage 1.04 D
99 SR 44 Tallmadge Rd I-76 Portage 1.04 D
100 Arlington Rd SR 619 Moore Rd Summit 1.03 D101 SR 93 (Manchester Rd) Cormany Rd I-277 Summit 1.03 D
102 SR 91 (Darrow Rd) Highland Rd I-480 Summit 1.03 D
103 Graham Rd SR 8 SB Ramps Baumberger Rd Summit 1.02 D
104 31st St Wooster Rd W Shannon Av Summit 1.02 D
105 Graham Rd Fishcreek Rd Portage County Line Summit 1.02 D
106 Smith Rd Revere Rd Sand Run Rd Summit 1.01 D
107 SR 82 (Aurora Rd) Olde Eight Rd SR 8 Summit 1.01 D
108 Tallmadge Rd Newberry St Clyde Av Summit 1.01 D
109 SR 261 (Tallmadge Av) SR 8 Glenwood Av Summit 1.01 D
110 S. Main St Caston Rd (N. Leg) SR 619 (Turkeyfoot Lake Rd) Summit 1.01 D
111 SR 59 (W. Main St) Sycamore St SR 88 (Freedom St) Portage 1.01 D
112 SR 241 (Massillon Rd) Mayfair Rd Killian Rd Summit 1.00 D
113 Hudson Dr Commerce Dr McCauley Rd Summit 1.00 D
114 SR 5/44 I-76 Prospect St Portage 1.00 D
115 SR 14 SR 5 I-76 Portage 1.00 D
116 SR 43 (Chillicothe Rd) Mennonite Rd Aurora-Hudson Rd Portage 1.00 D117 SR 43 Tallmadge Rd I-76 Portage 1.00 D
118 SR 261 (Tallmadge Av) N. Main St SR 8 Summit 1.00 D
26
8/9/2019 CMS Performance and Strategy Evaluation Report AMATS
http://slidepdf.com/reader/full/cms-performance-and-strategy-evaluation-report-amats 29/115
SUGAR BUS H\KNOLLS
BRADY\LAKE
NORTHFIELD
DOYLESTOWN
MOGADORE
REMINDERVILLE
SILVER\LAKE
HIRAM
GARRETTSVILLE
NEW\FRANKL IN
LAKEMORE
MANTUA
MUNROE FALLS
WINDHAM
BOSTON\ HEIGHTS
PENINSULA
CLINTON
FAIRLAWN
RAVENNA
BARBERTON
RICHFIELD
MACEDONIA
TALLMADGE
TWINSBURG
CUYAHOGA FALLS
KENT
STREETSBORO
NORTON
STOW
AURORA
HUDSON
GREEN
AKRON
8
5
8
8
5
14
91
21
82
44
59
18
43
44
21
94
21
14
44
43
59
93
91
94
44
14
8244
88
14
59
82
43
91
21
57
82
18
8844
305
77
77
80
80
76
76
77
77
80
76
76
76
43
176
764
585
532
162
261
619
303
241
306
225
604
619
183
241
183
303
261
225
261
282
303
236
303
700
277
271
480
271
480
224
422
224224
224
224
224
9
7
5
41
7
5
2
3
37
34
30
24
21
28
38
36
33
24
16
34
19
24
29
12
3017
17
19
15
12
22 24
12
23
10 10
32
Map 2-32003 INTERSECTION CAPACITY ANALYSIS
August 2004
0 1 2 3 4Miles
Over Capacity
At Capacity
Near Capacity
Under Capacity
2 7

8/9/2019 CMS Performance and Strategy Evaluation Report AMATS
http://slidepdf.com/reader/full/cms-performance-and-strategy-evaluation-report-amats 30/115
Table 2-3
2003 Intersection Capacity Analysis
Rank Intersection Community County
olume to
Capacity
Ratio
Operational
Status
1 SR 18 (Medina Rd)/Crystal Lake Rd Bath Twp/Copley Twp Summit 1.17 Over Capacity
2 SR 43/Fairchild Ave/Crain Ave Kent Portage 1.16 Over Capacity
3 N Portage Path/Merriman Rd Akron Summit 1.12 Over Capacity
4 Portage Trail/Akron-Peninsula Rd Cuyahoga Falls Summit 1.08 Over Capacity
5 SR 8/Highland Rd Macedonia Summit 1.04 Over Capacity
5 Howe Ave/Brittain Rd/Northwest Ave Cuyahoga Falls Summit 1.04 Over Capacity
7 SR 619/S Main St Green Summit 1.03 Over Capacity
7 US 224/SR 241 (Massillon Rd) Akron Summit 1.03 Over Capacity
9 SR 82/Olde Eight Rd/Brandywine Rd Northfield Center Twp Summit 1.02 Over Capacity
10 SR 91/SR 303 Hudson Summit 1.00 At Capacity
10 SR 14/SR 43/SR 303 Streetsboro Portage 1.00 At Capacity
12 SR 18 (W Market St)/Smith Rd Fairlawn Summit 0.98 At Capacity
12 SR 91 (Darrow Rd)/Graham Rd Stow Summit 0.98 At Capacity
12 Howe Rd/SR 261 (Northeast Ave)/North Munroe Rd Tallmadge Summit 0.98 At Capacity
15 SR 91 (Canton Rd)/US 224 Springfield Twp Summit 0.97 At Capacity
16 SR 43/SR 82 Aurora Portage 0.95 Near Capacity
17 SR 59 (Kent Rd)/SR 91 (Darrow Rd) Stow Summit 0.93 Near Capacity
17 SR 14/SR 59/Newton Falls Rd Ravenna Township Portage 0.93 Near Capacity
19 SR 59 (Front St)/Hudson Drive Cuyahoga Falls Summit 0.92 Near Capacity
19 SR 43/SR 261 Kent Portage 0.92 Near Capacity
21 SR 261(Tallmadge Ave)/Home Ave Akron Summit 0.91 Near Capacity
22 SR 619/Arlington Rd Green Summit 0.90 Near Capacity
23 Brittain Rd/Eastland Ave/Eastwood Ave Akron Summit 0.88 Near Capacity
24 Howe Ave/Main St Cuyahoga Falls Summit 0.87 Near Capacity
24 SR 43 (Water St)/SR 59 (Haymaker Pkwy) Kent Portage 0.87 Near Capacity
24 Wooster Rd W/31st St S.W. Barberton Summit 0.87 Near Capacity
24 SR 241 (Massillon Rd)/SR 619 Green Summit 0.87 Near Capacity
28 Graham Rd/Fishcreek Rd Stow Summit 0.86 Near Capacity
29 SR 59 (Kent Rd)/Fishcreek Rd Stow Summit 0.85 Under Capacity
30 State Rd/Portage Trail Cuyahoga Falls Summit 0.82 Under Capacity
30 SR 176 (Wheatley Rd)/Brecksville Rd Richfield Summit 0.82 Under Capacity
32 SR 18 (W Market St)/Cleveland-Massillon Rd Fairlawn Summit 0.80 Under Capacity
33 SR 261 (N Main St)/Tallmadge Ave Akron Summit 0.79 Under Capacity
34 SR 18 (W Market St)/Hawkins Ave/W Exchange St Akron Summit 0.77 Under Capacity
34 SR 82/SR 91 (Darrow Rd) Twinsburg Summit 0.77 Under Capacity
36 E Steels Corners Rd/Hudson Drive Stow Summit 0.74 Under Capacity
37 SR 93 (Manchester Rd)/SR 619 Franklin Township Summit 0.72 Under Capacity
38 SR 8/SR 82 Macedonia Summit 0.67 Under Capacity
28
8/9/2019 CMS Performance and Strategy Evaluation Report AMATS
http://slidepdf.com/reader/full/cms-performance-and-strategy-evaluation-report-amats 31/115
A B C D E F Totals
6,453 1,348 516 120 40 0 8,477
76.1% 15.9% 6.1% 1.4% 0.5% 0.0% 100%
67,989 5,585 1,865 519 148 22 76,128
89.3% 7.3% 2.4% 0.7% 0.2% 0.0% 100%
Freeways 4,479,262 2,358,276 1,238,521 386,934 157,399 0 8,620,392
Arterials 6,350,138 2,459,022 1,132,579 398,050 136,119 25,531 10,501,439
Freeways 76,194 40,474 21,549 6,978 3,013 0 148,207
Arterials 148,013 66,072 35,282 15,410 7,575 2,635 274,986
Freeways 59.0 58.3 57.0 55.7 52.3 0.0 N/A
Arterials 44.8 39.0 32.8 27.1 20.7 10.4 N/A
A B C D E F Totals148 99 59 32 16 0 353
41.9% 27.9% 16.8% 8.9% 4.5% 0.0% 100%
2,149 511 294 141 65 13 3,172
67.8% 16.1% 9.3% 4.4% 2.0% 0.4% 100%
Freeways 169,412 170,668 147,723 103,159 60,467 0 651,429
Arterials 288,675 229,103 183,948 112,751 61,287 15,042 890,806
Freeways 2,859 2,903 2,577 1,853 1,154 0 11,345
Arterials 6,856 6,109 5,695 4,305 3,393 1,568 27,926
Freeways 59.5 59.0 57.8 56.0 52.1 0.0 N/A
Arterials 43.4 39.2 34.1 28.0 19.2 9.8 N/A
Total Number of Miles
Table 2-4
2003 Existing Level of Service (24-Hour Period)
Table 2-5
2003 Existing Level of Service (Peak Hour 4-5 P.M.)
Level of Service
Level of Service
Freeways
Vehicle Miles Traveled
Vehicle Hours Traveled
Average Speed in MPH
Arterials
Freeways
Arterials
Average Speed in MPH
Vehicle Miles Traveled
Vehicle Hours Traveled
Total Number of Miles
29

8/9/2019 CMS Performance and Strategy Evaluation Report AMATS
http://slidepdf.com/reader/full/cms-performance-and-strategy-evaluation-report-amats 32/115
30

8/9/2019 CMS Performance and Strategy Evaluation Report AMATS
http://slidepdf.com/reader/full/cms-performance-and-strategy-evaluation-report-amats 33/115
31
CHAPTER 3
FUTURE TRAFFIC CONGESTION
Congestion is a dynamic condition that varies with time, changes in the transportation
system, and changes in land use. It is therefore necessary to understand the futureperformance of the transportation system, in order to effectively plan for transportationimprovements. In this chapter, future traffic congestion is identified based on the 2030Future Highway Congestion Study, which was approved by AMATS in July 2004.
The purpose of this chapter is to quantify the level of future traffic congestion on thefreeways and arterials that comprise the AMATS Congestion Management System(CMS). The level of future congestion at intersections included in the CMS was notanalyzed, due to the difficulty of accurately forecasting turning movements.
Summary statistics regarding the overall level of congestion on the future highway
system have also been developed and will be used in later chapters to evaluate theperformance of the transportation system over time.
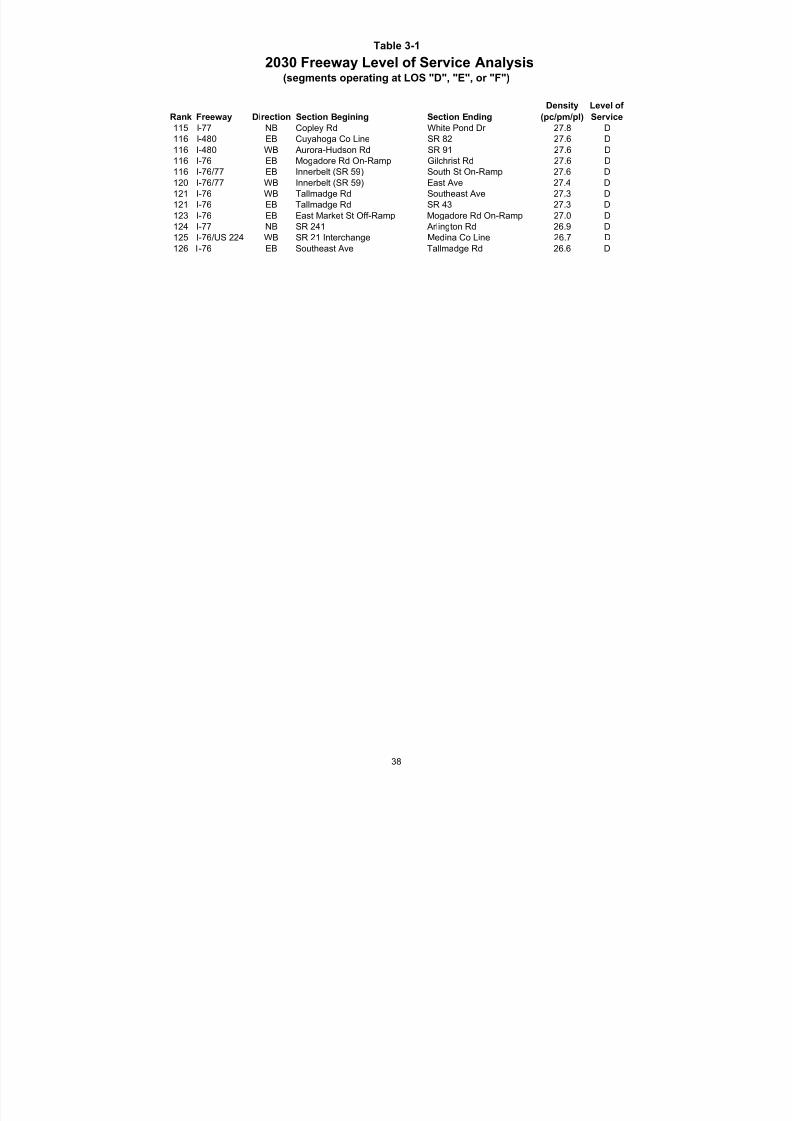
2030 Freeway Level of Service Analysis
This analysis determines the extent to which there will be sufficient capacity on thefreeway system in 2030 to accommodate future peak-hour travel volumes at areasonable level of service (LOS). Standard analytical techniques described in theHighway Capacity Manual 2000 (HCM2000) were utilized to determine the level of service of each freeway segment included in the CMS during the peak hour of travel.
The LOS of a freeway segment is determined based on the volume of traffic and thecapacity of the roadway, by direction of travel. The volume of traffic on each freewaysegment was forecasted using the AMATS urban transportation planning models. Thecapacity of each freeway segment was calculated using HCM2000 procedures, whichexamine roadway characteristics such as the number of lanes, interchange spacing,percent grade, length of grade, lateral clearance, free flow speed, and percent trucks.
Existing roadway characteristics were updated for this future analysis to include severalcommitted freeway improvements. These projects are all scheduled to be completed inthe near future. They include:
• SR 8 upgrade between SR 303 and I-271• I-77 widening between the Akron-Canton Airport and SR 241• I-77 widening between SR 162 and SR 21• U.S. 224 upgrade between Kelly Ave. and SR 241
Both volume and capacity are used to calculate the density of traffic on each freewaysegment. Density is the parameter used in the HCM2000 to determine the LOS of a

8/9/2019 CMS Performance and Strategy Evaluation Report AMATS
http://slidepdf.com/reader/full/cms-performance-and-strategy-evaluation-report-amats 34/115
32
freeway segment. It is measured in terms of the number of passenger cars, per mile,per lane (pcpmpl). The density corresponding to each LOS is summarized below:
Level of Service Density
A 0 to 11.0B 11.1 to 18.0C 18.1 to 26.0D 26.1 to 35.0E 35.1 to 45.0F 45.1 or greater
Freeway segments forecasted as operating at a density of greater than 26.0 (LOS "D","E", or "F") in the peak hour were identified as congested. These segments are shownon Map 3-1 (on page 35). Table 3-1 (on pages 36-38) lists these segments with their corresponding LOS, ranked according to their density.
Of the 186 freeway segments that were analyzed, 126 were identified as beingcongested during the peak hour of travel in 2030. Thirty-three segments operated atLOS "F", 32 operated at LOS "E", and 61 operated at LOS "D".
2030 Arterial Level of Service Analysis
This analysis determines the extent to which there will be sufficient capacity on arterialroadways in 2030 to accommodate future peak-hour travel volumes at a reasonablelevel of service (LOS). Analytical techniques, based on generalized planning-levelroadway capacities developed by AMATS, were utilized to determine the level of serviceof each arterial segment included in the CMS during the peak hour of travel.
The LOS of an arterial segment is determined based on the volume of traffic and thecapacity of the roadway. The volume of traffic on each arterial segment was forecastedusing the AMATS urban transportation planning models. The capacity of each arterialsegment was calculated using a methodology developed by AMATS, which examinesroadway characteristics such as the number of lanes, turn lanes, and the number of traffic signals per mile. The capacities used in this analysis are intended to representtypical peak-hour operating conditions and generally correspond to the default valuesgenerated by ODOT's Capacity Calculator software.
Existing roadway characteristics were updated for this future analysis to include severalcommitted arterial improvements. These projects are all scheduled to be completed inthe near future. They include:
• SR 43 widening between Tallmadge Rd. and SR 261• SR 43 widening between Seasons Rd. and Pike Pkwy.• SR 59 upgrade between SR 8 and Oak Park Blvd.• SR 91 upgrade between SR 59 and Norton Rd.

8/9/2019 CMS Performance and Strategy Evaluation Report AMATS
http://slidepdf.com/reader/full/cms-performance-and-strategy-evaluation-report-amats 35/115
33
• Arlington Rd. upgrade between Krumroy Rd. and Swartz Rd.• South Main St. widening between SR 619 and East Reservoir • Tuscarawas Ave. bridge replacement and Robinson Ave extension between
Wooster Rd and Van Buren Ave.
The volume-to-capacity (V/C) ratio of each arterial segment was used to determine itsLOS. The volume-to-capacity ratio corresponding to each LOS is summarized below:
Level of Service V/C Ratio
A 0 to 0.500B 0.501 to 0.750C 0.751 to 1.000D 1.001 to 1.250E 1.251 to 1.600F 1.601 or greater
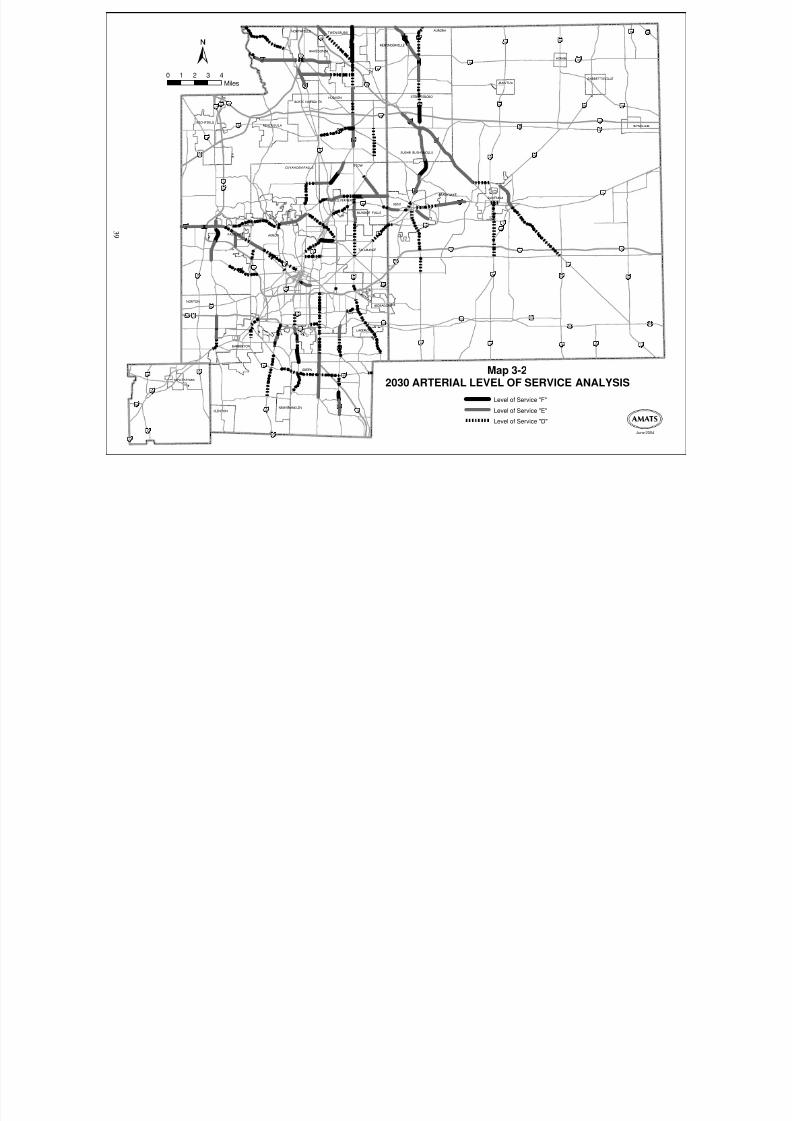
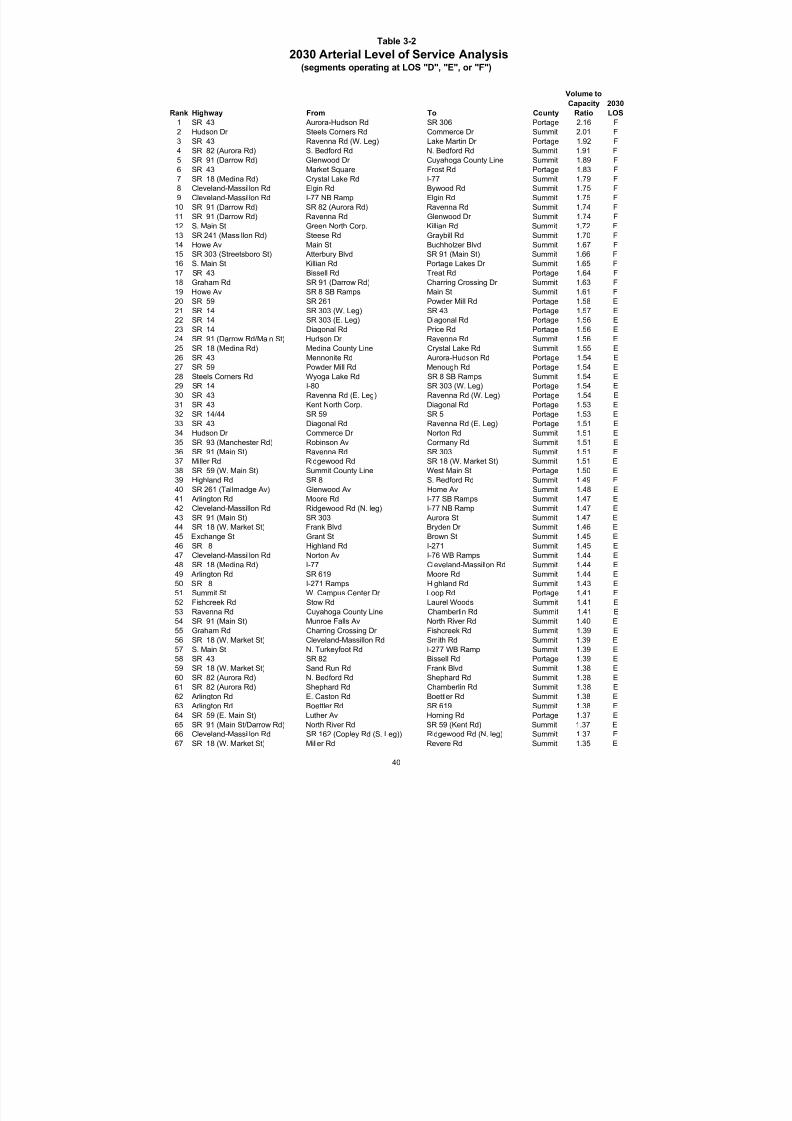
Arterial segments forecasted as operating at a volume-to-capacity ratio greater than 1.0(LOS "D", "E", or "F") in the peak hour were identified as congested. These segmentsare shown on Map 3-2 (on page 39). Table 3-2 (on pages 40-43) lists these segmentswith their corresponding LOS, ranked according to their V/C ratio.
Of the 528 arterial segments that were analyzed, 236 were identified as beingcongested during the peak hour of travel in 2030. Nineteen operated at LOS "F", 78operated at LOS "E", and 139 operated at LOS "D".
Future System Statistics
System statistics were developed to estimate the future performance and expected levelof congestion on the highway system in the AMATS area in 2030. AMATS urbantransportation planning models were used to estimate the total amount of travel on thefuture (2030) highway network. ODOT's post-processing routine, CMAQT, was thenused to analyze the model results and to generate various congestion statistics for freeways and arterials. These statistics include the total number of miles operating ateach level of service, vehicle miles traveled (VMT), vehicle hours traveled (VHT), andaverage speed.
Table 3-3 (on page 44) summarizes this information for freeways and arterials during a
typical 24-hour period in 2030. The table indicates that 4.3% of the freeway mileageand 2.7% of the arterial mileage is expected to operate at LOS "D" or worse in 2030.
Table 3-4 (on page 44) summarizes this information for freeways and arterials duringthe peak hour (4:00-5:00 p.m.) of a typical day in 2030. The table indicates that 21.7%of the freeway mileage and 16.7% of the arterial mileage will operate at LOS "D" or worse in 2030.

8/9/2019 CMS Performance and Strategy Evaluation Report AMATS
http://slidepdf.com/reader/full/cms-performance-and-strategy-evaluation-report-amats 36/115
34
In order to compare the level of existing (2003) congestion, documented in Chapter 2,with the level of future (2030) congestion, documented in this chapter, several additionalperformance measures calculated by CMAQT have been used as indicators to evaluatethe performance of the highway system over time. These indicators include vehiclehours of delay, person hours of delay, and the Congestion Severity Index (CSI). The
CSI was developed by the Texas Transportation Institute in order to measure the totallevel of congestion on the highway system.
Table 3-5 (on page 44) compares the following existing regional statistics from 2003with those forecasted for 2030: vehicle hours traveled (VHT), vehicle delay in hours,person delay in hours, and Congestion Severity Index. The table indicates that between2003 and 2030 there will be 32.6% increase in daily VHT on area freeways. During thesame time period it is expected that daily vehicle hours of delay and person hours of delay on area freeways will increase by over 170%.
Table 3-5 also indicates that between 2003 and 2030 there will be a 51.5% increase in
daily VHT on arterial roadways. During the same time period it is expected that dailyvehicle hours of delay and person hours of delay on arterial roadways will increase byover 270%.
Table 3-6 (on page 44) compares estimates of daily vehicle miles traveled (VMT) bylevel of service for 2003 and 2030. The table indicates that daily VMT in the AMATSarea is forecasted to increase from 19.1 million in 2003 to 26.1 million in 2030; anincrease of 36%. The VMT on roadways operating at LOS "D", "E", and "F" is expectedto increase by 154%, 202%, and 672%, respectively.

8/9/2019 CMS Performance and Strategy Evaluation Report AMATS
http://slidepdf.com/reader/full/cms-performance-and-strategy-evaluation-report-amats 37/115

8/9/2019 CMS Performance and Strategy Evaluation Report AMATS
http://slidepdf.com/reader/full/cms-performance-and-strategy-evaluation-report-amats 38/115
Table 3-1
2030 Freeway Level of Service Analysis(segments operating at LOS "D", "E", or "F")
Rank Freeway Direction Section Begining Section Ending
Density
(pc/pm/pl)
Level of
Service
1 I-77 SB I-76/SR 8 Interchange Archwood Ave - F
2 I-77 SB Archwood Ave Wilbeth Rd - F
3 I-77 SB Wilbeth Rd Waterloo Rd - F4 I-77 SB I-271 Interchange Wheatley Rd - F
5 I-77 SB Wheatley Rd Ghent Rd - F
6 I-77 NB Archwood Ave I-76/SR 8 Interchange - F
7 I-77 NB Ghent Rd Wheatley Rd - F
8 I-77 NB Wheatley Rd I-271 Interchange - F
9 SR 8 NB At Central Interchange - F
10 I-76 WB Kenmore Expressway-S.Inter. - F
11 I-77 SB Waterloo Rd US 224 Interchange - F
12 I-76 WB Kenmore Expressway-N.Inter. - F
13 SR 8 SB At Central Interchange - F
14 I-76 EB Kenmore Expressway-N.Inter. - F
15 I-271 NB SR 82 Cuyahoga Co Line - F
16 SR 8 SB Glenwood Ave Perkins St - F
17 I-76/US 224 EB Wooster Rd N I-277 Interchange - F18 I-77 NB Wilbeth Rd Archwood Ave - F
19 I-77 NB Waterloo Rd Wilbeth Rd - F
20 I-77 SB Ohio Turnpike (I-80) Brecksville Rd - F
21 I-76/US 224 WB I-277 Interchange Wooster Rd N - F
22 SR 8 SB Perkins St Buchtel Ave - F
23 I-76 WB I-77 Interchange Battles Ave - F
24 I-77 SB Brecksville Rd I-271 Interchange - F
25 SR 8 SB Tallmadge Ave Glenwood Ave - F
26 I-76 WB Battles Ave I-277 Interchange - F
27 I-76/US 224 EB Barber Rd State St - F
28 I-77 SB At Central Interchange - F
29 SR 8 SB Buchtel Ave I-76/77 Interchange - F
30 I-77 NB I-271 Interchange Brecksville Rd - F
31 I-77 NB Brecksville Rd Ohio Turnpike (I-80) - F32 SR 8 NB Perkins St Glenwood Ave - F
33 I-77 NB At Central Interchange - F
34 I-76/US 224 WB State St Barber Rd 44.6 E
35 SR 8 SB Cuyahoga Falls Ave Tallmadge Ave 44.5 E
36 I-76 EB I-277 Interchange Kenmore Blvd 44.1 E
37 SR 8 NB Carroll St Perkins St 43.9 E
38 SR 8 SB Graham Rd Second St 43.0 E
39 SR 8 SB Broad Blvd On-Ramp Howe Ave 42.9 E
40 I-77 NB US 224 Interchange Waterloo Rd 42.7 E
40 SR 8 SB Portage Trail On-Ramp Broad Blvd On-Ramp 42.7 E
42 SR 8 SB Howe Ave Cuyahoga Falls Ave 42.2 E
43 I-76 EB Kenmore Blvd I-77 Interchange 41.9 E
44 I-76/US 224 EB State St Wooster Rd N 41.8 E
45 I-76/77 EB East Ave South St Off-Ramp 40.6 E
46 SR 8 SB Second St Broad Blvd Off-Ramp 40.4 E
47 I-76/US 224 WB Wooster Rd N State St 40.2 E
48 I-76 WB At Central Interchange 39.7 E
49 I-76 EB Gilchrist Rd Southeast Ave 39.1 E
50 I-76/77 EB South St Off-Ramp Innerbelt (SR 59) 39.0 E
51 I-271 SB Cuyahoga Co Line SR 82 38.8 E
51 SR 8 NB I-76/77 Interchange Carroll St 38.8 E
53 SR 8 SB Broad Blvd Off-Ramp Portage Trail On-Ramp 38.5 E
54 I-76/US 224 EB Cleveland-Massillon Rd Barber Rd 38.4 E
55 I-77 NB SR 21 Interchange SR 18 Interchange 37.8 E
56 SR 8 NB Tallmadge Ave Cuyahoga Falls Ave 37.4 E
57 I-76/US 224 WB Barber Rd Cleveland-Massillon Rd 37.3 E
36

8/9/2019 CMS Performance and Strategy Evaluation Report AMATS
http://slidepdf.com/reader/full/cms-performance-and-strategy-evaluation-report-amats 39/115
Table 3-1
2030 Freeway Level of Service Analysis(segments operating at LOS "D", "E", or "F")
Rank Freeway Direction Section Begining Section Ending
Density
(pc/pm/pl)
Level of
Service
58 SR 8 NB Glenwood Ave Tallmadge Ave 37.0 E
59 SR 8 NB Howe Ave Broad Blvd Off-Ramp 36.6 E
60 I-77 SB US 224 Interchange Arlington Rd 36.4 E61 SR 8 NB Cuyahoga Falls Ave Howe Ave 35.8 E
62 I-76 WB Kelly Ave On-Ramp Inman St Off-Ramp 35.5 E
63 I-77 SB Wooster Ave I-76/77 W Interchange 35.4 E
63 I-76 WB Inman St Off-Ramp I-77 Interchange 35.4 E
65 I-77 SB SR 18 Interchange SR 21 Interchange 35.2 E
66 I-76 EB I-77 Interchange Kelly Ave Off-Ramp 35.0 D
66 I-480 WB Ohio Turnpike (I-80) Aurora-Hudson Rd 35.0 D
68 I-76 WB Southeast Ave Gilchrist Rd 34.9 D
68 I-271 NB SR 8 SR 82 34.9 D
68 I-76 EB Seiberling St Off-Ramp Martha Ave On-Ramp 34.9 D
68 I-76/77 EB I-77 Interchange East Ave 34.9 D
72 SR 8 NB Front St (SR59) Hudson Dr 34.8 D
72 SR 8 NB Broad Blvd On-Ramp Front St (SR59) 34.8 D
74 I-76/77 WB I-77 Interchange Wolf Ledges/Grant St 34.6 D75 SR 8 NB Hudson Dr Graham Rd 34.5 D
75 I-76/77 WB East Ave I-77 Interchange 34.5 D
75 I-76 EB Kenmore Expressway-S.Inter. 34.5 D
78 I-76 EB Kelly Ave Off-Ramp Arlington St On-Ramp 34.4 D
79 I-480 WB SR 82 Cuyahoga Co Line 34.0 D
80 I-77 SB SR 241 Akron-Canton Airport 33.9 D
80 I-77 NB I-76/77 W Interchange Wooster Ave 33.9 D
82 I-76 EB Martha Ave Off-Ramp Seiberling St Off-Ramp 33.8 D
83 I-76 EB Arlington St On-Ramp Martha Ave Off-Ramp 33.7 D
84 I-76/77 WB Wolf Ledges/Grant St Main St/Broadway 33.6 D
85 SR 8 NB Broad Blvd Off-Ramp Portage Trail Off-Ramp 33.5 D
86 SR 8 SB Steels Corners Graham Rd 33.1 D
87 I-76/77 EB Wolf Ledges/Grant St I-77 Interchange 32.8 D
87 I-76 WB Brittain Rd On-Ramp Martha Ave 32.8 D89 I-76/US 224 EB SR 21 Interchange Cleveland-Massillon Rd 32.7 D
90 I-77 SB Arlington Rd SR 241 32.5 D
91 I-76/77 EB Main St/Broadway Wolf Ledges/Grant St 32.2 D
92 I-76/77 WB Main St/Broadway Russell Ave 32.1 D
93 I-76 EB At Central Interchange 31.9 D
94 I-77 SB Copley Rd Wooster Ave 31.8 D
95 I-76/US 224 WB Cleveland-Massillon Rd SR 21 Interchange 31.7 D
96 SR 8 NB Portage Trail Off-Ramp Broad Blvd On-Ramp 31.6 D
97 I-76 WB Martha Ave Arlington St Off-Ramp 31.3 D
98 I-76 EB Martha Ave On-Ramp East Market St Off-Ramp 31.1 D
99 I-76/77 EB South St On-Ramp Main St/Broadway 31.0 D
100 I-76 WB East Market St Brittain Rd On-Ramp 30.6 D
101 I-77 NB Wooster Ave Copley Rd 30.4 D
102 SR 8 NB SR 303 Boston Mills Off-Ramp 30.2 D
103 I-77 SB Akron-Canton Airport Stark Co Line 29.7 D
104 I-77 NB Arlington Rd US 224 Interchange 29.2 D
105 I-77 SB Miller Rd/Ridgewood Rd White Pond Dr 29.1 D
106 I-77 SB White Pond Dr Copley Rd 29.0 D
106 I-271 SB SR 82 SR 8 29.0 D
106 I-76 WB Arlington St Off-Ramp Kelly Ave On-Ramp 29.0 D
109 I-77 NB White Pond Dr Miller Rd/Ridgewood Rd 28.5 D
109 I-480 EB Aurora-Hudson Rd Ohio Turnpike (I-80) 28.5 D
109 I-76/77 WB Russell Ave Innerbelt (SR 59) 28.5 D
112 SR 8 NB Graham Rd Steels Corners Rd 28.1 D
113 I-480 WB SR 91 SR 82 28.0 D
114 I-76 WB SR 43 Tallmadge Rd 27.9 D
37
8/9/2019 CMS Performance and Strategy Evaluation Report AMATS
http://slidepdf.com/reader/full/cms-performance-and-strategy-evaluation-report-amats 40/115
Table 3-1
2030 Freeway Level of Service Analysis(segments operating at LOS "D", "E", or "F")
Rank Freeway Direction Section Begining Section Ending
Density
(pc/pm/pl)
Level of
Service
115 I-77 NB Copley Rd White Pond Dr 27.8 D
116 I-480 EB Cuyahoga Co Line SR 82 27.6 D
116 I-480 WB Aurora-Hudson Rd SR 91 27.6 D116 I-76 EB Mogadore Rd On-Ramp Gilchrist Rd 27.6 D
116 I-76/77 EB Innerbelt (SR 59) South St On-Ramp 27.6 D
120 I-76/77 WB Innerbelt (SR 59) East Ave 27.4 D
121 I-76 WB Tallmadge Rd Southeast Ave 27.3 D
121 I-76 EB Tallmadge Rd SR 43 27.3 D
123 I-76 EB East Market St Off-Ramp Mogadore Rd On-Ramp 27.0 D
124 I-77 NB SR 241 Arlington Rd 26.9 D
125 I-76/US 224 WB SR 21 Interchange Medina Co Line 26.7 D
126 I-76 EB Southeast Ave Tallmadge Rd 26.6 D
38
8/9/2019 CMS Performance and Strategy Evaluation Report AMATS
http://slidepdf.com/reader/full/cms-performance-and-strategy-evaluation-report-amats 41/115
SUGAR BUSH\KNOLLS
BRADY\LAKE
NORTHFIELD
DOYLESTOWN
MOGADORE
REMINDERVILLE
SILVER\LAKE
HIRAM
GARRETTSVILLE
NEW\FRANK LIN
LAKEMORE
MANTUA
MUNROE FALLS
WINDHAM
BOSTO N\HEIGH TS
PENINSULA
CLINTON
FAIRLAWN
RAVENNA
BARBERTON
RICHFIELD
MACEDONIA
TALLMADGE
TWINSBURG
CUYAHOGA FALLS
STREETSBORO
NORTON
STOW
AURORA
HUDSON
GREEN
AKRON
KENT
8
5
8
8
5
14
91
21
82
44
59
18
43
44
21
94
21
14
44
43
59
93
91
94
44
14
43
8244 88
14
59
82
43
91
21
57
82
18
8844
305
77
77
80
80
76
76
77
77
80
76
76
76
176
764
585
532
162
261
619
303
241
306
225
604
619
183
241
183
303
261
225
261
282
303
236
303
700
277
271
480
271
480
224
422
224224
224
224
224
Map 3-22030 ARTERIAL LEVEL OF SERVICE ANALYSIS
Level of Service "F"
Level of Service "E"
Level of Service "D"
June 2004
0 1 2 3 4
Miles
3 9
8/9/2019 CMS Performance and Strategy Evaluation Report AMATS
http://slidepdf.com/reader/full/cms-performance-and-strategy-evaluation-report-amats 42/115
Table 3-2
2030 Arterial Level of Service Analysis(segments operating at LOS "D", "E", or "F")
Rank Highway From To County
Volume to
Capacity
Ratio
2030
LOS
1 SR 43 Aurora-Hudson Rd SR 306 Portage 2.16 F
2 Hudson Dr Steels Corners Rd Commerce Dr Summit 2.01 F
3 SR 43 Ravenna Rd (W. Leg) Lake Martin Dr Portage 1.92 F
4 SR 82 (Aurora Rd) S. Bedford Rd N. Bedford Rd Summit 1.91 F5 SR 91 (Darrow Rd) Glenwood Dr Cuyahoga County Line Summit 1.89 F
6 SR 43 Market Square Frost Rd Portage 1.83 F
7 SR 18 (Medina Rd) Crystal Lake Rd I-77 Summit 1.79 F
8 Cleveland-Massillon Rd Elgin Rd Bywood Rd Summit 1.75 F
9 Cleveland-Massillon Rd I-77 NB Ramp Elgin Rd Summit 1.75 F
10 SR 91 (Darrow Rd) SR 82 (Aurora Rd) Ravenna Rd Summit 1.74 F
11 SR 91 (Darrow Rd) Ravenna Rd Glenwood Dr Summit 1.74 F
12 S. Main St Green North Corp. Killian Rd Summit 1.72 F
13 SR 241 (Massillon Rd) Steese Rd Graybill Rd Summit 1.70 F
14 Howe Av Main St Buchholzer Blvd Summit 1.67 F
15 SR 303 (Streetsboro St) Atterbury Blvd SR 91 (Main St) Summit 1.66 F
16 S. Main St Killian Rd Portage Lakes Dr Summit 1.65 F
17 SR 43 Bissell Rd Treat Rd Portage 1.64 F
18 Graham Rd SR 91 (Darrow Rd) Charring Crossing Dr Summit 1.63 F
19 Howe Av SR 8 SB Ramps Main St Summit 1.61 F
20 SR 59 SR 261 Powder Mill Rd Portage 1.58 E21 SR 14 SR 303 (W. Leg) SR 43 Portage 1.57 E
22 SR 14 SR 303 (E. Leg) Diagonal Rd Portage 1.56 E
23 SR 14 Diagonal Rd Price Rd Portage 1.56 E
24 SR 91 (Darrow Rd/Main St) Hudson Dr Ravenna Rd Summit 1.56 E
25 SR 18 (Medina Rd) Medina County Line Crystal Lake Rd Summit 1.55 E
26 SR 43 Mennonite Rd Aurora-Hudson Rd Portage 1.54 E
27 SR 59 Powder Mill Rd Menough Rd Portage 1.54 E
28 Steels Corners Rd Wyoga Lake Rd SR 8 SB Ramps Summit 1.54 E
29 SR 14 I-80 SR 303 (W. Leg) Portage 1.54 E
30 SR 43 Ravenna Rd (E. Leg) Ravenna Rd (W. Leg) Portage 1.54 E
31 SR 43 Kent North Corp. Diagonal Rd Portage 1.53 E
32 SR 14/44 SR 59 SR 5 Portage 1.53 E
33 SR 43 Diagonal Rd Ravenna Rd (E. Leg) Portage 1.51 E
34 Hudson Dr Commerce Dr Norton Rd Summit 1.51 E
35 SR 93 (Manchester Rd) Robinson Av Cormany Rd Summit 1.51 E
36 SR 91 (Main St) Ravenna Rd SR 303 Summit 1.51 E37 Miller Rd Ridgewood Rd SR 18 (W. Market St) Summit 1.51 E
38 SR 59 (W. Main St) Summit County Line West Main St Portage 1.50 E
39 Highland Rd SR 8 S. Bedford Rd Summit 1.49 E
40 SR 261 (Tallmadge Av) Glenwood Av Home Av Summit 1.48 E
41 Arlington Rd Moore Rd I-77 SB Ramps Summit 1.47 E
42 Cleveland-Massillon Rd Ridgewood Rd (N. leg) I-77 NB Ramp Summit 1.47 E
43 SR 91 (Main St) SR 303 Aurora St Summit 1.47 E
44 SR 18 (W. Market St) Frank Blvd Bryden Dr Summit 1.46 E
45 Exchange St Grant St Brown St Summit 1.45 E
46 SR 8 Highland Rd I-271 Summit 1.45 E
47 Cleveland-Massillon Rd Norton Av I-76 WB Ramps Summit 1.44 E
48 SR 18 (Medina Rd) I-77 Cleveland-Massillon Rd Summit 1.44 E
49 Arlington Rd SR 619 Moore Rd Summit 1.44 E
50 SR 8 I-271 Ramps Highland Rd Summit 1.43 E
51 Summit St W. Campus Center Dr Loop Rd Portage 1.41 E
52 Fishcreek Rd Stow Rd Laurel Woods Summit 1.41 E
53 Ravenna Rd Cuyahoga County Line Chamberlin Rd Summit 1.41 E
54 SR 91 (Main St) Munroe Falls Av North River Rd Summit 1.40 E
55 Graham Rd Charring Crossing Dr Fishcreek Rd Summit 1.39 E
56 SR 18 (W. Market St) Cleveland-Massillon Rd Smith Rd Summit 1.39 E
57 S. Main St N. Turkeyfoot Rd I-277 WB Ramp Summit 1.39 E
58 SR 43 SR 82 Bissell Rd Portage 1.39 E
59 SR 18 (W. Market St) Sand Run Rd Frank Blvd Summit 1.38 E
60 SR 82 (Aurora Rd) N. Bedford Rd Shephard Rd Summit 1.38 E
61 SR 82 (Aurora Rd) Shephard Rd Chamberlin Rd Summit 1.38 E
62 Arlington Rd E. Caston Rd Boettler Rd Summit 1.38 E
63 Arlington Rd Boettler Rd SR 619 Summit 1.38 E
64 SR 59 (E. Main St) Luther Av Horning Rd Portage 1.37 E
65 SR 91 (Main St/Darrow Rd) North River Rd SR 59 (Kent Rd) Summit 1.37 E
66 Cleveland-Massillon Rd SR 162 (Copley Rd (S. Leg)) Ridgewood Rd (N. leg) Summit 1.37 E
67 SR 18 (W. Market St) Miller Rd Revere Rd Summit 1.35 E
40

8/9/2019 CMS Performance and Strategy Evaluation Report AMATS
http://slidepdf.com/reader/full/cms-performance-and-strategy-evaluation-report-amats 43/115
Table 3-2
2030 Arterial Level of Service Analysis(segments operating at LOS "D", "E", or "F")
Rank Highway From To County
Volume to
Capacity
Ratio
2030
LOS
68 Summit St Lincoln St W. Campus Center Dr Portage 1.35 E
69 SR 43 Seasons Rd SR 14/303 Portage 1.34 E
70 Graham Rd Hudson Dr SR 8 NB Ramps Summit 1.34 E
71 Portage Trail Portage Path Northampton Rd Summit 1.34 E72 Cleveland-Massillon Rd SR 18 (W. Market St/Medina Rd) Springside Dr Summit 1.34 E
73 SR 241 (Massillon Rd) Greensburg Rd Steese Rd Summit 1.33 E
74 SR 43 Treat Rd Geauga County Line Portage 1.33 E
75 Arlington Rd Greensburg Rd E. Caston Rd Summit 1.33 E
76 SR 43 SR 306 SR 82 Portage 1.33 E
77 SR 82 (Aurora Rd) Chaffee Rd Boyden Rd Summit 1.32 E
78 SR 91 (Main St) Aurora St Valleyview Rd Summit 1.32 E
79 Arlington Rd I-77 SB Ramps Killian Rd Summit 1.31 E
80 SR 14/44 SR 88 SR 59 Portage 1.31 E
81 SR 82 (Aurora Rd) Olde Eight Rd SR 8 Summit 1.30 E
82 Exchange St Brown St Fountain St Summit 1.30 E
83 SR 43 Lake Martin Dr Seasons Rd Portage 1.30 E
84 Highland Rd S. Bedford Rd E. Valleyview Rd Summit 1.29 E
85 Highland Rd E. Valleyview Rd Chamberlin Rd Summit 1.29 E
86 SR 14 Price Rd Cleveland Rd Portage 1.29 E
87 Portage Trail Valley Rd State Rd Summit 1.29 E88 Graham Rd SR 8 NB Ramps Baumberger Rd Summit 1.29 E
89 SR 82 (Aurora Rd) Boyden Rd Olde Eight Rd Summit 1.29 E
90 SR 18 (W. Market St) Bryden Dr Hawkins Av Summit 1.28 E
91 Cleveland-Massillon Rd Shannon Av Gardner Blvd Summit 1.28 E
92 SR 91 (Darrow Rd) Middleton Rd Twinsburg Rd Summit 1.27 E
93 Portage Trail Northampton Rd Valley Rd Summit 1.26 E
94 SR 18 (W. Market St) Ghent Rd Miller Rd Summit 1.26 E
95 SR 14 SR 43 SR 303 (E. Leg) Portage 1.26 E
96 SR 241 (Massillon Rd) Krumroy Rd US 224 Summit 1.26 E
97 Graham Rd Fishcreek Rd Portage County Line Summit 1.25 E
98 Arlington St SR 764 (Wilbeth Rd) SR 764 (Triplett Blvd) Summit 1.25 D
99 SR 162 (Copley Rd) Jacoby Rd Schocalog Rd Summit 1.25 D
100 Waterloo Rd I-77 SB Ramps Arlington St Summit 1.25 D
101 SR 18 (W. Market St) Revere Rd Sand Run Rd Summit 1.24 D
102 SR 5/44 I-76 Prospect St Portage 1.24 D
103 Smith Rd Ghent Rd Revere Rd Summit 1.24 D104 Valleyview Rd Cuyahoga County Line Chaffee Rd Summit 1.24 D
105 Stow Rd Ravenna Rd SR 303 Summit 1.24 D
106 SR 162 (Copley Rd) Schocalog Rd White Pond Dr Summit 1.23 D
107 Stow Rd Barlow Rd Ravenna Rd Summit 1.23 D
108 Prospect St Summit Rd Hayes Rd Portage 1.23 D
109 Prospect St Hayes Rd Lake Av Portage 1.23 D
110 SR 261 (Tallmadge Av) SR 8 Glenwood Av Summit 1.23 D
111 Portage Trail 6th St 2nd St Summit 1.23 D
112 SR 619 (5th St NE) Fairview Av Paige Av Summit 1.23 D
113 SR 619 (Turkeyfoot Lake Rd) Turkeyfoot Rd S. Main St Summit 1.23 D
114 Triplett Blvd Hilbish Av Abington Rd Summit 1.22 D
115 SR 162 (Copley Rd) White Pond Dr Collier Rd Summit 1.22 D
116 Fishcreek Rd Call Rd Stow Rd Summit 1.21 D
117 SR 18 (W. Market St) Hawkins Av Twin Oaks Rd Summit 1.21 D
118 SR 44 Tallmadge Rd I-76 Portage 1.20 D
119 SR 14 I-76 Tallmadge Rd Portage 1.20 D
120 SR 43 Frost Rd Mennonite Rd Portage 1.20 D
121 Arlington St Lovers Ln I-76 EB Ramps Summit 1.20 D
122 White Pond Dr I-77 NB Ramps Frank Blvd Summit 1.20 D
123 SR 93 (Manchester Rd) Vanderhoof Rd SR 619 (Turkeyfoot Lake Rd) Summit 1.19 D
124 Graham Rd Baumberger Rd SR 91 (Darrow Rd) Summit 1.19 D
125 SR 619 (Turkeyfoot Lake Rd) Myersville Rd Stark County Line Summit 1.19 D
126 SR 18 (W. Market St) North St Maple St Summit 1.19 D
127 Portage Path Merriman Rd Portage Trail Summit 1.19 D
128 Cuyahoga Falls Av N. Main St Patterson Av Summit 1.19 D
129 Cuyahoga Falls Av Patterson Av Front St Summit 1.19 D
130 SR 91 (Darrow Rd) Highland Rd I-480 Summit 1.19 D
131 SR 93 (Manchester Rd) Center Rd Vanderhoof Rd Summit 1.18 D
132 SR 93 (Manchester Rd) Portage Lakes Dr Robinson Av Summit 1.18 D
133 Steels Corners Rd SR 8 SB Ramps Hudson Dr Summit 1.18 D
134 SR 241 (Massillon Rd) Raber Rd SR 619 (Turkeyfoot Lake Rd) Summit 1.18 D
41

8/9/2019 CMS Performance and Strategy Evaluation Report AMATS
http://slidepdf.com/reader/full/cms-performance-and-strategy-evaluation-report-amats 44/115
Table 3-2
2030 Arterial Level of Service Analysis(segments operating at LOS "D", "E", or "F")
Rank Highway From To County
Volume to
Capacity
Ratio
2030
LOS
135 SR 619 (Turkeyfoot Lake Rd) State St Turkeyfoot Rd Summit 1.18 D
136 Exchange St SR 261 (Broadway St) Grant St Summit 1.18 D
137 Cuyahoga Falls Av Front St SR 8 SB Ramps Summit 1.18 D
138 Merriman Rd/Riverview Rd Weathervane Lane Smith Rd Summit 1.18 D139 SR 306 Treat Rd Geauga County Line Portage 1.18 D
140 SR 91 (North Av) Tallmadge Cir Howe Rd Summit 1.17 D
141 SR 241 (Massillon Rd) I-77 Raber Rd Summit 1.17 D
142 SR 14 Cleveland Rd Infirmary Rd Portage 1.17 D
143 SR 14 Infirmary Rd SR 44 Portage 1.17 D
144 Tallmadge Rd Newberry St Clyde Av Summit 1.17 D
145 Prospect St Sandy Lake Rd Summit Rd Portage 1.17 D
146 SR 306 SR 43 SR 82 Portage 1.16 D
147 SR 59 (Kent Rd) Fishcreek Rd Portage County Line Summit 1.16 D
148 Broad Blvd Second St SR 8 SB Ramps Summit 1.16 D
149 SR 43 I-76 Howe Rd Portage 1.16 D
150 SR 43 Howe Rd SR 261 Portage 1.16 D
151 SR 162 (Copley Rd) Collier Rd I-77 Summit 1.16 D
152 SR 619 (Wooster Rd N) Waterloo Rd SR 619 (State St) Summit 1.16 D
153 Fairchild Av Hudson Rd SR 43 Portage 1.16 D
154 SR 14 SR 5 I-76 Portage 1.16 D155 SR 619 (Turkeyfoot Lake Rd) S. Main St Cottage Grove Rd Summit 1.16 D
156 SR 59 (E. Main St) Prospect St SR 88 (Freedom St) Portage 1.15 D
157 Arlington St SR 764 (Triplett Blvd) E. Archwood Av Summit 1.15 D
158 SR 91 (Darrow Rd) Old Mill Rd Highland Rd Summit 1.15 D
159 SR 261 (Northeast Av) N. Munroe Rd Portage County Line Summit 1.15 D
160 Wooster Rd W Johnson Rd 31st St Summit 1.15 D
161 SR 93 (Manchester Rd) Cormany Rd I-277 Summit 1.15 D
162 SR 261 Summit County Line Cherry St Portage 1.14 D
163 SR 43 (Mantua St) W. Main St Fairchild Av Portage 1.14 D
164 Highland Rd Chamberlin Rd Boyle Pkwy Summit 1.14 D
165 SR 18 (W. Market St) Portage Path S. Highland Av Summit 1.14 D
166 SR 619 (Turkeyfoot Lake Rd) Cottage Grove Rd Arlington Rd Summit 1.13 D
167 SR 241 (Massillon Rd) Mayfair Rd Killian Rd Summit 1.13 D
168 Steels Corners Rd State Rd Wyoga Lake Rd Summit 1.13 D
169 SR 619 (Wooster Rd N) I-76 WB Ramps Waterloo Rd Summit 1.13 D
170 Valleyview Rd Chaffee Rd Boyden Rd Summit 1.13 D171 SR 303 (Streetsboro St) Boston Mills Rd Atterbury Blvd Summit 1.13 D
172 SR 91 (Darrow Rd) Valleyview Rd Middleton Rd Summit 1.13 D
173 S. Main St Warner Rd N. Turkeyfoot Rd Summit 1.13 D
174 Graham Rd Wyoga Lake Rd Bailey Rd Summit 1.13 D
175 SR 43 Old Forge Rd Tallmadge Rd Portage 1.12 D
176 SR 261 (Tallmadge Av) N. Main St SR 8 Summit 1.12 D
177 Highland Rd Boyle Pkwy SR 91 (Darrow Rd) Summit 1.11 D
178 SR 619 (Turkeyfoot Lake Rd) Arlington Rd Pickle Rd Summit 1.11 D
179 SR 619 (Turkeyfoot Lake Rd) Pickle Rd SR 241 (Massillon Rd) Summit 1.11 D
180 Arlington St E. Archwood Av Lovers Ln Summit 1.11 D
181 SR 18 (W. Market St) Merriman Rd North St Summit 1.11 D
182 SR 91 (Canton Rd) Triplett Blvd SR 18 (E. Market St) Summit 1.11 D
183 31st St Wooster Rd W Shannon Av Summit 1.10 D
184 SR 93 (Manchester Rd) SR 619 (Turkeyfoot Lake Rd) State St Summit 1.10 D
185 SR 59 (Kent Rd) Hudson Dr Englewood Dr Summit 1.10 D
186 SR 43 (Mantua St) Fairchild Av Crain Av Portage 1.10 D
187 SR 59 (W. Main St) Sycamore St Chestnut St Portage 1.10 D
188 Smith Rd Revere Rd Sand Run Rd Summit 1.09 D
189 SR 43 (Water St) SR 261 Cherry St Portage 1.09 D
190 SR 43 (Water St) Cherry St Summit St Portage 1.09 D
191 SR 59 (E. Main St) Lincoln St Luther Av Portage 1.09 D
192 SR 91 (Darrow Rd) I-480 SR 82 (Aurora Rd) Summit 1.08 D
193 Prospect St SR 44 Sandy Lake Rd Portage 1.08 D
194 SR 59 (E. Main St) Chestnut St Prospect St Portage 1.08 D
195 Broad Blvd SR 8 SB Ramps Newberry St Summit 1.08 D
196 Arlington St Waterloo Rd SR 764 (Wilbeth Rd) Summit 1.08 D
197 Graham Rd Bailey Rd Hudson Dr Summit 1.08 D
198 S. Main St Caston Rd (N. Leg) SR 619 (Turkeyfoot Lake Rd) Summit 1.07 D
199 Cleveland-Massillon Rd Gardner Blvd Norton Av Summit 1.07 D
200 SR 91 (North Av/Main St) Howe Rd Munroe Falls Av Summit 1.06 D
201 Arlington St Swartz Rd Waterloo Rd Summit 1.06 D
42

8/9/2019 CMS Performance and Strategy Evaluation Report AMATS
http://slidepdf.com/reader/full/cms-performance-and-strategy-evaluation-report-amats 45/115
Table 3-2
2030 Arterial Level of Service Analysis(segments operating at LOS "D", "E", or "F")
Rank Highway From To County
Volume to
Capacity
Ratio
2030
LOS
202 Portage Trail Lillis Dr 13th St Summit 1.06 D
203 Portage Trail 13th St 6th St Summit 1.06 D
204 SR 82 (Aurora Rd) SR 8 I-271 Summit 1.06 D
205 Smith Rd Sand Run Rd Riverview Rd Summit 1.06 D206 Exchange St S. Portage Path (N. Leg) Rhodes Av Summit 1.06 D
207 S. Main St Portage Lakes Dr Warner Rd Summit 1.06 D
208 Brittain Rd Bauer Blvd Goodyear Blvd Summit 1.05 D
209 Arlington Rd Killian Rd Warner Rd Summit 1.05 D
210 SR 306 SR 82 Treat Rd Portage 1.05 D
211 SR 59 (Haymaker Pkwy) Middlebury Rd Mantua St Portage 1.05 D
212 Portage Trail 2nd St SR 8 SB Ramp Summit 1.05 D
213 SR 59 (E. Main St) Haymaker Pkwy Lincoln St Portage 1.05 D
214 S. Main St Waterloo Rd Wilbeth Rd Summit 1.04 D
215 SR 82 (Aurora Rd) I-271 S. Bedford Rd Summit 1.04 D
216 Valleyview Rd Boyden Rd Olde Eight Rd Summit 1.04 D
217 SR 91 (Darrow Rd) Graham Rd Stow Rd Summit 1.04 D
218 SR 59 (E. Main St) Horning Rd SR 261 Portage 1.04 D
219 Exchange St Elmdale Av Rose Blvd Summit 1.04 D
220 SR 82 (Aurora Rd) Cuyahoga County Line Chaffee Rd Summit 1.03 D
221 SR 91 (Darrow Rd) SR 59 (Kent Rd) Graham Rd Summit 1.03 D222 SR 303 (Streetsboro Rd) Terex Rd Boston Mills Rd Summit 1.03 D
223 SR 241 (Massillon Rd) Killian Rd Krumroy Rd Summit 1.03 D
224 SR 619 (5th St NE) SR 619 (State St) Fairview Av Summit 1.03 D
225 Ravenna Rd Chamberlin Rd SR 91 (Darrow Rd) Summit 1.02 D
226 SR 82 SR 43 SR 306 Portage 1.02 D
227 SR 91 (Canton Rd/ Darrow Rd) Gilchrist Rd Newton St Summit 1.02 D
228 State Rd Bath Rd Steels Corners Rd Summit 1.02 D
229 Canton Rd Sanitarium Rd US 224 (Waterloo Rd) Summit 1.02 D
230 SR 18 (W. Market St) Smith Rd Ghent Rd Summit 1.02 D
231 Canton Rd Killian Rd Sanitarium Rd Summit 1.01 D
232 SR 91 (Canton Rd) US 224 (Waterloo Rd) Triplett Blvd Summit 1.01 D
233 Prospect St Riddle Av Main St Portage 1.01 D
234 Prospect St Lake Av Riddle Av Portage 1.01 D
235 SR 18 (W. Market St) Twin Oaks Rd Portage Path Summit 1.01 D
236 Arlington Rd Warner Rd Krumroy Rd Summit 1.00 D
43

8/9/2019 CMS Performance and Strategy Evaluation Report AMATS
http://slidepdf.com/reader/full/cms-performance-and-strategy-evaluation-report-amats 46/115
8/9/2019 CMS Performance and Strategy Evaluation Report AMATS
http://slidepdf.com/reader/full/cms-performance-and-strategy-evaluation-report-amats 47/115
45
CHAPTER 4
INCIDENT-RELATED TRAFFIC CONGESTION
Traffic congestion is usually analyzed in terms of identifying locations where it occurs on
a daily basis. This type of congestion, which was discussed in Chapters 2 and 3, isusually referred to as recurrent congestion, and is measured by comparing averagedaily traffic volume to roadway capacity.
However, effective transportation planning also requires that transportation problemsresulting from non-recurrent (incident-related) congestion be analyzed. One means of doing this is to identify the locations of frequent traffic crashes. Locations with frequenttraffic crashes are likely to experience incident-related congestion. Locations with bothfrequent crashes and recurrent congestion will be significantly more congested.
The purpose of this chapter is to identify existing incident-related congestion on
freeways, arterials, and intersections. Incident-related congestion is identified based onthe results of crash reports previously completed by AMATS.
Freeway Traffic Crash Report
This report summarizes crashes that occurred on freeways in the AMATS area during2000, 2001, and 2002. Freeway segments were analyzed with respect to the number of crashes per mile, crash rate (crashes per million vehicle miles traveled), and crashseverity. The report was approved by AMATS in February 2004.
For the purpose of this analysis, areas of incident-related freeway congestion aredetermined based on the number of crashes per mile. This measure was used, rather than crash severity or crash rate, because the actual frequency of crashes is thedetermining factor of incident-related congestion on freeways. Once a crash hasoccurred, the severity of the crash and the level of recurrent congestion will exacerbatethe situation even further.
Freeway segments that had at least 25 annual crashes per mile are considered areassubject to incident-related freeway congestion. These segments are shown on Map 4-1(on page 47). Table 4-1 (on page 48) lists these segments ranked according to their annual crashes per mile.
Arterial Traffic Crash Report
This report summarizes non-intersection crashes that occurred on arterial roadways inthe AMATS area during 1999, 2000, and 2001. Arterial segments were analyzed withrespect to the number of crashes per mile, crash rate (crashes per million vehicle milestraveled), and crash severity. The report was approved by AMATS in October 2003.

8/9/2019 CMS Performance and Strategy Evaluation Report AMATS
http://slidepdf.com/reader/full/cms-performance-and-strategy-evaluation-report-amats 48/115
46
Similar to the freeway analysis, areas of incident-related arterial congestion aredetermined based on the number of crashes per mile. This measure was used, rather than crash severity or crash rate, because the actual frequency of crashes is thedetermining factor of incident-related congestion on arterials. Once a crash hasoccurred, the severity of the crash and the level of recurrent congestion will exacerbate
the situation even further.
Arterial segments that had at least 25 annual crashes per mile are considered areassubject to incident-related arterial congestion. These segments are shown on Map 4-2(on page 49). Table 4-2 (on page 50) lists these segments ranked according to their annual crashes per mile.
Intersection Traffic Crash Report
This report summarizes crashes that occurred at intersections in the AMATS areaduring 1999, 2000, and 2001. Intersections were analyzed with respect to the total
number of crashes, crash rate (crashes per million approach vehicles), and crashseverity. The report was approved by AMATS in September 2003.
Unlike the freeway and arterial analyses, areas of incident-related intersectioncongestion are determined based on the total number of crashes. This measure wasused, rather than crash severity or crash rate, because the actual frequency of crashesis the determining factor of incident-related congestion at intersections. Once a crashhas occurred, the severity of the crash and the level of recurrent congestion willexacerbate the situation even further.
Intersections that had at least 70 crashes in the three-year period are considered areassubject to incident-related intersection congestion. These intersections are shown onMap 4-3 (on page 51). Table 4-3 (on page 52) lists these intersections rankedaccording to the number of crashes.
Summary
Frequent traffic crashes can have a significant impact on traffic congestion, particularlywhen they occur at high volume locations that already experience recurrent congestion.These common locations of recurrent and incident-related congestion are shown onMap 4-4 (on page 53). These locations will be considered in subsequent chapters of the report.

8/9/2019 CMS Performance and Strategy Evaluation Report AMATS
http://slidepdf.com/reader/full/cms-performance-and-strategy-evaluation-report-amats 49/115
SUGAR BUSH\KNOLLS
BRADY\LAKE
NORTHFIELD
DOYLESTOWN
MOGADORE
REMINDERVILLE
SILVER\LAKE
HIRAM
GARRETTSVILLE
NEW\FRANK LIN
LAKEMORE
MANTUA
MUNROE FALLS
WINDHAM
BOSTO N\HEIGH TS
PENINSULA
CLINTON
FAIRLAWN
RAVENNA
BARBERTON
RICHFIELD
MACEDONIA
TALLMADGE
TWINSBURG
CUYAHOGA FALLS
STREETSBORO
NORTON
STOW
AURORA
HUDSON
GREEN
AKRON
KENT
8
5
8
8
5
14
91
21
82
44
59
18
43
44
21
94
21
14
44
43
59
93
91
94
44
14
43
8244 88
14
59
82
43
91
21
57
82
18
8844
305
77
77
80
80
76
76
77
77
80
76
76
76
176
764
585
532
162
261
619
303
241
306
225
604
619
183
241
183
303
261
225
261
282
303
236
303
700
277
271
480
271
480
224
422
224224
224
224
224
Map 4-1INCIDENT-RELATED FREEWAY CONGESTION
(2000-2002)
Areas of Incident-related Congestion
October 2004
0 1 2 3 4
Miles
4 7

8/9/2019 CMS Performance and Strategy Evaluation Report AMATS
http://slidepdf.com/reader/full/cms-performance-and-strategy-evaluation-report-amats 50/115
Table 4-1
Incident-Related Freeway Congestion (2000-2002)Ranked by annual crashes per mile
Section Annual
Total Length Crashes /
Rank Freeway From To Crashes (miles) Mile
1 SR 8 E Exchange St E Market St (SR 18) 434 0.60 241.11
2 SR 8 E Market St (SR 18) Perkins St (SR 59) 167 0.28 198.81
3 SR 8 Gorge Blvd Howe Ave 138 0.45 102.22
4 I-76 S Main St Wolf Ledges Pkwy 122 0.40 101.67
5 I-76 Wolf Ledges Pkwy Central Interchange 216 0.78 92.31
6 SR 8 Glenwood Ave Tallmadge Ave (SR 261) 86 0.32 89.58
7 SR 8 Perkins St (SR 59) Glenwood Ave 219 0.98 74.49
8 SR 8 I-77 (Central Interchange) E Exchange St 186 0.87 71.26
9 I-76 East Ave Innerbelt (SR 59) 145 0.72 67.13
10 SR 8 Broad Blvd Portage Trail 37 0.19 64.91
11 I-76 State St Wooster Rd N 52 0.30 57.78
12 I-76 I-77 East Ave 58 0.34 56.86
13 I-77 I-277/US 224 Waterloo Rd 52 0.32 54.17
14 I-76 Innerbelt (SR 59) S Main St 128 0.88 48.48
15 I-77 SR 21 Medina Rd (SR 18) 73 0.57 42.6916 I-77 Archwood Ave SR 8 106 0.86 41.09
17 SR 8 Howe Ave Broad Blvd 129 1.06 40.57
18 SR 8 Front St Hudson Dr 52 0.44 39.39
19 I-77 Medina Rd (SR 18) Ghent Rd 176 1.51 38.85
20 I-77 I-76 (Kenmore Leg) Wooster Ave (SR 261) 58 0.53 36.48
21 I-77 Waterloo Rd Wilbeth Rd (SR 764) 79 0.75 35.11
22 I-77 Wilbeth Rd (SR 764) Archwood Ave 48 0.46 34.78
23 I-76 Martha Ave E. Market St. (SR 18) 113 1.11 33.93
24 I-77 Arlington Rd I-277/US 224 267 2.70 32.96
25 I-77 SR 8 I-76 (Central Interchange) 43 0.44 32.58
26 SR 8 Graham Rd Steels Corners Rd 133 1.43 31.00
27 I-76 S. Arlington St Martha Ave 61 0.66 30.81
28 I-77 Wooster Ave (SR 261) Copley Rd (SR 162) 130 1.43 30.3029 I-77 Copley Rd (SR 162) White Pond Dr 108 1.19 30.25
30 SR 8 Hudson Dr Graham Rd 85 1.07 26.48
31 I-76 Central Interchange S. Arlington St 61 0.77 26.41
32 I-77 White Pond Dr Miller/Ridgewood Rd 123 1.56 26.28
33 I-77 Miller/Ridgewood Rd Cleveland-Massillon Rd 127 1.63 25.97
48

8/9/2019 CMS Performance and Strategy Evaluation Report AMATS
http://slidepdf.com/reader/full/cms-performance-and-strategy-evaluation-report-amats 51/115
SUGAR BUSH\KNOLLS
BRADY\LAKE
NORTHFIELD
DOYLESTOWN
MOGADORE
REMINDERVILLE
SILVER\LAKE
HIRAM
GARRETTSVILLE
NEW\FRANK LIN
LAKEMORE
MANTUA
MUNROE FALLS
WINDHAM
BOSTO N\HEIGH TS
PENINSULA
CLINTON
FAIRLAWN
RAVENNA
BARBERTON
RICHFIELD
MACEDONIA
TALLMADGE
TWINSBURG
CUYAHOGA FALLS
STREETSBORO
NORTON
STOW
AURORA
HUDSON
GREEN
AKRON
KENT
8
5
8
8
5
14
91
21
82
44
59
18
43
44
21
94
21
14
44
43
59
93
91
94
44
14
43
8244 88
14
59
82
43
91
21
57
82
18
8844
305
77
77
80
80
76
76
77
77
80
76
76
76
176
764
585
532
162
261
619
303
241
306
225
604
619
183
241
183
303
261
225
261
282
303
236
303
700
277
271
480
271
480
224
422
224224
224
224
224
Map 4-2INCIDENT-RELATED ARTERIAL CONGESTION
(1999-2001)
Areas of Incident-related Congestion
October 2004
0 1 2 3 4
Miles
4 9

8/9/2019 CMS Performance and Strategy Evaluation Report AMATS
http://slidepdf.com/reader/full/cms-performance-and-strategy-evaluation-report-amats 52/115
Table 4-2
Incident-Related Arterial Congestion (1999-2001)Ranked by annual crashes per mile
Section Annual
Total Length Crashes
Rank Highway Section From To Co. Location Crashes (miles) per Mile
1 N Main St (SR 91) Streetsboro St (SR303) Aurora St S Hudson 50 0.15 111.11
2 Howe Av Cuyahoga WCL Main St S Cuyahoga Falls 63 0.23 91.30
3 Medina Rd (SR 18) I-77 underpass Cleveland-Massillon Rd S Bath 128 0.70 60.95
4 Graham Rd Hudson Dr Silver Lake WCL S Stow/Cuy Falls 75 0.44 56.825 W Market St (SR 18) Ghent Rd Miller Rd S Fairlawn 50 0.30 55.56
6 W Market St (SR 18) Cleveland-Massillon Rd Ghent Rd S Fairlawn 171 1.28 44.53
7 SR 14 SR 59 SR 5 P Ravenna Twp 48 0.39 41.03
8 Steels Corners Rd SR 8 Hudson Dr S Stow 24 0.20 40.00
9 Arlington Rd Turkeyfoot Lake Rd (SR619) I-77/Green NCL S Green 110 0.95 38.60
10 E Main St (SR 59) Willow St Luther Av P Kent 46 0.41 37.40
11 Arlington Rd I-77/Green NCL Killian Rd S Springfield 69 0.62 37.10
12 Broad Bl Second St Newberry St S Cuyahoga Falls 31 0.29 35.63
13 W Market St (SR 18) Miller Rd Fairlawn ECL S Fairlawn 72 0.68 35.29
14 Canton Rd Sanitarium Rd Waterloo Rd (US224) S Springfield 105 1.00 35.00
15 E Main St Water St Willow St P Kent 27 0.27 33.33
16 S Arlington St E Waterloo Rd E Wilbeth Rd (SR764) S Akron 68 0.70 32.38
17 Canton Rd (SR 91) Akron SCL Triplett Blvd S Akron 32 0.33 32.32
18 W Streetsboro St (SR 303) Boston Mills Rd Main St (SR 91) S Hudson 52 0.54 32.10
19 W Exchange St Rhodes Ave Rand Ave S Akron 50 0.53 31.4520 Darrow Rd (SR 91) E Highland Rd Aurora Rd (SR 82) S Twinsburg 84 0.95 29.47
21 E Main St (SR 59) Horning Rd Alpha Dr/Kent ECL P Kent 44 0.50 29.33
22 Canton Rd (SR 91) Waterloo Rd (US224) Akron SCL S Springfield 62 0.72 28.70
23 S Cleveland-Massillon Rd Barberton NCL Greenwich Rd S Norton 57 0.68 27.94
24 SR 43 I-76 Kent SCL/Meloy Rd P Brimfield Twp 134 1.61 27.74
25 W Main St (SR 59) Spaulding Dr Longmere Dr P Kent 40 0.50 26.67
26 SR 44 Tallmadge Rd SR 5 P Rootstown Twp 50 0.63 26.46
27 SR 59 Alpha Dr SR261 P Franklin Twp 31 0.41 25.20
28 Wooster Av (SR 261) Romig Rd S Hawkins Ave S Akron 58 0.77 25.11
29 Steels Corners Rd Stow WCL SR 8 S Stow 48 0.64 25.00
50

8/9/2019 CMS Performance and Strategy Evaluation Report AMATS
http://slidepdf.com/reader/full/cms-performance-and-strategy-evaluation-report-amats 53/115
SUGAR BUSH\KNOLLS
BRADY\LAKE
NORTHFIELD
DOYLESTOWN
MOGADORE
REMINDERVILLE
SILVER\LAKE
HIRAM
GARRETTSVILLE
NEW\FRANK LIN
LAKEMORE
MANTUA
MUNROE FALLS
WINDHAM
BOSTO N\HEIGH TS
PENINSULA
CLINTON
FAIRLAWN
RAVENNA
BARBERTON
RICHFIELD
MACEDONIA
TALLMADGE
TWINSBURG
CUYAHOGA FALLS
STREETSBORO
NORTON
STOW
AURORA
HUDSON
GREEN
AKRON
KENT
8
5
8
8
5
14
91
21
82
44
59
18
43
44
21
94
21
14
44
43
59
93
91
94
44
14
43
8244 88
14
59
82
43
91
21
57
82
18
8844
305
77
77
80
80
76
76
77
77
80
76
76
76
176
764
585
532
162
261
619
303
241
306
225
604
619
183
241
183
303
261
225
261
282
303
236
303
700
277
271
480
271
480
224
422
224224
224
224
224
Map 4-3INCIDENT-RELATED INTERSECTION CONGESTION
(1999-2001)Areas of Incident-related Congestion
October 2004
0 1 2 3 4
Miles
5 1

8/9/2019 CMS Performance and Strategy Evaluation Report AMATS
http://slidepdf.com/reader/full/cms-performance-and-strategy-evaluation-report-amats 54/115
Table 4-3
Incident-Related Intersection Congestion (1999-2001)Ranked by number of crashes
Total
Rank Street Intersecting Street County Political Unit Crashes
1 Tallmadge Circle Summit Tallmadge 314
2 Howe Ave Main St Summit Cuy Falls 182
3 SR 8 E Highland Rd Summit Macedonia 142
4 SR 8 Boston Mills Rd Summit Boston Heights 134
5 US 224 Canton Rd (SR 91) Summit Springfield Twp 132
6 Darrow Rd (SR 91) Graham Rd Summit Stow 126
7 Fishcreek Rd Graham Rd Summit Stow 121
8 Bailey/Brittain Rd Howe Av/Tallmadge Rd Summit Cuy Falls 116
9 W Market St (SR 18) Cleveland-Massillon Rd Summit Fairlawn 115
10 S Arlington Rd Killian Rd Summit Coventry Twp 95
11 E Waterloo Rd (US 224) G Washington Blvd (SR 241) Summit Akron 92
11 Front St (SR 59) Hudson Dr Summit Cuy Falls 92
13 E Turkeyfoot Lake Rd (SR 619) S Arlington Rd Summit Green 81
14 Broad Blvd State Rd Summit Cuy Falls 79
14 W Portage Trail State Rd Summit Cuy Falls 79
16 W Portage Trail 2nd St Summit Cuy Falls 7717 S Arlington St E Waterloo Rd Summit Akron 75
18 Turkeyfoot Lake Rd (SR 619) S Main St Summit Green 73
19 E Tallmadge Ave (SR 261) Brittain Rd Summit Akron 72
20 Aurora Rd (SR 43) W Garfield Rd (SR 82) Portage Aurora 70
52
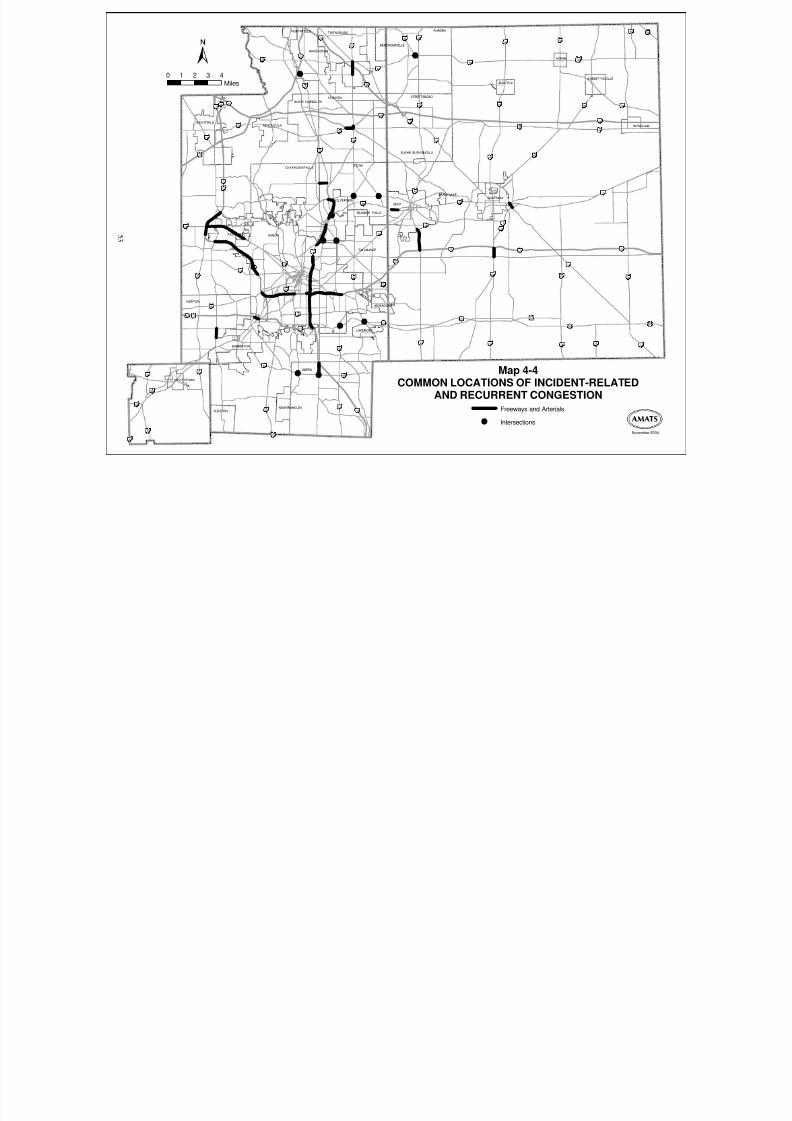
8/9/2019 CMS Performance and Strategy Evaluation Report AMATS
http://slidepdf.com/reader/full/cms-performance-and-strategy-evaluation-report-amats 55/115
SUGAR BUSH\KNOLLS
BRADY\LAKE
NORTHFIELD
DOYLESTOWN
MOGADORE
REMINDERVILLE
SILVER\LAKE
HIRAM
GARRETTSVILLE
NEW\FRANK LIN
LAKEMORE
MANTUA
MUNROE FALLS
WINDHAM
BOSTO N\HEIGH TS
PENINSULA
CLINTON
FAIRLAWN
RAVENNA
BARBERTON
RICHFIELD
MACEDONIA
TALLMADGE
TWINSBURG
CUYAHOGA FALLS
STREETSBORO
NORTON
STOW
AURORA
HUDSON
GREEN
AKRON
KENT
8
5
8
8
5
14
91
21
82
44
59
18
43
44
21
94
21
14
44
43
59
93
91
94
44
14
43
8244 88
14
59
82
43
91
21
57
82
18
8844
305
77
77
80
80
76
76
77
77
80
76
76
76
176
764
585
532
162
261
619
303
241
306
225
604
619
183
241
183
303
261
225
261
282
303
236
303
700
277
271
480
271
480
224
422
224224
224
224
224
Map 4-4COMMON LOCATIONS OF INCIDENT-RELATED
AND RECURRENT CONGESTIONFreeways and Arterials
Intersections
November 2004
0 1 2 3 4
Miles
5 3

8/9/2019 CMS Performance and Strategy Evaluation Report AMATS
http://slidepdf.com/reader/full/cms-performance-and-strategy-evaluation-report-amats 56/115
54

8/9/2019 CMS Performance and Strategy Evaluation Report AMATS
http://slidepdf.com/reader/full/cms-performance-and-strategy-evaluation-report-amats 57/115
55
CHAPTER 5
IDENTIFYING CMS ALTERNATIVES
In earlier chapters, areas of existing and future traffic congestion were identified on
roadways included in the AMATS Congestion Management System (CMS). The nextstep in the CMS process is to identify appropriate strategies for reducing trafficcongestion along these roadways.
Alternatives are identified and evaluated in a two-step process. The first step includes ascreening of possible congestion management strategies, eliminating those that are
judged to be infeasible, and identifying appropriate project alternatives. The secondstep of the process involves evaluating these project alternatives and determiningcongestion management recommendations.
This chapter focuses on the first step of this process. It discusses and evaluates
potential CMS strategies and identifies project alternatives for each congested roadway.Chapter 6 focuses on the second step, evaluating the effectiveness of each projectalternative.
CMS Strategies
CMS strategies are capital improvements, operational improvements, or policy actionsthat can be implemented to reduce traffic congestion. Federal regulations require thatfive strategies be evaluated as part of a Congestion Management System. These fivestrategies are: 1) Transportation Demand Management; 2) Public TransportationImprovements; 3) Intelligent Transportation Systems (ITS); 4) Traffic OperationalImprovements; and 5) Additional Highway Capacity.
These strategies are described in greater detail in the following section:
1) Transportation Demand Management consists of strategies which managecongestion by modifying trip-making behavior. These strategies include:
• Alternative work hours• Bicycle facilities• Carpooling• Congestion pricing (i.e. tolls)•
Employer trip-reduction ordinances• Growth management (e.g. land use policies/regulations)• Parking management• Pedestrian facilities• Telecommuting• Vanpooling

8/9/2019 CMS Performance and Strategy Evaluation Report AMATS
http://slidepdf.com/reader/full/cms-performance-and-strategy-evaluation-report-amats 58/115
56
2) Public Transportation Improvements manage congestion by promoting transitridership as an alternative to driving alone. These improvements include:
• Enhancement of existing transit services• Exclusive bus and other High Occupancy Vehicle (HOV) lanes
• Extension of existing transit services• Fare reductions• Improved paratransit services• Park-and-ride lots• Passenger rail• Traffic signal preemption for transit vehicles
3) Intelligent Transportation Systems use advanced technologies to make moreefficient use of the existing transportation system. They include:
• Freeway and incident management systems• Public transportation systems (e.g. automatic vehicle location systems, electronic
fare payment)• Traffic signal coordination systems• Traveler information systems
4) Traffic Operational Improvements manage congestion by optimizing the operationof the existing roadway without adding through traffic lanes. They include the following:
• Access management• Intersection improvements (e.g. adding turn lanes, improving geometrics)• Median turn lanes• Parking modifications• Reconstructing roadways to standard lane widths• Traffic signal improvements
5) Additional Highway Capacity reduces congestion by providing new transportationfacilities or by expanding existing transportation facilities. These improvements include:
• Constructing additional through lanes• Constructing new roadways• Eliminating at-grade intersections•
Reconfiguring freeway ramps and interchanges
Strategy Evaluation
The CMS strategies previously discussed have been considered as potentialalternatives for reducing traffic congestion. These strategies were examined in detail bythe AMATS Plan Update Subcommittee during the development of previous congestion
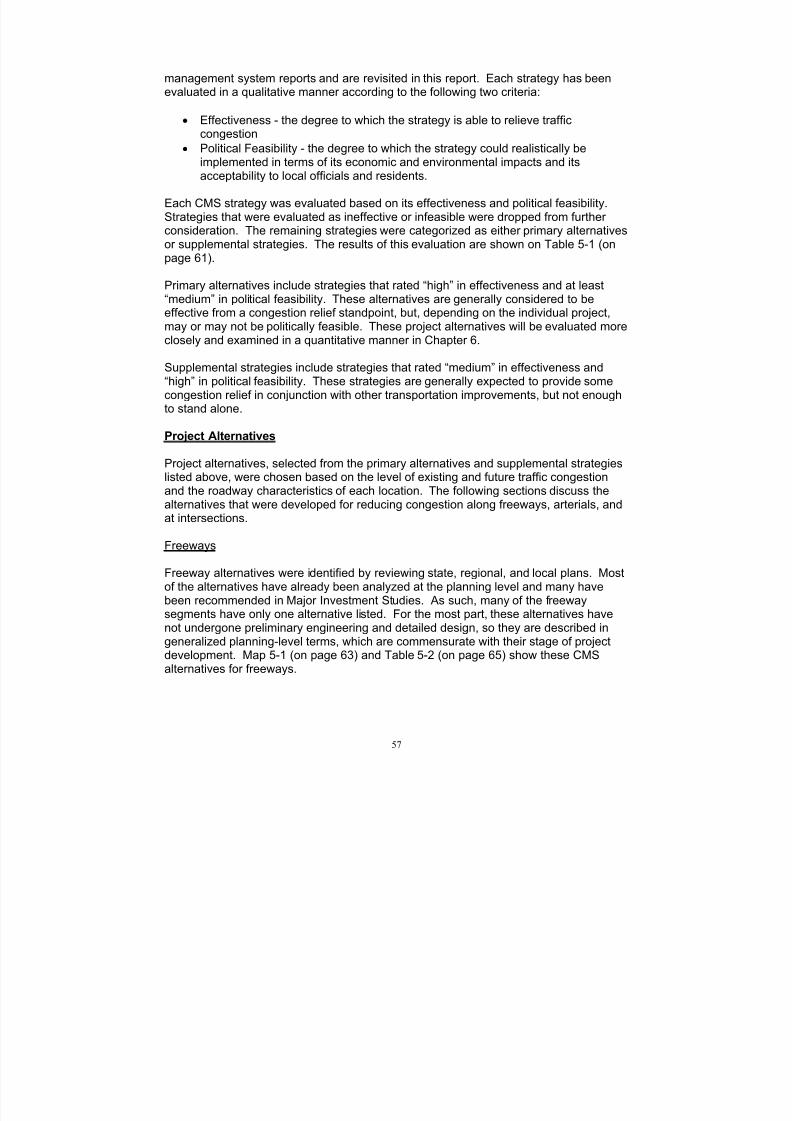
8/9/2019 CMS Performance and Strategy Evaluation Report AMATS
http://slidepdf.com/reader/full/cms-performance-and-strategy-evaluation-report-amats 59/115
57
management system reports and are revisited in this report. Each strategy has beenevaluated in a qualitative manner according to the following two criteria:
• Effectiveness - the degree to which the strategy is able to relieve trafficcongestion
•
Political Feasibility - the degree to which the strategy could realistically beimplemented in terms of its economic and environmental impacts and itsacceptability to local officials and residents.
Each CMS strategy was evaluated based on its effectiveness and political feasibility.Strategies that were evaluated as ineffective or infeasible were dropped from further consideration. The remaining strategies were categorized as either primary alternativesor supplemental strategies. The results of this evaluation are shown on Table 5-1 (onpage 61).
Primary alternatives include strategies that rated “high” in effectiveness and at least
“medium” in political feasibility. These alternatives are generally considered to beeffective from a congestion relief standpoint, but, depending on the individual project,may or may not be politically feasible. These project alternatives will be evaluated moreclosely and examined in a quantitative manner in Chapter 6.
Supplemental strategies include strategies that rated “medium” in effectiveness and“high” in political feasibility. These strategies are generally expected to provide somecongestion relief in conjunction with other transportation improvements, but not enoughto stand alone.
Project Alternatives
Project alternatives, selected from the primary alternatives and supplemental strategieslisted above, were chosen based on the level of existing and future traffic congestionand the roadway characteristics of each location. The following sections discuss thealternatives that were developed for reducing congestion along freeways, arterials, andat intersections.
Freeways
Freeway alternatives were identified by reviewing state, regional, and local plans. Mostof the alternatives have already been analyzed at the planning level and many have
been recommended in Major Investment Studies. As such, many of the freewaysegments have only one alternative listed. For the most part, these alternatives havenot undergone preliminary engineering and detailed design, so they are described ingeneralized planning-level terms, which are commensurate with their stage of projectdevelopment. Map 5-1 (on page 63) and Table 5-2 (on page 65) show these CMSalternatives for freeways.

8/9/2019 CMS Performance and Strategy Evaluation Report AMATS
http://slidepdf.com/reader/full/cms-performance-and-strategy-evaluation-report-amats 60/115
58
Three primary alternatives were considered to be potentially effective and politicallyfeasible on freeways:
• Constructing additional through lanes. This alternative expands roadwaycapacity by adding through lanes. It is usually considered on segments that
operate at LOS E or LOS F.• Constructing new roadways. This alternative expands capacity by constructing
new facilities in order to relieve congestion on existing roadways. It is usuallyconsidered when constructing additional lanes no longer appears to be a viableoption.
• Reconfiguring freeway ramps and interchanges. This alternative includeschanges to the current ramp configuration, adding or eliminating ramps, or completely redesigning access along the freeway segment.
Three supplemental strategies were considered to be potentially effective and politicallyfeasible on freeways:
• Enhancement of existing transit services. This alternative increases thefrequency of existing express bus service in order to increase transit ridership.
• Park-and-ride lots. This alternative expands park-and-ride lots to make transitservice more accessible.
• Freeway and incident management systems. This alternative usestechnology such as cameras, changeable message signs, and improvedcommunication with emergency responders in order to reduce response time,manage freeway congestion, and provide traveler information.
Arterials
Arterial alternatives were identified by reviewing state, regional, and local plans. Mostof these arterial segments have not undergone any detailed study or analysis. As such,many of them have more than one alternative listed. The alternatives are described ingeneralized planning-level terms. Map 5-2 (on page 67) and Table 5-3 (on pages 69-73) show these CMS alternatives for arterials.
Six primary alternatives were considered to be potentially effective and politicallyfeasible on arterials:
• Intersection Improvements. This alternative includes improvements such as
adding turn lanes, adding through lanes, improving intersection geometry, andrevising signal timing.
• Median turn lanes. This alternative adds median turn lanes to improve safetyfor turning vehicles and improve the flow of through traffic.
• Traffic signal improvements. This alternative includes improvements such asupgrading existing signals from electromechanical to microprocessor control,installing closed loop or other coordinated traffic signal systems, or revisingsignal timing.

8/9/2019 CMS Performance and Strategy Evaluation Report AMATS
http://slidepdf.com/reader/full/cms-performance-and-strategy-evaluation-report-amats 61/115
59
• Constructing additional through lanes. This alternative expands capacity byadding through lanes. It is usually considered on segments that operate at LOSE or LOS F.
• Constructing new roadways. This alternative expands capacity by constructingnew roadways in order to relieve congestion on existing roadways. It is usually
considered when constructing additional lanes no longer appears to be a viableoption.• Eliminating at-grade intersections. This alternative removes at-grade
intersections and replaces them with bridges and possibly ramps. Thisalternative is considered on arterials that are being upgraded to freewaystandards.
Three supplemental strategies were considered to be potentially effective and politicallyfeasible on arterials:
• Access management . This alternative limits access points along a roadway in
order to minimize turning movements and vehicle conflicts.• Parking modifications. This alternative changes the type of parking available
(e.g. removing angled parking and replacing it with parallel parking) or removesthe parking completely.
• Reconstructing roadways to standard lane widths. This alternativereconstructs roadways to provide standard lane and shoulder widths in keepingwith current design standards.
Intersections
Intersection alternatives were identified by reviewing state, regional, and local plans.
Most of these intersections have not undergone any detailed study or analysis. Thealternatives are described in generalized planning-level terms. Map 5-3 (on page 75)and Table 5-4 (on page 77) show these CMS alternatives for intersections.
Two primary alternatives were considered potentially effective and politically feasible atintersections:
• Intersection improvements. This alternative includes improvements such asadding turn lanes, adding through lanes, improving intersection geometry,revising signal timing, or realigning offset intersections.
• Constructing new roadways. This alternative reduces the traffic volumes at an
intersection by constructing new roadways to bypass the intersection. It isusually considered when constructing additional intersection lanes no longer appears to be a viable option.
System Alternatives
System alternatives were selected from the supplemental strategies identified in Table5-1 (on page 61). These alternatives help reduce congestion on a systemwide basis in

8/9/2019 CMS Performance and Strategy Evaluation Report AMATS
http://slidepdf.com/reader/full/cms-performance-and-strategy-evaluation-report-amats 62/115
60
the AMATS area. Five system alternatives were considered to be potentially effectiveand politically feasible:
• Carpooling . This alternative includes programs, such as AMATS Rideshare!,that encourage people to drive to work together in order to reduce the number of
vehicles on the roadway.• Vanpooling . This alternative includes programs, such as AMATS Rideshare!,
that encourage people to drive to work together in a van in order to reduce thenumber of vehicles on the roadway.
• Enhancement of existing transit services. This alternative increases thefrequency of existing local bus service in order to increase transit ridership.
• Park-and-ride lots. This alternative adds or expands park-and-ride lots in order to make transit, carpooling, and vanpooling more convenient.
• Access management . This alternative limits access points along roadways inorder to minimize turning movements and vehicle conflicts.
Summary
In this chapter, a variety of congestion management strategies are considered andevaluated as to their effectiveness and political feasibility. Certain strategies consideredearlier in the chapter are judged to be ineffective or infeasible from a social, economic,or environmental standpoint, and have been eliminated from further consideration. Theremaining strategies have been linked with previously identified congestion problems onfreeways, arterials, and at intersections to determine project alternatives. Systemalternatives have also been identified as an overall supplement to the projectalternatives. These alternatives will help reduce congestion on a systemwide basis.
The CMS alternatives that have been identified in this chapter will be evaluated inChapter 6 to determine their effectiveness and political feasibility at the project level.This information will then be used in Chapter 7 to determine the CMS recommendationsfor the AMATS area.

8/9/2019 CMS Performance and Strategy Evaluation Report AMATS
http://slidepdf.com/reader/full/cms-performance-and-strategy-evaluation-report-amats 63/115
Table 5-1
Evaluation of Congestion Management System Strategi
Effectiveness
Political
Feasibilty
Primary
Alternative
Su
Alternative work hours Low Low
Bicycle facilities Low High
Carpooling Medium HighCongestion pricing Medium Low
Employer trip-reduction ordinances Medium Low
Growth management Medium Low
Parking management Low Low
Pedestrian facilities Low High
Telecommuting Medium Medium
Vanpooling Medium High
Enhancement of existing transit services Medium High
Exclusive bus and other High Occupancy Vehicle (HOV) lanes Low Low
Extension of existing transit services Low Medium
Fare reductions Low Medium
Improved paratransit services Low HighPark-and-Ride lots Medium High
Passenger Rail Medium Medium
Traffic signal preemption for transit vehicles Low Medium
Freeway and incident management systems Medium High
Public transportation systems Low Medium
Traffic signal coordination systems High High √
Traveler information systems Low Medium
Access management Medium High
Intersection improvements High High √
Median turn lanes High High √
Parking modifications Medium HighReconstructing roadways to standard lane widths Medium High
Traffic signal improvements High High √
Constructing additional through lanes High Medium √
Constructing new roadways High Medium √
Eliminating at-grade intersections High High √
Reconfiguring freeway ramps and interchanges High Medium √
Traffic Operational Improvements
Additional Highway Capacity
Strategy
Transportation Demand Management
Public Transportation Improvements
Intelligent Transportation Systems

8/9/2019 CMS Performance and Strategy Evaluation Report AMATS
http://slidepdf.com/reader/full/cms-performance-and-strategy-evaluation-report-amats 64/115

8/9/2019 CMS Performance and Strategy Evaluation Report AMATS
http://slidepdf.com/reader/full/cms-performance-and-strategy-evaluation-report-amats 65/115
8
5
8
8
5
14
91
21
82
44
59
18
43
44
21
94
21
14
44
43
59
93
91
94
44
14
43
8244 88
14
59
82
43
91
21
57
82
18
8844
305
77
77
80
80
76
76
77
77
80
76
76
76
176
764
585
532
162
261
619
303
241
306
225
604
619
183
241
183
303
261
225
261
282
303
236
303
700
277
271
480
271
480
224
422
224224
224
224
224
Map 5-1CONGESTION MANAGEMENT SYSTEM
ALTERNATIVES - FREEWAYSMore Frequent Express Bus Service
Additional Lanes, Reconfigure access and ITS
Additional Lanes and ITS
Reconfigure access and ITS
Reconfigure Interchange
ITS-Freeway Management System
New Facility
Expand Park and Ride LotOctober 2004
0 1 2 3 4Miles
6 3

8/9/2019 CMS Performance and Strategy Evaluation Report AMATS
http://slidepdf.com/reader/full/cms-performance-and-strategy-evaluation-report-amats 66/115
64
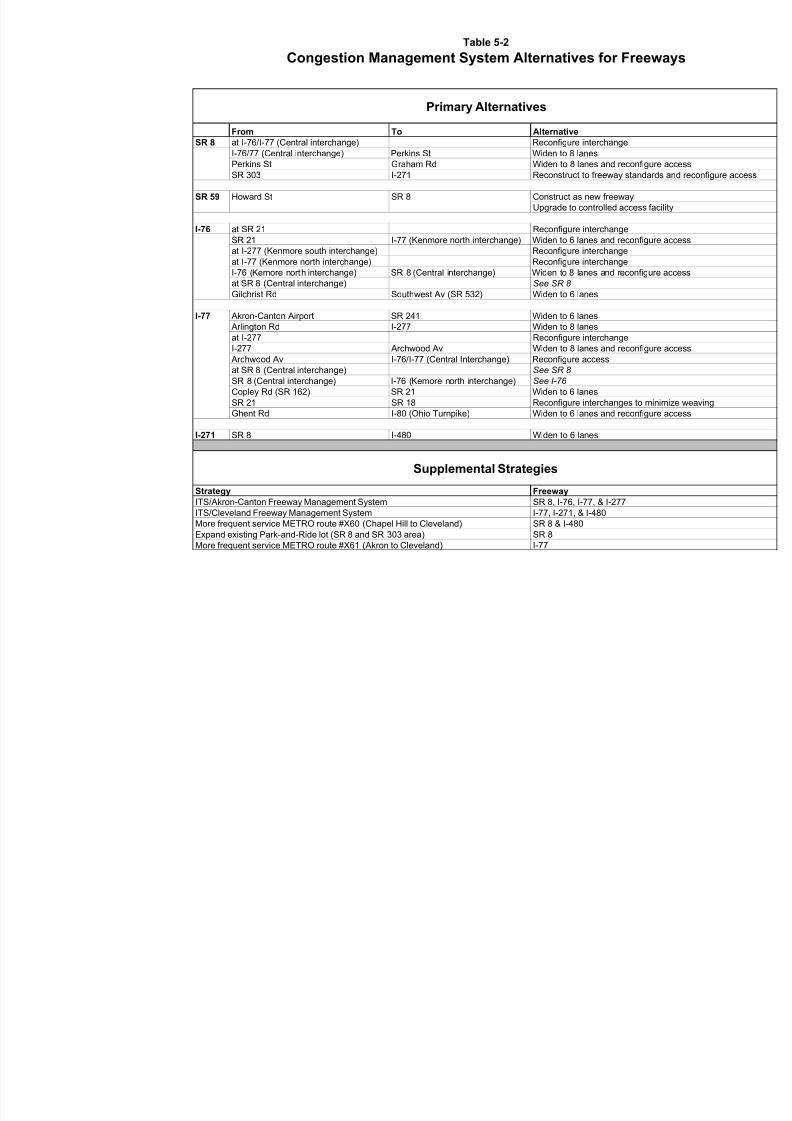
8/9/2019 CMS Performance and Strategy Evaluation Report AMATS
http://slidepdf.com/reader/full/cms-performance-and-strategy-evaluation-report-amats 67/115
Table 5-2
Congestion Management System Alternatives for Freew
From To Alternative
SR 8 at I-76/I-77 (Central interchange) Reconfigure interchange
I-76/77 (Central interchange) Perkins St Widen to 8 lanesPerkins St Graham Rd Widen to 8 lanes and reconfigure
SR 303 I-271 Reconstruct to freeway standards
SR 59 Howard St SR 8 Construct as new freeway
Upgrade to controlled access fac
I-76 at SR 21 Reconfigure interchange
SR 21 I-77 (Kenmore north interchange) Widen to 6 lanes and reconfigure
at I-277 (Kenmore south interchange) Reconfigure interchange
at I-77 (Kenmore north interchange) Reconfigure interchange
I-76 (Kemore north interchange) SR 8 (Central interchange) Widen to 8 lanes and reconfigure
at SR 8 (Central interchange) See SR 8
Gilchrist Rd Southwest Av (SR 532) Widen to 6 lanes
I-77 Akron-Canton Airport SR 241 Widen to 6 lanes
Arlington Rd I-277 Widen to 8 lanes
at I-277 Reconfigure interchange
I-277 Archwood Av Widen to 8 lanes and reconfigure
Archwood Av I-76/I-77 (Central Interchange) Reconfigure access
at SR 8 (Central interchange) See SR 8
SR 8 (Central interchange) I-76 (Kemore north interchange) See I-76
Copley Rd (SR 162) SR 21 Widen to 6 lanes
SR 21 SR 18 Reconfigure interchanges to mini
Ghent Rd I-80 (Ohio Turnpike) Widen to 6 lanes and reconfigure
I-271 SR 8 I-480 Widen to 6 lanes
Freeway
SR 8, I-76, I-77, & I-277
I-77, I-271, & I-480
SR 8 & I-480
SR 8
I-77
Primary Alternatives
Supplemental Strategies
Strategy
More frequent service METRO route #X61 (Akron to Cleveland)
ITS/Akron-Canton Freeway Management System
ITS/Cleveland Freeway Management System
More frequent service METRO route #X60 (Chapel Hill to Cleveland)
Expand existing Park-and-Ride lot (SR 8 and SR 303 area)

8/9/2019 CMS Performance and Strategy Evaluation Report AMATS
http://slidepdf.com/reader/full/cms-performance-and-strategy-evaluation-report-amats 68/115
66
8/9/2019 CMS Performance and Strategy Evaluation Report AMATS
http://slidepdf.com/reader/full/cms-performance-and-strategy-evaluation-report-amats 69/115
8
5
8
8
5
14
91
21
82
44
59
18
43
44
21
94
21
14
44
43
59
93
91
94
44
14
43
8244 88
14
59
82
43
91
21
57
82
18
8844
305
77
77
80
80
76
76
77
77
80
76
76
76
176
764
585
532
162
261
619
303
241
306
225
604
619
183
241
183
303
261
225
261
282
303
236
303
700
277
271
480
271
480
224
422
224224
224
224
224
Map 5-2CONGESTION MANAGEMENT SYSTEM
ALTERNATIVES - ARTERIALS
November 2004
0 1 2 3 4Miles
Additional Highway Capacity
Traffic Operational Improvements
6 7

8/9/2019 CMS Performance and Strategy Evaluation Report AMATS
http://slidepdf.com/reader/full/cms-performance-and-strategy-evaluation-report-amats 70/115
68

8/9/2019 CMS Performance and Strategy Evaluation Report AMATS
http://slidepdf.com/reader/full/cms-performance-and-strategy-evaluation-report-amats 71/115
Table 5-3
Congestion Management System Alternatives for ArterialsHighway From To Alternative
SR 14 I-80 SR 303 (W. leg) Widen to 6 lanes
Connect Phillip Pkwy to Ethan Dr (truck bypass)
SR 303 (E. leg) Cleveland Rd Turn lanes (where warranted)
Widen to 4 lanes and turn lanes (where warranted)
Cleveland Rd SR 44 Turn lanes (where warranted)
Widen to 4 lanes and turn lanes (where warranted)
SR 88 SR 5 Turn lanes (where warranted)
Widen to 4 lanes and turn lanes (where warranted)
SR 5 Tallmadge Rd Turn lanes (where warranted)
Widen to 4 lanes and turn lanes (where warranted)
SR 18 Medina county line I-77 Turn lanes (where warranted) and access management
Widen to 6 lanes and access management
Widen to 6 lanes, turn lanes (where warranted), and access management
I-77 Smith Rd Access management
Smith Rd Ghent Rd Reconstruct to standard lanes and access management
Ghent Rd Revere Rd Access management
Revere Rd Wheaton Rd Continue to monitor
Wheaton Rd Pershing Av Turn lanes (where warranted) and reconstruct to standard lanes
Pershing Av Twin Oaks Rd Turn lanes (where warranted), reconstruct to standard lanes, and signal coordination
Twin Oaks Rd Rose Blvd Turn lanes (where warranted)
Twin Oaks Rd Portage Path Widen to 4 lanes and signal coordination
Widen to 4 lanes, turn lanes (where warranted), and signal coordination
Portage Path S. Highland Av Remove angled parking and replace with parallel parking
S. Highland Av Maple St Access management
SR 43 Old Forge Rd Tallmadge Rd Reconstruct to standard lanes
Turn lanes (where warranted) and reconstruct to standard lanes
Tallmadge Rd Meloy Rd Widen to 4 lanes and turn lanes (where warranted)
SR 261 Summit St Turn lanes (where warranted) and reconstruct to standard lanes
Turn lanes (where warranted), reconstruct to standard lanes, and signal coordination
W. Main St Fairchild Av Eliminate on-street parking during peak
Continue to monitor
Kent North Corp. Ravenna Rd (W. Leg) Turn lanes (where warranted)
Widen to 4 lanes and turn lanes (where warranted)
Ravenna Rd (W. Leg) SR 14/303 Turn lanes (where warranted) and access management
Widen to 4 lanes, turn lanes (where warranted), and access management
Market Square Frost Rd Turn lanes (where warranted)
Widen to 4 lanes and turn lanes (where warranted)
Frost Rd Mennonite Rd Turn lanes (where warranted)
Widen to 4 lanes and turn lanes (where warranted)
Mennonite Rd SR 306 Turn lanes (where warranted)
Widen to 4 lanes and turn lanes (where warranted)
SR 306 SR 82 Turn lanes (where warranted)
Widen to 4 lanes and turn lanes (where warranted)
SR 82 Treat Rd Turn lanes (where warranted)
Widen to 4 lanes and turn lanes (where warranted)
Treat Rd Geauga County Line Turn lanes (where warranted)
Continue to monitor
SR 44 Tallmadge Rd I-76 Signal coordination
Widen to 4 lanes and turn lanes (where warranted)
Widen to 4 lanes, turn lanes (where warranted), and signal coordination
I-76 Prospect St Continue to monitor
SR 59 Oak Park Blvd Englewood Dr Turn lanes (where warranted)
Baird Rd Deidrick Rd Turn lanes (where warranted) and signal coordination
Deidrick Rd Longmere Dr Turn lanes (where warranted) and reconstruct to standard lanes
Turn lanes (where warranted), reconstruct to standard lanes, and signal coordination
Longmere Dr Mantua St Signal coordinationS. Water St (SR 43) Willow St Signal coordination
Willow St Horning Rd Signal coordination
Horning Rd SR 261 Signal coordination
SR 261 Menough Rd Median turn lane from Powder Mill Rd to Menough Rd
Widen to 4 lanes and turn lanes (where warranted)
Sycamore St Freedom St (SR 88) Turn lanes (where warranted) and remove angled parking and replace with parallel
parking
Turn lanes (where warranted), remove angled parking and replace with parallel parking,
and signal coordination
69

8/9/2019 CMS Performance and Strategy Evaluation Report AMATS
http://slidepdf.com/reader/full/cms-performance-and-strategy-evaluation-report-amats 72/115
Table 5-3
Congestion Management System Alternatives for ArterialsHighway From To Alternative
SR 82 Cuyahoga County Line SR 8 Turn lanes (where warranted) and signal coordination
Widen to 4 lanes, turn lanes (where warranted), and signal coordination
SR 8 S. Bedford Rd Access management
S. Bedford Rd Crow Dr Widen to 4 lanes and turn lanes (where warranted)
Signal coordination
Crow Dr Chamberlin Rd Turn lanes (where warranted)
Widen to 4 lanes and turn lanes (where warranted)
SR 43 SR 306 Turn lanes (where warranted)
SR 91 US 224 (Waterloo Rd) E. Market St (SR 18) Signal coordination
Turn lanes (where warranted) and reconstruct to standard lanes
Gilchrist Rd North of Eastwood Av Signal coordination
Continue to monitor
Tallmadge Cir Howe Rd Turn lanes (where warranted)
Howe Rd Northmoreland Av Turn lanes (where warranted)
Widen to 4 lanes and turn lanes (where warranted)
Northmoreland Av North River Rd Turn lanes (where warranted)
Widen to 4 lanes and turn lanes (where warranted)
Widen to 4 lanes, turn lanes (where warranted), and signal coordination
North River Rd Kent Rd (SR 59) Turn lanes (where warranted)
Widen to 4 lanes and turn lanes (where warranted)
Kent Rd (SR 59) City Center Blvd Turn lanes (where warranted), reconstruct to standard lanes, and signal coordination
Continue to monitor
Hudson Dr SR 303 Turn lanes (where warranted) and signal coordination
Widen to 4 lanes and turn lanes (where warranted)Widen to 4 lanes, turn lanes (where warranted), and signal coordination
SR 303 Owen Brown St Turn lanes (where warranted), reconstruct to standard lanes, remove angled parking
(replace with parallel parking), and signal coordination
Widen to 4 lanes, turn lanes (where warranted), remove angled parking (replace with
parallel parking), and signal coordination
Owen Brown St Valleyview Rd Turn lanes (where warranted)
Widen to 4 lanes and turn lanes (where warranted)
Valleyview Rd Twinsburg Rd Turn lanes (where warranted)
Widen to 4 lanes and turn lanes (where warranted)
Old Mill Rd I-480 Signal coordination
I-480 Ravenna Rd Turn lanes (where warranted) and signal coordination
Ravenna Rd Post Rd Turn lanes (where warranted)
Widen to 4 lanes and turn lanes (where warranted)
Post Rd Cuyahoga County Line Turn lanes (where warranted) and signal coordination
Widen to 4 lanes, turn lanes (where warranted), and signal coordination
SR 93 Center Rd SR 619 Turn lanes (where warranted) and reconstruct to standard lanes
SR 619 State St Turn lanes (where warranted)
State St Robinson Av Turn lanes (where warranted)
Widen to 4 lanes and turn lanes (where warranted)
Robinson Av Cormany Rd Widen to 4 lanes and turn lanes (where warranted)
Carnegie Av Waterloo Rd Turn lanes (where warranted), access management, and signal coordination
SR 162 Cleveland-Massillon Rd I-77 Turn lanes (where warranted) and reconstruct to standard lanes
Turn lanes (where warranted), reconstruct to standard lanes, and improve horizontal
geometry
SR 241 Greensburg Rd Steese Rd Turn lanes (where warranted)
Widen to 4 lanes and turn lanes (where warranted)
Steese Rd Graybill Rd Turn lanes (where warranted)
Widen to 4 lanes and turn lanes (where warranted)
Widen to 4 lanes, turn lanes (where warranted), and signal coordination
Graybill Rd Raber Rd Signal coordination
Raber Rd SR 619 Turn lanes (where warranted)
Widen to 4 lanes and turn lanes (where warranted)Widen to 4 lanes, turn lanes (where warranted), and signal coordination
Mayfair Rd Krumroy Rd Turn lanes (where warranted)
Krumroy Rd US 224 Turn lanes (where warranted)
Widen to 4 lanes and turn lanes (where warranted)
Widen to 4 lanes, turn lanes (where warranted), and signal coordination
SR 261 (Tallmadge Av) N. Main St Home Av Turn lanes (where warranted) and reconstruct to standard lanes
Turn lanes (where warranted), reconstruct to standard lanes, and signal coordination
SR 261 (Northeast Av) N. Munroe Rd Cherry St Turn lanes (where warranted) and access management
SR 261 Cherry St SR 43 Turn lanes (where necessary) and signal coordination
70

8/9/2019 CMS Performance and Strategy Evaluation Report AMATS
http://slidepdf.com/reader/full/cms-performance-and-strategy-evaluation-report-amats 73/115
Table 5-3
Congestion Management System Alternatives for ArterialsHighway From To Alternative
SR 303 Terex Rd Boston Mills Rd Turn lanes (where warranted)
Widen to 4 lanes and turn lanes (where warranted)
Boston Mills Rd Atterbury Blvd Turn lanes (where warranted)
Turn lanes (where warranted) and signal coordination
Atterbury Blvd SR 91 Turn lanes (where warranted)
Widen to 4 lanes and turn lanes (where warranted)
SR 306 SR 43 SR 82 Turn lanes (where warranted)
SR 82 Geauga County Line Widen to 4 lanes and turn lanes (where warranted)
SR 619 State St Cottage Grove Rd Turn lanes (where warranted)
Turn lanes (where warranted) and signal coordination
Widen to 4 lanes and turn lanes (where warranted)
Cottage Grove Rd SR 241 Turn lanes (where warranted)
Widen to 4 lanes and turn lanes (where warranted)
5th St NE Paige Av State St Turn lanes (where warranted)
31st St Wooster Rd W Shannon Av Turn lanes (where warranted)
Widen to 4 lanes and turn lanes (where warranted)
Arlington Rd Greensburg Rd SR 619 Turn lanes (where warranted)
Widen to 4 lanes and turn lanes (where warranted)
SR 619 I-77 SB Ramps Turn lanes (where warranted), reconstruct to standard lanes, and signal coordination
Arlington St I-77 SB Ramps Killian Rd Signal coordination
Killian Rd Krumroy Rd Turn lanes (where warranted)
Turn lanes (where warranted) and reconstruct to standard lanes
Krumroy Rd Swartz Rd Turn lanes (where warranted) and signal coordination
Swartz Rd Waterloo Rd Turn lanes (where warranted) and reconstruct to standard lanes
Turn lanes (where warranted), reconstruct to standard lanes, and signal coordination
Waterloo Rd 7th St Signal coordination
7th St E. Market St Signal coordination
Turn lanes (where warranted), reconstruct to standard lanes, and signal coordination
Brittain Rd E. Market St (SR 18) Eastwood Av Signal coordination
Broad Blvd Newberry St Second St Continue to monitor
Canton Rd Killian Rd US 224 (Waterloo Rd) Turn lanes (where warranted)
Cleveland-Massillon Rd Shannon Av Greenwich Rd Turn lanes (where warranted)
Widen to 4 lanes and turn lanes (where warranted)
Greenwich Rd I-76 Turn lanes (where warranted)
Widen to 4 lanes and turn lanes (where warranted)
SR 162 (Copley Rd) I-77 Turn lanes (where warranted)
Widen to 4 lanes and turn lanes (where warranted)
I-77 Bywood Rd Widen to 4 lanes
Widen to 4 lanes and signal coordination
Bywood Rd SR 18 Signal coordination
SR 18 Springside Dr Widen to 4 lanes and signal coordination
Cuyahoga Falls Av N. Main St Front St Turn lanes (where warranted) and parking management
Turn lanes (where warranted), parking management, and signal coordination
Widen to 4 lanes and turn lanes (where warranted)
Widen to 4 lanes, turn lanes (where warranted), and signal coordination
Front St SR 8 Continue to monitor
Exchange St Hawkins Av Delia Av Turn lanes (where warranted) and reconstruct to standard lanes
Turn lanes (where warranted), reconstruct to standard lanes, and signal coordinationDelia Av Rhodes Av Turn lanes (where warranted), parking management, and reconstruct to standard lanes
Turn lanes (where warranted), parking management, reconstruct to standard lanes, and
signal coordination
Broadway St Grant St Signal coordination
Grant St Fountain St Turn lanes (where warranted), parking management, pedestrian channelization, and
reconstruct to standard lanes
Turn lanes (where warranted), parking management, pedestrian channelization,
reconstruct to standard lanes, and signal coordination
Fairchild Av Hudson Rd SR 43 Turn lanes (where warranted) and reconstruct to standard lanes
71

8/9/2019 CMS Performance and Strategy Evaluation Report AMATS
http://slidepdf.com/reader/full/cms-performance-and-strategy-evaluation-report-amats 74/115
Table 5-3
Congestion Management System Alternatives for ArterialsHighway From To Alternative
Fishcreek Rd Call Rd Laurel Woods Blvd Turn lanes (where warranted)
Widen to 4 lanes and turn lanes (where warranted)
Frank Blvd White Pond Dr W. Market St (SR 18) Realign Frank Blvd and reconfigure intersection with White Pond Dr
Graham Rd Bath Rd Hudson Dr Turn lanes (where warranted)
Turn lanes (where warranted) and signal coordination
Hudson Dr SR 8 Access management and signal coordination
SR 8 SR 91 (Darrow Rd) Turn lanes (where warranted)
Turn lanes (where warranted) and signal coordination
SR 91 (Darrow Rd) Newcomer Rd Turn lanes (where warranted)
Widen to 4 lanes and turn lanes (where warranted)
Highland Rd SR 8 Chamberlin Rd Widen to 4 lanes and turn lanes (where warranted)
Chamberlin Rd SR 91 Turn lanes (where necessary)
Howe Av SR 8 Buchholzer Blvd Signal coordination
Widen to 6 lanes, turn lanes (where warranted), and signal coordination
Hudson Dr Steels Corners Rd Norton Rd Turn lanes (where warranted)
Widen to 4 lanes and turn lanes (where warranted)
S. Main St Caston Rd (N. Leg) SR 619 Turn lanes (where warranted)
Green north corp. Portage Lakes Dr Widen to 4 lanes and signal coordination
Portage Lakes Dr N. Turkeyfoot Rd Turn lanes (where warranted), reconstruct to standard lanes, and correct horizontal andvertical geometry
Turn lanes (where warranted), reconstruct to standard lanes, signal coordination, and
correct horizontal and vertical geometry
N. Turkeyfoot Rd Waterloo Rd Turn lanes (where warranted) and reconstruct to standard lanes
Turn lanes (where warranted), reconstruct to standard lanes, and signal coordination
Waterloo Rd Firestone Blvd Turn lanes (where warranted) and reconstruct to standard lanes
Turn lanes (where warranted), reconstruct to standard lanes, and signal coordination
Merriman/Riverview Rd Smith Rd Weathervane Lane Turn lanes (where warranted) and access management
Miller Rd Ridgewood Rd W. Market St (SR 18) Turn lanes (where warranted) and reconstruct to standard lanes
Portage Path Merriman Rd Portage Trail Continue to monitor
Portage Trail Portage Path State Rd Turn lanes (where warranted)
Widen to 4 lanes and turn lanes (where warranted)
Widen to 4 lanes, turn lanes (where warranted), and signal coordination
Lillis Dr SR 8 Turn lanes (where warranted) and reconstruct to standard lanes
Prospect St SR 44 Lake Av Turn lanes (where warranted)
Lake Av Main St (SR 59) Turn lanes (where warranted)
Turn lanes (where warranted) and signal coordination
Ravenna Rd SR 91 (Darrow Rd) Glenwood Dr Continue to monitor
Glenwood Dr Chamberlin Rd Signal coordination
Widen to 4 lanes, turn lanes (where warranted), and signal coordination
Chamberlin Rd Cuyahoga County Line Turn lanes (where warranted)
Widen to 4 lanes and signal coordination
Widen to 4 lanes, turn lanes (where warranted), and signal coordination
Smith Rd Lake of the Woods Blvd Sourek Trail Turn lanes (where warranted) and reconstruct to standard lanes
Sourek Trail Riverview Rd Reconstruct to standard lanes and vertical improvement
State Rd Bath Rd Steels Corners Rd Turn lanes (where warranted)
Steels Corners Rd State Rd SR 8 Turn lanes (where warranted) and signal coordination
Widen to 4 lanes and turn lanes (where warranted)
Widen to 4 lanes, turn lanes (where warranted), and signal coordination
SR 8 Hudson Dr Turn lanes (where warranted) and signal coordination
Stow Rd Barlow Rd SR 303 Turn lanes (where warranted)
Widen to 4 lanes and turn lanes (where warranted)
72

8/9/2019 CMS Performance and Strategy Evaluation Report AMATS
http://slidepdf.com/reader/full/cms-performance-and-strategy-evaluation-report-amats 75/115
Table 5-3
Congestion Management System Alternatives for ArterialsHighway From To Alternative
Summit St Lincoln St W. Campus Center Dr Traffic calming to discourage use of roadway by through traff ic
Turn lanes (where warranted), signal coordination, and access management
Widen to 4 lanes, signal coordination, and access management
Widen to 4 lanes, turn lanes (where warranted), signal coordination, and access
management
W. Campus Center Dr Loop Rd Traffic calming to discourage use of roadway by through traffic
Turn lanes (where warranted) and signal coordination
Widen to 4 lanes and signal coordination
Widen to 4 lanes, turn lanes (where warranted), and signal coordination
Tallmadge Rd Clyde Av Newberry St Turn lanes (where warranted) and reconstruct to standard lanes
Triplett Blvd Hilbish Av Canton Rd (SR 91) Turn lanes (where warranted)
Widen to 4 lanes and turn lanes (where warranted)
Valleyview Rd Olde Eight Rd Cuyahoga County Line Reconstruct to standard lanes
Turn lanes (where warranted) and reconstruct to standard lanes
Waterloo Rd I-77 SB Ramps S. Arlington St Restripe for median turn lane
Widen to 4 lanes and turn lanes (where warranted)
White Pond Dr Mull Av Frank Blvd Turn lanes (where warranted) and reconstruct to standard lanes
Wooster Rd W Johnson Rd 31st St Turn lanes (where warranted) and reconstruct to standard lanes
Widen to 4 lanes and turn lanes (where warranted)
Wooster Rd N State St I-76 Turn lanes (where warranted), reconstruct to standard lanes, and signal coordination
73

8/9/2019 CMS Performance and Strategy Evaluation Report AMATS
http://slidepdf.com/reader/full/cms-performance-and-strategy-evaluation-report-amats 76/115
74

8/9/2019 CMS Performance and Strategy Evaluation Report AMATS
http://slidepdf.com/reader/full/cms-performance-and-strategy-evaluation-report-amats 77/115
8
5
8
8
5
14
91
21
82
44
59
18
43
44
21
94
21
14
44
43
59
93
91
94
44
14
43
8244 88
14
59
82
43
91
21
57
82
18
8844
305
77
77
80
80
76
76
77
77
80
76
76
76
176
764
585
532
162
261
619
303
241
306
225
604
619
183
241
183
303
261
225
261
282
303
236
303
700
277
271
480
271
480
224
422
224224
224
224
224
Map 5-3CONGESTION MANAGEMENT SYSTEM
ALTERNATIVES - INTERSECTIONS
November 2004
0 1 2 3 4Miles
Realign IntersectionIntersection Upgrade
New Roadway
7 5 7 5

8/9/2019 CMS Performance and Strategy Evaluation Report AMATS
http://slidepdf.com/reader/full/cms-performance-and-strategy-evaluation-report-amats 78/115
76

8/9/2019 CMS Performance and Strategy Evaluation Report AMATS
http://slidepdf.com/reader/full/cms-performance-and-strategy-evaluation-report-amats 79/115
Table 5-4
Congestion Management System Alternatives for Intersections
Intersection of At Alternative
SR 14 SR 43/SR 303 Local bypass (connect Ferguson Rd to SR 14)
Intersection upgrade
Truck bypass (connect Phillip Pkwy to Ethan Dr)
SR 59/Newton Falls Rd Cul de sac Newton Falls Rd to limit intersection to only 4 approaches
SR 18 Crystal Lake Rd Intersection upgrade
Smith Rd Intersection upgrade
SR 43 Fairchild Av/Crain Av Extend Fairchild Av to Water St (replace Crain Av bridge), turn lanes
(where warranted), reconstruct to standard lanes, signal coordination
Mennonite Rd Realign W. Mennonite Rd to Mennonite Rd
SR 82 Olde Eight Rd/Brandywine Rd Intersection upgrade
SR 91 US 224 (Waterloo Rd) Intersection upgrade
Graham Rd Intersection upgrade
SR 303 Intersection upgrade
Local bypass (Milford Rd to SR 91 and SR 91 to Oviatt St)
SR 241 Greensburg Rd Intersection upgrade
SR 261 (Northeast Av) Howe Rd/N. Munroe Rd Intersection upgrade
SR 619 S. Main St Intersection upgrade
Arlington Rd/St Intersection upgrade
Myersville Rd Intersection upgrade
Akron-Peninsula Rd Portage Trail Intersection upgrade
Bailey/Brittain Rd Howe Av/Tallmadge Rd/
Northwest Av
Eliminate Northwest Ave and Tallmadge Rd intersection with Howe Av
and replace with new connector roadways
Cleveland-Massillon Rd Ridgewood Rd Realign Ridgewood Rd intersection
Highland Rd SR 8 Intersection upgrade
S. Main St Wilbeth Rd Intersection upgrade
Merriman Rd Portage Path Intersection upgrade
Prospect St Summit Rd/Hayes Rd Realign Hayes Rd to Summit Rd
Intersection upgrade
Ravenna Rd Shepard Rd Realign Shepard Rd and Richmond Rd
Summit St Lincoln St Realign Summit/Lincoln intersectionE. Campus Center Dr/Loop Rd Realign E. Campus Center Dr to Loop Rd
77

8/9/2019 CMS Performance and Strategy Evaluation Report AMATS
http://slidepdf.com/reader/full/cms-performance-and-strategy-evaluation-report-amats 80/115
78
8/9/2019 CMS Performance and Strategy Evaluation Report AMATS
http://slidepdf.com/reader/full/cms-performance-and-strategy-evaluation-report-amats 81/115
79
CHAPTER 6
EVALUATION OF CMS ALTERNATIVES
In the last chapter, CMS strategies were identified based on the level of existing and
future traffic congestion. They were evaluated at the system level to determine their effectiveness and political feasibility. The strategies were then linked with previouslyidentified congestion problems on freeways, arterials, and at intersections to determineproject alternatives. Systemwide alternatives were also identified. The next step in theCMS process is to evaluate these alternatives.
This chapter discusses the methodology used to determine the level of service (LOS)resulting from each alternative. It then evaluates each alternative based on itseffectiveness and political feasibility.
Methodology for Determining Level of Service
A system was prepared to test the alternatives that were identified in Chapter 5, usingthe AMATS urban transportation planning models. These models provide transportationeffectiveness information at both project and system level of detail.
The future (2030) volume of traffic for each freeway and arterial project alternative wasdetermined by using the AMATS urban transportation planning models. The capacity of each project alternative was calculated using HCM2000 procedures for freeways andAMATS generalized planning-level roadway capacities for arterials. These volumes andcapacities were analyzed to determine the resulting LOS for each project alternative.
The future (2030) volume of traffic for each intersection was not analyzed, due to thedifficulty of accurately determining turning movements. Therefore, existing volumeswere analyzed for this analysis. The capacity of each project alternative was calculatedusing HCM2000 procedures for intersections. These volumes and capacities were usedto determine the resulting operational status for each project alternative.
Finally, the AMATS Plan Update Subcommittee reviewed all of the project alternativesin order to determine whether they would be politically feasible.
Evaluation of Project Alternatives
Project alternatives are evaluated based on effectiveness and political feasibility. Theresults of this evaluation are discussed in the following sections.
Freeways
Table 6-1 (on page 83) shows the results of the evaluation of the freeway projectalternatives. It shows the existing LOS (from Chapter 2), future LOS without the projectalternative (from Chapter 3), and future LOS with the project alternative. It also shows

8/9/2019 CMS Performance and Strategy Evaluation Report AMATS
http://slidepdf.com/reader/full/cms-performance-and-strategy-evaluation-report-amats 82/115
80
the estimated cost of the project alternative and whether or not it is considered to beeffective and politically feasible.
A project alternative was considered effective if the resulting LOS was “D” or better, inkeeping with the AMATS Regional Transportation Goals and Objectives. A project
alternative was considered politically feasible if the social, economic, and environmentalimpacts were expected to be acceptable to local officials and the public. Alternativesthat were not effective and politically feasible were dropped from further consideration.
Arterials
Table 6-2 (on pages 84-91) shows the results of the evaluation of the arterial projectalternatives. It shows the existing LOS (from Chapter 2), future LOS without the projectalternative (from Chapter 3), and future LOS with the project alternative. It also showsthe estimated cost of the project alternative and whether or not it is considered to beeffective and politically feasible.
A project alternative was considered effective if the resulting LOS was “C” or better, inkeeping with the AMATS Regional Transportation Goals and Objectives. Because thevolumes and capacities are estimated at the planning-level, it is unclear in some caseswhether the project alternative completely relieves the congestion. These projectalternatives are denoted by “LOS C*”. This designation indicates that they areconsidered effective at the planning-level, but should be analyzed more closely at theproject-level.
A project alternative was considered politically feasible if the social, economic, andenvironmental impacts were expected to be acceptable to local officials and the public.Alternatives that were not effective and politically feasible were dropped from further consideration.
Intersections
Table 6-3 (on page 92) shows the results of the evaluation of the intersection projectalternatives. It shows the existing operational status (from Chapter 2) and theoperational status with the project alternative. It also shows the estimated cost of theproject alternative and whether or not it is to be considered effective and politicallyfeasible. A project alternative was considered effective if it improved the operationalstatus of the intersection.
Some intersections were not analyzed quantitatively because of a lack of traffic volumedata. The project alternative, however, was assumed to improve the operational status.
A project alternative was considered politically feasible if the social, economic, andenvironmental impacts were expected to be acceptable to local officials and the public.Alternatives that were not effective and politically feasible were dropped from further consideration.

8/9/2019 CMS Performance and Strategy Evaluation Report AMATS
http://slidepdf.com/reader/full/cms-performance-and-strategy-evaluation-report-amats 83/115
81
Evaluation of System Alternatives
Several supplemental strategies identified in Chapter 5 are considered systemalternatives. Unlike the project alternatives, the system alternatives do not correspond
to one congested location. The system alternatives are:
• Carpooling• Vanpooling• Park-and-ride lots• Enhancement of existing transit services• Freeway and incident management systems• Access management
Carpooling, Vanpooling, and Park-and-Ride Lots
These strategies are difficult to evaluate in a quantitative manner. Carpooling andvanpooling, in conjunction with the construction of park-and-ride lots, producecongestion-reduction benefits by reducing the number of vehicle miles and vehiclehours traveled. Unfortunately, these benefits tend to be scattered throughout theregion, rather than concentrated on particular highway facilities. As a result, thesetechniques are unlikely to relieve congestion on any one facility to the point whereadditional highway improvements would be unnecessary.
Carpooling, vanpooling, and park-and-ride lots remain useful supplemental strategiesfor congestion management and will be considered along with regional publictransportation needs as the AMATS 2030 Regional Transportation Plan is developed.
Enhancement of Existing Transit Services
Public transportation improvements are more amenable to quantitative evaluation thancarpooling and vanpooling, and have been evaluated as a part of major regionalplanning studies, such as the Canton-Akron-Cleveland Interregional Travel Corridor Major Investment Study (CAC MIS) and the I-76 Major Investment Study (I-76 MIS).These studies have examined the possibility of enhancing existing transit service as away of reducing traffic congestion.
More frequent express bus service between Akron and Cleveland and more frequent
service on local bus routes will provide minor congestion management benefits byreducing the total vehicle miles and vehicle hours traveled in the AMATS area.However, because these benefits will be spread out over a number of highway facilitiesand will occur at only certain hours of the day, they are not expected to relievecongestion on any one facility to the point where additional highway improvementswould be unnecessary.
Expanded express and local bus service remain useful supplemental strategies for
8/9/2019 CMS Performance and Strategy Evaluation Report AMATS
http://slidepdf.com/reader/full/cms-performance-and-strategy-evaluation-report-amats 84/115
82
congestion management, and will be considered along with other regional publictransportation needs as the AMATS 2030 Regional Transportation Plan is developed.
Freeway and Incident Management Systems
Freeway and incident management systems are difficult to evaluate in a quantitativemanner. They use technology such as cameras, changeable message signs, andimproved communication with emergency responders in order to reduce response time,manage freeway congestion, and provide traveler information.
Freeway and incident management systems have been evaluated as a part of major regional planning studies, such as the Akron-Canton Freeway Management SystemDetailed Project Plan, the Canton-Akron-Cleveland Interregional Travel Corridor Major Investment Study (CAC MIS), and the I-76 Major Investment Study (I-76 MIS). Thesestudies recommended implementing Freeway and incident management systems in theAkron metropolitan area. The benefits of these systems tend to be scattered throughout
a number of highway facilities, therefore these techniques are unlikely to relievecongestion on any one facility to the point where additional highway improvementswould be unnecessary.
Freeway and incident management systems remain useful supplemental strategies for congestion management and will be considered as the AMATS 2030 Regional Transportation Plan is developed.
Access Management
Access management improves traffic operations by controlling the frequency anddesign of access points to locations adjacent to the roadway. In order to be successful,access management requires close cooperation between developers, land useplanners, and transportation planners.
Proper access management can serve as a low-cost alternative to expensive highwayimprovements intended to alleviate traffic congestion. It can also improve safety byminimizing turning movements, thus removing vehicle conflicts.
Access management remains a useful supplemental strategy for congestionmanagement and will be considered as the AMATS 2030 Regional Transportation Plan is developed.

8/9/2019 CMS Performance and Strategy Evaluation Report AMATS
http://slidepdf.com/reader/full/cms-performance-and-strategy-evaluation-report-amats 85/115
Table 6-1
CMS Alternative Evaluation for Freeways
From To Primary Alternative
Existing
LOS
Futu
LOS
SR 8 at I-76/I-77 (Central interchange) Reconfigure interchange E F
I-76/77 (Central interchange) Perkins St Widen to 8 lanes F F
Perkins St Graham Rd Widen to 8 lanes and reconfigure access E F
SR 303 I-271 Reconstruct to freeway standards and reconfigure access F D1
SR 59 Howard St SR 8 Construct as new freeway N/A N/A
Upgrade to controlled access facility N/A N/A
I-76 at SR 21 Reconfigure interchange C D
SR 21 I-77 (Kenmore north interchange) Widen to 6 lanes and reconfigure access E F
at I-277 (Kenmore south interchange) Reconfigure interchange E F
at I-77 (Kenmore north interchange) Reconfigure interchange E F
I-76 (Kemore north interchange) SR 8 (Central interchange) Widen to 8 lanes and reconfigure access D E
at SR 8 (Central interchange) See SR 8 E E
Gilchrist Rd Southeast Av (SR 532) Widen to 6 lanes D E
I-77 Akron-Canton Airport SR 241 Widen to 6 lanes D D1
Arlington Rd I-277 Widen to 8 lanes C E
at I-277 Reconfigure interchange E F
I-277 Archwood Av Widen to 8 lanes and reconfigure access F F
Archwood Av I-76/I-77 (Central Interchange) Reconfigure access D F
at SR 8 (Central interchange) See SR 8 D F
SR 8 (Central interchange) I-76 (Kemore north interchange) See I-76 D E
Copley Rd (SR 162) SR 21 Widen to 6 lanes E D1
SR 21 SR 18 Reconfigure interchanges to minimize weaving D E
Ghent Rd I-271 Widen to 6 lanes and reconfigure access E F
I-271 I-80 (Ohio Turnpike) Widen to 6 lanes and reconfigure access D F
I-271 SR 8 I-480 Widen to 6 lanes D F
1 The future (2030) LOS analysis includes the committed project from Chapter

8/9/2019 CMS Performance and Strategy Evaluation Report AMATS
http://slidepdf.com/reader/full/cms-performance-and-strategy-evaluation-report-amats 86/115

8/9/2019 CMS Performance and Strategy Evaluation Report AMATS
http://slidepdf.com/reader/full/cms-performance-and-strategy-evaluation-report-amats 87/115
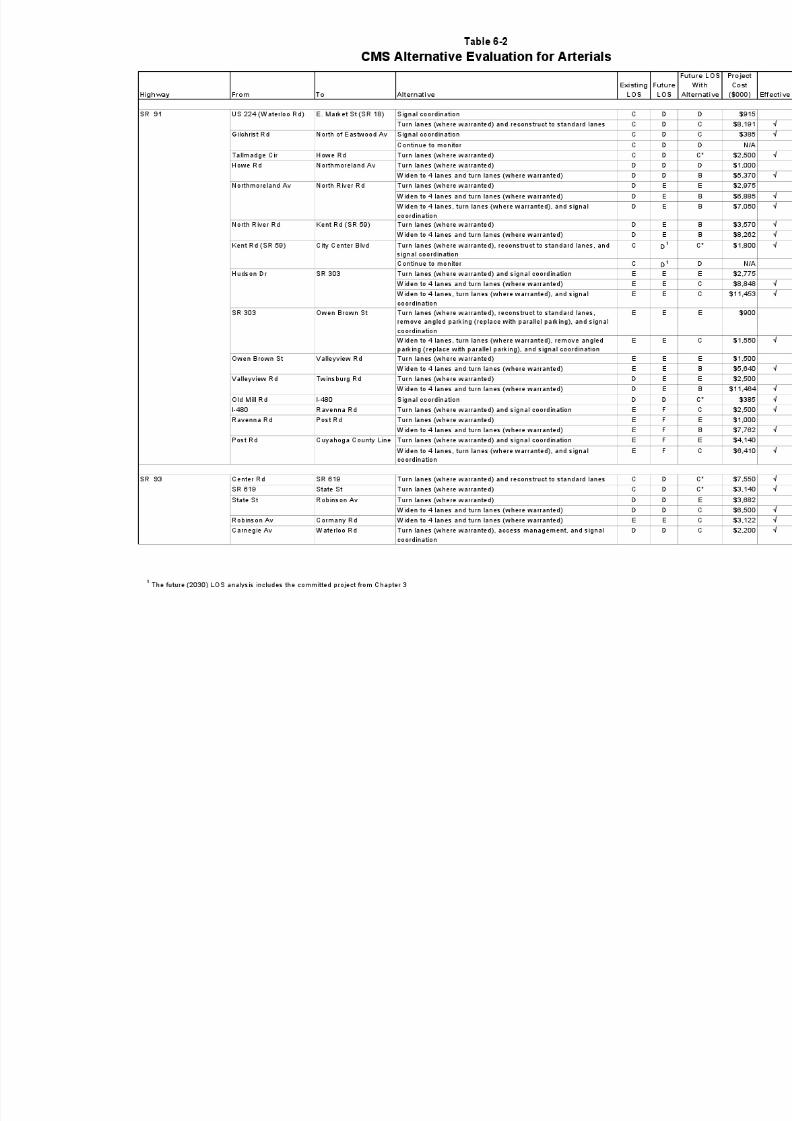
8/9/2019 CMS Performance and Strategy Evaluation Report AMATS
http://slidepdf.com/reader/full/cms-performance-and-strategy-evaluation-report-amats 88/115

8/9/2019 CMS Performance and Strategy Evaluation Report AMATS
http://slidepdf.com/reader/full/cms-performance-and-strategy-evaluation-report-amats 89/115

8/9/2019 CMS Performance and Strategy Evaluation Report AMATS
http://slidepdf.com/reader/full/cms-performance-and-strategy-evaluation-report-amats 90/115
Table 6-2
CMS Alternative Evaluation for Arterials
Highway From To Alternative
Existing
LOS
Fu
L
31st St Wooster Rd W Shannon Av Turn lanes (where warranted) D
Widen to 4 lanes and turn lanes (where warranted) D
Arlington Rd/St Greensburg Rd SR 619 Turn lanes (where warranted) C
Widen to 4 lanes and turn lanes (where warranted) CSR 619 I-77 SB Ramps Turn lanes (where warranted), reconstruct to standard lanes, and
signal coordination
D
I-77 SB Ramps Killian Rd Signal coordination C
Killian Rd Krumroy Rd Turn lanes (where warranted) B
Turn lanes (where warranted) and reconstruct to standard lanes B
Krumroy Rd Swartz Rd Turn lanes (where warranted) and signal coordination C CSwartz Rd Waterloo Rd Turn lanes (where warranted) and reconstruct to standard lanes C
Turn lanes (where warranted), reconstruct to standard lanes, andsignal coordination
C
Waterloo Rd 7th St Signal coordination C
7th St E. Market St Signal coordination C
Turn lanes (where warranted), reconstruct to standard lanes, andsignal coordination
C
Brittain Rd E. Market St (SR 18) Eastwood Av Signal coordination C
Broad Blvd Newberry St Second St Continue to monitor C
Canton Rd Killian Rd US 224 (Waterloo Rd) Turn lanes (where warranted) C
Cleveland-Massillon Rd Shannon Av Greenwich Rd Turn lanes (where warranted) D
Widen to 4 lanes and turn lanes (where warranted) D
Greenwich Rd I-76 Turn lanes (where warranted) E
Widen to 4 lanes and turn lanes (where warranted) E
SR 162 (Copley Rd) I-77 Turn lanes (where warranted) D
Widen to 4 lanes and turn lanes (where warranted) D
I-77 Bywood Rd Widen to 4 lanes E
Widen to 4 lanes and signal coordination E
Bywood Rd SR 18 Signal coordination B
SR 18 Springside Dr Widen to 4 lanes and signal coordination B
Cuyahoga Falls Av N. Main St Front St Turn lanes (where warranted) and parking management D
Turn lanes (where warranted), parking management, and signalcoordination
D
Widen to 4 lanes and turn lanes (where warranted) D
Widen to 4 lanes, turn lanes (where warranted), and signalcoordination
D
Front St SR 8 Continue to monitor D
1 The future (2030) LOS analysis includes the committed project from Chapter 3

8/9/2019 CMS Performance and Strategy Evaluation Report AMATS
http://slidepdf.com/reader/full/cms-performance-and-strategy-evaluation-report-amats 91/115
Table 6-2
CMS Alternative Evaluation for Arterials
Highway From To Alternative
Existing
LOS
Fu
L
Exchange St Hawkins Av Delia Av Turn lanes (where warranted) and reconstruct to standard lanes C
Turn lanes (where warranted), reconstruct to standard lanes, andsignal coordination
C
Delia Av Rhodes Av Turn lanes (where warranted), parking management, and
reconstruct to standard lanes
C
Turn lanes (where warranted), parking management, reconstruct tostandard lanes, and signal coordination
C
Broadway St Grant St Signal coordination C
Grant St Fountain St Turn lanes (where warranted), parking management, pedestrianchannelization, and reconstruct to standard lanes
E
Turn lanes (where warranted), parking management, pedestrianchannelization, reconstruct to standard lanes, and signalcoordination
E
Fairchild Av Hudson Rd SR 43 Turn lanes (where warranted) and reconstruct to standard lanes C
Fishcreek Rd Call Rd Laurel Woods Blvd Turn lanes (where warranted) D
Widen to 4 lanes and turn lanes (where warranted) D
Frank Blvd White Pond Dr W. Market St (SR 18) Realign Frank Blvd and reconfigure intersection with White PondDr
A
Graham Rd Bath Rd Hudson Dr Turn lanes (where warranted) C
Turn lanes (where warranted) and signal coordination C
Hudson Dr SR 8 Access management and signal coordination D
SR 8 SR 91 (Darrow Rd) Turn lanes (where warranted) D
Turn lanes (where warranted) and signal coordination D
SR 91 (Darrow Rd) Newcomer Rd Turn lanes (where warranted) E
Widen to 4 lanes and turn lanes (where warranted) E
Highland Rd SR 8 Chamberlin Rd Widen to 4 lanes and turn lanes (where warranted) C
Chamberlin Rd SR 91 Turn lanes (where necessary) B
Howe Av SR 8 Buchholzer Blvd Signal coordination E
Widen to 6 lanes, turn lanes (where warranted), and signalcoordination
E
Hudson Dr Steels Corners Rd Norton Rd Turn lanes (where warranted) E
Widen to 4 lanes and turn lanes (where warranted) E
1 The future (2030) LOS analysis includes the committed project from Chapter 3
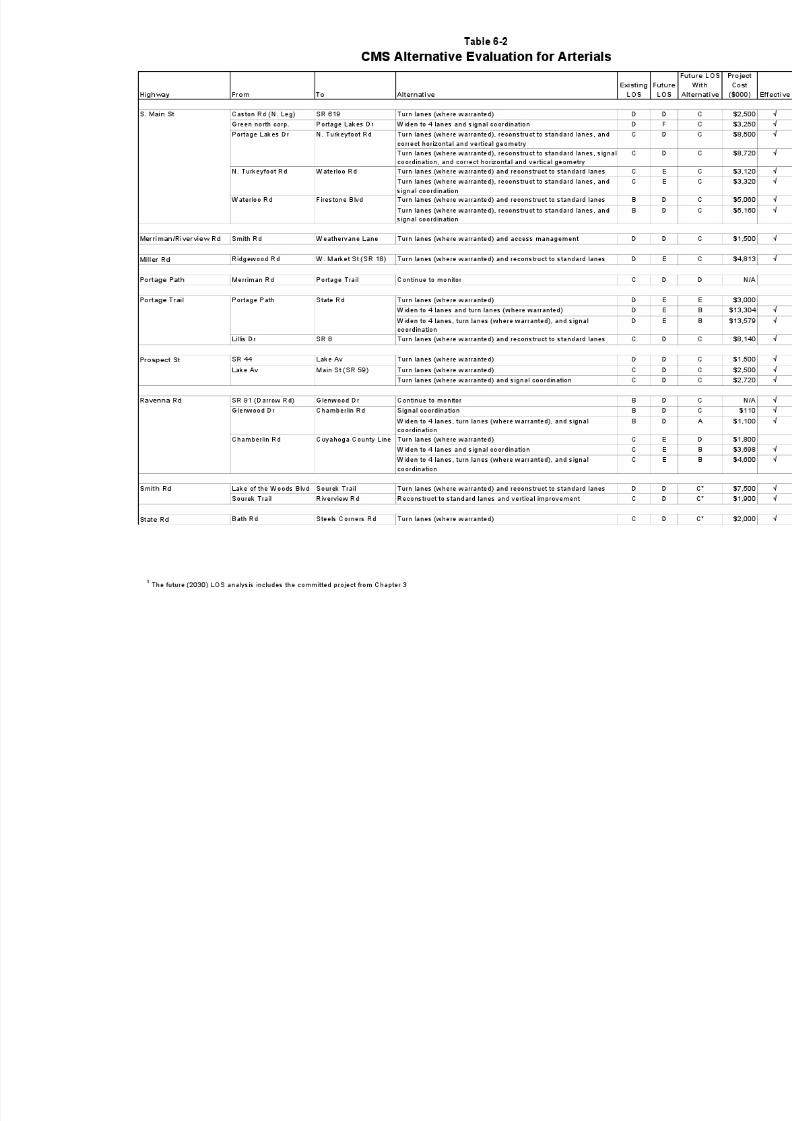
8/9/2019 CMS Performance and Strategy Evaluation Report AMATS
http://slidepdf.com/reader/full/cms-performance-and-strategy-evaluation-report-amats 92/115
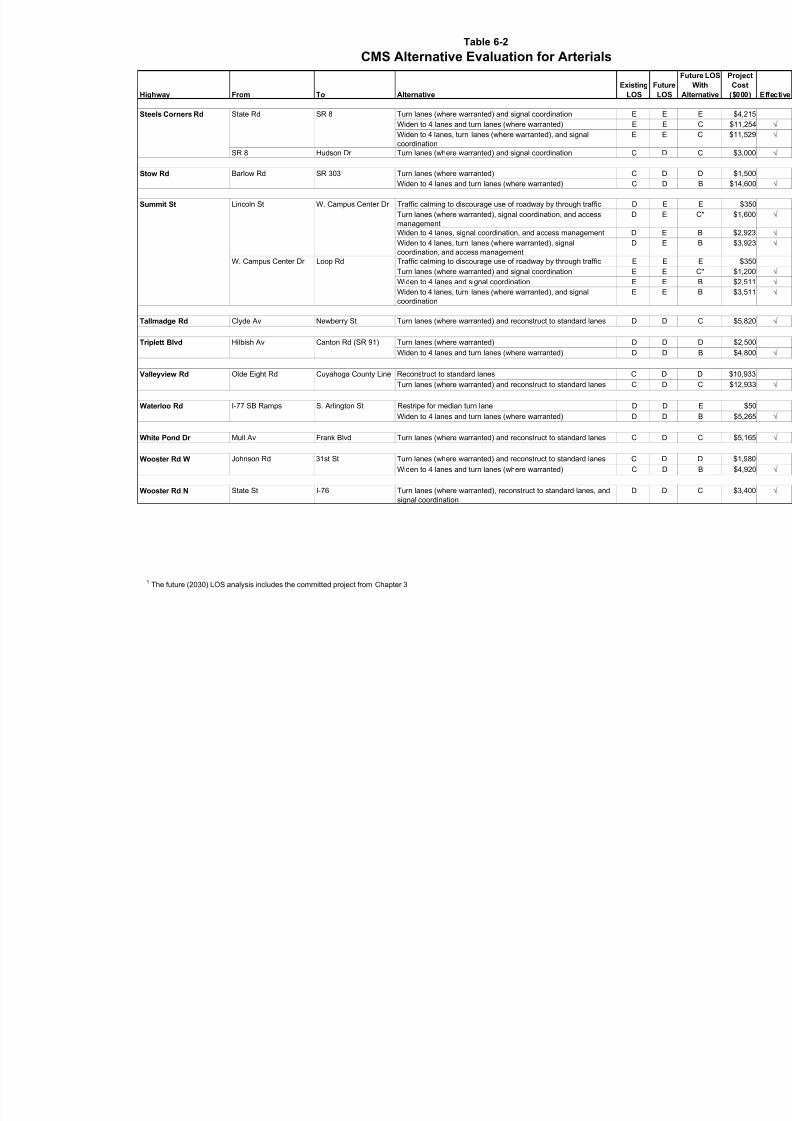
8/9/2019 CMS Performance and Strategy Evaluation Report AMATS
http://slidepdf.com/reader/full/cms-performance-and-strategy-evaluation-report-amats 93/115
Table 6-2
CMS Alternative Evaluation for Arterials
Highway From To Alternative
Existing
LOS
Fu
L
Steels Corners Rd State Rd SR 8 Turn lanes (where warranted) and signal coordination E
Widen to 4 lanes and turn lanes (where warranted) E
Widen to 4 lanes, turn lanes (where warranted), and signalcoordination
E
SR 8 Hudson Dr Turn lanes (where warranted) and signal coordination C
Stow Rd Barlow Rd SR 303 Turn lanes (where warranted) C
Widen to 4 lanes and turn lanes (where warranted) C
Summit St Lincoln St W. Campus Center Dr Traffic calming to discourage use of roadway by through traffic D
Turn lanes (where warranted), signal coordination, and accessmanagement
D
Widen to 4 lanes, signal coordination, and access management D
Widen to 4 lanes, turn lanes (where warranted), signalcoordination, and access management
D
W. Campus Center Dr Loop Rd Traffic calming to discourage use of roadway by through traffic E
Turn lanes (where warranted) and signal coordination E
Widen to 4 lanes and signal coordination E
Widen to 4 lanes, turn lanes (where warranted), and signal
coordination
E
Tallmadge Rd Clyde Av Newberry St Turn lanes (where warranted) and reconstruct to standard lanes D
Triplett Blvd Hilbish Av Canton Rd (SR 91) Turn lanes (where warranted) D
Widen to 4 lanes and turn lanes (where warranted) D
Valleyview Rd Olde Eight Rd Cuyahoga County Line Reconstruct to standard lanes C
Turn lanes (where warranted) and reconstruct to standard lanes C
Waterloo Rd I-77 SB Ramps S. Arlington St Restripe for median turn lane D
Widen to 4 lanes and turn lanes (where warranted) D
White Pond Dr Mull Av Frank Blvd Turn lanes (where warranted) and reconstruct to standard lanes C
Wooster Rd W Johnson Rd 31st St Turn lanes (where warranted) and reconstruct to standard lanes C
Widen to 4 lanes and turn lanes (where warranted) C
Wooster Rd N State St I-76 Turn lanes (where warranted), reconstruct to standard lanes, and
signal coordination
D
1 The future (2030) LOS analysis includes the committed project from Chapter 3

8/9/2019 CMS Performance and Strategy Evaluation Report AMATS
http://slidepdf.com/reader/full/cms-performance-and-strategy-evaluation-report-amats 94/115
Table 6-3
CMS Alternative Evaluation for Intersections
Intersection of At Alternative
Existing
Operational
Status
Operat
With
SR 14 SR 43/SR 303 Local bypass (connect Ferguson Rd to SR 14) N/A
Intersection upgrade At Capacity Nea
Truck bypass (connect Phillip Pkwy to Ethan Dr) N/A
SR 59/Newton Falls Rd Cul de sac Newton Falls Rd to limit intersection to only 4 approaches Near Capacity Unde
SR 18 Crystal Lake Rd Intersection upgrade Over Capacity At
Smith Rd Intersection upgrade At Capacity Nea
SR 43 Fairchild Av/Crain Av Extend Fairchild Av to Water St (replace Crain Av briddge), turn lanes
(where warranted), reconstruct to standard lanes, signal coordination
Over Capacity At
Mennonite Rd Realign W. Mennonite Rd to Mennonite Rd N/A
SR 82 Olde Eight Rd/Brandywine Rd Intersection upgrade Over Capacity At
SR 91 US 224 (Waterloo Rd) Intersection upgrade At Capacity Nea
Graham Rd Intersection upgrade At Capacity Nea
SR 303 Intersection upgrade At Capacity Nea
Local bypass (Milford Rd to SR 91 and SR 91 to Oviatt St) N/A
SR 241 Greensburg Rd Intersection upgrade N/A
SR 261 (Northeast Av) Howe Rd/N.Munroe Rd Intersection upgrade At Capacity Nea
SR 619 S. Main St Intersection upgrade Over Capacity Nea
Arlington Rd/St Intersection upgrade Near Capacity Unde
Myersville Rd Intersection upgrade N/A
Akron-Peninsula Rd Portage Trail Intersection upgrade Over Capacity Nea
Bailey/Brittain Rd Howe Av/Tallmadge Rd/ Northwest Av Eliminate Northwest Ave and Tallmadge Rd intersection with Howe Av and
replace with new connector roadways
Over Capacity Nea
Cleveland-Massillon Rd Ridgewood Rd Realign Ridgewood Rd intersection N/A
Highland Rd SR 8 Intersection upgrade Over Capacity Unde
S. Main St Wilbeth Rd Intersection upgrade N/A
Merriman Rd Portage Path Intersection upgrade Over Capacity At
Prospect St Summit Rd/Hayes Rd Realign Hayes Rd to Summit Rd N/A
Intersection upgrade N/A
Ravenna Rd Shepard Rd Realign Shepard Rd and Richmond Rd N/A
Summit St Lincoln St Realign Summit/Lincoln intersection N/A
E. Campus Center Dr/Loop Rd Realign E. Campus Center Dr to Loop Rd N/A

8/9/2019 CMS Performance and Strategy Evaluation Report AMATS
http://slidepdf.com/reader/full/cms-performance-and-strategy-evaluation-report-amats 95/115
93
CHAPTER 7
CMS RECOMMENDATIONS
This chapter summarizes the CMS recommendations for the AMATS area between now
and 2030. CMS recommendations were identified based on the evaluation presented inChapter 6.
Recommendations for freeways, arterials, and intersections are listed in their respectivesections below. Systemwide congestion management recommendations andsummarized system statistics are also included in this chapter.
Freeways
Table 7-1 (on pages 93-94) lists the freeway recommendations and includes location,project description, and estimated total cost. These recommendations are also shown
on Map 7-1 (on page 105). These recommendations are divided into two categories:primary recommendations and supplemental strategies.
The primary recommendations are expected to relieve congestion on freewaysegments. The primary recommendations include constructing additional throughlanes, constructing new roadways, and reconfiguring freeway ramps and interchanges.
The supplemental strategies are generally expected to provide some congestion relief inconjunction with other transportation improvements, but not enough to stand alone.Supplemental strategies include ITS Freeway Management Systems in theAkron/Canton area and the Cleveland area, more frequent express bus service toCleveland, and expanding the park-and-ride lot in the SR 8/SR 303 area. Theestimated total cost for freeway recommendations is approximately $1.85 billion.
Table 7-1: FREEWAY RECOMMENDATIONS
Primary Recommendations Cost ($000)
SR 8
• Central interchange (I-76/I-77) – reconfigure interchange to include 2-lane mainline $201,300freeway ramps (i.e. I-77) and to replace the left lane exit ramps
• Central interchange (I-76/I-77) to Perkins St – widen to 8 lanes $53,000• Perkins St to Graham Rd – widen to 8 lanes and reconfigure access at major $287,000
interchanges• SR 303 to I-271 – reconstruct to freeway standards by removing at-grade $161,600
intersections and reconfiguring access
I-76
• at SR 21 – reconfigure interchange $52,800• SR 21 to I-77 (Kenmore north interchange) – widen to 6 lanes and reconfigure $204,900
access at major interchanges• at I-277 – reconfigure interchange to include 2-lane mainline freeway ramps (i.e. I-76) $55,900
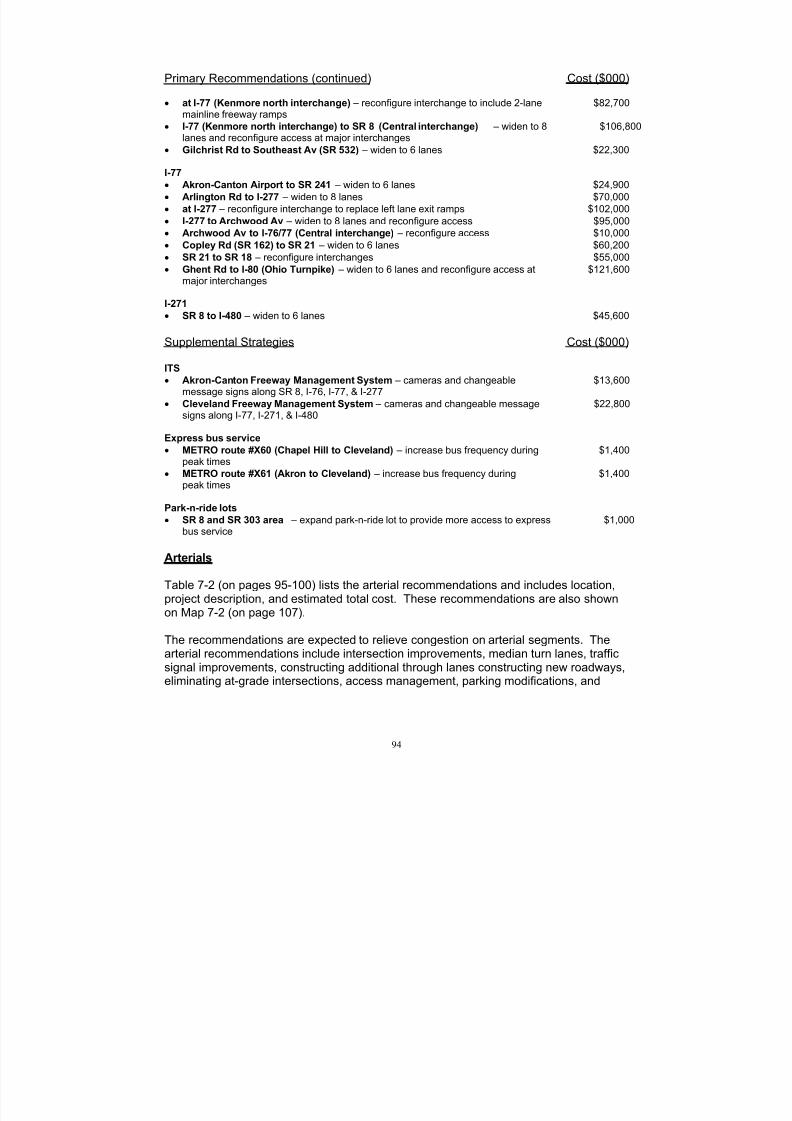
8/9/2019 CMS Performance and Strategy Evaluation Report AMATS
http://slidepdf.com/reader/full/cms-performance-and-strategy-evaluation-report-amats 96/115
94
Primary Recommendations (continued) Cost ($000)
• at I-77 (Kenmore north interchange) – reconfigure interchange to include 2-lane $82,700mainline freeway ramps
• I-77 (Kenmore north interchange) to SR 8 (Central interchange) – widen to 8 $106,800lanes and reconfigure access at major interchanges
• Gilchrist Rd to Southeast Av (SR 532) – widen to 6 lanes $22,300
I-77
• Akron-Canton Airport to SR 241 – widen to 6 lanes $24,900• Arlington Rd to I-277 – widen to 8 lanes $70,000• at I-277 – reconfigure interchange to replace left lane exit ramps $102,000• I-277 to Archwood Av – widen to 8 lanes and reconfigure access $95,000• Archwood Av to I-76/77 (Central interchange) – reconfigure access $10,000• Copley Rd (SR 162) to SR 21 – widen to 6 lanes $60,200• SR 21 to SR 18 – reconfigure interchanges $55,000• Ghent Rd to I-80 (Ohio Turnpike) – widen to 6 lanes and reconfigure access at $121,600
major interchanges
I-271• SR 8 to I-480 – widen to 6 lanes $45,600
Supplemental Strategies Cost ($000)
ITS
• Akron-Canton Freeway Management System – cameras and changeable $13,600message signs along SR 8, I-76, I-77, & I-277
• Cleveland Freeway Management System – cameras and changeable message $22,800signs along I-77, I-271, & I-480
Express bus service •
METRO route #X60 (Chapel Hill to Cleveland) – increase bus frequency during $1,400peak times• METRO route #X61 (Akron to Cleveland) – increase bus frequency during $1,400
peak times
Park-n-ride lots
• SR 8 and SR 303 area – expand park-n-ride lot to provide more access to express $1,000bus service
Arterials
Table 7-2 (on pages 95-100) lists the arterial recommendations and includes location,project description, and estimated total cost. These recommendations are also shownon Map 7-2 (on page 107).
The recommendations are expected to relieve congestion on arterial segments. Thearterial recommendations include intersection improvements, median turn lanes, trafficsignal improvements, constructing additional through lanes constructing new roadways,eliminating at-grade intersections, access management, parking modifications, and
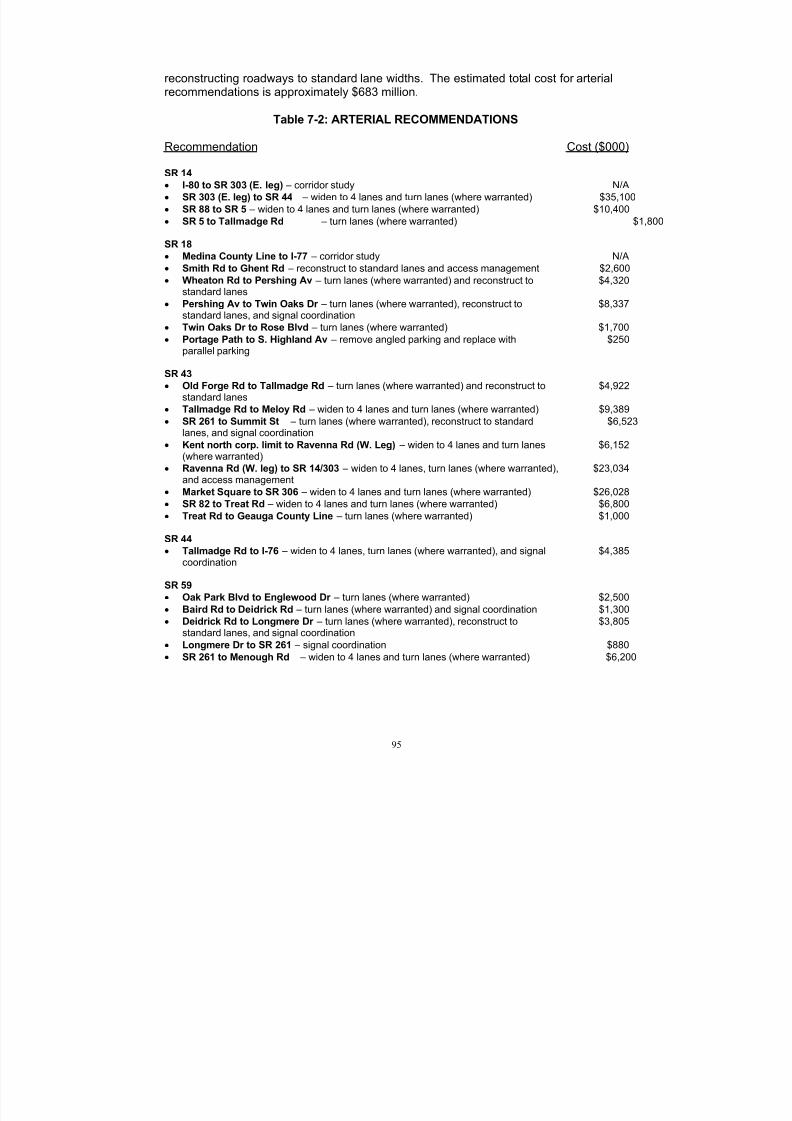
8/9/2019 CMS Performance and Strategy Evaluation Report AMATS
http://slidepdf.com/reader/full/cms-performance-and-strategy-evaluation-report-amats 97/115
95
reconstructing roadways to standard lane widths. The estimated total cost for arterialrecommendations is approximately $683 million.
Table 7-2: ARTERIAL RECOMMENDATIONS
Recommendation Cost ($000)
SR 14
• I-80 to SR 303 (E. leg) – corridor study N/A• SR 303 (E. leg) to SR 44 – widen to 4 lanes and turn lanes (where warranted) $35,100• SR 88 to SR 5 – widen to 4 lanes and turn lanes (where warranted) $10,400• SR 5 to Tallmadge Rd – turn lanes (where warranted) $1,800
SR 18 • Medina County Line to I-77 – corridor study N/A• Smith Rd to Ghent Rd – reconstruct to standard lanes and access management $2,600• Wheaton Rd to Pershing Av – turn lanes (where warranted) and reconstruct to $4,320
standard lanes
• Pershing Av to Twin Oaks Dr – turn lanes (where warranted), reconstruct to $8,337standard lanes, and signal coordination
• Twin Oaks Dr to Rose Blvd – turn lanes (where warranted) $1,700• Portage Path to S. Highland Av – remove angled parking and replace with $250
parallel parking
SR 43
• Old Forge Rd to Tallmadge Rd – turn lanes (where warranted) and reconstruct to $4,922standard lanes
• Tallmadge Rd to Meloy Rd – widen to 4 lanes and turn lanes (where warranted) $9,389• SR 261 to Summit St – turn lanes (where warranted), reconstruct to standard $6,523
lanes, and signal coordination• Kent north corp. limit to Ravenna Rd (W. Leg) – widen to 4 lanes and turn lanes $6,152
(where warranted)• Ravenna Rd (W. leg) to SR 14/303 – widen to 4 lanes, turn lanes (where warranted), $23,034
and access management• Market Square to SR 306 – widen to 4 lanes and turn lanes (where warranted) $26,028
• SR 82 to Treat Rd – widen to 4 lanes and turn lanes (where warranted) $6,800• Treat Rd to Geauga County Line – turn lanes (where warranted) $1,000
SR 44
• Tallmadge Rd to I-76 – widen to 4 lanes, turn lanes (where warranted), and signal $4,385coordination
SR 59
• Oak Park Blvd to Englewood Dr – turn lanes (where warranted) $2,500• Baird Rd to Deidrick Rd – turn lanes (where warranted) and signal coordination $1,300• Deidrick Rd to Longmere Dr – turn lanes (where warranted), reconstruct to $3,805
standard lanes, and signal coordination• Longmere Dr to SR 261 – signal coordination $880• SR 261 to Menough Rd – widen to 4 lanes and turn lanes (where warranted) $6,200

8/9/2019 CMS Performance and Strategy Evaluation Report AMATS
http://slidepdf.com/reader/full/cms-performance-and-strategy-evaluation-report-amats 98/115
96
Recommendation Cost ($000)
SR 82
• Cuyahoga County Line to SR 8 – widen to 4 lanes, turn lanes (where warranted), $20,123and signal coordination
• S. Bedford Rd to Crow Dr – widen 4 lanes and turn lanes (where warranted) $11,728
• S. Bedford Rd to Chamberlain Rd – widen to 4 lanes and turn lanes (where $8,912warranted)
• SR 43 to SR 306 – turn lanes (where warranted) $50
SR 91
• US 224 to E. Market St (SR 18) – turn lanes (where warranted), reconstruct to $9,106standard lanes, and signal coordination
• Gilchrist Rd to north of Eastwood Av – signal coordination $• Tallmadge Circle to Howe Rd – turn lanes (where warranted) $2,500• Howe Rd to Kent Rd (SR 59) – widen to 4 lanes and turn lanes (where warranted) $20,517• Kent Rd (SR 59) to City Center Blvd – turn lanes (where warranted), reconstruct $1,800
to standard lanes, and signal coordination
• Valleyview Rd to Twinsburg Rd – widen to 4 lanes and turn lanes (where $11,464
warranted)• Old Mill Rd to I-480 – signal coordination • I-480 to Ravenna Rd – turn lanes (where warranted) and signal coordination $2,500• Post Rd to Cuyahoga County Line – widen to 4 lanes, turn lanes (where $6,410
warranted), and signal coordination
SR 93
• Center Rd to SR 619 – turn lanes (where warranted) and reconstruct to standard $7,550lanes
• SR 619 to State St – turn lanes (where warranted) $3,140• State St to Cormany Rd – widen to 4 lanes and turn lanes (where warranted) $9,622• Carnegie Av to Waterloo Rd – turn lanes (where warranted), access management, $2,200
and signal coordination
SR 162
• Cleveland-Massillon Rd to I-77 – turn lanes (where warranted), reconstruct to $15,700standard lanes, and improve horizontal geometry
SR 241
• Greensburg Rd to Steese Rd – turn lanes (where warranted) $1,500• Steese Rd to Graybill Rd – widen to 4 lanes, turn lanes (where warranted), and $2,328
signal coordination• Graybill Rd to Raber Rd – signal coordination $444• Raber Rd to SR 619 – widen to 4 lanes, turn lanes (where warranted), and signal $4,309
coordination• Mayfair Rd to Krumroy Rd – turn lanes (where warranted) $1,800• Krumroy Rd to US 224 – widen to 4 lanes and turn lanes (where warranted) $5,410
SR 261 (Tallmadge Av)
• N. Main St to Home Av – turn lanes (where warranted), reconstruct to standard $10,500lanes, and signal coordination
SR 261 (Northeast Av)
• N. Munroe Rd to Cherry St – turn lanes (where warranted) and access management $2,310

8/9/2019 CMS Performance and Strategy Evaluation Report AMATS
http://slidepdf.com/reader/full/cms-performance-and-strategy-evaluation-report-amats 99/115
97
Recommendation Cost ($000)
SR 261
• Cherry St to SR 43 – turn lanes (where warranted) and signal coordination $1,600
SR 303
•
Terex Rd to Boston Mills Rd – widen to 4 lanes and turn lanes (where warranted) $15,957• Boston Mills Rd to Atterbury Blvd – turn lanes (where warranted) and signal $600
coordination
SR 306
• SR 43 to SR 82 – turn lanes (where warranted) $500• SR 82 to Geauga County Line – widen to 4 lanes and turn lanes (where warranted) $7,000
SR 619 (5th
St NE)
• Paige Av to State St – turn lanes (where warranted) $3,000
SR 619 (Turkeyfoot Lake Rd)
• State St to SR 241 – widen to 4 lanes and turn lanes (where warranted) $31,400
SR 619 (Wooster Rd N)
• State St to I-76 – turn lanes (where warranted), reconstruct to standard lanes, and $3,400signal coordination
31st
St
• Wooster Rd W to Shannon Av – widen to 4 lanes and turn lanes (where warranted) $6,624
Arlington Rd/St
• Greensburg Rd to SR 619 – widen to 4 lanes and turn lanes (where warranted) $13,608• SR 619 to I-77 SB ramps – turn lanes (where warranted), reconstruct to standard $2,723
lanes, and signal coordination• I-77 SB ramps to Killian Rd – signal coordination $275
• Killian Rd to Krumroy Rd – turn lanes (where warranted) and reconstruct to $5,154standard lanes
• Krumroy Rd to Swartz Rd – turn lanes (where warranted) and signal coordination $921• Swartz Rd to Waterloo Rd – turn lanes (where warranted), reconstruct to standard $4,100
lanes, and signal coordination• Waterloo Rd to 7
thAv – signal coordination
• 7th
Av to E. Market St (SR 18) – turn lanes (where warranted), reconstruct to $5,943standard lanes, and signal coordination
Brittain Rd
• E. Market St (SR 18) to Eastwood Av – signal coordination $380
Canton Rd
• Killian Rd to US 224 (Waterloo Rd) – turn lanes (where warranted) $3,500
Cleveland-Massillon Rd
• Shannon Av to I-76 – widen to 4 lanes and turn lanes (where warranted) $11,044• SR 162 (Copley Rd) to I-77 – widen to 4 lanes and turn lanes (where warranted) $12,231• I-77 to Bywood Rd – widen to 4 lanes and signal coordination $4,240• Bywood Rd to SR 18 – signal coordination $200• SR 18 to Springside Dr – widen to 4 lanes and signal coordination $2,500

8/9/2019 CMS Performance and Strategy Evaluation Report AMATS
http://slidepdf.com/reader/full/cms-performance-and-strategy-evaluation-report-amats 100/115
98
Recommendation Cost ($000)
Cuyahoga Falls Av
• N. Main St to Front St – widen to 4 lanes, turn lanes (where warranted), and $5,000signal coordination
Exchange St• Hawkins Av to Delia Av – signal coordination $225• Delia Av to Rhodes Av – turn lanes (where warranted), parking management, $3,730
reconstruct to standard lanes, and signal coordination• Broadway St to Grant St – signal coordination • Grant St to Fountain St – turn lanes (where warranted), parking management, $5,134
pedestrian channelization, reconstruct to standard lanes, and signal coordination
Fairchild Av
• Hudson Rd to SR 43 – turn lanes (where warranted) and reconstruct to standard $790lanes
Fishcreek Rd
• Call Rd to Laurel Woods Blvd - widen to 4 lanes and turn lanes (where warranted) $9,600
Frank Blvd
• White Pond Dr to W. Market St (SR 18) – realign Frank Blvd and reconfigure $6,020intersection with White Pond Dr
Graham Rd
• Bath Rd to Hudson Dr – turn lanes (where warranted) and signal coordination $2,830• SR 91 (Darrow Rd) to Newcomer Rd – widen to 4 lanes and turn lanes (where $13,600
warranted)
Highland Rd
• SR 8 to Chamberlin Rd – widen to 4 lanes and turn lanes (where warranted) $7,750
• Chamberlin Rd to SR 91 – turn lanes (where warranted) $3,775
Howe Rd
• SR 8 to Buchholzer Blvd – widen to 6 lanes, turn lanes (where warranted), and $6,534signal coordination
Hudson Dr
• Steels Corners Rd to Norton Rd – widen to 4 lanes and turn lanes (where $10,280warranted)
S. Main St
• Caston Rd (N. leg) to SR 619 – turn lanes (where warranted) $2,500• Green north corp. limit to Portage Lakes Dr – widen to 4 lanes and signal $3,250
coordination• Portage Lakes Dr to N. Turkeyfoot Rd – turn lanes (where warranted), reconstruct $8,720
to standard lanes, signal coordination, and correct horizontal and vertical geometry• N. Turkeyfoot Rd to Firestone Blvd – turn lanes (where warranted), reconstruct to $8,480
standard lanes, and signal coordination
Merriman/Riverview Rd
• Smith Rd to Weathervane Lane – turn lanes (where warranted) and access $1,500management

8/9/2019 CMS Performance and Strategy Evaluation Report AMATS
http://slidepdf.com/reader/full/cms-performance-and-strategy-evaluation-report-amats 101/115
99
Recommendation Cost ($000)
Miller Rd
• Ridgewood Rd to W. Market St (SR 18) – turn lanes (where warranted) and $4,813reconstruct to standard lanes
Portage Trail• Portage Path to State Rd – widen to 4 lanes and turn lanes (where warranted) $13,304• Lillis Dr to SR 8 – turn lanes (where warranted) and reconstruct to standard lanes $8,140
Prospect St
• SR 44 to Lake Av – turn lanes (where warranted) $1,500• Lake Av to Main St (SR 59) – turn lanes (where warranted) and signal coordination $2,720
Ravenna Rd
• Glenwood Dr to Cuyahoga County line – widen to 4 lanes, turn lanes (where $5,700warranted), and signal coordination
Smith Rd
• Lake of the Woods Blvd to Sourek Trail – turn lanes (where warranted) and $7,500reconstruct to standard lanes• Sourek Trail to Riverview Rd – reconstruct to standard lanes and vertical $1,900
improvement
State Rd
• Bath Rd to Steels Corners Rd – turn lanes (where warranted) $2,000
Steels Corners Rd
• State Rd to SR 8 – widen to 4 lanes, turn lanes (where warranted), and signal $11,529coordination
• SR 8 to Hudson Dr – turn lanes (where warranted) and signal coordination $3,000
Stow Rd• Barlow Rd to SR 303 – widen to 4 lanes and turn lanes (where warranted) $14,600
Summit St
• Lincoln St to W. Campus Center Dr – turn lanes (where warranted), signal $1,600coordination, access management, and traffic calming
• W. Campus Center Dr to Loop Rd – turn lanes (where warranted), signal $1,200coordination, and traffic calming
Tallmadge Rd
• Clyde Av to Newberry St – turn lanes (where warranted) and reconstruct to $5,820standard lanes
Triplett Blvd• Hilbish Av to Canton Rd (SR 91) – widen to 4 lanes and turn lanes (where $4,800
warranted)
Valleyview Rd
• Olde Eight Rd to Cuyahoga County line – turn lanes (where warranted) and $12,933reconstruct to standard lanes
Waterloo Rd
• I-77 SB ramps to S. Arlington Rd – widen to 4 lanes and turn lanes (where warranted) $5,265

8/9/2019 CMS Performance and Strategy Evaluation Report AMATS
http://slidepdf.com/reader/full/cms-performance-and-strategy-evaluation-report-amats 102/115
100
Recommendation Cost ($000)
White Pond Dr
• Mull Av to Frank Blvd – turn lanes (where warranted) and reconstruct to standard $5,165lanes
Wooster Rd W• Johnson Rd to 31
stSt – widen to 4 lanes and turn lanes (where warranted) $4,920
Intersections
Table 7-3 (on pages 100-101) lists the intersection recommendations and includeslocation, project description, and estimated total cost. These recommendations are alsoshown on Map 7-3 (on page 109).
The recommendations for intersections generally consist of relatively low-costintersection upgrades. In some cases, however, more intensive improvements such asintersection bypasses have been recommended. The estimated total cost for intersection recommendations is approximately $65 million.
Table 7-3: INTERSECTION RECOMMENDATIONS
Recommendation Cost ($000)
SR 14
• at SR 59/Newton Falls Rd – Cul de sac Newton Falls Rd to limit intersection to $6,544only 4 approaches
SR 18 •
at Smith Rd – intersection upgrade
SR 43
• at Fairchild Av/Crain Av – Extend Fairchild Av to Water St (to replace Crain Av $14,400bridge), turn lanes (where warranted), reconstruct to standard lanes, and signalcoordination
• at Mennonite Rd – realign W. Mennonite Rd to Mennonite Rd $800
SR 82
• at Olde Eight Rd/Brandywine Rd – intersection upgrade $1,300
SR 91
• at US 224 – intersection upgrade
•
at Graham Rd – intersection upgrade $1,300 • at SR 303 – intersection upgrade $2,300
• at SR 303 – intersection bypass (extend Milford Rd to SR 91 to Oviatt St) $4,650
SR 241
• at Greensburg Rd – intersection upgrade $2,308
SR 261 (Northeast Av)
• at Howe Rd/N. Munroe Rd – intersection upgrade $3,000

8/9/2019 CMS Performance and Strategy Evaluation Report AMATS
http://slidepdf.com/reader/full/cms-performance-and-strategy-evaluation-report-amats 103/115
101
Recommendation Cost ($000)
SR 619
• at Arlington Rd – intersection upgrade $3,919• at Myersville Rd – intersection upgrade $620
Akron Peninsula Rd• at Portage Trail – intersection upgrade
Brittain Rd
• at Howe Av/Tallmadge Rd/Northwest Av/Bailey Rd – eliminate Northwest Av and $11,000Tallmadge Rd intersection with Howe Av and replace with new connector roadways
Cleveland-Massillon Rd
• at Ridgewood Rd – realign intersection $2,750
Highland Rd
• at SR 8 – intersection upgrade $1,800
S. Main St• at Wilbeth Rd – intersection upgrade $700
Merriman Rd
• at Portage Path – intersection upgrade $500
Prospect St
• at Summit Rd/Hayes Rd – intersection upgrades $725
Ravenna Rd
• at Shepard Rd – realign intersection $2,750
Summit St
•
at Lincoln St – realign intersection $700• at E. Campus Center Dr/Loop Rd – realign E. Campus Center Dr to Loop Rd $1,200
Systemwide Recommendations
This section shows the recommendations for systemwide improvements. Systemwiderecommendations, unlike the freeway, arterial, and intersection recommendations,include supplemental strategies that are not project specific. The systemwiderecommendations include:
• Carpooling• Vanpooling• Park-and-ride• Enhancement of existing local transit services• Access management
These recommendations remain useful supplemental strategies for congestionmanagement and will be considered along with regional public transportation needs as

8/9/2019 CMS Performance and Strategy Evaluation Report AMATS
http://slidepdf.com/reader/full/cms-performance-and-strategy-evaluation-report-amats 104/115
102
the plan is developed. The total cost for these systemwide recommendations was notdetermined because of lack of detailed information.
Future System Statistics
System statistics were developed to estimate the future performance and expected levelof congestion on the highway system in the AMATS area in 2030, assuming theimplementation of the recommendations in this chapter. AMATS urban transportationplanning models were used to estimate the total amount of travel on the resulting future(2030) highway network. ODOT’s post-processing routine, CMAQT, was then used toanalyze the model results and to generate various congestion statistics for freewaysand arterials. These statistics include total number of miles operating at each level of service, vehicle miles traveled (VMT), vehicle hours traveled (VHT), and average speed.
Table 7-4 (on page 111) summarizes this information for freeways and arterials during atypical 24-hour period in 2030 with the recommendations. The table indicates that 2.5%
of the freeway mileage and 1.8% of the arterial mileage is expected to operate at LOS“D” or worse in 2030 with the recommendations.
Table 7-5 (on page 111) summarizes this information for freeways and arterials duringthe peak hour (4:00-5:00 p.m.) of a typical day in 2030 with the recommendations. Thetable indicates that 13.6% of the freeway mileage and 13.1% of the arterial mileage willoperate at LOS "D" or worse in 2030 with the recommendations.
In order to simplify comparisons between different conditions found in this report, threecases were defined as follows:
•
Case #1 – under existing (2003) conditions (from Chapter 2)• Case #2 – under future (2030) without recommendations condition (from Chapter 3)• Case #3 – under future (2030) with the recommendations condition (from this
chapter)
Tables 7-6 and 7-7 (on page 112) compare information from Case #1, Case #2, andCase #3. Table 7-6 provides comparisons for total vehicle miles of travel by level of service. Table 7-7 compares vehicle hours of travel, vehicle delay in hours, persondelay in hours, and Congestion Severity Index for freeways and surface arterialsrespectively. The following conclusions can be drawn from these tables:
1) Total vehicle miles of travel (VMT) for Case #2 and Case #3 is approximately thesame. However, VMT for both Case #2 and Case #3 is higher than Case #1.
2) The VMT for roadways operating at congested levels of service (LOS "D", "E",and "F") is significantly lower in Case #3 than in Case #2.
3) Vehicle hours of delay and person hours of delay are significantly lower in Case#3 than in Case #2.

8/9/2019 CMS Performance and Strategy Evaluation Report AMATS
http://slidepdf.com/reader/full/cms-performance-and-strategy-evaluation-report-amats 105/115
103
4) Both Case #2 and Case #3 have higher vehicle hours of delay and person hoursof delay than Case #1. Therefore, if current demographic trends continue, trafficcongestion will continue to worsen (although at a substantially slower rate inCase #3 than in Case #2) over the next 27 years.
Summary
There are 160 CMS recommendations for freeways, arterials, and intersections listed inthis chapter. These recommendations are expected to improve the operating conditionsof the transportation system at both the project and the system level. The estimatedtotal cost of implementing these recommendations is approximately $2.6 billion.
The CMS recommendations described in this chapter will be taken into consideredalong with other highway needs, public transportation needs, and transportationenhancement needs as the financially constrained AMATS 2030 Regional Transportation Plan is developed.

8/9/2019 CMS Performance and Strategy Evaluation Report AMATS
http://slidepdf.com/reader/full/cms-performance-and-strategy-evaluation-report-amats 106/115
104

8/9/2019 CMS Performance and Strategy Evaluation Report AMATS
http://slidepdf.com/reader/full/cms-performance-and-strategy-evaluation-report-amats 107/115
8
5
8
8
5
14
91
21
82
44
59
18
43
44
21
94
21
14
44
43
59
93
91
94
44
14
43
8244 88
14
59
82
43
91
21
57
82
18
8844
305
77
77
80
80
76
76
77
77
80
76
76
76
176
764
585
532
162
261
619
303
241
306
225
604
619
183
241
183
303
261
225
261
282
303
236
303
700
277
271
480
271
480
224
422
224224
224
224
224
Map 7-1CONGESTION MANAGEMENT SYSTEM
RECOMMENDATIONS - FREEWAYSAdditional Lanes, Reconfigure access and ITS
Additional Lanes and ITS
Reconfigure access and ITS
Reconfigure Interchange
ITS-Freeway Management System
More Frequent Express Bus Service
Expand Park and Ride LotOctober 2004
0 1 2 3 4Miles
1 0 5

8/9/2019 CMS Performance and Strategy Evaluation Report AMATS
http://slidepdf.com/reader/full/cms-performance-and-strategy-evaluation-report-amats 108/115
106
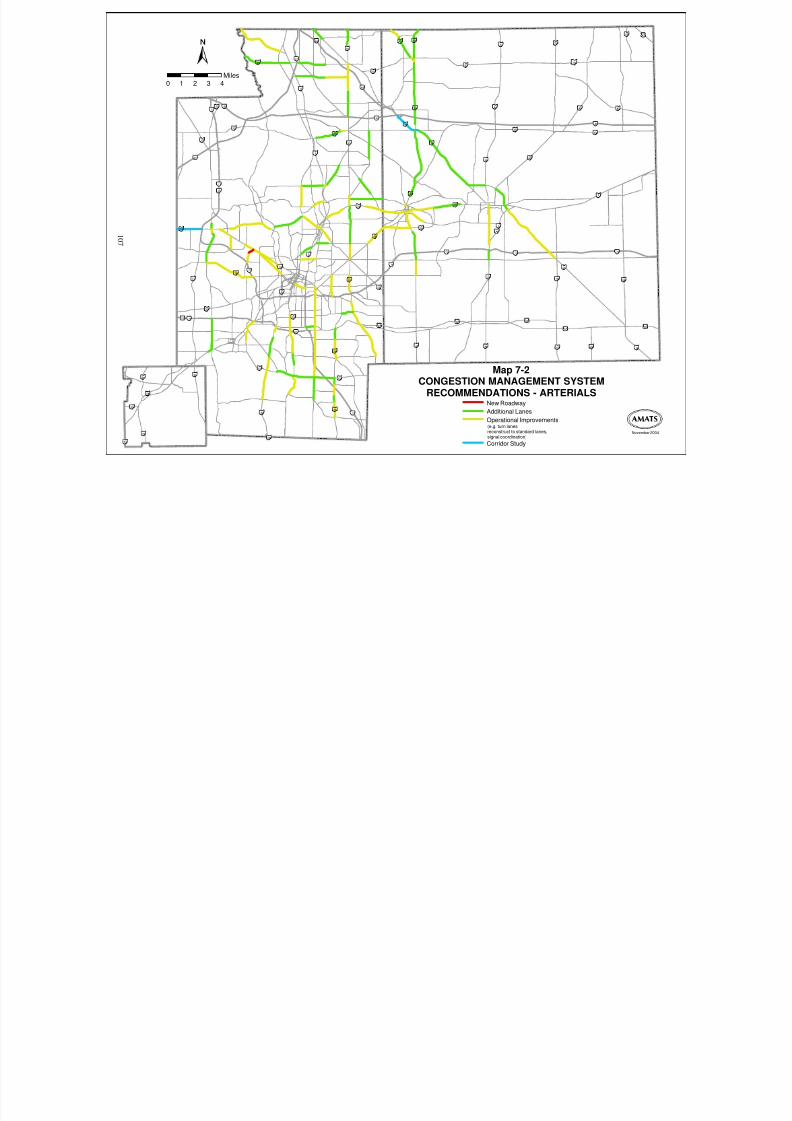
8/9/2019 CMS Performance and Strategy Evaluation Report AMATS
http://slidepdf.com/reader/full/cms-performance-and-strategy-evaluation-report-amats 109/115
8
5
8
8
5
14
91
21
82
44
59
18
43
44
21
94
21
14
44
43
59
93
91
94
44
14
43
8244 88
14
59
82
43
91
21
57
82
18
8844
305
77
77
80
80
76
76
77
77
80
76
76
76
176
764
585
532
162
261
619
303
241
306
225
604
619
183
241
183
303
261
225
261
282
303
236
303
700
277
271
480
271
480
224
422
224224
224
224
224
Map 7-2CONGESTION MANAGEMENT SYSTEM
RECOMMENDATIONS - ARTERIALSNew Roadway
Additional Lanes
Operational Improvements
Corridor Study
November 2004
0 1 2 3 4Miles
(e.g. turn lanes,reconstruct to standard lanes,signal coordination)
1 0 7

8/9/2019 CMS Performance and Strategy Evaluation Report AMATS
http://slidepdf.com/reader/full/cms-performance-and-strategy-evaluation-report-amats 110/115
108

8/9/2019 CMS Performance and Strategy Evaluation Report AMATS
http://slidepdf.com/reader/full/cms-performance-and-strategy-evaluation-report-amats 111/115
8
5
8
8
5
14
91
21
82
44
59
18
43
44
21
94
21
14
44
43
59
93
91
94
44
14
43
8244 88
14
59
82
43
91
21
57
82
18
8844
305
77
77
80
80
76
76
77
77
80
76
76
76
176
764
585
532
162
261
619
303
241
306
225
604
619
183
241
183
303
261
225
261
282
303
236
303
700
277
271
480
271
480
224
422
224224
224
224
224
Map 7-3CONGESTION MANAGEMENT SYSTEM
RECOMMENDATIONS - INTERSECTIONS
November 2004
0 1 2 3 4Miles
Realign IntersectionIntersection UpgradeNew Roadway
1 0 9

8/9/2019 CMS Performance and Strategy Evaluation Report AMATS
http://slidepdf.com/reader/full/cms-performance-and-strategy-evaluation-report-amats 112/115
110

8/9/2019 CMS Performance and Strategy Evaluation Report AMATS
http://slidepdf.com/reader/full/cms-performance-and-strategy-evaluation-report-amats 113/115
A B C D E F Totals
5,782 1,941 665 167 49 1 8,605
67.2% 22.6% 7.7% 1.9% 0.6% 0.0% 100%
63,096 8,369 3,410 974 336 47 76,232
82.8% 11.0% 4.5% 1.3% 0.4% 0.1% 100%
Freeways 4,781,400 3,922,453 1,938,092 643,277 249,377 5,714 11,540,313
Arterials 7,066,113 3,978,507 2,221,690 801,900 342,512 59,069 14,469,791
Freeways 81,436 67,030 33,603 11,598 4,763 370 198,800
Arterials 164,051 104,925 67,723 29,999 18,481 6,652 391,831
Freeways 58.9 58.3 57.1 49.4 50.7 15.3 N/A
Arterials 44.8 39.0 33.6 27.0 20.7 8.5 N/A
A B C D E F Totals71 144 95 30 18 0 359
19.8% 40.1% 26.5% 8.3% 5.1% 0.1% 100%
1,726 600 435 245 143 26 3,176
54.4% 18.9% 13.7% 7.7% 4.5% 0.8% 100%
Freeways 88,326 289,212 282,761 114,945 93,853 1,949 871,046
Arterials 252,894 291,380 293,285 208,448 149,970 33,363 1,229,340
Freeways 1,496 4,898 4,900 2,099 1,797 124 15,314
Arterials 6,032 7,796 8,825 7,675 8,437 3,765 42,530
Freeways 59.1 59.3 57.9 54.8 50.1 15.5 N/A
Arterials 43.2 39.0 34.8 28.7 18.6 8.4 N/A
Vehicle Miles Traveled
Vehicle Hours Traveled
Table 7-5
2030 Future Level of Service with Recommendations (Peak Hour 4-5 P.M.)
Vehicle Hours Traveled
Total Number of Miles
Level of Service
Level of Service
Table 7-4
2030 Future Level of Service with Recommendations (24-Hour Period)
Average Speed in MPH
Arterials
Freeways
Total Number of Miles
Freeways
Arterials
Average Speed in MPH
Vehicle Miles Traveled
111

8/9/2019 CMS Performance and Strategy Evaluation Report AMATS
http://slidepdf.com/reader/full/cms-performance-and-strategy-evaluation-report-amats 114/115
Case # Time Period A B C D E F Total
10,829,400 4,817,298 2,371,100 784,984 293,518 25,531 19,121,831
56.6% 25.2% 12.4% 4.1% 1.5% 0.1% 100.0%10,900,630 7,195,515 4,898,071 1,989,960 887,635 196,993 26,068,804
41.8% 27.6% 18.8% 7.6% 3.4% 0.8% 100.0%
11,847,513 7,900,960 4,159,782 1,445,177 591,889 64,783 26,010,104
45.5% 30.4% 16.0% 5.6% 2.3% 0.2% 100.0%
946,883 705,445 -738,289 -544,783 -295,746 -132,210 -58,700
8.7% 9.8% -15.1% -27.4% -33.3% -67.1% -0.2%
24 Hours PM Peak 24 Hours PM Peak 24 Hours PM Peak 24 Hours PM Peak
1 Existing (2003) 148,207 11,345 1,546 469 2,142 647 19.02 1.48
Future (2030) 196,593 15,268 4,238 1,089 5,931 1,503 23.38 1.82
48,385 3,922 2,692 620 3,789 856 4.36 0.34
32.6% 34.6% 174.1% 132.3% 176.9% 132.3% 22.9% 23.0%
Future (2030) with
Recommendations198,800 15,314 2,780 751 3,873 1,037 20.27 1.57
2,207 46 -1,458 -338 -2,058 -466 -3.11 -0.25
1.1% 0.3% -34.4% -31.0% -34.7% -31.0% -13.3% -13.7%
1Existing (2003) 274,986 27,926 10,027 3,943 14,187 5,442 9.33 0.78
Future (2030)416,617 47,202 37,141 13,086 52,768 18,059 11.99 1.00
141,631 19,276 27,115 9,143 38,582 12,617 2.66 0.22
51.5% 69.0% 270.4% 231.8% 272.0% 231.8% 28.5% 28.2%
Future (2030) with
Recommendations391,831 42,530 22,637 9,132 32,006 12,603 11.48 0.96
-24,786 -4,671 -14,504 -3,954 -20,762 -5,456 -0.51 -0.04
-5.9% -9.9% -39.1% -30.2% -39.3% -30.2% -4.3% -4.0%
CMS Performance MeasuresTable 7-7
1 Existing (2003)
3
Future (2030) with
Recommendations
Increase in VMT (case #3 to case
#2)
Future (2030)
3Increase in Arterial Congestion
Indicators (case #3 to case #2)
ARTERIALS
Time Period
3
FREEWAYS
2Increase in Freeway Congestion
Indicators (case #2 to case #1)
Congestion Severity
Index
Person Delay in
Hours
Table 7-6
Vehicle Miles of Travel (VMT) - (24-Hour Period)
2Increase in Arterial Congestion
Indicators (case #2 to case #1)
2
Case #
Vehicle Hours of Travel
(VHT)
Vehicle Delay in
Hours
VMT by Level of Service
Increase in Freeway Congestion
Indicators (case #3 to case #2)
112

8/9/2019 CMS Performance and Strategy Evaluation Report AMATS
http://slidepdf.com/reader/full/cms-performance-and-strategy-evaluation-report-amats 115/115
Metropolitan Transportation Policy Committee Technical Advisory Committee
Chairman - Mr. Michael A. Marozzi Chairman - Mr. Peter Bell
Vice Chairman - Mr. David J. Celik Vice Chairman - Mr. John Trew
AKRON - Mayor Donald L. Plusquellic AKRON - Mr. Mike Madonio
AURORA - Mayor Lynn McGill AKRON - Mr. Ralph Coletta
BARBERTON - Mayor Randy Hart AKRON - Mr. Dave Gasper
BOSTON HEIGHTS - Mayor Raymond McFall AURORA - Mr. John E. Trew
BRADY LAKE - Mayor Hal Lehman BARBERTON - Mr. James L. Beckett
CLINTON - Mayor Thomas Mayberry BARBERTON - Mr. William Courson
CUYAHOGA FALLS - Mayor Don Robart CUYAHOGA FALLS - Mr. Peter BellDOYLESTOWN - Mayor Terry L. Lindeman CUYAHOGA FALLS - Mr. Fred Guerra
FAIRLAWN - Mayor William J. Roth DOYLESTOWN - Engineering Associates
GARRETTSVILLE - Mayor Craig Moser FAIRLAWN - Mr. Nicholas Spagnuolo
GREEN - Mayor Dan Croghan GREEN - Mr. Wayne Wiethe
HIRAM - Mayor Robert Summers GREEN - Mr. Paul Pickett
HUDSON - Mayor William A. Currin HUDSON - Mr. David McCallops
KENT - Mr. Bill Lillich HUDSON - Mr. Mark Richardson
MACEDONIA - Mayor Don Kuchta KENT - Mr. Eugene Roberts
MANTUA - Mayor Claude Hopkins KENT - Mr. Max Johns
MOGADORE - Mayor Steve Marks MACEDONIA - Mr. John Chasteen
MUNROE FALLS - Mayor Frank Larson MOGADORE - Vacant
NEW FRANKLIN - Mayor Robert A. Lockhart MUNROE FALLS - Mr. Don Brooker
NORTHFIELD - Mayor Victor F. Milani NORTHFIELD - Mr. Richard Wasosky
NORTON - Mayor Joe Kernan NORTON - Mr. Jeff Pritchard
PENINSULA - Mayor Michael J. Kaplan RAVENNA - Mr. Mark Bowen
RAVENNA - Mayor Paul Jones RICHFIELD - Mr. Ralph Waszak, Sr.REMINDERVILLE - Mayor Sam Alonso SILVER LAKE - Mr. Richard Fenwick
RICHFIELD - Mayor Michael K. Lyons STOW - Mr. James McCleary
SILVER LAKE - Mayor Warner D. Mendenhall STOW - Mr. Ken Trenner
STOW - Mayor Karen Fritschel STREETSBORO - Mr. Bill Rudlosky
STREETSBORO - Mayor Mark J. Pavlick TALLMADGE - Mr. Pat Sauner
SUGAR BUSH KNOLLS - Mayor Nancy S. Carstensen TWINSBURG - Mr. Dan Moczadlo
TALLMADGE - Mayor Christopher B. Grimm SUMMIT COUNTY ENGINEER - Mr. Greg Bachman
TWINSBURG - Mayor Katherine A. Procop PORTAGE COUNTY ENGINEER - Mr. Michael Marozzi
SUMMIT COUNTY ENGINEER - Mr. Greg Bachman PORTAGE COUNTY TOWNSHIP ASSOCIATION - Ms. Connie Leedom
SUMMIT COUNTY EXECUTIVE - Mr. James McCarthy METRO RTA - Mr. Robert Pfaff
SUMMIT COUNTY - Mr. Joseph Migliorini NEFCO - Mr. Joseph Hadley
SUMMIT COUNTY - Mr. Jim Oberdorfer ODOT - Mr. Mohamed Darwish
PORTAGE COUNTY ENGINEER - Mr. Michael Marozzi PARTA - Mr. John Drew
PORTAGE COUNTY COMMISSIONER - Mr. Charles Keiper II PORTAGE COUNTY REGIONAL PLANNING COMMISSION - Ms. Lynn Erickson
PORTAGE COUNTY COMMISSIONER - Ms. Maureen Frederick PORTAGE COUNTY SMALL VILLAGES - Vacant
PORTAGE COUNTY COMMISSIONER - Mr. Christopher Smeiles SUMMIT COUNTY PLANNING DEPARTMENT - Mr. Jim Oberdorfer
WAYNE COUNTY - Mr. Mark Spademan SUMMIT COUNTY TOWNSHIP ASSOCIATION - Ms. Betty Klingenberg
ODOT - Mr. Mohamed Darwish SUMMIT COUNTY SMALL VILLAGES - Ms. Marilyn Moses
METRO RTA - Mr. Bernard Bear
PARTA - Mr. Pat McCon Non-Voting Members
Non-Voting Member Akron Canton Airport - Mr. Frederick Krum
AKRON METROPOLITAN AREA TRANSPORTATION STUDY