cnts in polymer melt: the influence on dispersion by ... · pdf filecnts in polymer melt: the...
TRANSCRIPT

CNTs in polymer melt: The influence on dispersion by
sonication
M Bischoff
1, T Köhler
1, J. Bandelin
2, J. Möhricke
2, R. Jung
2, T Gries
1
1 Rheinisch Westfälische Technische Hochschule, Institut für Textiltechnik, Otto-
Blumenthalstraße 1, 52074 Aachen, Germany 2 BANDELIN electronic GmbH & Co. KG, Heinrichstraße 3-4, 12207 Berlin,
Germany
Abstract
Nanocomposites have become more important as the implementation of nanoparticles in
polymer allows additional functions in common industrial parts. Especially in the fabrication of
filaments or fibres nanomodification is crucial, as only very small fillers can be added to the
very fine fibres (common fibre diameter is 20 µm, fine filaments are 1 µm). [1,2]
Discharging fibres, conductive fibres and many other functional fibres raise in their
importance nowadays, as the need for highly functional but flexible surfaces, such as textiles
rises. Especially the dispersion quality is essential for the final enhancement of the filament
properties. Homogeneously distributed particles serve function throughout the full fibre giving
equal mechanical and functional properties over the length of the fibre and of the manufactured
textile [3,4]. Counteracting this requirement nanoparticles tend to form agglomerates due to
their high specific surface area during the manufacturing of those nanocomposites [5].
In this paper the distribution and dispersion methods are introduced. The homogenization
of carbon nanoparticles in polymer melt is enhanced by a novel sonication unit of ITA and
BANDELIN electronic GmbH & Co. KG. The first development steps of the semi-industrial
unit fabrication as well as the first experimental results in the lab scale of the modification of
the dispersion will be shown. Special focus will be laid on the sealing of the new sonication
unit as well as the positioning and equipment size when being implemented in an existing melt
spinning unit.
The paper will show the status of the project as well as the next steps, to show other
participants the potential of the newly developed unit.
1. Introduction
Distribution (equivalent distribution over the polymer matrix) and dispersion (disaggregation of large
aggregates to form single particles) of nanoparticles in a polymer matrix can be enhanced via several
methods [6]:
Melt mixing
Solution mixing
In-situ polymerisation
Particle functionalization
dispersing agent
Ultra-sonication dispersion

Within the direct melt mixing process melt viscosity, temperature, pressure and design of twin
screws are the most important process influences on the particle distribution and dispersion. Currently
this is the most relevant compounding process to produce compounds efficiently. [7, 8] Though the
impact of these influences depends on polymer and particle, high sheering rates and long residence
times are known to counteract particle accumulation. On the contrary, both high sheer rates and long
residence times can cause chain degradation of the polymers and thereby drive the decline of product
quality. Additionally, besides the filler agglomerates some nanoparticles themself, e.g. on carbon nano
tubes (CNTs), tend to rupture under high sheer stress. Thereby they lose their functionality. [9, 10]
Finally, melt mixing cannot be applied with high sheer rated and long residence times for all mixtures.
Alternatively, solution mixing can be used, where both dissolved polymer and nanoadditives are
mixed. When both mixtures have a low viscosity, high quality dispersions can be reached.
Unfortunately, following the removal of the (potentially toxic) solvent, particles tend to re-
agglomerate. Furthermore, the removal of the solvent can be work, and therefore cost intensive. [11,
12, 13, 14, 15]
In-situ polymerization is used for simultaneous nanocomposite production and homogenisation.
For this treatment nanoparticles are added to the monomers. The monomer`s viscosity is low and
allows homogeneous mixtures. Unfortunately, the manufacture at industrial scale is not economical for
specialized processes due to the high effort required. [16, 17]
Particle functionalization through covalent or non-covalent bonds can be achieved via linkage of
atoms or molecules to reduce interactive forces between the particles. As this procedure is work
intensive it is only performed in the lab scale. [18, 19, 20]
Dispersing agents are based on one of the three mechanisms as shown in Figure 1:
Electrostatic (in polar fluids, acting through polar-polar repulsion)
Steric (long-chained molecules prevent assembly)
Electrosteric (combination of electrostatic and steric)
These dispersing agents rely on the effect that both electrostatic and steric agents enlarge the
distance between the particles and thereby avoid the formation of agglomerates. The repulsion of the
particles beneath each other or the use of spacers or their combination is shown respectively in Figure
1.
Figure 1. Mechanisms of dispersing agents for nanoparticles; a) electrostatic, b) steric, c) electrosteric
[21]
In ultra-sonication dispersion cavitation effects, based on the implosion of cavitation bubbles
forming micro-currents (jets) at high sonication intensities, are used. While this method is common for
the rupture of 3D networks of vulcanised rubber [22, 23], the dispersion of nanoparticles in polymer
melt has only been used at the lab scale [20, 24, 25, 26]. Here the method was successful at destroying
agglomerates and achieving homogeneous particle distributions. The implementation of this method in
a semi-industrial spinning line is covered in the following. The potential use of dispersing agents in
such a system is so far not covered, to avoid interactions.

2. Theoretical unit design
A common melt spinning process consists of an extrusion unit, a spinning unit and a take-up unit.
For the implementation of a sonication unit in such a process, only the extrusion unit has to be
modified, as this is the part, where the polymer is available as liquid melt. The implementation of the
sonication unit is achievable at several positions. As the particles tend to re-agglomerate, though they
were primarily homogeneously dispersed in the extruder, the implementation of the sonication unit at
the latest point possible is recommended. Therefore the unit is implemented right before the spin pack.
The spin pack consists of several filtration units (filter meshes and filter sands) and therefore requires
a melt without agglomerates. The set-up is shown in Figure 2.
spin pack
conduct
extruder
hopper
sonication
device
spin pump
filament
Figure 2. Position of the implementation of a sonication unit in a spinning line at the latest possible
step of the extrusion unit
The ultra-sound can be applied via several set-ups. Number of sonication units, direction of
implementation and strength of implementation of the ultra-sound are considered in this set-up. So far
the units are going to be implemented individually. This allows to determine the effect of dispersion of
one sonication device, but could also give information on multiple sonication units, when the material
is re-entering the extruder after the first trial. For this study the implementation direction design
involves both radial insertion from all sides through four units as well as a linear exposure through a
rod sonotrode, that is implemented to the melt path from one side only. The aim is to achieve a
maximum intensity of 400 W with a single sonotrode, while the radial unit can add up to 1.000 W.As

the implementation of both units does not allow to visually investigate the dispersion quality in the
melt duct right after sonication application separate tests were conducted on the lab scale.
3. Test design
Lab scale sonication tests are conducted as the direct sonication impact cannot be visualized directly in
the melt spinning process, as the system is enclosed. Sonication influences can only be measured by
investigation of final particle dispersion in the melt/filament and/or by examination of the remains,
e.g. particle lumps and their position, in the filters. Here agglomerates and inhomogeneous
distributions can be detected visually via microscopy. Nevertheless it is important to understand
further influences, as melt behaviour, jet formation and temperature variation in the sonication area as
well, which cannot be detected afterwards. Therefore a sonication test is designed.
For simple set up a rod sonotrode is used. Radial sonication is preliminarily excluded, as the
system is then already enclosed from four sides and does not allow as much insight as the rod system.
For the experimental design a standard ultrasonic transducer type UW 200 equipped with a sonotrode
type TS 410 and a sonopuls ultrasonic homogenizer HD 4100 by BANDELIN electronic GmbH & Co.
KG, Berlin, Germany is used. In an oven by Fourné, Maschinenbau GmbH, Alfter, Germany, roughly
20 g of polycaprolactone (PCL) Capa 6506 supplied by Perstorp Specialty Chemicals AB, Perstorp,
Schweden, is melted at 200 °C in a 100 ml glass beaker for 240 min. The beaker is then transferred a
heating plate, positioned underneath the sonication device to retain the temperature. Multiwall carbon
nanotubes (MWCNTs) type NC7000, produced as a powder via vapor depositioning, supplied by
Nanocyl NA, Sambreville, Beligium are added on the melt via a spatula. Through lowering the
sonotrode into the powder, it is pushed into the melt. No further stirring is applied. The sonotrode is
inserted into the melt by about 1 cm and sonication is applied at an amplitude of 100 % without
pulsation for 90 seconds to include an energy of 19.413kJ. The set-up is shown in Figure 3.
Sonotrode
Glass
Table
Heating plate
Melt
Figure 3. Schematic set-up of the sonication device and beaker
Throughout the experiment melt temperature measurements are conducted on a thermal camera
type Flir SC 640 by Flir Systems, Wilsonville, USA.
After sonication the final mixture is poured out to form a thick film. This film break in sharp edges
and these breaking edges are investigated in microscopy to investigate the particle distribution.

4. Results and discussion
When exposing a polymer melt and added CNTs to ultrasound, a mixture was successfully
prepared. Prove of principal was therefore successful. The used sonotrode is able to initiate ultrasonic
energy into the polymer melt.The results of the thermal camera measurements are shown in Figure 4.
Here it can be seen, that the preheated melt quickly loses its temperature when positioned outside of
the oven. On the other hand the sonication implied heating starts to heat the system after 45 s as the
dissipating energy is smaller, that the sonication energy applied. This combination of applied energy to
form heat in the system, resulting in lower melt viscosity, and start of a mixing process enables high
quality mixing of polymer melt and CNTs via ultrasonic dispersion. By microscopy it was able to
show that agglomerates can be destroyed.
t= 0 s t= 45 s t= 90 s
Tmax= 143 C Tmax= 113 C Tmax= 150 C
135 C
10 C
sonotrode
beaker
Figure 4. Thermal pictures of the beaker with melt at time t= 0 s, 45 s and 90 s with the according
maximum melt temperature.
5. Outlook
After giving first proof of principal for the used sonotrode the finalization of sonication device
design has to be done. Here especially the sealing of parts against melt flow is important to consider
and investigate. When the concept is finalized, the ultrasound device is manufactured and
implemented in the melt spinning line. From a CNT polymer compound fibres will be produced,
which will then be analysis via conductivity tests, to ensure homogeneous antistatic properties, and
additionally, microscopy is used to check for homogeneous distribution of CNTs in the fibre and to
measure the particle size of remaining particles/agglomerates to ensure great distribution.
Acknowledgements
This work has been supported by the Bundesministerium für Wirtschaft und Technologie (BMWi)
under the grant ZIM (AiF FKZ ZF4018738ST6, Entwicklung eines Inline Ultraschall-Feindispergators
zur Auflösung von Agglomeraten in Polymerschmelze bei der Herstellung von Monofilamenten).
References
[1] Walter S: Entwicklung piezoelektrisch wirksamer Sensorfasern auf Basis von
Polyvinylidenfluorik, Aachen, RWTH Aachen University, Dissertation Shaker Verlag (2012)
5 cm
[2] Steinmann W: Elektrisch leitfähige Polymerfasern aus Nanoverbundwerkstoffen, Aachen,
RWTH Aachen University, Dissertation Shaker Verlag (2014)
[3] Leute, U: Elektrisch leitfähige Polymerwerkstoffe: ein Überblich für Studierende und Praktiker,
Wiesbaden, Springer Verlag (2015)
[4] Heiser J A, King J A, Konell J P, Sutter L L 2004 Electrical Conductivity of Carbon Filled
Nylon 6.6. Advances in Polymer Technology, 23 (2004) 2, pp 135-146
[5] Moller B: Herstellung, Charakterisierung und Weiterverarbeitung von Carbon Nanotube
Dispersionen, Universität Stuttgart, Dissertation (2013)
[6] Yoon H, Yamashita M, Ata S, Futaba DN, Yamada T, Hata K 2015 Controlling exfoliation in
order to minimize damage during dispersion of long SWCNTs for advanced composites
Scientific Reports 4 (2015) p 3907
[7] Fasulo P D, Rodgers W M, Ottaviani R A 2004 Extrusion processing of TPO nanocomposites
Polymer Engineering & Science, 44 (2004) 6, p 1036
[8] Wagenknecht U et al. 2008 Polymere Nanokomposite mit anorganischen Funktionsfüllstoffen
Chemie Ingenieur Technik, 80 (2008) 11, p 1683
[9] Shen J, Han X, Lee L J 2005 Nucleation and reinforcement of carbon nanofibres on polystyrene
nanocomposite foam (2005)
[10] Dennis H R et al. 2001 Effect of melt processing conditions on the extent of exfoliation in
organoclay-based nanocomposites Polymer 42 (2001) 23, p 9513
[11] Safadi B et al. 2002 Multiwalled carbon nanotube polymer composites: Synthesis and
characterization of thin films J. Appl. Polym. Sci. 84 (2002) 14, p 2660
[12] Vaia R A et al. 1997 Relaxations of confined chains in polymer nanocomposites: Glass
transition properties of poly(ethylene oxide) intercalated in montmorillonite J. Polym. Sci. B
Polym. Phys. 35 (1997) 1, p 59
[13] Ogata N et al. 1997 Poly(vinyl alcohol)-clay and poly(ethylene oxide)-clay blends prepared
using water as solvent, J. Appl. Polym. Sci. 66 (1997) 3, p 573
[14] Billingham J et al. 1997 Adsorption of polyamine, polyacrylic acid and polyethylene glycol on
montmorillonite: An in situ study using ATR-FTIR Vibrational Spectroscopy 14 (1997) 1, p
19
[15] Kymakis E et al. 2002 Single-walled carbon nanotube–polymer composites: electrical, optical
and structural investigation, Novel organic material and technological advances for
photonics, 127, (2002) 1–3, p 59
[16] Huang X and Brittain W J 2001 Synthesis and Characterization of PMMA Nanocomposites by
Suspension and Emulsion Polymerization, Macromolecules 34 (2001) 10, p 3255
[17] Park C et al. 2002 Dispersion of single wall carbon nanotubes by in situ polymerization under
sonication, Chemical Physics Letters 364 (2002) 3–4, p 303
[18] Hirsch A 2002 Functionalization of Single-Walled Carbon Nanotubes, Angewandte Chemie
International Edition 41 (2002) 11, p 1853
[19] Ma P-C et al. 2010 Dispersion and functionalization of carbon nanotubes for polymer-based
nanocomposites: A review, Composites Part A: Applied Science and Manufacturing 41
(2010) 10, p 1345
[20] Isayev A I et al. 2009 Ultrasound assisted twin screw extrusion of polymer–nanocomposites
containing carbon nanotubes, Polymer 50 (2009) 1, 250
[21] Reindl A Dispersing and Stabilizing Semiconducting Nanoparticles for Application in Printable
Electronics, Doktorarbeit, Universität Erlangen-Nürnberg, (2009)
[22] Hong C K and Isayev A I 2002 Continuous ultrasonic devulcanization of NR/SBR blends, J.
Appl. Polym. Sci. 83 (2002) 1, p 160
[23] Kook Hong C and Isayev A I 2002 Blends of ultrasonically devulcanized and virgin carbon
black filled NR, Journal of Materials Science 37 (2002) 2, pp 385-388
[24] Isayev A I et al. 1990 Effect of oscillations during extrusion on rheology and mechanical
properties of polymers, Adv. Polym. Technol. 10 (1990) 1, p 31

[25] Kim H et al. 2002 Evolution of phase morphology and in-situ compatibilization of polymer
blends during ultrasound-assisted melt mixing, Korea-Australia Rheol. J. 14 (2002) 3, p 121
[26] Ryu J G et al. Power ultrasound effects for in situ compatibilization of polymer–clay
nanocomposites, Materials Science and Engineering: C 24 (2004) 1-2, p 285

Preparation and properties of electro-conductive fabrics
based on polypyrrole: covalent vs. non-covalent attachment
N C David1, D Anavi
1, M Milanovich
1, Y Popowski
1, L Frid
2, and E Amir
1
1Shenkar, Faculty of Engineering and Design, Department of Polymers and Plastics
Engineering, Ramat Gan 5252626, Israel 2School of Chemistry, Raymond and Beverly Sackler Faculty of Exact Sciences Tel
Aviv University, Tel Aviv, Israel
E-mail: [email protected]
Supporting information is available
Abstract. Electro-conductive fabrics were prepared via in situ oxidative polymerization of
pyrrole (Py) in the presence of unmodified and chemically modified cotton fabrics. Chemical
modification of cotton fabric was achieved by covalent attachment of a bifunctional linker
molecule to the surface of the fabric, followed by incorporation of a monomer unit onto the
linker. The fabrics were characterized using Fourier transform infrared spectroscopy, X-ray
photoelectron spectroscopy, scanning electron spectroscopy, and thermal analysis.
Furthermore, the effect of Py concentration on the degree of polypyrrole (PPy) grafting,
surface morphology, electrical resistivity, and laundering durability were studied for both types
of cotton fabrics. Reductions of several orders of magnitude in surface and volume electrical
resistivities were observed for both non-covalently and covalently linked cotton-PPy systems,
whereas the effect of covalent pre-treatment of the fabric was stronger at low Py concentration.
On the other hand, at higher monomer concentration, the electrical properties and laundering
durability of the fabrics we comparable for both unmodified and chemically pre-treated cotton
fabrics, indicating that only a small fraction of PPy chains were chemically grafted onto the
fabric surface with the majority of the polymer being connected to the fabric through hydrogen
bonds.
1. Introduction Over the past few decades, intrinsically conductive polymers (ICPs) have been in the center of
extensive research due to their unique properties, which include electrical conductivity, light weight,
and solution processability [1–3]. Consequently, ICPs have found numerous applications in a range of
flexible and low-cost organic electronic devices such as organic photovoltaics (OPVs), light emitting
diodes (LEDs), field effect transistors (FETs), sensors, actuators and more [4–10]. Due to their
mechanical flexibility, electro-conductive polymers have been applied as thin layers on a variety of
rigid and flexible substrates such as glass, silicon wafers, polyesters, and fabrics [11–13]. Combining
fabric with ICPs opens possibilities for production of smart textiles with advanced properties such as
electrical conductivity, dissipation of static charges and microwave energy, shielding of
electromagnetic radiation, heat generation, and sensing. Consequently, the potential applications of
electro-conductive fabrics based on organic polymers span over a wide range of areas such as military,
sportswear, protective clothing, and medical garments [14–23]. The properties of the ICP-fabric
systems depend on the type of polymer, type of fabric, the yarn density of the fabric, and the
processing method used.
Among different types of ICPs that have been applied to textiles, polyaniline (PANI),
polythiophene (PT) and polypyrrole (PPy) show the most promising results it terms of high electrical
conductivity and simple processing. The two main methods for incorporation of ICPs into fabrics
include direct coating with the solution of ICP or in situ polymerization of the precursor monomers in
the presence of fabric. It was previously shown that direct coating can be achieved by spray painting
and hand brushing [24] or dip coating techniques [25], whereas in situ polymerization is generally
performed either in solution using oxidative coupling polymerization [15–19,22,23,26,27] or by the
exposure of the fabric to the monomer in vapor phase [28,29]. It is important to establish a uniform
polymer coating that allows an efficient charge transport without significantly affecting the
mechanical properties of the fabric. In most studied systems, these methods result in a formation of
physical bonding between the fabric and the conductive polymer coating; a very limited number of
studies have described chemical grafting of ICPs to the fabric [30,31].
Herein, we report a simple method for the preparation of PPy-based electro-conductive cotton
fabrics obtained by covalent grafting of conjugated monomers to the surface of the fabric, followed by
in situ polymerization of pyrrole (Py). To establish a covalent bonding between the monomers and the
fabric, the fabric was first grafted with a bifunctional linker molecule, 10-undecenoyl chloride, which
contains acyl chloride and alkene groups. The acyl chloride group of the linker reacted with the
hydroxyl present on the surface of cotton, forming an ester bond, and the remaining alkene moiety was
used for covalent binding to the conjugated monomer using thiol-ene click reaction conditions [32,33].
In situ oxidative polymerization of Py was done using ferric chloride as an oxidant and water as a
solvent. One of the main goals of the study was to examine the effect of chemical pretreatment of the
fabric on the electrical resistivity and laundering durability of the electro-conductive coating. This was
done in comparison with the PPy-cotton system having only physical bonding between PPy and
cotton. In addition, the effect of the amount of Py monomer used for the polymerization on the degree
of PPy grafting, electrical resistivity, and final morphology of the polymer on the surface of the fabric
was also studied. The fabrics were characterized using Fourier transform infrared (FTIR)
spectroscopy, X-ray photoelectron spectroscopy (XPS), scanning electron microscopy (SEM), and
elemental and thermal analyses.
2. Experimental
2.1 Materials
Cotton woven fabric (100% cotton, weight: 147 g m-2) was used as a substrate textile and washed
twice in a washing machine at 90 before use. The fabric was dried in a vacuum oven at 65 for 12
hours prior to use. Py and triethylamine were purchased from Merck. Chloroform, dichloromethane,
and hexane were purchased from Bio-Lab Ltd. 10-Undecenoyl chloride, 2-thiophenethiol, 2,2-
dimethoxy-2-phenyl-acetophenone (DMPA), 3-hexylthiophene (3HT), ferric chloride, acetonitrile, and
chlorobenzene were purchased from Sigma-Aldrich and used as received.
2.2. Characterization
The degree of PPy grafting was estimated according to the following equation:
𝑊𝑡% = 𝑊𝑓− 𝑊𝑖
𝑊𝑖× 100 (1)
where Wt% is weight percent, and Wi and Wf are the initial and final weights, respectively. The
measurements were carried out on three specimens for each sample and the average Wt% is reported.

FTIR spectra were measured using a Bruker Alpha-P FTIR spectrometer with an attenuated total
reflectance (ATR) crystal. Spectra were recorded in a range between 400–4000 cm-1
at a resolution of
2 cm-1 with 24 scans.
XPS signals were recorded with Kratos Axis Ultra spectrometer using an Al Kα monochromatic
radiation X-ray source (1486.7 eV). Data were collected and analyzed by using a Casa XPS (Casa
Software Ltd.) and the Vision data processing program (Kratos Analytical Ltd.). High-resolution XPS
spectra were collected with a takeoff angle of 90° (normal to analyzer); vacuum condition in the
chamber was 1.9 x 10⁹ Torr, for the C 1s, O 1s, N 1s, Cl 2p, and S 2p levels with pass energy of 20
and 0.1 eV step size. The binding energies were calibrated using C 1s peak energy as 285.0 eV.
Elemental analysis for N, C, H, O, and S were performed in triplicate for each studied PPy-cotton
system. The samples were weighed using a Sartorius microbalance to the nearest 1 μg and analyzed
with a Thermo Flash EA-1112 Elemental analyzer. The instrument was calibrated with special
standards for elemental analysis.
Contact angles were measured with a Dataphysics-OCA20 system at the standard atmosphere
conditions (25 °C and 60% relative humidity) using 5 μL deionized water droplets. All reported values
of the contact angles were determined by averaging values measured at least on 5 different points for
each sample surface.
Surface morphologies of the original and modified cotton fabrics were studied using extra high-
resolution scanning electron microscopy (HRSEM) with a MagellanTM 400L Instrument. Prior to the
analysis, the samples were coated with a thin layer of gold (5 nm) by sputtering under rarefied argon
atmosphere.
Thermal gravimetric analysis (TGA) was used to estimate thermal stability of the pristine and
modified cotton fabrics using a TGA Q50 (TA Instruments). During the measurement the temperature
was increased from 25 to 600 °C at a heating rate of 10 °C min-1
. All the measurements were carried
out under oxygen atmosphere. Thermal decomposition temperature was taken as the onset of
significant weight loss of the heated sample.
Differential scanning calorimetry (DSC) measurements were performed in a TA Q200 instrument
(TA Instruments-Waters LLC) using a heating rate of 10 °C min-1. Samples were analyzed in heat-
cool-heat cycles between -20 and 400 °C.
Electrical resistivity measurements were performed using a resistivity chamber (Keithley Model
8009). Voltage (range between 1-100 V) and current (range between 20 mA - 200 μA) were applied
using an electrometer (Keithley Model 6517B), and the surface and volume resistivity were recorded.
This procedure was adapted from the ASTM D-257 standard method. The fabrics were prepared at the
same size (7 cm diameter) and positioned between two pressed electric contacts. The measurements
were performed at the standard atmosphere conditions (25 °C and 60% relative humidity).
Washing durability tests were performed according to BS-EN ISO 105 C-06, test method A1S,
using a standard wash fastness Launder-Ometer machine (Roaches Washtec Instrument). The fabrics
were washed in a rotating closed can containing 150 mL aqueous solution of an ISO standard
European colour fastness establishment (ECE) detergent at 40 °C, pH 8.5 and 40 rpm for 30 minutes
in the presence of 10 stainless steel balls. One washing cycle is equivalent to about three home
machine launderings according to the ISO test method. After each cycle, the fabrics were first rinsed
with water to remove the residual detergent, followed by air-drying and vacuum oven drying at 65 °C
overnight. Electrical resistivity measurements were performed before and after each of the six washing
cycles. Washed fabrics were labelled with a prefix “w”.
2.3. Experimental Details
2.3.1. Chemical grafting of PPy onto cotton fabric. The synthetic route for covalent modification of
cotton fabric, followed by graft polymerization of Py is shown in Figure 1. In the first step, a
bifunctional linker molecule, containing an acyl chloride and a double bond, was attached to the
surface of cotton fabric via an esterification reaction. This step resulted in incorporation of alkene

groups into the fabric, which are suitable for further chemical reaction. Next, 2-thiophenethiol was
applied onto the fabric utilizing thiol-ene click reaction conditions, leading to the covalent attachment
of thiophene molecules to the surface of cotton fabric. It is important to note that a commercially
available 2-thiophenethiol was employed as a monomer for chemical binding to the fabric, since the
corresponding Py analogue is unknown. Finally, in situ oxidative polymerization of Py was carried out
using ferric chloride as an oxidant and water as a solvent.
Figure 1. Synthetic pathway for chemical grafting of PPy onto cotton fabric.
Preparation of MC-1
Cotton fabric (0.5 g, 3.1 mmol) was dried overnight in a vacuum oven at 65 °C prior the reaction and
then placed in an Erlenmeyer flask. Chloroform (100 mL), 10-undecenoyl chloride (23.8 g, 117.4
mmol), and triethylamine (13.1 g, 129.7 mmol) were then added to the flask, and the reaction mixture
was stirred for 6 hours at room temperature. After the reaction was completed, the fabric was purified
by Soxhlet extraction for 24 hours using chloroform as a solvent, followed by drying in a vacuum
oven at 65 oC.
Preparation of MC-2
To a solution of chloroform (60 mL), 2-thiophenethiol (3.9 g, 33.6 mmol), and DMPA (5 wt%), the
MC-1 fabric (0.5 g, 3.1 mmol) was added. The flask was purged with argon for 2 minutes and
irradiated with a UV lamp (Spectroline Model SB-100PC/F, 230 V) for 30 minutes. After the reaction
was completed, the fabric was taken out and purified by Soxhlet extraction using chloroform (24
hours), followed by drying in a vacuum oven at 65 oC.
Preparation of MC-PPy
Polymerization of Py was performed using various monomer amounts of 3, 5, 10, and 25 wt% based
on the weight of the cotton fabric taken for the polymerization. Monomer concentration in the
polymerization solution ranged from 1 to 2.3 mg ml-1. The molar ratio between the monomer and the
Cotton Fabric
MC-2
MC-PPy
MC-1
MC-2
Step 1 Step 2
Step 3

oxidant was 1:2.2 and was kept constant for all polymerization reactions. MC-PPy fabrics were first
soaked in an aqueous solution containing Py monomer for 30 minutes, followed by the addition of an
aqueous solution of ferric chloride, and reaction mixture was stirred at room temperature for 6 hr.
After polymerization was completed, the fabrics were washed several times with water, and purified
using Soxhlet extraction with dichloromethane for 24 hours. Finally, fabric was dried in a vacuum
oven at 65 °C overnight prior to further analysis.
Due to the fact that PPy is insoluble in most known organic solvents and in order to provide a
support for its covalent grafting onto the cotton fabric, a model reaction using poly(3-hexylthiophene)
(P3HT) was done (experimental procedure is provided in the Supporting Information). Since P3HT
has good solubility in the chlorinated solvents such as chloroform, it was possible to completely
remove a non-covalently attached polymer from the fabric after the polymerization and perform
surface analysis of the fabric. Thus, unmodified cotton and MC-2 fabric were polymerized with 3HT
under the similar polymerization conditions described above. These samples are referred to as NC-
P3HT and MC-2-P3HT, respectively.
2.3.2. Non-covalent incorporation of PPy into cotton fabrics. In order to compare fabrics with
covalent and non-covalent attachment of PPy, oxidative polymerization of Py was performed in the
presence of unmodified cotton fabrics under the polymerization conditions described above. The
physical incorporation of PPy into the cotton fabric takes place due to presence of hydroxyl groups
(OH) in the molecular structure of cellulose as well as microporous nature of the cotton fabrics, which
both lead to the formation of extensive hydrogen bonding between the fabric and PPy (Figure 2) [34].
Figure 2. Schematic representation of hydrogen bonds formed through physical
incorporation of PPy into the cotton fabric, achieved by oxidative polymerization of Py in
the presence of unmodified cotton fabric.
3. Results and Discussions
3.1. Degree of PPy grafting Figure 3 shows PPy weight percent in the MC-PPy fabrics prepared with different Py percentages. The
results show a good correlation between the amount of Py used for the polymerization and the final
degree of polymer grafting in the fabric, which indicates the high efficiency of the developed chemical
multi-step polymer grafting methodology. For example, using 10% Py in the polymerization solution
afforded 8.5 wt% PPy in the functionalized fabric, whereas 25% Py led to ~23 wt% PPy. These values
are considerably higher than the ones previously reported in the literature for PPy-functionalized
textiles [31].

Figure 3. PPy weight percent in MC-PPy fabrics prepared with different Py percentages.
3.2. Characterization of the chemically grafted cotton fabrics
Figure 4 shows ATR-FTIR spectra of the chemically grafted cotton fabrics obtained from each
treatment step. MC-1 and MC-2 fabrics show a broad signal at around 3300 cm-1 for O-H stretch, a
peak at 2885 cm-1 for C-H stretch in alkanes, and a peak at 1026 cm-1 for C-O stretch; these signals are
typical of the pristine cotton fabric. A new signal at 1732 cm−1 in the spectrum of MC-1 fabric was
assigned to C=O stretching vibration, which was attributed to the newly formed ester linkage. This
demonstrates that the functional linker molecule was successfully covalently attached onto the cotton
fabric. The formation of C=C bonds in the MC-1 fabric could not be detected in the ATR spectra since
the bands of the adsorbed water in cotton appear at 1642 cm-1 and are superimposed on those of C=C
stretching vibrations [35,36]. In addition, the peak at 747 cm−1, which appears for MC-2 fabric, was
assigned to C-S groups; the presence of this peak indicates that the thiophene ring was successfully
covalently attached through the linker molecule. Furthermore, ATR-FTIR spectra for the model
reaction with P3HT (Supporting Information) supports the fact that P3HT was chemically grafted onto
the cotton fabric: The unmodified and NC-P3HT fabrics displayed only signals typical of the pristine
cotton fabric. In contrast, the MC-2-P3HT fabric displayed also typical signals of P3HT (C―H stretch
of aromatic and aliphatic bonds located in 1450–1600 cm-1 region). The ATR-FTIR spectrum for
pristine P3HT is presented in the Supporting Information.

Figure 4. ATR-FTIR spectra of unmodified cotton, MC-1, and MC-2 fabrics.
Further evidence for chemical modification of the cotton fabric surface by each of the treatment
steps was obtained by analysis of surface composition by XPS. As shown in Table 1, the carbon
content for MC-1 fabric was higher than that of unmodified fabric due to the increase in carbon-carbon
and hydrocarbon (C-C/C-H) concentration, whereas the oxygen content was lower as expected. Figure
5 presents high-resolution C1s spectra for MC-1 fabric and the unmodified fabric. The results for MC-
1 fabric showed that the intensity of C-C/C-H peak around 285 eV was increased relative to
unmodified fabric, whereas the intensity of the C-O peak around 287 eV was reduced due to the
increase in the amount of hydrocarbons and the consumption of hydroxyl groups during esterification
reaction, respectively. In addition, the appearance of the O-C=O peak around 289 eV in the MC-1
fabric confirmed that the functional linker molecule was successfully chemically grafted onto the
cotton fabric via the esterification reaction. Moreover, no evidence for the presence of sulfur was
detected in analysis of the unmodified fabric, but the S2p content after the thiol-ene click reaction was
0.38, indicating higher abundance of sulfur on the surface of MC-2 fabric than unmodified fabric.
Table 1. Apparent surface chemical compositions (in atomic concentration %)
of tested fabrics as determined by XPS.
N/C ratio O/C ratio S 2p C 1s N 1s O 1s Sample
0.02 0.53 0.00 64.42 1.46 34.12 Unmodified cotton
- 0.40 0.00 69.95 1.17 27.82 MC-1
- 0.42 0.38 68.38 1.11 28.95 MC-2
0.08 0.31 0.34 71.23 5.65 22.01 MC-PPy-3%
0.08 0.30 0.52 71.51 6.03 21.11 MC-PPy-5%
0.14 0.21 0.66 72.84 9.90 15.35 MC-PPy-10%
0.15 0.15 0.25 75.77 11.55 11.71 MC-PPy-25%
- 0.45 0.72 67.25 1.26 30.06 NC-P3HT
- 0.06 6.06 86.21 0.22 5.29 MC-2-P3HT
1732
747
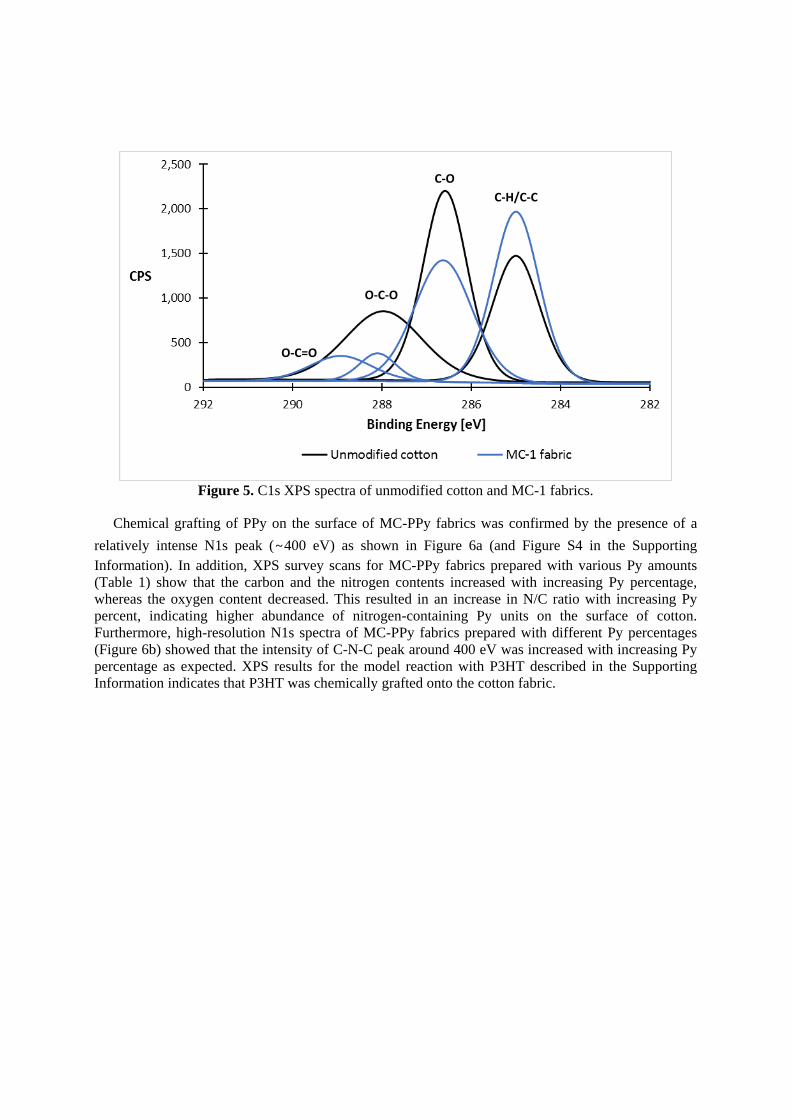
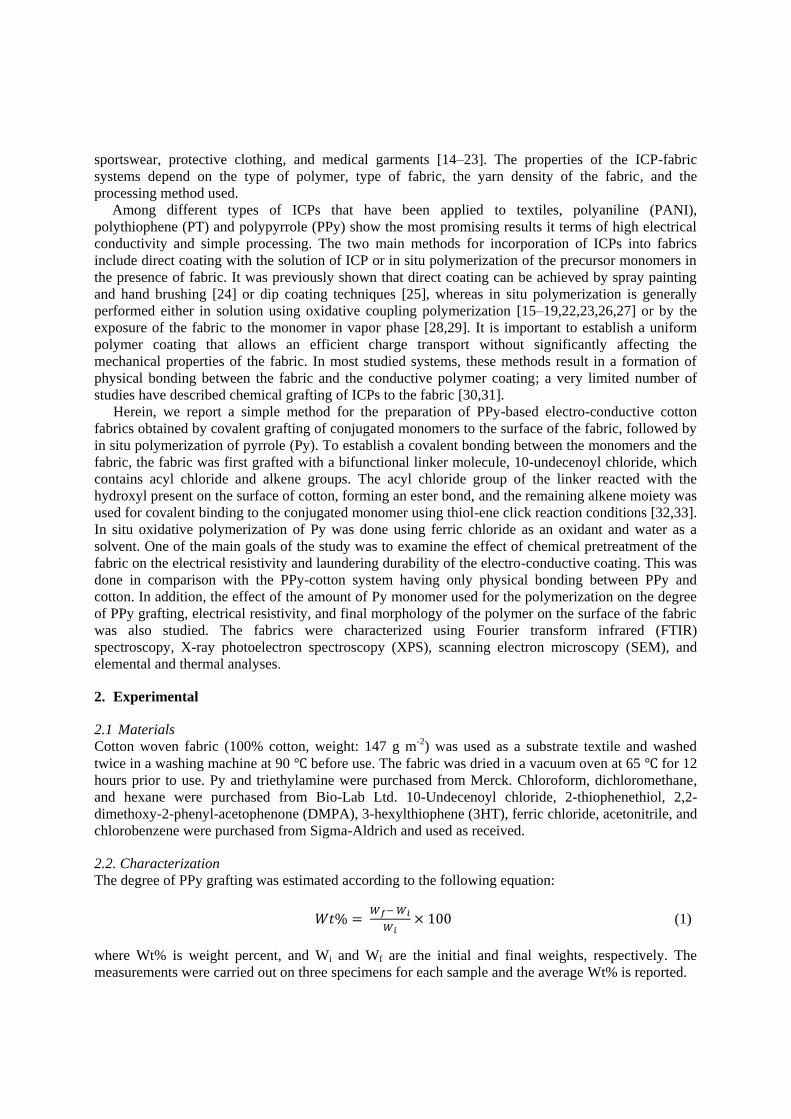
Figure 5. C1s XPS spectra of unmodified cotton and MC-1 fabrics.
Chemical grafting of PPy on the surface of MC-PPy fabrics was confirmed by the presence of a
relatively intense N1s peak (∼400 eV) as shown in Figure 6a (and Figure S4 in the Supporting
Information). In addition, XPS survey scans for MC-PPy fabrics prepared with various Py amounts
(Table 1) show that the carbon and the nitrogen contents increased with increasing Py percentage,
whereas the oxygen content decreased. This resulted in an increase in N/C ratio with increasing Py
percent, indicating higher abundance of nitrogen-containing Py units on the surface of cotton.
Furthermore, high-resolution N1s spectra of MC-PPy fabrics prepared with different Py percentages
(Figure 6b) showed that the intensity of C-N-C peak around 400 eV was increased with increasing Py
percentage as expected. XPS results for the model reaction with P3HT described in the Supporting
Information indicates that P3HT was chemically grafted onto the cotton fabric.
O-C=O
O-C-O
C-O
C-H/C-C

Figure 6. (a) Full-scan and (b) N1s (C-N-C) XPS spectra of MC-PPy fabrics prepared with
different Py percentages.
3.3. Surface Properties
Next, changes in the surface properties of the chemically modified cotton fabrics were investigated for
each treatment step using contact angle analysis; results are shown in Figure 7. As a result of the
hydrophilic nature of cotton fabric a droplet of water was quickly absorbed into the unmodified cotton
fabric (Figure 7a). After chemical grafting of cotton fabric with the functional linker molecule, the
N1s
C-N-C
a.
b.
c.
a.
d.
water contact angle was about 138° (Figure 7b), which indicates good hydrophobicity. Furthermore,
MC-2 fabric showed a slight increase in the water contact angle, to about 144° (Figure 7c) owing to
the addition of C and S atoms. We also found that for chemical graft polymerization with 10% Py and
above, MC-PPy fabrics were hydrophilic (Figure 7d). This is presumably due to the formation of
hydrogen bonds between the hydroxyl groups present on the fabric and the amine hydrogen atom of
Py rings. For the cotton fabrics modified with 5% Py monomer, a water contact angle of about 138°
was observed, indicating that chemical graft polymerization in this case resulted in the formation of
lower amount of PPy on the surface of the fabric.
Figure 7. Representative photographs of (a) unmodified cotton, (b) MC-1, (c) MC-2 and (d) MC-PPy-
10% fabrics used to determine water contact angles.
3.4. Thermal Analysis
Thermal properties of MC-PPy fabrics prepared with different Py percentages were evaluated using
TGA and DSC measurements. PPy decomposed in the temperature range between 200-600 °C, and
decomposition of cotton occurred between 320 to 500 °C as evident in TGA curves shown in Figure
8a. MC-PPy fabrics decomposed in the temperature range between 215-350 °C, and thus showed
slightly lower thermal stability in comparison with the unmodified cotton. The initial weight loss of
7%-14% around 265 °C was consistent with the level of modification of the fabric with PPy, with the
highest weight loss percentage observed for MC-PPy-25%. For comparison, the unmodified cotton
fabric exhibit 5% weight loss at this temperature range. An additional weight loss for the MC-PPy
fabrics was observed between 300 and 350 °C, corresponding to initial breakdown of cotton. Similar
behavior of the reduction in thermal stability after incorporation of PPy was also reported for
PPy/nylon/lycra composite [23]. DSC thermograms for the unmodified and PPy-modified cotton
fabrics are shown in Figure 8b. A thermogram for the unmodified fabric displayed a strong
endothermic peak at 360 °C, which was attributed previously to the thermal degradation of cotton
[37,38]. A progressive shift of the decomposition peak toward lower temperatures, from 360 to 330
°C, was observed when Py percentage increased in the MC-PPy fabrics, which was attributed to the
degradation of PPy. A similar trend of the thermal degradation temperature with increasing Py
concentration was previously reported for cellulose-PPy textiles [27].
b.
𝛉 = 𝟏𝟑𝟖˚ ± 𝟕
c.
𝛉 = 𝟏𝟒𝟒˚ ± 𝟔

Figure 8. (a) TGA curves for unmodified cotton, MC-PPy-3%, MC-PPy-5%, MC-PPy-10%,
and MC-PPy-25% fabrics and (b) DSC second heating cycle for the unmodified cotton, MC-
PPy-3%, MC-PPy-5%, and MC-PPy-10% fabrics.
3.5. Surface Morphology
Surface morphologies of MC-PPy fabrics prepared with increasing Py percentages were analyzed
using HRSEM. The results showed that the unmodified cotton has fibers with a relatively smooth
surface morphology (Figure 9a). On the other hand, the images obtained for PPy-modified cotton
showed that cotton fibers were completely coated with PPy for all Py percentages. In addition, PPy
aggregates were also formed (Figure 9b-e) due to the previously described supramolecular assembly
of the PPy macromolecules on the surfaces of cotton fibers [30]. These aggregates had irregular
360
340
341
331
Exo up
a.
b.

intervals and a feature size between 80-160 nm (Supporting Information). The analysis indicated that
as the Py percentage in the polymerization solution increased, the cotton fibrils became more
massively covered with PPy, resulting in a thicker PPy layer and an increased density of aggregates
deposited on the fibers. HRSEM micrographs for NC-PPy fabrics prepared with increasing Py
percentages (Supporting Information) showed similar surface morphologies to MC-PPy fabrics.
Figure 9. HRSEM images of: (a) unmodified cotton, (b) MC-PPy-3%, (c) MC-
PPy-5%, (d) MC-PPy-10%, and (e) MC-PPy-25% fabrics.

3.6. Electrical Resistivity
One of the advantages of incorporation of ICP into cotton fabric having porous structure, is the
possibility to obtain both surface and volume electrical conductivities [25]. Electrical resistivity
measurements of MC-PPy fabrics prepared with different monomer amounts revealed that both
surface and volume resistivities were several orders of magnitude lower than resistivities of the
unmodified fabric (Figure 10). In fact, surface resistivity of the fabric prepared using 3% Py was three
orders of magnitude lower (3.1×10⁶ Ω square -1) relative to the unmodified fabric (1.2×10⁹ Ω square -
1). The surface resistivities were even lower for the fabrics prepared with 5 and 10% Py, showing
average values of 3.6×10⁵ Ω square -1 and 5.6×10⁴ Ω square -1 respectively.
Volume resistivity measurements showed a reduction of five orders of magnitude for the fabrics
prepared with initial concentration of Py of only 3% (5.4×10⁵ Ω cm -1) relative to the unmodified
fabric (2.5×10¹⁰ Ω cm -1). These results indicate that Py penetrated into the cotton fibers and a
continuous polymer network was formed throughout the fabric. The results also revealed that there
was no further decrease in surface and volume resistivity of MC-PPy fabrics beyond 10% and 3%
pyrrole, respectively, suggesting that the effect of PPy layer thickness on the electrical resistivity
becomes negligible when the amount of the conducting polymer exceeds a certain amount. A similar
effect was also reported for polyaniline chemically grafted cotton fabric: Above 10 wt% degree of
polymer grafting no increase in conductivity was observed [30].
Our data showed that PPy had stronger effect on volume than on surface resistivity of the fabric,
indicating that a larger fraction of the PPy was incorporated into the fabric rather than onto its surface,
which was also previously observed by us for P3HT-cotton fabrics [25]. In addition, a comparison
between electrical resistivity of MC-PPy and NC-PPy fabrics showed that surface resistivity at the
lowest Py percentage of MC-PPy fabric (MC-PPy-3%) was one order of magnitude lower than the one
obtained for the cotton fabric treated only with PPy (NC-PPy-3%), as reflected in resistivity values of
3.1×10⁶ Ω square -1 and 1.1×10⁷ Ω square -1, respectively (Supporting Information). This improvement
in surface electrical resistivity is attributed to the covalent binding of PPy to the surface of cotton
fabric. A similar trend of the reduction in surface conductivity was previously reported for
polypropylene fabrics covalently functionalized with PPy [31]. When the initial concentration of Py
was higher than 3%, comparable values of surface and volume resistivities were obtained for both
MC-PPy and NC-PPy fabrics.
The degree of substitution of the cotton fabric with the bifunctional linker molecule was estimated
from the elemental analysis of the fabrics (see Supporting Information for calculation details). These
analyses revealed that only 2.8% of the fabric was covalently modified. This value indicates that
chemical modification occurred predominantly on the surface of the fabric. The relatively low degree
of substitution of MC-1 fabrics could explain why volume resistivity was not influenced by the
covalent pretreatment of the fabric and why the improvement in surface resistivity was observed only
for 3% initial concentration of pyrrole. At higher Py concentration, the electrical properties were most
influenced by the hydrogen bonding between PPy and cotton, whereas at lower Py percentage the
covalent bonding was the determining factor.

Figure 10. Surface (a) and volume (b) resistivity of unmodified cotton, MC-PPy-3%, MC-
PPy-5%, MC-PPy-10%, and MC-PPy-25% fabrics. The resistivities were collected for 1 volt
and a range of 20 mA.
3.7. Washing Durability
In order to evaluate washing durability of PPy coating, the fabrics were subjected to six Launder-
Ometer cycles, which are equivalent to about twenty home machine launderings. Surface and volume
resistivity measurements revealed an increase in surface resistivity of approximately four orders of
magnitude. Volume resistivity was less affected by the washings with an increase of only two orders
of magnitude (Figures 11a; Figure 9 in the Supporting Information). The increase in the surface
1,2E+09
3,1E+06
3,6E+05
5,6E+04 4,9E+04
1,0E+03
1,0E+04
1,0E+05
1,0E+06
1,0E+07
1,0E+08
1,0E+09
1,0E+10
0 5 10 15 20 25
Log Surface Resistivity
[Ω square-1]
Pyrrole Percent [%]
Unmodified cotton MC-PPy fabrics
2,5E+10
5,4E+05 2,2E+05 1,9E+05 1,4E+05
1,0E+04
1,0E+05
1,0E+06
1,0E+07
1,0E+08
1,0E+09
1,0E+10
1,0E+11
0 5 10 15 20 25
Log Volume Resistivity
[Ω cm-1]
Pyrrole Percent [%]
Unmodified cotton MC-PPy-fabrics
a.
b.
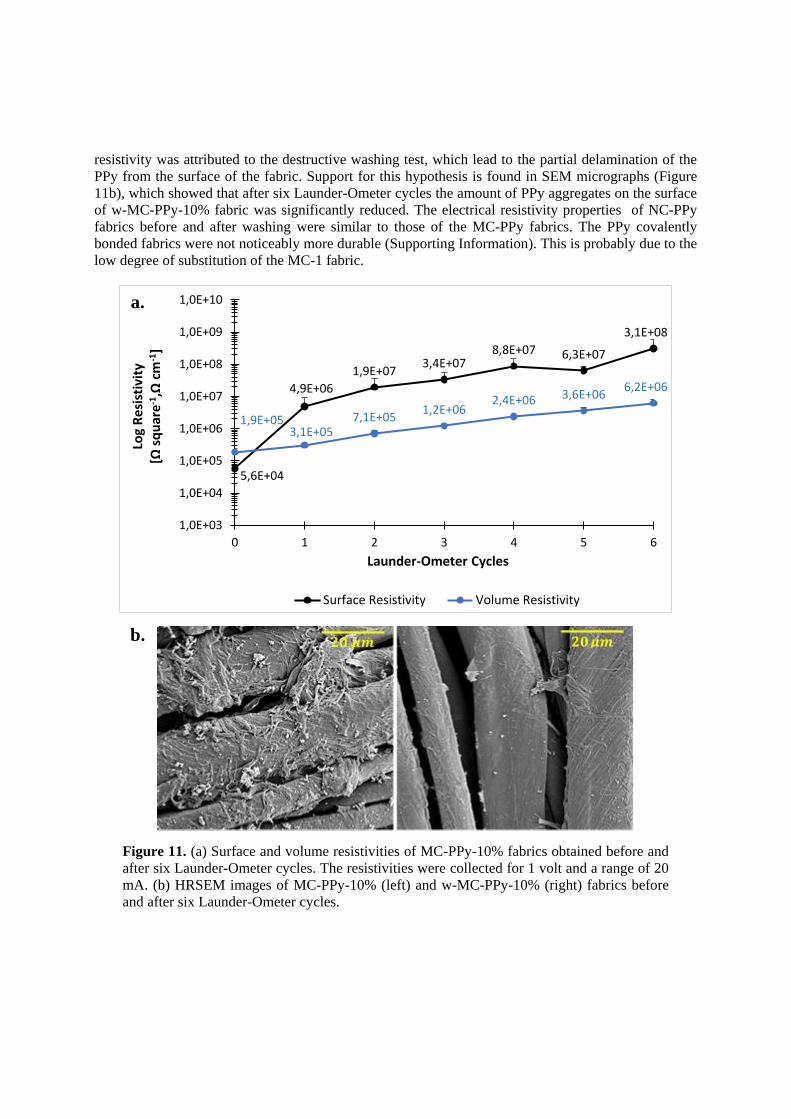
resistivity was attributed to the destructive washing test, which lead to the partial delamination of the
PPy from the surface of the fabric. Support for this hypothesis is found in SEM micrographs (Figure
11b), which showed that after six Launder-Ometer cycles the amount of PPy aggregates on the surface
of w-MC-PPy-10% fabric was significantly reduced. The electrical resistivity properties of NC-PPy
fabrics before and after washing were similar to those of the MC-PPy fabrics. The PPy covalently
bonded fabrics were not noticeably more durable (Supporting Information). This is probably due to the
low degree of substitution of the MC-1 fabric.
Figure 11. (a) Surface and volume resistivities of MC-PPy-10% fabrics obtained before and
after six Launder-Ometer cycles. The resistivities were collected for 1 volt and a range of 20
mA. (b) HRSEM images of MC-PPy-10% (left) and w-MC-PPy-10% (right) fabrics before
and after six Launder-Ometer cycles.
5,6E+04
4,9E+06
1,9E+07 3,4E+07
8,8E+07 6,3E+07
3,1E+08
1,9E+05 3,1E+05
7,1E+05 1,2E+06
2,4E+06 3,6E+06 6,2E+06
1,0E+03
1,0E+04
1,0E+05
1,0E+06
1,0E+07
1,0E+08
1,0E+09
1,0E+10
0 1 2 3 4 5 6
Log
Re
sist
ivit
y
[Ω s
qu
are
-1,Ω
cm
-1]
Launder-Ometer Cycles
Surface Resistivity Volume Resistivity
a.
b.

4. Conclusions
Electro conductive fabrics with a continuous PPy network were successfully prepared by chemical and
physical grafting of PPy onto cotton fabrics. SEM and electrical resistivity analyses showed that the
fibers were completely covered with a PPy layer and exhibited both surface and volume electrical
resistivities in the range of semiconductors. Based on the relatively low degree of substitution, it only
a small fraction of PPy chains were chemically grafted onto the fabric surface, while most were
physically grafted onto the fabric through hydrogen bonds. Thus, covalent bonding had a stronger
effect at lower Py amount used for the polymerization, whereas at a higher percentage of the
monomer, the electrical properties were more influenced by the physical bonding. Washing durability
studies showed some mechanical destruction of the fabric surface, which mainly affected surface
resistivity of the fabrics. In addition, durability was not noticeably higher for the chemically grafted
fabrics as a result of the low degree of substitution. Our future attempts will be directed toward further
modifications of PPy chemically grafted fabrics using hydrophobic fabrics such as polyester and
polypropylene, as well as using functional linker molecules with higher functionality. These
modifications are expected to increase the efficiency of covalent fabrication over physical fabrication
of ICPs onto fabrics.
Acknowledgments
The authors would like to thank Prof. Ana Dotan from the department of Polymers and Plastics
Engineering at Shenkar College for her valuable and helpful discussions. The authors would also like
to thank Mrs. Shosh Tfilin from the department of Textile Design at Shenkar College for the helpful in
washing durability tests and Dr. Vitaly Gutkin from the department of Nano-characterization, the
Hebrew University of Jerusalem for help with HRSEM and XPS measurements. NCD is grateful for
the scholarship provided by Faculty of Engineering and Design, Shenkar College, Israel.
References
[1] Lu X, Zhang W, Wang C, Wen T C and Wei Y 2011 One-dimensional conducting polymer
nanocomposites: synthesis, properties and applications Prog. Polym. Sci. 36 671-712
[2] Heeger A J 2010 Semiconducting polymers: the third generation Chem. Soc. Rev. 39 2354-71
[3] MacDiarmid A G 2001 Synthetic metals: a novel role for organic polymers (nobel lecture)
Angew. Chemie. Int. Ed. 40 2581-90
[4] Guimard N K, Gomez N and Schmidt C E 2007 Conducting polymers in biomedical
engineering Prog. Polym. Sci. 32 876-921
[5] Lange U, Roznyatovskaya N V and Mirsky V M 2008 Conducting polymers in chemical
sensors
and arrays Anal. Chim. Acta. 614 1-26
[6] Dong H, Fu X, Liu J, Wang Z and Hu W 2013 25th anniversary article: key points for high-
mobility organic field-effect transistors Adv. Mater. 25, 6158-83
[7] Klauk H 2010 Organic thin-film transistors Chem. Soc. Rev. 39 2643-66
[8] Perepichka I F, Perepichka D F, Meng H and Wudl F 2005 Light-emitting polythiophenes
Adv. Mater. 17 2281-305
[9] Li C, Liu M, Pschirer N G, Baumgarten M and Muellen K 2010 Polyphenylene-based materials
for organic photovoltaics Chem. Rev. 110 6817-55
[10] Cheng Y J, Yang S H and Hsu C S 2009 Synthesis of conjugated polymers for organic solar
cell applications Chem. Rev. 109 5868-923
[11] Huang J, Wang X, DeMello A J, DeMello J C and Bradley D D C 2007 Efficient flexible
polymer light emitting diodes with conducting polymer anodes J. Mater. Chem. 17 3551-4
[12] McCarthy J, Hanley C, Brennan L, Lambertini V and Gun’ko Y 2014 Fabrication of highly
transparent and conducting PEDOT:PSS films using a formic acid treatment J. Mater.
Chem.
C 2 764–70

[13] Xie K and Wei B 2014 Materials and structures for stretchable energy storage and conversion
devices Adv. Mater. 26 3592–617
[14] Hu E, Kaynak A and Li Y 2005 Development of a cooling fabric from conducting polymer
coated fibres: proof of concept Synth. Met. 150 139-43
[15] Sparavigna A C, Florio L, Avloni J and Henn A 2010 Polypyrrole coated PET fabrics for
thermal applications Mater. Sci. Appl. 1 253-9
[16] Saini P and Choudhary V 2013 Conducting polymer coated textile based multilayered shields
for suppression of microwave radiations in 8.2-12.4 GHz range J. Appl. Polym. Sci. 129
2832-9
[17] Opwis K, Knittel D and Gutmann J S 2012 Oxidative in situ deposition of conductive
PEDOT:PTSA on textile substrates and their application as textile heating element Synth.
Met. 162 1912-8
[18] Hakansson E, Kaynak A, Lin T, Nahavandi S, Jones T and Hu E 2004 Characterization of
conducting polymer coated synthetic fabrics for heat generation Synth. Met. 144 21- 8
[19] Knittel D and Schollmeyer E 2009 Electrically high-conductive textiles Synth. Met. 159
1433-7
[20] Zeng W, Shu L, Li Q, Chen S, Wang F and Tao X M 2014 Fiber-based wearable electronics:
a review of materials, fabrication, devices, and applications Adv. Mater. 26 5310-36
[21] Jiang X, Tessier D, Dao L H and Zhang Z 2002 Biostability of electrically conductive
polyester fabrics: an in vitro study J. Biomed. Mater. Res. 62 507-13
[22] Cucchi I, Boschi A, Arosio C, Bertini F, Freddi G and Catellani M 2009 Bio-based conductive
composites: preparation and properties of polypyrrole (PPy)-coated silk fabrics Synth. Met.
159 246-53
[23] Wu J, Zhou D, Too C O and Wallace G G 2005 Conducting polymer coated lycra Synth.
Met. 155 698-701
[24] Kaynak A and Foitzik R 2011 Methods of coating textiles with soluble conducting polymers
Res. J. Text. Appar. 15 107-13
[25] David N C, David Y, Katz N, Milanovich M, Anavi D, Buzhor M and Amir E 2017
Electro-conductive fabrics based on dip coating of cotton in poly(3-hexylthiophene) Polym.
Adv.Technol. 28 583-9
[26] Muthukumar N and Thilagavathi G 2012 Development and characterization of electrically
conductive polyaniline coated fabrics Indian J. Chem. Technol. 19 434-41
[27] Dall’Acqua L, Tonin C, Peila R, Ferrero F and Catellani M 2004 Performances and properties
of intrinsic conductive cellulose-polypyrrole textiles Synth. Met. 146 213-21
[28] Biglari M J, Mokhtari J, Nouri M and Sarabi A A 2014 Chemical vapor deposition of poly(3-
alkylthiophene) nanoparticles on fabric: chemical and electrochemical characterization J.
Appl. Polym. Sci. 131 40673-9
[29] Kaynak A, Najar S S and Foitzik R C 2008 Conducting nylon, cotton and wool yarns by
continuous vapor polymerization of pyrrole Synth. Met. 158 1-5
[30] Wu B, Zhang B, Wu J, Wang Z, Ma H, Yu M, Li L and Li J 2015 Electrical switchability and
dry- wash durability of conductive textiles Sci. Rep. 5 11255-263
[31] Micusık M, Nedelcev T, Omastova M, Krupa I, Olejnıkova K, Fedorko P and Chehimi M
M 2007 Conductive polymer-coated textiles: the role of fabric treatment by pyrrole-
functionalized triethoxysilane Synth. Met. 157 914–23
[32] Zhao G L, Hafre´n J, Deiana L and Co´rdova A 2010 Heterogeneous ‘‘organoclick’’
derivatization of polysaccharides: photochemical thiol-ene click modification of solid
cellulose Macromol. Rapid Commun. 31 740–4
[33] Rosilo H, Kontturi E, Seitsonen J, Kolehmainen E and Ikkala O 2013 Transition to reinforced
state by percolating domains of intercalated brush-modified cellulose nanocrystals and
poly(butadiene) in cross-linked composites based on thiol−ene click chemistry
Biomacromolecules. 14 1547−54

[34] Saini P, Choudhary V and Dhawan S K 2012 Improved microwave absorption and
electrostatic
charge dissipation efficiencies of conducting polymer grafted fabrics prepared via in situ
polymerization Polym. Adv. Technol. 23 343–9
[35] Carrillo F, Colom X, Sunol J J and Saurin J 2004 Structural FTIR analysis and thermal
characterization of lyocell and viscose-type fibres Eur. Polym. J. 40 2229–34
[36] Poletto M, Pistor V and Zattera A J 2013 Structural characteristics and thermal properties of
native cellulose Cellulose–Fundamental Aspects Ed Van de Ven T and Godbout L (InTech)
2 45-68
[37] Dehabadi V A, Buschmann H J and Gutmann J S 2014 Flame-retardant finishing of cotton
fabrics using polyamino carboxylic acids and sodium hypophosphite FIRE Mater. 38 166-
73
[38] Abkenar S S, Malek R M A and Mazaheri F 2013 Thermal properties of cotton fabric
modified
with poly (propylene imine) dendrimers Cellulose 20 3079-91

Supporting Information
Preparation and Properties of Electro-Conductive Fabrics Based on Polypyrrole:
Covalent vs. Non-covalent Attachment
Model reaction with 3HT
Due to the fact that PPy is not soluble in organic solvents we wanted to ensure its
covalent binding to cotton fabric. Therefore, we carried out a model reaction using a soluble
monomer, 3HT, according to the following scheme.
Scheme 1: Model reaction for chemical grafting of P3HT onto MC-2 fabric.
Cotton fabrics were dried in a vacuum oven over night before polymerization of 3HT.
Acetonitrile (20 ml), ferric chloride (0.35 g, 2.17 mmol) and cotton fabric (0.03 g, 0.19 mmol)
were placed in a flask. 3HT (0.12 g, 0.7 mmol) was then added drop-wise and the reaction
solution was stirred at room temperature for 17 hr. In order to remove any excess of reactants
after polymerization, the fabrics were washed several times with acetonitrile, followed by 24
hr. soxhlet extraction with chloroform and finally washed several times with chlorobenzene.
The obtained fabrics were dried in a vacuum oven at 65 °C overnight prior to characterization.
For comparison, unmodified cotton fabric and MC-2 fabrics were polymerized with 3HT
(labelled NC-P3HT and MC-2-P3HT, respectively). A visual photographs of the fabrics after
polymerization with 3HT and soxhlet extraction are shown in Figure S1.
OHOH OH
OH OHOH OH
OH
MC-2
MC-2-P3HT
80
90
100
5001100170023002900
Transmittance [%]
Wavenumber [cm-1]
a.
b.
c.
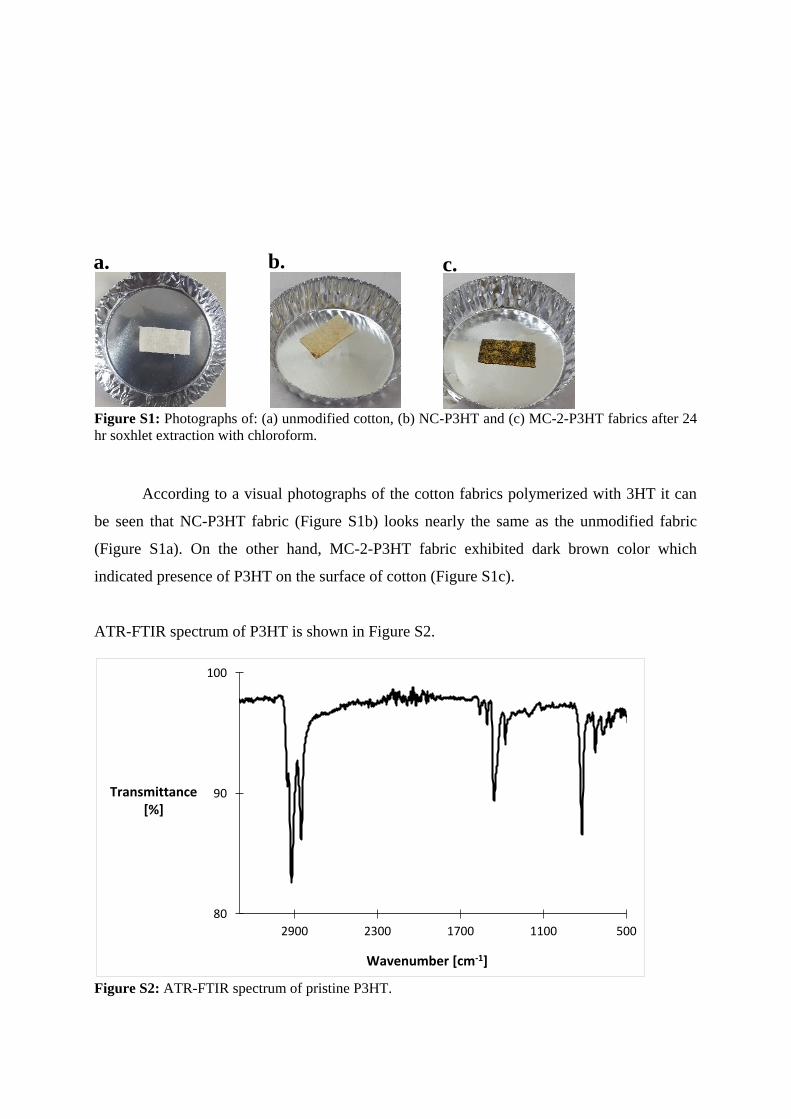
Figure S1: Photographs of: (a) unmodified cotton, (b) NC-P3HT and (c) MC-2-P3HT fabrics after 24
hr soxhlet extraction with chloroform.
According to a visual photographs of the cotton fabrics polymerized with 3HT it can
be seen that NC-P3HT fabric (Figure S1b) looks nearly the same as the unmodified fabric
(Figure S1a). On the other hand, MC-2-P3HT fabric exhibited dark brown color which
indicated presence of P3HT on the surface of cotton (Figure S1c).
ATR-FTIR spectrum of P3HT is shown in Figure S2.
Figure S2: ATR-FTIR spectrum of pristine P3HT.

P3HT shows signals between 2851 and 2919 cm-1
(C―H stretch of aromatic and
aliphatic bonds), 1450–1600 cm-1
(C―C and C=C bonds) and 817 cm-1
(C―S bonds).
ATR-FTIR spectra of the cotton fabrics polymerized with 3HT are shown in Figure S3.
Figure S3: ATR-FTIR spectra of unmodified cotton, NC-P3HT and MC-2-P3HT fabrics.
The results showed a difference between modified and unmodified cotton fabrics:
while the spectrum for unmodified and NC-P3HT fabrics displayed only typical signals of the
pristine cotton fabric, the spectrum for MC-2-P3HT fabric displayed also typical signals of
P3HT (C―H stretch of aromatic and aliphatic bonds located in 1450–1600 cm-1
region).
Thus, ATR-FTIR spectra demonstrates that P3HT chains were successfully chemically
grafted onto the cotton fabric.
500100015002000250030003500
Transmittance [%]
Wavenumber [cm-1]
Unmodified cotton NC-P3HT fabric MC-2-P3HT fabric

XPS. Figure S4 presents full-scan XPS spectra of unmodified cotton, MC-1, MC-2 and MC-
PPy fabrics.
Figure S4: Full-scan XPS spectra of unmodified cotton, MC-1, MC-2 and MC-PPy fabrics.
Figure S5 presents full-scan XPS spectra of NC-P3HT and MC-2-P3HT fabrics.
100200300400500600
CPS
Binding Energy [eV]
Unmodified cotton MC-1 fabric MC-2 fabric MC-PPy fabric
O1s
N1s
C1s

Figure S5: Full-scan XPS spectra of NC-P3HT and MC-2-P3HT fabrics.
XPS results for the model reaction with P3HT showed that cotton fabric modified only
with P3HT (NC-P3HT) displayed quite similar surface chemical compositions (in atomic
concentration %) in comparison with the pristine cotton fabric (Table 1 in the main text). On
the other hand, MC-2-P3HT fabric exhibited a higher carbon content and lower oxygen
content, which was attributed to the presence of the thiophene rings on the fabric surface.
Moreover, a sulfur content in the MC-2-P3HT fabric was much higher relative to the NC-
P3HT, as also evident by the intense S2p peak (∼163 eV) shown in Figure S5. This led to a
lower O/C ratio in comparison with NC-P3HT, which exhibited quite similar ratios to the
ones obtain for the unmodified cotton fabric, confirming the presence of P3HT on the
modified cotton.
HRSEM. Figure S6 presents PPy aggregates formed on the surface of MC-PPy-5% fabric.
100150200250300350400450500550600
CPS
Binding Energy [eV]
NC-P3HT fabric MC-2-P3HT fabric
O1s
C1s
S2s
S2p

Figure S6: HRSEM image of MC-PPy-5% fabric.
Figure S7 presents HRSEM micrographs of the NC-PPy-fabrics prepared with increasing
pyrrole percentage.
d. 𝟓𝟎 𝝁𝒎 c. 𝟓𝟎 𝝁𝒎
b. 𝟓𝟎 𝝁𝒎 a.
𝟓𝟎 𝝁𝒎
𝟏 𝝁𝒎

Figure S7: HRSEM images of: (a) NC-PPy-3%, (b) NC-PPy-5%, (c) NC-PPy-10% and (d) NC-PPy-
25% fabrics.
Figure S8 presents electrical resistivity measurements of NC-PPy and MC-PPy fabrics
prepared with different pyrrole percentage.

Figure S8: Surface (a) and volume (b) resistivity of unmodified cotton, MC-PPy-3%, MC-PPy-5%,
MC-PPy-10%, MC-PPy-25%, NC-PPy-3%, NC-PPy-5%, NC-PPy-10%, and NC-PPy-25% fabrics.
The resistivities were collected for 1 volt and a range of 20 mA.
Degree of substitution (DS) calculation
1,2E+09
3,1E+06
3,6E+05
5,6E+04 4,9E+04
1,1E+07
3,3E+05
4,7E+04 5,5E+04
1,0E+03
1,0E+04
1,0E+05
1,0E+06
1,0E+07
1,0E+08
1,0E+09
1,0E+10
0 5 10 15 20 25
Log Surface Resistivity
[Ω square-1]
Pyrrole Percent [%]
Unmodified cotton MC-PPy fabrics NC-PPy- fabrics
2,5E+10
5,4E+05 2,2E+05 1,9E+05 1,4E+05
3,9E+05
1,1E+05 1,3E+05 1,4E+05
1,0E+04
1,0E+05
1,0E+06
1,0E+07
1,0E+08
1,0E+09
1,0E+10
1,0E+11
0 5 10 15 20 25
Log Volume Resistivity
[Ω cm-1]
Pyrrole Percent [%]
Unmodified cotton MC-PPy-fabrics NC-PPy-fabrics
a.
b.

Elemental analysis was used to estimate the degree of substitution of the chemically
modified cotton fabrics. The DS indicates the average number of hydroxyl groups of the
anhydroglucose unit of the cellulose molecule that have been substituted due to a reaction. In
case that all three hydroxyl groups in the repeating unit of cellulose are substituted, the DS
should be 100%.1
Elemental analysis results for N, C, H and O atoms of the unmodified and MC-1
cotton fabrics are presented in Table 1 (%wt).
Table S1: Elemental analysis results of the unmodified and MC-1 cotton fabrics (%wt).
Sample N C H O
Unmodified cotton fabric <0.1 41.92 6.78 27.48
MC-1 fabric 0.12 42.84 6.51 25.82
The carbon weight content of the modified cotton fabric (MC-1) was corrected by the
theoretical value of pure cellulose according to the following equation: 2
%C = %Cexp ∙44.44
41.92 (1)
Where: %C is the corrected %wt of carbon in the MC-1 fabric, %Cexp is the experimental
%wt of carbon in the MC-1 fabric as determined by elemental analysis, 44.44 is the
theoretical carbon weight content of pure cellulose, and 41.92 is the experimental %wt of
carbon in unmodified cotton fabric as determined by elemental analysis.
The carbon weight content in the MC-1 fabric can represent by the following
equation:
%C = 12 ∙ (6 + Cg ∙ DS)
12 ∙ (6 + Cg ∙ DS) + (10 + (Hg − 1) ∙ DS) + 16 ∙ (5 + Og ∙ DS) (2)
Where: %C is the corrected %wt of carbon in the MC-1 fabric as described above, Cg, Hg and
Og are the number of carbon, hydrogen and oxygen respectively in the substituent. In the case
of MC-1 fabric: Cg =11, Og =1, Hg =19.

Thus the DS can calculated according to:
DS = 72 − 162 ∙ %C
12 ∙ Cg(%C − 1) + %C ∙ Hg + 16 ∙ %C ∙ Og − %C (3)
The %Cexp, %Ccorr. and DS for the MC-1 cotton fabric are shown in Table 2.
Table S2: %Cexp, %Ccorr. and DS of the MC-1 fabric according to Eq. 1, and 3.
Sample %Cexp %Ccorr. DS [%]
Unmodified cotton fabric 41.92 44.44 -
MC-1 fabric 42.84 45.42 2.8%
Figure S9 presents surface and volume resistivity measurements for MC-PPy-fabrics obtained
before and after six Launder-Ometer cycles.
1,2E+09
3,6E+05
3,3E+07
3,3E+08 2,8E+08 3,6E+08 3,8E+08 8,4E+08
5,6E+04
4,9E+06 1,9E+07 3,4E+07
8,8E+07 6,3E+07 3,1E+08
4,9E+04
6,7E+05 1,3E+06
3,8E+06 7,5E+06
4,4E+07 5,1E+07
1,0E+02
1,0E+03
1,0E+04
1,0E+05
1,0E+06
1,0E+07
1,0E+08
1,0E+09
1,0E+10
1,0E+11
0 1 2 3 4 5 6
Log Surface Resistivity
[Ω square-1]
Launder-Ometer Cycles
Unmodified cotton MC-PPy-5% MC-PPy-10% MC-PPy-25%
a.

Figure S9: Surface (a) and volume (b) resistivity of unmodified cotton, w-MC-PPy-5%, w-MC-PPy-
10% and w-MC-PPy-25% fabrics, which obtained before and after six Launder-Ometer cycles. The
resistivities were collected for 1 volt and a range of 20 mA.
2,5E+10
2,2E+05 1,5E+06
4,7E+06 8,4E+06
2,1E+07 2,5E+07 4,0E+07
1,9E+05 3,1E+05
7,1E+05 1,2E+06
2,4E+06 3,6E+06 6,2E+06
1,4E+05 3,0E+05
9,3E+05 1,6E+06
2,7E+06 3,5E+06 6,9E+06
1,0E+03
1,0E+04
1,0E+05
1,0E+06
1,0E+07
1,0E+08
1,0E+09
1,0E+10
1,0E+11
0 1 2 3 4 5 6
Log Volume Resistivity [Ω cm-1]
Launder-Ometer Cycles
Unmodified cotton MC-PPy-5% MC-PPy-10% MC-PPy-25%
b.
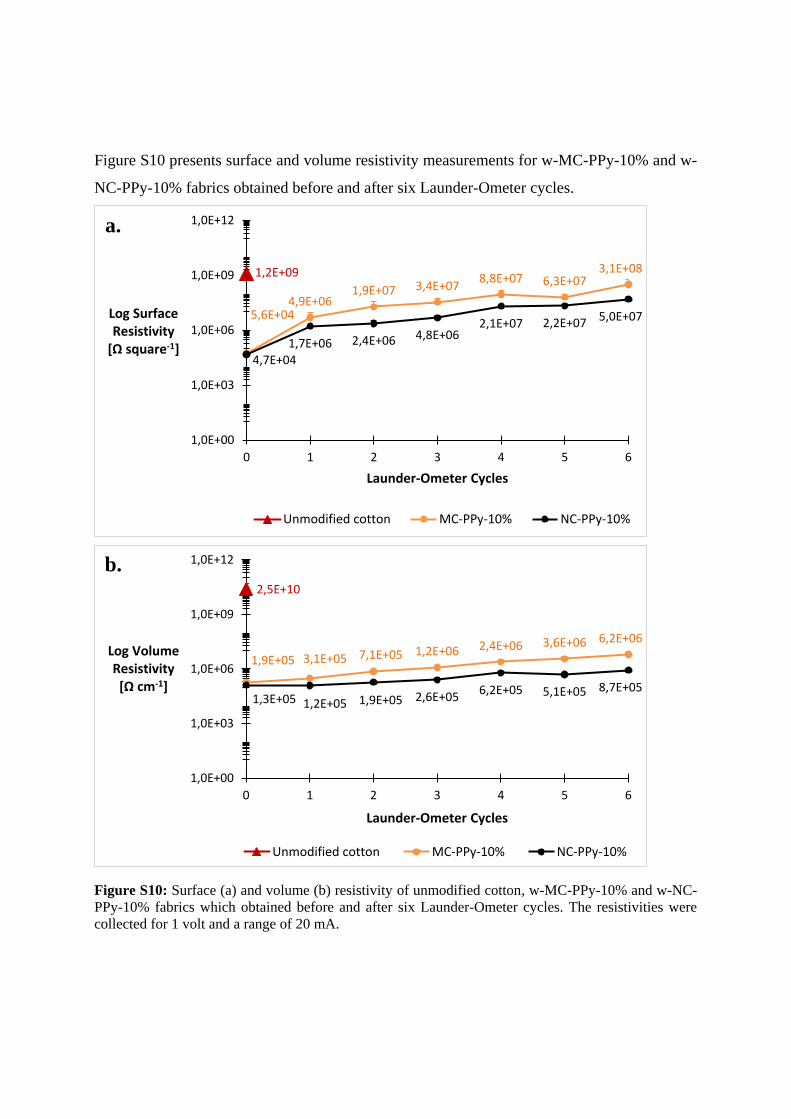
Figure S10 presents surface and volume resistivity measurements for w-MC-PPy-10% and w-
NC-PPy-10% fabrics obtained before and after six Launder-Ometer cycles.
Figure S10: Surface (a) and volume (b) resistivity of unmodified cotton, w-MC-PPy-10% and w-NC-
PPy-10% fabrics which obtained before and after six Launder-Ometer cycles. The resistivities were
collected for 1 volt and a range of 20 mA.
1,2E+09
5,6E+04 4,9E+06
1,9E+07 3,4E+07 8,8E+07 6,3E+07
3,1E+08
4,7E+04 1,7E+06 2,4E+06 4,8E+06
2,1E+07 2,2E+07 5,0E+07
1,0E+00
1,0E+03
1,0E+06
1,0E+09
1,0E+12
0 1 2 3 4 5 6
Log Surface Resistivity
[Ω square-1]
Launder-Ometer Cycles
Unmodified cotton MC-PPy-10% NC-PPy-10%
2,5E+10
1,9E+05 3,1E+05 7,1E+05 1,2E+06 2,4E+06 3,6E+06 6,2E+06
1,3E+05 1,2E+05 1,9E+05 2,6E+05 6,2E+05 5,1E+05 8,7E+05
1,0E+00
1,0E+03
1,0E+06
1,0E+09
1,0E+12
0 1 2 3 4 5 6
Log Volume Resistivity
[Ω cm-1]
Launder-Ometer Cycles
Unmodified cotton MC-PPy-10% NC-PPy-10%
a.
b.

References
[1] D. Roy, M. Semsarilar, J. T. Guthriea and S. Perrier, "Cellulose modification by
polymer grafting: a review", Chem. Soc. Rev., 2009, 38, 2046–2064.
[2] H. Sehaqui, T. Zimmermann, P. Tingaut, "Hydrophobic cellulose nanopaper
through a mild esterification procedure", Cellulose, 2014, 21, 367–382.

Differentiation of molecular chain entanglement structure
through laser Raman spectrum measurement
of High strength PET fibers under stress
D Go1, W Takarada
1 and T Kikutani
1
1Tokyo Institute of Technology, School of Materials and Chemical Technology,
Department of Materials Science and Engineering, Ookayama 2-12-1 S8-32 Meguro
Tokyo, Japan
Abstract. The aim of this study was to investigate the mechanism for the improvement of
mechanical properties of poly(ethylene terephthalate) (PET) fibers based on the concept of
controlling the state of molecular entanglement. For this purpose, five different PET fibers
were prepared through either the conventional melt spinning and drawing/annealing process or
the high-speed melt spinning process. In both cases, the melt spinning process was designed so
as to realize different Deborah number conditions. The prepared fibers were subjected to the
laser Raman spectroscopy measurement and the characteristics of the scattering peak at around
1616 cm-1, which corresponds to the C-C/C=C stretching mode of the aromatic ring in the main
chain, were investigated in detail. It was revealed that the fibers drawn and annealed after the
melt spinning process of lower Deborah number showed higher tensile strength as well as
lower value of full width at half maximum (FWHM) in the laser Raman spectrum. Narrow
FWHM was considered to represent the homogeneous state of entanglement structure, which
may lead to the higher strength and toughness of fibers because individual molecular chains
tend to bare similar level of tensile stress when the fiber is stretched. In case of high-speed
spun fibers prepared with a high Deborah number condition, the FWHM was narrow
presumably because much lower tensile stress in comparison with the drawing/annealing
process was applied when the fiber structure was developed, however the value increased
significantly upon applying tensile load to the fibers during the laser Raman spectrum
measurement. From these results, it was concluded that the Laser Raman spectroscopy could
differentiate molecular chain entanglement structure of various fiber samples, in that low
FWHM, which corresponds to either homogeneous state of molecular entanglement or lower
level of mean residual stress, and small increase of FWTH upon applying tensile stress are
considered to be the key factors for the improvement of the mechanical properties of PET
fibers.
1. Introduction
Poly(ethylene terephthalate) (PET), which is widely used as synthetic fibers, bottles etc., is a polymer
with excellent properties such as high mechanical and thermal performances and low cost. Even
though the development of PET fibers was achieved long time ago, its tensile strength as well as the
ratio of tensile strength of the available fibers to the theoretical value are not high enough in
comparison with other commercialized high-strength fibers. This also means that there still is a high
possibility of improving the mechanical properties of currently existing PET fibers. After significant
efforts of developing high-strength PET fibers without much success, it is now considered that the
control of the state of molecular entanglement is the key element for the significant and essential
improvement of mechanical properties [1].
In the cases of high-strength fibers with rigid molecular chains such as poly(p-phenylene
terephthalamide) (PPTA), poly(p-phenylene benzobisoxazole) (PBO) etc., entanglement density is
considered to be extremely low. In the cases of high-strength fibers with flexible molecular chains
such as ultra-high molecular weight polyethylene (UHMWPE), process for decreasing the
entanglement density, such as gel spinning, is designed in order to improve the mechanical properties.
In the case of PET, however, it has been reported that the improvement of mechanical properties can
be achieved through the control of melt spinning conditions to keep Deborah number at a low level
[1]. Low Deborah number corresponds to the suppression of the reduction of entanglement density in
the melt spinning process. This means that totally opposite strategy in terms of controlling the
entanglement density is required for the improvement of the mechanical properties of PET fibers. To
explain this behavior, the concept of keeping the homogeneous entangled state of the molecular chains
was proposed consulting the results of coarse molecular dynamics simulation. In other words, it has
been considered that keeping the narrow distribution of the molecular weight between the adjacent
entanglement points is the key concept for obtaining high strength and high toughness fibers, however,
direct verification of the relationship between the mechanical properties and entanglement structure of
PET fibers has not been completed yet. Therefore, in this study, several types of PET fiber samples
prepared under various spinning conditions were subjected to the detailed analysis of the state of
molecular entanglement using the laser Raman spectroscopy.
2. Experimental
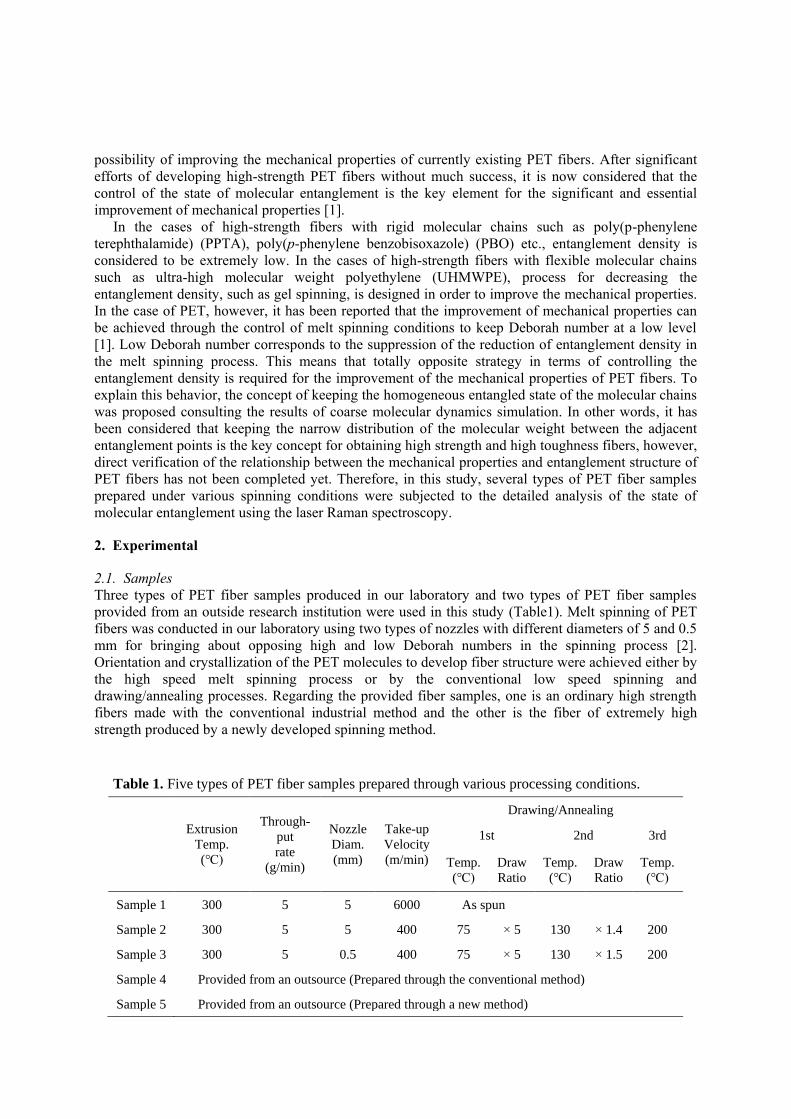
2.1. Samples
Three types of PET fiber samples produced in our laboratory and two types of PET fiber samples
provided from an outside research institution were used in this study (Table1). Melt spinning of PET
fibers was conducted in our laboratory using two types of nozzles with different diameters of 5 and 0.5
mm for bringing about opposing high and low Deborah numbers in the spinning process [2].
Orientation and crystallization of the PET molecules to develop fiber structure were achieved either by
the high speed melt spinning process or by the conventional low speed spinning and
drawing/annealing processes. Regarding the provided fiber samples, one is an ordinary high strength
fibers made with the conventional industrial method and the other is the fiber of extremely high
strength produced by a newly developed spinning method.
Table 1. Five types of PET fiber samples prepared through various processing conditions.
Extrusion
Temp.
()
Through-
put
rate
(g/min)
Nozzle
Diam.
(mm)
Take-up
Velocity
(m/min)
Drawing/Annealing
1st 2nd 3rd
Temp.
()
Draw
Ratio
Temp.
()
Draw
Ratio
Temp.
()
Sample 1 300 5 5 6000 As spun
Sample 2 300 5 5 400 75 × 5 130 × 1.4 200
Sample 3 300 5 0.5 400 75 × 5 130 × 1.5 200
Sample 4 Provided from an outsource (Prepared through the conventional method)
Sample 5 Provided from an outsource (Prepared through a new method)
2.2. Tensile strength
Tensile strength and elongation at break of the fiber samples were evaluated through the stress-strain
curve measurements using a tensile testing machine (Shimadzu, AG-I) at the strain rate of 50 %/min.
2.3. Laser Raman spectroscopy
Laser Raman spectroscopy measurement was performed on single filaments using a Raman
spectrometer (Jasco, NRS-5100) equipped with a 532.26 nm green laser. The power of incident light
ranged between 1.5 and 1.8 mW. The focus of the laser was adjusted to the surface of the fiber sample
by a confocal microscopy optical system. The Raman spectra between 1350 and 1850 cm-1 was
recorded with and without applying the tensile stress of around 180 MPa.
2.3.1. Reproducibility In order to evaluate the precision and reproducibility of the laser Raman
spectroscopy measurement, repetitive measurements were carried out under the same conditions using
PET fiber samples. For each measurement, the wavenumber was calibrated measuring the spectral
peak of Ne light. After repeated measurements of eight times in the spectrum range between 1350 and
1850 cm-1, the spectral peak at around 1616 cm-1 was subjected to curve fitting by combining the
Lorentzian and Gaussian functions. Standard deviations of peak wavenumber and full width at half
maximum (FWHM) of scattering peak at around 1616 cm-1 were evaluated from the entire
measurements.
2.3.2. Peak analysis Differentiation of the state of molecular chain entanglement through the laser
Raman spectroscopy measurement was attempted analysing the characteristics of Raman scattering
intensity at around 1616 cm-1, which corresponds to the C-C/C=C stretching modes of the aromatic
ring in the main chain [3]. The shape of the Raman scattering peak near 1616 cm-1 was subjected to
curve fitting as stated above and the wavenumber and the FWHM of the peak were obtained.
Subsequently, Raman spectroscopy measurement was carried out applying the tensile stress of around
180 MPa to the fiber sample, and the variations of the wavenumber and the FWHM of the peak were
evaluated.
3. Results and Discussion
3.1. Tensile strength
Figure 1 shows the stress-strain curves of the PET fibers used in this research. Tensile strength and
elongation at break analyzed from the stress-strain curves are summarized in Table 1. The fiber
samples produced under various melt spinning conditions showed significantly different mechanical
properties. The fiber sample of the highest tensile strength (sample 5), which was produced through a
modified melt spinning process, showed a tensile strength of 1.58 GPa and an elongation at break of
11.7%. In the case of fiber sample prepared through the high-speed spinning process with a large
diameter nozzle (sample 1), the tensile strength was 0.46 GPa, and the elongation at break was 85.2%.

Table 2. Tensile strength and elongation at break of PET fiber samples
prepared through various processing conditions.
Tensile strength (GPa) Elongation (%)
Sample 1 0.46 85.2
Sample 2 1.13 13.4
Sample 3 1.21 12.5
Sample 4 1.27 11.7
Sample 5 1.58 11.7
3.2. Laser Raman spectroscopy
3.2.1. Reproducibility As only small differences in the laser Raman spectra were expected when
comparing the fiber samples of different mechanical properties as well as comparing those with and
without applying the tensile load, firstly, reproducibility of the data acquisition was investigated
comparing the results of the wavenumber and the FWHM of scattering peak at around 1616 cm-1 for
eight repeated measurements of the same fiber sample. The results are shown in Table 3. Standard
deviations of both the peak wave number and that of the FWHM of only about 0.03 were obtained.
Through this accuracy test, the reproducibility of the measurement was found to be satisfactorily high
enough for the differentiation of the characteristics of fiber samples in this study.
Table 3. The wavenumber and the full width at half
maximum of the peak at around 1616 cm-1. Standard
deviations of these values are also shown.
Measurement
#
Peak wavenumber
(cm-1)
Full width at
half maximum
(cm-1
)
1st 1615.561 9.488
2nd 1615.555 9.468
3rd 1615.604 9.500
4th 1615.602 9.538
5th 1615.607 9.556
Figure 1. Stress-strain curves of PET
fiber samples prepared through various
processing conditions.

6th 1615.523 9.489
7th 1615.554 9.473
8th 1615.552 9.494
Standard
deviation 0.031 0.031
3.2.2. Peak analysis Raman scattering peak located at around 1616 cm-1 has characteristics of
changing peak wavenumber and peak width when stress is applied. Figure 2 shows the change of
FWHM of the peak around 1616 cm-1 due to the loading of tensile stress for various fibers. Without
applying the tensile stress, the FWHM for the melt spun and drawn/annealed fibers prepared using a
small diameter nozzle in the spinning process was narrower than that for the fibers prepared using a
large diameter nozzle, whereas the high strength fiber prepared with a new method showed the
narrowest FWHM in comparison with any other samples. Large nozzle diameter corresponds to a
large Deborah number, whereas the new method for producing high strength PET fibers was designed
so as to decrease the Deborah number in the melt spinning process. Accordingly, it was speculated that
the spinning process with lower Deborah number leads to the formation of structure with more
homogeneous state of molecular entanglement in the as-spun fibers, which eventually causes narrower
residual stress distribution in the drawn/annealed fibers. For all the drawn/annealed fibers, increases of
the FWHM upon the loading of tensile stress were found to be similar. On the other hand, the FWHM
for the high speed melt spun fibers prepared with a large diameter nozzle was narrower than those for
the drawn fiber samples. It can be considered that in the high speed spinning process, lower tensile
stress was loaded for the formation of fiber structure through the orientation-induced crystallization in
the melt spinning process. This may lead to the narrower FWHM because of the lower level of mean
residual stress. In contrast, larger increase in the FWHM value was observed for this sample after
applying the tensile load. This result suggested that the individual molecular chains between adjacent
entanglement points bear the applied stress with significantly inhomogeneous manner in comparison
with other drawn/annealed fibers.
Figure 2. Variation of FWHM (Full width at
half maximum) of Laser Raman spectrum
peak at around 1616 cm-1 with application of
tensile stress for five different PET fiber
samples.
4. Conclusions

As described above, improvement of the mechanical properties of PET fibers showed close correlation
with the decrease in the FWHM of the aromatic ring stretch vibration mode peak in the laser Raman
spectrum. Suppression of the increase of FWHM upon the loading of tensile stress was also confirmed.
These results suggested the applicability of laser Raman spectroscopy for distinguishing the difference
in the state of molecular entanglement. In summary, it can be said that narrow FWHM and its small
increase upon the application of tensile load are the conditions for achieving the fibers of high
mechanical properties.
Acknowledgement
This study is supported by Korean National R&D fund for the international collaboration program of
KIAT (Korea Institute for Advancement of Technology)
References
[1] Masuda M, Takarada W and Kikutani T 2010 Intern. Polymer Processing 25 p 159
[2] Jeon H, Ito H, Kikutani T and Norimasa O 1997 Sen’i Gakkaishi 53 p 540
[3] Fina L J, Bower D I and Ward I M 1988 Polymer 29 p 2146

Woven metamaterials with an electromagnetic phase-advance
for selective shielding
C Huppé
1,2, C Cochrane
1,2, L Burgnies
3,4, F Rault
1,2, G Ducournau
3,
E Lheurette 3, V Koncar
1,2, D Lippens
3
1 GEMTEX EA - 2461, ENSAIT, F-59056 Roubaix cedex 1, France 2 Univ. Lille, F-59000 Lille, France 3 Univ. Lille, CNRS, Centrale Lille, ISEN, Univ. Valenciennes, UMR 8520 - IEMN, F-59000
Lille, France 4 Univ. du Littoral Côte d'Opale, F-62228 Calais cedex, France
e-mail: [email protected]
Abstract. This study deals with the development of a large woven metamaterial surface for
applications in the submillimeter frequency band. Before weaving, design of the metamaterial
textile is investigated to obtain a phase-advance near 500 GHz. Then, a large sample is
produced by semi-industrial machine and characterized in terms of dimensional homogeneity
and electromagnetic behaviours in the frequency band [325 – 700 GHz]. Dimensional
heterogeneity is measured to be less than 2% and shows that weaving process is well
controlled. A phase-advance and high-pass filter behaviors are experimentally evidenced by
electromagnetic characterizations with potential applications for selective shielding and phase
manipulation of the wave.
1. Introduction In the middle of the 1990s, the scientific field of metamaterials has appeared with the emergence of technologies permitting to produce new materials with electromagnetic or optical properties which can not be found in nature [1]. Metamaterials are produced by arranging metallic and/or dielectric structures with a specific organisation (slotted rings, metal cylinders, fishnets, arrays of planar or dielectric resonators…)[2]–[6]. While natural materials have only values of the electromagnetic parameters (permittivity and permeability ) greater than one, such a metamaterial can act as an equivalent material with effective electromagnetic parameters which can have any positive or negative values. Then new applications have been considered as perfect lens previously theoretically proposed by Veselago [7], perfect electromagnetic absorbers [2], or the invisibility cloak to hide objects surrounded by a metamaterial [8]. A lab scale textile inspired technology has been proposed [9], and negative refractive index appearing as a phase-advance of the electromagnetic wave transmitted through a textile metamaterial have been measured [10].
This study deals with the development of a more realistic woven metamaterial in terms of flexibility and of the type of yarns available on the market. Metamaterials will be produced by the intrinsic ripple of plain wave woven yarns and not by addition of wires, by coating, printing or embroidery, as it is currently considered in literature. Firstly, we propose to study the homogeneity of woven metamaterial produced with semi-industrial machine. In a second part, electromagnectic characterization will be proposed showing a phase-advance of the transmission through the structure.

2. Materials and experimental method 2.1. Simulation Figure 1 shows a 3D schematic of the basic cell of the fabric used for the simulation of electromagnetic responses of woven metamaterials with HFSS software by Ansys. Metallic wires (in orange/green) are composed of a copper (in orange) monofilament with a varnished dielectric cladding (in green), and dielectric monofilaments (in blue) are considered. Relative permittivity of dielectric
materials (yarns and varnish) is fixed to = 3.3 (1 - i 0.02) [11]. For simulation, an electric field polarization parallel to conductive copper yarns is considered.
Figure 1. Basic cell of the fabric used for simulation (a), equivalent electric circuit of woven
metamaterial (b), and equivalent electric circuit for phase-advance behavior (c). 2.2. Materials and woven structure Textile metamaterial (30 x 30 cm2, Figure 2) was produced by a weaving loom CCI SL8900S with parameter settings permitting to respect the geometrical dimensions of the basic cell previously defined by electromagnetic simulations with the goal to obtain a phase-advance in the frequency response around 500 GHz. Thus plain weave was selected with metallic wires in weft direction and dielectric yarns in wrap direction. According to simulations and weaving machine possibility, a warp density of 18 yarns.cm-1 was used. Dielectric yarns were polyethylene terephthalate monofilament with diameter of 100 µm, and copper yarns, of diameter 81 µm, vanished with dielectric material of thickness estimated to 6 µm, were used for weft direction.
Figure 2.Textile metamaterial (30 x 30 cm2) and close up view of weaving.

2.3. Dimensional characterization The woven textile have been divided in 21 areas of 5 x 5 cm
2, and each area has been observed with an
optical microscope to measure the real values of px and py periods. Thus 304 measurements were taken for px and 373 for py. From dimensional measurements, mean value, minimal value, maximal value and standard deviation have been calculated and reported in the Table 1. 2.4. Electromagnetic characterization Complex transmission coefficient was measured in two frequency bands (325-500 GHz and 500-750 GHz) by a Vector Network Analyzer (VNA) Rohde & Schwarz ZNA 24. The experimental setup is shown in Figure 3. Fabric has been cut in samples of 20 x 12.5 cm2 to fit in the sample holder which is fixed on a motorized XYZ displacement stage. It was positioned in the middle of the transmitting and receiving devices constituted by an antenna and a lens. The sample was illuminated by a collimated beam of about 1 cm of diameter, and the transmission (ts) and reflection (rs, not shown here) coefficients were measured by scanning the entire sample with an horizontal and vertical step of 1 cm. More than 200 electromagnetic measurements have been performed in each band. They permit the statistic evaluation of the rejection frequency fR and of the frequency fT~1 with maximum transmission reported in the Table 2.
Figure 3. Manufactured textile metamaterial and experimental electromagnetic setup.
Finally, the transmission coefficient tref was also measured in the absence of the sample and it was
used as a reference for calculating the transmission coefficient for a thickness of the woven metamaterial structure e = 0.18 mm by equation 1 [10].
c
eiexp
t
tt
ref
s (1)
The set of measurement data is then post-processed by a Scilab code for (i) interpolating the
frequency responses of each measured transmission by spline functions ; (ii) determining the frequency fR and the value of the transmission tmin, both corresponding to a rejection, as well as the values corresponding to the quasi-unit transmission (fT ~ 1, and tmax).
3. Results 3.1. Simulation In the Figure 4, transmissions (T) simulated for a period px =0.55 mm with the period py as a parameter from 0.46 mm to 0.54 mm are plotted. We can note that the woven structure act as a high-pass filter. Under f ~ 500 GHz, less than 10% of the power (T(dB) < -10dB) is transmitted through the textile while quasi-unitary transmission band is observed at higher frequency, above a strong rejection appearing between 440 GHz and 480 GHz depending on the value of py. Between the rejection and

500 GHz, a phase-advance is observed just above a phase jump of near 180°. In this frequency band, the metamaterial textile is equivalent to a material with a negative refractive index.
Figure 4. Simulated transmission through the woven metamaterial illustrated in insert.
To better understanding the frequency response of the Figure 1, the equivalent electric circuit of the
weaving shown in the Figure 1b can be evaluated. By calculation, we can show that each impedance (zi with i = 1 to 3) of the circuit corresponds to a parallel RLC circuit with a resonance appearing at the rejection frequency for z3, and at around 560 GHz for z1 = z2. The latter frequency value corresponds to the second minimum of transmission observed in the Figure 4. Before the resonance, the impedance of a RLC circuit is inductive and above it is capacitive. Then, between the two resonances of impedances the woven metamaterial is equivalent to the high-pass filter circuit shown in the Figure 1c, and a phase-advance appears in the phase of the transmission coefficient. More extensive physical explanations about the origin of the phase-advance observed in woven metamaterials can also be found in the reference [12]. 3.2. Dimensional characterization From optical microscope observations, px and py periods and their statistical value are presented in
Table 1. The plain weave is homogeneous in terms of yarn periods. The period px have a weak
variation (px ~ 0.5 %) while py have highest dispersion (py ~ 2 %) in good accordance with the
distributions of the measured periods plotted in the Figure 5.
Table 1. Statistical values from px and py periods measurements
Moy (mm) (µm) Min (mm) Max (mm)
px 0.548 2.46 0.542 0.554
py 0.512 10.58 0.491 0.531
Figure 5. Distributions of the measured periods px and py in the entire woven sample.

We can see that the distribution of the period px follows a narrow Gaussian shape centered on 0.548 mm, while the distribution for the period py is rather uniform and more extended from 0.49 and 0.53 mm. These behaviors can be explained by the weaving process. Indeed, the spacing between wrap yarns is quite constant because it is imposed by comb, whereas weft yarns are packed with a force which may not be constant during the textile production. 3.3. Electromagnetic characterization Table 2 summarizes the statistical values calculated from about 200 and 370 measured transmissions used to determine fR and fT ~ 1 respectively. Despite the relatively strong dispersion of the py values shown above, it appears that the rejection frequency is relatively stable with a low standard deviation ( = 0.55%) and values centered around 478.8 GHz. On the other hand, the value of the minimum transmission at rejection varies greatly in a ratio 2 (in dB). Table 2. Statistical measured values for fR and fT ~ 1 and for transmission levels in dB
Moy Min Max
fR (GHz) 478.8 2.61 471.2 485.0
tmin (dB) -29.7 3.37 -41.6 -23.1
fT~1 (GHz) 509.8 11.4 494.8 546.0
tmax (dB) -2.85 0.650 -4.55 -1.69
A selection of deembedded experimental transmissions measured at three positions on the sample and corresponding to minimal, mean, and maximal values of the rejection frequency fR are plotted in the Figure 6. A phase-advance is clearly evidenced between the rejection at around 480 GHz and the highest transmission level at 500 GHz. Results show a strong rejection down to T ~ -30 dB, and a phase jump of more than 100° at the rejection.
Figure 6: Experimental transmission, modulus (a) and phase (b), measured at three positions on the
sample corresponding to the extreme and mean values of the rejection frequency fR.
On the Figure 6, the sensitivity of the rejection frequency fR is visible and a quasi-insensitivity of fT ~ 1 with a maximum transmission value (about -2 dB) is observed. These sensitivities are also observed on the phase of the transmission which shows a phase shift at the rejection preceding a phase-advance frequency band. It is noted that the low sensitivity of the frequency fT ~ 1 makes it possible to obtain a phase-advance which is almost identical and not very sensitive to the position of the measurement on the sample. Finally, experiments compare favorably with the simulated results plotted in the Figure 4 which shows identical transmission phases around the maximum transmission. Beyond the phase-advance, we can mention that such textile behaves as a high-pass filter, with an attenuated band lower than -12 dB and a higher transmission above 490 GHz. Such an electromagnetic characteristic could be a good feature for selecting the frequency band of electromagnetic shielding.
4. Conclusion A textile metamaterial has been produced by weaving metallic and dielectric yarns with specific dimensions, and it has been electromagnetically characterized in the frequency band 325 - 700 GHz.

Experiments have been favorably compared with simulated results. Phase-advance and high-pass filter behaviors have been measured with potential applications in metamaterial and electromagnetic shielding domains. Acknowledgments These works held with the financial support of the Fonds Européen de Développement Régional/ Met steun van het Europees Fonds voor Regionale Ontwikkeling in the framework of the European Interreg France-Wallonie-Vlaanderen project named Luminoptex.
References
[1] F. Capolino, Theory and Phenomena of Metamaterials. CRC Press, 2009.
[2] N. I. Landy, S. Sajuyigbe, J. J. Mock, D. R. Smith, and W. J. Padilla, “Perfect Metamaterial
Absorber,” Phys. Rev. Lett., vol. 100, no. 20, p. 207402, May 2008.
[3] A. Mary, S. G. Rodrigo, F. J. Garcia-Vidal, and L. Martin-Moreno, “Theory of Negative-
Refractive-Index Response of Double-Fishnet Structures,” Phys. Rev. Lett., vol. 101, no. 10, p.
103902, Sep. 2008.
[4] J. Hao, V. Sadaune, L. Burgnies, and D. Lippens, “Ferroelectrics based absorbing layers,” J. Appl.
Phys., vol. 116, no. 4, p. 043520, Jul. 2014.
[5] V. V. Khardikov, S. V. Mizrakhy, V. R. Tuz, and S. L. Prosvirnin, “Resonant all-dielectric planar
metamaterials,” in 2016 9th International Kharkiv Symposium on Physics and Engineering of
Microwaves, Millimeter and Submillimeter Waves (MSMW), 2016, pp. 1–5.
[6] N. Xu, R. Singh, and W. Zhang, “High-Q lattice mode matched structural resonances in terahertz
metasurfaces,” Appl. Phys. Lett., vol. 109, no. 2, p. 021108, Jul. 2016.
[7] V. G. Veselago, “The electrodynamics of substances with simultaneously negative values of
epsilon and mu.,” Sov. Phys. Uspekhi, vol. 10, no. 4, p. 509, 1968.
[8] J. B. Pendry, D. Schurig, and D. R. Smith, “Controlling Electromagnetic Fields,” Science, vol.
312, no. 5781, pp. 1780–1782, Jun. 2006.
[9] M. Ghebrebrhan et al., “Tunable millimeter and sub-millimeter spectral response of textile
metamaterial via resonant states,” Opt. Express, vol. 22, no. 3, pp. 2853–2859, Feb. 2014.
[10] L. Burgnies et al., “Experimental phase-advance in woven textile metasurface,” Appl. Phys. Lett.,
vol. 107, no. 20, p. 203505, Nov. 2015.
[11] L. Burgnies et al., “Loi des mélanges pour les tissages de fils diélectriques,” in Proceeding of
JNM 2017, Saint Malo, 2017.
[12] L. Burgnies, É. Lheurette, and D. Lippens, “Textile inspired flexible metamaterial with negative
refractive index,” J. Appl. Phys., vol. 117, no. 14, p. 144506, Apr. 2015.

Soil-release behaviour of polyester fabrics after chemical
modification with polyethylene glycol
T M R Miranda1, J Santos
1 and G M B Soares
1
1Minho University. 2C2T – Centre for Textile Science and Technology. Department of
Textile Engineering. Guimarães. Portugal
Email: [email protected]
Abstract. The fibres cleanability depends, among other characteristics, on their hydrophilicity.
Hydrophilic fibres are easy-wash materials but hydrophobic fibres are difficult to clean due to
their higher water-repellent surfaces. This type of surfaces, like polyester (PET), produce an
accumulation of electrostatic charges, which favors adsorption and retention of dirt. Thus, the
polyester soil-release properties can be increased by finishing processes that improve fiber
hydrophilicity. In present study, PET fabric modification was described by using poly(ethylene
glycol) (PEG) and N,N´-dimethylol-4,5-dihydroxyethylene urea (DMDHEU) chemically
modified resin. Briefly, the modification process was carried out in two steps, one to hydrolyse
the polyester and create hydroxyl and carboxylic acid groups on the surface and other to
crosslink the PEG chains. The resulting materials were characterized by contact angle, DSC
and FTIR-ATR methods. Additionally, the soil release behavior and the mechanical properties
of modified PET were evaluated. For the best process conditions, the treated PET presented 0º
contact angle, grade 5 stain release and acceptable mechanical performance.
1. Introduction
Polyester fabrics are made from poly(ethylene terephthalate) (PET), currently accounting for more
than 50% of all fibrous materials, have high uniformity, mechanical strength and resistance against
chemicals and abrasion.
The fibres cleanability depends, among other characteristics, on their hydrophilicity. So,
hydrophilic fibres are easy-wash materials but hydrophobic fibres are difficult to clean due to their
higher water-repellent surfaces. These type of surfaces, like that of PET fibres, produce an
accumulation of electrostatic charges that attract and retain dirt. Thus, the polyester soil-release
properties can be increased by finishing processes that improve fiber hydrophilicity [1, 2].
In order to increase their surface energy and hence their hydrophilicity, the PET chemical structure
can be modified by different ways: by chemical finishing or grafting, chemical treatment with NaOH,
superficial physical treatment using plasma or by a biochemical treatment with enzymes [1, 2, 3, 4, 5].
Poly(ethylene glycol) (PEG) can be used in chemical PET modification, due to its exceptional
properties such as hydrophilicity, flexibility and nontoxicity [1]. This hydrophilic polymer has already
been used to improve soil-release properties of PET fibres in the form of a copolymer with blocks of
poly(ethylene terephtalate) and poly(oxyethylene terephtalate) that provide a structure with alternating
hydrophilic and hydrophobic regions that have a strong attraction for the PET surface [2].
Alkaline hydrolysis of PET fibres is one of the most reported and widely used strategies to enhance
PET reactivity, by increasing the number of reactive sites that can react during chemical modification.
The nucleophilic attack of a base on the electron-deficient carbonyl carbon in PET causes chain
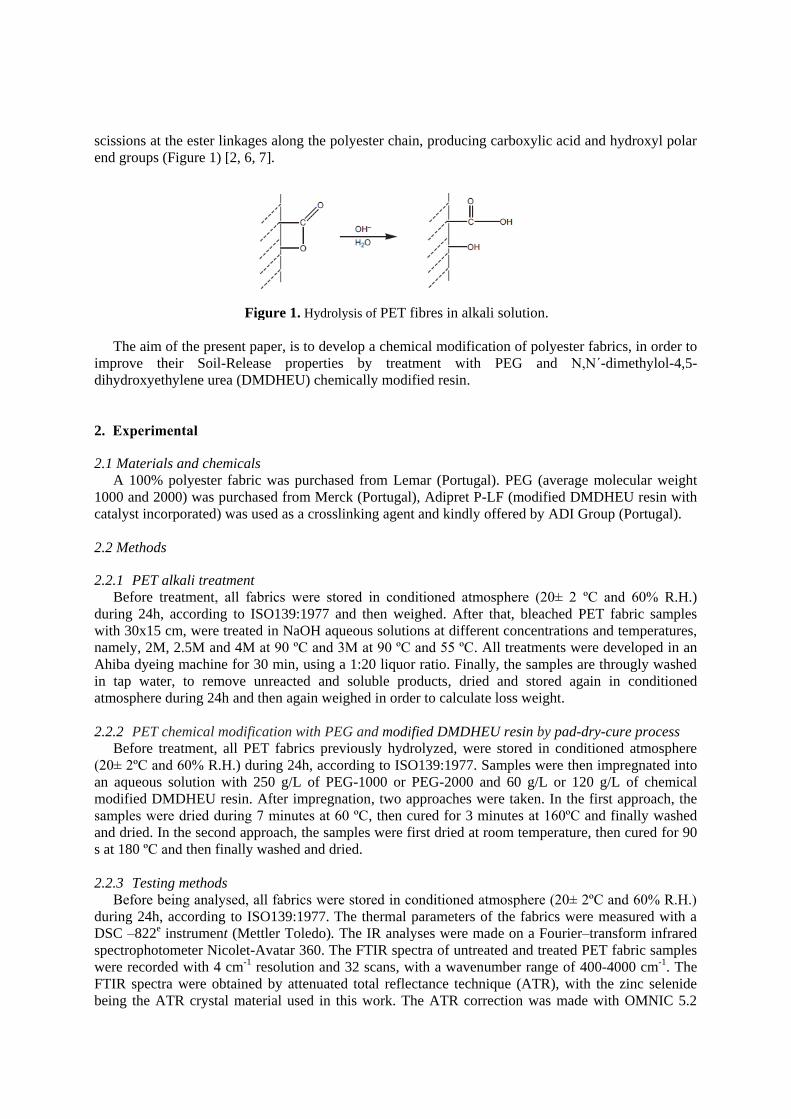
scissions at the ester linkages along the polyester chain, producing carboxylic acid and hydroxyl polar
end groups (Figure 1) [2, 6, 7].
Figure 1. Hydrolysis of PET fibres in alkali solution.
The aim of the present paper, is to develop a chemical modification of polyester fabrics, in order to
improve their Soil-Release properties by treatment with PEG and N,N´-dimethylol-4,5-
dihydroxyethylene urea (DMDHEU) chemically modified resin.
2. Experimental
2.1 Materials and chemicals
A 100% polyester fabric was purchased from Lemar (Portugal). PEG (average molecular weight
1000 and 2000) was purchased from Merck (Portugal), Adipret P-LF (modified DMDHEU resin with
catalyst incorporated) was used as a crosslinking agent and kindly offered by ADI Group (Portugal).
2.2 Methods
2.2.1 PET alkali treatment
Before treatment, all fabrics were stored in conditioned atmosphere (20± 2 ºC and 60% R.H.)
during 24h, according to ISO139:1977 and then weighed. After that, bleached PET fabric samples
with 30x15 cm, were treated in NaOH aqueous solutions at different concentrations and temperatures,
namely, 2M, 2.5M and 4M at 90 ºC and 3M at 90 ºC and 55 ºC. All treatments were developed in an
Ahiba dyeing machine for 30 min, using a 1:20 liquor ratio. Finally, the samples are througly washed
in tap water, to remove unreacted and soluble products, dried and stored again in conditioned
atmosphere during 24h and then again weighed in order to calculate loss weight.
2.2.2 PET chemical modification with PEG and modified DMDHEU resin by pad-dry-cure process
Before treatment, all PET fabrics previously hydrolyzed, were stored in conditioned atmosphere
(20± 2ºC and 60% R.H.) during 24h, according to ISO139:1977. Samples were then impregnated into
an aqueous solution with 250 g/L of PEG-1000 or PEG-2000 and 60 g/L or 120 g/L of chemical
modified DMDHEU resin. After impregnation, two approaches were taken. In the first approach, the
samples were dried during 7 minutes at 60 ºC, then cured for 3 minutes at 160ºC and finally washed
and dried. In the second approach, the samples were first dried at room temperature, then cured for 90
s at 180 ºC and then finally washed and dried.
2.2.3 Testing methods
Before being analysed, all fabrics were stored in conditioned atmosphere (20± 2ºC and 60% R.H.)
during 24h, according to ISO139:1977. The thermal parameters of the fabrics were measured with a
DSC –822e instrument (Mettler Toledo). The IR analyses were made on a Fourier–transform infrared
spectrophotometer Nicolet-Avatar 360. The FTIR spectra of untreated and treated PET fabric samples
were recorded with 4 cm-1 resolution and 32 scans, with a wavenumber range of 400-4000 cm-1. The
FTIR spectra were obtained by attenuated total reflectance technique (ATR), with the zinc selenide
being the ATR crystal material used in this work. The ATR correction was made with OMNIC 5.2
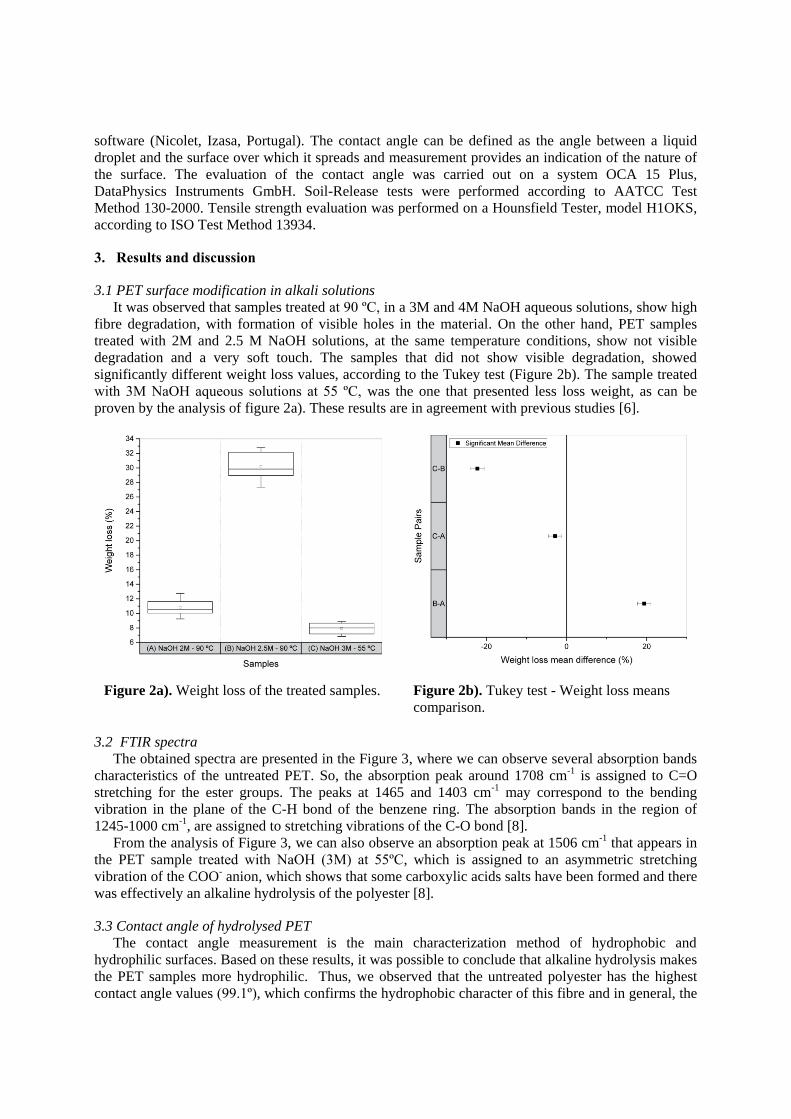
software (Nicolet, Izasa, Portugal). The contact angle can be defined as the angle between a liquid
droplet and the surface over which it spreads and measurement provides an indication of the nature of
the surface. The evaluation of the contact angle was carried out on a system OCA 15 Plus,
DataPhysics Instruments GmbH. Soil-Release tests were performed according to AATCC Test
Method 130-2000. Tensile strength evaluation was performed on a Hounsfield Tester, model H1OKS,
according to ISO Test Method 13934.
3. Results and discussion
3.1 PET surface modification in alkali solutions
It was observed that samples treated at 90 ºC, in a 3M and 4M NaOH aqueous solutions, show high
fibre degradation, with formation of visible holes in the material. On the other hand, PET samples
treated with 2M and 2.5 M NaOH solutions, at the same temperature conditions, show not visible
degradation and a very soft touch. The samples that did not show visible degradation, showed
significantly different weight loss values, according to the Tukey test (Figure 2b). The sample treated
with 3M NaOH aqueous solutions at 55 ºC, was the one that presented less loss weight, as can be
proven by the analysis of figure 2a). These results are in agreement with previous studies [6].
Figure 2a). Weight loss of the treated samples. Figure 2b). Tukey test - Weight loss means
comparison.
3.2 FTIR spectra
The obtained spectra are presented in the Figure 3, where we can observe several absorption bands
characteristics of the untreated PET. So, the absorption peak around 1708 cm-1 is assigned to C=O
stretching for the ester groups. The peaks at 1465 and 1403 cm-1 may correspond to the bending
vibration in the plane of the C-H bond of the benzene ring. The absorption bands in the region of
1245-1000 cm-1, are assigned to stretching vibrations of the C-O bond [8].
From the analysis of Figure 3, we can also observe an absorption peak at 1506 cm-1 that appears in
the PET sample treated with NaOH (3M) at 55ºC, which is assigned to an asymmetric stretching
vibration of the COO- anion, which shows that some carboxylic acids salts have been formed and there
was effectively an alkaline hydrolysis of the polyester [8].
3.3 Contact angle of hydrolysed PET
The contact angle measurement is the main characterization method of hydrophobic and
hydrophilic surfaces. Based on these results, it was possible to conclude that alkaline hydrolysis makes
the PET samples more hydrophilic. Thus, we observed that the untreated polyester has the highest
contact angle values (99.1º), which confirms the hydrophobic character of this fibre and in general, the

contact angle decreases with saponification, regardless of the conditions used. The best results
correspond to the PET sample hydrolyzed with NaOH 3M, at 55ºC, with a contact angle of 23,8º.
Figure 3. FTIR spectra of untreated PET () and PET treated with NaOH (3M) at 55 °C (…).
3.4 Basic thermal properties of hydrolysed PET
A DSC equipment was used to evaluate melting temperature and fusion enthalpy of untreated and
treated PET samples during the exothermic process. Figures 4 and 5 show the DSC thermograms of
untreated and hydrolysed PET
In Table 1 we can see the melting enthalpy and the melting point of untreated (A) and hydrolysed
PET with NaOH 3M at 55 °C (B).
Table 1. Differential scanning calorimetry results of untreated (A) and treated PET (B)
Melting enthalpy (J/g) Melting point (°C)
A 48.11 253.62
B 45.93 253.56
Figure 4. DSC heating curve of untreated PET. Figure 5. DSC heating curve of PET treated
with NaOH solution (3M) at 55ºC.
Analyzing the Table 1, it can be concluded that alkaline hydrolysis promotes a polymer chains
breaking, leading to a decrease in crystallinity. Thus, a slight decrease in melting enthalpy was
observed for the PET samples hydrolyzed with NaOH 3M at 55 °C, when compared with the untreated
PET. It should be noted that, the melting point for the treated and untreated PET samples are similar.
These results are in agreement with the results obtained in the evaluation of the tensile strength of the
hydrolyzed PET which are closest to the untreated PET (results not shown). So, we can conclude that
the best conditions to develop PET saponification with a minimum fibre degradation is a treatment
with NaOH 3M at 55 °C for 30 minutes.

3.4 Chemical modification of hydrolyzed PET fibres with PEG and DMDHEU resin
The chemical modification of PET fibres was studied in terms of PEG and resin concentrations as
well as process conditions. Under suitable conditions the application of a crosslinking agent (modified
DMDHEU resin), that can act as a bridge, the chemical crosslinking reaction between the low
molecular weight PEG and the fibre can be promoted.
It was observed that by performing a pre-drying at 60 ºC, after impregnation and before the curing
process, a PEG degradation occurs as described by J. Glastrup [9]. He noted that PEG degradation can
occur under air stream at 70°C, with formation of formic acid. Under dry conditions, this acid reacts
with the terminal hydroxyl group of the PEG, resulting in formic acid esters. Under wet conditions the
acid stays in solution or evaporates. Therefore, the pre-drying step previously described by T. L. Vigo
and J. S. Bruno [10], in their PET modification process with DMDHEU and adopted in our first trials,
was changed by a simple room temperature drying process. The PET samples were thus treated by this
process, with PEG of different molecular weights (1000 and 2000) in the presence of a modified
DMDHEU resin (Adipret P-LF). After the treatment, we evaluated the changes produced in terms of
weight gain, contact angle, mechanical and soil-release properties.
Several treatments were developed in conditions described in Table 2. In Figure 7a) we can see the
weight gain obtained in each treatment. According to the Tukey test presented in Figure 7b) the best
results are obtained in the case of sample D, which are significantly different from the results obtained
in other samples. The increase in the hydrophilicity of treated PET surface was confirmed by decrease
of contact angle from 99º to 0º (Figure 8).
Table 2. Chemical modification conditions
Sample PEG 1000 (g/L) PEG 2000 (g/L) DMDHEU resin (g/L)
A 250 60
B 250 120
C 250 60
D 250 120
Figure 7a). Weight gain of the treated samples. Figure 7b). Tukey test - Weight gain means
comparison.

The treated PET samples showed better soil-release properties, increasing the stain release degree
from 3-4 in case of untreated PET, to stain release grade 5 for PET fabric treated with PEG (2000) and
modified DMDHEU (60 g/L) (Figure 9).
Figure 9. PET samples used in the evaluation of soil-release properties. a) untreated
PET; b) PET fabric treated with PEG (1000) and DMDHEU resin (60 g/L); c) PET
fabric treated with PEG (1000) and DMDHEU resin (120 g/L); d) PET fabric treated
with PEG (2000) and DMDHEU resin (60 g/L); e) PET fabric treated with PEG (2000)
and DMDHEU resin (120 g/L).
4. Conclusions
This work allowed to conclude that, PET chemical modification with PEG and modified
DMDHEU resin was effective. The best results were obtained with PET fabric treated with PEG 2000
in presence of resin (60 g/L). This sample presented a 0º contact angle, acceptable mechanical
performance (results not shown) and good soil-release properties.
Acknowledgments
Programme - COMPETE and by national funds through FCT – Foundation for Science and
Technology within the scope of the project POCI-01-0145-FEDER-007136
References
[1] Takke V Behary N Perwuelz A and Campagne C 2011 J. Appl. Polymer Sci. 122 2621
[2] Butola, B S 2008 Polyesters and polyamides ed B L Deopura, R Alagirusamy, M Joshi, B
Gupta (Woodhead Publishing Limited Cambrige England) chapter 12 pp 333
[3] Kish M H and Nouri M 1999 J. Appl Polymer Sci 72 631
[4] Hsiao K Jen Z Lu C 2002 J. Appl Polymer Sci. 86 3601
[5] Vertommen M A M E Nierstrasz Veer V A and Warmoeskerken M M C G 2005 J. of Biotech.
120 376
[6] Wang J and Zhejiang L J 2009 Surface modification of textiles (Woodhead Publishing Limited
Cambridge)
[7] Burkinshaws M 1995 Chemical Principles of Synthetic Fibre Dyeing (published by Chapman &
Halli)
[8] Gu X Raghavana Nguyen T VanLandingham M R and Yebassaa D 2001 Polymer degradation
and stability 74 139
[9] Glastrup J 1996 Polymer Degradation and Stability 52 217
[10] Vigo T L and Bruno J S 1987 Textile Research Institute 57 427
Figure 8. Dynamic contact angles of water drop on a) untreated PET; b) PET treated with PEG
(1000) and DMDHEU (60 g/L); c) PET treated with PEG (2000) and DMDHEU (60 g/L).