co national advisory committee for aeronautics · national advisory committee _ _ for aeronautics...
TRANSCRIPT

CO
<(P<
: = I I II I F I1 i I" rIII ,
NATIONAL ADVISORY COMMITTEE
_ _ FOR AERONAUTICS
TECHNICAL NOTE
No. 1819
THE RF__PONSE OF p__-URING SYSTEMS
TO OSCILLATING PRESSURES.
By Israel Taback
Langley Aeronautical Laboratory
Langley Air Force Base, Va.
/
Washington
February 1949REPRODUCEDBY
NATIONAL TECHNICAL _
INFORMATION SERVICE !U. S. DEPARTMENTOF COMMERCE
SPRINGFIELD,VA. 22161
I III I
f
D
_k
/- J
https://ntrs.nasa.gov/search.jsp?R=19930082493 2018-06-11T11:03:05+00:00Z

NATIONAL ADVISORY COMMITTEE FOR AKRONAUTICS
TECENICY_L NOi_ NO. 1819
THE RESPONSE OF FKESS[rRE MEASURING SYSTEMS
TO 0SCILIATING PRESSURES
By Israel Taback
SUMMARY
A method is presented for calculating the response and lag Jn
pressure measuring system_ subjected to steady-state sinusoidally
varying pressures. The pressure system is assumed to consist of an
inlet restriction, tubing length, and connected instrument volume. The
material presented is limited by the fact that no theoretical method of
predicting the attenuation characteristics of the tubing is given. This
limitation is not severe, however, as this characteristic may be experi-
mentally determined for given tube sizes and pressure frequencies.
Experimental data for some sample systems tested are presented and
show good agreement with calculated values. The results are presented
in such fashion that the qualitative effect of varying the dimensions
of system components is apparent. It is therefore possible, once the
attenuation characteristics of the tube are determined, to design a
system with a required frequency response by a trial-and-error variation
of parameters.
INTRODUCTION
Of major interest in many test installations is the response of
pressure-dlstribution systems to rapidly varying pressures, both where
these pressures must be accurately measured and where unwanted oscilla-
tions must be filtered out or eliminated. When such pressures are
measured, the pressure sensing element is normally installed as close
to the point of measurement as posslble. When this installation is
not feasible, connecting tubing must be employed with the consequent
possibility of errors caused by resonance or attenuation in the tube.
Metho'ds of calculation of the response of pressure systems to small-
amplitude steady-state slnusoidal pressures based upon electromechanlcal
analogies have been previously developed (reference 1), but little use
has been made of these m_thods, both because of the large amount of
tedious calculation necessary for the solution of even simple pressure
systems and because of the lack of information as to whether the
equations were valid for pressure oscillations of large amplitude. This
paper has been prepared to present a more convenient method of calculating
response and lag in pressure systems. The main emphasis has been placed on
2 NACA_ No. !819
simplifying the necessary equations to the po_t wh_re they can be easilyapplied to practical instrumentation problems. The _c:_erial consequentlyis in such form that the qualitative effect of var._TJngkhe componentsofa pressure system is easily visualized.
In support of the theoretical m_thods presen_dj _xperimental datahave been secured on various pressure systems in the frequency range upto 70 cycles per second. Both the frequency range and pressure systemstested were chosen as being representative of conditions which would beencountered in flight and wLud-tunnel installations.
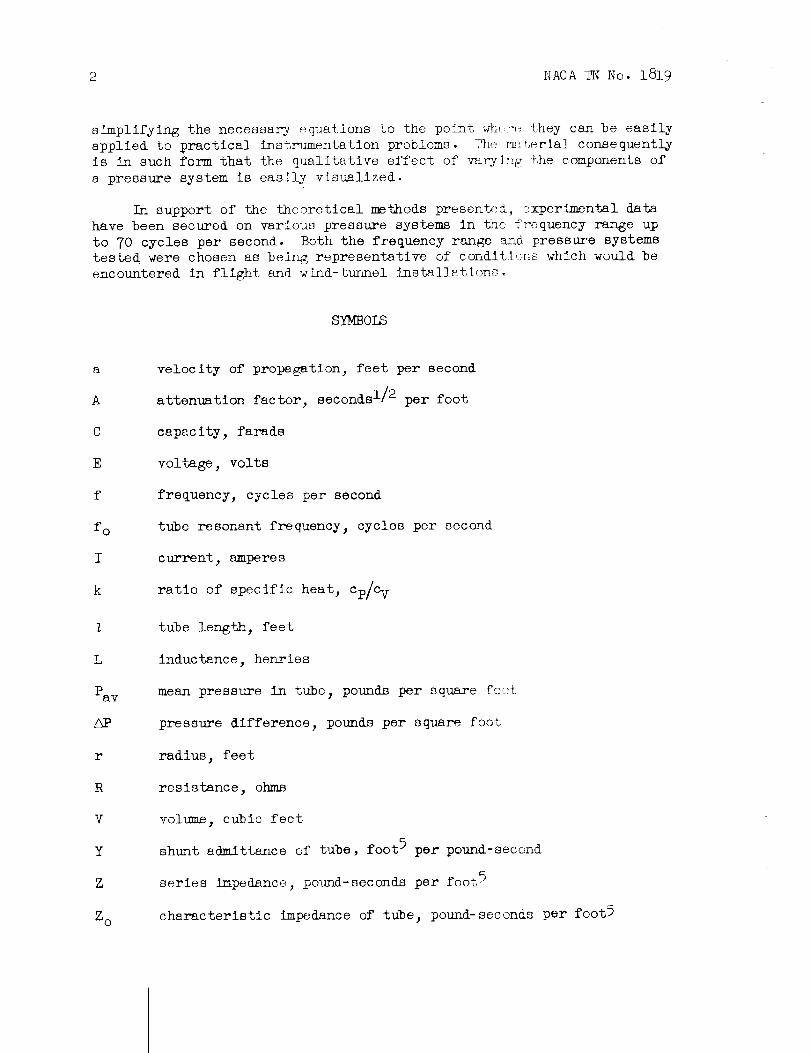
SYMBOLS
A
C
E
f
fo
I
k
Z
L
Pay
r
R
V
Y
Z
go
velocity of propagation, feet per second
attenuation factor, seconds I/2 per foot
capacity, farads
voltage, volts
frequency, cycles per second
tube resonant frequency, cycles per second
current, amperes
ratio of specific heat, Cp/C V
tube length, feet
inductance, henries
mean pressure in tube_ pounds per square fo<_t
pressure difference, pounds per square foot
radius, feet
resistance, ohms
volume_ cubic feet
shunt ad_Littance of tube, foot 5 per pound-second
series impedance, pound-seconds per foot 5
characteristic impedance of tube, pound-seconds per foot5

NACATN No. 1819
(z
k
Day
attenuation constant, 1/feet
propagation constant, radians per foot
wave length, feet
mean density in tube, slugs per cubic foot
coefficient of viscosity, pounds per foot-second
angular frequency, radians per second
Subscripts:
d
r
S
quantity existing at inlet restriction or restriction parameter
quantity existing at instrument or instrument parameter
quantity existing at pressure-system inlet
The measurement of rapidly varying pressures requires in most cases
that a pressure instrument be connected to the measuring point through a
finite length of connecting tube. The tube opening may be restricted by
a connector of smaller opening, either because of aerodynamic consider-
ations or because the response of the measuring system to the oscillating
pressures must be adjusted. In most cases exposing the pressure-
measuring diaphragm to a reference pressure is necessary. This procedure
requires that the diaphragm be installed so that it is exposed to a refer-
ence pressure volume which may be connected by means of tubing to a
reference pressure source. The reference volume and connecting tubing
is hereinafter referred to as the reference pressure system. For the
purpose of the following analysis, it will be considered that: (1) the
response of the instrument may be separately evaluated or is constant
throughout the frequency range, and that (2) deflections of the sensitive
element are sufficiently _ small so that negligible changes in internal
volume occur and no energy is transferred to the reference pressure
systems.
The air column in a tube has mass inertia, elasticity, and can
dissipate energy with its motion; consequently, as is generally known,
wave motion can be propagated along its length. The equations governing
this motion have been previously derived for sm_ll-amplitude pressure
variations (references i and 2) and are exactly similar to the equations
which govern the propagation of electrical waves on transmission lines.
As these equations already have been developed, it is relatively easy

4 NACATN No. 1819
to describe the behavior of the pressure system in terms of the analogouselectrical system by use of the usual electrical notation (reference 3).The electrical terms and the equivalent acoustical terms used herein areshown in the following table:
ElectricalTerm Unit
inductance
capacity
resistance
currentvoltage
henries
farads
ohms
amperesvolts
SymbolL
C
R
IE
E_uivalent acousticalTel_n
inertance
volumetriccapacity
flow resistance
volume flowpressure
Unit,pound-seconds2 per
foot _'foot5 per pourld
pound-seconds perfoot5
feet 3 per secondpounds per foot 2
SymbolL
C
R
QP
In acoustical terms (reference 4), the inductance per unit length of line
L = Pa---Xthe capacitance per unit length C - _r2 _nd the resistance_r2_ kPav'
AP (the latter being dependent _ the type andper unit length R =-_ ....amplitude of flow).
The behavior of the system can then be defined by the generalequations for a transmission line
where
ES = Ercosh Z_ Z + IrZoslnh_Z
ErI s = IrCOShZ_Y Z + _o sinh _ Z
Z=R+ J_L
(i)
(2)
The quantity '/ZY is a complex number and may there:Tore be written as
gZk--= _ + J_ (3)
where a is an attenuation constant determined by th,_ decrement in
pressure amplitude per length of tube and _ is a propagation constant
or phase-angle change per unit length of tube as defined by the following
equation:
2_f
: Propagation velocity

NACATN No. 1819
The quantity Zo is designated the characteristic impedanceof the tube
Zo =_= Z_Y_a+_y Y (4)
Equation (i) may be rewritten to give
E S Z o= cosh_-_ Z + -- sinh_
Er Zr(5)
Substituting equation (3)'into equation (5) and simplifying by trigono-
metric substitutions gives
+ _sinh2c_ + sin2_Z /tan-l(t_ZcLZ) (6)
Equation (6) defines the ratio of the voltage or pressure amplitude
at the open end of the tube to the amplitude existing at the pressure
capsule. The reciprocal of this ratio is called herein the response of
the system. The right-hand terms in equation (6) are given in polar
coordinates and must be added vectorially at the indicated angles.
Simplified Theory
Characteristics of system having negligible instrument volume.- Ifthe pressure capsule is sufficiently small, negligible air flow occurs at
the instrument end of the tube, Zr approaches infinity, and equation (1)reduces to
PS ES _
Pr : Er coshz_ z (7)
PS: (sinh2a_ + cos2_l/2/tan_l(tan _ tanh aZ)Pr
(8)
Further, if the tube is of sufficiently large diameter, negligible
attenuation of the pressure wave occurs in the tube, a approaches zero,and equation 8 simplifies to
PS= cos p_ (9)
Pr

6 NACATNNo. 1819
At resonance frequencies, equation (9) becomeszero and thePr
response _ becomes infinite. The following simple relationship can
then be derived for the determination of the resonant frequency :
where
cos = o (lO)
where fo is the resonant frequency of the tube with no attached volume.
As the wave length of a pressure wave is given by the relation fk = a
equation (12) indicates that, at resonance frequencies, the tube length
is an odd multiple of 1/4 wave length.
Figure i is a plot of response and phase angles based on equations (8)
and (9) for simple systems having zero or finite 8ttenuation.
Characteristics of system havin_ an inlet restriction.- In a similar
system having negligible instrument volume so that Ir approaches zero,the effect of adding a constriction at the tube inlet may be evaluated as
indicated in the following discussion.
For restrictions which are short in length compared to i wave length,
the flow impedance consists of a resistance caused by viscous pressure
losses and an inertance caused by the mass of air in the restriction.
As derived in reference 5,
Zd = Zd _d 2 4 X rd2 + 9(13)
This impedance causes a pressure loss
ES - ES' -- ISZd (14)
where ES is the applied pressure and ES' is the pressure appliedto the tube past the restriction.
From equations (i) and (2), when Ir equals ___'4_
E$ = E r cosh _ (15)

NACATN No. 1819 7
Er-- z (16)
IS - Zo
By the substitution of v_lues from equations (15) and (16) into
equation (14),
E S - ES ' Zd
ES, - Zo(17)
E S Zd(18)
Equation (18) was derived to secure the ratio of the pressure applied
to the pressure existing lh the tube past the restriction. The magnitude of
the over-all response of the tube and restriction can now be secured by
multiplying the effectiveness of the restriction, as given by equation (18),
by the relation for the tube without the restriction, as given by equation (8).
PS ES ES ' ES
Pr - Er - Er Esr
* _O tanh(_Z * J_Z sinh2_ * cos2_)i/2 /tan-l(tan _Z tanh _)
(19)
The effectiveness of the restriction can be shown to vary with the
applied frequency and the tube characteristics. In order to visualize the
effect of the constriction on the response of the system, equation (18)
may be rewritten by trigonometric substitution
=1+Zo\1+ j mh Zt Z](20)
At antlresonance frequencies (SZ = O, g, n_),
tan _Z = 0 and equation (20) reduces to
ES Zd
"'o
At res°nance frequencies (8l =2, _ 2)2 '
tan B_ = _ end equation (20) red1_ces to
ES Zd i
_S = i + Zo tanh aZ(22)

8 NACA i_ No. 1819
For the case of a resonant tube tanh _Z << I and therefore it can
be seen from equations (21) and (22) that the resi_iGtion is extremely
effective in reducing large amplitude resonances but has only a negli-
gible effect at antlresonance frequencies.
In the case of a large-diameter tube wherein the attenuation is
negligible, _ approaches zero and equation (19) _duces to
PS ES ( Zd )=Er = 1 cos (23)
Ps Za: cos _ + _ s_ _ (2_)
"'o
The impedance of a smaLl-diameter constriction is almost a pure
resistance since the viscous forces which cause presm_re losses are much
larger than the inertia forces caused by the Ease of _ir in the constric-
tion. The ratio of the impedances Zd/Z o therefore closely approaches
a real nt_nber and equation (24) can be rewritten irl polar coordinates to
give
When _ -
PsPr -
Zd
Zo - i,
(25)
PS-- : 1 (26)Pr
A plot of equation (25) is given in figure 2 for two assumed values
of the ratio Zd/Z o. As noted previously, the restriction at the tube
inlet is extremely effective at resonance frequencies but has no effect
upon the response at antiresonance frequencies. The principal difference
between an adjustment to the response of a system b2 m_ans of small-
diameter tubing or an inlet restriction may be clearly seen from a com-
parison of figures ! and 2. Although it is possible_ by use of a large-
diameter tube and a suitable inlet restriction, to secure unit response
over a large frequency range, the use of a sm_ll-diameter tube inherently
causes decreased response at higher frequencies.
Characteristics of pressure systems havin 6 instr_nent volumes.-
Pressure-measurlng instruments which are designed to have uniform response
over a wide range of frequencies are necessarily designed with high-
frequency_ low-deflection-type diaphragms. The ip_trument impegance in
such case is a function only of its vol_netrlc capec!ty and can be written
1 kea_ (27)Zr = j_c----_: _Vr

NACA TN No. 1819 9
The characteristic impedance of the tube as given by equation (4) is
Y _r2z(28)
The ratio of these impedances, which appears in equation (6), is
Z o
Z rVr _,)2 + (_,)_1/7 tan-l]3
_r2 Z(29)
For a given tube diameter and length the value of equation (29) depends
directly on the ratio of the volume of the instrument to the total volume
of the tube. Equation (6) may now be altered to include only values of
real quantities and phase angles,
P_S = (sinh2c_, + cos2_)1/2/ tan_l(ta _ _' tanh _,) VrPr + _r2Z
+ (p,)2_ 1/2 (sinh2_, + sj_u2bO1/2/ /tan_l ( tan _,_+/tan-l(_ 1 (30)
t / \tanh o_7,/ /_ \o.J
In the case of a large-diameter tube in which _ approaches zero,equation (30) reduces to
PS Vr= pz sin _z (3z)
Pr cos _Z _r2Z
A plot of equation (31) is given in figure 3 for two values of the
V rratio _. The plot indicates that the resonant frequency of a pressure
_r2Z
system decreases with an increase in instrument volume. It also shows
that instruments having volumes of the same order of magnitude as the
total tube volume cause a significant decrease in response at higherfrequencies.
At the resonant frequency of the tube with attached instrument
volume, equation (31) may be set equal to zero so that
V rcos t3Z = _ ,SZ sin 137,
_r 2 Z(32)
l0 NACA TN No. 1819
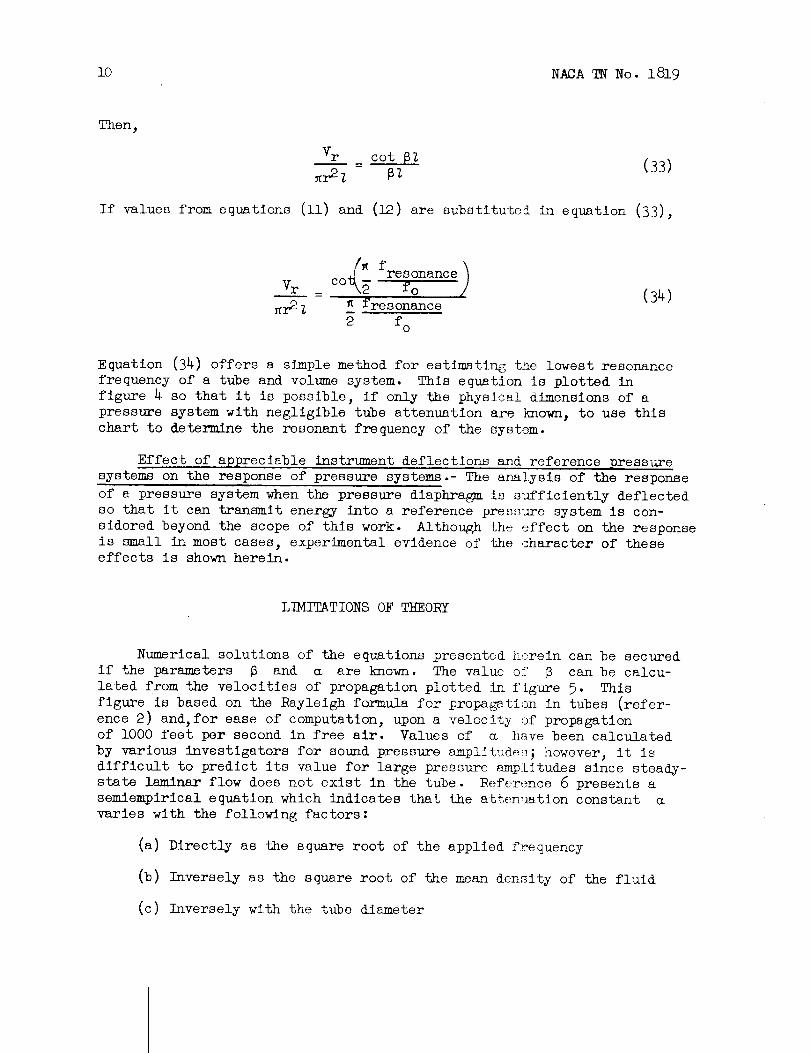
Then,
Vr cot _ZF (33)
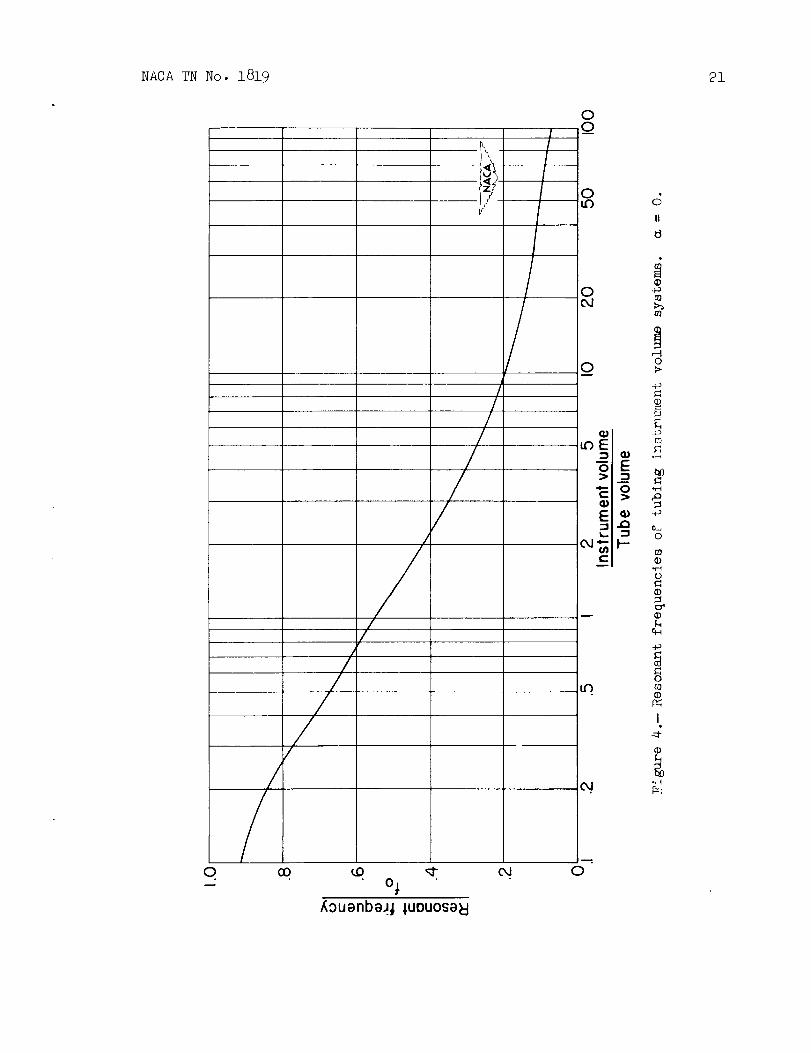
If values from equations (ii) and (12) are substituted in equation (33),
V r _ fresonancel_ co fofresonance
fo
(34)
Equation (34) offers a simple method for estimating t_e lowest resonance
frequency of a tube and volume system. This eguPtion is plotted in
figure 4 so that it is possible, if only the physical dimensions of a
pressure system with negligible tube attenuation are known_ to use this
chart to determine the resonant freguency of the system.
Effect of appreciable instrument deflections and reference pressure
systems on the response of pressure systems.- The armlysis of the response
of a pressure system when the pressure diaphragm is sufficiently deflected
so that it can transmit energy into a reference pressure system is con-
sidered beyond the scope of this work. Although the effect on the response
is small inmost cases, experimental evidence of the character of theseeffects is shown herein.
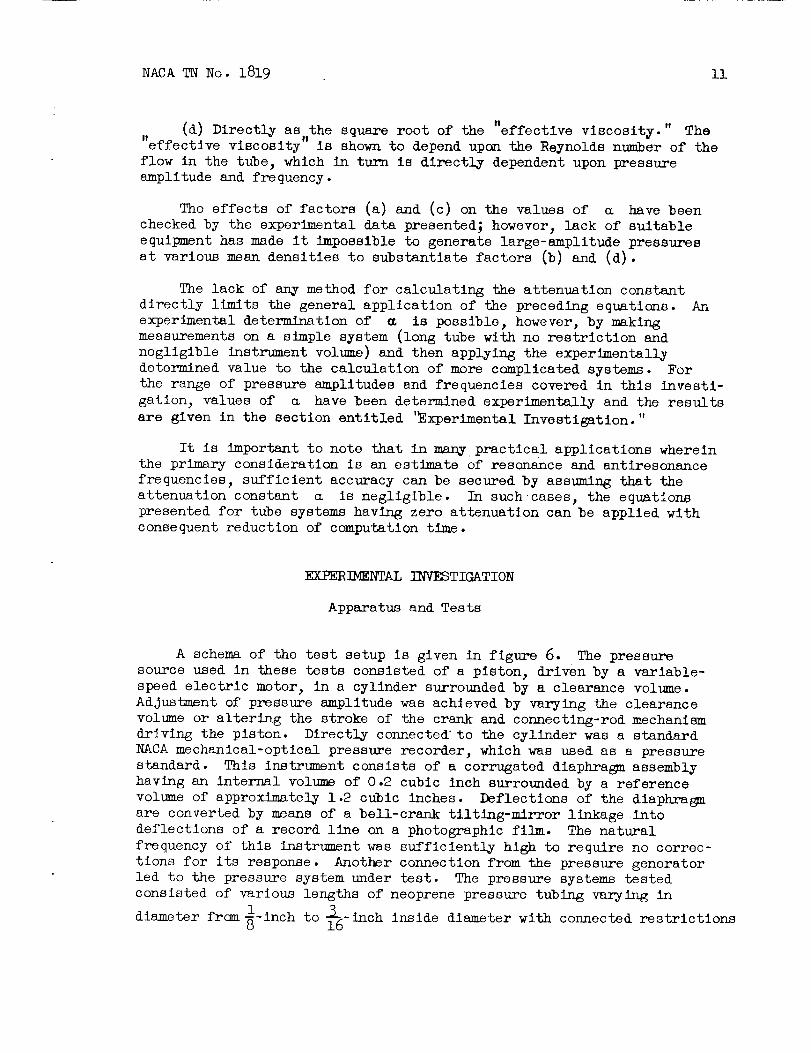
LIMITATIONS OF THEORY
Numerical solutions of the eguations presented herein can be secured
if the parameters 6 and a are known. The value of 6 can be calcu-
lated from the velocities of propagation plotted in figure 5. This
figure is based on the Rayleigh formula for propagation in tubes (refer-
ence 2) and, for ease of computation, upon a velocity of propagation
of lO00 feet per second in free air. Values of _ h_ve been calculated
by various investigators for sound pressure amplltudes; however, it is
difficult to predict its value for large pressure amplitudes since steady-
state laminar flow does not exist in the tube. Reference 6 presents a
semiempirical equation which indicates that the attenuation constant a
varies with the following factors:
(a) Directly as the square root of the applied frequency
(b) Inversely as the square root of the mean density of the fluid
(c) Inversely with the tube diameter
NACATN No. 1819 ii
(d) Directly as the square root of the "effective viscosity. " The"effective viscosity" is shownto depend upon the Reynolds number of theflow In the tube, which in turn is directly dependent upon pressureamplitude and freguency.
The effects of factors (a) and (c) on the values of a have beenchecked by the experimental data presented; however, lack of suitableequipment has nmdeit impossible to generate large-amplltude pressuresat various meandensities to substantiate factors (b) and (d).
The lack of any method for calculating the attenuation constantdirectly limits the general application of the preceding equations. Anexperimental determination of _ is possible, however, by makingmeasurementson a simple system (long tube with no restriction andnegligible instrument vollnne) and then applying the experimentallydetermined value to the calculation of more complicated systems. Forthe range of pressure amplitudes and frequencies covered in thls investi-gation, values of a have been determined experimentally and the resultsare given in the section entitled '_xperimental Investigation. "
It is important to note that in manypractical applications whereinthe prin_ry consideration Is an estimate of resonance and antlresonancefrequencies, sufficient accuracy can be secured by assuming that theattenuation constant a is negligible. In such cases, the equationspresented for tube systems having zero attenuation can be applied withconseguent reduction of computation time.
EXPERIMENTALINVESTIGATION
Apparatus and Tests
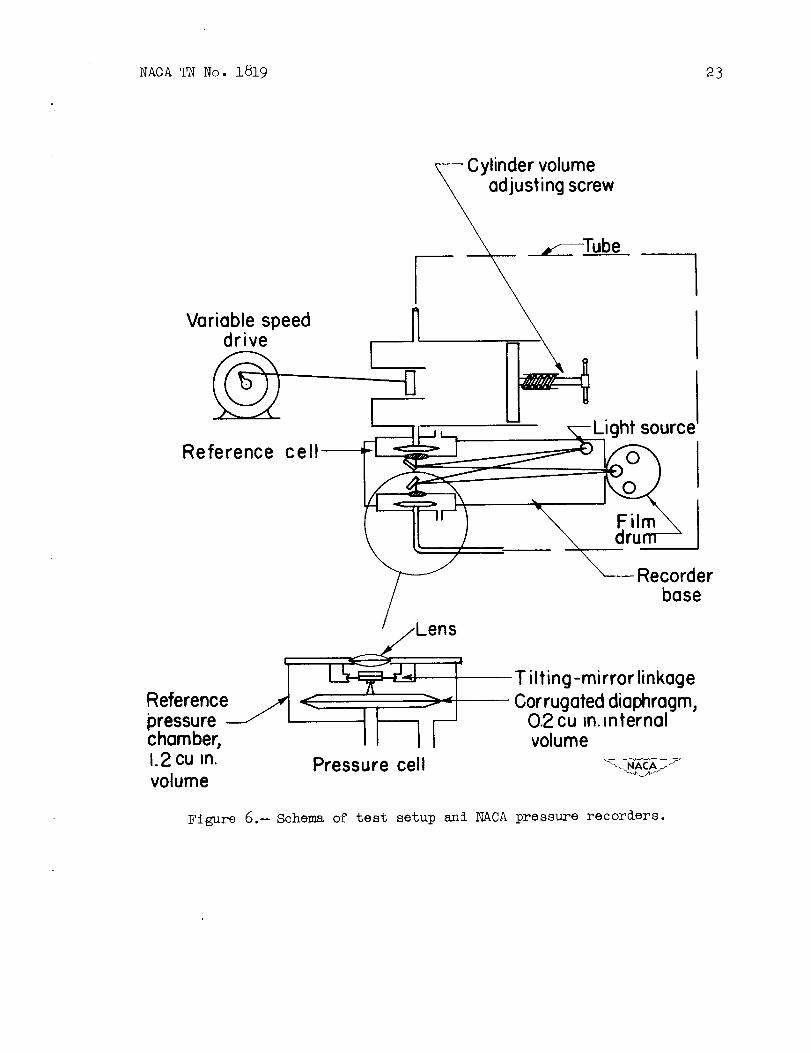
A schemaof the test setup is given in figure 6. The pressuresource used in these tests consisted of a piston, driven by a variable-speed electric motor, in a cylinder surrounded by a clearance volume.Adjustment of pressure amplitude was achieved by varying the clearancevolume or altering the stroke of the crank and connectlng-rod mechanismdriving the piston. Directly connected to the cylinder was a standardNACAmechanlcal-optical pressure recorder, which was used as a pressurestandard. This instrument consists of a corrugated diaphragm assemblyhaving an internal volume of 0.2 cubic inch surrounded by a referencevolume of approximately 1.2 cubic inches. Deflections of the diaphragmare converted by meansof a bell-crank tilting-mlrror llnkageintodeflections of a record line on a photographic film. The naturalfrequency of this instrument was sufficiently hlgh to reguire no correc-tions for its response. Another connection from the pressure generatorled to the pressure system under test. The pressure systems testedconsisted of various lengths of neoprene pressure tubing varying in
frGn_-Inch to_-pinch inside diameter wlth connected restrictionsdiameterO ±O

12 NACA TN No. 1819
and volumes. The pressure generator supplied oscillating pressure ampli-
tudes up to + I0 inches of w_ter at frequencies ranging from 0 to
70 cycles per second. Records of the generated pressure as determined by
the reference-pressure cell, pressures existing in the test instrument,
and ---1-second timing marks were all recorded on the same film. The testsi0
were made in the Flight Instrument Development Section of the LangleyInstrument Research Division.
Results of Amplitude Response Tests
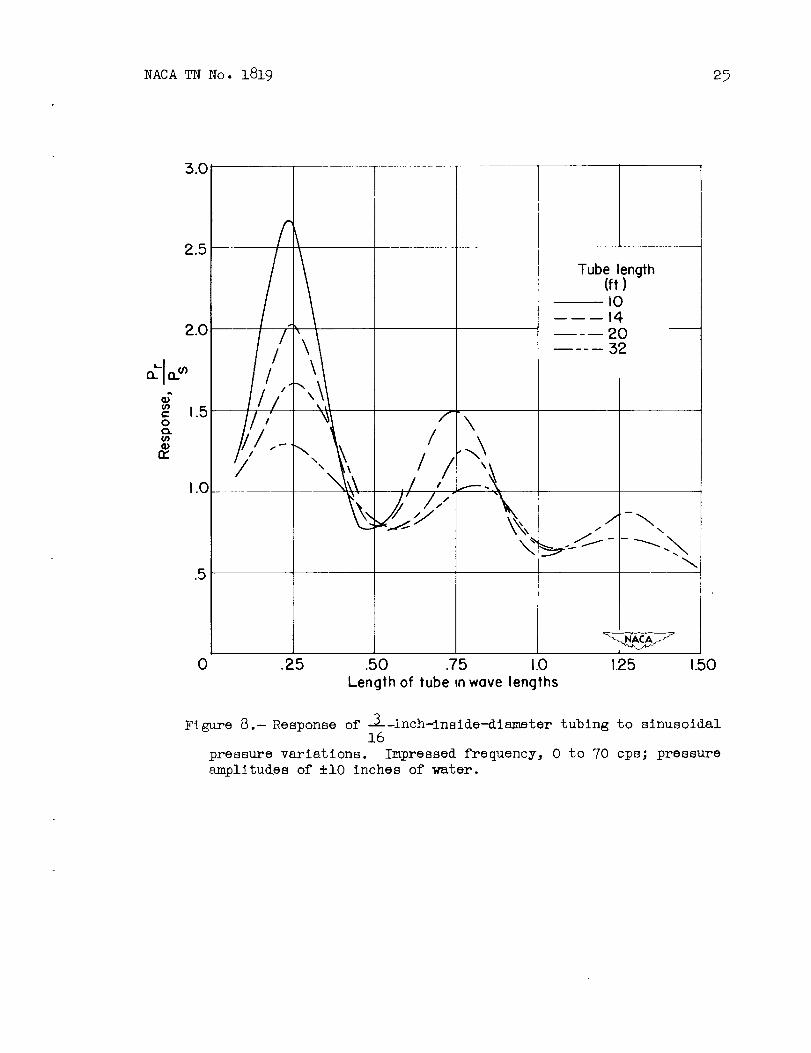
Simple tube system with negligible instrument volume.- Figures 7
and 8 summarize the results of tests made with _:-inch andS-inch-inside-
diameter tubes with applied pressure amplitudes of Z i0 inches of water.
The length of tube, given in wave lengths, is calculated from the
velocity of propagation as given in figure 6 and the relation a/f equals
w_ve length. In figure 7 the response of systems using _-Inch-inslde-8
diameter tubing is seen to be such that large attenuation of pressure
amplitude occurs in the main portion of the frequency range up to 70 cycles
per second. Figure 8 indicates that the attenuation in T-_g-inch-inslde-
diameter tubes is snmll enough so that, with suitable damping of the
resonance peaks, the response through a largefrequency range can be
made to approximate unity. Tests made on other tube lengths not shown
in these figures fair in well with the plotted cu_<c_.
Based upon figures 7 and 8 and equation (8), the attenuation
constant _ was determ_led for both tube diameters. The attenuation
constant was found to vary with the square root of the applied frequency.
Values of the attenuation factor A are plotted in fdgure 9. The
value of A as calculated from equation (8) is apparently not constant
for the shorter tube lengths_ however, this effect is actually caused
by the finite volume of the pressure capsule. The values of A.
asymptotically approach their true value for the longer tubes since the
attenuation in the tube becomes the determining fac±or in the over-all
response. The values of _ thus determined are as follows:
For _-inch-lnslde-diameter tubes,
= 0.014_
For l_-inch-inside-dlameter tubes,
= 0.0065r_-
NACA TN No. 1819 13
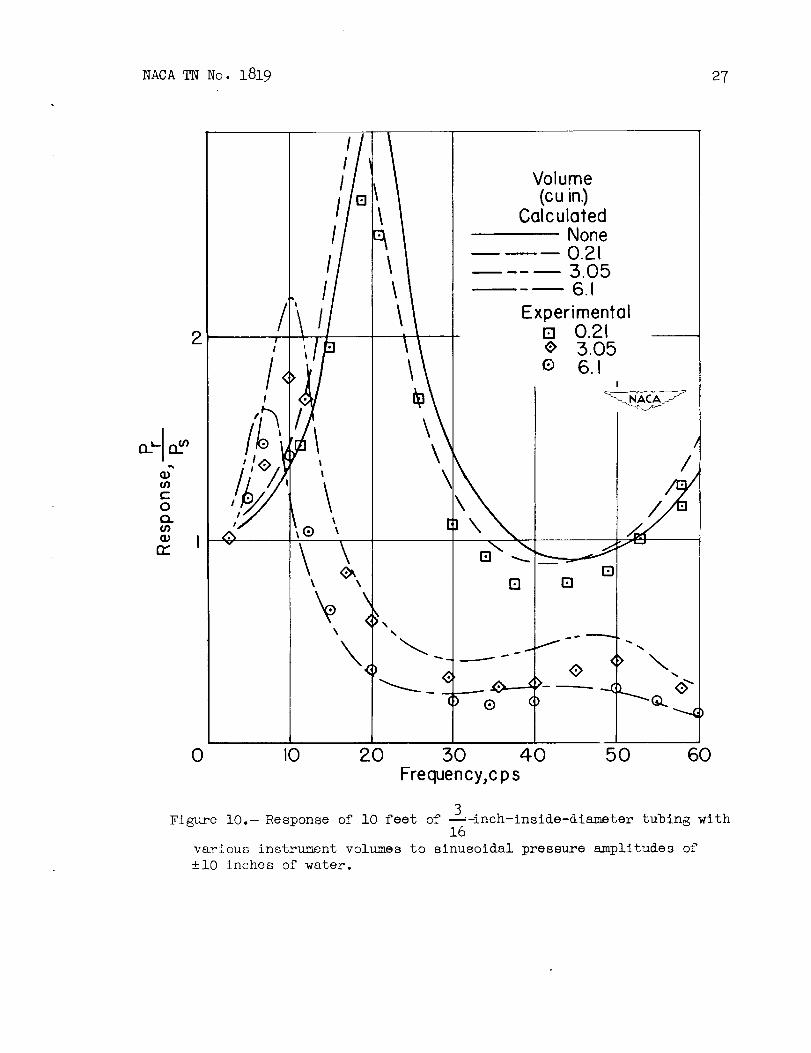
The curves of figures I0 and ii have been calculated on the basis
of the attenuation factor for the _-Inch-lnslde-dlameter tube. The
variation between the calculated response curves for zero instrument
volume and for 0.21 cubic inch instrument volume shows the effect of
the volume of the instrument used (fig. lO). The experimental pointsfor the lO-foot tube with an instrument volume of O._l cubic Inch
approximate a theoretical curve for a lO-foot tube wlth no volume
attached which has an attenuation constant equal to O.O1. The comparison
shown In figure lO between these experimental points and the theoretical
curve for zero volume indicates that except at resonance frequencies a
relatively large variation In the attenuation factor causes only minor
changes In the general characteristics of the response c_ve.
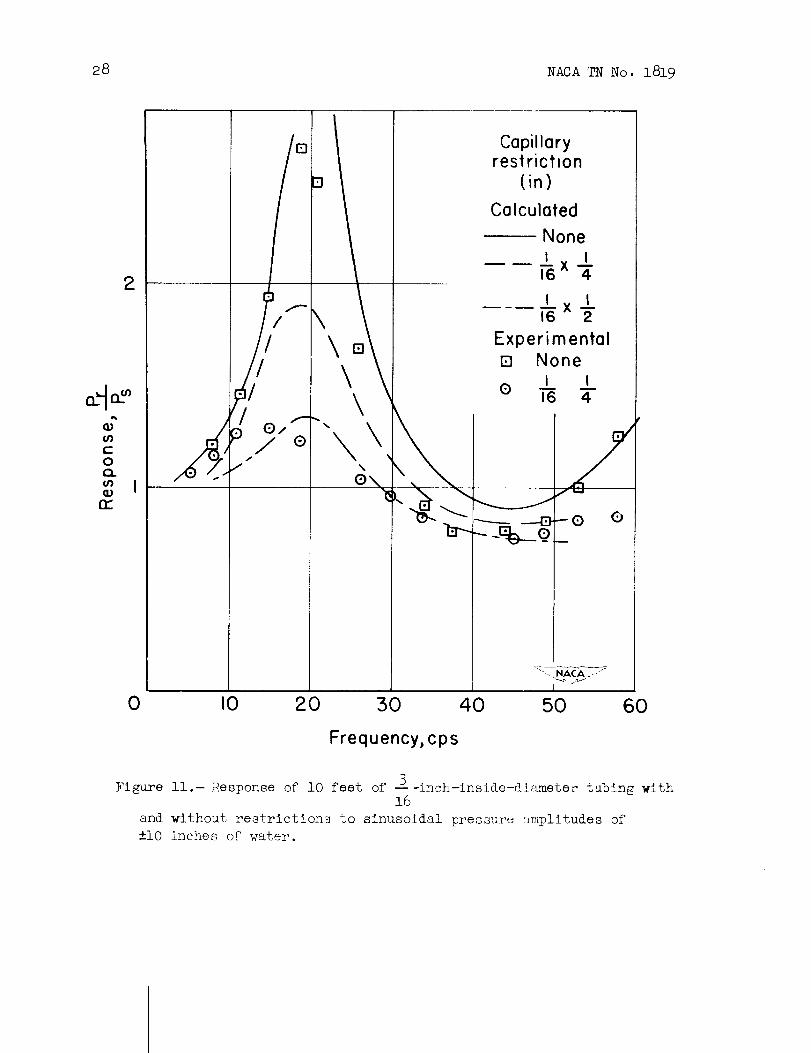
Tube wlth inlet restriction.-Figure ll illustrates the correlation
between the calculated response curves and the experimental data ±'or a
10-foot tube wlth and without an inlet restriction subjected to
pressure amplitudes of + lO inches of water. The damping restriction,
as previously indicated, is placed at the open tube end. The main effect
of the damper at resonance frequencies and the almost negligible effect
at antlresonance frequencies should be noted on these curves. Inasmuch as
the experimental data for a _6-inch-inside-dlameter, ¼-inch-long connector
seem to correspond more exactly to the calculated values for a connector
of twice this length, the losses in this connector can be assumed to be
larger than those predicted by equation (13). These added losses are
attributed to the inlet and exit losses of the connector and to the fact
that steady laminar flow does not exist in the connector.
Tube wlth appreciable instrument volume.- Figure i0 also indicates
the response to sinusoldal pressure amplitudes of ± i0 inches of water
of a 10-foot length of _-Inch-lnside-diameter tubing with volumes
of 3.05 cubic inches and 6.1 cubic inches added adjacent to the recording
instrument. The correlation between calculated and experimental curves
indicates that although a high percentage accuracy has not been
achieved, good agreement exists insofar as response-curve shape and
attenuation characteristics are concerned. The effect of increasing
the recording instrument volume is seen to be a lowering of the
resonant frequency of the system and a decrease in amplitude of the
recorded pressures throughout most of the frequency range.
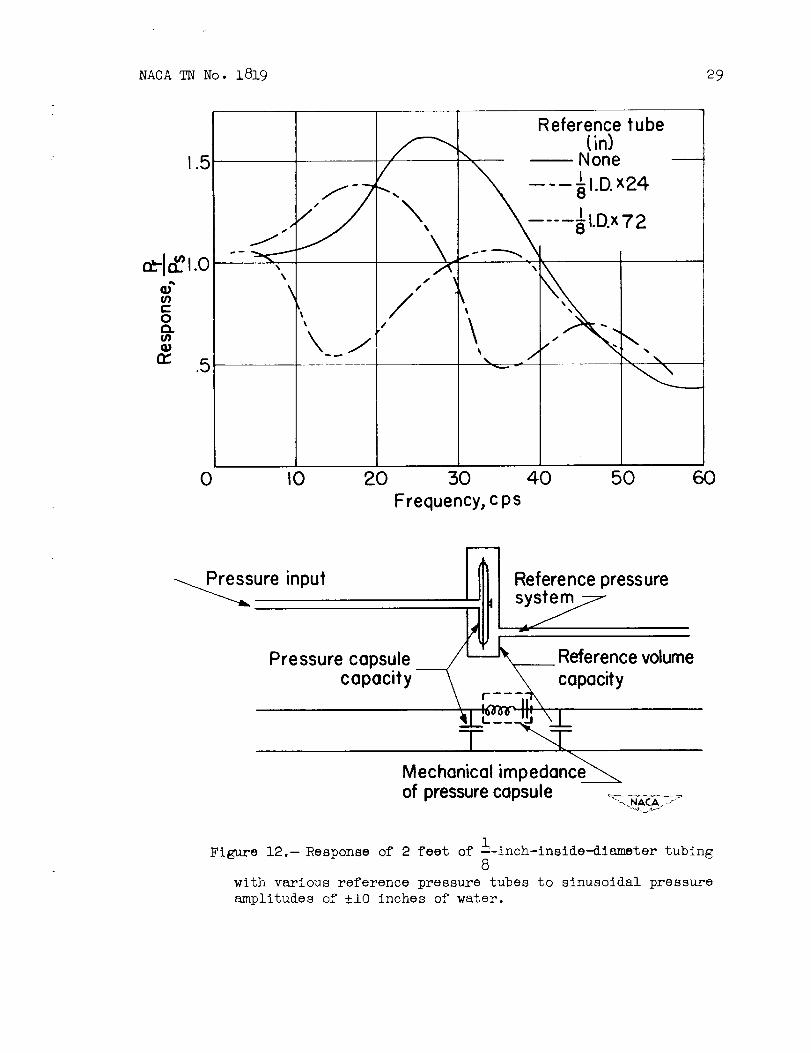
Effect of some reference pressure systems on the response character-
istlcs of a pressure system.- When pressure recorders are connected to
both a pressure measuring system and a reference pressure system, appreci-
able interaction and energy transfer may occur, which can alter signlfi-
cantly the response of the entire system. The calculation of the
response of such systems is considered inadvisable since It is necessarily
tedious and the accuracy is questionable. Figure 12 is included as
representative of the interactions which occurred with the c_pst,2e

14 NACATN No. 1819
employed in these tests in a test setup designed so that the interactionwas very pronounced. Thc variations in the respor_c curves are typicalof coupled systems which maybe encountered in prsctice. The equivalentpressure and electrical systems are schematically shownin the samefigure. It should be noted that these effects maybe decreased oreliminated by enlarging the reference volume surroundh_g the measuringelement so that its equD_a!ent electrical capacity becomesextremelylarge and approaches a short circuit.
Results of PhaserShift Determination
Figure 13 illustrates the correlation between cslculated and experi-
mental lag curves for i0 feet of_-Inch-inside-diameter tubing with
various added volumes. The response curves of fi_<_urei0 show that thefollowing general characteristics are commonto the lag curves of figure 13:
(i) The phase angle shifts relatively slowly until a resonancefrequency is reached, at which time the phase changes rapidly through 90° .
(2) The lag remains almost constant at approximately 180° fromfrequencies above resonance through the first antlresonance frequencyand then increases to larger values.
(3) The rate of change of lag angle with increasing frequency becomesmore and more linear as the magnitude of the amplitude response atresonance becomessmaller and smaller.
SampleCalculation
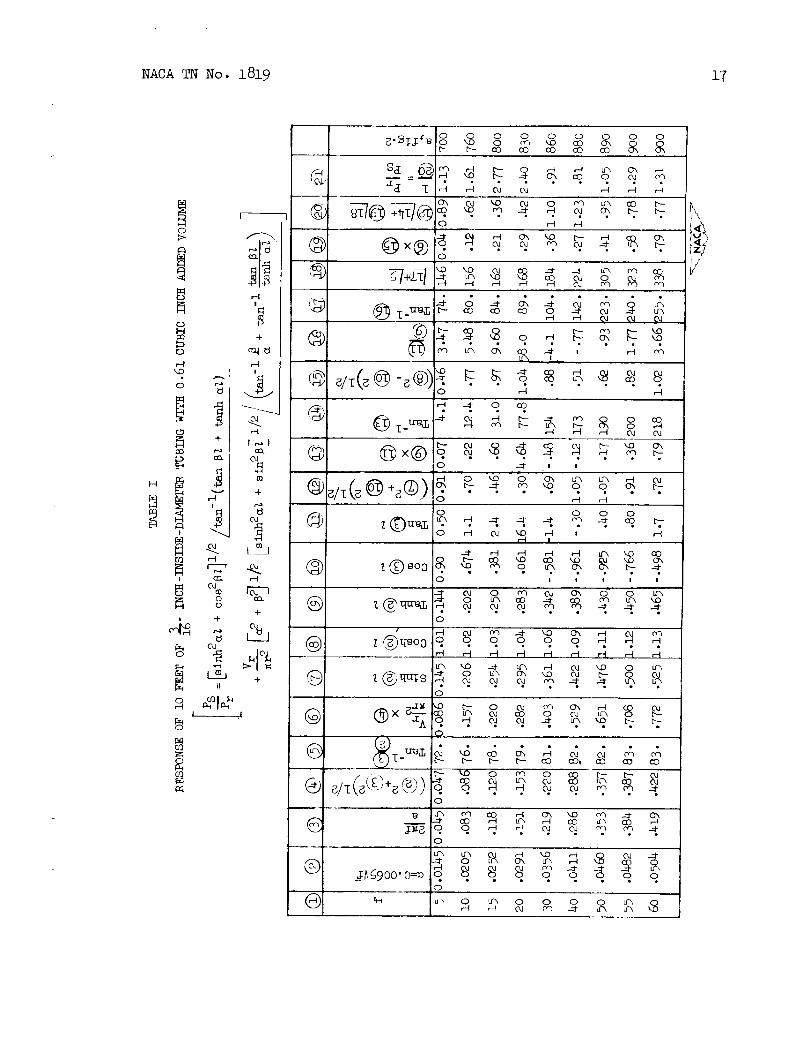
Equation (20) has been presented in such form thst the response andlag maybe arithmetically calculated. Table 1 indicates the calculations
necessary for the determination of the response of l0 feet of l-_-inch-inside-diameter tubing with an added volume of 0.61 cubic inch. Allcomputations are arithmetic except that for column Q , which maybedone graphically with little labor. The determination of the responsefor various other added volumes can be easily madeby recalculatingc ©, @, © only.
CONCLUSIONS
A method has been developed for estimating the d_amlc response of
pressure systems subjected to steady-state oscillating pressures which
can be applied to the design of these systems either to secure good
response over a desired frequency range or to eliminate unwanted
NACATN No. 1819 19
resonances whenonly a meanpressure level is desired. Although nomethod of predicting the attenuation constant of various tubing under
all pressure conditions has been presented, this attenuation constant
may be determined experimentally in a simple tube system and used for
the design of other more complicated systems.
Even in long tubes of small diameter (that is, 20 ft of 1-_-In.-I.D.
tubes), resonances can occur which cannot be ignored in the interpreta-
tion of recorded data. The resonance frequency range for tubes of
approximately this length is the frequency range in which airplane
buffeting may occur and airplanes passing through contiguous atmospheric
gusts may also be subjected to pressure cycles in this rsnge. The
direct interpretation of such recorded data without reference to the
effect of the recording system will lead to erroneous results.
It can be concluded from the material presented that for accurate
dynamic-pressure measurements the first resonant frequency of the
pressure-measurement system should be kept well above the highest
pressure frequency to be measured. This result can usually be accom-
plished only by installing the pressure sensing element as close to the
point of measurement as possible. When such installation is not feasible,
the principles presented in this paper should be applied to the design
of an appropriate pressure system. The errors inherent in such a method
should be mitigated whenever possible by a direct calibration under
conditions of use.
Langley Aeronautical Laboratory
National Advisory Committee for Aeronautics
Langley Air Force Base, Va., January 7, 1949
16 NACATN No. 1819
REFERENCES
i. Mason, Warren P. : Electromechanical Transducers azLdWaveFilters.D. Van Nostrand Co., Inc., 1942, pp. 106-118.
2. Rayleigh, (Lord): The Theory of Sound. Seconded., vol. II, Macmillan& Co., Ltd. (London), 1896. (Reprinted 1929.)
3. Everltt, William Littell: CommunicationEngineering. McGraw-HillBook Co., Inc., 1937, pp. 94-177.
4. 01son_ Harry F.: Dynamical Analogies. D. Van Nostrand Co., Inc.,1943.
5. Crandall_ Irving B. : Theory of Vibrating Systems snudSound. D. VanNostrand Co., Inc., 1926, appendix A.
6. Binder, R. C.:in a Pipe.pp. 41-43.
The Dampingof Large Amplitude Vib1_tions of FluidJour. Acous. Soc. Am., vol. 15, no. i, July 1943,
NACATN No. 1819 17
I_ 0 0 0 0_'_r;'_ o °o o o co o_ A_- b- CO O0 CO GO CO
"zcI I _ H 0_ 04 _ _

18 NACA TN No. 1819
O
3
2
0 34 2 4
--oc=O
(NolossesDntube)
oc=AV#-(Finile
losses)
360
•"o 270
180
o 90e-13_
Figure
0
J
f
f/
J...---
I
3
4 2 4
Tube length, wave lengths
i.-Response and phase shift in system having ne_l_glble instrument
volume.

NACA TN No. 1819 19
6
5
4
3
2
0
_. 360
•,- 270r-¢,/)
a_ 1800
a_ 9O
I 1
/1' ///
5
4 2 z
//"
m _
I
0 3_4 2 4
Tube length, wave lengths
Zd ---0Zo
Zd =0.2Zo
Zd = 0.5Z
0
Figure 2.-- Response and phase shift in system with various inlet restric-
tions. _ = O.

20 NACA TN No. 1819
5
EOQ.
4
II
iI• I
3 ItI I
2 l
i \\
0
I\, J
IIl-
,i
\\
4 2 4
Vr
7Tr2Z=0-2
V r=2.0
-/T r2_
360
-,--" 270
_ 18o(/)
t--a_ 9O
0
I
J i
5.z 2 4
Tube length, wave lengths
Figure 3.--Response _-'_t phase shift in systems wlth v_!oms instrument
volumes. _ = 0.
NACATiNNo. 1819 21
O
/o_
,_ouenb_Jj ;u0u0seEJ
0_o
0uO
00_1
0
U'3
0
c;II
4._
0b-
.p
4-_
°r--t
4_
0
0
qO%
4._
gffJ
©
I
©
-r-t

22 NACA TN No. 1819
°_
o
>
I000
900
8OO
700
60O
5OO
//
//,
///
t
/j
/
Diam.
(in.)1
4
316
!8
332
4OO0 20 40 60 80 I00 120
Frequency, cps
Figure 5.- Velocity of propagation in tube based on Rayleigh formula and
free-_ir velocity of i000 feet per second.
NACATN No. 1819 23
Variable speeddrive
Reference cell
Reference__ /
pressure __-_chamber,1.2cu =n.volume
_-- Cylinder volume
odjusting screw
f _ ___ _Tube
, n I
\
__,,_L_n _ _---- Re_°rdeer
--_P_' _.I' _'o';:ug_,e;';:";,"2¢e,0.2cu re.internalvolume
Pressure cell __
Figure 6.-- Schema of test setup anl NACA pressure recorders.

24 NACAT_ No. 1819
2
O
¢/)
aS
i \
\\
\
0 .25
\\
.50 .75 .0
Length of tube in wove lengths
Tube length(ft)
I0
1652
JI. 2 5 1.50
Figure 7.-- Response of _-inch-inside-diameter uubing to sinusoidal8
press_re variations. Impressed frequency, ()to 70 cps; pressure
amplitudes of ±I0 _nches of water.
NACATNNo. 1819 25
50
.5
\
/ /
"/ ' "_'_X,,,II /1 /
cY
,,,,:
Tube length(ft)
1 tO142052
/
_.Jj--\
0 .25 .50 .75 1.0 1.25 1.50
Length of tube ,n wave lengths
Figure 8.- Response of 3-inch-inside-diameter tubing to sinusoidal16
pressure variations. Impressed frequency, 0 to 70 cps; pressure
amplitudes of ±lO inches of water.

26 NACA TN No. 1819
/
D ®
.D
()
()
Lood
fTt ,_ O_J (kJ
ro oJ 50 0 0
I.o
0
c-
m
I--
-,-I0B"J
0.+_
0
,.Q
4-_
%©
5'®
,.r-t
,r...tI
0
°r-_I
r-"tlCO
I
0
%0
r_0
4-_0
0
©
I
0",
%
.c-tr_
0
®
0
0
+1
0
©
H
q_%
V 'JO.l_)O)l uo!,l.DnUa.l.l_
NACA TN No. 1819 27
c-
O
_K
2 /!
!
/,I
I
i!
I
"!,i|
\\o,
\ \
<\
\,
\
Volume(cu in.)
CalculatedNone0.213.056.1
Experimental[] 0.21e 3.05
G 6.1,
/
() ® (
E3[] Q
f
<
,>- ---__._ ...()
,> \
0 I0 20 30 40 50 60Frequency, c p s
3Figure i0.- Response of I0 feet of -U_nch-inside-diameter tubing with
16
various instrument volumes to sinusoidal pressure amplitudes of
±lO inches of water.
28 NACATNNo. 1819
2
c-o
Capillaryrestriction
(in)
Calculated
NoneI I
16 x "_"
___ l_x ±16 2
ExperimentalE] None
I I0 --
16 4
I
0 I0 20 30 40 50 60
Frequency, cps
Figure ii.- Response of i0 feet of -_-inch-inside-di_meter tubing with16
and without restrictions to sinusoldal pressur_ _r_litudes of
±lO inches of water.
NACATN No. 1819 29
15
EO
QZ 5
J
\
\
\_J
f
//
Reference tube
\
(in)None
I I.D.x248
I l.Dx728 "
0 I0 2O 3O 4O 50
Frequency, c ps
6O
_._sure input _ ] Reference pressure/ system_
Pressure capsule ___//L_ _ Reference volumecapacity _ capacity
Mechanical impedance_of pressurecapsule
_NA£Aj _
1Figure 12.--Response of 2 feet of Z-inch-inside-diameter tubing
8
with various reference pressure tubes to sinusoidal pressure
amplitudes of +lO inches of water.

30 NACATN No. 1819
360
270
"O
_ 1800')
13..
9O
Volume(cu in.)
ColculGted-00.216.1
Experimentale 0.21[] 6.1
[]
o j
I
//"
o
cP
Ji
J/
[]
/
(3
1
0 I0 20 30 40 50 60
Frequency, c ps
Figure 13.--Lag curves for i0 feet of -_3-inch-inslde-diameter tubing16
with various instrument volumes subjected to slnusoidal pressure
amplitudes of +I0 inches of water.