coal seam gas water from maramarua, new zealand ...eprints.qut.edu.au/38133/1/jhnz_mtaulis.pdf ·...
TRANSCRIPT

1
Coal Seam Gas water from Maramarua, New
Zealand: Characterisation and Comparison to US
Analogues
MAURICIO TAULIS 1
, MARK MILKE 2
1 Department of Civil Engineering, University of Canterbury, Private Bag 4800,
Christchurch, NEW ZEALAND. Email: [email protected], tel.: +64 3 3642987 ext
7332, fax: +64 3 3642758 2 Department of Civil Engineering, University of Canterbury, Private Bag 4800,
Christchurch, NEW ZEALAND
2
Abstract
Groundwater from Maramarua has been identified as coal seam gas (CSG) water
by studying its composition, and comparing it against the geochemical signature from
other CSG basins. CSG is natural gas which has been produced through thermogenic and
biogenic processes in underground coal seams; CSG extraction requires the abstraction of
significant amounts of CSG water. To date, no international literature has described coal
seam gas water in New Zealand, however recent CSG exploration work has resulted in
CSG water quality data from a coal seam in Maramarua, NZ. Water quality from this site
closely follows the geochemical signature associated with US CSG waters, and this has
helped to characterise the type of water being abstracted. CSG water from this part of
Maramarua has low calcium, magnesium, and sulphate concentrations but high sodium
(334 mg/l), chloride (146 mg/l) and bicarbonate (435 mg/l) concentrations. In addition,
this water has high pH (7.8) and alkalinity (360 mg/l as CaCO3) which is a direct
consequence of the carbonate dissolution and biogenic processes. Different analyte ratios
(rock source deduction) have helped to identify the different formation processes
responsible in shaping Maramarua CSG water.
Number of words: 188
Keywords: Coal seam gas (CSG), coalbed methane (CBM), coal bed natural gas
(CBNG), groundwater, New Zealand.
3
Introduction
Coal seam gas (CSG) is mainly methane gas sorbed (absorbed and adsorbed) in
underground coal beds. This same gas is known in the United States as coalbed methane
(CBM) or coalbed natural gas (CBNG). In the U.S. this gas has been extracted
commercially since the 1980’s, but in New Zealand the CSG potential is still being
explored. The procedure for mining this gas involves drilling a hole that directly targets
one or more coal seams and pumping out groundwater in order to recover methane gas.
This gas is generated in the coal through biogenic and thermogenic processes, and is
sorbed into the coal’s micropores; it will remain in the micropores as long as there is
enough aquifer pressure. When the aquifer pressure is lowered by artificial means (e.g.
pumping water out of the coal aquifer), methane gas is released from the micropores,
thereby flowing out of the well. However to achieve this, large quantities of groundwater
have to be pumped out to the surface. These waters, known in New Zealand as CSG
waters, have a specific chemical signature which may generate particular environmental
problems. For example, CSG water generally exhibits a substantial dissolved salt content
and relatively elevated sodium, low calcium, and low magnesium concentrations. When
used for irrigation, water having a high dissolved salts content may reduce water
availability to crops, thus affecting crop yield (Ayers et al., 1985). In addition, the high
sodium, low calcium and low magnesium concentrations present the potential to disperse
soils and can significantly reduce the water infiltration rate (Ayers et al., 1985).
Therefore, CSG waters need to be properly characterised, managed, treated, and disposed
to safeguard the environment without compromising other natural resources. This paper
presents the water quality from a CSG exploration well in Maramarua, New Zealand.
The Maramarua CSG water is studied and compared against the CSG
geochemical signature and against known data from basins in the U.S. The comparison
will advance hydrogeologists’ general understanding of the composition of CSG waters.
The correct characterisation of CSG waters is useful for both resource identification and
impact assessment. At an exploratory level, CSG waters can provide insight into aquifer
processes and CSG production potential, while at the production level, knowing the type

4
of water being abstracted is essential to prevent future environmental problems arising
from CSG production operations.
Genesis and chemistry of CSG waters
In most CSG producing basins, coal seams act as regional aquifers confined by
nearly impermeable units (mudstones or shales). Coal seam gas-bearing aquifers have a
specific water chemistry that relates to specific biogeophysical and geochemical
processes. Underground, coal seams are interbeded with other geological units
(mudstones, shales, or clays), and the arrangement and characteristics of these adjoining
units define the geochemical processes affecting the chemical composition of CSG
waters. The physical processes relate to depth of burial, potential uplift, possible erosion,
and mixing of waters from other units. Although many processes will operate to produce
a particular CSG water quality, a few processes predominate and merit emphasis.
Process 1: Biogenic and thermogenic production of methane
and carbon dioxide.
Coal seam gas is formed through the anaerobic biodegradation of organic matter
and by thermogenic processes of high temperature and pressure. Initially, plant detritus is
deposited and buried by the deposition of sediments of marine or terrestrial origin. This
organic matter is first decomposed by aerobic respiration; however, as the burial process
continues and oxygen is depleted, the biodegradation process turns from aerobic
respiration to fermentation and methanogenesis. In this process, acetogenic, hydrolytic
and fermentative bacteria produce simple organic compounds that methanogenic bacteria
then convert into carbon dioxide and methane (Kjeldsen et al., 2002). Processes 2 and 5
(presented subsequently) further explain the carbon dioxide accumulation process. As the
interring process continues, thermogenesis becomes more important. Higher temperatures
and pressures result in increasing coalification and the production of water, carbon
dioxide, and methane as by-products of this process (Stach, 1982).
In essence, whether the processes involved are biogenic or thermogenic depends
on the depth of burial. The deeper the depth of burial of the coal seam, the higher the
5
temperatures and pressures acting on it. Deeply buried coal seams may have temperatures
above the limit at which methanogenic bacteria are able to survive. Generally,
thermogenic methane generation is related to high rank coals, while biogenic methane
formation is associated with lower rank, sub-bituminous or lignite coals. However, both
processes can occur at different stages within the coal seam and can even overlap over
time.
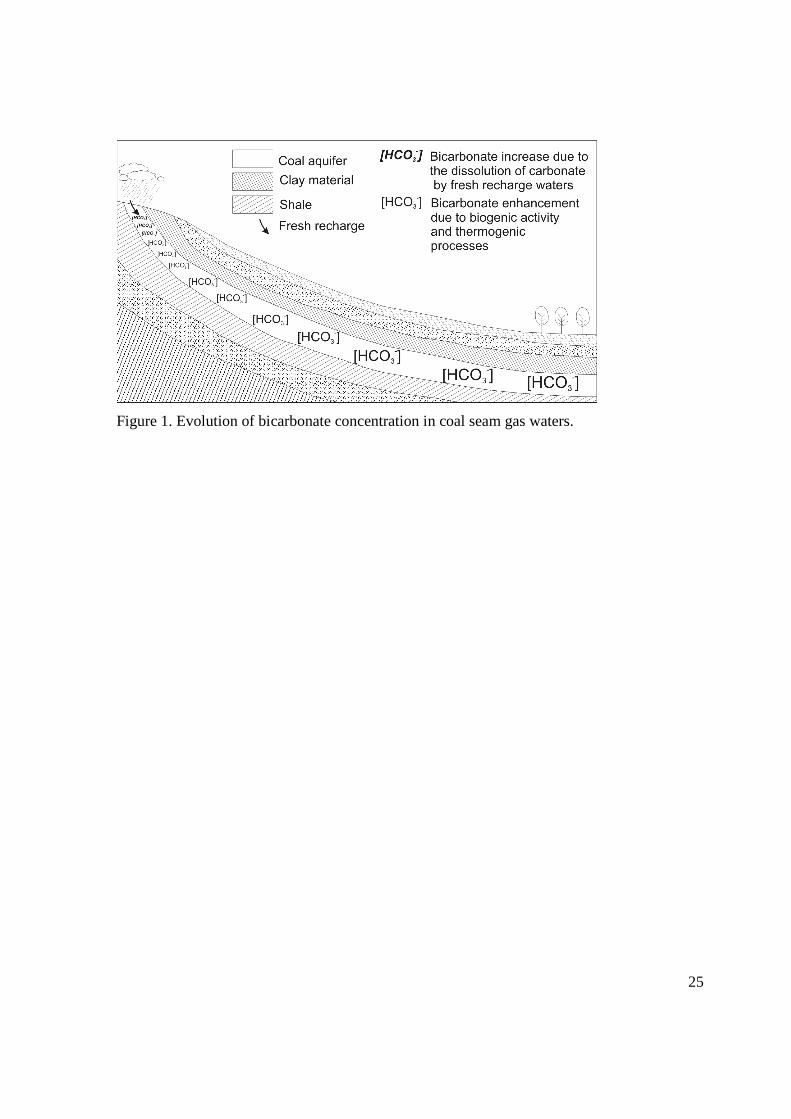
Process 2: Accumulation of high bicarbonate concentrations.
Water confined within coal seams always has a high bicarbonate (HCO3-) content, which
can be accounted for by two processes in the aquifer. The first of these processes is the
dissolution of carbonate by recharge waters (Freeze and Cherry, 1979). The second and
primary process accounting for high HCO3- content in CSG aquifers is Process 1. The
biologic and thermogenic production of methane result in large quantities of carbon
dioxide gas. Even biological processes that do not produce methane, such as sulphate
reduction (see Process 5), will produce carbon dioxide. As the pressure of carbon dioxide
gas increases, the concentration of dissolved carbon dioxide increases, and the
concentration of bicarbonate ion increases.
The concentrations of HCO3- in the aquifer will follow the speciation rules for a
closed aqueous carbonate system. The possible species available are CO32-, CO2 (aq),
H2CO3, and HCO3-. However, the pH for CSG waters typically falls between 6.3 and
10.3 and, in this range of values, HCO3- will be the dominant species according to
carbonate chemistry (Decker et al., 1987). Also, high pressure develops in the aquifer
with increasing depth, and this keeps inorganic carbon in the HCO3- form along with
dissolved CO2 (aq). Fig. 1 shows the evolution of recharge waters and their gradual
increase in bicarbonate as these enter and flow through the coal aquifer.
Process 3: Dissolution of Minerals
As fresh water seeps through recharge areas and flows through the coal aquifer, it
encounters different minerals along its path of flow. One important and common class of
minerals is plagioclase feldspar, which can dissolve with recharge water and increase Na+
concentrations (Lee, 1981). Fig. 2 shows the evolution of recharge waters as these enter

6
the aquifer and dissolve plagioclase feldspars. When these feldspars are of marine origin
(albite for example), chloride concentrations can also increase with mineral dissolution.
As indicated in Process 2, carbonate minerals will also dissolve with fresh recharge
waters. Dissolution of sulphate minerals can also occur, but because of other active
processes in CSG water formation (see Process 5), their effect on CSG waters is often
small.
Process 4: Calcium and Magnesium depletion plus Sodium
enhancement.
Van Voast (2003) has identified high HCO3- concentrations as the main cause for
low Ca2+ and Mg2+ concentrations in CSG waters. This is because the solubility of Ca2+
and Mg2+ decreases with high bicarbonate concentrations, which causes precipitation of
calcite (CaCO3) and dolomite (CaMg(CO3)2) in the aquifer. Another source of calcium
and magnesium depletion is given by the process of ion exchange. In coal aquifers,
groundwater may encounter clays or shales in adjoining units or in lenses or pockets as it
flows through the coal seam. As a result, an ion exchange process takes place between
these minerals and the water. In this process, Ca2+ and Mg2+ are held more tightly than
Na+ in clays. Therefore, the outcome of this exchange is a soft groundwater (low Ca2+
and Mg2+) with an enhanced Na+ concentration. This process has been used to explain the
high Na+ and low Ca2+ and Mg2+ concentrations in CSG waters from the Powder River
Basin (Bartos et al., 2002).
Studies by Hagmaier (1971), Lee (1981), and Hamilton (1970) suggest that this
process is more pronounced with increasing depth and away from sources of recharge.
Therefore, as aquifer water flows into deeper parts of the basin, calcium and magnesium
concentrations gradually decrease due to the exchange of ions with clays. The same
inversely holds true for sodium concentrations which would increase further with
increasing aquifer depth (Fig. 2).

7
Process 5: Sulphate reduction.
Sulphate (SO42-) is originally present in organic matter undergoing coalification.
In coal aquifers, sulphate originally increases when fresh recharge water encounters and
dissolves sulphate minerals (CaSO4, gypsum and anhydrite) along the path of flow, or
through the weathering and oxidation of pyrite and marcasite (FeS2) (Bartos et al., 2002),
which also results in trace amounts of iron present in aquifer waters. In addition, sulphate
is present in sea spray (Rosen, 2001), which deposits on recharge areas and finds its way
into the aquifer.
After oxygen has been consumed, biological anaerobic respiration occurs, and
sulphate reduction becomes the dominant form of respiration, especially in depositions of
marine association where large concentrations of sulphate are available (Rice, 1993).
Important by-products of the sulphate reduction process are carbon dioxide, hydrogen
sulphide (H2S), sulphide (HS-), and water. Carbon dioxide can remain in that form or can
later get converted into methane by methanogenic bacteria, while the sulphides will
precipitate out as black iron sulphides (Decker et al., 1987). Depending on the
methanogenic species present in the aquifer, methane generation can take place
simultaneously with the sulphate reduction process (Oremland et al., 1982). However,
methane generation is minimal at high sulphate concentrations.
With thermogenesis, sulphate concentrations can also decrease because
coalification is basically “metamorphism by pressure and heat of burial” (Van Voast,
2003). In this way, high temperatures and pressures initiate a devolatilization process
which results in sulphate reduction with hydrogen sulphide as a by-product . Therefore,
whether biogenic or thermogenic, CSG waters exhibit very low sulphate concentrations
as seen on Fig. 3. Van Voast (2003) has presented an upper limit of 10 meq/l (~500 mg/l)
for sulphate concentrations in co-produced water from methane-producing wells in the
U.S. The 10 meq/l upper limit was selected by Van Voast (2003) because this
concentration corresponds to the sulphate concentration of CSG waters which are not
associated with the production of methane.

8
CSG and CSG waters in the US
Coal seam gas production proliferated in the 1980’s when tax incentives were put
in place to boost exploration of alternative energy sources (ALL-Consulting, 2003).
Since then CSG has been extracted throughout different basins across the U.S., and today
the most important ones are the San Juan Basin (CO and NM), Uinta and Piceance (UT
and CO), Black Warrior Basin (AL), Raton (CO and NM), and the Powder River Basin
(MT and WY). Some of these basins produce more than 8000 thousand cubic meters
(TCM) of CSG per day. For example, in 2002 the Black Warrior Basin produced 8996
TCM per day (Alabama State Oil and Gas Board (AOGB), 2003), while in the year 2000
the San Juan Basin produced 60519 TCM per day (ALL-Consulting and Montana Board
of Oil and Gas Conservation, 2004).
In all of these basins, CSG production takes place with the co-production of CSG
water. These waters tend to be alkaline with medium to high TDS, and are generally high
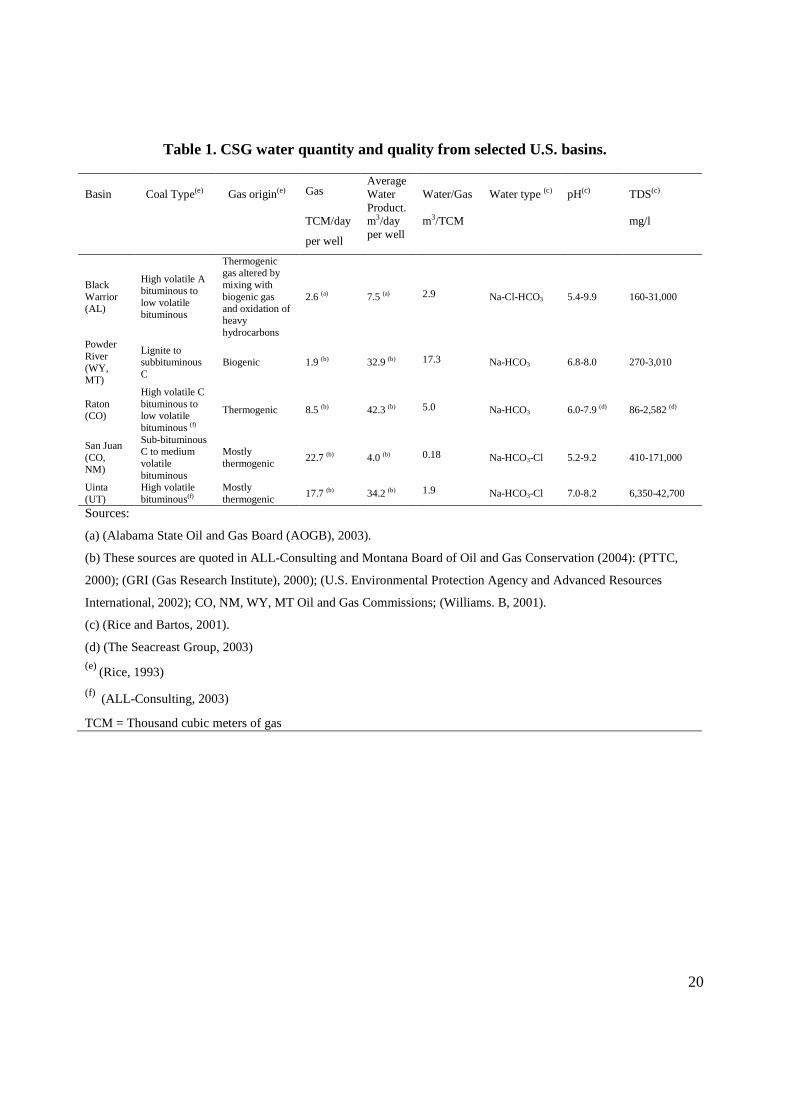
in sodium, bicarbonate, and sometimes chloride. Table 1 presents different CSG
producing basins in the U.S. and their different characteristics in terms of water and gas
production. The quantities of produced water vary greatly from basin to basin (Table 1)
depending on the geological characteristics and type of production operation. Whether
the coal is low or high in rank, or whether the CSG is thermogenic or biogenic, the
produced waters exhibit similar chemical characteristics. Van Voast (2003) presented
typical water quality data from different U.S. basins and compared their chemical
concentrations using Schoeller diagrams. In all of these instances Van Voast (2003)
found the same chemical signature: high-bicarbonate, high-sodium, low-calcium, low-
magnesium, low-sulphate, and sometimes high chloride. Concentrations would vary
across different basins and within each basin, but the overall relationship was maintained.
This is not unexpected and is explained by processes 1-5 (see previous section) which
result in groundwater having the same chemical characteristics; the use of Schoeller
diagrams is a useful exploratory tool because it allows for the comparison of different
produced waters. This is useful for the correct identification of CSG waters and for
evaluating the potential for methane production in wells.

9
CSG exploration in New Zealand
New Zealand has been following the developments of coalbed methane (coal
seam gas) in the U.S. with keen interest. Up to 1990 there was a general belief in New
Zealand that CSG could only be minable if it was a consequence of the thermogenic
processes in bituminous (high-rank) coals (Johnson, 2004). However, in the 1990’s
developments in the U.S. Powder River Basin (PRB) proved that commercial quantities
of CSG could be recovered from low-rank coals (Johnson, 2004). A large portion of New
Zealand coals present some of the same characteristics as those found in the Powder
River Basin (Moore, 2002). For example, most New Zealand coals and PRB coals are
low in rank (lignite or subbituminous) and both deposits tend to be thicker than 20m
(Montgomery, 1999; Moore and Shearer, 2003). Therefore, New Zealand coals hold
significant potential for CSG development and extraction. Many companies seized this
opportunity, and since the 1990’s have obtained exploration licenses. Consequently, the
CSG water disposal issue has been acknowledged by these companies for the successful
development of CSG projects in New Zealand. In 2004 and 2005, Kenham Holdings Ltd.,
with the aid of L&M Mining Ltd. and CRL Energy Ltd., has collected CSG water
samples from an exploration well in Maramarua, New Zealand.
The Maramarua coalfield is located in the NZ North Island about 30 km north of
Huntly. A map of the area and its location within New Zealand is presented in Fig. 4. The
Maramarua Kupakupa coal seam contains substantial amounts of subbituminous coal and
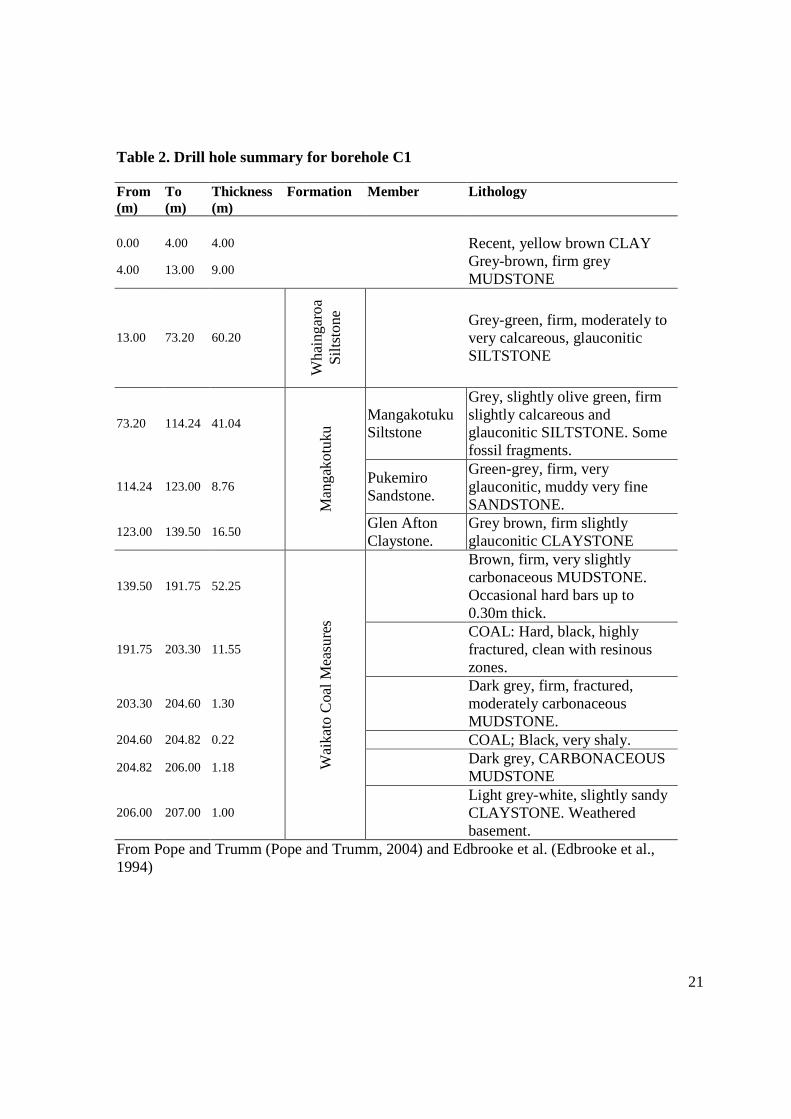
has low ash and sulphur contents (Pope and Trumm, 2004). Table 2 shows the bore log
data collected when Maramarua C-1 was drilled. The Eocene Kupakupa Seam has
impermeable claystone cap rocks which would prevent water (and gas) from escaping the
seam. This coal seam has been identified as an aquifer with sufficient hydrostatic head
capable of preventing natural CSG desorption (Pope and Trumm, 2004).
Exploration hole Maramarua C-1 was completed in June 2004 for the purpose of
conducting a gas flow test. The well was completed with steel casing (100 mm diameter)
all the way down to the coal seam (200 m), effectively isolating it from nearby units, and
thus preventing the mixing of coal seam waters with waters alien to the coal formation. In
August 2004 dewatering of this well took place which allowed the collection of 22

10
samples between August and October 2004. These samples were analysed for major ion
composition at the Environmental Engineering Laboratory (EEL), University of
Canterbury. In addition, one sample was collected on 19/8/2004 and sent to commercial
laboratories where detailed analyses were carried out, and a composite of samples
collected on the 20th and 21st of October was sent for tritium determination. In April 2005
a new dewatering round enabled the collection of 11 more samples which were analysed
at the EEL. In sum, a total of 34 samples were collected from C-1 over the course of 1
year, so a wide spread of transient sampling conditions is covered for this well.
Common guidelines for well sampling generally involve sampling the well after
3-5 well volumes have been purged or until parameters such as pH, conductivity, and
water temperature remain constant (Nielsen, 1990; Rosen and Institute of Geological &
Nuclear Sciences Limited., 1999). These guidelines exist so that, when the well is
sampled, the stagnant water that was present in the well prior to sampling is effectively
removed through purging, thus only sampling aquifer water. Before collecting each
sample, the Maramarua C-1 well was continuously purged and sometimes even beyond
the 5-well volume guideline. This is because the well dewatering program focused on
lowering the water level to just above the coal seam. Water samples from this well were
collected using guidelines from the APHA (American Public Health Association et al.,
1999); samples were collected in untreated 1-litre bottles when testing for major
constituents and in HNO3 -treated 250-ml bottles when testing for dissolved metals.
Collection was carried out by filling the plastic bottles completely and by taking care not
to leave any air gaps. These samples were then placed in cool containers to minimise
volatilization and biodegradation during transport.
The commercial laboratories followed guidelines from the APHA (1999) with
very low detection limits. The confirmatory tests conducted at the University of
Canterbury were carried out using simplified, and less reliable, analytical techniques to
test for variability in water quality from the test well.
Characterisation of Maramarua CSG water quality
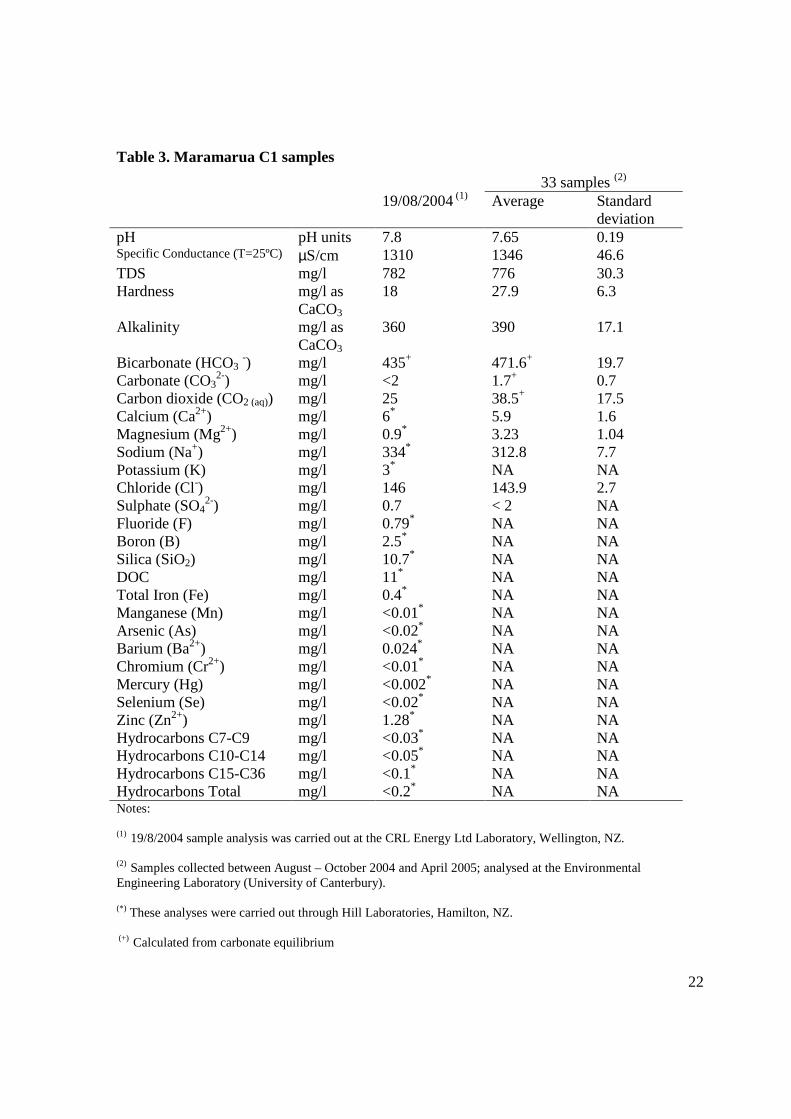
The sample collected on 19/8/2004 is a representative sample of CSG water from
the C-1 well in Maramarua (Table 3). The sample was collected after a prolonged

11
pumping period (19 days) and when the water level was low (>126 m when measured
from the surface). Even though samples were collected under a variety of pumping and
flow conditions, the 33 samples analysed at the EEL fall within 9% of the 19/8/2004
sample’s values for pH and conductivity. These 33 samples show little variability for
major ions. The relative standard deviations of the 33 samples were about 4% for
bicarbonate (X = 471.6 mg/l), 3% for sodium (X = 312.8 mg/l), and 2% for chloride
( X = 143.9 mg/l), which suggests that water from this well is chemically stagnant. This
in turn adds confidence that the 19/8/2004 sample is representative of the aquifer’s water
quality. If more exploration wells are drilled in Maramarua, their corresponding CSG
water quality could be slightly different to the one presented in this paper because those
wells could be located in areas where the basin is deeper or shallower. For example, if
wells are drilled close to recharge areas, CSG water would be less mineralised than if
wells were drilled deep within the basin.
Results for the 19/8/2004 sample are presented in Table 3. The major ions are
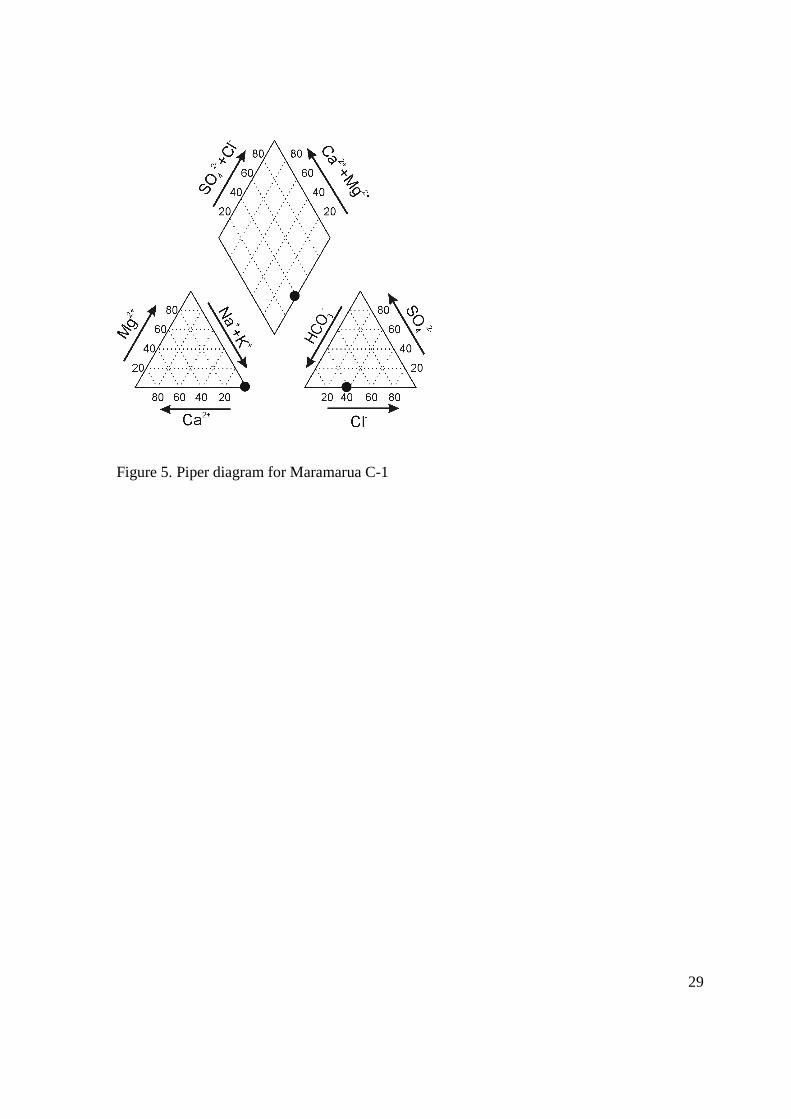
sodium, bicarbonate and chloride, thus classifying this water as of the Na-HCO3--Cl- type
as shown in Fig. 5. The pH for this sample is high (7.8) and the sample has relatively
high alkalinity (360 mg/l as CaCO3). Calcium and magnesium concentrations are
comparatively low (6 and 0.9 mg/l, respectively), and sulphate levels are almost nil (0.7
mg/l) and below the limit of 500 mg/l for methane-producing wells in the United States
(Van Voast, 2003). There is a significant difference in magnitude between major ions
(sodium, chloride and bicarbonate) and minor ones (calcium, magnesium, and sulphate).
For example, concentrations of sodium are about 50 times higher than calcium, and
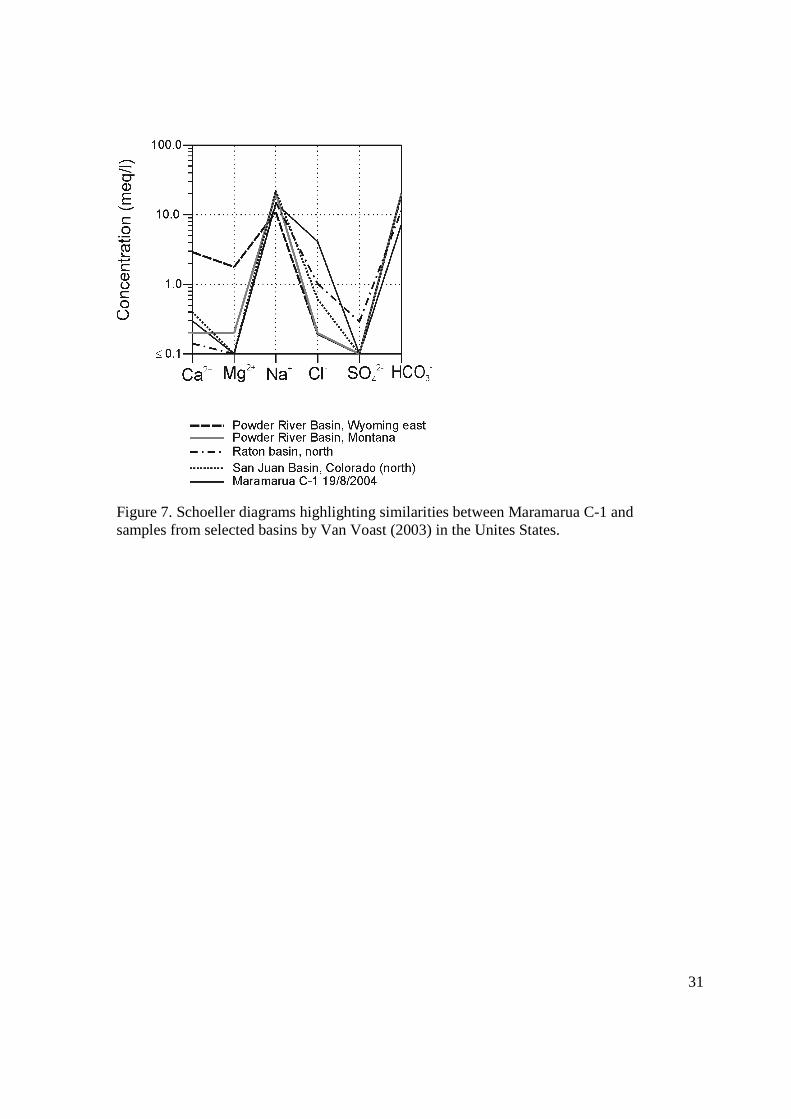
concentrations of chloride are more than 200 times higher than sulphate. Fig. 6 shows
these differences graphically by plotting the major and minor ions in a Schoeller diagram.
Very low tritium concentrations (-0.003 ± 0.016 TU) in samples collected on the
20th and 21st of October, 2004 suggest there is no recent recharge in the Maramarua coal
aquifer. A qualitative interpretation of this value (<0.8 TU) classifies this water as sub-
modern or pre-1952 (Clark and Fritz, 1997). The nil tritium concentrations indicate the
aquifer is either confined or so deep that recharge takes a long time. Log bore data (Table
1) suggests the aquifer is confined by a 16.5 m claystone cap (Pope and Trumm, 2004).
Therefore, if no dispersion is assumed within the aquifer, then it is possible to apply a
12
piston flow model (PFM) for a quantitative estimate of water residence time. A PFM is a
model that assumes little or no dispersion; it has been compared to a train moving people
on a single path as opposed to people travelling in cars on a highway (Clark and Fritz,
1997). Consequently, the PFM assumes tritium concentrations change only due to
isotopic decay (Maloszewski and Zuber, 1982). According to this, water from the
Maramarua C-1 well would be at least older than 86 years.
A high transit time in the coal aquifer means CSG waters are subjected to
geochemical processes as they flow through the seam. This leads to a more quantitative
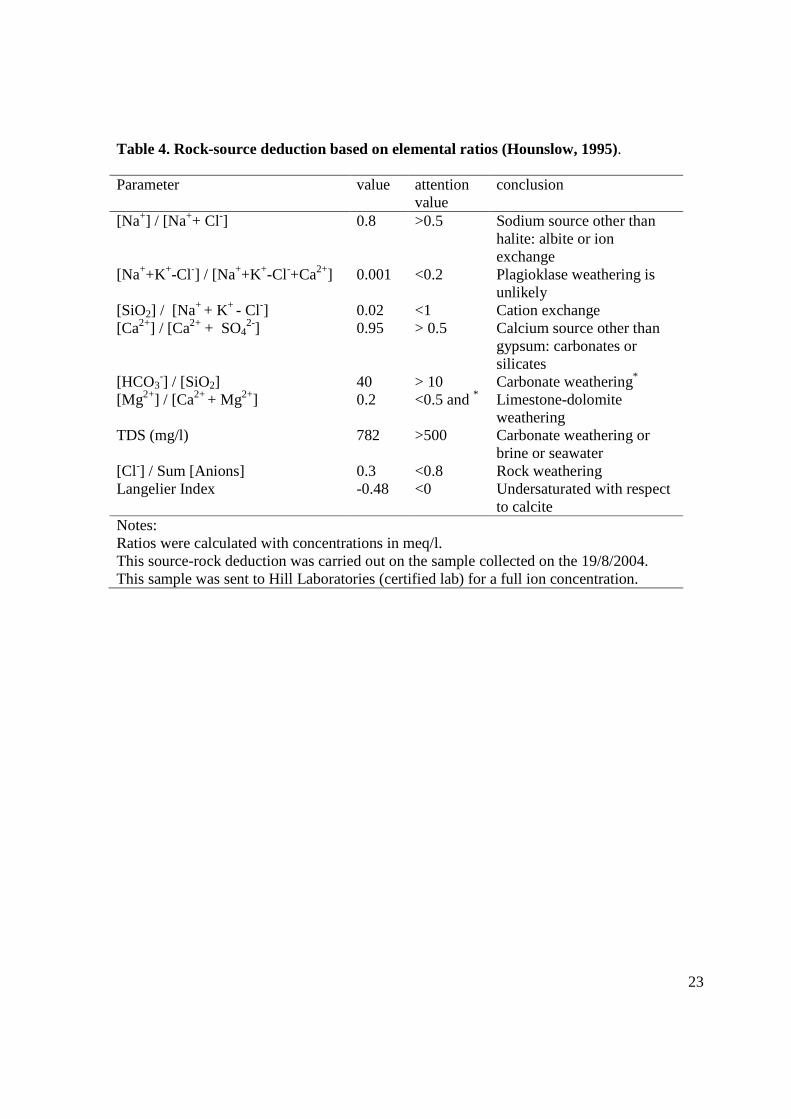
interpretation of the Maramarua CSG water samples using the source-rock deduction
method described by (Hounslow, 1995). In this method, different ratios of chemical
constituents give insight into the origin of the water being analysed. The attention values
used in this method are derived from a mass balance approach using collections of water
quality data (Hounslow, 1995), therefore this method can provide an estimate on the
origins of a particular water. The calculated ratios for the 19/8/2004 sample, their
attention values, and conclusions are presented in Table 4. The first ratio, which relates to
the proportion of sodium and chloride ions in halite (NaCl), indicates there is extra
sodium (not accounted by halite dissolution) which could have resulted from the
dissolution of albite (sodium feldspars) or an ion exchange process. However, the second
ratio, which tests for nonhalite sodium, indicates that the extra sodium is not likely to
originate from plagioklase (albite) weathering. Therefore, the main process responsible
for enhancing sodium concentrations would have to be ion exchange. This is confirmed
by comparing silica concentrations with nonhalite sodium using the third ratio on Table
4. Because silica concentrations are low in comparison to nonhalite sodium, it is
reasonable to conclude that the majority of the sodium is likely to have originated from a
cation exchange process.
The fourth ratio indicates that there is more calcium than sulphate in the water,
indicating carbonate weathering. The same conclusion is reached when analysing the
ratio of bicarbonate and silica. A high TDS value and the magnesium concentrations
relative to calcium concentrations (sixth and seventh ratios) point towards carbonate,
limestone and dolomite weathering. However, high bicarbonate concentrations can also
result from methane generation processes, which also account for the low sulphate

13
concentrations in the CSG water. Therefore, it is possible that some carbonate weathering
did occur, but bicarbonate concentrations were enhanced and sulphate concentrations
were reduced through the methanation process. Low chloride concentrations (last ratio in
Table 4) in the water sample are due to rock weathering. This is possible if there is some
halite dissolution processes taking place. Lastly, the calculated Langelier Index for this
sample is -0.48, which indicates that the sample is undersaturated with respect to calcite.
However, this value can change once the sample is exposed to local atmospheric
conditions. Sparging experiments conducted at the EEL have yielded positive Langelier
Indexes for the same type of water. Consequently, once these CSG waters reach
equilibrium with the atmosphere, they become oversaturated with calcite, thus
precipitating calcium carbonate.
Summarising, the majority of the sodium would originate from ion exchange
processes in the aquifer. Some halite dissolution would be responsible for some sodium
and the majority of the chloride. High bicarbonate concentrations would be due to
carbonate weathering and biogenic (methanogenic) processes which are also responsible
for low sulphate concentrations. Carbonate and dolomite weathering would also be
responsible for calcium and magnesium concentrations. However, because of the high
bicarbonate content, these cations would rapidly precipitate out of solution in the aquifer.
In addition, the same ion exchange process responsible for sodium enhancement aids in
the depletion of calcium and magnesium concentrations.
Comparison of Maramarua CSG water quality to US CSG
Analogues
The major ion concentrations of the Maramarua C-1 samples are similar to the
chemistry of selected basins in the United States. Fig. 7 compares major ion
concentrations between Maramarua CSG water and typical CSG water from the Powder
River basin (PRB; MT and WY), the Raton basin (RB), and the San Juan basin (SJB).
Maramarua CSG water looks very similar (in terms of concentration) to the PRB
(Montana) CSG water: similar calcium and sodium concentrations, less magnesium and
bicarbonate, but significantly more chloride. Magnesium concentrations for Maramarua

14
are similar to those from SJB and PRB (WY east), but chloride is significantly higher. It
is possible to observe an example of CSG water quality variability within basins in Fig. 7
where CSG samples for the Wyoming portion of the PRB show significantly more
calcium and magnesium than CSG samples for the Montana portion.
Fig. 8 presents differences between the Maramarua C-1 CSG water and CSG
waters from the Black Warrior basin (BWB), SJB (NM, south), and Uinta basin (UB;
Drunkards Wash), where ion concentrations are significantly higher than those for
Maramarua C-1 CSG water. For example, sodium and chloride concentrations are around
20 times higher than Maramarua C-1 values; bicarbonate is also higher and particularly in
the SJB where bicarbonate concentrations are 40 times higher than the Maramarua C-1
value. Also, calcium and magnesium concentrations are about 5 and 12 times higher in all
of these basins, but these are also minor ions in comparison to the sodium, chloride, and
bicarbonate content. Even though there are differences in magnitude for Maramarua C-1
ion concentrations and ion concentrations for basins in the U.S., there is one common
characteristic that prevails: the consistently low (almost nil) sulphate content (Fig. 8).
Maramarua C-1 CSG water has the same major and minor ion proportions as CSG
water from basins in the United States. This can be illustrated by grouping the data
according to their major anion/cation percentages using the Piper diagram on Fig. 9. This
figure shows how sodium is the major cation in CSG water samples for Maramarua C-1
and basins in the US. Most CSG samples plot at the bottom right hand corner of the
cation triangle; the exception is Wyoming east (Powder River) because of the higher
calcium and magnesium concentrations for these data. The bottom right-hand triangle in
the Piper diagram of Fig. 9 represents the major anion composition. In all of the CSG
samples bicarbonate is the major anion followed by chloride; in some of these samples
(Black Warrior and Uinta for example) chloride concentrations are greater than
bicarbonate concentrations.
Conclusions
Coal seam gas waters from Maramarua exhibit the typical geochemical signature
of CSG waters: low calcium, low magnesium, high bicarbonate, low sulphate and
sometimes high chloride. Maramarua’s CSG water quality is invariant for this particular

15
well, but could change in composition and constituent ratios if sampling wells are drilled
in deeper parts of the basin or closer to recharge areas. More wells could provide the
necessary information to determine the flow conditions and the range of water quality
expected throughout the Maramarua basin.
Chemical analysis (rock source deduction) of Maramarua CSG water samples
provides insight into the origins and processes responsible for this particular water
quality. This method is a simple approach for verifying an actual sample’s origins,
especially if specific biogeological processes are suspected to have taken part in its
formation. In the case of Maramarua, these processes are a combination of weathering of
rocks (carbonates, dolomite, and halite), cation exchange, and biogenic processes. Nil
tritium concentrations suggest aquifer recharge is taking place at a very slow rate, which
would allow enough time for the CSG water generation processes to take place. This also
could explain the low variation in the water chemistry composition of 33 samples taken
from the same well.
A comparison between the Maramarua CSG water quality and known CSG water
quality data from producing basins in the US further confirms the water quality results.
Researchers with new CSG water quality data can compare their data against data from
other CSG basins around the world to verify the accuracy of their results. Also, when
correlated with gas production data, this can prove a useful analysis to assess the
potential for CSG production. For instance, the CSG chemical signature and low sulphate
levels in the Maramarua CSG samples suggest good potential for methane generation.
Caution is needed when comparing CSG waters between and within basins.
Literature values do not necessarily describe the full variation one might expect in a
basin; for example, the water qualities provided for the Powder River Basin in Van Voast
(2003) have significant differences that could affect the management of the pumped
water discharge. Even with this constraint, knowledge of the type of water being
abstracted is important in order to identify production-related problems and disposal
options; this knowledge transfer can help CSG stakeholders around the world develop
successful operations.

16
Acknowledgements
This research is a direct result of a TIF project funded by FRST through The University
of Canterbury, L&M Coal Seam Gas, and CRL Energy. Without the TIF funding this
work would not have been possible. Additional thanks to L&M for providing data and
funding, especially to Mick Ryan (L&M) who diligently collected water samples and
data from the gas flow testing. Special thanks to Dave Trumm (CRL Energy) and Dr.
David Nobes (University of Canterbury) for proofreading this article and providing
valuable comments on it.

17
References
Alabama State Oil and Gas Board (AOGB), 2003: Coalbed Methane Resources of Alabama http://www.ogb.state.al.us. Accessed 24 February 2005.
ALL-Consulting, 2003: Handbook on Coal Bed Methane Produced Water: Management and Beneficial Use Alternatives., Ground Water Protection Research Foundation, U.S. Department of Energy, National Petroleum Technology Office, Bureau of Land Management, Tulsa, Oklahoma.
ALL-Consulting and Montana Board of Oil and Gas Conservation, 2004: Coal Bed Methane primer. New Source of Natural Gas–Environmental Implications. Background and Development in the Rocky Mountain West, U.S. Department of Energy, National Petroleum Technology Office, Tulsa, Oklahoma.
American Public Health Association, American Water Works Association and Water Environment Federation., 1999: Standard methods for the examination of water and wastewater. American Public Health Association, Washington, D.C.
Ayers, R.S., Westcot, D.W. and Food and Agriculture Organization of the United Nations., 1985: Water quality for agriculture. FAO Irrigation and Drainage Paper 29 Rev. 1, Food and Agriculture Organization of the United Nations, Rome.
Bartos, T.T., Ogle, K.M., Wyoming. State Engineer's Office., United States. Bureau of Land Management. and Geological Survey (U.S.), 2002: Water quality and environmental isotopic analyses of ground-water samples collected from the Wasatch and Fort Union formations in areas of coalbead methane development : implications to recharge and ground-water flow, eastern Powder River Basin, Wyoming, U.S. Dept. of the Interior U.S. Geological Survey, Branch of Information Services distributor, Cheyenne, Wyo; Denver, CO.
Clark, I.D. and Fritz, P., 1997: Environmental isotopes in hydrogeology. CRC Press/Lewis Publishers, Boca Raton, FL.
Decker, A.D., Klusman, R., Horner, D.M. and Anonymous, 1987: Geochemical techniques applied to the identification and disposal of connate coal water. Proceedings - International Coalbed Methane Symposium, 1987: 229-242.
Edbrooke, S.W., Sykes, R. and Pocknall, D.T., 1994: Geology of the Waikato Coal Measures, Waikato Coal Region, New Zealand., Institute of Geological & Nuclear Sciences Monograph.
Freeze, R.A. and Cherry, J.A., 1979: Groundwater. Prentice-Hall, Englewood Cliffs, N.J.
18
GRI (Gas Research Institute), 2000: Coalbed Methane Potential of the U.S. Rocky Mountain Region. 3pp.
Hagmaier, J.L., 1971: Groundwater flow, hydrogeochemistry, and uranium deposition in the Powder River Basin, Wyoming. Ph.D thesis Thesis, University of North Dakota, Department of Geology, Grand Forks, 166 pp.
Hamilton, T.M., 1970: Groundwater flow in part of the Little Missouri River Basin, North Dakota. Ph.D thesis Thesis, University of North Dakota, Department of Geology, Grand Forks, 179 pp.
Hounslow, A., 1995: Water quality data : analysis and interpretation. Lewis Publishers, Boca Raton.
Johnson, K.C., 2004: The New Zealand coal seam gas scene, 2004 New Zealand Petroleum Conference proceedings. New Zealand Crown Minerals, Wellington, N.Z.
Kjeldsen, P., Barlaz, M.A., Rooker, A.P., Baun, A., Ledin, A. and Christensen, T.H., 2002: Present and Long-Term Composition of MSW Landfill Leachate: A Review. Critical Reviews in Environmental Science and Technology, 32(4): 297-336.
Lee, R.W., 1981: Geochemistry of water in the Fort Union Formation of the northern Powder River Basin, southeastern Montana.
Maloszewski, P. and Zuber, A., 1982: Determining the Turnover Time of Groundwater Systems with the Aid of Environmental Tracers .1. Models and Their Applicability. Journal of Hydrology, 57(3-4): 207-231.
Montgomery, S.L., 1999: Powder River basin, Wyoming: An expanding coalbed methane (CBM) play. Aapg Bulletin-American Association of Petroleum Geologists, 83(8): 1207-1222.
Moore, T.A., Manhire D.A., Flores R.M., 2002: Coalbed Methane opportunities in New Zealand: Similarities with the Powder River Basin coalbed methane paradigm, AusIMM Conference, Auckland, New Zealand.
Moore, T.A. and Shearer, J.C., 2003: Peat/coal type and depositional environment - Are they related? International Journal of Coal Geology, 56(3-4): 233-252.
Nielsen, D., 1990: Practical handbook of ground-water monitoring. Lewis Publishers, Chelsea, MI.
Oremland, R.S., Marsh, L.M. and Polcin, S., 1982: Methane Production and Simultaneous Sulfate Reduction in Anoxic, Salt-Marsh Sediments. Nature, 296(5853): 143-145.
19
Pope, S. and Trumm, D., 2004: Coal Seam Gas Desorption Results: Drill Holes C1, K1 and K3, Maramarua Coalfield, Waikato, 2003. 04-41006, CRL Energy Ltd, Christchurch.
PTTC, 2000: Coal bed methane strategraphic traps in the ferron coals of east-central Utah, PTTC Rocky Mountain Newsletter.
Rice, C.A. and Bartos, T.T., 2001: Nature and Characteristics of Water Co-Produced with Coalbed Methane with emphasis on the Powder River Basin, USGS Coalbed Methane Field conference May 9-10, 2001. USGS, Casper, Wyoming.
Rice, D.D., 1993: Composition and origin of coalbed gas. In: B.E. Law and D.D. Rice (Editors), Hydrocarbons from coal. American Association of Petroleum Geologists: 159-184.
Rosen, M.R., 2001: Hydrochemistry of New Zealand's Aquifers. In: M.R. Rosen and P.A. White (Editors), Groundwaters of New Zealand. New Zealand Hydrological Society, Wellington, New Zealand: 77-110.
Rosen, M.R. and Institute of Geological & Nuclear Sciences Limited., 1999: New Zealand guidelines for the collection of groundwater samples for chemical and isotopic analyses. Institute of Geological and Nuclear Sciences, Lower Hutt, N.Z.
Stach, E., 1982: Stach's textbook of coal petrology. Borntraeger, Berlin.
The Seacreast Group, 2003: Water quality data collected from water wells in the Raton basin, Colorado, Colorado Oil and Gas State Conservation Comission, Denver, Colorado.
U.S. Environmental Protection Agency and Advanced Resources International, 2002: Enhanced CBM Recovery. under Contract 68-W-00-094., U.S. Environmental Protection Agency.
Van Voast, W.A., 2003: Geochemical signature of formation waters associated with coalbed methane. AAPG Bulletin, 87(4): 667-676.
Williams. B, 2001: Personal communication between Mr. Williams/ V.P., Redstone and Dr. Langhus/ALL-LLC. March 23, 2001.
20
Table 1. CSG water quantity and quality from selected U.S. basins.
Basin Coal Type(e) Gas origin(e) Gas Average Water Product.
Water/Gas Water type (c) pH(c) TDS(c)
TCM/day
per well
m3/day per well
m3/TCM mg/l
Black Warrior (AL)
High volatile A bituminous to low volatile bituminous
Thermogenic gas altered by mixing with biogenic gas and oxidation of heavy hydrocarbons
2.6 (a) 7.5 (a) 2.9 Na-Cl-HCO3 5.4-9.9 160-31,000
Powder River (WY, MT)
Lignite to subbituminous C
Biogenic 1.9 (b) 32.9 (b) 17.3 Na-HCO3 6.8-8.0 270-3,010
Raton (CO)
High volatile C bituminous to low volatile bituminous (f)
Thermogenic 8.5 (b) 42.3 (b) 5.0 Na-HCO3 6.0-7.9 (d) 86-2,582 (d)
San Juan (CO, NM)
Sub-bituminous C to medium volatile bituminous
Mostly thermogenic
22.7 (b) 4.0 (b) 0.18 Na-HCO3-Cl 5.2-9.2 410-171,000
Uinta (UT)
High volatile bituminous(f)
Mostly thermogenic
17.7 (b) 34.2 (b) 1.9 Na-HCO3-Cl 7.0-8.2 6,350-42,700
Sources:
(a) (Alabama State Oil and Gas Board (AOGB), 2003).
(b) These sources are quoted in ALL-Consulting and Montana Board of Oil and Gas Conservation (2004): (PTTC,
2000); (GRI (Gas Research Institute), 2000); (U.S. Environmental Protection Agency and Advanced Resources
International, 2002); CO, NM, WY, MT Oil and Gas Commissions; (Williams. B, 2001).
(c) (Rice and Bartos, 2001).
(d) (The Seacreast Group, 2003) (e) (Rice, 1993)
(f) (ALL-Consulting, 2003)
TCM = Thousand cubic meters of gas
21
Table 2. Drill hole summary for borehole C1
From To Thickness Formation Member Lithology (m) (m) (m) 0.00 4.00 4.00 Recent, yellow brown CLAY
4.00 13.00 9.00
Grey-brown, firm grey MUDSTONE
13.00 73.20 60.20
Wh
aing
aro
a S
iltst
one
Grey-green, firm, moderately to very calcareous, glauconitic SILTSTONE
73.20 114.24 41.04
Man
gak
otu
ku Mangakotuku
Siltstone
Grey, slightly olive green, firm slightly calcareous and glauconitic SILTSTONE. Some fossil fragments.
114.24 123.00 8.76 Pukemiro Sandstone.
Green-grey, firm, very glauconitic, muddy very fine SANDSTONE.
123.00 139.50 16.50 Glen Afton Claystone.
Grey brown, firm slightly glauconitic CLAYSTONE
139.50 191.75 52.25
Wai
kato
Coa
l Mea
sure
s
Brown, firm, very slightly carbonaceous MUDSTONE. Occasional hard bars up to 0.30m thick.
191.75 203.30 11.55 COAL: Hard, black, highly fractured, clean with resinous zones.
203.30 204.60 1.30 Dark grey, firm, fractured, moderately carbonaceous MUDSTONE.
204.60 204.82 0.22 COAL; Black, very shaly.
204.82 206.00 1.18 Dark grey, CARBONACEOUS MUDSTONE
206.00 207.00 1.00 Light grey-white, slightly sandy CLAYSTONE. Weathered basement.
From Pope and Trumm (Pope and Trumm, 2004) and Edbrooke et al. (Edbrooke et al., 1994)
22
Table 3. Maramarua C1 samples
33 samples (2) 19/08/2004 (1) Average Standard
deviation pH pH units 7.8 7.65 0.19 Specific Conductance (T=25ºC) µS/cm 1310 1346 46.6 TDS mg/l 782 776 30.3 Hardness mg/l as
CaCO3 18 27.9 6.3
Alkalinity mg/l as CaCO3
360 390 17.1
Bicarbonate (HCO3 -) mg/l 435+ 471.6+ 19.7
Carbonate (CO32-) mg/l <2 1.7+ 0.7
Carbon dioxide (CO2 (aq)) mg/l 25 38.5+ 17.5 Calcium (Ca2+) mg/l 6* 5.9 1.6 Magnesium (Mg2+) mg/l 0.9* 3.23 1.04 Sodium (Na+) mg/l 334* 312.8 7.7 Potassium (K) mg/l 3* NA NA Chloride (Cl-) mg/l 146 143.9 2.7 Sulphate (SO4
2-) mg/l 0.7 < 2 NA Fluoride (F) mg/l 0.79* NA NA Boron (B) mg/l 2.5* NA NA Silica (SiO2) mg/l 10.7* NA NA DOC mg/l 11* NA NA Total Iron (Fe) mg/l 0.4* NA NA Manganese (Mn) mg/l <0.01* NA NA Arsenic (As) mg/l <0.02* NA NA Barium (Ba2+) mg/l 0.024* NA NA Chromium (Cr2+) mg/l <0.01* NA NA Mercury (Hg) mg/l <0.002* NA NA Selenium (Se) mg/l <0.02* NA NA Zinc (Zn2+) mg/l 1.28* NA NA Hydrocarbons C7-C9 mg/l <0.03* NA NA Hydrocarbons C10-C14 mg/l <0.05* NA NA Hydrocarbons C15-C36 mg/l <0.1* NA NA Hydrocarbons Total mg/l <0.2* NA NA Notes:
(1) 19/8/2004 sample analysis was carried out at the CRL Energy Ltd Laboratory, Wellington, NZ.
(2) Samples collected between August – October 2004 and April 2005; analysed at the Environmental Engineering Laboratory (University of Canterbury). (*) These analyses were carried out through Hill Laboratories, Hamilton, NZ. (+) Calculated from carbonate equilibrium
23
Table 4. Rock-source deduction based on elemental ratios (Hounslow, 1995).
Parameter value attention value
conclusion
[Na+] / [Na++ Cl-] 0.8 >0.5 Sodium source other than halite: albite or ion exchange
[Na++K+-Cl-] / [Na++K+-Cl-+Ca2+] 0.001 <0.2 Plagioklase weathering is unlikely
[SiO2] / [Na+ + K+ - Cl-] 0.02 <1 Cation exchange [Ca2+] / [Ca2+ + SO4
2-] 0.95 > 0.5 Calcium source other than gypsum: carbonates or silicates
[HCO3-] / [SiO2] 40 > 10 Carbonate weathering*
[Mg2+] / [Ca2+ + Mg2+] 0.2 <0.5 and * Limestone-dolomite weathering
TDS (mg/l) 782 >500 Carbonate weathering or brine or seawater
[Cl-] / Sum [Anions] 0.3 <0.8 Rock weathering Langelier Index -0.48 <0 Undersaturated with respect
to calcite Notes: Ratios were calculated with concentrations in meq/l. This source-rock deduction was carried out on the sample collected on the 19/8/2004. This sample was sent to Hill Laboratories (certified lab) for a full ion concentration.
24
Figure legends. Figure 1. Evolution of bicarbonate concentration in coal seam gas waters.
Figure 2. Dissolution of sodium feldspars and ion exchange process in coal seam
aquifers.
Figure 3. Sulphate reduction in CSG aquifers
Figure 4. Location of borehole C1, Maramarua, New Zealand.
Figure 5. Piper diagram for Maramarua C-1
Figure 6. Schoeller diagram for Maramarua C-1.
Figure 7. Schoeller diagrams highlighting similarities between Maramarua C-1 and
samples from selected basins by Van Voast (2003) in the Unites States.
Figure 8. Schoeller diagrams highlighting differences between Maramarua C-1 and
samples from selected basins by Van Voast (2003) in the United States.
Figure 9. Piper diagram for Maramarua C-1 CSG water compared against CSG water
from selected U.S. basins.
25
Figure 1. Evolution of bicarbonate concentration in coal seam gas waters.

26
Figure 2. Dissolution of sodium feldspars and ion exchange process in coal seam
aquifers.

27
Figure 1. Sulphate reduction in CSG aquifers

28
Figure 2. Location of borehole C1, Maramarua, New Zealand.
29
Figure 5. Piper diagram for Maramarua C-1

30
Figure 6. Schoeller diagram for Maramarua C-1.
31
Figure 7. Schoeller diagrams highlighting similarities between Maramarua C-1 and samples from selected basins by Van Voast (2003) in the Unites States.

32
Figure 8. Schoeller diagrams highlighting differences between Maramarua C-1 and samples from selected basins by Van Voast (2003) in the United States.

33
Figure 9. Piper diagram for Maramarua C-1 CSG water compared against CSG water
from selected U.S. basins.