coca-cola enterprises inc. - · pdf filejohn r. alm president and chief executive officer...
TRANSCRIPT

delivering value
2003 Annual Report
2500 Windy Ridge ParkwayAtlanta, GA 30339
770-989-3000www.cokecce.com
Coca-Cola Enterprises Inc. (NYSE: CCE) is the world’s largest marketer, distributor, and producer of bottle and can liquid nonalcoholic refreshment.
Coca-Cola Enterprises sells approximately 80 percent of The Coca-Cola Company’s bottle and can volume in North America and is the sole licensed bottler for
products of The Coca-Cola Company in Belgium, France, Great Britain, Luxembourg, Monaco, and the Netherlands.
Coca-C
ola Enterprises Inc.
2003 Annual R
eport

JOHN R. ALMPresident and Chief Executive Officer
LOWRY F. KLINEChairman of the Board
87
Coca-Cola Enterprises Inc.
Lowry F. KlineChairman of the Board
John R. AlmPresident and Chief Executive Officer
G. David Van Houten, Jr. Executive Vice President, Chief Operating Officer and President, North American Business Unit
Vicki R. Palmer Executive Vice President, Financial Services and Administration
Daniel S. Bowling, III Senior Vice President, Human Resources
John J. Culhane Senior Vice President and General Counsel
John H. Downs, Jr. Senior Vice President, Public Affairs and Communications
Robert F. Gray Senior Vice President, Operations and Capital Planning
Shaun B. Higgins Senior Vice President and Chief Strategy and Planning Officer
Patrick J. Mannelly Senior Vice President and Chief Financial Officer
Daniel G. MarrPresident, North American Sales
Dominique Reiniche Senior Vice President and President, European Group
Scott AnthonyVice President, Investor Relations
Carol A. BentonVice President, Internal Audit
E. Liston Bishop IIIVice President, Secretary, Deputy General Counsel and Director of Acquisitions
Margaret F. CartonVice President, Information Technology
Rick L. EngumVice President, Controller and Principal Accounting Officer
Rick A. FrazierVice President, Quality Assurance
Stephen C. HornVice President and Chief Marketing Officer, North America
Timothy W. JohnsonVice President, Labor and Employee Relations
Joyce King-LavinderVice President and Treasurer
Bernard P. KunerthVice President, Human Resources Processes
Gray McCalley, Jr.Vice President and Deputy General Counsel
Terrance M. MarksVice President and Chief Revenue Officer, North America
H. Lynn OliverVice President, Tax
William T. PlybonVice President and Deputy General Counsel
Terri L. PurcellVice President,Deputy General Counsel and Assistant Secretary
Edward L. Sutter Vice President and Chief Procurement Officer
Lori Taylor Vice President, Risk Management
S. Kim AdamsonAssistant Controller, Financial Reporting and Accounting
Officers of the Company
Environmental Policy StatementCoca-Cola Enterprises uses environmentally responsible packaging which continues to demonstrate our commitment to the environment and recycling in several ways. We use 100 percent recyclable packaging throughout our operations, all of our aluminum bever-age containers have 45 percent recycled content, and 80 percent of our plastic beverage resin has 10 percent recycled content. Furthermore, Coca-Cola Enterprises supports many local environmental groups and initiatives to promote curbside, drop-off, and away-from-home recycling programs throughout the many local communities in which our employees live and work.
Portions of this report printed on recycled paper.
© 2004 Coca-Cola Enterprises Inc.
“ Coca-Cola” is a trademark of The Coca-Cola Company.
Designed and produced by Corporate Reports Inc./Atlanta. www.corporatereport.com
Primary photography by Flip Chalfant and Philip Vullo.
E
1
Bolstered by a strong emphasis on revenue man-agement and improved efficiency, our 2003 netincome totaled $674 million, or $1.46 per dilutedcommon share. Though these reported resultsincluded favorable tax and operating items with a net14-cent per share benefit, our comparable earningsper share still increased 28 percent to $1.32. Operat-ing income grew 9 percent on a comparable basis to$1.49 billion. Favorable interest rate and currencytrends also positively contributed to our perform-ance. Our higher level of profitability enabled us togenerate free cash flow* of approximately $700 mil-lion, up more than $300 million from a year ago,which we used to reduce our net debt levels.
Our company is built on a more than 100-yearheritage of successfully bottling and selling Coca-Colaproducts, and today we continue to see tremendousopportunities to grow and improve our business.In fact, we firmly believe our company’s future is asbright and prosperous as it has ever been.
There are many reasons for our optimism. Weknow, for example, that people are not less thirstytoday than they were five or 50 years ago. The needand demand for a moment of refreshment has neverbeen greater. We know there are not only more bev-erage consumers in North America and westernEurope, but also more occasions. We know we aresolidly positioned in a growing market sector with
the world’s best and most popular beverage brands,the world’s best bottling system, and a world-classteam of employees and managers.
FOCUS ON VALUE CREATION
Today’s opportunities – and today’s challenges –are created by the changing demands of today’sconsumers, and the changing dynamics of today’smarketplace. We are working to seize these oppor-tunities with the benefit of an unmatched totalbeverage brand portfolio and a new strategic direc-tion in revenue management that fully implementsthe principles of sound value creation. We believethis direction will heighten our ability to benefit fromthe strength of our brands and generate long-term,sustainable profit growth.
This clear focus on revenue management is basedon a strong commitment to improving pricing dis-cipline throughout our company. Our pricing effortsin 2003, with net revenue per case up 2 percent inNorth America and 21⁄2 percent in Europe, markedour fifth consecutive year of pricing growth.
As we and our customers continue to benefit fromthe value captured by revenue management, it isimportant for us to remember that simply decidingto raise prices will not guarantee our success. Tothat end, Coca-Cola Enterprises and the manage-ment of The Coca-Cola Company are united in
In 2003, we took another important step toward our objectiveof growing value for Coca-Cola Enterprises’ shareowners bybuilding on our strong performance of 2002 with improvedresults in virtually every area of financial measurement. Lastyear, we achieved significantly higher earnings per share,strong free cash flow, an improved return on invested capital,and lower net debt levels.
Letter to Our Shareowners
*Free cash flow is defined as cash from operations less capital expenditures.
2
our belief that, as a system, we must continue toshift our focus from volume to value and changeour respective cultures accordingly. In fact, in thelast half of 2003, we jointly embarked on a detailedeffort to identify ideas and methods that will allowus to work better together in creating a more trans-parent, efficient system driven by value creation andsustained profitability. This effort will continue in2004 as we begin to implement initiatives that willfuel continued improvement in our performance.
To benefit fully from this renewed commitment tovalue, we’ve identified four key areas that are essen-tial to our long-term success:• We will create value by strengthening our existing
brands, by building new brandswith solid marketing efforts andcontinued product and packageinnovation, and by improvingour outstanding day-to-day exe-cution in the marketplace;
• We will capture the value we cre-ate with enhanced revenue man-agement principles throughoutour company;
• We will continue to improve our already outstand-ing customer service, making it even easier forour customers to do business with us;
• We will operate our company at every level in themost efficient manner possible, exploring everyopportunity within our company and as a system,thus freeing up system resources to drive growthby reinvesting against our brands.
BUILDING OUR BRANDS WITH INNOVATION
As we look at our brand portfolio, we must empha-size the importance of continued package andproduct innovation on our growth opportunitiesnow and in the future. In 2003 for example, wesaw the benefits created by Fridge Pack, which werolled out in most North American markets. Thisinnovative take-home package proved popular with
consumers, and its perceived value enhanced ourability to generate additional unit profitability atthe retail level. In 2004 we will continue to test fur-ther package innovations, such as smaller, 390-mlPET bottles for certain immediate consumptionchannels and 12-ounce PET bottle Fridge Packs forcertain future consumption channels. In Europe,we will continue our initiatives with “slim cans” and“share size” PET bottles.
We also were able to reignite growth in our lemon-lime category with the successful introduction ofSprite Remix last summer, again demonstratinghow brand innovation creates excitement amongconsumers and drives incremental growth. We have
plans for additional soft drink inno-vation in 2004, such as the fullintroduction of a line of MinuteMaid light juice drinks.
Our diet portfolio, which includesthe industry’s most popular dietbrands, contributed significantly toour performance for the year andwill, we believe, remain a primary
source of growth. In fact, we moved forward in early2004 with the addition of diet Coke with lime, whichwe believe will be a popular extension of our dietportfolio. Last year, we achieved growth in ourNorth American diet portfolio of more than 5 per-cent, in part due to the excellent performance ofdiet Vanilla Coke and diet Cherry Coke, as well asdiet Coke. The success of our diet portfolio, coupledwith continued volume growth of our Dasani waterbrand, enabled us to maintain constant volume inNorth America while overcoming the extraordi-nary volume hurdles created by the introductionof Vanilla Coke in 2002.
Our North American water business continuedto thrive with volume up more than 12 percent in2003. During the year, we worked to expand ourpresence in the high-margin immediate consump-tion channel, which represents more than 60 percent
We are solidly positioned in a
growing market sectorwith the world’s bestand most popular beverage brands.
Letter to Our Shareowners
3
of our total water business. We also continued tobuild equity in the Dasani brand with significantpackage innovations and enhanced marketplaceexecution strategies. Enhanced brand equity is essen-tial in maintaining Dasani’s mid-tier price point asthe water segment continues to be highly competitive.Long term, we believe our three-tier water strategy, featuring Evianin the premium category, Dasani asa mid-tier water, and Dannon brandsat the value level, leaves us well-positioned to meet the challengesof changing market conditions.
We continued to grow our busi-ness in Europe in 2003, with volumeup 51⁄2 percent for the year. A major-ity of this growth resulted fromproduct innovation introduced since2000, including the 2003 success ofboth Vanilla Coke and diet Coke withlemon. This ongoing innovationprovides momentum for increasesin our core Coca-Cola trademarkbrands, and with Fanta and Sprite.Our volume also was enhanced byrecord summer heat throughoutEurope, which helped create thestrongest summer selling season oursystem has seen.
Our most important brand inno-vation in Europe in 2004 will be inthe water category, with the intro-duction of our Dasani brand in both France andGreat Britain. Our strategy, which will also includerelaunching the recently acquired Chaudfontainewater brand in Belgium, will allow us to improveour presence efficiently in the highly competitiveEuropean water segment and better serve our cus-tomers with a more complete beverage portfolio.We believe this will create positive, long-term bene-fits for our business.
IMPROVING INTERACTION WITH CUSTOMERS
More than just innovating with new brands, we arealso improving the way we bring our products tomarket and the way we interact with our customers.We’ve made good progress over the past severalyears to better meet the needs of our customers, but
much more work remains.Meeting this objective requires
prompt action to deal with thechanges created by the continuedconsolidation in the retail industry.Already, we’ve very successfullyworked with Coca-Cola NorthAmerica to merge our customermanagement organizations into asingle unit. This change has beenvital in dealing with the challengesof consolidation, and enables us tospeak much more clearly as a sys-tem when we introduce importantnew brands, brand extensions, andpackages, and implement our rev-enue management strategies. Weare simplifying our operating struc-ture in North America in an effortto further improve customer serviceand efficiency.
We face an emerging challengewith the public’s heightened con-cern over health and wellnessissues. Consumers are demandingmore beverage choices, and we
must have readily available the products and pack-ages to accommodate these changing wants andneeds. This is particularly important in the educa-tion channel, where we have embarked on a “YourPower to Choose” initiative that enables educationcustomers to decide which brands and productsbest fit their individual needs. With a portfolio thatincludes juices and juice drinks, refreshment brands
Four Keys to Our Success:
We will build strong,prosperous brands withmarketing, innovation,
and outstanding marketplace execution.
We will capture valuewith enhanced
revenue managementphilosophies.
We will continue to improve our
already outstanding customer service.
We will operate our company in the most
efficient manner we possibly can.
Letter to Our Shareowners
4
like Sprite and Coca-Cola classic, and hydrationand energy brands such as Dasani and Powerade,we are in an excellent position to meet the healthand wellness sensitivities of this channel.
BECOMING MORE EFFICIENT CREATES
NEW RESOURCES
Making certain that we operate, as a company andas a system, in the most efficient way possible isessential in meeting our long-term financial objec-tives. Efficiency gives us additional resources toinvest against our brands, improves our ability tomeet changing or unforeseen market conditions, andstrengthens our bottom line. For example, in 2003we continued to work with The Coca-Cola Companyand other Coca-Cola bottlers in the development ofthe Coca-Cola Bottlers’ Sales & Services organiza-tion, which streamlines our purchasing activities.Last year we began to realize the financial benefitsof this organization, as cost of goods trends contin-ued to be moderate throughout the year.
We also made great progress with Project Pinnacle,a program to create a world-class information tech-nology infrastructure that optimizes our interactionwith our customers, our suppliers, and our employ-ees. Project Pinnacle has been designed to strengthenour business processes, improve our service levels,and reduce costs.
In Tampa, Florida, we continued the integrationof multiple, separate administrative functions ofour North American field operations into ourShared Services Center for all North Americanoperations. The center creates significant efficien-cies by managing payroll, accounts payable, and
other functions previously handled separately byeach of our field divisions.
THE YEAR AHEAD
In summary, our work in 2003 resulted in a verygood financial performance for the year, with excel-lent progress in several important operational areas.Looking ahead to 2004, we believe we will continuethis trend of improving results, with solid growth inoperating income and earnings per share. In addi-tion, we believe we will generate significant freecash flow, in part by continuing to control capitalexpenditures tightly to a level equal to approximately6 percent of total revenues. We also expect furtherimprovement in our return on invested capital.
But even with this very solid outlook, we can real-ize additional gains only if we remain totally open tochange while embracing the same beliefs that havedriven our system for more than 100 years:• The purpose of our business is to refresh, serve,
and please consumers and customers;• Everybody involved in the business – including
our customers, our consumers, our communities –deserves genuine value;
• Value depends totally on the integrity and strengthof our brands, and creating exciting, relevant rela-tionships for the brands with our consumers.By being mindful of these three important beliefs,
by operating our company with a constant eye foroperational improvement, and by continuing toimprove the way we work together with our businesspartners in the Coca-Cola system, we will build onour solid performance of the last two years and fur-ther improve the value of our company’s shares.
LOWRY F. KLINE
Chairman of the Board
JOHN R. ALM
President and Chief Executive Officer
Letter to Our Shareowners
5
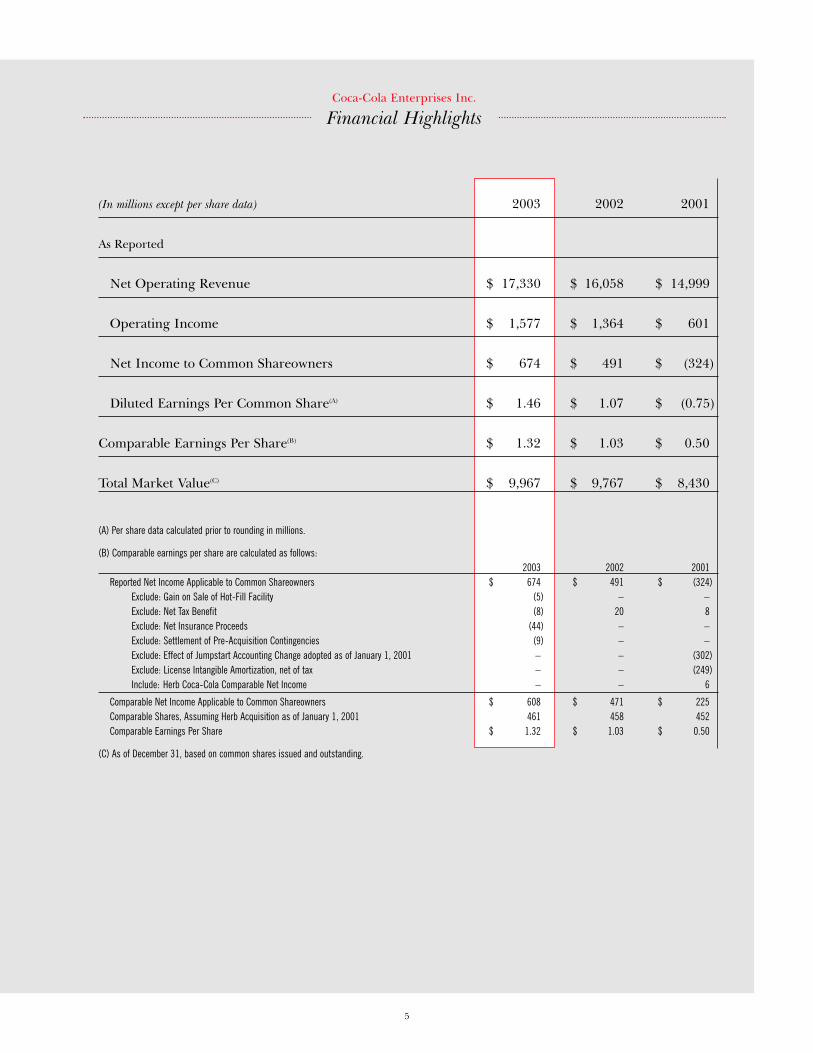
(In millions except per share data) 2003 2002 2001
As Reported
Net Operating Revenue $ 17,330 $ 16,058 $ 14,999
Operating Income $ 1,577 $ 1,364 $ 601
Net Income to Common Shareowners $ 674 $ 491 $ (324)
Diluted Earnings Per Common Share(A) $ 1.46 $ 1.07 $ (0.75)
Comparable Earnings Per Share(B) $ 1.32 $ 1.03 $ 0.50
Total Market Value(C) $ 9,967 $ 9,767 $ 8,430
(A) Per share data calculated prior to rounding in millions.
(B) Comparable earnings per share are calculated as follows:2003 2002 2001
Reported Net Income Applicable to Common Shareowners $ 674 $ 491 $ (324)Exclude: Gain on Sale of Hot-Fill Facility (5) – –Exclude: Net Tax Benefit (8) 20 8Exclude: Net Insurance Proceeds (44) – –Exclude: Settlement of Pre-Acquisition Contingencies (9) – –Exclude: Effect of Jumpstart Accounting Change adopted as of January 1, 2001 – – (302)Exclude: License Intangible Amortization, net of tax – – (249)Include: Herb Coca-Cola Comparable Net Income – – 6
Comparable Net Income Applicable to Common Shareowners $ 608 $ 471 $ 225Comparable Shares, Assuming Herb Acquisition as of January 1, 2001 461 458 452 Comparable Earnings Per Share $ 1.32 $ 1.03 $ 0.50
(C) As of December 31, based on common shares issued and outstanding.
Coca-Cola Enterprises Inc.
Financial Highlights

7
Our brands – already among the strongest, most recognized in the world – are our greatest asset. By offering the right products and packages for each consumption occasion,
we will continue to grow the value of our brands for consumers and our customers.
Strategic Initiative ONE
STRENGTHEN OUR BRANDS
Pictured at left: Shim Yang (center),
Tacoma, Washington, with customers
Do Kim (left) and Ki Kim.
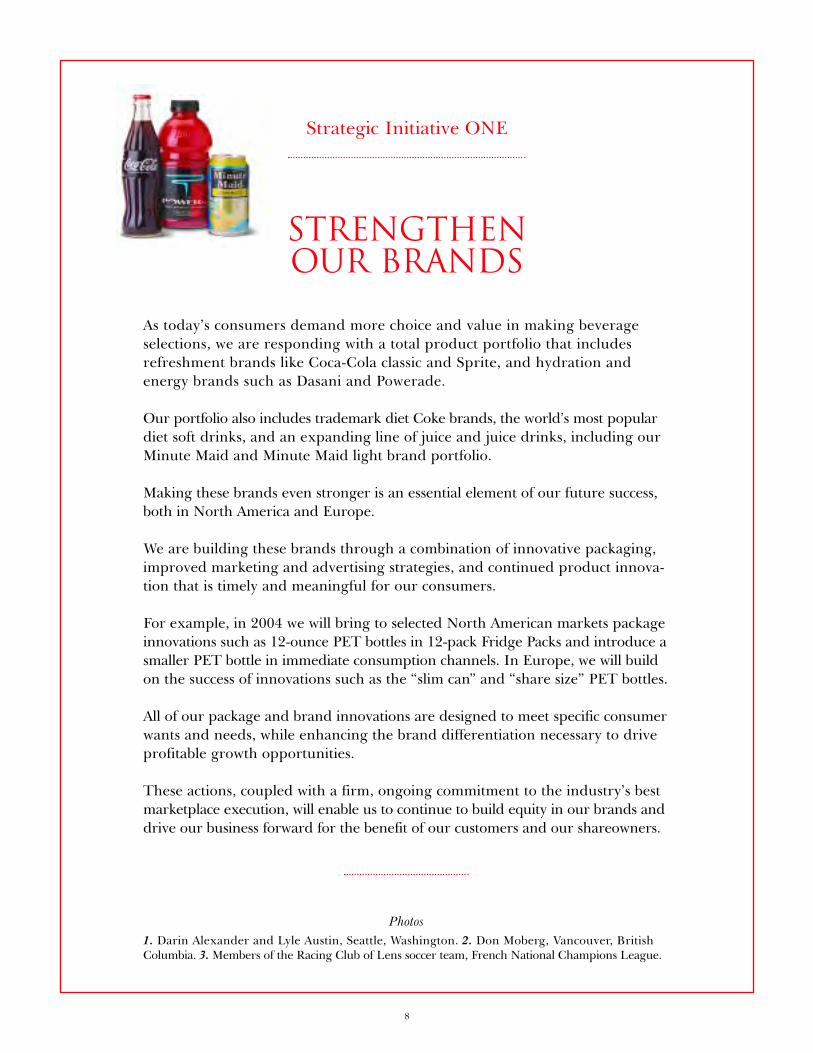
As today’s consumers demand more choice and value in making beverage selections, we are responding with a total product portfolio that includesrefreshment brands like Coca-Cola classic and Sprite, and hydration and energy brands such as Dasani and Powerade.
Our portfolio also includes trademark diet Coke brands, the world’s most populardiet soft drinks, and an expanding line of juice and juice drinks, including ourMinute Maid and Minute Maid light brand portfolio.
Making these brands even stronger is an essential element of our future success,both in North America and Europe.
We are building these brands through a combination of innovative packaging,improved marketing and advertising strategies, and continued product innova-tion that is timely and meaningful for our consumers.
For example, in 2004 we will bring to selected North American markets packageinnovations such as 12-ounce PET bottles in 12-pack Fridge Packs and introduce asmaller PET bottle in immediate consumption channels. In Europe, we will buildon the success of innovations such as the “slim can” and “share size” PET bottles.
All of our package and brand innovations are designed to meet specific consumerwants and needs, while enhancing the brand differentiation necessary to driveprofitable growth opportunities.
These actions, coupled with a firm, ongoing commitment to the industry’s bestmarketplace execution, will enable us to continue to build equity in our brands anddrive our business forward for the benefit of our customers and our shareowners.
Photos1. Darin Alexander and Lyle Austin, Seattle, Washington. 2. Don Moberg, Vancouver, BritishColumbia. 3. Members of the Racing Club of Lens soccer team, French National Champions League.
8
Strategic Initiative ONE
STRENGTHENOUR BRANDS
9
3
2
0 20 40 60 80
100
0 20 40 60 80
100
1
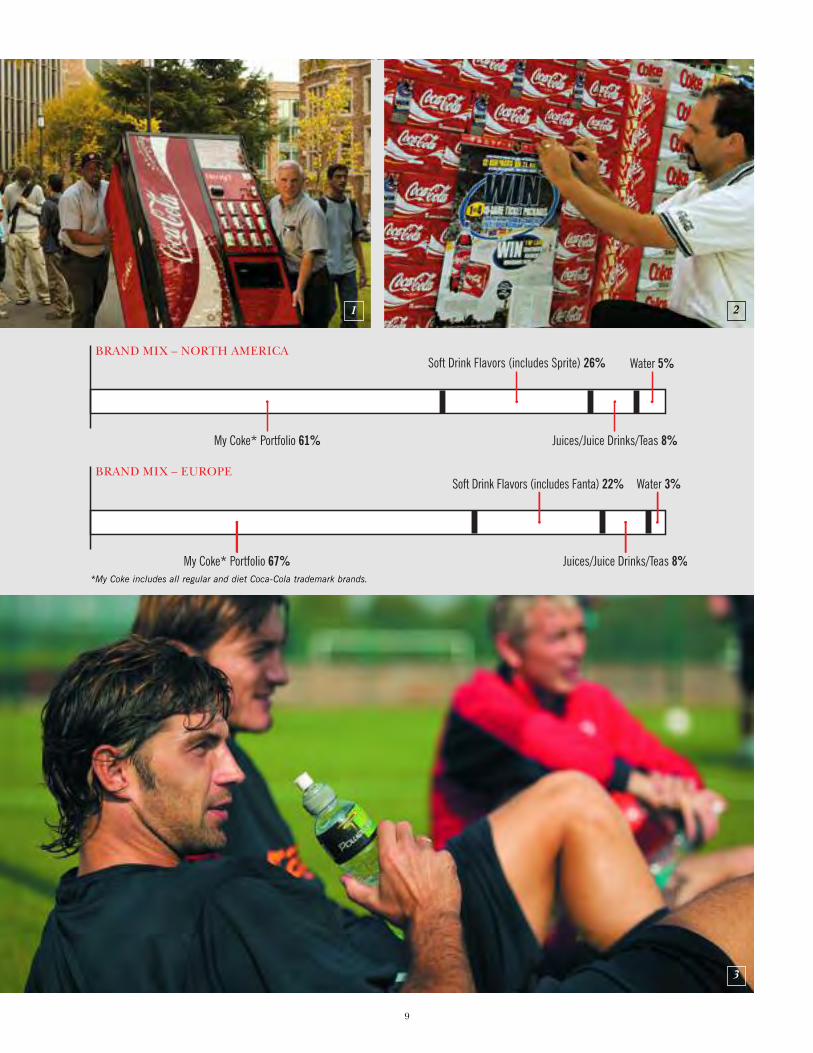
*My Coke includes all regular and diet Coca-Cola trademark brands.

11
Our goal for revenue management is clear: deliver the gross profit necessary to absorb increases in our commodity costs and operating
expenses, expand our gross profit margins, and meet profit targets.
Strategic Initiative TWO
Capture the Value Of Our BRands

Throughout 2003, Coca-Cola Enterprises maintained a disciplined pricingstrategy that resulted in full-year pricing growth of 21⁄2 percent. We also beganto establish a clear, more coordinated approach to revenue management basedon consistent principles at all levels of our company.
This approach is based on two key factors. First, we must further enhance ourability to create value with our brands, packaging, execution, and productavailability. These elements of our business have always been integral to oursuccess, but we must execute at an even higher level to distinguish ourselvesand truly please our customers and consumers.
Second, we must capture the value we create with pricing discipline and a clearunderstanding of the factors that impact pricing decisions at each level of ourcompany. Price must relate to the strength of our brands and the value theydeliver to our consumers.
Revenue management is more than just the price we charge for our products.It is a function of balancing price, package and product mix, and volume mar-ket by market, channel by channel, and occasion by occasion. However, priceincreases, both rate and mix, are essential as we work to expand our profitmargins. The increased revenue generated from our products will remain aprimary focus in our go-to-market strategies.
Photos1. Steve Johnson and Sheniqua Austin, Atlanta, Georgia. 2. Jarceline Ronelle, Paris, France. 3. Patrick Humphries, London, England (right). 4. Joe Calla, Vancouver, Canada.
12
Capture theValue of Our Brands
Strategic Initiative TWO

13
1
32
4

15
In an environment of rapid retail consolidation, we must continue to improve our ability to speak clearly as a system to our customers, as we expand our package
and product portfolio and implement our revenue management strategies.
Strategic Initiative THREE
Excel At Customer
management
Pictured at left: Doug Souder,
Seattle, Washington.
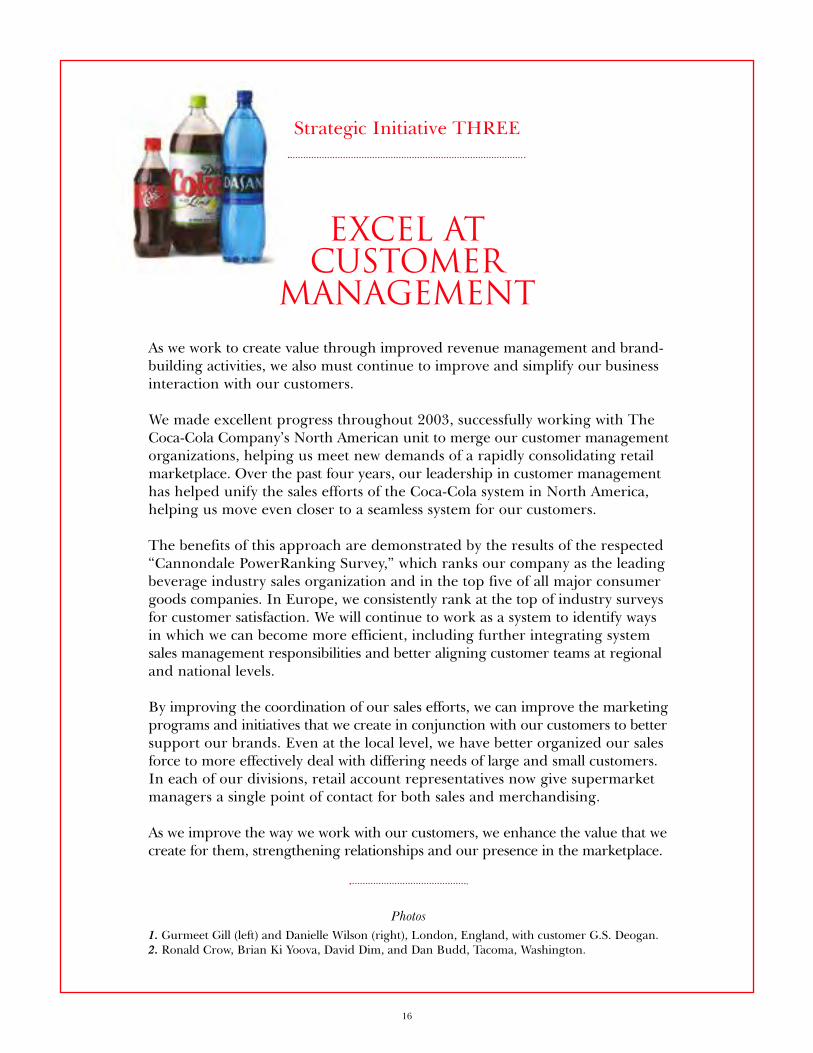
As we work to create value through improved revenue management and brand-building activities, we also must continue to improve and simplify our businessinteraction with our customers.
We made excellent progress throughout 2003, successfully working with TheCoca-Cola Company’s North American unit to merge our customer managementorganizations, helping us meet new demands of a rapidly consolidating retailmarketplace. Over the past four years, our leadership in customer managementhas helped unify the sales efforts of the Coca-Cola system in North America,helping us move even closer to a seamless system for our customers.
The benefits of this approach are demonstrated by the results of the respected“Cannondale PowerRanking Survey,” which ranks our company as the leadingbeverage industry sales organization and in the top five of all major consumergoods companies. In Europe, we consistently rank at the top of industry surveysfor customer satisfaction. We will continue to work as a system to identify waysin which we can become more efficient, including further integrating systemsales management responsibilities and better aligning customer teams at regionaland national levels.
By improving the coordination of our sales efforts, we can improve the marketingprograms and initiatives that we create in conjunction with our customers to bettersupport our brands. Even at the local level, we have better organized our salesforce to more effectively deal with differing needs of large and small customers.In each of our divisions, retail account representatives now give supermarketmanagers a single point of contact for both sales and merchandising.
As we improve the way we work with our customers, we enhance the value that wecreate for them, strengthening relationships and our presence in the marketplace.
Photos1. Gurmeet Gill (left) and Danielle Wilson (right), London, England, with customer G.S. Deogan.2. Ronald Crow, Brian Ki Yoova, David Dim, and Dan Budd, Tacoma, Washington.
16
Strategic Initiative THREE
Excel atCustomer
management
17
1
2
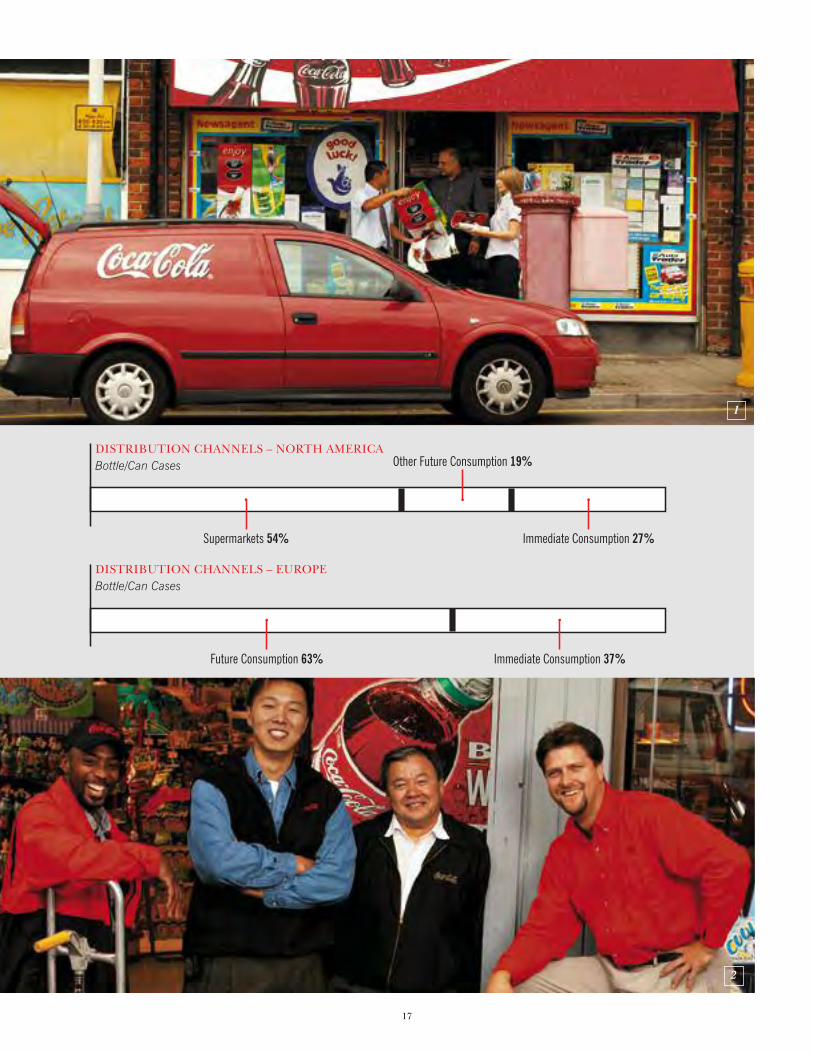
0 20 40 60 80
100
0 20 40 60 80
100
19
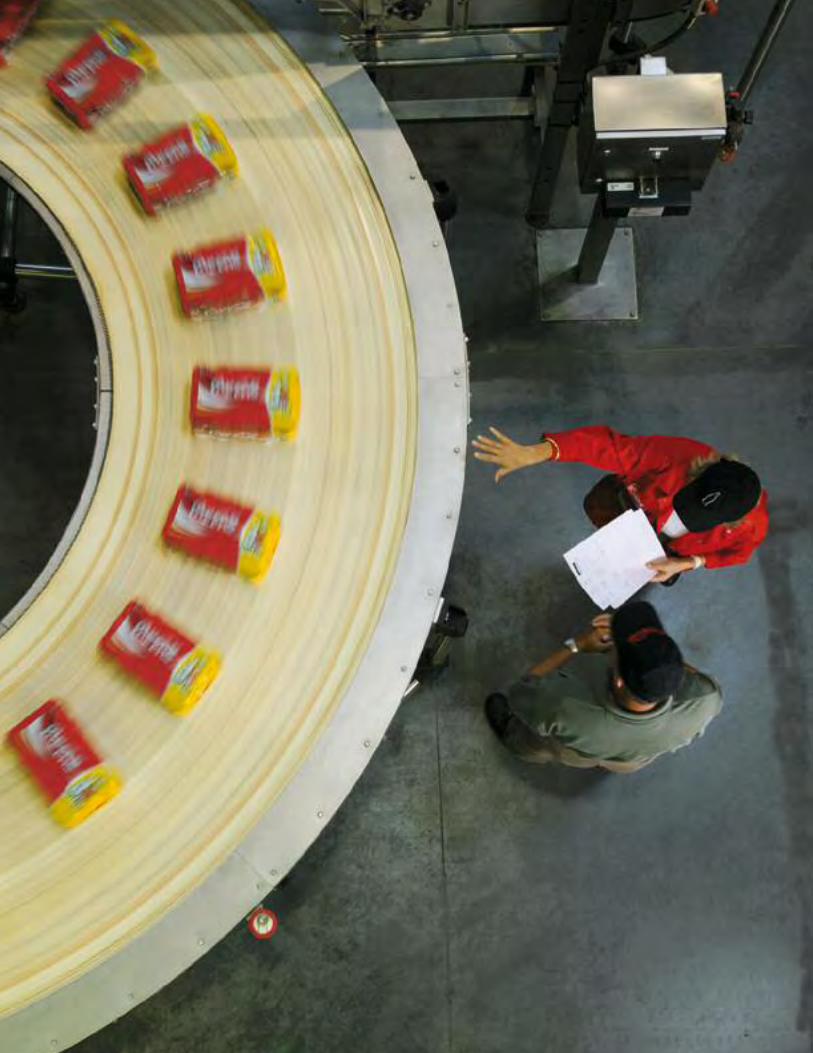
Though we are a 100-year-old business that is among the most successful enterprises in the world, we must constantly
update and renew our processes and procedures and make certain we are operating with maximum efficiency.
Strategic Initiative FOUR
ImprovingSystem Efficiency
Pictured at left: Nicole Verhille, (top),
Dunkirk, France, production center.
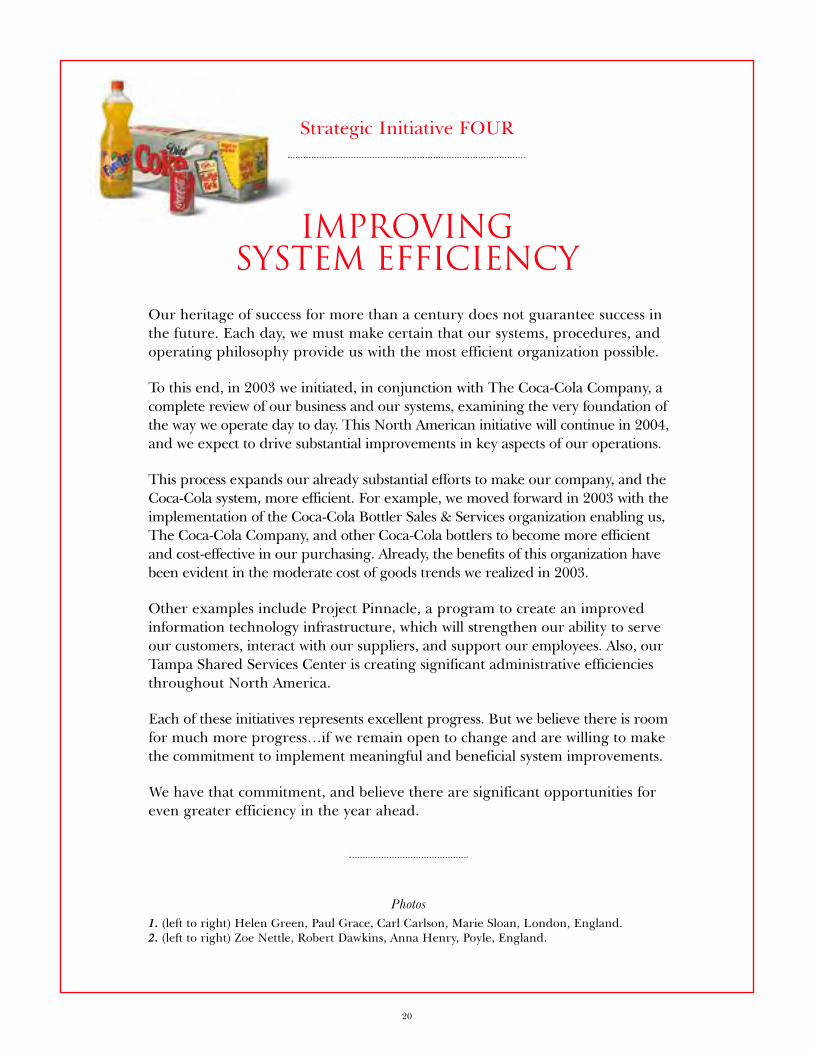
Our heritage of success for more than a century does not guarantee success inthe future. Each day, we must make certain that our systems, procedures, andoperating philosophy provide us with the most efficient organization possible.
To this end, in 2003 we initiated, in conjunction with The Coca-Cola Company, acomplete review of our business and our systems, examining the very foundation ofthe way we operate day to day. This North American initiative will continue in 2004,and we expect to drive substantial improvements in key aspects of our operations.
This process expands our already substantial efforts to make our company, and theCoca-Cola system, more efficient. For example, we moved forward in 2003 with theimplementation of the Coca-Cola Bottler Sales & Services organization enabling us,The Coca-Cola Company, and other Coca-Cola bottlers to become more efficientand cost-effective in our purchasing. Already, the benefits of this organization havebeen evident in the moderate cost of goods trends we realized in 2003.
Other examples include Project Pinnacle, a program to create an improvedinformation technology infrastructure, which will strengthen our ability to serveour customers, interact with our suppliers, and support our employees. Also, ourTampa Shared Services Center is creating significant administrative efficienciesthroughout North America.
Each of these initiatives represents excellent progress. But we believe there is roomfor much more progress…if we remain open to change and are willing to makethe commitment to implement meaningful and beneficial system improvements.
We have that commitment, and believe there are significant opportunities foreven greater efficiency in the year ahead.
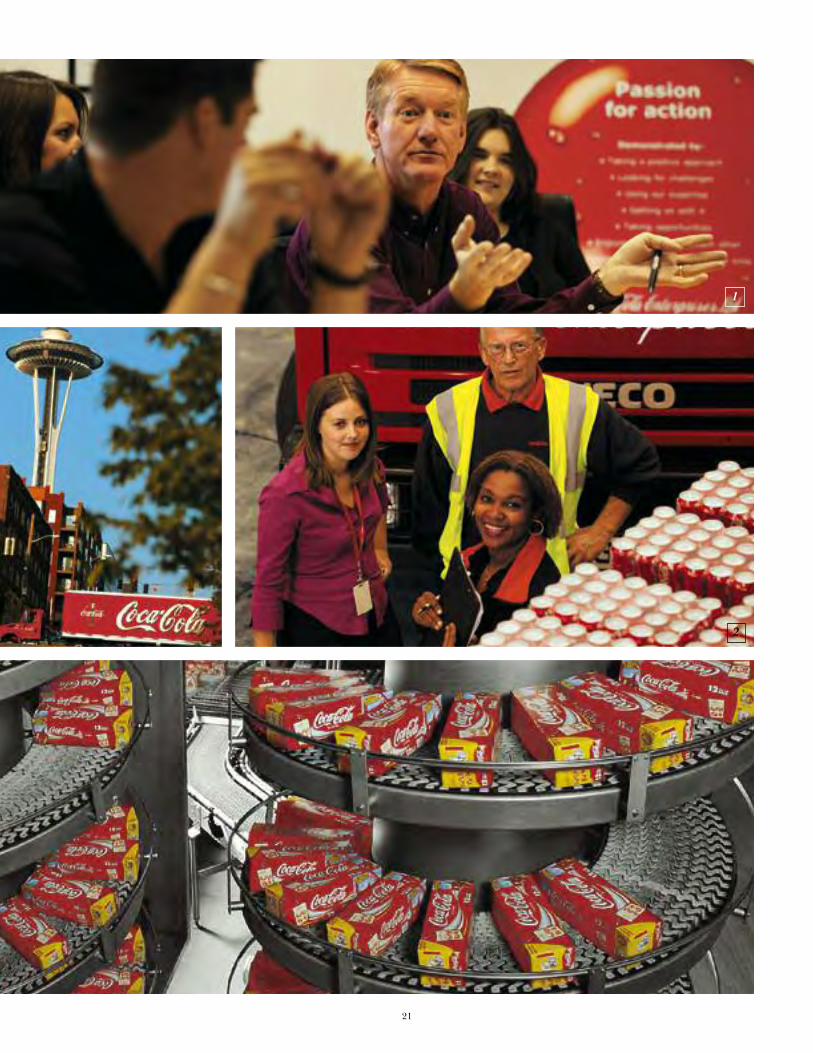
Photos1. (left to right) Helen Green, Paul Grace, Carl Carlson, Marie Sloan, London, England. 2. (left to right) Zoe Nettle, Robert Dawkins, Anna Henry, Poyle, England.
20
Strategic Initiative FOUR
ImprovingSystem Efficiency
21
1
2
22
0 20 40 60 80
100
0 20 40 60 80
100
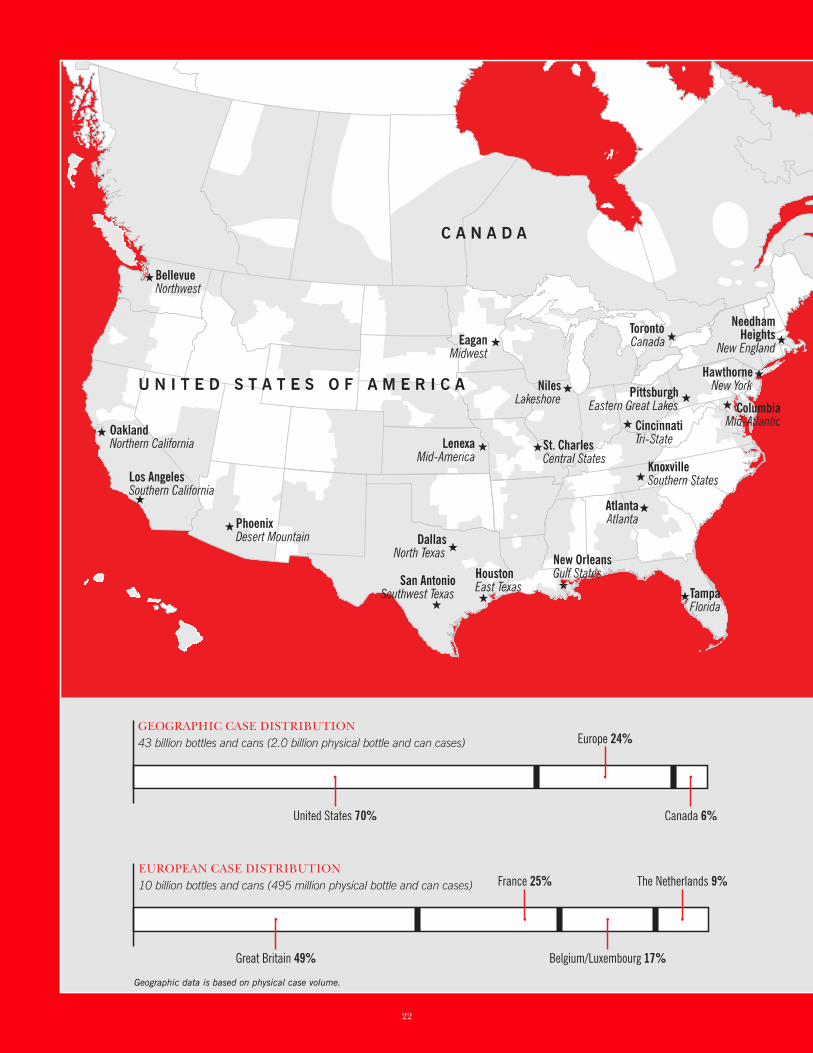
Geographic data is based on physical case volume.
0 20 40 60 80
100
0 20 40 60 80
100
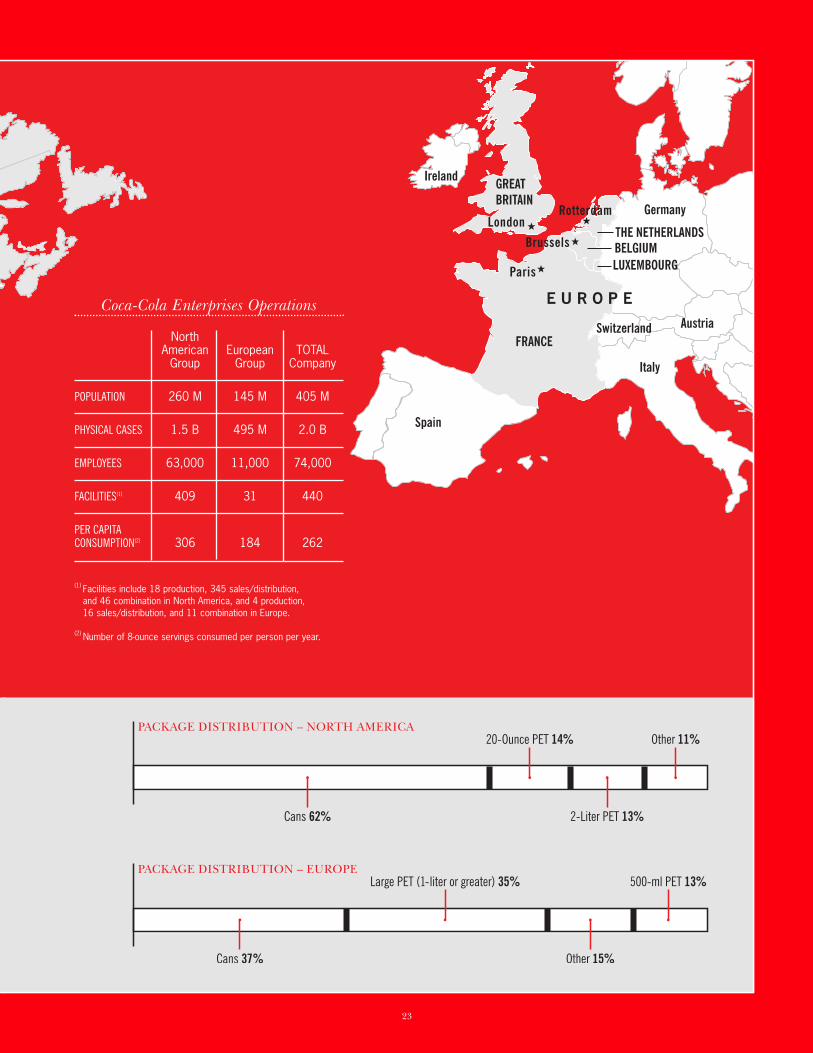
Coca-Cola Enterprises Operations
NorthAmerican European TOTAL
Group Group Company
POPULATION 260 M 145 M 405 M
PHYSICAL CASES 1.5 B 495 M 2.0 B
EMPLOYEES 63,000 11,000 74,000
FACILITIES(1) 409 31 440
PER CAPITA CONSUMPTION(2) 306 184 262
(1) Facilities include 18 production, 345 sales/distribution, and 46 combination in North America, and 4 production, 16 sales/distribution, and 11 combination in Europe.
(2) Number of 8-ounce servings consumed per person per year.
23
24
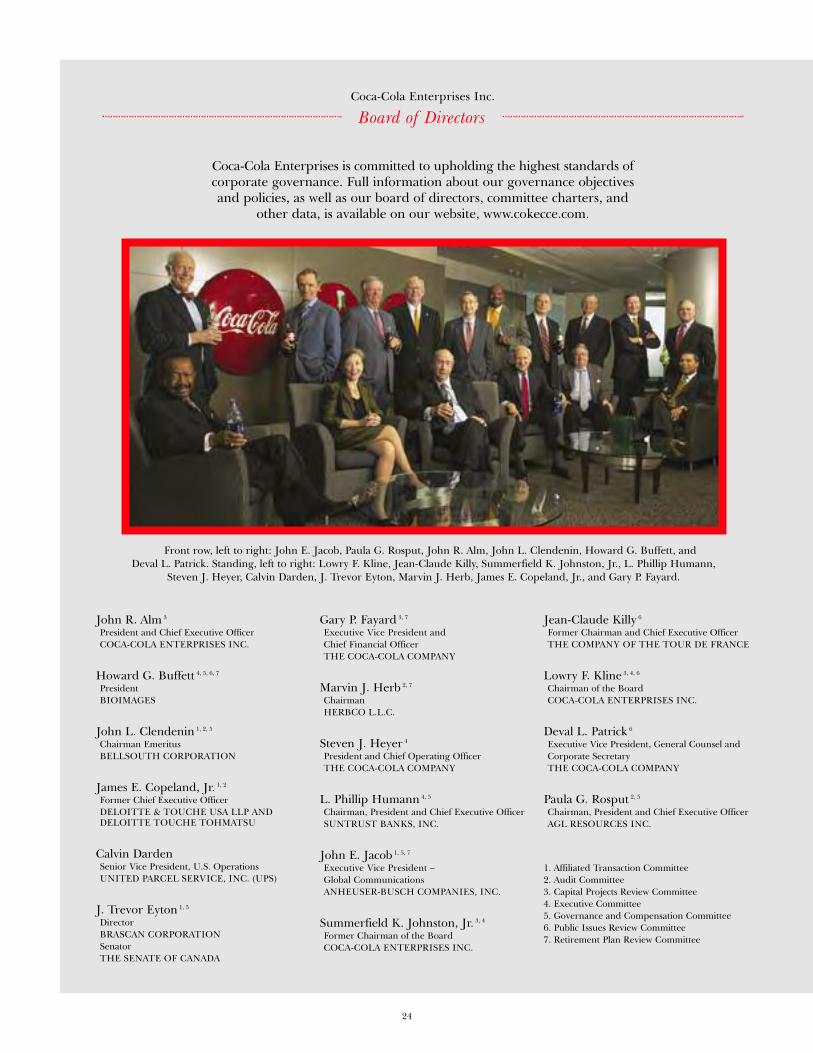
Front row, left to right: John E. Jacob, Paula G. Rosput, John R. Alm, John L. Clendenin, Howard G. Buffett, and Deval L. Patrick. Standing, left to right: Lowry F. Kline, Jean-Claude Killy, Summerfield K. Johnston, Jr., L. Phillip Humann,
Steven J. Heyer, Calvin Darden, J. Trevor Eyton, Marvin J. Herb, James E. Copeland, Jr., and Gary P. Fayard.
John R. Alm 3
President and Chief Executive Officer COCA-COLA ENTERPRISES INC.
Howard G. Buffett 4, 5, 6, 7
President BIOIMAGES
John L. Clendenin 1, 2, 5
Chairman Emeritus BELLSOUTH CORPORATION
James E. Copeland, Jr. 1, 2
Former Chief Executive Officer DELOITTE & TOUCHE USA LLP ANDDELOITTE TOUCHE TOHMATSU
Calvin Darden Senior Vice President, U.S. Operations UNITED PARCEL SERVICE, INC. (UPS)
J. Trevor Eyton 1, 5
DirectorBRASCAN CORPORATION SenatorTHE SENATE OF CANADA
Gary P. Fayard 3, 7
Executive Vice President and Chief Financial Officer THE COCA-COLA COMPANY
Marvin J. Herb 2, 7
ChairmanHERBCO L.L.C.
Steven J. Heyer 4
President and Chief Operating Officer THE COCA-COLA COMPANY
L. Phillip Humann 4, 5
Chairman, President and Chief Executive Officer SUNTRUST BANKS, INC.
John E. Jacob 1, 5, 7
Executive Vice President – Global CommunicationsANHEUSER-BUSCH COMPANIES, INC.
Summerfield K. Johnston, Jr. 3, 4
Former Chairman of the Board COCA-COLA ENTERPRISES INC.
Jean-Claude Killy 6
Former Chairman and Chief Executive Officer THE COMPANY OF THE TOUR DE FRANCE
Lowry F. Kline 3, 4, 6
Chairman of the BoardCOCA-COLA ENTERPRISES INC.
Deval L. Patrick 6
Executive Vice President, General Counsel andCorporate Secretary THE COCA-COLA COMPANY
Paula G. Rosput 2, 5
Chairman, President and Chief Executive Officer AGL RESOURCES INC.
1. Affiliated Transaction Committee2. Audit Committee3. Capital Projects Review Committee4. Executive Committee5. Governance and Compensation Committee6. Public Issues Review Committee7. Retirement Plan Review Committee
Coca-Cola Enterprises is committed to upholding the highest standards ofcorporate governance. Full information about our governance objectivesand policies, as well as our board of directors, committee charters, and
other data, is available on our website, www.cokecce.com.
Board of DirectorsCoca-Cola Enterprises Inc.
25
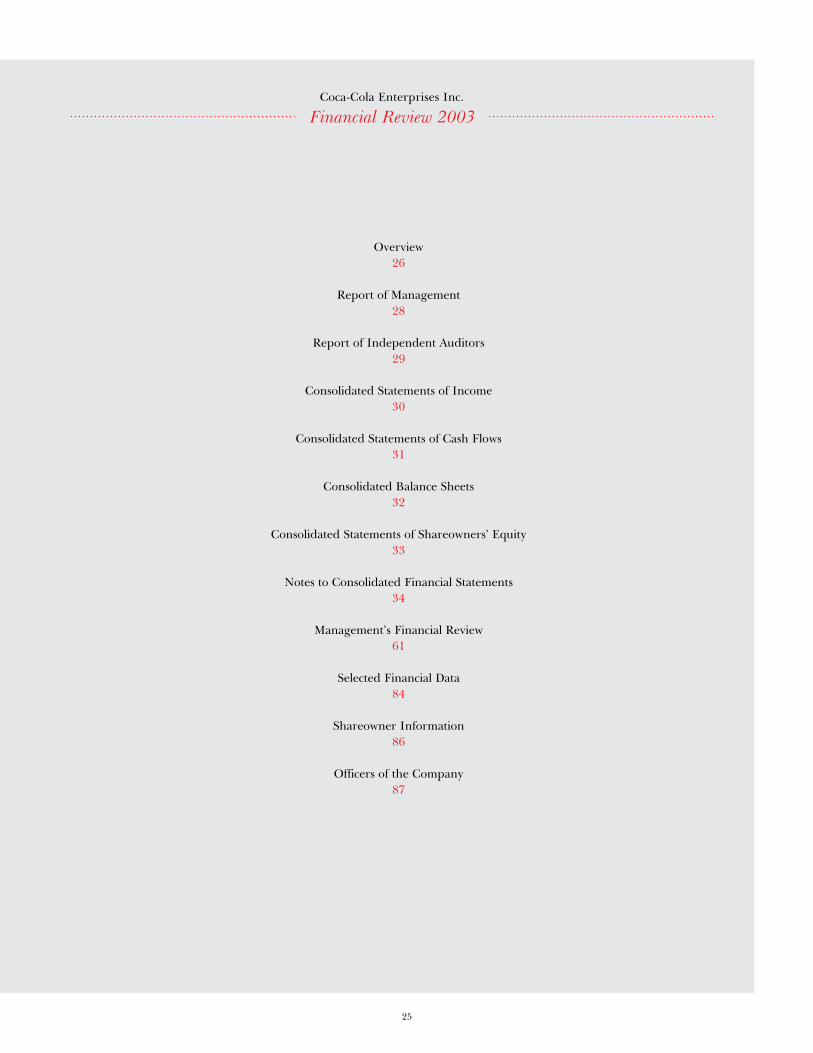
Financial Review 2003Coca-Cola Enterprises Inc.
Overview26
Report of Management28
Report of Independent Auditors 29
Consolidated Statements of Income30
Consolidated Statements of Cash Flows31
Consolidated Balance Sheets32
Consolidated Statements of Shareowners’ Equity 33
Notes to Consolidated Financial Statements34
Management’s Financial Review61
Selected Financial Data84
Shareowner Information86
Officers of the Company87
26
2003 OVERVIEWCoca-Cola Enterprises Inc.’s (CCE) strong financial per-formance continued in 2003. Our net income applicable tocommon shareowners increased to $674 million, or $1.46per diluted common share in 2003, compared to netincome applicable to common shareowners of $491 million,or $1.07 per diluted common share in 2002. We achievedthis improved performance through our strong commit-ment to value creation, including enhanced brand buildingactivities and a clear, company-wide strategy for revenuemanagement. We also benefited from favorable currencyexchange rates and lower interest rates.
Revenue GrowthOur commitment to improved revenue managementresulted in North American pricing growth of 2 percentand European pricing growth of approximately 21⁄2 percentfor the year. Continued innovations in brand extensionsand new packaging resulted in consolidated volumegrowth of 11⁄2 percent with North American volume flatand European volume up 51⁄2 percent.
In North America, growth in diet soft drink brands,strong sales of Dasani, and lemon-lime category growthfrom the introduction of Sprite Remix were offset byslower sales of regular soft drinks and our inability tomatch the strong 2002 volume levels attributable to theintroduction of Vanilla Coke. The North American rein-troduction of diet Cherry Coke and the introduction of diet Vanilla Coke in 2002 re-energized our diet colaportfolio in 2003. The introduction of Sprite Remixwas responsible for a 6 percent increase in volume inthe lemon-lime category for the year. We believe wehave continued to build strong brand equity and arepositioned for volume growth in 2004.
We continued the roll-out of Fridge Pack, a newpackaging design, in our North American territories.Consumers buy more Fridge Packs at higher prices com-pared to our traditional 12-pack packaging because ofthe added value and functionality of the package. Thisadded value is helping our efforts to achieve both volumeand pricing growth over the long term.
European volume grew 51⁄2 percent, primarily due torecord-setting temperatures during the summer monthsand new brand introductions. The European introductionsof diet Coke with lemon in 2002 and diet Vanilla Coke
in 2003 contributed to a 12 percent volume increase inEurope’s diet cola portfolio. The introduction of VanillaCoke in Europe was responsible for a 3 percent increasein volume in Europe’s sugar cola category.
Our European group grew volume in our take-homechannel with a 7 percent increase in 2-liter PET volume.Our European higher margin immediate consumptionbusiness continued to grow with a 4 percent increase in330-ml can volume and a 16 percent increase in 500-mlPET volume.
Expense Management We continued our commitment to closely manage ourcosts and moderate operating expense growth. Our con-tinued commitment to new processes that will ultimatelyimprove our profitability include our ongoing ProjectPinnacle and shared services initiatives.
Project Pinnacle, our multi-year effort to redesignbusiness processes and implement the SAP software plat-form, is progressing favorably in achieving our objectiveof enhancing shareowner value by (i) developing standardglobal processes, (ii) increasing information capabilities,and (iii) providing system flexibility. The project covers allfunctional areas of our business and is staffed with repre-sentatives from both Europe and North America. Our firststage of financial systems and processes implementationwas completed for Canada, along with our supply chainsystem and processes for one of our manufacturing facilitiesin France in fourth quarter 2003. Complete roll-out of financial systems and processes in North America isprojected to occur in the third quarter of 2004. Financialsystems and processes implementation in certain Europeanterritories will commence in the fourth quarter of 2004.We anticipate our implementation of the initial phase willbe executed over multiple years. Including the costs ofour internal resources assigned to the project, we incurredapproximately $113 million in implementation costs during2003, $75 million of which were capital costs. The estimatedcapital costs of this project total approximately $215 millionand we have incurred approximately $115 million ofthat through 2003.
We expect to recover our investment in this project bysustaining lower administrative costs, reducing the com-plexity of our core transaction systems, improving thespeed at which new or enhanced systems are delivered,
OverviewCoca-Cola Enterprises Inc.
27
increasing our information capabilities for customers andsuppliers, and providing flexibility for changes from thebusiness environment with minimal disruptions to ourexisting business.
We continued migration of certain administrative,financial, and accounting functions for all of our NorthAmerican divisions into a single shared services centerlocated in Tampa, Florida. This consolidation hasresulted in improved efficiencies, enhanced consistencyof practices, and improved information delivery fromcommon processes.
Licensee of The Coca-Cola CompanyOur relationship with The Coca-Cola Company (TCCC)has a great impact on our success. We recently participatedin a strategic planning project with TCCC to more closelyalign our businesses. Under this project, we evaluated allaspects of our operations, including all elements of oursupply chain as well as our information services and salesorganizations, to ensure we are effective and efficient inachieving our profitability targets. As a result of the pro-ject, we are pursuing various initiatives going forward tosimplify our relationship with TCCC, make transactionsmore transparent, and better align our economic intereststo enhance our focus on building brand equity.
2004 OUTLOOKOur plans for 2004 are categorized into four key areas ofemphasis we have identified as essential to improve ourbusiness performance.• First, we are working to strengthen our brands. We must
constantly focus on building brand equity and creatingdemand for our brands.
• Secondly, we will improve revenue management, a func-tion of price, brand equity, innovation, and the value wecreate. We have named a chief revenue officer for NorthAmerica to lead our commitment to this initiative.
• Thirdly, we will improve our customer management capa-bilities. We will strive to become an even better partner toour customers, both in terms of service and profitability,and help them grow their businesses as we grow ours.
• Finally, we will become even more efficient and costeffective. The creation of Coca-Cola Bottlers’ Sales andServices Company (CCBSS), our goals under ProjectPinnacle, and the creation of our shared services centerhave all contributed to this initiative in 2003. We willcontinue to identify ways to become more efficient andcost effective as we plan for the future.
We are projecting we will achieve operating income for2004 in a range of $1.56 billion to $1.58 billion as comparedto 2003 comparable operating income of $1.49 billion. Thisexpectation includes the impact of a significant increasein pension expense and difficult growth comparisons inour European territory which will negatively impact 2004growth. We project cash flows from operations will beslightly lower in 2004 than 2003, primarily as a result ofhigher cash taxes as well as the increased pension contri-butions expected to be paid in 2004.
Earnings per diluted common share are expected togrow to a range of $1.42 to $1.46 as compared to 2003comparable earnings per diluted common share of $1.32,excluding the impact of various items. Our overall capitalspending will continue to be managed to approximately6 percent of net operating revenues, for a total of approxi-mately $1.15 billion. Net income is expected to be in therange of $653 million to $672 million.
For North America, our goal is to achieve volumegrowth of approximately 11⁄2 percent and net price percase growth of approximately 21⁄2 percent from our con-tinued emphasis on revenue management. We expectour North American cost of goods per case to increaseapproximately 2 percent including the impact of packagemix shifts and a 2 percent increase in our concentrateprice from TCCC.
For Europe, our goals are volume growth of approxi-mately 11⁄2 percent and 2 percent currency neutral netprice per case growth. We expect our European cost ofgoods per case to increase approximately 2 pecent on acurrency neutral basis including the impact of a 21⁄2 per-cent increase in our concentrate price from TCCC.
Immediately following, the audited financial statementsand related footnotes are presented in accordance withaccounting principles generally accepted in the UnitedStates for your analysis. Following these is Management’sFinancial Review of 2003 and 2002 presenting manage-ment’s discussion and analysis in accordance with thefinancial reporting guidelines and requirements of theSecurities and Exchange Commission.
Coca-Cola Enterprises Inc.
Overview
28
Report of Management
Coca-Cola Enterprises Inc.
Management has prepared the accompanying consolidatedfinancial statements appearing in this Annual Report andis responsible for their integrity and objectivity. The con-solidated financial statements, including amounts that arebased on management’s best estimates and judgment,have been prepared in conformity with accounting prin-ciples generally accepted in the United States and are freeof material misstatement. Management also preparedother information in this Annual Report and is responsi-ble for its accuracy and consistency with the consolidatedfinancial statements.
Management maintains a system of internal accountingcontrols and procedures over financial reporting designedto provide reasonable assurance, at an appropriate cost/benefit relationship, that assets are safeguarded and thattransactions are authorized, recorded, and reported prop-erly. The internal accounting control system is augmentedby a program of internal audits and reviews by manage-ment, written policies and guidelines, careful selectionand training of qualified personnel, and a written Codeof Business Conduct adopted by the Board of Directorsapplicable to all employees of CCE and our subsidiaries.Management believes that our internal accounting controlsprovide reasonable assurance (i) that assets are safeguardedagainst material loss from unauthorized use or disposition
and (ii) that the financial records are reliable for preparingconsolidated financial statements and other data andmaintaining accountability for assets.
The Audit Committee of the Board of Directors, com-posed solely of directors who are not officers of CCE orThe Coca-Cola Company, meets periodically with theindependent auditors, management, and the CCE officerdirecting internal audit to discuss internal accountingcontrol, auditing, and financial reporting matters. TheCommittee reviews with the independent auditors thescope and results of the audit effort. The Committee alsomeets with the independent auditors and our Vice Presidentof Internal Audit, without management present, to ensurethat the independent auditors and our Vice President ofInternal Audit have free access to the Committee.
The independent auditors, Ernst & Young LLP, are hiredby the Audit Committee of the Board of Directors andratified by our shareowners. Ernst & Young LLP is engagedto audit the consolidated financial statements of Coca-ColaEnterprises Inc. and subsidiaries and conduct such tests andrelated procedures as Ernst & Young LLP deems necessaryin conformity with auditing standards generally acceptedin the United States. The opinion of the independentauditors, based upon their audit of the consolidatedfinancial statements, is contained in this Annual Report.
John R. AlmPresident and Chief Executive Officer
Atlanta, GeorgiaFebruary 6, 2004
Patrick J. MannellySenior Vice President and Chief Financial Officer
Rick L. EngumVice President, Controller and Principal Accounting Officer
Financial StatementsAudited
29
Board of Directors, Coca-Cola Enterprises Inc.
We have audited the accompanying consolidated balancesheets of Coca-Cola Enterprises Inc. as of December 31,2003 and 2002, and the related consolidated statementsof income, shareowners’ equity, and cash flows for eachof the three years in the period ended December 31,2003. These financial statements are the responsibility of the Company’s management. Our responsibility is toexpress an opinion on these financial statements basedon our audits.
We conducted our audits in accordance with auditingstandards generally accepted in the United States. Thosestandards require that we plan and perform the audit toobtain reasonable assurance about whether the financialstatements are free of material misstatement. An auditincludes examining, on a test basis, evidence supportingthe amounts and disclosures in the financial statements.An audit also includes assessing the accounting principlesused and significant estimates made by management, aswell as evaluating the overall financial statement presen-tation. We believe our audits provide a reasonable basisfor our opinion.
In our opinion, the consolidated financial statementsreferred to above present fairly, in all material respects, theconsolidated financial position of Coca-Cola EnterprisesInc. at December 31, 2003 and 2002, and the consolidatedresults of its operations and its cash flows for each of thethree years in the period ended December 31, 2003, inconformity with accounting principles generally acceptedin the United States.
As discussed in Note 2 to the consolidated financialstatements, effective January 1, 2001, the Companychanged its method of accounting for certain licensorsupport payments. Also, as discussed in Note 18, theCompany adopted Statement of Financial AccountingStandards No. 142, “Goodwill and Other IntangibleAssets,” effective January 1, 2002.
Atlanta, GeorgiaFebruary 6, 2004
Report of Ernst & Young LLP, Independent AuditorsCoca-Cola Enterprises Inc.
30
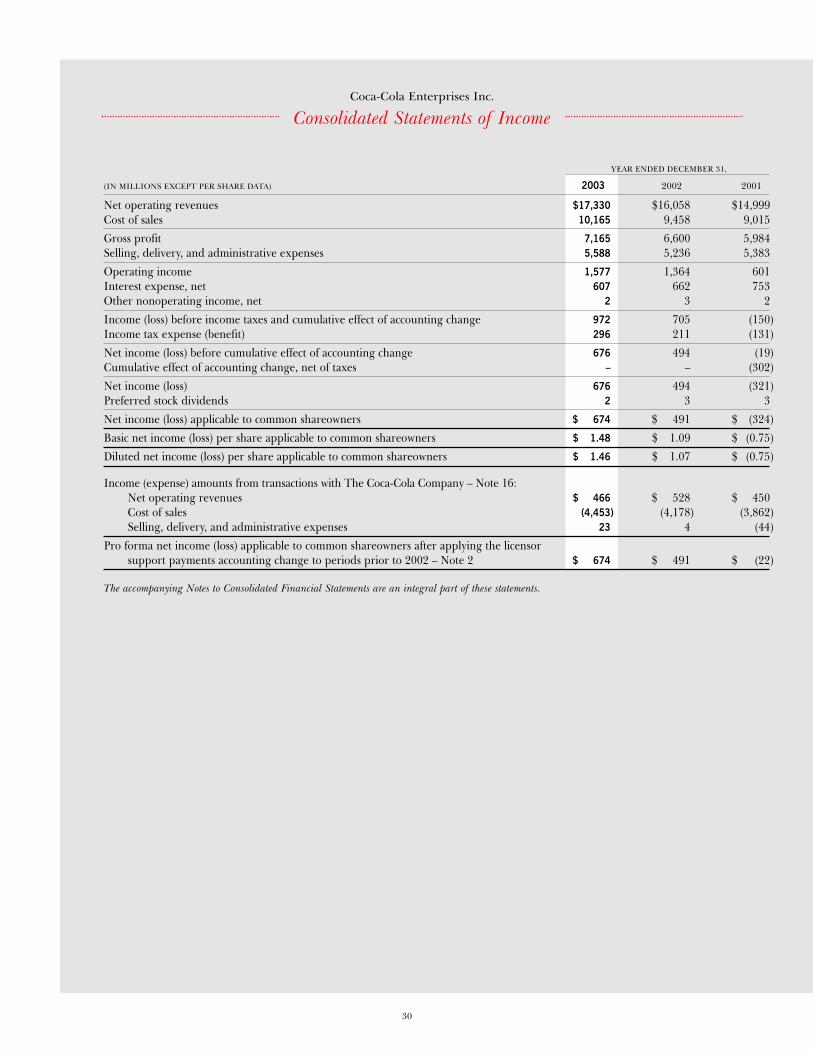
Coca-Cola Enterprises Inc.
YEAR ENDED DECEMBER 31,
(IN MILLIONS EXCEPT PER SHARE DATA) 2003 2002 2001
Net operating revenues $17,330 $16,058 $14,999Cost of sales 10,165 9,458 9,015
Gross profit 7,165 6,600 5,984Selling, delivery, and administrative expenses 5,588 5,236 5,383
Operating income 1,577 1,364 601Interest expense, net 607 662 753Other nonoperating income, net 2 3 2
Income (loss) before income taxes and cumulative effect of accounting change 972 705 (150)Income tax expense (benefit) 296 211 (131)
Net income (loss) before cumulative effect of accounting change 676 494 (19)Cumulative effect of accounting change, net of taxes – – (302)
Net income (loss) 676 494 (321)Preferred stock dividends 2 3 3
Net income (loss) applicable to common shareowners $ 674 $ 491 $ (324)
Basic net income (loss) per share applicable to common shareowners $ 1.48 $ 1.09 $ (0.75)
Diluted net income (loss) per share applicable to common shareowners $ 1.46 $ 1.07 $ (0.75)
Income (expense) amounts from transactions with The Coca-Cola Company – Note 16:Net operating revenues $ 466 $ 528 $ 450Cost of sales (4,453) (4,178) (3,862)Selling, delivery, and administrative expenses 23 4 (44)
Pro forma net income (loss) applicable to common shareowners after applying the licensorsupport payments accounting change to periods prior to 2002 – Note 2 $ 674 $ 491 $ (22)
The accompanying Notes to Consolidated Financial Statements are an integral part of these statements.
Consolidated Statements of Income
31
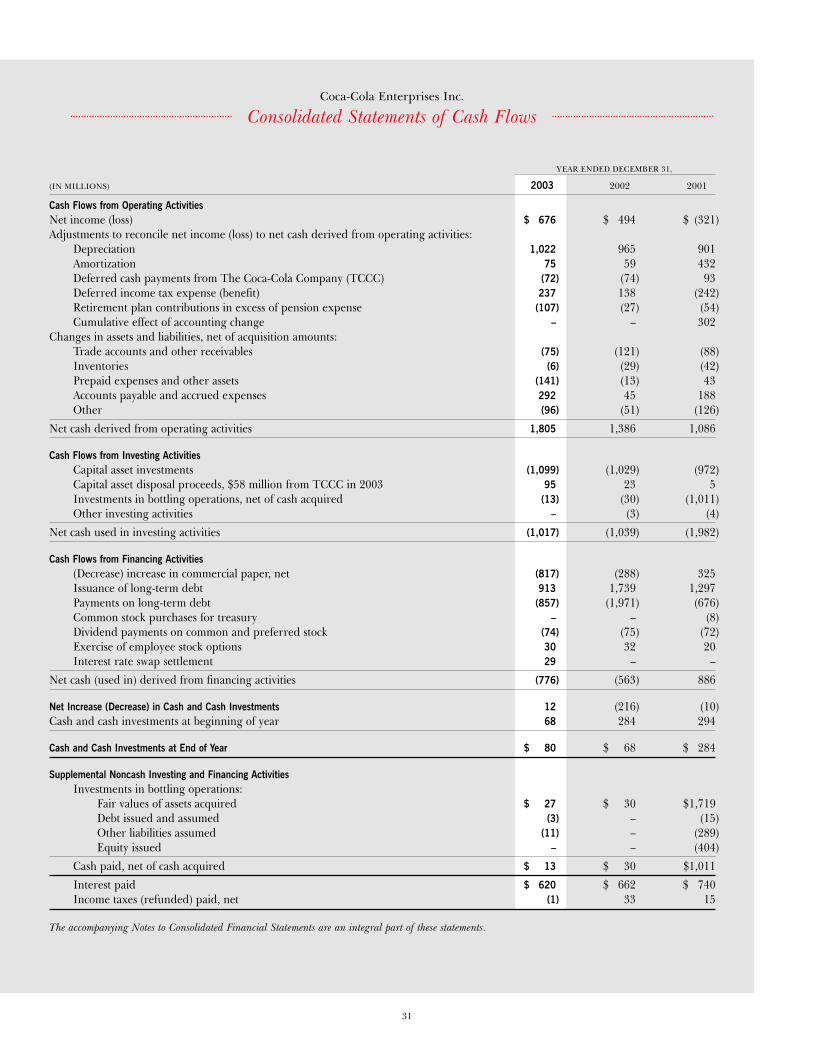
Coca-Cola Enterprises Inc.
YEAR ENDED DECEMBER 31,
(IN MILLIONS) 2003 2002 2001
Cash Flows from Operating ActivitiesNet income (loss) $ 676 $ 494 $ (321)Adjustments to reconcile net income (loss) to net cash derived from operating activities:
Depreciation 1,022 965 901Amortization 75 59 432Deferred cash payments from The Coca-Cola Company (TCCC) (72) (74) 93Deferred income tax expense (benefit) 237 138 (242)Retirement plan contributions in excess of pension expense (107) (27) (54)Cumulative effect of accounting change – – 302
Changes in assets and liabilities, net of acquisition amounts:Trade accounts and other receivables (75) (121) (88)Inventories (6) (29) (42)Prepaid expenses and other assets (141) (13) 43Accounts payable and accrued expenses 292 45 188Other (96) (51) (126)
Net cash derived from operating activities 1,805 1,386 1,086
Cash Flows from Investing ActivitiesCapital asset investments (1,099) (1,029) (972)Capital asset disposal proceeds, $58 million from TCCC in 2003 95 23 5Investments in bottling operations, net of cash acquired (13) (30) (1,011)Other investing activities – (3) (4)
Net cash used in investing activities (1,017) (1,039) (1,982)
Cash Flows from Financing Activities(Decrease) increase in commercial paper, net (817) (288) 325Issuance of long-term debt 913 1,739 1,297Payments on long-term debt (857) (1,971) (676)Common stock purchases for treasury – – (8)Dividend payments on common and preferred stock (74) (75) (72)Exercise of employee stock options 30 32 20Interest rate swap settlement 29 – –
Net cash (used in) derived from financing activities (776) (563) 886
Net Increase (Decrease) in Cash and Cash Investments 12 (216) (10)Cash and cash investments at beginning of year 68 284 294
Cash and Cash Investments at End of Year $ 80 $ 68 $ 284
Supplemental Noncash Investing and Financing ActivitiesInvestments in bottling operations:
Fair values of assets acquired $ 27 $ 30 $1,719Debt issued and assumed (3) – (15)Other liabilities assumed (11) – (289)Equity issued – – (404)
Cash paid, net of cash acquired $ 13 $ 30 $1,011
Interest paid $ 620 $ 662 $ 740Income taxes (refunded) paid, net (1) 33 15
The accompanying Notes to Consolidated Financial Statements are an integral part of these statements.
Consolidated Statements of Cash Flows
32
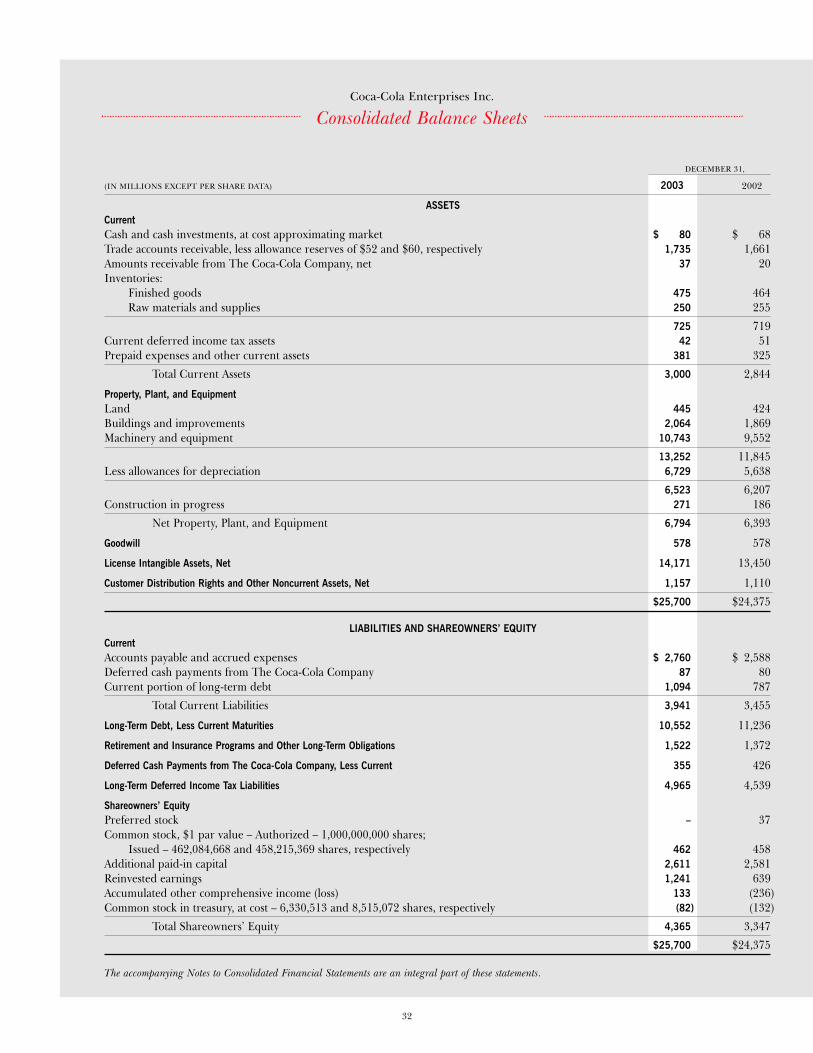
Consolidated Balance SheetsCoca-Cola Enterprises Inc.
DECEMBER 31,
(IN MILLIONS EXCEPT PER SHARE DATA) 2003 2002
ASSETSCurrentCash and cash investments, at cost approximating market $ 80 $ 68Trade accounts receivable, less allowance reserves of $52 and $60, respectively 1,735 1,661Amounts receivable from The Coca-Cola Company, net 37 20Inventories:
Finished goods 475 464Raw materials and supplies 250 255
725 719Current deferred income tax assets 42 51Prepaid expenses and other current assets 381 325
Total Current Assets 3,000 2,844
Property, Plant, and EquipmentLand 445 424Buildings and improvements 2,064 1,869Machinery and equipment 10,743 9,552
13,252 11,845Less allowances for depreciation 6,729 5,638
6,523 6,207Construction in progress 271 186
Net Property, Plant, and Equipment 6,794 6,393
Goodwill 578 578
License Intangible Assets, Net 14,171 13,450
Customer Distribution Rights and Other Noncurrent Assets, Net 1,157 1,110
$25,700 $24,375
LIABILITIES AND SHAREOWNERS’ EQUITYCurrentAccounts payable and accrued expenses $ 2,760 $ 2,588Deferred cash payments from The Coca-Cola Company 87 80Current portion of long-term debt 1,094 787
Total Current Liabilities 3,941 3,455
Long-Term Debt, Less Current Maturities 10,552 11,236
Retirement and Insurance Programs and Other Long-Term Obligations 1,522 1,372
Deferred Cash Payments from The Coca-Cola Company, Less Current 355 426
Long-Term Deferred Income Tax Liabilities 4,965 4,539
Shareowners’ EquityPreferred stock – 37Common stock, $1 par value – Authorized – 1,000,000,000 shares;
Issued – 462,084,668 and 458,215,369 shares, respectively 462 458Additional paid-in capital 2,611 2,581Reinvested earnings 1,241 639Accumulated other comprehensive income (loss) 133 (236)Common stock in treasury, at cost – 6,330,513 and 8,515,072 shares, respectively (82) (132)
Total Shareowners’ Equity 4,365 3,347
$25,700 $24,375
The accompanying Notes to Consolidated Financial Statements are an integral part of these statements.
33
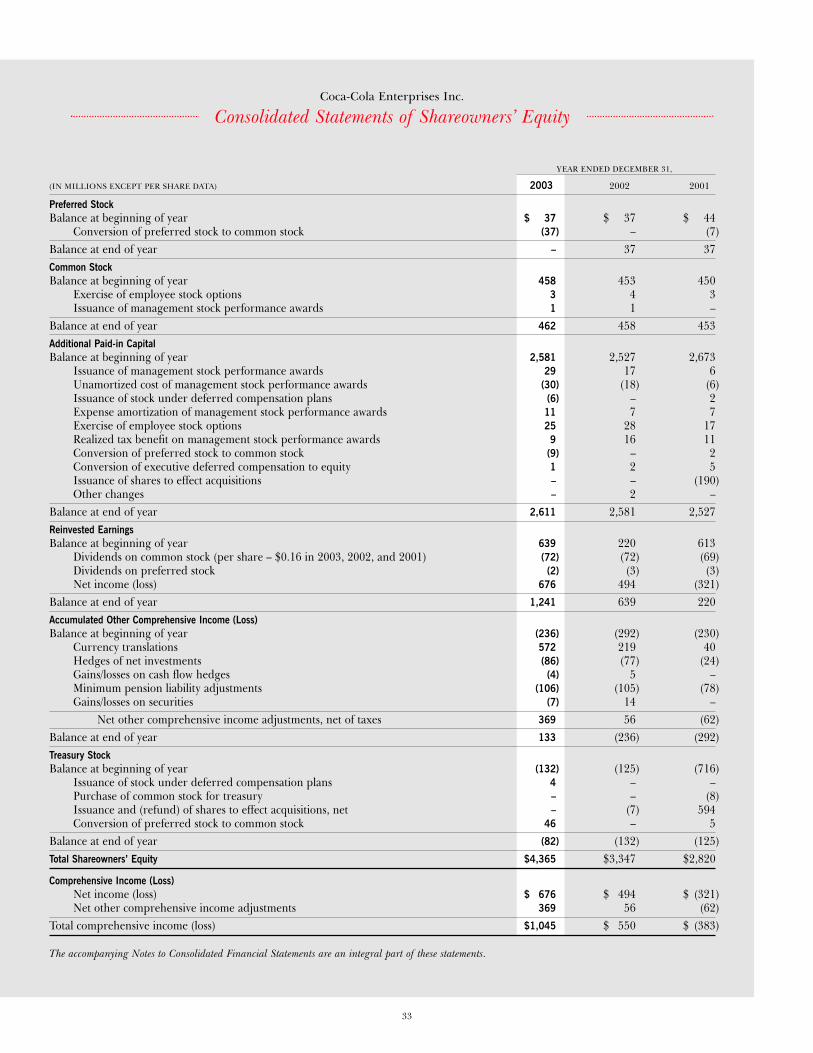
Consolidated Statements of Shareowners’ EquityCoca-Cola Enterprises Inc.
YEAR ENDED DECEMBER 31,
(IN MILLIONS EXCEPT PER SHARE DATA) 2003 2002 2001
Preferred StockBalance at beginning of year $ 37 $ 37 $ 44
Conversion of preferred stock to common stock (37) – (7)Balance at end of year – 37 37Common StockBalance at beginning of year 458 453 450
Exercise of employee stock options 3 4 3Issuance of management stock performance awards 1 1 –
Balance at end of year 462 458 453Additional Paid-in CapitalBalance at beginning of year 2,581 2,527 2,673
Issuance of management stock performance awards 29 17 6Unamortized cost of management stock performance awards (30) (18) (6)Issuance of stock under deferred compensation plans (6) – 2Expense amortization of management stock performance awards 11 7 7Exercise of employee stock options 25 28 17Realized tax benefit on management stock performance awards 9 16 11Conversion of preferred stock to common stock (9) – 2Conversion of executive deferred compensation to equity 1 2 5Issuance of shares to effect acquisitions – – (190)Other changes – 2 –
Balance at end of year 2,611 2,581 2,527Reinvested EarningsBalance at beginning of year 639 220 613
Dividends on common stock (per share – $0.16 in 2003, 2002, and 2001) (72) (72) (69)Dividends on preferred stock (2) (3) (3)Net income (loss) 676 494 (321)
Balance at end of year 1,241 639 220Accumulated Other Comprehensive Income (Loss)Balance at beginning of year (236) (292) (230)
Currency translations 572 219 40Hedges of net investments (86) (77) (24)Gains/losses on cash flow hedges (4) 5 –Minimum pension liability adjustments (106) (105) (78)Gains/losses on securities (7) 14 –
Net other comprehensive income adjustments, net of taxes 369 56 (62)Balance at end of year 133 (236) (292)Treasury StockBalance at beginning of year (132) (125) (716)
Issuance of stock under deferred compensation plans 4 – –Purchase of common stock for treasury – – (8)Issuance and (refund) of shares to effect acquisitions, net – (7) 594Conversion of preferred stock to common stock 46 – 5
Balance at end of year (82) (132) (125)Total Shareowners’ Equity $4,365 $3,347 $2,820
Comprehensive Income (Loss)Net income (loss) $ 676 $ 494 $ (321)Net other comprehensive income adjustments 369 56 (62)
Total comprehensive income (loss) $1,045 $ 550 $ (383)
The accompanying Notes to Consolidated Financial Statements are an integral part of these statements.
34
Note 1SIGNIFICANT ACCOUNTING POLICIESThe Company’s Business: Coca-Cola Enterprises Inc. (“CCE,”“we,” “our,” “us,” or “the Company”) is the world’slargest marketer, distributor, and producer of bottle andcan nonalcoholic beverages. We distribute our bottle andcan products to customers and consumers in the UnitedStates and Canada through license territories in 46 statesin the United States, the District of Columbia, and the10 provinces of Canada. We are also the sole licensedbottler for products of The Coca-Cola Company (TCCC)in Belgium, continental France, Great Britain, Luxembourg,Monaco, and the Netherlands.
Basis of Presentation: The consolidated financial statementsinclude the accounts of CCE and our majority-ownedsubsidiaries. All significant intercompany accounts andtransactions are eliminated in consolidation. Our fiscalyear ends on December 31. For interim quarterly report-ing convenience, we report on the Friday closest to theend of the quarterly calendar period. The financial state-ments and accompanying notes prepared in accordancewith accounting principles generally accepted in the UnitedStates (GAAP) include estimates and assumptions madeby management that affect reported amounts. Actualresults could differ from those estimates.
Reclassifications: Classifications in the 2002 and 2001Consolidated Statements of Income have been conformedto classifications used in the current year under EmergingIssues Task Force (EITF) No. 02-16, “Accounting by aCustomer (Including a Reseller) for Cash ConsiderationReceived from a Vendor.” Upon adoption of EITF 02-16in 2003, we classified the following amounts in the 2002and 2001 income statements as reductions in cost ofsales: approximately $882 million and $651 million ofdirect marketing support from TCCC and other licensorspreviously included in net operating revenues, andapproximately $77 million and $74 million of cold drinkequipment placement funding from TCCC previouslyincluded as a reduction in selling, delivery, and adminis-trative expenses for the years ended December 31, 2002and 2001, respectively. We also classified in net operatingrevenues $51 million and $45 million of net paymentsfor dispensing equipment repair services received from
TCCC, previously included in selling, delivery, andadministrative expenses for the years ended December 31,2002 and 2001, respectively.
Classifications in the 2001 Consolidated Statement ofIncome were also conformed to classifications used in2003 and 2002 under EITF No. 01-09, “Accounting forConsideration Given by a Vendor to a Customer or Resellerof the Vendor’s Products.” EITF 01-09 requires certainpayments made to customers by us, previously classifiedas selling expenses, to be classified as deductions fromrevenue. For 2001, we classified as deductions in netoperating revenues approximately $95 million of pay-ments made to customers, previously classified as selling,delivery, and administrative expenses.
Classifications in the 2002 and 2001 ConsolidatedStatements of Cash Flows have been conformed to classi-fications used in the current year for payments andamortization expense associated with contracts for pouringor vending rights in specific athletic venues, specific schooldistricts, or other locations. Refer to the “MarketingPrograms and Sales Incentives” discussion in Note 1,Significant Accounting Policies, for additional informa-tion on these classifications. In addition, classifications inthe 2002 and 2001 Consolidated Statements of Cash Flowshave been conformed to classifications used in the currentyear for the presentation of retirement plan contributionsin excess of pension expense.
Revenue Recognition: We recognize net revenues from thesale of our products when legal title transfers to the cus-tomer and in the case of full service vending, when wecollect cash from vending machines. We earn servicerevenues for equipment maintenance and productionwhen services are performed.
Cash Investments: Cash investments include all highly liquidinvestments purchased with original maturity dates lessthan three months. The fair value of cash and cashinvestments approximates the amounts shown in thefinancial statements.
Credit Risk and Sale of Accounts Receivable: We sell our productsto chain stores and other customers and extend credit,generally without requiring collateral, based on an evalua-tion of the customer’s financial condition. Potential losseson receivables are dependent on each individual customer’s
NotesCoca-Cola Enterprises Inc.
to Consolidated Financial Statements
35
financial condition and sales adjustments granted after thebalance sheet date. We monitor our exposure to losseson receivables and maintain allowances for potential lossesor adjustments. Our accounts receivable are typically col-lected within approximately 40 days.
We have an agreement in Canada whereby designatedrevolving pools of accounts receivable may be sold withrecourse at a discount to a Canadian special purposetrust. At any given time, the maximum capacity availableunder this agreement is $75 million Canadian dollars(approximately $58 million and $48 million U.S. dollars,at December 31, 2003 and 2002, respectively). AtDecember 31, 2003 and 2002, we had sold the maximumcapacity of receivables available under this agreement,and this amount is excluded from the accompanying balance sheets in accordance with Statement of FinancialAccounting Standards No. 140 (FAS 140), “Accountingfor Transfers and Servicing of Financial Assets andExtinguishment of Liabilities.” We retain collection andadministrative responsibilities for the accounts receivablesold. We believe the benefits of the arrangement morethan offset the cost of retaining servicing responsibilitiesand receiving a discounted payment for the accountsreceivable. Our liability to service the receivables sold isindistinguishable from other collection responsibilitiesand is not separately recorded as a liability. Our recourseliability is limited to the requirement to repurchase anybalance that ceases to be a part of the designated pool.
Inventories: We value our inventories at the lower of cost ormarket. Cost is determined using the first-in, first-out(FIFO) method.
Property, Plant, and Equipment: Property, plant, and equipmentare stated at cost. Depreciation expense is computedusing the straight-line method over the estimated usefullives of 20 to 40 years for buildings and improvements andthree to 20 years for machinery and equipment. Leaseholdimprovements are amortized over the shorter of the asset’slife or the remaining contractual lease term.
Income Taxes: We provide for income taxes under Statementof Financial Accounting Standards No. 109 (FAS 109),“Accounting for Income Taxes.” FAS 109 requires therecognition of deferred tax liabilities and assets for theexpected future tax consequences of temporary differ-ences between the financial statement carrying amountsand the tax bases of assets and liabilities.
License Intangible Assets, Net: License intangible agreementscontain performance requirements and convey to thelicensee the rights to distribute and sell products of thelicensor within specified territories. The majority of ourlicense intangible agreements are perpetual, reflecting along and ongoing relationship with TCCC. Our agree-ments covering our European and Canadian operationsare not perpetual because TCCC does not grant perpetuallicense intangible rights outside the United States. Webelieve these agreements will continue to be renewed ateach expiration date with minimal cost and, therefore,are essentially perpetual.
Before 2002, license intangible assets were amortized ona straight-line basis over 40 years, the maximum periodallowed under GAAP. As of January 1, 2002, under theprovisions of Statement of Financial Accounting StandardsNo. 142 (FAS 142), “Goodwill and Other Intangible Assets,”we no longer amortize our license intangible and goodwillassets. The assets are evaluated for impairment annually,or more frequently if facts and circumstances indicatethey may be impaired. For license intangible assets, theimpairment evaluation involves comparing the estimatedfair values, as determined using estimated future discountedcash flows associated with the asset, to the asset’s carryingamount to determine if a write-down to fair value isrequired. The goodwill asset impairment evaluation involvescomparing the fair value of a reporting unit with its car-rying value, including goodwill. Accumulated licenseintangible amortization amounted to $3,183 million and$3,078 million at December 31, 2003 and 2002, respectively,with the difference between years resulting from theeffects of foreign currency translations.
Insurance Programs: In general, we are self-insured for costs ofworkers’ compensation, casualty, and health and welfareclaims. We use commercial insurance on casualty andworkers’ compensation claims for risk reduction to minimizecatastrophic losses. Workers’ compensation and casualtylosses are estimated using actuarial procedures of theinsurance industry and industry assumptions adjusted forCCE-specific expectations based on historical facts.
Management Stock-Based Compensation Plans: We account forstock-based compensation plans under AccountingPrinciples Board (APB) Opinion No. 25 and relatedInterpretations, as permitted by Statement of FinancialAccounting Standards No. 123 (FAS 123), “Accountingfor Stock-Based Compensation.” As part of our overallmanagement compensation program, we issue stockcompensation awards to key executives and employees.
Coca-Cola Enterprises Inc.
Notes to Consolidated Financial Statements
36
Coca-Cola Enterprises Inc.
Foreign Currency Translations: Assets and liabilities of interna-tional operations are translated from local currencies intoU.S. dollars at the approximate rate of currency exchangeat the end of the fiscal period. Gains and losses from trans-lations of foreign entities are included in accumulated othercomprehensive income (loss) as a component of share-owners’ equity. Revenues and expenses are translated ataverage monthly exchange rates. Transaction gains andlosses arising from exchange rate fluctuations on trans-actions denominated in a currency other than the localfunctional currency are included in results of operations.
Fair Values of Financial Instruments and Derivatives: The fair valuesof financial instruments and derivatives are estimated basedon market rates. The fair values of long-term debt arecalculated based on debt with the same maturities andcredit quality and current market interest rates. The esti-mated fair values of derivative instruments are calculatedbased on market rates. These values represent the estimatedamounts we would receive or pay to terminate agreements,taking into consideration current market rates. Marketconditions and counterparty creditworthiness might alsofactor into the values received or paid should there bean actual unwinding of any of these positions.
Derivative Financial Instruments: We use interest rate swap agree-ments and other risk management instruments to managethe fluctuation of interest rates on our fixed/floating debtportfolio. We also use currency swap agreements, forwardagreements, options, and other risk management instru-ments to minimize the impact of exchange rate changeson our nonfunctional currency cash flows and to protectthe value of our net investments in foreign operations.On January 1, 2001, we adopted Statement of FinancialAccounting Standards No. 133 (FAS 133), “Accountingfor Derivative Instruments and Hedging Activities,” asamended. Upon adoption of this statement, all derivativefinancial instruments in the consolidated financial state-ments are recognized at fair value. We recognized a charge,net of tax, of approximately $26 million in accumulatedother comprehensive income during the first quarter of2001 from the adoption of FAS 133.
Hedges entered into by us can be categorized as fairvalue, cash flow, or net investment hedges. We enter intofair value hedges to mitigate exposure to changes in thefair value of fixed rate debt resulting from fluctuations ininterest rates. Effective changes in the fair values of des-ignated and qualifying fair value hedges are recognized
in earnings as offsets to changes in the fair value of therelated hedged liabilities.
We enter into cash flow hedges to mitigate exposures tochanges in the cash flows attributable to certain forecastedtransactions such as international raw material purchasesand payments on certain foreign currency debt obligations.Changes in the fair value of cash flow hedging instrumentsare recognized in accumulated other comprehensiveincome. Amounts recognized in accumulated other com-prehensive income are then subsequently reversed toearnings in the same periods the forecasted purchases or payments affect earnings. Changes in fair value fromineffectiveness of cash flow hedges are recognized inother nonoperating income, net in the ConsolidatedStatements of Income.
We enter into certain nonfunctional currency borrowingsas net investment hedges of international subsidiaries. We donot hold or issue financial instruments for trading purposes.
Marketing Programs and Sales Incentives: We participate in variousprograms and arrangements with customers to increasethe sale of our products by these customers. Among theprograms negotiated with customers are arrangementsunder which allowances can be earned by the customerfor attaining agreed-upon sales levels and/or for partici-pating in specific marketing programs. Coupon programsand under-the-cap promotions are also developed on aterritory-specific basis with the intent of increasing salesby all customers. The cost of all of these various programs,included as deductions in net operating revenues, totaledapproximately $1,729 million, $1,484 million, and$1,314 million in 2003, 2002, and 2001, respectively.The increase in the cost of these programs is primarilydue to volume increases, the impact of foreign currencytranslation, and our increased focus on improved revenuemanagement in 2003.
Beginning in 2002, all costs associated with customercooperative trade marketing programs (CTM), excludingcertain identified customers, shifted to us, and all costsfor local media programs in North America shifted toTCCC. Net operating revenues, which include allowancesfor CTM, and selling, delivery, and administrative expenses,which included local media expense in 2001, in each casewould have been approximately $46 million lower hadthis arrangement been in place in 2001. The shift of CTMand local media costs impacts income statement compar-isons between 2003, 2002, and 2001. The impact of thisshift on 2003, 2002, and future operating income is
Notes to Consolidated Financial Statements
37
dependent upon the levels of our CTM spending. Webelieve our participation in these programs is essential to ensuring continued volume and revenue growth inthe competitive marketplace.
We also participate in contractual arrangements forpouring or vending rights in specific athletic venues, specificschool districts, or other locations. The net unamortizedbalance of these arrangements at December 31, 2003,included in other noncurrent assets, totaled approximately$536 million (consisting of gross amounts of approximately$922 million net of $386 million in accumulated amorti-zation). Amortization expense on these assets, included asdeductions in net operating revenues, totaled approximately$143 million, $128 million, and $89 million in 2003, 2002,and 2001, respectively. Estimated amortization expense forassets existing at December 31, 2003 for the next five fiscalyears is as follows (in millions): 2004 – $127; 2005 – $115;2006 – $104; 2007 – $92; and 2008 – $79.
At December 31, 2003, the liability associated with thesearrangements totaled approximately $435 million, $99 mil-lion of which is included in accounts payable and accruedexpenses and $336 million of which is included in otherlong-term obligations. Cash payments on these obligationstotaled approximately $82 million, $79 million, and $59 mil-lion in 2003, 2002, and 2001, respectively. Over the nextfive years and thereafter, future payments required underthese contractual arrangements are as follows (in millions):2004 – $99; 2005 – $89; 2006 – $78; 2007 – $105; 2008 –$55; and thereafter – $9. For presentation purposes, amor-tization expense included in the Consolidated Statementsof Cash Flows is reduced by the amount of cash paymentsmade under these arrangements.
Marketing Costs and Support Arrangements: We participate in variousprograms supported by TCCC or other licensors. Underthese programs, certain costs incurred by us are reimbursedby the applicable licensor.
Payments from TCCC and other licensors for marketingprograms and other similar arrangements to promote thesale of products are classified as a reduction of cost of sales.Payments for marketing programs to promote the sale oflicensed products are recognized in cost of sales either inthe period payments are specified for or on a per unit basisover the year as product is sold. Payments for annualmarketing programs are recognized as product is sold;periodic programs are recognized in the periods for whichthey are specified. Support payments from licensorsreceived in connection with market or infrastructuredevelopment are classified as a reduction of cost of sales.
Prior to January 1, 2001, payments from TCCC underthe Jumpstart programs were recognized as an offset toincremental expenses of the programs in the periods thesupport payments were specified for. Effective January 1,2001, with implementation of the change in accountingmethod, infrastructure cost payments from TCCC are recog-nized as cold drink equipment is placed, and over the periodwe have the potential requirement to move equipment.
Note 2CHANGE IN ACCOUNTING METHODAs of January 1, 2001, we changed our method of account-ing for infrastructure development payments received fromTCCC under our cold-drink Jumpstart programs, marketdevelopment programs that began in 1994 designed toaccelerate placements of cold drink equipment.
Under these programs, we received payments fromTCCC for infrastructure development. The Jumpstartagreements specified the periods payments were designatedfor and the amounts of such payments. The agreementsdid not specify which infrastructure costs we were to incuror when the costs were to be incurred, and incurring thosecosts did not give us rights to reimbursement. Prior to thischange, these payments were recognized as an offset tooperating expenses as incurred in the period for which thepayments were designated. We now recognize the paymentsreceived under these programs as we meet the requirementsof the programs. These requirements principally consistof equipment placements in our license territories as wellas potential requirements to move equipment to ensuresufficient sales volumes are achieved during the life ofthe equipment. We changed to this preferred method ofaccounting because it defers recognition of cash paymentsreceived to give accounting recognition to the equipmentplacement requirements and the potential requirementto move equipment under the programs.
The contracts under the programs were amended onoccasion over the period since inception of the programsin 1994, primarily to add additional and acquired licenseterritories. The current agreements require us to placeapproximately 814,000 pieces of cold drink equipmentover the period from 2004 to 2008. There are no addi-tional funding amounts due under the programs.
Under the programs, we agree to: (1) purchase andplace specified numbers of venders/coolers or cold drinkequipment each year through 2008; (2) maintain the equip-ment in service, with certain exceptions, for a period ofat least 12 years after placement; (3) maintain and stock
Coca-Cola Enterprises Inc.
Notes to Consolidated Financial Statements
38
Coca-Cola Enterprises Inc.
the equipment in accordance with specified standardsfor marketing TCCC products; and (4) report to TCCCduring the period the equipment is in service whether,on average the equipment purchased under the programshas generated a stated minimum sales volume of TCCCproducts. Our principal obligation under the programsis to purchase and place equipment. Requirements tomaintain equipment in service for a minimum numberof years, to maintain certain flavor set standards, and toreport volumes are operating standards of CCE per-formed in the normal course of business.
We also agree to relocate equipment if it is not generat-ing sufficient volume to meet the minimum requirements.Movement of the equipment is required only if it isdetermined that, on average, sufficient volume is not beinggenerated and it would help to ensure our performanceunder the programs. It was not necessary to move equip-ment solely to meet this volume requirement through 2003.
Under the agreements, should we fail to meet thecumulative purchase requirements of the programs forany calendar year, the parties agree to mutually developa reasonable solution/alternative. Should no mutuallyagreeable solution be developed, or in the event that weotherwise breach any material obligation under the con-tracts and such breach is not remedied within a statedperiod, then we might be required to repay portions ofthe support funding as determined by formulas. CCE andTCCC have, from time to time, amended the requirementsof the programs after evaluating progress in the market-place and no refunds have ever been paid. The Coca-ColaCompany has agreed we are in compliance with the pro-grams through 2003 and we believe we would in all casesresolve any matters that might arise regarding theseprograms. We believe that the probability of a partial refundof amounts previously paid under the program is remote.
Under the current accounting method, the supportpayments are allocated to equipment units based on perunit funding amounts. The amount allocated to the require-ment to place equipment is the balance remaining afterdetermining the potential cost of moving the equipmentafter placement. The amount allocated to the requirementto place equipment is recognized as the equipment isplaced. The amount allocated to the potential cost ofmoving placed equipment will be recognized on a straight-line basis over the 12-year in-service requirement underthe agreements beginning after the equipment is placed.
The amount allocated to the potential cost of movingplaced equipment was determined based on an estimateof the units of equipment that could potentially be movedafter 2003 and an estimate of the cost of movement. Theestimate of potential move costs is based on potentialmoves of vending equipment serviced by us which doesnot include vending equipment used by third parties andcooler equipment because movement of this equipmentby us is not probable. Significant assumptions and judg-ments made in making the computations included: (1) thepopulation of equipment that could potentially be moved;(2) the costs of moving equipment; (3) requirements of theprograms that are outside our routine operations and couldpotentially be considered material obligations; and (4) theprobability of the assertion of refund rights by TCCC.
We believe the accounting method as outlined aboveis consistent with our rights and performance obligationsunder the programs as it reflects the primary obligationfor equipment placements, the parties’ business relation-ship, and our operating practices.
The change in accounting, as of January 1, 2001, resultedin a noncash cumulative effect adjustment of $(302) mil-lion, net of $185 million in taxes, or $(0.70) per commonshare. The accounting change also decreased incomebefore the cumulative effect in 2001 by approximately$(56) million or $(0.13) per common share. The noncashcumulative effect of the accounting change was determinedbased on: (i) a per-unit funding amount for the total equip-ment placement requirements under the programs, and(ii) applying that amount to the remaining units to beplaced under the contracts as of January 1, 2001. Thecumulative effect adjustment is the after-tax differencebetween the amount of retained earnings at the beginningof 2001 and the amount of retained earnings that wouldhave been reported by us at the beginning of 2001 if thenew accounting method had been applied in years 1994through 2000 under the programs.
At December 31, 2003, $435 million in cash payments aredeferred under the programs. Of this amount, $404 mil-lion will be recognized during the period 2004 through2008 as equipment is placed, and $31 million will be rec-ognized over 12 years after the equipment is placed togive accounting recognition to the potential requirementto move equipment during its useful life.
Pro forma amounts, representing the amounts thatwould have been reported had the current accountingprinciple been applied retroactively to 2001 withoutadjustment for any changes in the business that might
Notes to Consolidated Financial Statements
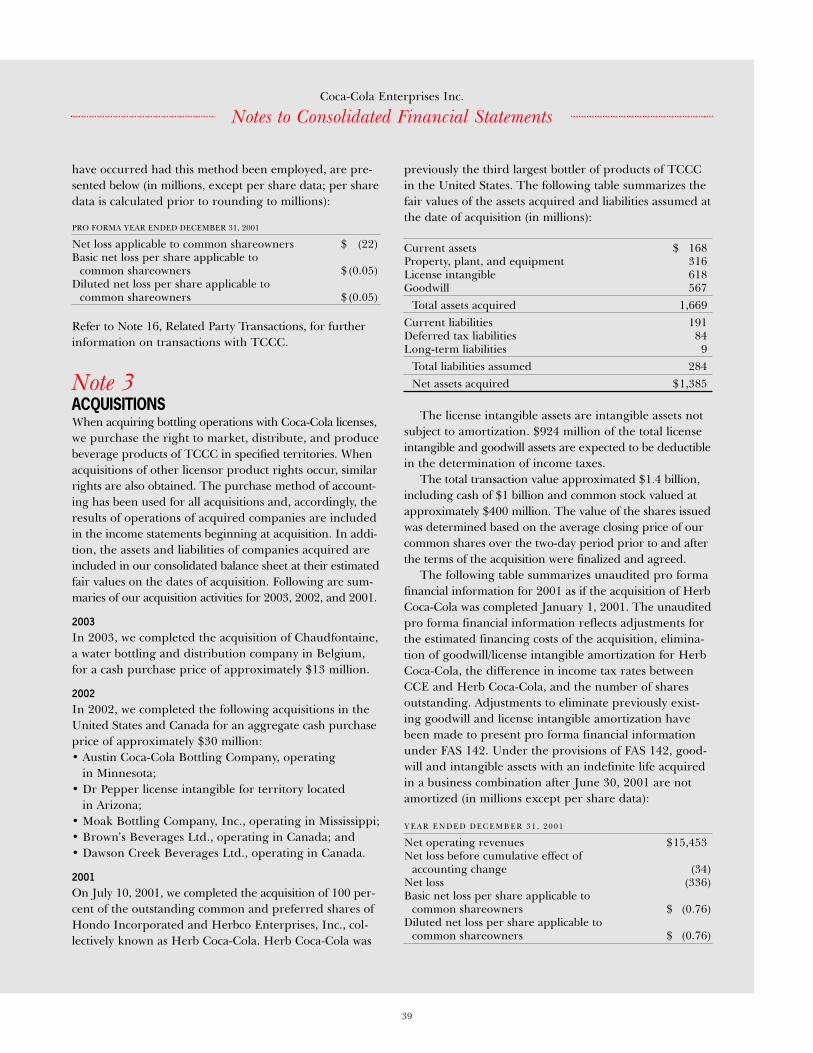
39
have occurred had this method been employed, are pre-sented below (in millions, except per share data; per sharedata is calculated prior to rounding to millions):
PRO FORMA YEAR ENDED DECEMBER 31, 2001
Net loss applicable to common shareowners $ (22)Basic net loss per share applicable to
common shareowners $ (0.05)Diluted net loss per share applicable to
common shareowners $ (0.05)
Refer to Note 16, Related Party Transactions, for furtherinformation on transactions with TCCC.
Note 3ACQUISITIONSWhen acquiring bottling operations with Coca-Cola licenses,we purchase the right to market, distribute, and producebeverage products of TCCC in specified territories. Whenacquisitions of other licensor product rights occur, similarrights are also obtained. The purchase method of account-ing has been used for all acquisitions and, accordingly, theresults of operations of acquired companies are includedin the income statements beginning at acquisition. In addi-tion, the assets and liabilities of companies acquired areincluded in our consolidated balance sheet at their estimatedfair values on the dates of acquisition. Following are sum-maries of our acquisition activities for 2003, 2002, and 2001.
2003In 2003, we completed the acquisition of Chaudfontaine,a water bottling and distribution company in Belgium,for a cash purchase price of approximately $13 million.
2002In 2002, we completed the following acquisitions in theUnited States and Canada for an aggregate cash purchaseprice of approximately $30 million:• Austin Coca-Cola Bottling Company, operating
in Minnesota;• Dr Pepper license intangible for territory located
in Arizona; • Moak Bottling Company, Inc., operating in Mississippi;• Brown’s Beverages Ltd., operating in Canada; and• Dawson Creek Beverages Ltd., operating in Canada.
2001On July 10, 2001, we completed the acquisition of 100 per-cent of the outstanding common and preferred shares ofHondo Incorporated and Herbco Enterprises, Inc., col-lectively known as Herb Coca-Cola. Herb Coca-Cola was
previously the third largest bottler of products of TCCCin the United States. The following table summarizes thefair values of the assets acquired and liabilities assumed atthe date of acquisition (in millions):
Current assets $ 168Property, plant, and equipment 316License intangible 618Goodwill 567
Total assets acquired 1,669Current liabilities 191Deferred tax liabilities 84Long-term liabilities 9
Total liabilities assumed 284Net assets acquired $1,385
The license intangible assets are intangible assets notsubject to amortization. $924 million of the total licenseintangible and goodwill assets are expected to be deductiblein the determination of income taxes.
The total transaction value approximated $1.4 billion,including cash of $1 billion and common stock valued atapproximately $400 million. The value of the shares issuedwas determined based on the average closing price of ourcommon shares over the two-day period prior to and afterthe terms of the acquisition were finalized and agreed.
The following table summarizes unaudited pro formafinancial information for 2001 as if the acquisition of HerbCoca-Cola was completed January 1, 2001. The unauditedpro forma financial information reflects adjustments forthe estimated financing costs of the acquisition, elimina-tion of goodwill/license intangible amortization for HerbCoca-Cola, the difference in income tax rates betweenCCE and Herb Coca-Cola, and the number of sharesoutstanding. Adjustments to eliminate previously exist-ing goodwill and license intangible amortization havebeen made to present pro forma financial informationunder FAS 142. Under the provisions of FAS 142, good-will and intangible assets with an indefinite life acquiredin a business combination after June 30, 2001 are notamortized (in millions except per share data):
YEAR ENDED DECEMBER 31, 2001
Net operating revenues $15,453Net loss before cumulative effect of
accounting change (34)Net loss (336)Basic net loss per share applicable to
common shareowners $ (0.76)Diluted net loss per share applicable to
common shareowners $ (0.76)
Coca-Cola Enterprises Inc.
Notes to Consolidated Financial Statements
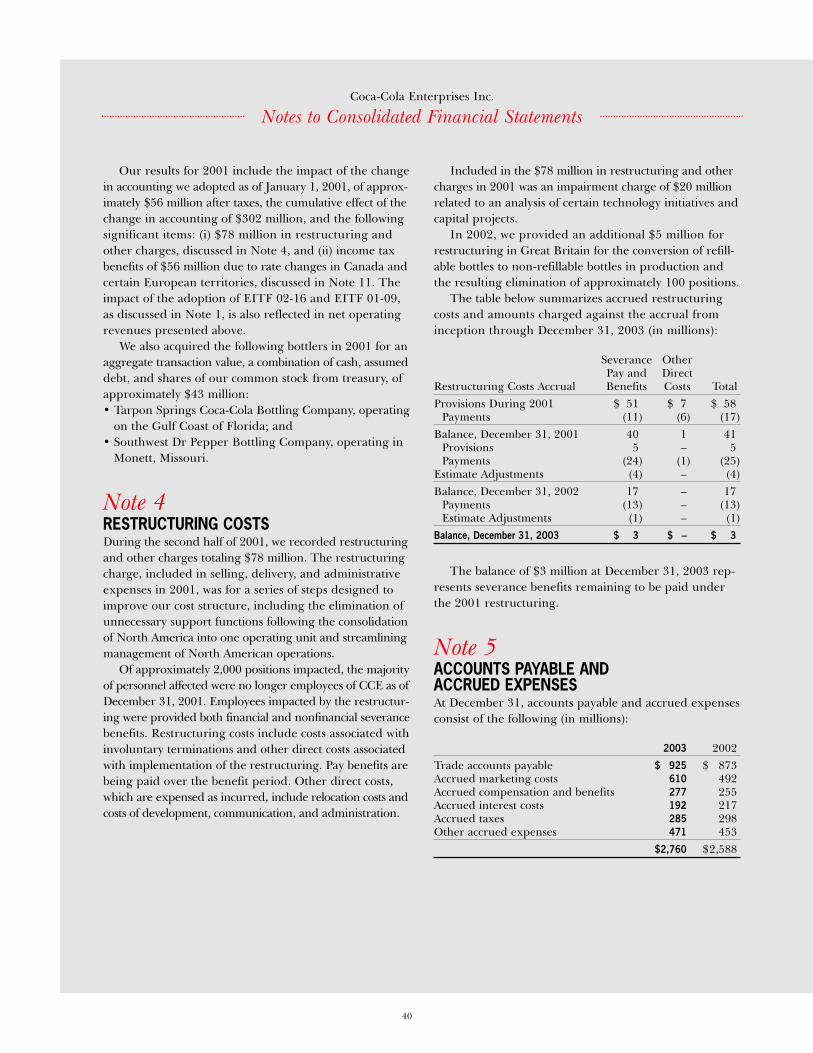
40
Coca-Cola Enterprises Inc.
Our results for 2001 include the impact of the changein accounting we adopted as of January 1, 2001, of approx-imately $56 million after taxes, the cumulative effect of thechange in accounting of $302 million, and the followingsignificant items: (i) $78 million in restructuring andother charges, discussed in Note 4, and (ii) income taxbenefits of $56 million due to rate changes in Canada andcertain European territories, discussed in Note 11. Theimpact of the adoption of EITF 02-16 and EITF 01-09,as discussed in Note 1, is also reflected in net operatingrevenues presented above.
We also acquired the following bottlers in 2001 for anaggregate transaction value, a combination of cash, assumeddebt, and shares of our common stock from treasury, ofapproximately $43 million:• Tarpon Springs Coca-Cola Bottling Company, operating
on the Gulf Coast of Florida; and• Southwest Dr Pepper Bottling Company, operating in
Monett, Missouri.
Note 4RESTRUCTURING COSTSDuring the second half of 2001, we recorded restructuringand other charges totaling $78 million. The restructuringcharge, included in selling, delivery, and administrativeexpenses in 2001, was for a series of steps designed toimprove our cost structure, including the elimination ofunnecessary support functions following the consolidationof North America into one operating unit and streamliningmanagement of North American operations.
Of approximately 2,000 positions impacted, the majorityof personnel affected were no longer employees of CCE as ofDecember 31, 2001. Employees impacted by the restructur-ing were provided both financial and nonfinancial severancebenefits. Restructuring costs include costs associated withinvoluntary terminations and other direct costs associatedwith implementation of the restructuring. Pay benefits arebeing paid over the benefit period. Other direct costs,which are expensed as incurred, include relocation costs andcosts of development, communication, and administration.
Included in the $78 million in restructuring and othercharges in 2001 was an impairment charge of $20 millionrelated to an analysis of certain technology initiatives andcapital projects.
In 2002, we provided an additional $5 million forrestructuring in Great Britain for the conversion of refill-able bottles to non-refillable bottles in production andthe resulting elimination of approximately 100 positions.
The table below summarizes accrued restructuringcosts and amounts charged against the accrual frominception through December 31, 2003 (in millions):
Severance OtherPay and Direct
Restructuring Costs Accrual Benefits Costs TotalProvisions During 2001 $ 51 $ 7 $ 58
Payments (11) (6) (17)Balance, December 31, 2001 40 1 41
Provisions 5 – 5Payments (24) (1) (25)
Estimate Adjustments (4) – (4)Balance, December 31, 2002 17 – 17
Payments (13) – (13)Estimate Adjustments (1) – (1)
Balance, December 31, 2003 $ 3 $ – $ 3
The balance of $3 million at December 31, 2003 rep-resents severance benefits remaining to be paid underthe 2001 restructuring.
Note 5ACCOUNTS PAYABLE AND ACCRUED EXPENSESAt December 31, accounts payable and accrued expensesconsist of the following (in millions):
2003 2002Trade accounts payable $ 925 $ 873Accrued marketing costs 610 492Accrued compensation and benefits 277 255Accrued interest costs 192 217Accrued taxes 285 298Other accrued expenses 471 453
$2,760 $2,588
Notes to Consolidated Financial Statements
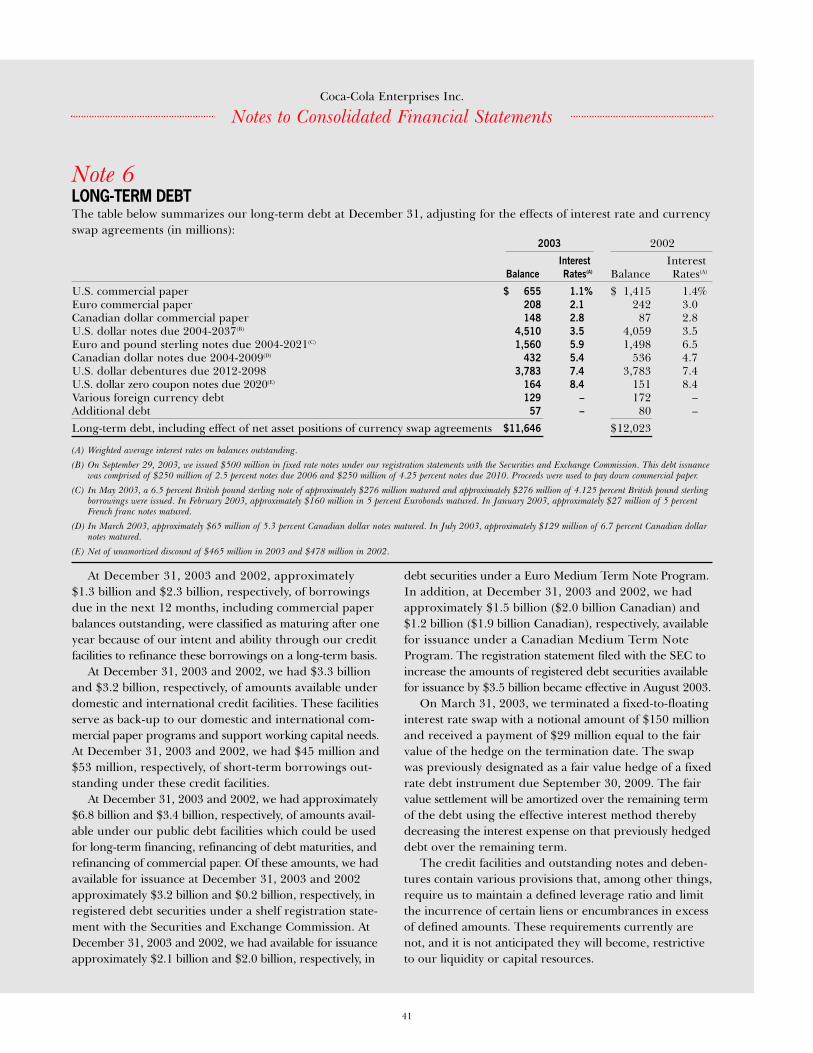
41
Note 6LONG-TERM DEBTThe table below summarizes our long-term debt at December 31, adjusting for the effects of interest rate and currencyswap agreements (in millions):
2003 2002Interest Interest
Balance Rates(A) Balance Rates(A)
U.S. commercial paper $ 655 1.1% $ 1,415 1.4%Euro commercial paper 208 2.1 242 3.0Canadian dollar commercial paper 148 2.8 87 2.8U.S. dollar notes due 2004-2037(B) 4,510 3.5 4,059 3.5Euro and pound sterling notes due 2004-2021(C) 1,560 5.9 1,498 6.5Canadian dollar notes due 2004-2009(D) 432 5.4 536 4.7U.S. dollar debentures due 2012-2098 3,783 7.4 3,783 7.4U.S. dollar zero coupon notes due 2020(E) 164 8.4 151 8.4Various foreign currency debt 129 – 172 –Additional debt 57 – 80 –Long-term debt, including effect of net asset positions of currency swap agreements $11,646 $12,023
(A) Weighted average interest rates on balances outstanding.
(B) On September 29, 2003, we issued $500 million in fixed rate notes under our registration statements with the Securities and Exchange Commission. This debt issuancewas comprised of $250 million of 2.5 percent notes due 2006 and $250 million of 4.25 percent notes due 2010. Proceeds were used to pay down commercial paper.
(C) In May 2003, a 6.5 percent British pound sterling note of approximately $276 million matured and approximately $276 million of 4.125 percent British pound sterlingborrowings were issued. In February 2003, approximately $160 million in 5 percent Eurobonds matured. In January 2003, approximately $27 million of 5 percentFrench franc notes matured.
(D) In March 2003, approximately $65 million of 5.3 percent Canadian dollar notes matured. In July 2003, approximately $129 million of 6.7 percent Canadian dollarnotes matured.
(E) Net of unamortized discount of $465 million in 2003 and $478 million in 2002.
Coca-Cola Enterprises Inc.
Notes to Consolidated Financial Statements
At December 31, 2003 and 2002, approximately$1.3 billion and $2.3 billion, respectively, of borrowingsdue in the next 12 months, including commercial paperbalances outstanding, were classified as maturing after oneyear because of our intent and ability through our creditfacilities to refinance these borrowings on a long-term basis.
At December 31, 2003 and 2002, we had $3.3 billionand $3.2 billion, respectively, of amounts available underdomestic and international credit facilities. These facilitiesserve as back-up to our domestic and international com-mercial paper programs and support working capital needs.At December 31, 2003 and 2002, we had $45 million and$53 million, respectively, of short-term borrowings out-standing under these credit facilities.
At December 31, 2003 and 2002, we had approximately$6.8 billion and $3.4 billion, respectively, of amounts avail-able under our public debt facilities which could be usedfor long-term financing, refinancing of debt maturities, andrefinancing of commercial paper. Of these amounts, we hadavailable for issuance at December 31, 2003 and 2002approximately $3.2 billion and $0.2 billion, respectively, inregistered debt securities under a shelf registration state-ment with the Securities and Exchange Commission. AtDecember 31, 2003 and 2002, we had available for issuanceapproximately $2.1 billion and $2.0 billion, respectively, in
debt securities under a Euro Medium Term Note Program.In addition, at December 31, 2003 and 2002, we hadapproximately $1.5 billion ($2.0 billion Canadian) and$1.2 billion ($1.9 billion Canadian), respectively, availablefor issuance under a Canadian Medium Term NoteProgram. The registration statement filed with the SEC toincrease the amounts of registered debt securities availablefor issuance by $3.5 billion became effective in August 2003.
On March 31, 2003, we terminated a fixed-to-floatinginterest rate swap with a notional amount of $150 millionand received a payment of $29 million equal to the fairvalue of the hedge on the termination date. The swapwas previously designated as a fair value hedge of a fixedrate debt instrument due September 30, 2009. The fairvalue settlement will be amortized over the remaining termof the debt using the effective interest method therebydecreasing the interest expense on that previously hedgeddebt over the remaining term.
The credit facilities and outstanding notes and deben-tures contain various provisions that, among other things,require us to maintain a defined leverage ratio and limitthe incurrence of certain liens or encumbrances in excessof defined amounts. These requirements currently arenot, and it is not anticipated they will become, restrictiveto our liquidity or capital resources.
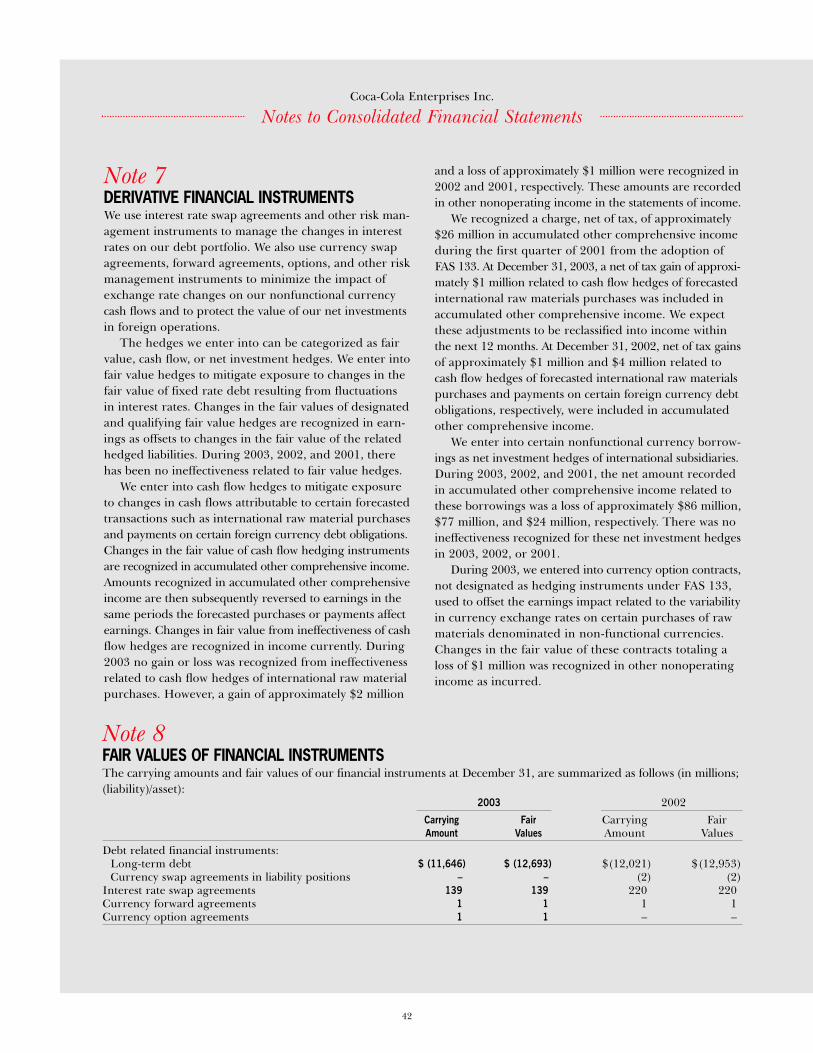
42
Coca-Cola Enterprises Inc.
Note 7DERIVATIVE FINANCIAL INSTRUMENTSWe use interest rate swap agreements and other risk man-agement instruments to manage the changes in interestrates on our debt portfolio. We also use currency swapagreements, forward agreements, options, and other riskmanagement instruments to minimize the impact ofexchange rate changes on our nonfunctional currencycash flows and to protect the value of our net investmentsin foreign operations.
The hedges we enter into can be categorized as fairvalue, cash flow, or net investment hedges. We enter intofair value hedges to mitigate exposure to changes in thefair value of fixed rate debt resulting from fluctuationsin interest rates. Changes in the fair values of designatedand qualifying fair value hedges are recognized in earn-ings as offsets to changes in the fair value of the relatedhedged liabilities. During 2003, 2002, and 2001, therehas been no ineffectiveness related to fair value hedges.
We enter into cash flow hedges to mitigate exposureto changes in cash flows attributable to certain forecastedtransactions such as international raw material purchasesand payments on certain foreign currency debt obligations.Changes in the fair value of cash flow hedging instrumentsare recognized in accumulated other comprehensive income.Amounts recognized in accumulated other comprehensiveincome are then subsequently reversed to earnings in thesame periods the forecasted purchases or payments affectearnings. Changes in fair value from ineffectiveness of cashflow hedges are recognized in income currently. During2003 no gain or loss was recognized from ineffectivenessrelated to cash flow hedges of international raw materialpurchases. However, a gain of approximately $2 million
and a loss of approximately $1 million were recognized in2002 and 2001, respectively. These amounts are recordedin other nonoperating income in the statements of income.
We recognized a charge, net of tax, of approximately$26 million in accumulated other comprehensive incomeduring the first quarter of 2001 from the adoption ofFAS 133. At December 31, 2003, a net of tax gain of approxi-mately $1 million related to cash flow hedges of forecastedinternational raw materials purchases was included inaccumulated other comprehensive income. We expectthese adjustments to be reclassified into income withinthe next 12 months. At December 31, 2002, net of tax gainsof approximately $1 million and $4 million related tocash flow hedges of forecasted international raw materialspurchases and payments on certain foreign currency debtobligations, respectively, were included in accumulatedother comprehensive income.
We enter into certain nonfunctional currency borrow-ings as net investment hedges of international subsidiaries.During 2003, 2002, and 2001, the net amount recordedin accumulated other comprehensive income related tothese borrowings was a loss of approximately $86 million,$77 million, and $24 million, respectively. There was noineffectiveness recognized for these net investment hedgesin 2003, 2002, or 2001.
During 2003, we entered into currency option contracts,not designated as hedging instruments under FAS 133,used to offset the earnings impact related to the variabilityin currency exchange rates on certain purchases of rawmaterials denominated in non-functional currencies.Changes in the fair value of these contracts totaling aloss of $1 million was recognized in other nonoperatingincome as incurred.
Notes to Consolidated Financial Statements
Note 8FAIR VALUES OF FINANCIAL INSTRUMENTSThe carrying amounts and fair values of our financial instruments at December 31, are summarized as follows (in millions;(liability)/asset):
2003 2002Carrying Fair Carrying FairAmount Values Amount Values
Debt related financial instruments:Long-term debt $ (11,646) $ (12,693) $(12,021) $(12,953)Currency swap agreements in liability positions – – (2) (2)
Interest rate swap agreements 139 139 220 220Currency forward agreements 1 1 1 1Currency option agreements 1 1 – –
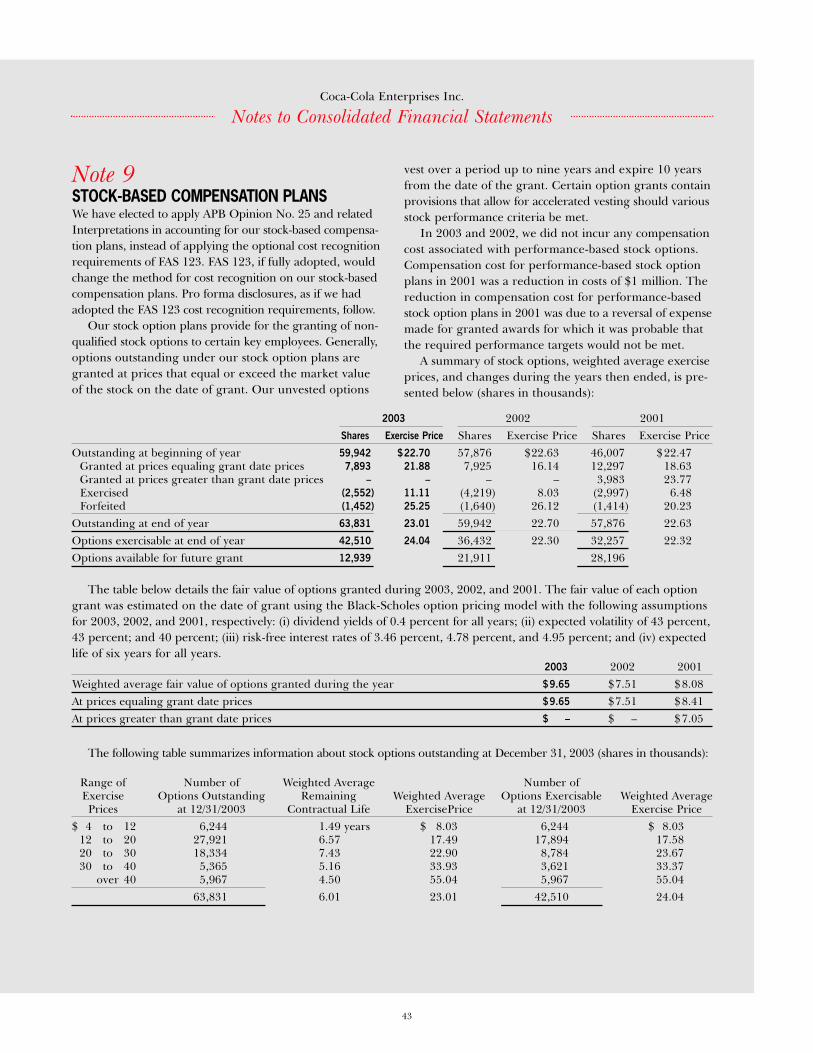
43
Note 9STOCK-BASED COMPENSATION PLANSWe have elected to apply APB Opinion No. 25 and relatedInterpretations in accounting for our stock-based compensa-tion plans, instead of applying the optional cost recognitionrequirements of FAS 123. FAS 123, if fully adopted, wouldchange the method for cost recognition on our stock-basedcompensation plans. Pro forma disclosures, as if we hadadopted the FAS 123 cost recognition requirements, follow.
Our stock option plans provide for the granting of non-qualified stock options to certain key employees. Generally,options outstanding under our stock option plans aregranted at prices that equal or exceed the market valueof the stock on the date of grant. Our unvested options
vest over a period up to nine years and expire 10 yearsfrom the date of the grant. Certain option grants containprovisions that allow for accelerated vesting should variousstock performance criteria be met.
In 2003 and 2002, we did not incur any compensationcost associated with performance-based stock options.Compensation cost for performance-based stock optionplans in 2001 was a reduction in costs of $1 million. Thereduction in compensation cost for performance-basedstock option plans in 2001 was due to a reversal of expensemade for granted awards for which it was probable thatthe required performance targets would not be met.
A summary of stock options, weighted average exerciseprices, and changes during the years then ended, is pre-sented below (shares in thousands):
Coca-Cola Enterprises Inc.
Notes to Consolidated Financial Statements
2003 2002 2001Shares Exercise Price Shares Exercise Price Shares Exercise Price
Outstanding at beginning of year 59,942 $22.70 57,876 $22.63 46,007 $22.47Granted at prices equaling grant date prices 7,893 21.88 7,925 16.14 12,297 18.63Granted at prices greater than grant date prices – – – – 3,983 23.77Exercised (2,552) 11.11 (4,219) 8.03 (2,997) 6.48Forfeited (1,452) 25.25 (1,640) 26.12 (1,414) 20.23
Outstanding at end of year 63,831 23.01 59,942 22.70 57,876 22.63Options exercisable at end of year 42,510 24.04 36,432 22.30 32,257 22.32Options available for future grant 12,939 21,911 28,196
The table below details the fair value of options granted during 2003, 2002, and 2001. The fair value of each optiongrant was estimated on the date of grant using the Black-Scholes option pricing model with the following assumptionsfor 2003, 2002, and 2001, respectively: (i) dividend yields of 0.4 percent for all years; (ii) expected volatility of 43 percent,43 percent; and 40 percent; (iii) risk-free interest rates of 3.46 percent, 4.78 percent, and 4.95 percent; and (iv) expectedlife of six years for all years.
2003 2002 2001Weighted average fair value of options granted during the year $9.65 $7.51 $8.08At prices equaling grant date prices $9.65 $7.51 $8.41At prices greater than grant date prices $ – $ – $7.05
The following table summarizes information about stock options outstanding at December 31, 2003 (shares in thousands):
Range of Number of Weighted Average Number ofExercise Options Outstanding Remaining Weighted Average Options Exercisable Weighted AveragePrices at 12/31/2003 Contractual Life ExercisePrice at 12/31/2003 Exercise Price
$ 4 to 12 6,244 1.49 years $ 8.03 6,244 $ 8.0312 to 20 27,921 6.57 17.49 17,894 17.5820 to 30 18,334 7.43 22.90 8,784 23.6730 to 40 5,365 5.16 33.93 3,621 33.37
over 40 5,967 4.50 55.04 5,967 55.0463,831 6.01 23.01 42,510 24.04
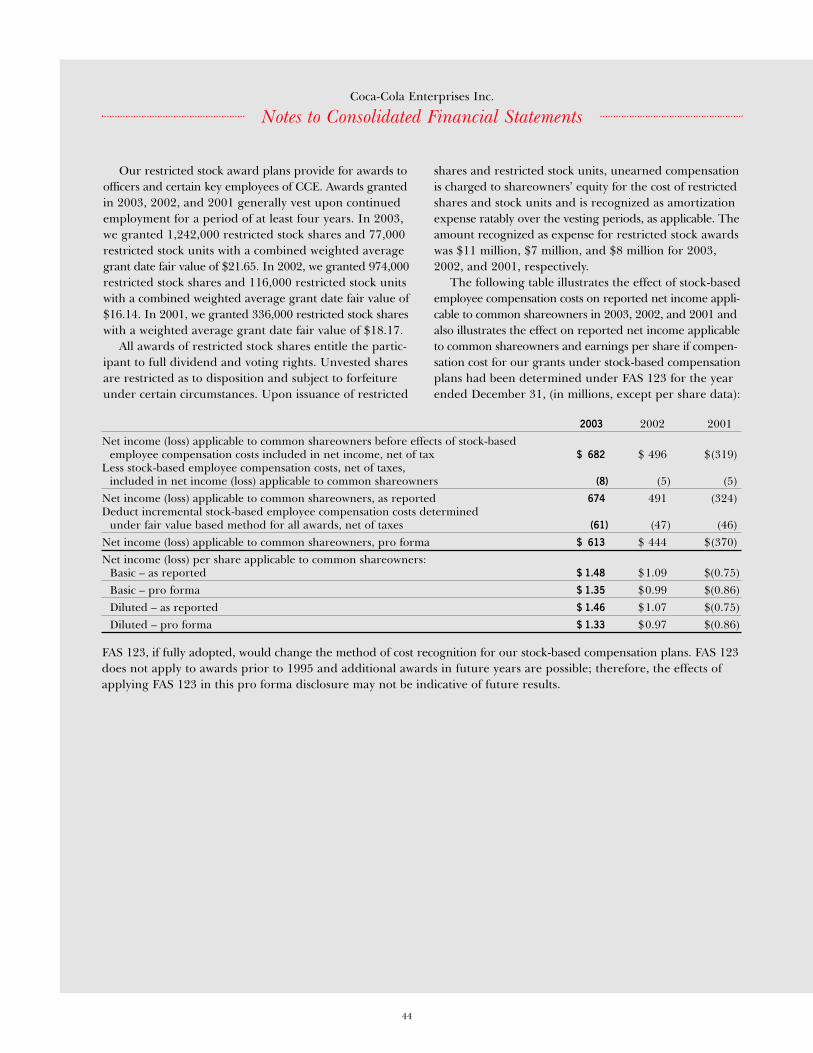
44
Coca-Cola Enterprises Inc.
Our restricted stock award plans provide for awards toofficers and certain key employees of CCE. Awards grantedin 2003, 2002, and 2001 generally vest upon continuedemployment for a period of at least four years. In 2003,we granted 1,242,000 restricted stock shares and 77,000restricted stock units with a combined weighted averagegrant date fair value of $21.65. In 2002, we granted 974,000restricted stock shares and 116,000 restricted stock unitswith a combined weighted average grant date fair value of$16.14. In 2001, we granted 336,000 restricted stock shareswith a weighted average grant date fair value of $18.17.
All awards of restricted stock shares entitle the partic-ipant to full dividend and voting rights. Unvested sharesare restricted as to disposition and subject to forfeitureunder certain circumstances. Upon issuance of restricted
shares and restricted stock units, unearned compensationis charged to shareowners’ equity for the cost of restrictedshares and stock units and is recognized as amortizationexpense ratably over the vesting periods, as applicable. Theamount recognized as expense for restricted stock awardswas $11 million, $7 million, and $8 million for 2003,2002, and 2001, respectively.
The following table illustrates the effect of stock-basedemployee compensation costs on reported net income appli-cable to common shareowners in 2003, 2002, and 2001 andalso illustrates the effect on reported net income applicableto common shareowners and earnings per share if compen-sation cost for our grants under stock-based compensationplans had been determined under FAS 123 for the yearended December 31, (in millions, except per share data):
Notes to Consolidated Financial Statements
2003 2002 2001Net income (loss) applicable to common shareowners before effects of stock-based
employee compensation costs included in net income, net of tax $ 682 $ 496 $(319)Less stock-based employee compensation costs, net of taxes,
included in net income (loss) applicable to common shareowners (8) (5) (5)Net income (loss) applicable to common shareowners, as reported 674 491 (324)Deduct incremental stock-based employee compensation costs determined
under fair value based method for all awards, net of taxes (61) (47) (46)Net income (loss) applicable to common shareowners, pro forma $ 613 $ 444 $(370)Net income (loss) per share applicable to common shareowners:
Basic – as reported $ 1.48 $1.09 $(0.75)Basic – pro forma $ 1.35 $0.99 $(0.86)Diluted – as reported $ 1.46 $1.07 $(0.75)Diluted – pro forma $ 1.33 $0.97 $(0.86)
FAS 123, if fully adopted, would change the method of cost recognition for our stock-based compensation plans. FAS 123does not apply to awards prior to 1995 and additional awards in future years are possible; therefore, the effects ofapplying FAS 123 in this pro forma disclosure may not be indicative of future results.
45
Note 10PENSION AND OTHER POSTRETIREMENT BENEFIT PLANSPension Plans: We sponsor a number of defined benefit pen-sion plans covering substantially all of our employees inNorth America and Europe. Pension plans representing97 percent of benefit obligations at December 31, 2003 aremeasured, as provided in Statement of Financial AccountingStandards No. 87 (FAS 87), “Employers’ Accounting forPensions,” at our selected alternative measurement dateof September 30th, with all other plans measured onDecember 31st.
Other Postretirement Plans: We sponsor unfunded definedbenefit postretirement plans providing healthcare andlife insurance benefits to substantially all U.S. and Canadianemployees who retire or terminate after qualifying for suchbenefits. Retirees of our European Group are coveredprimarily by government-sponsored programs, and thespecific cost to us for those programs and other postre-tirement healthcare is not significant. The primary U.S.postretirement benefit plan is a defined dollar benefit planlimiting the effects of medical inflation by establishingdollar limits for determining our contribution. EffectiveJanuary 1, 2004, our dollar limit has been frozen at fixedrates and will no longer be subject to increases at the lesserof 4.0 percent or the assumed Consumer Price Index (CPI).The assumed CPI rate used to determine the liability forother postretirement plans was 3.0 percent at December 31,2002 and 2001. Because the plan has established dollarlimits for determining our contributions, the effect of a 1 percent increase in the assumed healthcare cost trend rate
is not significant. The Canadian plan also contains provi-sions that limit the effects of inflation on our future costs.
On December 8, 2003, President Bush signed theMedicare Prescription Drug, Improvement andModernization Act of 2003 (“the Act”) into law. The Actexpanded Medicare to include, for the first time, cover-age for prescription drugs. We expect that this legislationmay reduce our costs for some of these programs. At thispoint, our investigation into our response to the legisla-tion is preliminary as we await guidance from variousgovernmental and regulatory agencies concerning therequirements that must be met to obtain these cost reduc-tions as well as the manner in which such savings shouldbe measured. Based on this preliminary analysis, it appearsthat some of our retiree medical plans will need to bechanged to qualify for beneficial treatment under theAct, while other plans may continue unchanged.
Because of various uncertainties related to our responseto this legislation and the appropriate accounting method-ology to be applied for this event, we have elected to deferfinancial recognition of this legislation until the FinancialAccounting Standards Board issues final accounting guid-ance. When issued, that final guidance could require usto change previously reported information. However,since we have already taken steps to limit our postretire-ment medical benefits, any reductions in postretirementbenefit costs resulting from the Act are not expected tobe material. This deferral election is permitted underFinancial Accounting Standards Board Staff Position No. FAS 106-1, “Accounting and Disclosure RequirementsRelated to the Medicare Prescription Drug, Improvementand Modernization Act of 2003.”
Coca-Cola Enterprises Inc.
Notes to Consolidated Financial Statements
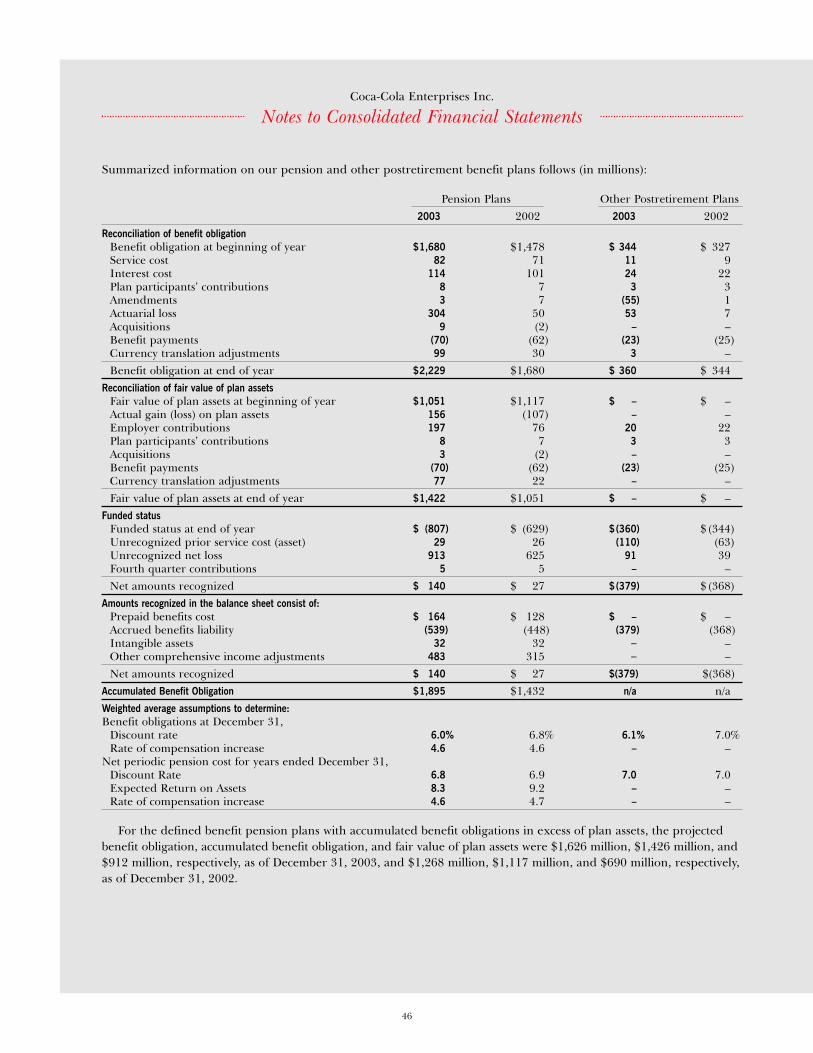
46
Coca-Cola Enterprises Inc.
Notes to Consolidated Financial Statements
Summarized information on our pension and other postretirement benefit plans follows (in millions):
Pension Plans Other Postretirement Plans2003 2002 2003 2002
Reconciliation of benefit obligationBenefit obligation at beginning of year $1,680 $1,478 $ 344 $ 327Service cost 82 71 11 9Interest cost 114 101 24 22Plan participants’ contributions 8 7 3 3Amendments 3 7 (55) 1Actuarial loss 304 50 53 7Acquisitions 9 (2) – –Benefit payments (70) (62) (23) (25)Currency translation adjustments 99 30 3 –Benefit obligation at end of year $2,229 $1,680 $ 360 $ 344
Reconciliation of fair value of plan assetsFair value of plan assets at beginning of year $1,051 $1,117 $ – $ –Actual gain (loss) on plan assets 156 (107) – –Employer contributions 197 76 20 22Plan participants’ contributions 8 7 3 3Acquisitions 3 (2) – –Benefit payments (70) (62) (23) (25)Currency translation adjustments 77 22 – –Fair value of plan assets at end of year $1,422 $1,051 $ – $ –
Funded statusFunded status at end of year $ (807) $ (629) $(360) $ (344)Unrecognized prior service cost (asset) 29 26 (110) (63)Unrecognized net loss 913 625 91 39Fourth quarter contributions 5 5 – –Net amounts recognized $ 140 $ 27 $(379) $ (368)
Amounts recognized in the balance sheet consist of:Prepaid benefits cost $ 164 $ 128 $ – $ –Accrued benefits liability (539) (448) (379) (368)Intangible assets 32 32 – –Other comprehensive income adjustments 483 315 – –Net amounts recognized $ 140 $ 27 $(379) $(368)
Accumulated Benefit Obligation $1,895 $1,432 n/a n/aWeighted average assumptions to determine:Benefit obligations at December 31,
Discount rate 6.0% 6.8% 6.1% 7.0%Rate of compensation increase 4.6 4.6 – –
Net periodic pension cost for years ended December 31,Discount Rate 6.8 6.9 7.0 7.0Expected Return on Assets 8.3 9.2 – –Rate of compensation increase 4.6 4.7 – –
For the defined benefit pension plans with accumulated benefit obligations in excess of plan assets, the projectedbenefit obligation, accumulated benefit obligation, and fair value of plan assets were $1,626 million, $1,426 million, and$912 million, respectively, as of December 31, 2003, and $1,268 million, $1,117 million, and $690 million, respectively,as of December 31, 2002.
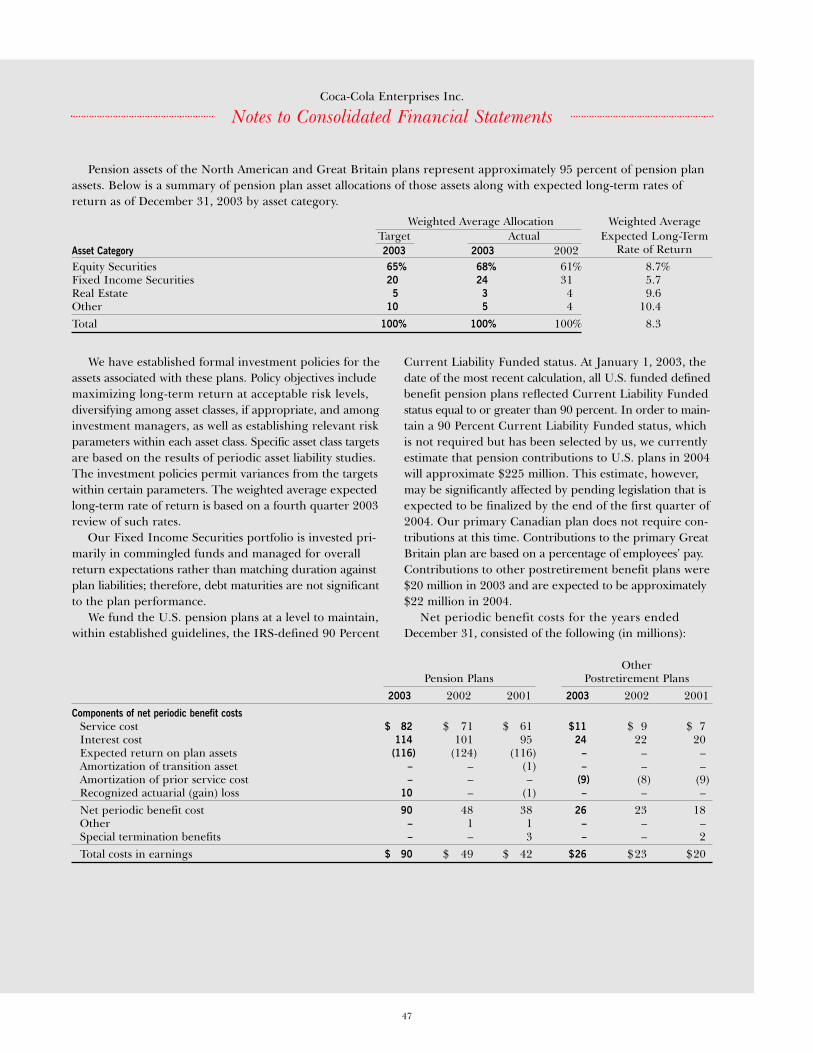
47
Pension assets of the North American and Great Britain plans represent approximately 95 percent of pension planassets. Below is a summary of pension plan asset allocations of those assets along with expected long-term rates ofreturn as of December 31, 2003 by asset category.
Weighted Average Allocation Weighted AverageTarget Actual Expected Long-Term
Asset Category 2003 2003 2002 Rate of ReturnEquity Securities 65% 68% 61% 8.7%Fixed Income Securities 20 24 31 5.7Real Estate 5 3 4 9.6Other 10 5 4 10.4Total 100% 100% 100% 8.3
Coca-Cola Enterprises Inc.
Notes to Consolidated Financial Statements
We have established formal investment policies for theassets associated with these plans. Policy objectives includemaximizing long-term return at acceptable risk levels,diversifying among asset classes, if appropriate, and amonginvestment managers, as well as establishing relevant riskparameters within each asset class. Specific asset class targetsare based on the results of periodic asset liability studies.The investment policies permit variances from the targetswithin certain parameters. The weighted average expectedlong-term rate of return is based on a fourth quarter 2003review of such rates.
Our Fixed Income Securities portfolio is invested pri-marily in commingled funds and managed for overallreturn expectations rather than matching duration againstplan liabilities; therefore, debt maturities are not significantto the plan performance.
We fund the U.S. pension plans at a level to maintain,within established guidelines, the IRS-defined 90 Percent
Current Liability Funded status. At January 1, 2003, thedate of the most recent calculation, all U.S. funded definedbenefit pension plans reflected Current Liability Fundedstatus equal to or greater than 90 percent. In order to main-tain a 90 Percent Current Liability Funded status, whichis not required but has been selected by us, we currentlyestimate that pension contributions to U.S. plans in 2004will approximate $225 million. This estimate, however,may be significantly affected by pending legislation that isexpected to be finalized by the end of the first quarter of2004. Our primary Canadian plan does not require con-tributions at this time. Contributions to the primary GreatBritain plan are based on a percentage of employees’ pay.Contributions to other postretirement benefit plans were$20 million in 2003 and are expected to be approximately$22 million in 2004.
Net periodic benefit costs for the years endedDecember 31, consisted of the following (in millions):
OtherPension Plans Postretirement Plans
2003 2002 2001 2003 2002 2001Components of net periodic benefit costs
Service cost $ 82 $ 71 $ 61 $11 $ 9 $ 7Interest cost 114 101 95 24 22 20Expected return on plan assets (116) (124) (116) – – –Amortization of transition asset – – (1) – – –Amortization of prior service cost – – – (9) (8) (9)Recognized actuarial (gain) loss 10 – (1) – – –Net periodic benefit cost 90 48 38 26 23 18Other – 1 1 – – –Special termination benefits – – 3 – – 2Total costs in earnings $ 90 $ 49 $ 42 $26 $23 $20
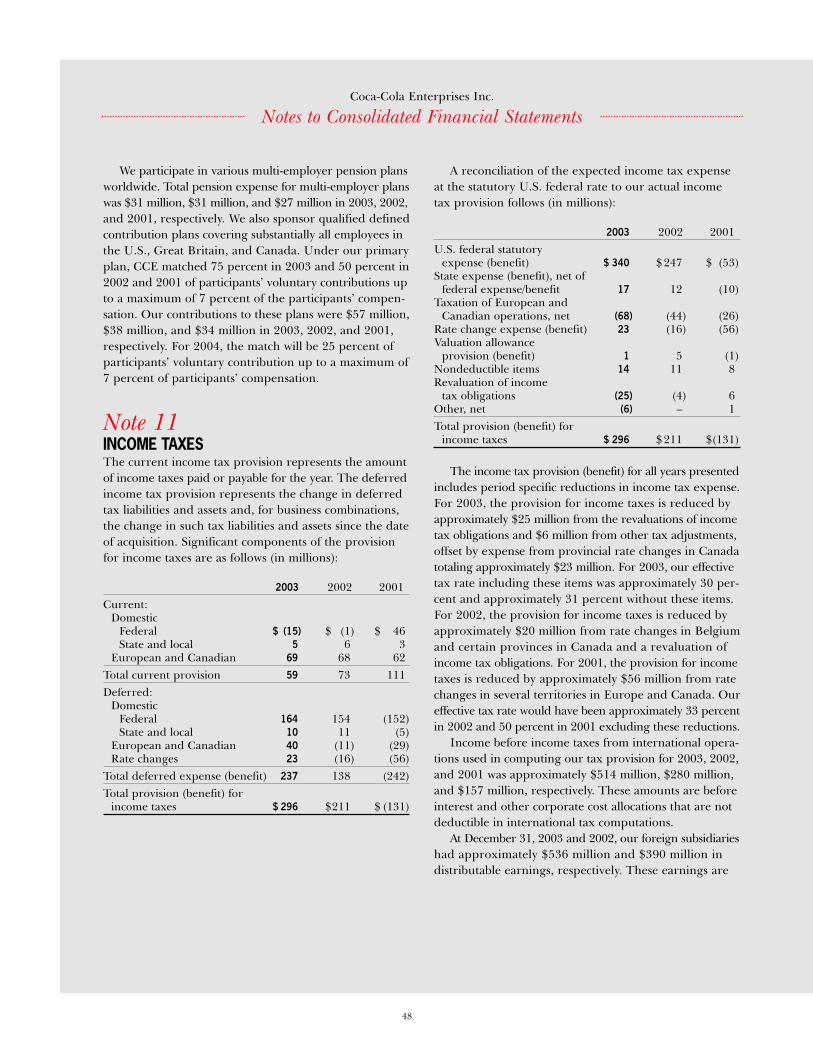
48
Coca-Cola Enterprises Inc.
We participate in various multi-employer pension plansworldwide. Total pension expense for multi-employer planswas $31 million, $31 million, and $27 million in 2003, 2002,and 2001, respectively. We also sponsor qualified definedcontribution plans covering substantially all employees inthe U.S., Great Britain, and Canada. Under our primaryplan, CCE matched 75 percent in 2003 and 50 percent in2002 and 2001 of participants’ voluntary contributions upto a maximum of 7 percent of the participants’ compen-sation. Our contributions to these plans were $57 million,$38 million, and $34 million in 2003, 2002, and 2001,respectively. For 2004, the match will be 25 percent ofparticipants’ voluntary contribution up to a maximum of7 percent of participants’ compensation.
Note 11INCOME TAXESThe current income tax provision represents the amountof income taxes paid or payable for the year. The deferredincome tax provision represents the change in deferredtax liabilities and assets and, for business combinations,the change in such tax liabilities and assets since the dateof acquisition. Significant components of the provisionfor income taxes are as follows (in millions):
2003 2002 2001Current:
DomesticFederal $ (15) $ (1) $ 46State and local 5 6 3
European and Canadian 69 68 62Total current provision 59 73 111Deferred:
DomesticFederal 164 154 (152)State and local 10 11 (5)
European and Canadian 40 (11) (29)Rate changes 23 (16) (56)
Total deferred expense (benefit) 237 138 (242)Total provision (benefit) for
income taxes $ 296 $211 $ (131)
A reconciliation of the expected income tax expenseat the statutory U.S. federal rate to our actual incometax provision follows (in millions):
2003 2002 2001U.S. federal statutory
expense (benefit) $ 340 $247 $ (53)State expense (benefit), net of
federal expense/benefit 17 12 (10)Taxation of European and
Canadian operations, net (68) (44) (26)Rate change expense (benefit) 23 (16) (56)Valuation allowance
provision (benefit) 1 5 (1)Nondeductible items 14 11 8Revaluation of income
tax obligations (25) (4) 6Other, net (6) – 1Total provision (benefit) for
income taxes $ 296 $211 $(131)
The income tax provision (benefit) for all years presentedincludes period specific reductions in income tax expense.For 2003, the provision for income taxes is reduced byapproximately $25 million from the revaluations of incometax obligations and $6 million from other tax adjustments,offset by expense from provincial rate changes in Canadatotaling approximately $23 million. For 2003, our effectivetax rate including these items was approximately 30 per-cent and approximately 31 percent without these items.For 2002, the provision for income taxes is reduced byapproximately $20 million from rate changes in Belgiumand certain provinces in Canada and a revaluation ofincome tax obligations. For 2001, the provision for incometaxes is reduced by approximately $56 million from ratechanges in several territories in Europe and Canada. Oureffective tax rate would have been approximately 33 percentin 2002 and 50 percent in 2001 excluding these reductions.
Income before income taxes from international opera-tions used in computing our tax provision for 2003, 2002,and 2001 was approximately $514 million, $280 million,and $157 million, respectively. These amounts are beforeinterest and other corporate cost allocations that are notdeductible in international tax computations.
At December 31, 2003 and 2002, our foreign subsidiarieshad approximately $536 million and $390 million indistributable earnings, respectively. These earnings are
Notes to Consolidated Financial Statements
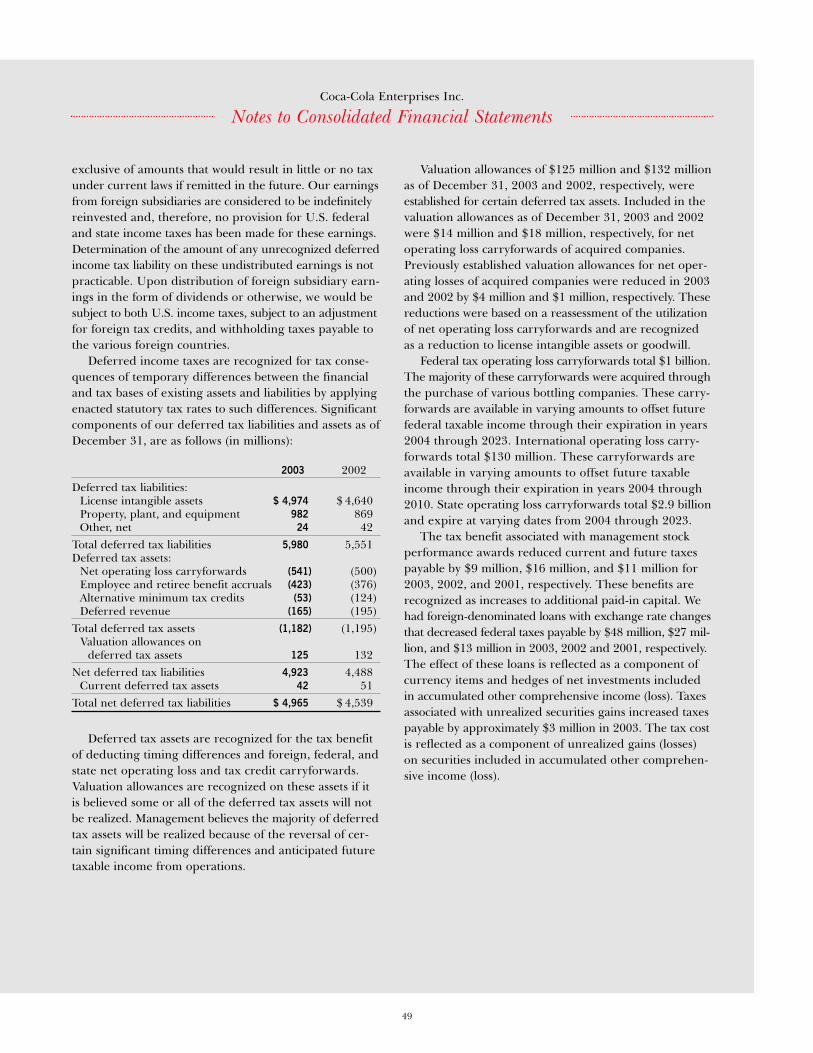
49
exclusive of amounts that would result in little or no taxunder current laws if remitted in the future. Our earningsfrom foreign subsidiaries are considered to be indefinitelyreinvested and, therefore, no provision for U.S. federaland state income taxes has been made for these earnings.Determination of the amount of any unrecognized deferredincome tax liability on these undistributed earnings is notpracticable. Upon distribution of foreign subsidiary earn-ings in the form of dividends or otherwise, we would besubject to both U.S. income taxes, subject to an adjustmentfor foreign tax credits, and withholding taxes payable tothe various foreign countries.
Deferred income taxes are recognized for tax conse-quences of temporary differences between the financialand tax bases of existing assets and liabilities by applyingenacted statutory tax rates to such differences. Significantcomponents of our deferred tax liabilities and assets as ofDecember 31, are as follows (in millions):
2003 2002Deferred tax liabilities:
License intangible assets $ 4,974 $ 4,640Property, plant, and equipment 982 869Other, net 24 42
Total deferred tax liabilities 5,980 5,551Deferred tax assets:
Net operating loss carryforwards (541) (500)Employee and retiree benefit accruals (423) (376)Alternative minimum tax credits (53) (124)Deferred revenue (165) (195)
Total deferred tax assets (1,182) (1,195)Valuation allowances on
deferred tax assets 125 132Net deferred tax liabilities 4,923 4,488
Current deferred tax assets 42 51Total net deferred tax liabilities $ 4,965 $ 4,539
Deferred tax assets are recognized for the tax benefitof deducting timing differences and foreign, federal, andstate net operating loss and tax credit carryforwards.Valuation allowances are recognized on these assets if itis believed some or all of the deferred tax assets will notbe realized. Management believes the majority of deferredtax assets will be realized because of the reversal of cer-tain significant timing differences and anticipated futuretaxable income from operations.
Valuation allowances of $125 million and $132 millionas of December 31, 2003 and 2002, respectively, wereestablished for certain deferred tax assets. Included in thevaluation allowances as of December 31, 2003 and 2002were $14 million and $18 million, respectively, for netoperating loss carryforwards of acquired companies.Previously established valuation allowances for net oper-ating losses of acquired companies were reduced in 2003and 2002 by $4 million and $1 million, respectively. Thesereductions were based on a reassessment of the utilizationof net operating loss carryforwards and are recognizedas a reduction to license intangible assets or goodwill.
Federal tax operating loss carryforwards total $1 billion.The majority of these carryforwards were acquired throughthe purchase of various bottling companies. These carry-forwards are available in varying amounts to offset futurefederal taxable income through their expiration in years2004 through 2023. International operating loss carry-forwards total $130 million. These carryforwards areavailable in varying amounts to offset future taxableincome through their expiration in years 2004 through2010. State operating loss carryforwards total $2.9 billionand expire at varying dates from 2004 through 2023.
The tax benefit associated with management stockperformance awards reduced current and future taxespayable by $9 million, $16 million, and $11 million for2003, 2002, and 2001, respectively. These benefits arerecognized as increases to additional paid-in capital. Wehad foreign-denominated loans with exchange rate changesthat decreased federal taxes payable by $48 million, $27 mil-lion, and $13 million in 2003, 2002 and 2001, respectively.The effect of these loans is reflected as a component ofcurrency items and hedges of net investments includedin accumulated other comprehensive income (loss). Taxesassociated with unrealized securities gains increased taxespayable by approximately $3 million in 2003. The tax costis reflected as a component of unrealized gains (losses)on securities included in accumulated other comprehen-sive income (loss).
Coca-Cola Enterprises Inc.
Notes to Consolidated Financial Statements
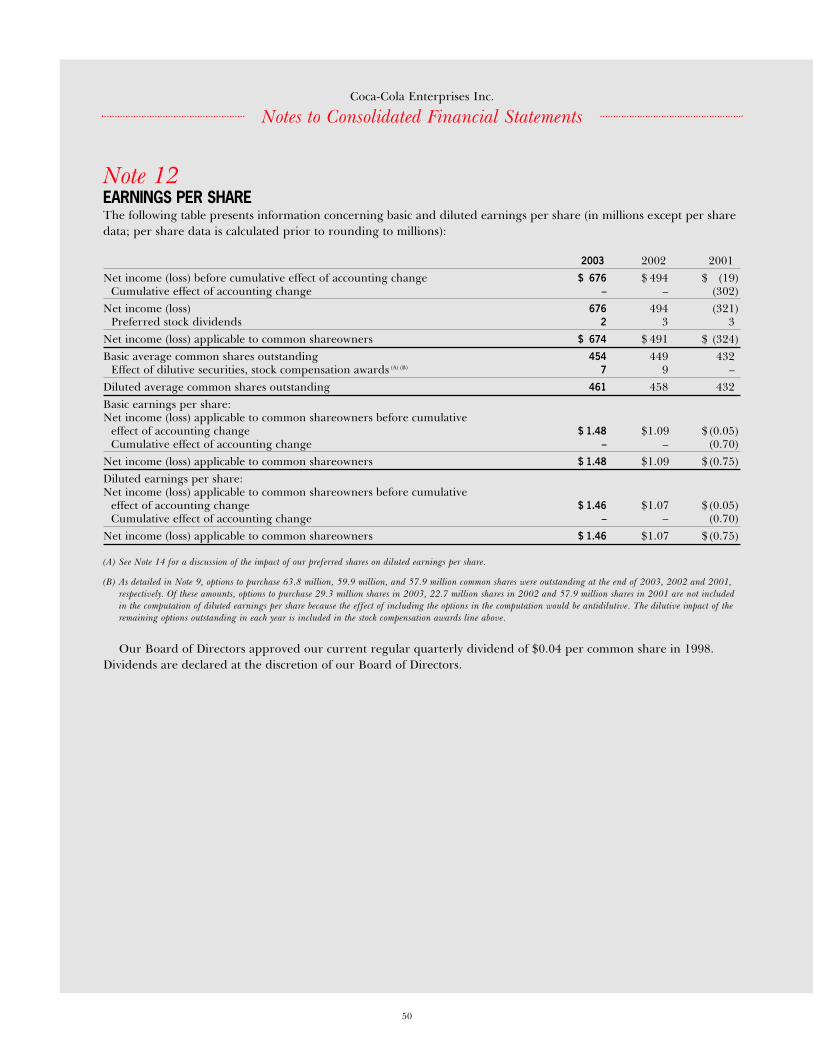
50
Coca-Cola Enterprises Inc.
Note 12EARNINGS PER SHAREThe following table presents information concerning basic and diluted earnings per share (in millions except per sharedata; per share data is calculated prior to rounding to millions):
2003 2002 2001Net income (loss) before cumulative effect of accounting change $ 676 $ 494 $ (19)
Cumulative effect of accounting change – – (302)Net income (loss) 676 494 (321)
Preferred stock dividends 2 3 3Net income (loss) applicable to common shareowners $ 674 $ 491 $ (324)Basic average common shares outstanding 454 449 432
Effect of dilutive securities, stock compensation awards (A) (B) 7 9 –Diluted average common shares outstanding 461 458 432Basic earnings per share:Net income (loss) applicable to common shareowners before cumulative
effect of accounting change $ 1.48 $1.09 $ (0.05)Cumulative effect of accounting change – – (0.70)
Net income (loss) applicable to common shareowners $ 1.48 $1.09 $ (0.75)Diluted earnings per share:Net income (loss) applicable to common shareowners before cumulative
effect of accounting change $ 1.46 $1.07 $ (0.05)Cumulative effect of accounting change – – (0.70)
Net income (loss) applicable to common shareowners $ 1.46 $1.07 $ (0.75)
(A) See Note 14 for a discussion of the impact of our preferred shares on diluted earnings per share.
(B) As detailed in Note 9, options to purchase 63.8 million, 59.9 million, and 57.9 million common shares were outstanding at the end of 2003, 2002 and 2001,respectively. Of these amounts, options to purchase 29.3 million shares in 2003, 22.7 million shares in 2002 and 57.9 million shares in 2001 are not includedin the computation of diluted earnings per share because the effect of including the options in the computation would be antidilutive. The dilutive impact of theremaining options outstanding in each year is included in the stock compensation awards line above.
Our Board of Directors approved our current regular quarterly dividend of $0.04 per common share in 1998.Dividends are declared at the discretion of our Board of Directors.
Notes to Consolidated Financial Statements
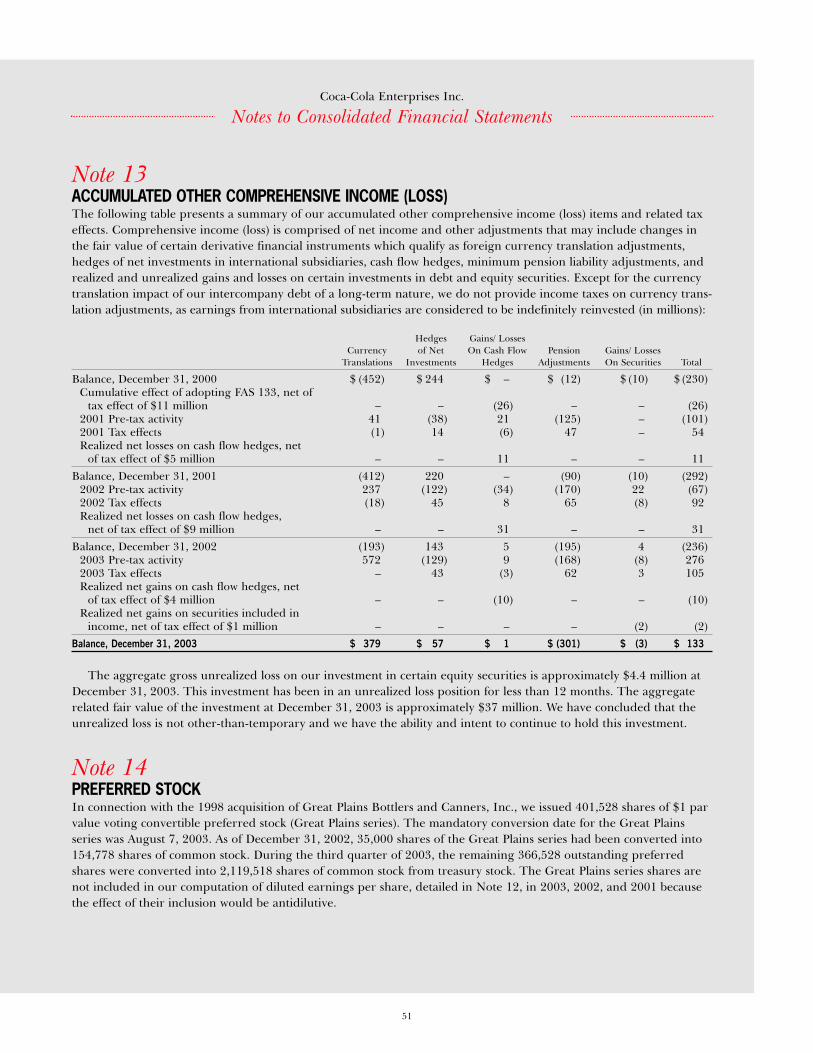
51
Note 13ACCUMULATED OTHER COMPREHENSIVE INCOME (LOSS)The following table presents a summary of our accumulated other comprehensive income (loss) items and related taxeffects. Comprehensive income (loss) is comprised of net income and other adjustments that may include changes inthe fair value of certain derivative financial instruments which qualify as foreign currency translation adjustments,hedges of net investments in international subsidiaries, cash flow hedges, minimum pension liability adjustments, andrealized and unrealized gains and losses on certain investments in debt and equity securities. Except for the currencytranslation impact of our intercompany debt of a long-term nature, we do not provide income taxes on currency trans-lation adjustments, as earnings from international subsidiaries are considered to be indefinitely reinvested (in millions):
Hedges Gains/ LossesCurrency of Net On Cash Flow Pension Gains/ Losses
Translations Investments Hedges Adjustments On Securities Total
Balance, December 31, 2000 $ (452) $ 244 $ – $ (12) $ (10) $ (230)Cumulative effect of adopting FAS 133, net of
tax effect of $11 million – – (26) – – (26)2001 Pre-tax activity 41 (38) 21 (125) – (101)2001 Tax effects (1) 14 (6) 47 – 54Realized net losses on cash flow hedges, net
of tax effect of $5 million – – 11 – – 11Balance, December 31, 2001 (412) 220 – (90) (10) (292)
2002 Pre-tax activity 237 (122) (34) (170) 22 (67)2002 Tax effects (18) 45 8 65 (8) 92Realized net losses on cash flow hedges,
net of tax effect of $9 million – – 31 – – 31Balance, December 31, 2002 (193) 143 5 (195) 4 (236)
2003 Pre-tax activity 572 (129) 9 (168) (8) 2762003 Tax effects – 43 (3) 62 3 105Realized net gains on cash flow hedges, net
of tax effect of $4 million – – (10) – – (10)Realized net gains on securities included in
income, net of tax effect of $1 million – – – – (2) (2)Balance, December 31, 2003 $ 379 $ 57 $ 1 $ (301) $ (3) $ 133
The aggregate gross unrealized loss on our investment in certain equity securities is approximately $4.4 million atDecember 31, 2003. This investment has been in an unrealized loss position for less than 12 months. The aggregaterelated fair value of the investment at December 31, 2003 is approximately $37 million. We have concluded that theunrealized loss is not other-than-temporary and we have the ability and intent to continue to hold this investment.
Note 14PREFERRED STOCKIn connection with the 1998 acquisition of Great Plains Bottlers and Canners, Inc., we issued 401,528 shares of $1 parvalue voting convertible preferred stock (Great Plains series). The mandatory conversion date for the Great Plainsseries was August 7, 2003. As of December 31, 2002, 35,000 shares of the Great Plains series had been converted into154,778 shares of common stock. During the third quarter of 2003, the remaining 366,528 outstanding preferredshares were converted into 2,119,518 shares of common stock from treasury stock. The Great Plains series shares arenot included in our computation of diluted earnings per share, detailed in Note 12, in 2003, 2002, and 2001 becausethe effect of their inclusion would be antidilutive.
Coca-Cola Enterprises Inc.
Notes to Consolidated Financial Statements
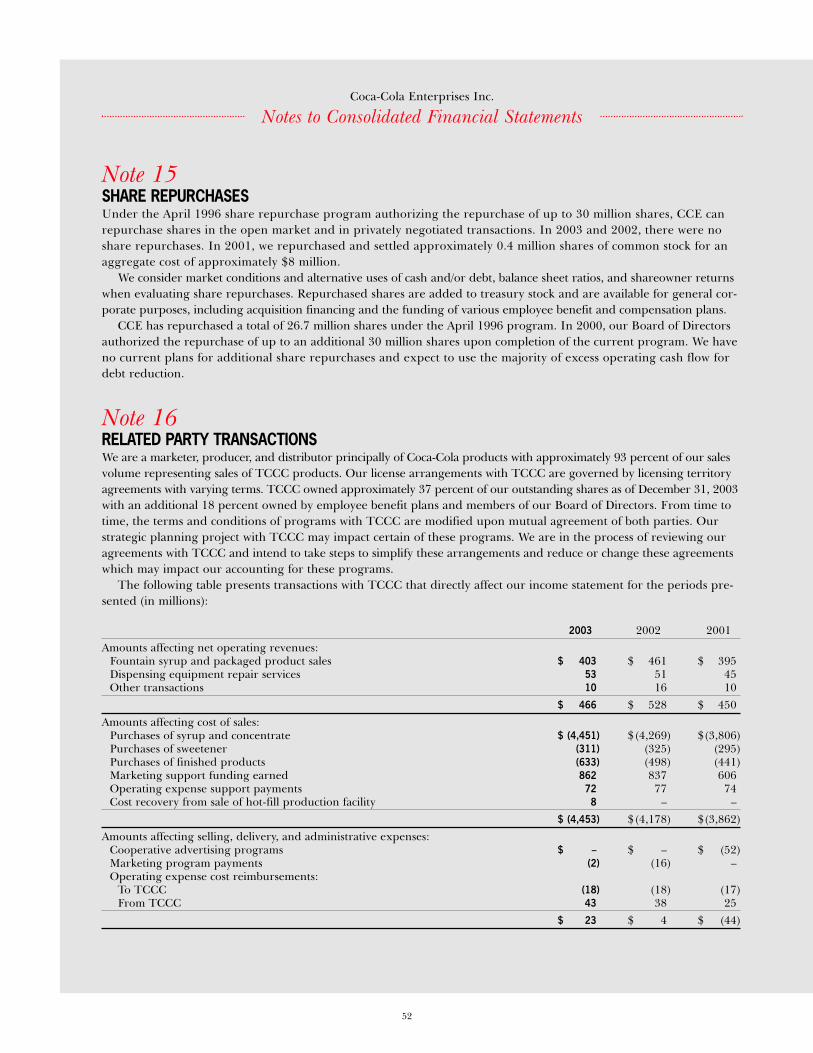
52
Coca-Cola Enterprises Inc.
Notes to Consolidated Financial Statements
Note 15SHARE REPURCHASESUnder the April 1996 share repurchase program authorizing the repurchase of up to 30 million shares, CCE canrepurchase shares in the open market and in privately negotiated transactions. In 2003 and 2002, there were noshare repurchases. In 2001, we repurchased and settled approximately 0.4 million shares of common stock for anaggregate cost of approximately $8 million.
We consider market conditions and alternative uses of cash and/or debt, balance sheet ratios, and shareowner returnswhen evaluating share repurchases. Repurchased shares are added to treasury stock and are available for general cor-porate purposes, including acquisition financing and the funding of various employee benefit and compensation plans.
CCE has repurchased a total of 26.7 million shares under the April 1996 program. In 2000, our Board of Directorsauthorized the repurchase of up to an additional 30 million shares upon completion of the current program. We haveno current plans for additional share repurchases and expect to use the majority of excess operating cash flow fordebt reduction.
Note 16RELATED PARTY TRANSACTIONSWe are a marketer, producer, and distributor principally of Coca-Cola products with approximately 93 percent of our salesvolume representing sales of TCCC products. Our license arrangements with TCCC are governed by licensing territoryagreements with varying terms. TCCC owned approximately 37 percent of our outstanding shares as of December 31, 2003with an additional 18 percent owned by employee benefit plans and members of our Board of Directors. From time totime, the terms and conditions of programs with TCCC are modified upon mutual agreement of both parties. Ourstrategic planning project with TCCC may impact certain of these programs. We are in the process of reviewing ouragreements with TCCC and intend to take steps to simplify these arrangements and reduce or change these agreementswhich may impact our accounting for these programs.
The following table presents transactions with TCCC that directly affect our income statement for the periods pre-sented (in millions):
2003 2002 2001Amounts affecting net operating revenues:
Fountain syrup and packaged product sales $ 403 $ 461 $ 395Dispensing equipment repair services 53 51 45Other transactions 10 16 10
$ 466 $ 528 $ 450Amounts affecting cost of sales:
Purchases of syrup and concentrate $ (4,451) $(4,269) $(3,806)Purchases of sweetener (311) (325) (295)Purchases of finished products (633) (498) (441)Marketing support funding earned 862 837 606Operating expense support payments 72 77 74Cost recovery from sale of hot-fill production facility 8 – –
$ (4,453) $(4,178) $(3,862)Amounts affecting selling, delivery, and administrative expenses:
Cooperative advertising programs $ – $ – $ (52)Marketing program payments (2) (16) –Operating expense cost reimbursements:
To TCCC (18) (18) (17)From TCCC 43 38 25
$ 23 $ 4 $ (44)
53
Upon adoption of EITF 02-16, marketing supportpreviously included in net operating revenues and colddrink equipment placement funding previously includedin selling, delivery, and administrative expenses havebeen classified in cost of sales. In addition, dispensingequipment repair services previously included in selling,delivery, and administrative expenses have been classi-fied in net operating revenues.
Marketing Support and Other Arrangements: CCE and TCCC engagein a variety of marketing programs, local media advertis-ing, and other similar arrangements to promote the saleof products of TCCC in territories in which we operate.The amounts to be paid under the programs are deter-mined annually and as the programs progress during theyear. Payments made under the programs, except foramounts paid under the Jumpstart programs, are receivedor made within the year they are due or shortly thereafter.TCCC is under no obligation to participate in the programsor continue past levels of funding into the future. Theamounts paid and terms of similar programs may differwith other licensees. Marketing support programs fundedto us provide financial support principally based on productsales to offset a portion of the costs to us of the programs.TCCC also administers certain other marketing programsdirectly with our customers. In 2003, 2002, and 2001,total direct-marketing support paid or payable to us, orto customers in our territories by TCCC, totaled approx-imately $1,076 million, $1,041 million, and $888 million,respectively. Of these amounts, we recognized $862 million,$837 million, and $606 million as a reduction of cost of sales in 2003, 2002, and 2001, respectively. The totalsalso include amounts paid directly to our customers byTCCC of approximately $212 million, $201 million, and$279 million for 2003, 2002, and 2001, respectively, aswell as $2 million, $3 million, and $3 million paid in 2003,2002, and 2001, respectively, for TCCC’s participation inlong-term agreements.
We have a multi-year Sales Growth Initiative (SGI) agree-ment with TCCC to promote and support the profitablegrowth of TCCC brands in our territories. Amounts recog-nized under the SGI agreement are included in the tableabove in “Marketing support funding earned.” In each yearof the agreement, $30 million of funding is recognized assales are realized. The remaining funding available to us
under the agreement (volume growth funding) is earned byattaining mutually established sales volume growth rates.Sales volume growth is determined through a formula withadjustments for brand conversions, brand acquisitions, andnew brand introductions. Growth that exceeds the target inNorth America offsets any shortfalls in Europe and vice versa.
Volume growth funding under the SGI agreement isadvanced to us equally over the four quarters of the pro-gram year within thirty days after the beginning of eachquarter. We recognize quarterly volume growth fundingas a reduction of cost of sales as volume growth is attained.The agreement provides for refunds of volume growthfunding advances of $1 per equivalent case should we notattain the specified minimum sales volume growth targets.
For 2002, we recognized the entire $120 million ofvolume growth funding that was available to us underthe agreement. For 2003, we recognized $131 million ofthe $170 million that was available to us under the SGIprogram after adjustment for penalty charges of $39 mil-lion because of a shortage of 39 million equivalent casesbelow our sales volume growth targets for 2003. Underthe agreement, $165 million of volume growth fundingis available to us for 2004.
We participate in programs with TCCC designed topromote the placement of cold drink equipment (Jumpstartprograms). Under the Jumpstart programs, we agree to:(1) purchase and place specified numbers of venders/coolersor cold drink equipment each year through 2008; (2) main-tain the equipment in service, with certain exceptions, fora period of at least 12 years after placement; (3) maintainand stock the equipment in accordance with specifiedstandards for marketing TCCC products; and (4) reportto TCCC during the period the equipment is in servicewhether, on average, the equipment purchased under theprograms has generated a stated minimum sales volumeof TCCC products.
Should we not satisfy these or other provisions of theprograms, the agreement provides for the parties to meetto work out mutually agreeable solutions. Should the partiesbe unable to agree on alternative solutions, TCCC wouldbe able to seek a partial refund of amounts previously paid.No refunds have ever been paid under the programs andwe believe the probability of a partial refund of amountspreviously paid under the programs is remote. We believewe, in all cases, will be able to resolve any matters that
Coca-Cola Enterprises Inc.
Notes to Consolidated Financial Statements
54
Coca-Cola Enterprises Inc.
might arise regarding these programs. In 2003, we did not meet certain requirements for the allocation of pur-chases between venders and coolers and minimumpurchase requirements in certain countries because ofchanges in the business environment. However, in totalwe did purchase and place the required minimums inboth North America and Europe and TCCC has agreedwe are in compliance under the Jumpstart programsthrough 2003.
TCCC’s support payments under the Jumpstart pro-grams were paid in the early years of the agreements. Wereceived approximately $1.2 billion in payments during theperiod 1994 through 2001. No additional amounts arepayable under the Jumpstart programs. We recognizeJumpstart funding as we place cold drink equipment.We recognized $72 million, $77 million, and $71 millionin 2003, 2002, and 2001, respectively. These amountsare included in “Operating expense support payments”as a reduction of cost of sales.
We have an agreement with TCCC under which TCCCprovides support payments in “Marketing support fund-ing earned” for the marketing of certain brands of TCCCin the Herb territories acquired in 2001. Under the termsof this agreement, we received $14 million in 2003 and willreceive $14 million annually through 2008 and $11 millionin 2009. Payments received under this agreement are notrefundable to TCCC.
We participate in cooperative advertising and brand andtrade arrangements with TCCC. Prior to 2002, we paidTCCC a portion of the costs for participation in these pro-grams. Beginning in 2002, all costs in our North Americanterritories under the customer trade marketing (CTM)programs, excluding costs for certain specific customersadministered by TCCC, shifted to us and all costs for localmedia programs in our North American territories shiftedto TCCC. However, we continue to pay TCCC and TCCCpays our customers as a representative for the NorthAmerican bottling system. Amounts paid under CTMprograms to TCCC, included as reductions in net oper-ating revenues for payment to customers on our behalf,totaled $219 million for 2003, $248 million for 2002, and$200 million for 2001. Amounts paid under cooperativeadvertising and brand programs to TCCC, included inselling, delivery, and administrative expenses, in 2001totaled $52 million.
Participation in Marketing Programs with TCCC: On occasion, weparticipate in marketing programs outside the scope ofrecurring arrangements with TCCC. In 2003 and 2002,we paid TCCC approximately $2 million and $16 million,respectively, for participation in marketing programs.
Syrup, Concentrate, Sweetener, and Finished Products: We purchasesyrup and concentrate requirements from TCCC to man-ufacture, package, distribute, and sell TCCC productsunder licensing agreements. These licensing agreementsgive TCCC complete discretion to set prices of the syrupsand concentrates. We also purchase finished productsand fountain syrup from TCCC for sale within our terri-tories and have an agreement with TCCC to purchasesubstantially all our requirements for sweetener in theUnited States.
Fountain Syrup and Packaged Product Sales: We sell fountain syrupto TCCC in certain territories and deliver this syrup tocertain major fountain accounts of TCCC. We will, onbehalf of TCCC, invoice and collect amounts receivablefor these fountain sales. We also sell bottle and can prod-uct to TCCC at prices that are generally similar to theprices charged by us to our major customers.
Customer Marketing Group and Media Staff Cost Reimbursements: Wereached an agreement with TCCC in 2000 to transfercertain responsibilities and the associated staffing forcustomer marketing group (CMG) efforts in NorthAmerica to us from TCCC and for local media activitiesfrom us to TCCC. Under the agreement, TCCC reim-burses us for the CMG staffing costs transferred to usand we reimburse TCCC for the local media staffingcosts transferred to TCCC. Amounts reimbursed to usby TCCC for CMG staffing expenses were $43 million,$38 million, and $25 million for 2003, 2002, and 2001,respectively. These costs and cost reimbursements, asapplicable, are included in selling, delivery, and adminis-trative expenses. Amounts reimbursed to TCCC for localmedia staffing expenses were $18 million, $18 million,and $17 million for 2003, 2002, and 2001, respectively.
Notes to Consolidated Financial Statements

55
Other Transactions: Other transactions with TCCC includemanagement fees, office space leases, and purchases ofpoint-of-sale and other advertising items.
In 2003, we sold a hot-fill plant in Truesdale, Missourito TCCC for approximately $58 million realizing costrecoveries for operating, depreciation, and carrying costsof $8 million as a reduction of cost of sales.
In 2003, we acquired the production and distributionfacilities of Chaudfontaine, a Belgian water brand. At thesame time, TCCC acquired the Chaudfontaine water sourceand brand. The total acquisition cost for both TCCC andCCE was $31 million in cash and assumed debt. Our por-tion of the acquisition cost was $16 million in cash andassumed debt. We also entered into an agreement withTCCC to equally share the profits or losses from the saleof Chaudfontaine products.
Note 17GEOGRAPHIC OPERATING INFORMATIONCCE operates in one industry: the marketing, distribution,and production of bottle and can nonalcoholic beverages.We operate in 46 states in the United States, the District ofColumbia, and in the 10 provinces of Canada (collectivelyreferred to as the North American territories), and inBelgium, continental France, Great Britain, Luxembourg,Monaco, and the Netherlands (collectively referred to asthe European territories). We have no material amountsof sales or transfers between our North American andEuropean territories and no significant United Statesexport sales.
The following presents long-lived assets as ofDecember 31, 2003 and 2002 and net operating revenuesfor the years ended December 31, 2003, 2002, and 2001by geographic territory (in millions):
Long-Lived Assets2003 2002
North American $ 17,180 $16,918European(A) 5,520 4,613Consolidated $ 22,700 $21,531
Net Operating Revenues2003 2002(B) 2001(B)(C)
North American $12,590 $12,269 $11,549European(A) 4,740 3,789 3,450Consolidated $17,330 $16,058 $14,999
(A) At December 31, 2003 and 2002, Great Britain represented approximately 63 percent and 65 percent, respectively, of European long-lived assets. GreatBritain contributed approximately 48 percent, 51 percent, and 49 percent ofEuropean net operating revenues for 2003, 2002, and 2001, respectively.
(B) To conform to the current year presentation, after the adoption of EITF 02-16in the first quarter 2003, 2002 net operating revenues have been classified asfollows: approximately $707 million and $175 million of marketing support inNorth America and Europe, respectively, previously included in net operatingrevenues have been classified as reductions of cost of sales and $51 million ofpayments for dispensing equipment repair services in North America previouslyincluded in selling, delivery, and administrative expenses have been classifiedas net operating revenues. In addition, 2001 net operating revenues have beenclassified as follows: approximately $459 million and $192 million of market-ing support in North America and Europe, respectively, previously included innet operating revenues have been classified as reductions of cost of sales and$45 million of payments for dispensing equipment repair services in NorthAmerica previously included in selling, delivery, and administrative expenseshave been classified as net operating revenues.
(C) Balances reflect the adoption of EITF No. 01-09 effective as of January 1,2002. The adoption of this pronouncement resulted in the reclassification todeductions from net operating revenues of approximately $95 million in 2001previously classified as selling expenses.
Coca-Cola Enterprises Inc.
Notes to Consolidated Financial Statements
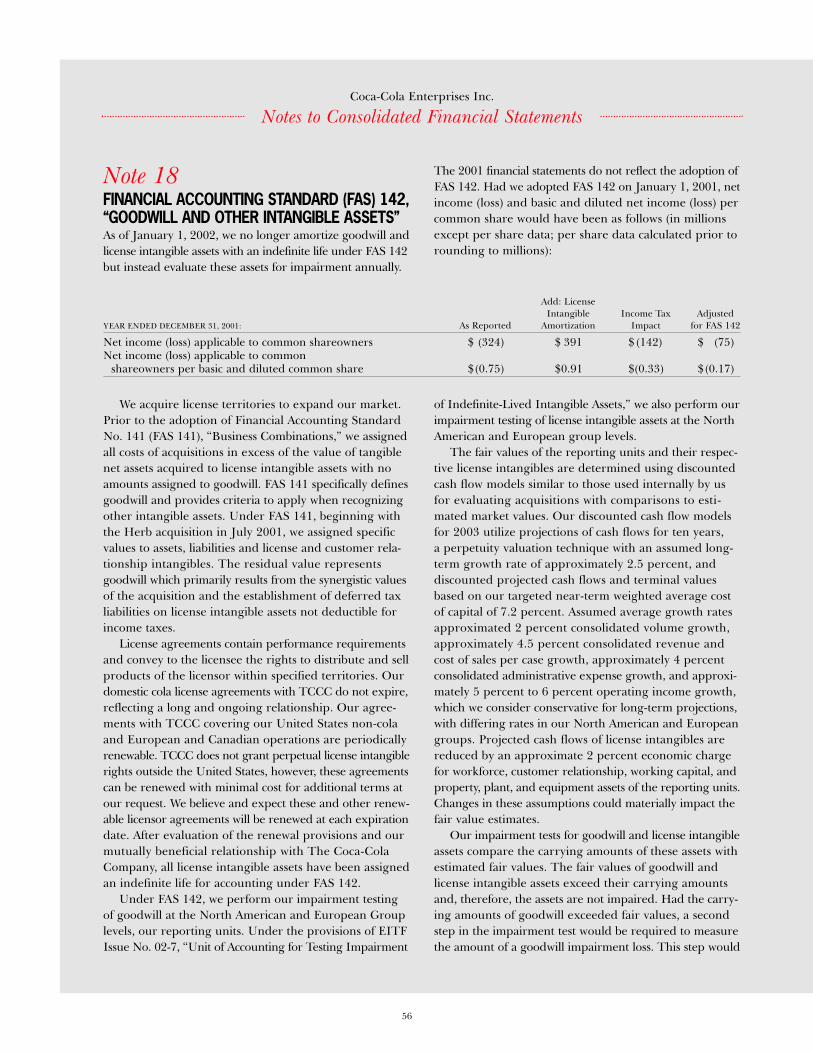
56
Coca-Cola Enterprises Inc.
Note 18FINANCIAL ACCOUNTING STANDARD (FAS) 142,“GOODWILL AND OTHER INTANGIBLE ASSETS”As of January 1, 2002, we no longer amortize goodwill andlicense intangible assets with an indefinite life under FAS 142but instead evaluate these assets for impairment annually.
The 2001 financial statements do not reflect the adoption ofFAS 142. Had we adopted FAS 142 on January 1, 2001, netincome (loss) and basic and diluted net income (loss) percommon share would have been as follows (in millionsexcept per share data; per share data calculated prior torounding to millions):
We acquire license territories to expand our market.Prior to the adoption of Financial Accounting StandardNo. 141 (FAS 141), “Business Combinations,” we assignedall costs of acquisitions in excess of the value of tangiblenet assets acquired to license intangible assets with noamounts assigned to goodwill. FAS 141 specifically definesgoodwill and provides criteria to apply when recognizingother intangible assets. Under FAS 141, beginning withthe Herb acquisition in July 2001, we assigned specificvalues to assets, liabilities and license and customer rela-tionship intangibles. The residual value representsgoodwill which primarily results from the synergistic valuesof the acquisition and the establishment of deferred taxliabilities on license intangible assets not deductible forincome taxes.
License agreements contain performance requirementsand convey to the licensee the rights to distribute and sellproducts of the licensor within specified territories. Ourdomestic cola license agreements with TCCC do not expire,reflecting a long and ongoing relationship. Our agree-ments with TCCC covering our United States non-colaand European and Canadian operations are periodicallyrenewable. TCCC does not grant perpetual license intangiblerights outside the United States, however, these agreementscan be renewed with minimal cost for additional terms atour request. We believe and expect these and other renew-able licensor agreements will be renewed at each expirationdate. After evaluation of the renewal provisions and ourmutually beneficial relationship with The Coca-ColaCompany, all license intangible assets have been assignedan indefinite life for accounting under FAS 142.
Under FAS 142, we perform our impairment testingof goodwill at the North American and European Grouplevels, our reporting units. Under the provisions of EITFIssue No. 02-7, “Unit of Accounting for Testing Impairment
of Indefinite-Lived Intangible Assets,” we also perform ourimpairment testing of license intangible assets at the NorthAmerican and European group levels.
The fair values of the reporting units and their respec-tive license intangibles are determined using discountedcash flow models similar to those used internally by usfor evaluating acquisitions with comparisons to esti-mated market values. Our discounted cash flow modelsfor 2003 utilize projections of cash flows for ten years, a perpetuity valuation technique with an assumed long-term growth rate of approximately 2.5 percent, and discounted projected cash flows and terminal valuesbased on our targeted near-term weighted average costof capital of 7.2 percent. Assumed average growth ratesapproximated 2 percent consolidated volume growth,approximately 4.5 percent consolidated revenue andcost of sales per case growth, approximately 4 percentconsolidated administrative expense growth, and approxi-mately 5 percent to 6 percent operating income growth,which we consider conservative for long-term projections,with differing rates in our North American and Europeangroups. Projected cash flows of license intangibles arereduced by an approximate 2 percent economic chargefor workforce, customer relationship, working capital, andproperty, plant, and equipment assets of the reporting units.Changes in these assumptions could materially impact thefair value estimates.
Our impairment tests for goodwill and license intangibleassets compare the carrying amounts of these assets withestimated fair values. The fair values of goodwill andlicense intangible assets exceed their carrying amountsand, therefore, the assets are not impaired. Had the carry-ing amounts of goodwill exceeded fair values, a secondstep in the impairment test would be required to measurethe amount of a goodwill impairment loss. This step would
Add: LicenseIntangible Income Tax Adjusted
YEAR ENDED DECEMBER 31, 2001: As Reported Amortization Impact for FAS 142
Net income (loss) applicable to common shareowners $ (324) $ 391 $ (142) $ (75)Net income (loss) applicable to common
shareowners per basic and diluted common share $(0.75) $0.91 $(0.33) $(0.17)
Notes to Consolidated Financial Statements
57
compare the implied fair values of the reporting unit’sgoodwill with the carrying amount of goodwill. If thecarrying amount of the reporting unit goodwill exceeds theimplied fair value of goodwill, an impairment loss wouldbe recognized in an amount equal to that excess.
We provide deferred income taxes on license intangibleassets not deductible for tax purposes under FAS 109. Priorto FAS 142, license intangible assets were amortized over40 years. As this amortization cost was recognized, therelated deferred tax liability was recognized as a decreasein income tax expense. Under FAS 142, previously rec-ognized unamortized balances of license intangible assetsand associated deferred income tax liabilities remain
unchanged except upon the recognized impairment inthe value of these assets or any ultimate sale of territories.At December 31, 2003 and 2002, we had approximately$5.0 billion and $4.6 billion of deferred tax liabilities,respectively, on license intangible assets. These deferredtax liabilities, while impacted by tax rate changes andcurrency translations, will decrease only for the reasonsabove but will increase for the effect of any tax deductionsrealized on tax deductible license intangible assets.
Goodwill and license intangible assets at December 31,2003 associated with acquisitions completed in 2003 maycontinue to be adjusted as the values of assets and liabilitiesacquired are finalized.
Purchase Agreements: The long-term purchase agreements wehave with various suppliers are subject to each supplier’squality and performance.
Operating Leases: We lease office and warehouse space, com-puter hardware, and machinery and equipment undernoncancelable operating lease agreements expiring atvarious dates through 2039. Rent expense under non-cancelable operating lease agreements totaled approximately$144 million, $99 million, and $85 million during 2003,2002, and 2001, respectively.
Customer Contracts: We participate in customer contractualarrangements for pouring or vending rights in specificathletic venues, specific school districts, or other venues.
Letters of Credit: We have issued letters of credit as collateralfor claims incurred under self-insurance programs forworkers’ compensation and large deductible casualty insur-ance programs aggregating $361 million and letters of creditprovided for operating activities aggregating $4 million. InDecember 2003, we executed a committed letter of creditfacility under self-insurance programs in the amount of$390 million. Approximately $241 million of the total out-standing at December 31, 2003 is covered by this facilityand the majority of the remaining outstanding letters ofcredit are to be transferred to the facility in 2004.
Affiliate Guarantees: We guarantee debt and other obligationsof certain third parties. In North America, we guaranteerepayment of indebtedness owed by a PET (plastic) bottle
Coca-Cola Enterprises Inc.
Notes to Consolidated Financial Statements
Note 19COMMITMENTS AND CONTINGENCIESContractual Obligations and Other Commercial Commitments: The following table summarizes our significant contractual obligationsand commercial commitments as of December 31, 2003 (in millions):
Payments due by PeriodContractual Obligations Total 2004 2005 2006 2007 2008 ThereafterLong-term debt $11,646 $1,094 $ 273 $2,052 $ 921 $ 877 $6,429Long-term purchase agreements 9,779 2,260 2,353 1,810 1,459 1,056 841Operating leases (future minimum) 402 76 58 40 31 32 165Customer contractual arrangements 435 99 89 78 105 55 9Total contractual cash obligations $22,622 $3,529 $2,773 $3,980 $2,516 $2,020 $7,444
Amount of Commitment Expiration per PeriodOther Commercial Commitments Total 2004 2005 2006 2007 2008 ThereafterStandby letters of credit $ 365 $ 356 $ 9 $ – $ – $ – $ –Affiliate guarantees 196 5 – 35 8 10 138Total commercial commitments $ 561 $ 361 $ 9 $ 35 $ 8 $ 10 $ 138
58
Coca-Cola Enterprises Inc.
manufacturing cooperative. We also guarantee repaymentof indebtedness owed by a vending partnership in whichwe have a limited partnership interest.
As of December 31, 2003, we have guaranteed paymentof up to $262 million owed by certain affiliates, primarilythose noted above, to third parties. At December 31, 2003,these affiliates had approximately $196 million of indebt-edness guaranteed by us, of which $195 million is owedby a manufacturing cooperative and a vending partner-ship. We hold no assets as collateral against these guar-antees and no contractual recourse provisions existunder the guarantees that would enable us to recoveramounts we guarantee in the event of an occurrence of atriggering event under these guarantees. These guaran-tees, which expire at varying dates through 2015, arose asa result of our ongoing business relationships. Noamounts are recorded for our obligations under theseguarantees as we consider the risk of default associatedwith these guarantees to be remote.
Other Contingencies: Our business practices are being reviewedby the European Commission in various jurisdictions foralleged abuses of an alleged dominant position underArticle 82 of the EU Treaty. We do not believe we have a dominant position in the relevant markets, or that ourcurrent or past commercial practices violate EU law.Nonetheless, the Commission has considerable discretionin reaching conclusions and levying fines, which are sub-ject to judicial review. The Commission has not notifiedus when it might reach any conclusions.
In addition, we are also the subject of investigationsby Belgian and French competition law authorities forour compliance with respect to competition laws. Theseproceedings are subject to further review and we intendto continue to vigorously defend against an unfavorableoutcome. At this time, it is not possible for us to deter-mine the ultimate outcome of this matter.
Our California subsidiary has been sued by severalcurrent and former employees over alleged violations ofstate wage and hour rules. Our California subsidiary isvigorously defending against the claims but at this timeit is not possible to predict the outcome.
Our California subsidiary was also involved in anotherlawsuit by current and former employees over alleged viola-tions of state wage and hour rules that settled in 2001. Inlate 2003 we received proceeds of approximately $21 mil-lion from our insurance carriers to reimburse us for the
cost of this settlement. In 2000, CCE and TCCC were found by a Texas jury
to be jointly liable in a combined amount of $15.2 millionto five plaintiffs, each a distributor of competing beverageproducts. These distributors sued alleging that CCE andTCCC engaged in unfair marketing practices. The trialcourt’s verdict was upheld by the Texas Court of Appealsin July 2003; we and TCCC have applied to the TexasSupreme Court for leave to appeal to that court. We believeour accruals are adequate to cover the damages awardedby the trial court if its verdict is allowed to stand. The claimsof the three remaining plaintiffs in this case remain to betried and four additional competitors have filed similarclaims against us. We have not provided for any poten-tial awards under these additional claims. We intend tovigorously defend against these claims.
In June 2003, Riverwood International Corporationfiled a patent infringement suit against MeadWestvacoCorporation in the United States District Court for theNorthern District of Georgia. We currently hold a multi-year supply contract with MeadWestvaco for the supplyof paperboard cartons, including the cartons known asthe “Fridge Pack.” Riverwood’s suit sought to enjoinMeadWestvaco from supplying us with Fridge Pack pack-aging. An agreement related to this suit was reached inlate 2003 requiring us to pay approximately $4 millionto settle any and all claims related to this matter.
Under the Jumpstart programs with TCCC, we receivedpayments from TCCC for a portion of the cost of devel-oping the infrastructure (consisting primarily of peopleand systems) necessary to support accelerated placementsof cold drink equipment. We recognize the paymentsprimarily as cold drink equipment is placed, through2008, and over the period we have the potential require-ment to move equipment, through 2020. Should we notsatisfy the provisions of the programs, the agreementprovides for the parties to meet to work out mutuallyagreeable solutions. Should the parties be unable to agreeon alternative solutions, TCCC would be able to seek apartial refund of amounts previously paid. No refundshave ever been paid under the programs and we believethe probability of a partial refund of amounts previouslypaid under the programs is remote. We believe we, in allcases, will be able to resolve any matters that might ariseregarding these programs. In 2003, we did not meet cer-tain requirements for the allocation of purchases betweenvenders and coolers and minimum purchase requirements
Notes to Consolidated Financial Statements
59
in certain countries because of changes in the businessenvironment. However, in total we did purchase and placethe required minimums in both North America andEurope and TCCC has agreed to our compliance underthe Jumpstart programs through 2003.
Under the SGI agreement with TCCC, we are eligibleto receive up to $165 million of “Volume Growth Funding”in 2004 which is to be earned by attaining mutually estab-lished sales volume growth targets for brands owned byTCCC. The annual and quarterly target minimums areestablished for each program year through mutual agree-ments with TCCC. Sales volume growth is determinedthrough a formula with adjustments for brand conver-sions, brand acquisitions, new brand introductions, andperformance in excess of the previous year’s perform-ance. If these minimum targets are not met, penalties of $1 per equivalent case shortfalls to target are offsetagainst the Volume Growth Funding available under theprogram. Under the SGI agreement, quarterly fundingcommitments are advanced at the beginning of each quar-ter less penalties for shortfalls to targets not previouslyoffset. We do not anticipate we will incur penalties that willbe offset against the $165 million Volume Growth Fundingavailable to us under the SGI agreement for 2004.
Our tax filings are routinely subjected to audit by taxauthorities in most jurisdictions where we conduct busi-ness. These audits may result in assessments of additionaltaxes that are subsequently resolved with the authorities orpotentially through the courts. Currently, there are assess-ments or audits which may lead to assessments involvingcertain of our subsidiaries, including our subsidiary inCanada, that may not be resolved in the foreseeable future.We believe we have substantial defenses to the questionsbeing raised and intend to pursue all legal remediesavailable if we are unable to reach a resolution with theauthorities. We believe we have adequately provided forany ultimate amounts that would result from these pro-ceedings, however, it is too early to predict a final outcomein these matters.
In December 2003, we settled our claims against ourinsurance carriers for the losses we incurred in the 1999Belgian recall. Under the agreement, we received $47.5 mil-lion upon the execution of a final settlement agreementin exchange for a release of our claims. We do not antici-pate any additional recoveries associated with the productrecall in Belgium.
At January 31, 2004, there were two federal and twostate superfund sites for which CCE and our bottlingsubsidiaries’ involvement or liability as a potentiallyresponsible party (PRP) was unresolved. We believe anyultimate liability under these PRP designations will nothave a material adverse effect on our financial position,cash flows, or results of operations. In addition, we orour bottling subsidiaries have been named PRPs at 35other federal and 10 other state superfund sites undercircumstances that have led us to conclude that either (i) we will have no further liability because we had noresponsibility for having deposited hazardous waste, (ii) our ultimate liability, if any, would be less than $100,000per site, or (iii) payments made to date will be sufficientto satisfy all liability.
We are a defendant in various other matters of litigationgenerally arising out of the normal course of business.Although it is difficult to predict the ultimate outcome ofthese cases, management believes, based on discussions withcounsel, that any ultimate liability would not materially affectour financial position, results of operations, or liquidity.
Note 20NEW ACCOUNTING STANDARDSIn January 2003, the FASB issued Interpretation No. 46(FIN 46), “Consolidation of Variable Interest Entities,”revised December 2003. FIN 46 requires variable inter-est entities to be consolidated by the primary beneficiaryof the entity in certain instances. FIN 46 is effective forall new variable interest entities created or acquired afterJanuary 31, 2003. For variable interest entities createdor acquired prior to February 1, 2003, the provisions ofFIN 46 are to be applied by us in the first quarter of 2004.We participate in manufacturing cooperatives and haveownership in a vending partnership. Amounts owed bythese entities at December 31, 2003 total $240 million.We are currently evaluating the implications of the adop-tion of FIN 46 on our financial position, cash flows, andresults of operations. Should we determine under FIN 46we are required to consolidate the manufacturing coop-eratives and vending partnership, our debt balances willincrease by the amounts then owed by these entities.
Coca-Cola Enterprises Inc.
Notes to Consolidated Financial Statements
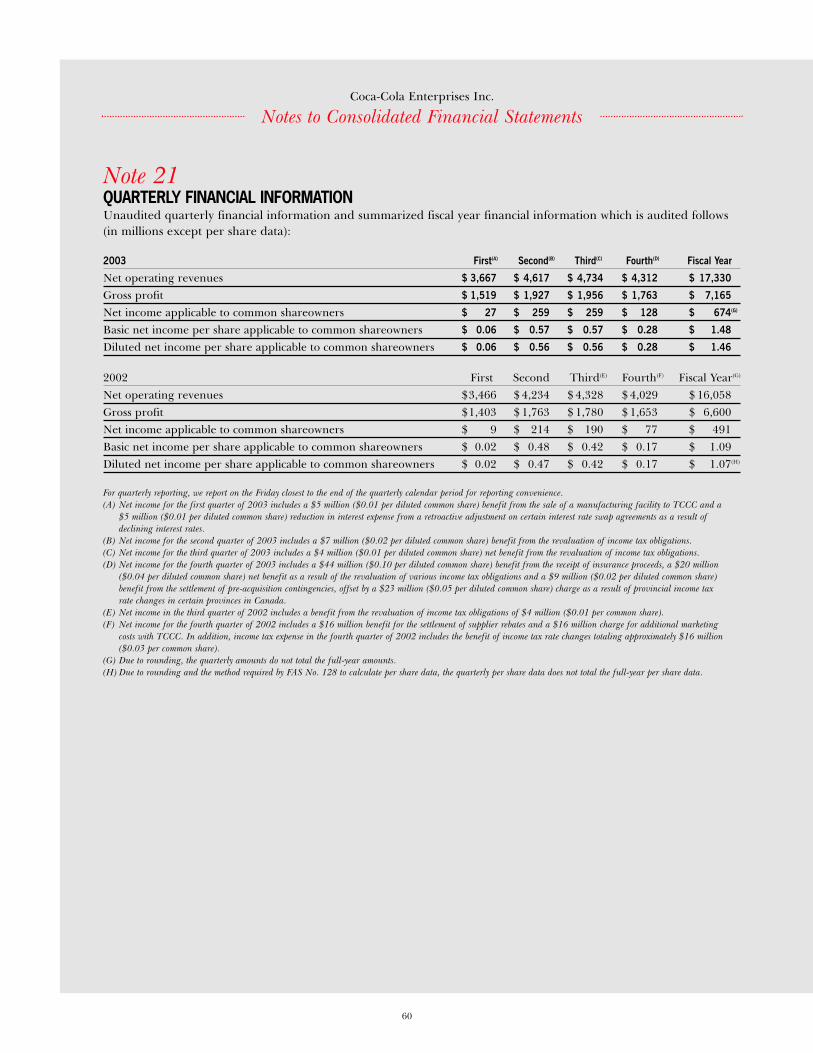
Note 21QUARTERLY FINANCIAL INFORMATIONUnaudited quarterly financial information and summarized fiscal year financial information which is audited follows(in millions except per share data):
2003 First(A) Second(B) Third(C) Fourth(D) Fiscal Year
Net operating revenues $ 3,667 $ 4,617 $ 4,734 $ 4,312 $ 17,330
Gross profit $ 1,519 $ 1,927 $ 1,956 $ 1,763 $ 7,165
Net income applicable to common shareowners $ 27 $ 259 $ 259 $ 128 $ 674(G)
Basic net income per share applicable to common shareowners $ 0.06 $ 0.57 $ 0.57 $ 0.28 $ 1.48
Diluted net income per share applicable to common shareowners $ 0.06 $ 0.56 $ 0.56 $ 0.28 $ 1.46
2002 First Second Third(E) Fourth(F) Fiscal Year(G)
Net operating revenues $3,466 $ 4,234 $ 4,328 $ 4,029 $ 16,058Gross profit $1,403 $ 1,763 $ 1,780 $ 1,653 $ 6,600Net income applicable to common shareowners $ 9 $ 214 $ 190 $ 77 $ 491Basic net income per share applicable to common shareowners $ 0.02 $ 0.48 $ 0.42 $ 0.17 $ 1.09Diluted net income per share applicable to common shareowners $ 0.02 $ 0.47 $ 0.42 $ 0.17 $ 1.07(H)
For quarterly reporting, we report on the Friday closest to the end of the quarterly calendar period for reporting convenience. (A) Net income for the first quarter of 2003 includes a $5 million ($0.01 per diluted common share) benefit from the sale of a manufacturing facility to TCCC and a
$5 million ($0.01 per diluted common share) reduction in interest expense from a retroactive adjustment on certain interest rate swap agreements as a result of declining interest rates.
(B) Net income for the second quarter of 2003 includes a $7 million ($0.02 per diluted common share) benefit from the revaluation of income tax obligations.(C) Net income for the third quarter of 2003 includes a $4 million ($0.01 per diluted common share) net benefit from the revaluation of income tax obligations.(D) Net income for the fourth quarter of 2003 includes a $44 million ($0.10 per diluted common share) benefit from the receipt of insurance proceeds, a $20 million
($0.04 per diluted common share) net benefit as a result of the revaluation of various income tax obligations and a $9 million ($0.02 per diluted common share) benefit from the settlement of pre-acquisition contingencies, offset by a $23 million ($0.05 per diluted common share) charge as a result of provincial income tax rate changes in certain provinces in Canada.
(E) Net income in the third quarter of 2002 includes a benefit from the revaluation of income tax obligations of $4 million ($0.01 per common share).(F) Net income for the fourth quarter of 2002 includes a $16 million benefit for the settlement of supplier rebates and a $16 million charge for additional marketing
costs with TCCC. In addition, income tax expense in the fourth quarter of 2002 includes the benefit of income tax rate changes totaling approximately $16 million($0.03 per common share).
(G) Due to rounding, the quarterly amounts do not total the full-year amounts.(H) Due to rounding and the method required by FAS No. 128 to calculate per share data, the quarterly per share data does not total the full-year per share data.
Coca-Cola Enterprises Inc.
60
Notes to Consolidated Financial Statements
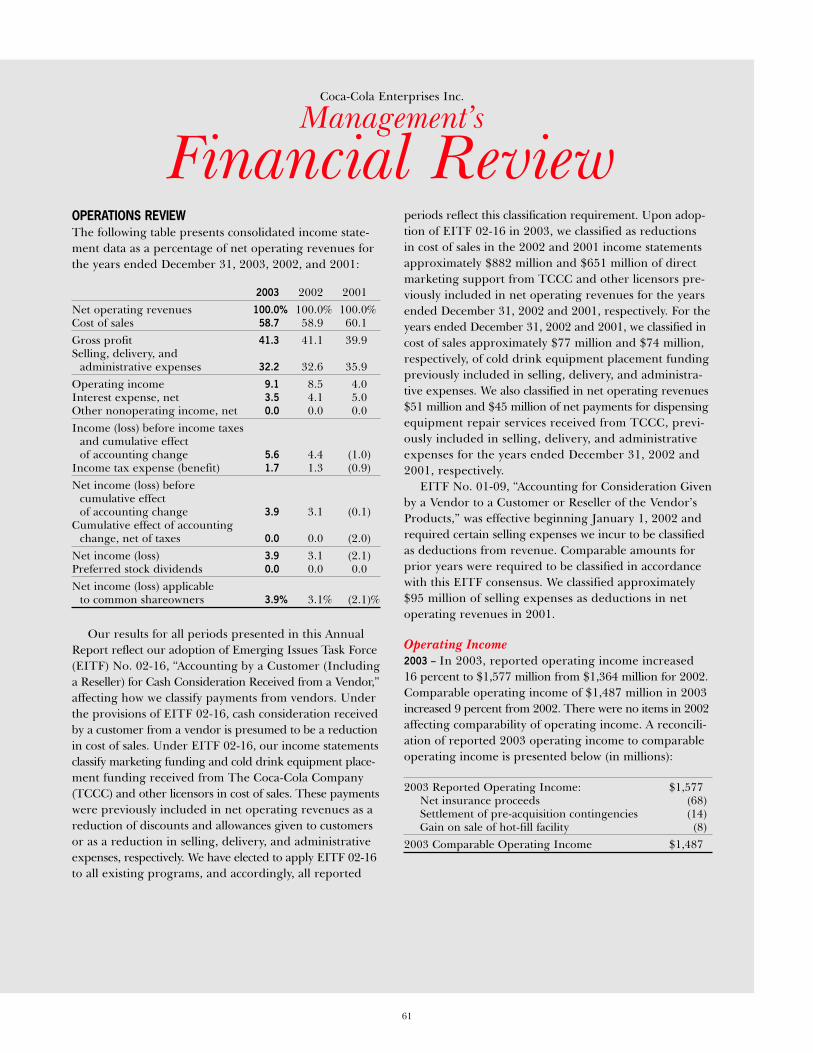
61
OPERATIONS REVIEWThe following table presents consolidated income state-ment data as a percentage of net operating revenues forthe years ended December 31, 2003, 2002, and 2001:
2003 2002 2001Net operating revenues 100.0% 100.0% 100.0%Cost of sales 58.7 58.9 60.1Gross profit 41.3 41.1 39.9Selling, delivery, and
administrative expenses 32.2 32.6 35.9Operating income 9.1 8.5 4.0Interest expense, net 3.5 4.1 5.0Other nonoperating income, net 0.0 0.0 0.0Income (loss) before income taxes
and cumulative effect of accounting change 5.6 4.4 (1.0)
Income tax expense (benefit) 1.7 1.3 (0.9)Net income (loss) before
cumulative effect of accounting change 3.9 3.1 (0.1)
Cumulative effect of accounting change, net of taxes 0.0 0.0 (2.0)
Net income (loss) 3.9 3.1 (2.1)Preferred stock dividends 0.0 0.0 0.0Net income (loss) applicable
to common shareowners 3.9% 3.1% (2.1)%
Our results for all periods presented in this AnnualReport reflect our adoption of Emerging Issues Task Force(EITF) No. 02-16, “Accounting by a Customer (Includinga Reseller) for Cash Consideration Received from a Vendor,”affecting how we classify payments from vendors. Underthe provisions of EITF 02-16, cash consideration receivedby a customer from a vendor is presumed to be a reductionin cost of sales. Under EITF 02-16, our income statementsclassify marketing funding and cold drink equipment place-ment funding received from The Coca-Cola Company(TCCC) and other licensors in cost of sales. These paymentswere previously included in net operating revenues as areduction of discounts and allowances given to customersor as a reduction in selling, delivery, and administrativeexpenses, respectively. We have elected to apply EITF 02-16to all existing programs, and accordingly, all reported
periods reflect this classification requirement. Upon adop-tion of EITF 02-16 in 2003, we classified as reductions in cost of sales in the 2002 and 2001 income statementsapproximately $882 million and $651 million of directmarketing support from TCCC and other licensors pre-viously included in net operating revenues for the yearsended December 31, 2002 and 2001, respectively. For theyears ended December 31, 2002 and 2001, we classified incost of sales approximately $77 million and $74 million,respectively, of cold drink equipment placement fundingpreviously included in selling, delivery, and administra-tive expenses. We also classified in net operating revenues$51 million and $45 million of net payments for dispensingequipment repair services received from TCCC, previ-ously included in selling, delivery, and administrativeexpenses for the years ended December 31, 2002 and2001, respectively.
EITF No. 01-09, “Accounting for Consideration Givenby a Vendor to a Customer or Reseller of the Vendor’sProducts,” was effective beginning January 1, 2002 andrequired certain selling expenses we incur to be classifiedas deductions from revenue. Comparable amounts forprior years were required to be classified in accordancewith this EITF consensus. We classified approximately$95 million of selling expenses as deductions in netoperating revenues in 2001.
Operating Income2003 – In 2003, reported operating income increased 16 percent to $1,577 million from $1,364 million for 2002.Comparable operating income of $1,487 million in 2003increased 9 percent from 2002. There were no items in 2002affecting comparability of operating income. A reconcili-ation of reported 2003 operating income to comparableoperating income is presented below (in millions):
2003 Reported Operating Income: $1,577Net insurance proceeds (68)Settlement of pre-acquisition contingencies (14)Gain on sale of hot-fill facility (8)
2003 Comparable Operating Income $1,487
Coca-Cola Enterprises Inc.
Financial ReviewManagement’s
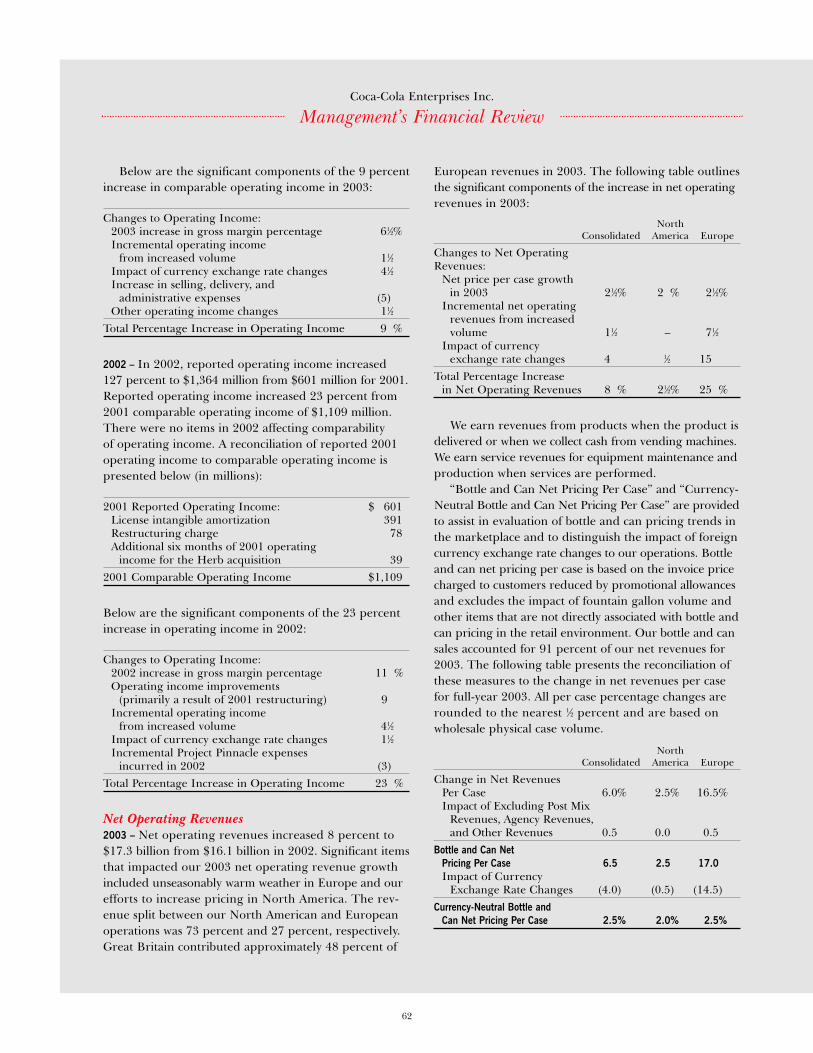
62
Coca-Cola Enterprises Inc.
Below are the significant components of the 9 percentincrease in comparable operating income in 2003:
Changes to Operating Income:2003 increase in gross margin percentage 61⁄2%Incremental operating income
from increased volume 11⁄2Impact of currency exchange rate changes 41⁄2Increase in selling, delivery, and
administrative expenses (5)Other operating income changes 11⁄2
Total Percentage Increase in Operating Income 9 %
2002 – In 2002, reported operating income increased 127 percent to $1,364 million from $601 million for 2001.Reported operating income increased 23 percent from2001 comparable operating income of $1,109 million.There were no items in 2002 affecting comparability of operating income. A reconciliation of reported 2001operating income to comparable operating income ispresented below (in millions):
2001 Reported Operating Income: $ 601License intangible amortization 391Restructuring charge 78Additional six months of 2001 operating
income for the Herb acquisition 392001 Comparable Operating Income $1,109
Below are the significant components of the 23 percentincrease in operating income in 2002:
Changes to Operating Income:2002 increase in gross margin percentage 11 %Operating income improvements
(primarily a result of 2001 restructuring) 9Incremental operating income
from increased volume 41⁄2Impact of currency exchange rate changes 11⁄2Incremental Project Pinnacle expenses
incurred in 2002 (3)Total Percentage Increase in Operating Income 23 %
Net Operating Revenues2003 – Net operating revenues increased 8 percent to$17.3 billion from $16.1 billion in 2002. Significant itemsthat impacted our 2003 net operating revenue growthincluded unseasonably warm weather in Europe and ourefforts to increase pricing in North America. The rev-enue split between our North American and Europeanoperations was 73 percent and 27 percent, respectively.Great Britain contributed approximately 48 percent of
European revenues in 2003. The following table outlinesthe significant components of the increase in net operatingrevenues in 2003:
NorthConsolidated America Europe
Changes to Net Operating Revenues:
Net price per case growth in 2003 21⁄2% 2 % 21⁄2%
Incremental net operating revenues from increased volume 11⁄2 – 71⁄2
Impact of currency exchange rate changes 4 1⁄2 15
Total Percentage Increase in Net Operating Revenues 8 % 21⁄2% 25 %
We earn revenues from products when the product isdelivered or when we collect cash from vending machines.We earn service revenues for equipment maintenance andproduction when services are performed.
“Bottle and Can Net Pricing Per Case” and “Currency-Neutral Bottle and Can Net Pricing Per Case” are providedto assist in evaluation of bottle and can pricing trends inthe marketplace and to distinguish the impact of foreigncurrency exchange rate changes to our operations. Bottleand can net pricing per case is based on the invoice pricecharged to customers reduced by promotional allowancesand excludes the impact of fountain gallon volume andother items that are not directly associated with bottle andcan pricing in the retail environment. Our bottle and cansales accounted for 91 percent of our net revenues for2003. The following table presents the reconciliation ofthese measures to the change in net revenues per casefor full-year 2003. All per case percentage changes arerounded to the nearest 1⁄2 percent and are based onwholesale physical case volume.
NorthConsolidated America Europe
Change in Net Revenues Per Case 6.0% 2.5% 16.5%Impact of Excluding Post Mix
Revenues, Agency Revenues, and Other Revenues 0.5 0.0 0.5
Bottle and Can Net Pricing Per Case 6.5 2.5 17.0Impact of Currency
Exchange Rate Changes (4.0) (0.5) (14.5)Currency-Neutral Bottle and
Can Net Pricing Per Case 2.5% 2.0% 2.5%
Management’s Financial ReviewManagement’s Financial Review
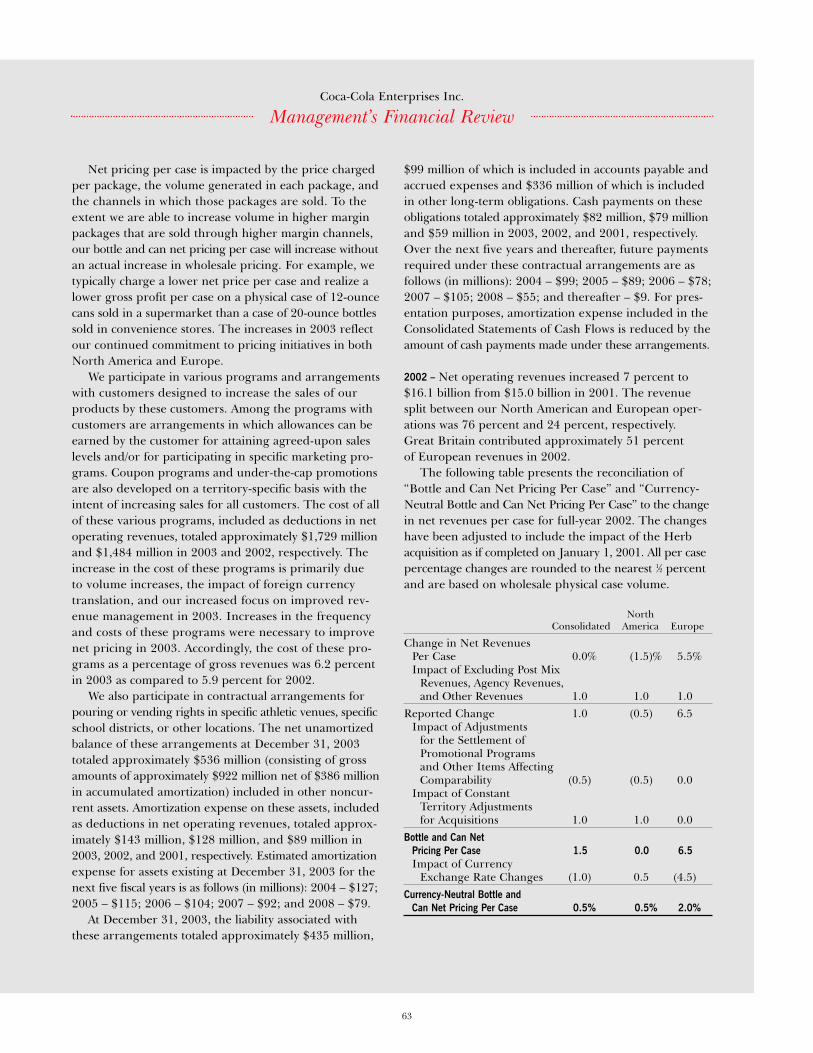
63
Net pricing per case is impacted by the price chargedper package, the volume generated in each package, andthe channels in which those packages are sold. To theextent we are able to increase volume in higher marginpackages that are sold through higher margin channels,our bottle and can net pricing per case will increase withoutan actual increase in wholesale pricing. For example, wetypically charge a lower net price per case and realize alower gross profit per case on a physical case of 12-ouncecans sold in a supermarket than a case of 20-ounce bottlessold in convenience stores. The increases in 2003 reflectour continued commitment to pricing initiatives in bothNorth America and Europe.
We participate in various programs and arrangementswith customers designed to increase the sales of ourproducts by these customers. Among the programs withcustomers are arrangements in which allowances can beearned by the customer for attaining agreed-upon saleslevels and/or for participating in specific marketing pro-grams. Coupon programs and under-the-cap promotionsare also developed on a territory-specific basis with theintent of increasing sales for all customers. The cost of allof these various programs, included as deductions in netoperating revenues, totaled approximately $1,729 millionand $1,484 million in 2003 and 2002, respectively. Theincrease in the cost of these programs is primarily due to volume increases, the impact of foreign currencytranslation, and our increased focus on improved rev-enue management in 2003. Increases in the frequencyand costs of these programs were necessary to improvenet pricing in 2003. Accordingly, the cost of these pro-grams as a percentage of gross revenues was 6.2 percentin 2003 as compared to 5.9 percent for 2002.
We also participate in contractual arrangements forpouring or vending rights in specific athletic venues, specificschool districts, or other locations. The net unamortizedbalance of these arrangements at December 31, 2003totaled approximately $536 million (consisting of grossamounts of approximately $922 million net of $386 millionin accumulated amortization) included in other noncur-rent assets. Amortization expense on these assets, includedas deductions in net operating revenues, totaled approx-imately $143 million, $128 million, and $89 million in2003, 2002, and 2001, respectively. Estimated amortizationexpense for assets existing at December 31, 2003 for thenext five fiscal years is as follows (in millions): 2004 – $127;2005 – $115; 2006 – $104; 2007 – $92; and 2008 – $79.
At December 31, 2003, the liability associated withthese arrangements totaled approximately $435 million,
$99 million of which is included in accounts payable andaccrued expenses and $336 million of which is includedin other long-term obligations. Cash payments on theseobligations totaled approximately $82 million, $79 millionand $59 million in 2003, 2002, and 2001, respectively.Over the next five years and thereafter, future paymentsrequired under these contractual arrangements are asfollows (in millions): 2004 – $99; 2005 – $89; 2006 – $78;2007 – $105; 2008 – $55; and thereafter – $9. For pres-entation purposes, amortization expense included in theConsolidated Statements of Cash Flows is reduced by theamount of cash payments made under these arrangements.
2002 – Net operating revenues increased 7 percent to$16.1 billion from $15.0 billion in 2001. The revenuesplit between our North American and European oper-ations was 76 percent and 24 percent, respectively. Great Britain contributed approximately 51 percent of European revenues in 2002.
The following table presents the reconciliation of“Bottle and Can Net Pricing Per Case” and “Currency-Neutral Bottle and Can Net Pricing Per Case” to the changein net revenues per case for full-year 2002. The changeshave been adjusted to include the impact of the Herbacquisition as if completed on January 1, 2001. All per casepercentage changes are rounded to the nearest 1⁄2 percentand are based on wholesale physical case volume.
NorthConsolidated America Europe
Change in Net Revenues Per Case 0.0% (1.5)% 5.5%Impact of Excluding Post Mix
Revenues, Agency Revenues, and Other Revenues 1.0 1.0 1.0
Reported Change 1.0 (0.5) 6.5Impact of Adjustments
for the Settlement of Promotional Programs and Other Items Affecting Comparability (0.5) (0.5) 0.0
Impact of Constant Territory Adjustments for Acquisitions 1.0 1.0 0.0
Bottle and Can Net Pricing Per Case 1.5 0.0 6.5Impact of Currency
Exchange Rate Changes (1.0) 0.5 (4.5)Currency-Neutral Bottle and
Can Net Pricing Per Case 0.5% 0.5% 2.0%
Coca-Cola Enterprises Inc.
Management’s Financial Review
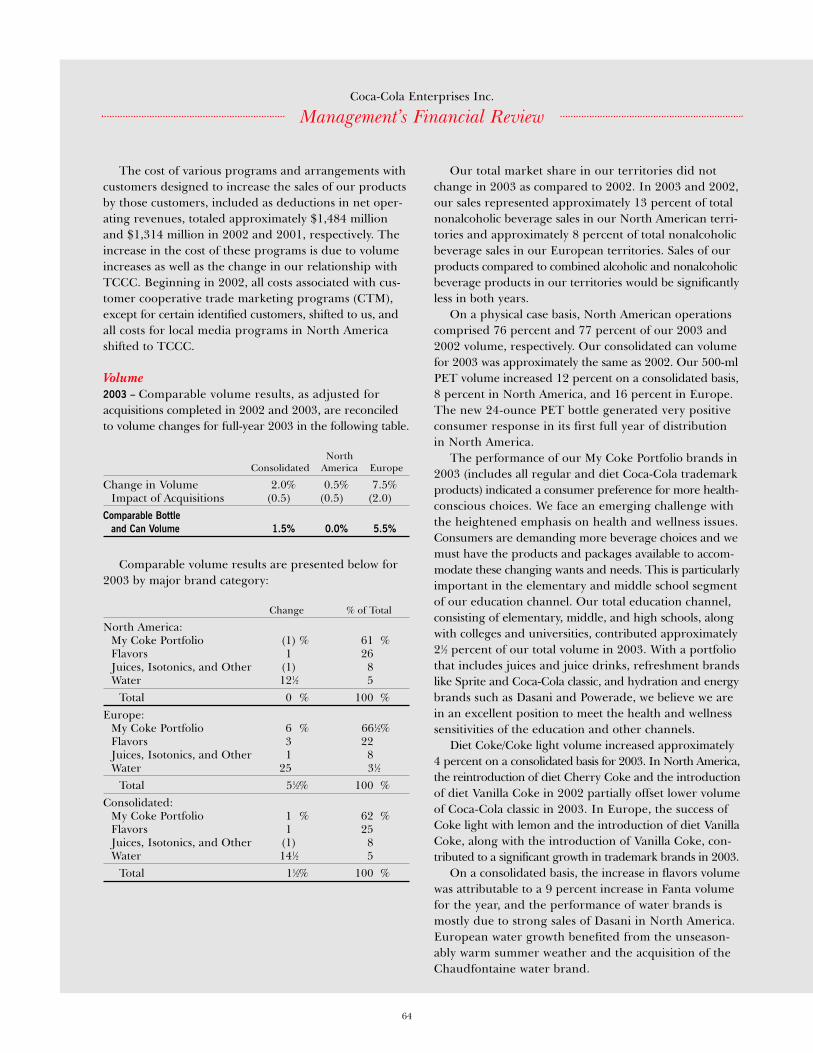
64
Coca-Cola Enterprises Inc.
The cost of various programs and arrangements withcustomers designed to increase the sales of our productsby those customers, included as deductions in net oper-ating revenues, totaled approximately $1,484 millionand $1,314 million in 2002 and 2001, respectively. Theincrease in the cost of these programs is due to volumeincreases as well as the change in our relationship withTCCC. Beginning in 2002, all costs associated with cus-tomer cooperative trade marketing programs (CTM),except for certain identified customers, shifted to us, andall costs for local media programs in North Americashifted to TCCC.
Volume2003 – Comparable volume results, as adjusted foracquisitions completed in 2002 and 2003, are reconciledto volume changes for full-year 2003 in the following table.
NorthConsolidated America Europe
Change in Volume 2.0% 0.5% 7.5%Impact of Acquisitions (0.5) (0.5) (2.0)
Comparable Bottle and Can Volume 1.5% 0.0% 5.5%
Comparable volume results are presented below for2003 by major brand category:
Change % of Total
North America:My Coke Portfolio (1) % 61 %Flavors 1 26Juices, Isotonics, and Other (1) 8Water 121⁄2 5
Total 0 % 100 %Europe:
My Coke Portfolio 6 % 661⁄2%Flavors 3 22Juices, Isotonics, and Other 1 8Water 25 31⁄2
Total 51⁄2% 100 %Consolidated:
My Coke Portfolio 1 % 62 %Flavors 1 25Juices, Isotonics, and Other (1) 8Water 141⁄2 5
Total 11⁄2% 100 %
Our total market share in our territories did notchange in 2003 as compared to 2002. In 2003 and 2002,our sales represented approximately 13 percent of totalnonalcoholic beverage sales in our North American terri-tories and approximately 8 percent of total nonalcoholicbeverage sales in our European territories. Sales of ourproducts compared to combined alcoholic and nonalcoholicbeverage products in our territories would be significantlyless in both years.
On a physical case basis, North American operationscomprised 76 percent and 77 percent of our 2003 and2002 volume, respectively. Our consolidated can volumefor 2003 was approximately the same as 2002. Our 500-mlPET volume increased 12 percent on a consolidated basis,8 percent in North America, and 16 percent in Europe.The new 24-ounce PET bottle generated very positiveconsumer response in its first full year of distribution in North America.
The performance of our My Coke Portfolio brands in2003 (includes all regular and diet Coca-Cola trademarkproducts) indicated a consumer preference for more health-conscious choices. We face an emerging challenge withthe heightened emphasis on health and wellness issues.Consumers are demanding more beverage choices and wemust have the products and packages available to accom-modate these changing wants and needs. This is particularlyimportant in the elementary and middle school segmentof our education channel. Our total education channel,consisting of elementary, middle, and high schools, alongwith colleges and universities, contributed approximately21⁄2 percent of our total volume in 2003. With a portfoliothat includes juices and juice drinks, refreshment brandslike Sprite and Coca-Cola classic, and hydration and energybrands such as Dasani and Powerade, we believe we arein an excellent position to meet the health and wellnesssensitivities of the education and other channels.
Diet Coke/Coke light volume increased approximately4 percent on a consolidated basis for 2003. In North America,the reintroduction of diet Cherry Coke and the introductionof diet Vanilla Coke in 2002 partially offset lower volumeof Coca-Cola classic in 2003. In Europe, the success ofCoke light with lemon and the introduction of diet VanillaCoke, along with the introduction of Vanilla Coke, con-tributed to a significant growth in trademark brands in 2003.
On a consolidated basis, the increase in flavors volumewas attributable to a 9 percent increase in Fanta volumefor the year, and the performance of water brands ismostly due to strong sales of Dasani in North America.European water growth benefited from the unseason-ably warm summer weather and the acquisition of theChaudfontaine water brand.
Management’s Financial Review
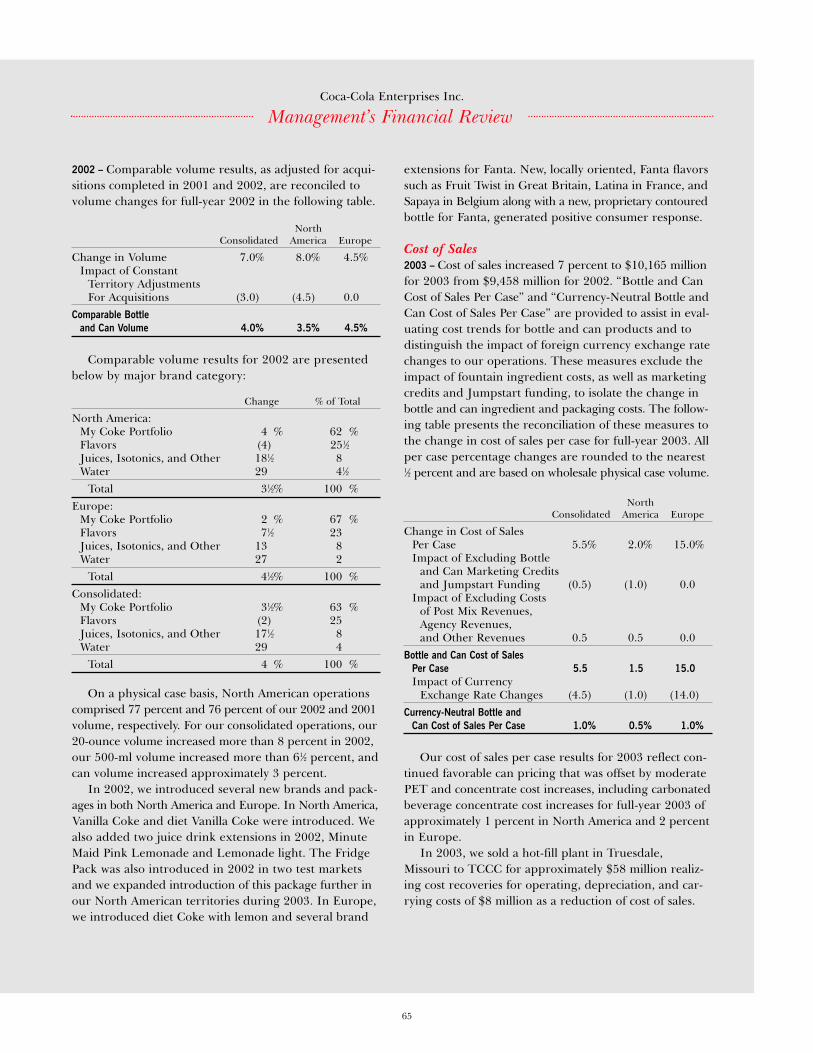
65
2002 – Comparable volume results, as adjusted for acqui-sitions completed in 2001 and 2002, are reconciled tovolume changes for full-year 2002 in the following table.
NorthConsolidated America Europe
Change in Volume 7.0% 8.0% 4.5%Impact of Constant
Territory Adjustments For Acquisitions (3.0) (4.5) 0.0
Comparable Bottle and Can Volume 4.0% 3.5% 4.5%
Comparable volume results for 2002 are presentedbelow by major brand category:
Change % of Total
North America:My Coke Portfolio 4 % 62 %Flavors (4) 251⁄2Juices, Isotonics, and Other 181⁄2 8Water 29 41⁄2
Total 31⁄2% 100 %Europe:
My Coke Portfolio 2 % 67 %Flavors 71⁄2 23Juices, Isotonics, and Other 13 8Water 27 2
Total 41⁄2% 100 %Consolidated:
My Coke Portfolio 31⁄2% 63 %Flavors (2) 25Juices, Isotonics, and Other 171⁄2 8Water 29 4
Total 4 % 100 %
On a physical case basis, North American operationscomprised 77 percent and 76 percent of our 2002 and 2001volume, respectively. For our consolidated operations, our20-ounce volume increased more than 8 percent in 2002,our 500-ml volume increased more than 61⁄2 percent, andcan volume increased approximately 3 percent.
In 2002, we introduced several new brands and pack-ages in both North America and Europe. In North America,Vanilla Coke and diet Vanilla Coke were introduced. Wealso added two juice drink extensions in 2002, MinuteMaid Pink Lemonade and Lemonade light. The FridgePack was also introduced in 2002 in two test marketsand we expanded introduction of this package further inour North American territories during 2003. In Europe,we introduced diet Coke with lemon and several brand
extensions for Fanta. New, locally oriented, Fanta flavorssuch as Fruit Twist in Great Britain, Latina in France, andSapaya in Belgium along with a new, proprietary contouredbottle for Fanta, generated positive consumer response.
Cost of Sales2003 – Cost of sales increased 7 percent to $10,165 millionfor 2003 from $9,458 million for 2002. “Bottle and CanCost of Sales Per Case” and “Currency-Neutral Bottle andCan Cost of Sales Per Case” are provided to assist in eval-uating cost trends for bottle and can products and to distinguish the impact of foreign currency exchange ratechanges to our operations. These measures exclude theimpact of fountain ingredient costs, as well as marketingcredits and Jumpstart funding, to isolate the change inbottle and can ingredient and packaging costs. The follow-ing table presents the reconciliation of these measures tothe change in cost of sales per case for full-year 2003. Allper case percentage changes are rounded to the nearest1⁄2 percent and are based on wholesale physical case volume.
NorthConsolidated America Europe
Change in Cost of Sales Per Case 5.5% 2.0% 15.0%Impact of Excluding Bottle
and Can Marketing Credits and Jumpstart Funding (0.5) (1.0) 0.0
Impact of Excluding Costs of Post Mix Revenues, Agency Revenues, and Other Revenues 0.5 0.5 0.0
Bottle and Can Cost of Sales Per Case 5.5 1.5 15.0Impact of Currency
Exchange Rate Changes (4.5) (1.0) (14.0)Currency-Neutral Bottle and
Can Cost of Sales Per Case 1.0% 0.5% 1.0%
Our cost of sales per case results for 2003 reflect con-tinued favorable can pricing that was offset by moderatePET and concentrate cost increases, including carbonatedbeverage concentrate cost increases for full-year 2003 ofapproximately 1 percent in North America and 2 percentin Europe.
In 2003, we sold a hot-fill plant in Truesdale,Missouri to TCCC for approximately $58 million realiz-ing cost recoveries for operating, depreciation, and car-rying costs of $8 million as a reduction of cost of sales.
Coca-Cola Enterprises Inc.
Management’s Financial Review

66
Coca-Cola Enterprises Inc.
2002 – Cost of sales increased 5 percent to $9,458 millionfor 2002 from $9,015 million for 2001. The followingtable presents the reconciliation of “Bottle and Can Costof Sales Per Case” and “Currency-Neutral Bottle andCan Cost of Sales Per Case” to the change in cost of salesper case for full-year 2002. The changes have been adjustedto include the impact of the Herb acquisition as if com-pleted on January 1, 2001. All per case percentage changesare rounded to the nearest 1⁄2 percent and are based onwholesale physical case volume.
NorthConsolidated America Europe
Change in Cost of Sales Per Case (2.0)% (4.0)% 5.0%Impact of Excluding Bottle
and Can Marketing Credits and Jumpstart Funding 2.0 3.5 (2.5)
Impact of Excluding Costs of Post Mix Revenues, Agency Revenues, and Other Revenues 0.5 0.0 1.5
Impact of Constant Territory Adjustments for Acquisitions 0.5 0.0 0.0
Bottle and Can Cost of Sales Per Case 1.0 (0.5) 4.0Impact of Currency Exchange Rate Changes (1.0) 0.5 (4.5)
Currency-Neutral Bottle and Can Cost of Sales Per Case 0.0% 0.0% (0.5)%
Our cost of sales per case results for 2002 reflect lowerpackaging material costs and favorable overhead costswhich offset our increase in concentrate costs, includingcarbonated beverage concentrate cost increases for full-year 2002 of approximately 11⁄2 percent in North Americaand 21⁄2 percent in Europe.
Selling, Delivery, and Administrative Expenses2003 – Selling, delivery, and administrative (SD&A)expenses increased 7 percent to $5,588 million in 2003from $5,236 million in 2002. The following table presentsthe impact of favorable items and currency exchange rate changes on the change in selling, delivery, andadministrative expenses for 2003 from 2002.
Reported Selling, Delivery, and Administrative Expenses 7%Impact of Insurance Proceeds and Settlement
of Pre-acquisition Contingencies 1Impact of Currency Exchange Rate Changes (3)
Currency-Neutral Change in Selling, Delivery, andAdministrative Expenses 5%
On a currency-neutral basis, this increase reflects ourcommitment to closely manage our costs and controloperating expense growth. On a currency-neutral basis,our reported SD&A expenses increased 3 percent inNorth America and 6 percent in Europe. For NorthAmerica, this change in SD&A expenses excludes thebenefit of $21 million related to the receipt of insuranceproceeds and $14 million related to the settlement ofpre-acquisition contingencies. For Europe, this changein SD&A excludes the benefit of the receipt of $47 mil-lion in insurance proceeds.
The following table presents selling, delivery, and admin-istrative expenses as a percentage of net operating revenues.(in millions):
2003 2002Selling, Delivery, and
Administrative Expenses $ 5,588 $ 5,236Net Operating Revenues 17,330 16,058Selling, Delivery, and Administrative
Expenses as a percentage of Net Operating Revenues 32.2% 32.6%
The decrease in 2003 from 2002 results from ourfavorable increases in volume and net pricing per casepartially offset by moderate SD&A cost growth.
Depreciation expense increased $57 million to $1,022 million for 2003 from $965 million for 2002.Approximately $55 million of this increase was includedin selling, delivery, and administrative expenses withthe balance included in cost of sales. The increase indepreciation expense is a result of increased capitalexpenditures in recent years.
In 2003, our restructuring accrual decreased by $14 million due to payments for severance benefits ofapproximately $13 million and estimate adjustments of approximately $1 million, including payment of allremaining amounts related to Great Britain’s 2002restructuring. The remaining balance of $3 million atDecember 31, 2003 represents remaining severance benefits to be paid.
Management’s Financial Review
67
2002 – SD&A expenses declined approximately 3 percentto $5,236 million in 2002 as compared to reported SD&Aof $5,383 million in 2001. SD&A expenses increased 5 percent from 2001 comparable SD&A expenses of$5,004 million. There were no items in 2002 affectingcomparability of SD&A expenses. A reconciliation ofreported 2001 SD&A to comparable SD&A is presentedbelow (in millions):
2001 Reported Selling, Delivery, and Administrative Expenses $5,383
License intangible amortization (391)2001 restructuring charge (78)Media expenses due to the
change in our media programs (46)SD&A expense for the first 6 months
of 2001 for Herb 1362001 Comparable Selling, Delivery,
and Administrative Expenses $5,004
The 5 percent increase in comparable SD&A expensesin 2002 is primarily attributable to incremental expensesassociated with additional volume, the impact of curren-cy exchange rate changes, and incremental operatingexpenses associated with Project Pinnacle.
The restructuring charges in 2001 related to a seriesof steps designed to improve our cost structure, includ-ing the elimination of unnecessary support functionsfollowing the consolidation of North America into oneoperating unit and streamlining management of theNorth American operations.
Beginning in 2002, all costs associated with local mediaprograms in North America shifted to TCCC. Selling, deliv-ery, and administrative expenses, which included localmedia expense in 2001, would have been approximately$46 million lower had this arrangement been in place in2001. As a result, the shift of local media costs impactsincome statement comparisons between 2002 and 2001.
Depreciation expense increased approximately $64 million for 2002 as compared to 2001. Approximately$50 million of this increase was included in selling, deliv-ery, and administrative expenses with the balance includedin cost of sales. Approximately $23 million of the totalincrease is due to depreciation of assets acquired in theHerb acquisition for a full year in 2002 as compared tosix months for 2001 with the remaining increase result-ing from increased capital expenditures in recent years.
In 2002, our restructuring accrual decreased by approxi-mately $24 million for severance benefits payments of$25 million and estimate reduction adjustments of $4 mil-
lion offset by $5 million in costs for a 2002 restructuringprogram in Great Britain. The restructuring in GreatBritain was from the conversion of refillable bottles tonon-refillable bottles in production and the resultingelimination of approximately 100 positions.
Interest Expense2003 – For 2003, interest expense decreased to $607 mil-lion from $662 million, or approximately 8 percent on a reported basis and 10 percent on a currency-neutralbasis. The change was primarily due to interest marketconditions, a decline in our weighted average cost of debt,and a decrease in our debt balances during 2003. Ourweighted average cost of debt was 5.1 percent for 2003and 5.5 percent for 2002. Our average debt balance for2003 was $12.0 billion as compared to $12.3 billion for2002. For 2003, our cash repayments on debt exceedednew debt borrowings by approximately $761 million.However, our debt balance increased $426 million in2003 from changes in foreign currency exchange rates.At December 31, 2003, 27 percent of our debt portfoliowas comprised of floating-rate debt with the remainderof our portfolio bearing fixed rates.
2002 – For 2002, interest expense decreased to $662 mil-lion from $753 million, or approximately 12 percent ona reported basis and on a currency-neutral basis. Thedecrease was primarily due to interest market conditionsand a decline in our weighted average cost of debt. Ourweighted average cost of debt was 5.5 percent for 2002and 6.3 percent for 2001. Our average debt balance for2002 increased slightly to $12.3 billion as compared toapproximately $11.8 billion for 2001. However, thisincrease in the average balance was primarily associatedwith the effects of noncash FAS 133 fair value adjustmentsand translation adjustments. For 2002, our cash repay-ments of debt exceeded new debt borrowings by approx-imately $520 million. At the end of 2002, 35 percent ofour debt portfolio was comprised of floating-rate debtwith the remainder of our portfolio bearing fixed rates.
Income Tax Expense2003 – Our effective tax rate was 30 percent for 2003 and2002 including the net impact of $8 million in reductionsrecognized for 2003 and $20 million in reductions recog-nized for 2002. Our effective tax rate would have beenapproximately 31 percent for 2003 and 33 percent for2002 excluding these reductions. The reductions in 2003were due to the benefit of favorable tax items resulting
Coca-Cola Enterprises Inc.
Management’s Financial Review
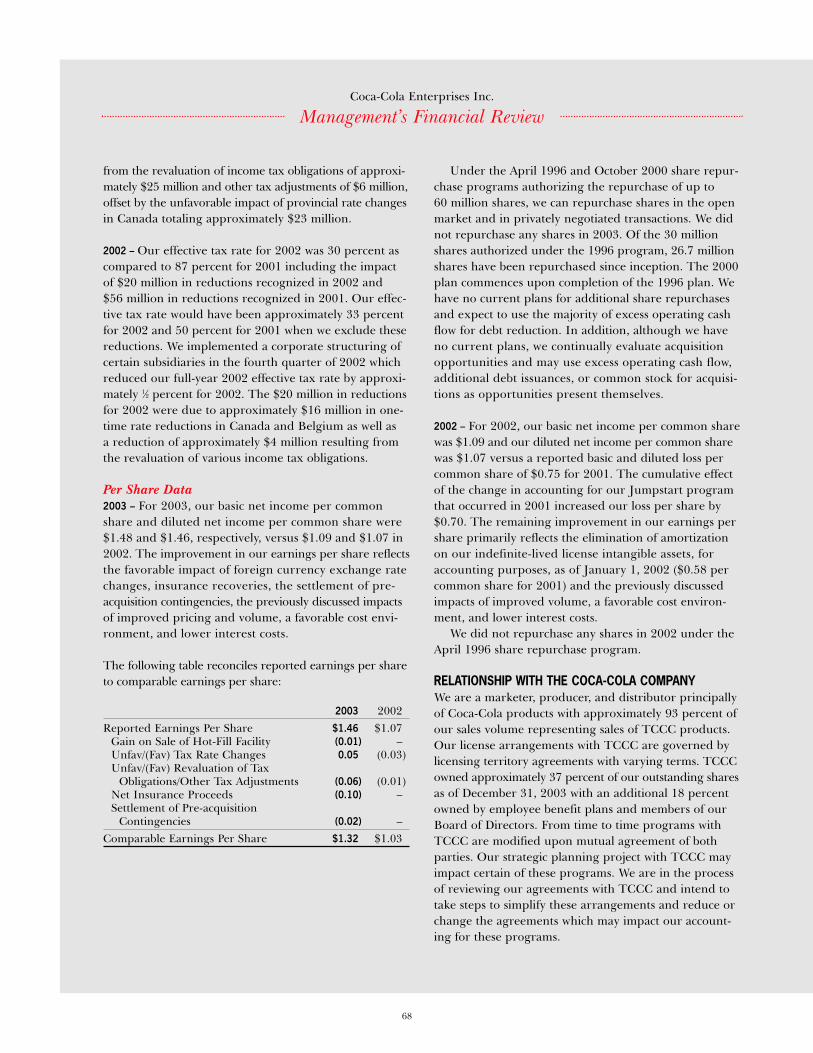
68
Coca-Cola Enterprises Inc.
from the revaluation of income tax obligations of approxi-mately $25 million and other tax adjustments of $6 million,offset by the unfavorable impact of provincial rate changesin Canada totaling approximately $23 million.
2002 – Our effective tax rate for 2002 was 30 percent ascompared to 87 percent for 2001 including the impactof $20 million in reductions recognized in 2002 and $56 million in reductions recognized in 2001. Our effec-tive tax rate would have been approximately 33 percentfor 2002 and 50 percent for 2001 when we exclude thesereductions. We implemented a corporate structuring ofcertain subsidiaries in the fourth quarter of 2002 whichreduced our full-year 2002 effective tax rate by approxi-mately 1⁄2 percent for 2002. The $20 million in reductionsfor 2002 were due to approximately $16 million in one-time rate reductions in Canada and Belgium as well as a reduction of approximately $4 million resulting fromthe revaluation of various income tax obligations.
Per Share Data2003 – For 2003, our basic net income per commonshare and diluted net income per common share were$1.48 and $1.46, respectively, versus $1.09 and $1.07 in2002. The improvement in our earnings per share reflectsthe favorable impact of foreign currency exchange ratechanges, insurance recoveries, the settlement of pre-acquisition contingencies, the previously discussed impactsof improved pricing and volume, a favorable cost envi-ronment, and lower interest costs.
The following table reconciles reported earnings per shareto comparable earnings per share:
2003 2002Reported Earnings Per Share $1.46 $1.07
Gain on Sale of Hot-Fill Facility (0.01) –Unfav/(Fav) Tax Rate Changes 0.05 (0.03)Unfav/(Fav) Revaluation of Tax
Obligations/Other Tax Adjustments (0.06) (0.01)Net Insurance Proceeds (0.10) –Settlement of Pre-acquisition
Contingencies (0.02) –Comparable Earnings Per Share $1.32 $1.03
Under the April 1996 and October 2000 share repur-chase programs authorizing the repurchase of up to 60 million shares, we can repurchase shares in the openmarket and in privately negotiated transactions. We didnot repurchase any shares in 2003. Of the 30 millionshares authorized under the 1996 program, 26.7 millionshares have been repurchased since inception. The 2000plan commences upon completion of the 1996 plan. Wehave no current plans for additional share repurchasesand expect to use the majority of excess operating cashflow for debt reduction. In addition, although we haveno current plans, we continually evaluate acquisitionopportunities and may use excess operating cash flow,additional debt issuances, or common stock for acquisi-tions as opportunities present themselves.
2002 – For 2002, our basic net income per common sharewas $1.09 and our diluted net income per common sharewas $1.07 versus a reported basic and diluted loss percommon share of $0.75 for 2001. The cumulative effectof the change in accounting for our Jumpstart programthat occurred in 2001 increased our loss per share by$0.70. The remaining improvement in our earnings pershare primarily reflects the elimination of amortizationon our indefinite-lived license intangible assets, foraccounting purposes, as of January 1, 2002 ($0.58 percommon share for 2001) and the previously discussedimpacts of improved volume, a favorable cost environ-ment, and lower interest costs.
We did not repurchase any shares in 2002 under theApril 1996 share repurchase program.
RELATIONSHIP WITH THE COCA-COLA COMPANYWe are a marketer, producer, and distributor principallyof Coca-Cola products with approximately 93 percent ofour sales volume representing sales of TCCC products.Our license arrangements with TCCC are governed bylicensing territory agreements with varying terms. TCCCowned approximately 37 percent of our outstanding sharesas of December 31, 2003 with an additional 18 percentowned by employee benefit plans and members of ourBoard of Directors. From time to time programs withTCCC are modified upon mutual agreement of bothparties. Our strategic planning project with TCCC mayimpact certain of these programs. We are in the processof reviewing our agreements with TCCC and intend totake steps to simplify these arrangements and reduce orchange the agreements which may impact our account-ing for these programs.
Management’s Financial Review
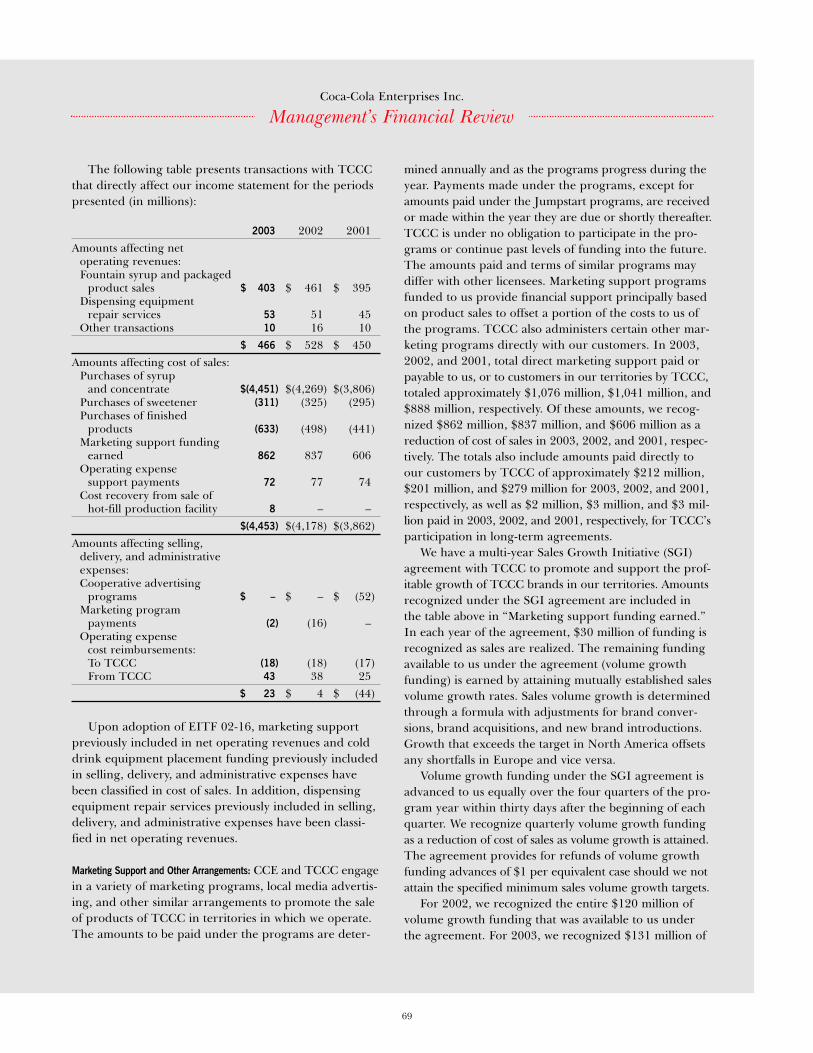
69
The following table presents transactions with TCCCthat directly affect our income statement for the periodspresented (in millions):
2003 2002 2001Amounts affecting net
operating revenues:Fountain syrup and packaged
product sales $ 403 $ 461 $ 395Dispensing equipment
repair services 53 51 45Other transactions 10 16 10
$ 466 $ 528 $ 450Amounts affecting cost of sales:
Purchases of syrup and concentrate $(4,451) $(4,269) $(3,806)
Purchases of sweetener (311) (325) (295)Purchases of finished
products (633) (498) (441)Marketing support funding
earned 862 837 606Operating expense
support payments 72 77 74Cost recovery from sale of
hot-fill production facility 8 – –$(4,453) $(4,178) $(3,862)
Amounts affecting selling, delivery, and administrative expenses:Cooperative advertising
programs $ – $ – $ (52)Marketing program
payments (2) (16) –Operating expense
cost reimbursements:To TCCC (18) (18) (17)From TCCC 43 38 25
$ 23 $ 4 $ (44)
Upon adoption of EITF 02-16, marketing supportpreviously included in net operating revenues and colddrink equipment placement funding previously includedin selling, delivery, and administrative expenses havebeen classified in cost of sales. In addition, dispensingequipment repair services previously included in selling,delivery, and administrative expenses have been classi-fied in net operating revenues.
Marketing Support and Other Arrangements: CCE and TCCC engagein a variety of marketing programs, local media advertis-ing, and other similar arrangements to promote the saleof products of TCCC in territories in which we operate.The amounts to be paid under the programs are deter-
mined annually and as the programs progress during theyear. Payments made under the programs, except foramounts paid under the Jumpstart programs, are receivedor made within the year they are due or shortly thereafter.TCCC is under no obligation to participate in the pro-grams or continue past levels of funding into the future.The amounts paid and terms of similar programs maydiffer with other licensees. Marketing support programsfunded to us provide financial support principally basedon product sales to offset a portion of the costs to us ofthe programs. TCCC also administers certain other mar-keting programs directly with our customers. In 2003,2002, and 2001, total direct marketing support paid orpayable to us, or to customers in our territories by TCCC,totaled approximately $1,076 million, $1,041 million, and$888 million, respectively. Of these amounts, we recog-nized $862 million, $837 million, and $606 million as areduction of cost of sales in 2003, 2002, and 2001, respec-tively. The totals also include amounts paid directly toour customers by TCCC of approximately $212 million,$201 million, and $279 million for 2003, 2002, and 2001,respectively, as well as $2 million, $3 million, and $3 mil-lion paid in 2003, 2002, and 2001, respectively, for TCCC’sparticipation in long-term agreements.
We have a multi-year Sales Growth Initiative (SGI)agreement with TCCC to promote and support the prof-itable growth of TCCC brands in our territories. Amountsrecognized under the SGI agreement are included in the table above in “Marketing support funding earned.”In each year of the agreement, $30 million of funding isrecognized as sales are realized. The remaining fundingavailable to us under the agreement (volume growthfunding) is earned by attaining mutually established salesvolume growth rates. Sales volume growth is determinedthrough a formula with adjustments for brand conver-sions, brand acquisitions, and new brand introductions.Growth that exceeds the target in North America offsetsany shortfalls in Europe and vice versa.
Volume growth funding under the SGI agreement isadvanced to us equally over the four quarters of the pro-gram year within thirty days after the beginning of eachquarter. We recognize quarterly volume growth fundingas a reduction of cost of sales as volume growth is attained.The agreement provides for refunds of volume growthfunding advances of $1 per equivalent case should we notattain the specified minimum sales volume growth targets.
For 2002, we recognized the entire $120 million ofvolume growth funding that was available to us underthe agreement. For 2003, we recognized $131 million of
Coca-Cola Enterprises Inc.
Management’s Financial Review
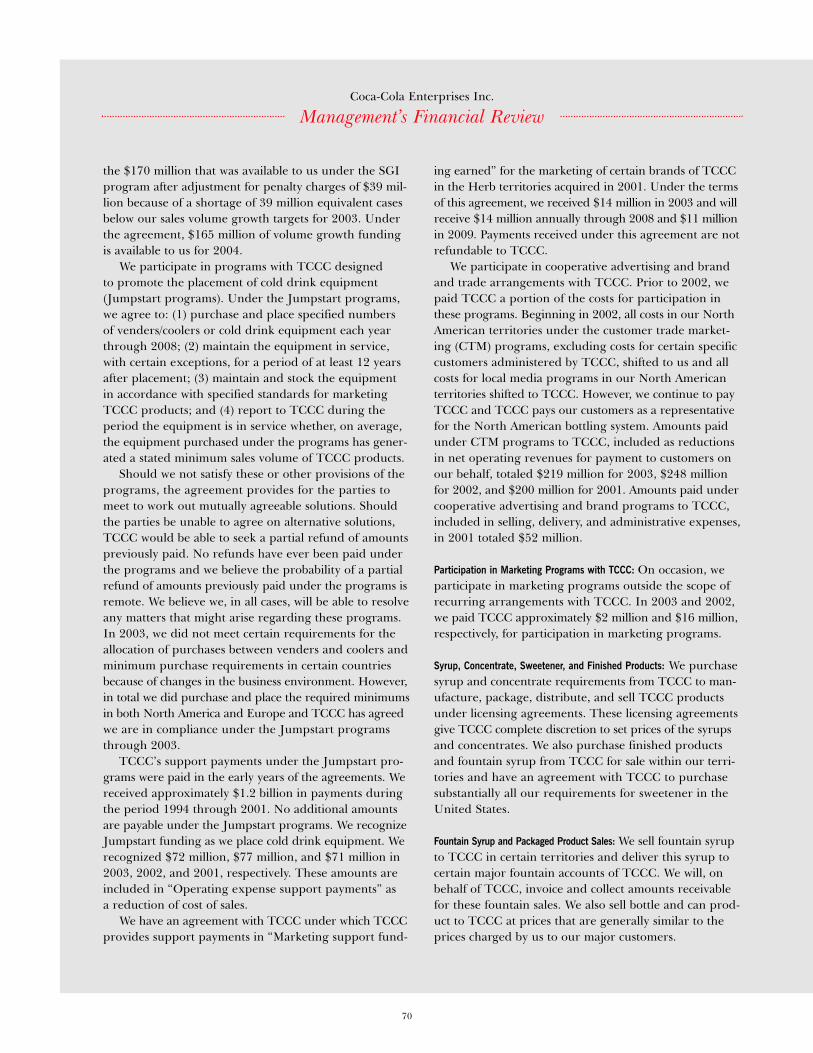
70
Coca-Cola Enterprises Inc.
the $170 million that was available to us under the SGIprogram after adjustment for penalty charges of $39 mil-lion because of a shortage of 39 million equivalent casesbelow our sales volume growth targets for 2003. Underthe agreement, $165 million of volume growth fundingis available to us for 2004.
We participate in programs with TCCC designed to promote the placement of cold drink equipment(Jumpstart programs). Under the Jumpstart programs,we agree to: (1) purchase and place specified numbers of venders/coolers or cold drink equipment each yearthrough 2008; (2) maintain the equipment in service,with certain exceptions, for a period of at least 12 yearsafter placement; (3) maintain and stock the equipmentin accordance with specified standards for marketingTCCC products; and (4) report to TCCC during theperiod the equipment is in service whether, on average,the equipment purchased under the programs has gener-ated a stated minimum sales volume of TCCC products.
Should we not satisfy these or other provisions of theprograms, the agreement provides for the parties tomeet to work out mutually agreeable solutions. Shouldthe parties be unable to agree on alternative solutions,TCCC would be able to seek a partial refund of amountspreviously paid. No refunds have ever been paid underthe programs and we believe the probability of a partialrefund of amounts previously paid under the programs isremote. We believe we, in all cases, will be able to resolveany matters that might arise regarding these programs.In 2003, we did not meet certain requirements for theallocation of purchases between venders and coolers andminimum purchase requirements in certain countriesbecause of changes in the business environment. However,in total we did purchase and place the required minimumsin both North America and Europe and TCCC has agreedwe are in compliance under the Jumpstart programsthrough 2003.
TCCC’s support payments under the Jumpstart pro-grams were paid in the early years of the agreements. Wereceived approximately $1.2 billion in payments duringthe period 1994 through 2001. No additional amountsare payable under the Jumpstart programs. We recognizeJumpstart funding as we place cold drink equipment. Werecognized $72 million, $77 million, and $71 million in2003, 2002, and 2001, respectively. These amounts areincluded in “Operating expense support payments” as a reduction of cost of sales.
We have an agreement with TCCC under which TCCCprovides support payments in “Marketing support fund-
ing earned” for the marketing of certain brands of TCCCin the Herb territories acquired in 2001. Under the termsof this agreement, we received $14 million in 2003 and willreceive $14 million annually through 2008 and $11 millionin 2009. Payments received under this agreement are notrefundable to TCCC.
We participate in cooperative advertising and brandand trade arrangements with TCCC. Prior to 2002, wepaid TCCC a portion of the costs for participation inthese programs. Beginning in 2002, all costs in our NorthAmerican territories under the customer trade market-ing (CTM) programs, excluding costs for certain specificcustomers administered by TCCC, shifted to us and allcosts for local media programs in our North Americanterritories shifted to TCCC. However, we continue to payTCCC and TCCC pays our customers as a representativefor the North American bottling system. Amounts paidunder CTM programs to TCCC, included as reductionsin net operating revenues for payment to customers onour behalf, totaled $219 million for 2003, $248 millionfor 2002, and $200 million for 2001. Amounts paid undercooperative advertising and brand programs to TCCC,included in selling, delivery, and administrative expenses,in 2001 totaled $52 million.
Participation in Marketing Programs with TCCC: On occasion, weparticipate in marketing programs outside the scope ofrecurring arrangements with TCCC. In 2003 and 2002,we paid TCCC approximately $2 million and $16 million,respectively, for participation in marketing programs.
Syrup, Concentrate, Sweetener, and Finished Products: We purchasesyrup and concentrate requirements from TCCC to man-ufacture, package, distribute, and sell TCCC productsunder licensing agreements. These licensing agreementsgive TCCC complete discretion to set prices of the syrupsand concentrates. We also purchase finished productsand fountain syrup from TCCC for sale within our terri-tories and have an agreement with TCCC to purchasesubstantially all our requirements for sweetener in theUnited States.
Fountain Syrup and Packaged Product Sales: We sell fountain syrupto TCCC in certain territories and deliver this syrup tocertain major fountain accounts of TCCC. We will, onbehalf of TCCC, invoice and collect amounts receivablefor these fountain sales. We also sell bottle and can prod-uct to TCCC at prices that are generally similar to theprices charged by us to our major customers.
Management’s Financial Review
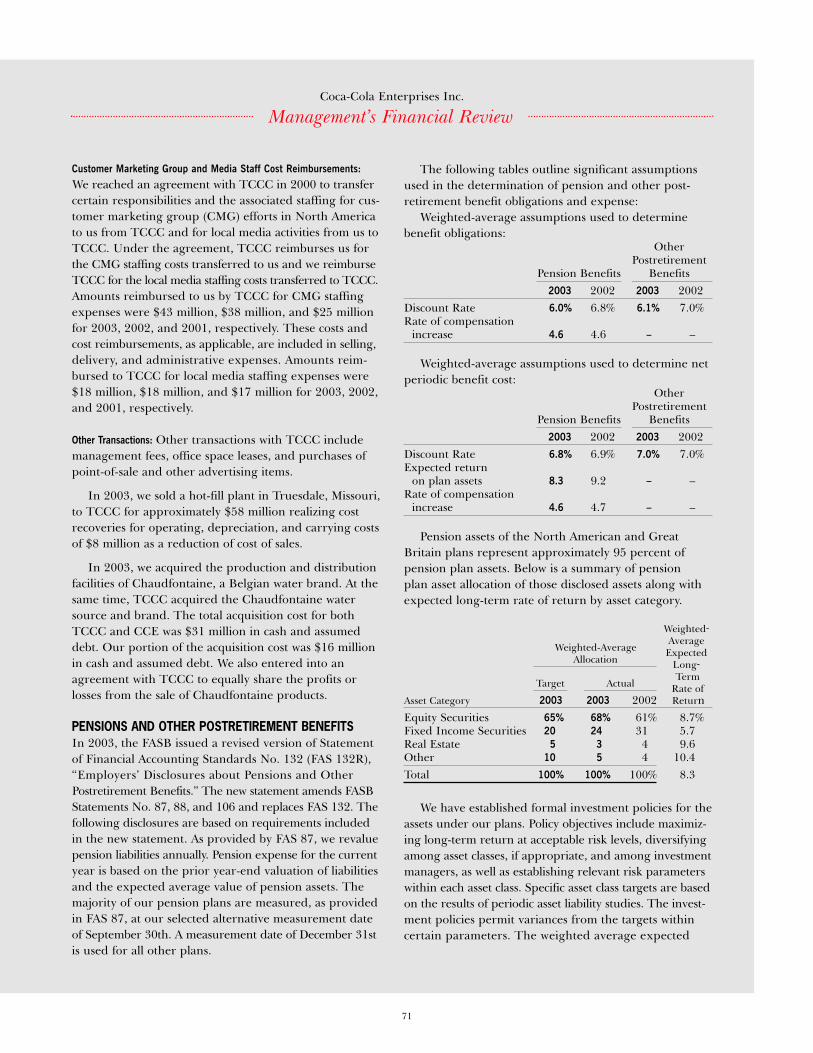
71
Customer Marketing Group and Media Staff Cost Reimbursements:We reached an agreement with TCCC in 2000 to transfercertain responsibilities and the associated staffing for cus-tomer marketing group (CMG) efforts in North Americato us from TCCC and for local media activities from us toTCCC. Under the agreement, TCCC reimburses us forthe CMG staffing costs transferred to us and we reimburseTCCC for the local media staffing costs transferred to TCCC.Amounts reimbursed to us by TCCC for CMG staffingexpenses were $43 million, $38 million, and $25 millionfor 2003, 2002, and 2001, respectively. These costs andcost reimbursements, as applicable, are included in selling,delivery, and administrative expenses. Amounts reim-bursed to TCCC for local media staffing expenses were$18 million, $18 million, and $17 million for 2003, 2002,and 2001, respectively.
Other Transactions: Other transactions with TCCC includemanagement fees, office space leases, and purchases ofpoint-of-sale and other advertising items.
In 2003, we sold a hot-fill plant in Truesdale, Missouri,to TCCC for approximately $58 million realizing costrecoveries for operating, depreciation, and carrying costsof $8 million as a reduction of cost of sales.
In 2003, we acquired the production and distributionfacilities of Chaudfontaine, a Belgian water brand. At thesame time, TCCC acquired the Chaudfontaine watersource and brand. The total acquisition cost for bothTCCC and CCE was $31 million in cash and assumeddebt. Our portion of the acquisition cost was $16 millionin cash and assumed debt. We also entered into anagreement with TCCC to equally share the profits orlosses from the sale of Chaudfontaine products.
PENSIONS AND OTHER POSTRETIREMENT BENEFITSIn 2003, the FASB issued a revised version of Statementof Financial Accounting Standards No. 132 (FAS 132R),“Employers’ Disclosures about Pensions and OtherPostretirement Benefits.” The new statement amends FASBStatements No. 87, 88, and 106 and replaces FAS 132. Thefollowing disclosures are based on requirements includedin the new statement. As provided by FAS 87, we revaluepension liabilities annually. Pension expense for the currentyear is based on the prior year-end valuation of liabilitiesand the expected average value of pension assets. Themajority of our pension plans are measured, as providedin FAS 87, at our selected alternative measurement dateof September 30th. A measurement date of December 31stis used for all other plans.
The following tables outline significant assumptionsused in the determination of pension and other post-retirement benefit obligations and expense:
Weighted-average assumptions used to determinebenefit obligations:
OtherPostretirement
Pension Benefits Benefits2003 2002 2003 2002
Discount Rate 6.0% 6.8% 6.1% 7.0%Rate of compensation
increase 4.6 4.6 – –
Weighted-average assumptions used to determine netperiodic benefit cost:
OtherPostretirement
Pension Benefits Benefits2003 2002 2003 2002
Discount Rate 6.8% 6.9% 7.0% 7.0%Expected return
on plan assets 8.3 9.2 – –Rate of compensation
increase 4.6 4.7 – –
Pension assets of the North American and GreatBritain plans represent approximately 95 percent ofpension plan assets. Below is a summary of pension plan asset allocation of those disclosed assets along withexpected long-term rate of return by asset category.
Weighted-Average
Weighted-Average ExpectedAllocation Long-
TermTarget Actual Rate of
Asset Category 2003 2003 2002 ReturnEquity Securities 65% 68% 61% 8.7%Fixed Income Securities 20 24 31 5.7Real Estate 5 3 4 9.6Other 10 5 4 10.4Total 100% 100% 100% 8.3
We have established formal investment policies for theassets under our plans. Policy objectives include maximiz-ing long-term return at acceptable risk levels, diversifyingamong asset classes, if appropriate, and among investmentmanagers, as well as establishing relevant risk parameterswithin each asset class. Specific asset class targets are basedon the results of periodic asset liability studies. The invest-ment policies permit variances from the targets withincertain parameters. The weighted average expected
Coca-Cola Enterprises Inc.
Management’s Financial Review
72
Coca-Cola Enterprises Inc.
long-term rate of return is based on a fourth quarter 2003review of such rates with input from our investment con-sultants and managers. Our Fixed Income Securitiesportfolio is invested primarily in commingled funds andmanaged for overall return expectations rather thanmatching duration against plan liabilities; therefore, debtmaturities are not significant to the plan performance.
In managing pension plan assets, we utilize a combi-nation of active and passive fund management to maximizepension returns within established risk parameters. Weperiodically revise asset allocations to improve returns.We complete periodic studies that highlight historicalExpected Return on Assets (EROA), the range of EROAthat we might expect based on the current allocation ofpension assets, indications of potential future fundingrequirements and pension expense.
As a result of asset losses and the decline in discountrates in recent years, pension expense in future periodswill increase when unrecognized losses exceed the definedcorridor of losses under FAS 87. Pension expense for 2004will increase to approximately $150 million as comparedto $90 million for 2003, an increase of $60 million. Thisincrease primarily results from actuarial loss increases tobe recognized of $50 million principally resulting from thedecrease in the average discount rate from 6.8 percentfor 2003 to 6.0 percent for 2004. Losses will be amortizedto expense until such time as, for example, increases inasset values and/or discount rates reduce unrecognizedlosses below the defined corridor.
Unrecognized losses net of gains totaling $913 millionare deferred under FAS 87 through 2003. Also underFAS 87, net recognized pension liabilities have increasedby $515 million through charges to other comprehensiveincome of $483 million, before income taxes, and recog-nition of an intangible asset of $32 million. Charges toother comprehensive income, net of tax, for 2003 and2002 were $106 million and $105 million, respectively.
Consolidated pension contributions were $197 mil-lion and $76 million in 2003 and 2002, respectively, ofwhich U.S. contributions represented $168 million and$57 million, respectively. Our policy is to fund the U.S.pension plans at a level to maintain, within establishedguidelines, the IRS-defined 90 Percent Current LiabilityFunded status. At January 1, 2003, the date of the mostrecent calculation, all U.S. funded defined benefit pen-sion plans reflected Current Liability Funded status
equal to or greater than 90 percent. In accordance withcalculation guidelines, the January 1, 2003 CurrentLiability Funded status reflects the third quarter 2003contributions as a receivable. In order to maintain a 90 Percent Current Liability Funded status, which is notrequired but has been selected by us, we currently esti-mate that pension contributions to U.S. plans in 2004will be approximately $225 million. This estimate, how-ever, may be significantly affected by pending legislationthat is expected to be finalized by the end of the firstquarter of 2004. The primary Canadian plan does notrequire contributions at this time. Contributions to theprimary U.K. plan are based on a percentage of employ-ees’ pay. Contributions to other postretirement benefitplans were $20 million in 2003 and are expected to beapproximately $22 million in 2004.
As outlined in Statement of Financial AccountingStandards No. 87 (FAS 87), “Employers’ Accounting for Pensions,” we utilize the five-year asset smoothingtechnique to recognize market gains and losses for plansrepresenting 84 percent of North American assets.Cumulative losses, net of gains, totaling $174 millionhave been deferred as of December 31, 2003. Pensionexpense in 2004 will increase by $12 million over the 2003level as a result of recognizing previously deferred losses.
Other assumptions used in the calculation of pensionliability and expense include termination assumptions,expected payroll increases, and mortality assumptions.Termination and payroll experience are reviewed on arecurring three-year cycle.
We sponsor unfunded defined benefit postretirementplans providing healthcare and life insurance benefits to substantially all U.S. and Canadian employees whoretire or terminate after qualifying for such benefits. OnDecember 8, 2003, President Bush signed the MedicarePrescription Drug, Improvement and Modernization Actof 2003 (“the Act”) into law. The Act expanded Medicareto include, for the first time, coverage for prescriptiondrugs. We expect that this legislation may eventuallyreduce our costs for some of these programs.
At this point, our investigation into our response to thelegislation is preliminary, as we await guidance from var-ious governmental and regulatory agencies concerningthe requirements that must be met to obtain these costreductions as well as the manner in which such savingsshould be measured. Based on this preliminary analysis,
Management’s Financial Review
73
it appears that some of our retiree medical plans will needto be changed to qualify for beneficial treatment underthe Act, while other plans can continue unchanged.
Because of various uncertainties related to ourresponse to this legislation and the appropriate account-ing methodology for this event, we have elected to deferfinancial recognition of this legislation until the FinancialAccounting Standards Board issues final accounting guid-ance. When issued, that final guidance could require usto change previously reported information. However, sincewe have already taken steps to limit our postretirementmedical benefits, any reductions in postretirement benefitcosts resulting from the Act are not expected to be mate-rial. This deferral election is permitted under FinancialAccounting Standards Board Staff Position No. FAS 106-1,“Accounting and Disclosure Requirements Related to the Medicare Prescription Drug, Improvement andModernization Act of 2003.”
CASH FLOW AND LIQUIDITY REVIEWLiquidity and Capital ResourcesOur sources of capital include, but are not limited to,cash flows from operations, the issuance of public or pri-vate placement debt, bank borrowings, and the issuanceof equity securities. We believe that available short-termand long-term capital resources are sufficient to fundour capital expenditure and working capital require-ments, scheduled debt payments, interest and incometax obligations, dividends to our shareowners, acquisi-tions, and share repurchases.
At December 31, 2003 and 2002, we had approximately$6.8 billion and $3.4 billion, respectively, in available capi-tal under our public debt facilities which could be used forlong-term financing, refinancing of debt maturities, andrefinancing of commercial paper. Of these amounts, wehad available for issuance at December 31, 2003 and 2002(i) $3.2 billion and $0.2 billion, respectively, available underregistration statements with the Securities and ExchangeCommission, (ii) $2.1 billion and $2.0 billion, respectively,in debt securities under a Euro Medium-Term NoteProgram (EMTN), and (iii) $1.5 billion and $1.2 billion($2.0 billion and $1.9 billion Canadian), respectively, in Canadian dollar debt securities under a CanadianMedium-Term Note Program (CMTN). Our S-3 shelfregistration statement to increase the amounts of regis-tered debt securities available for issuance by $3.5 billionbecame effective in August 2003.
In addition, we satisfy seasonal working capital needsand other financing requirements with short-term bor-rowings under our commercial paper programs, bankborrowings, and various lines of credit in the countriesin which we operate. At December 31, 2003 and 2002, wehad approximately $1.0 billion and $1.7 billion, respec-tively, outstanding in commercial paper. At December 31,2003 and 2002, we had approximately $3.3 billion and$3.2 billion, respectively, available as a back-up to com-mercial paper and undrawn working capital lines of credit.We intend to refinance borrowings under our commercialpaper programs and our short-term credit facilities withlonger-term fixed and floating rate financings, as well asrepay a portion of these financings with operating cash flow.At the end of 2003, our debt portfolio contained 73 percentfixed rate debt and 27 percent floating rate debt.
Some of our bank borrowings contain various provi-sions that, among other things, require us to maintain aleverage ratio (defined as consolidated net debt dividedby total capital, including deferred taxes) of less than 75 percent and to limit the incurrence of certain liens orencumbrances in excess of defined amounts. At Decem-ber 31, 2003 and 2002, our leverage ratio was approxi-mately 56 percent and 61 percent, respectively, andsubstantially all of our assets were unencumbered. Thevarious requirements currently are not, and it is notanticipated they will become, restrictive to our liquidityor capital resources. Our public debt has no leveragecovenant requirements but does limit the incurrence ofliens and encumbrances.
Our credit ratings are periodically reviewed by ratingagencies. Currently, our long-term ratings from Moody’s,Standard and Poor’s and Fitch are A2, A, and A, respec-tively. Changes in our operating results, cash flows, orfinancial position could impact the ratings assigned bythe various rating agencies which could ultimately impactour cost of debt. As previously announced, Moody’schanged its rating outlook on us to negative in 2001 butleft the existing rating unchanged. Should Moody’s orany other of these ratings be adjusted downward, wecould incur higher interest costs on new borrowings.
Summary of Cash Activities2003 – Our principal sources of cash consisted of thosederived from operations of $1,805 million and proceedsfrom the issuance of debt aggregating $913 million. Ourprimary uses of cash were for long-term debt repaymentsof $1,674 million and capital expenditures totaling
Coca-Cola Enterprises Inc.
Management’s Financial Review
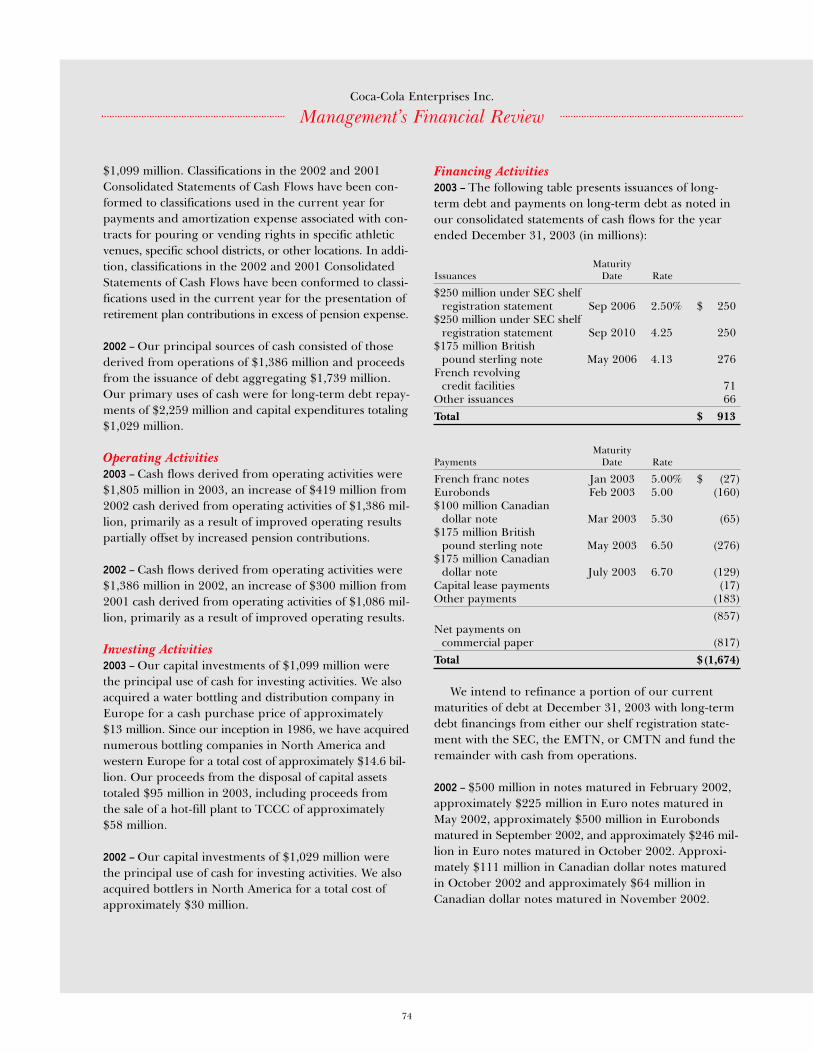
74
Coca-Cola Enterprises Inc.
$1,099 million. Classifications in the 2002 and 2001Consolidated Statements of Cash Flows have been con-formed to classifications used in the current year forpayments and amortization expense associated with con-tracts for pouring or vending rights in specific athleticvenues, specific school districts, or other locations. In addi-tion, classifications in the 2002 and 2001 ConsolidatedStatements of Cash Flows have been conformed to classi-fications used in the current year for the presentation ofretirement plan contributions in excess of pension expense.
2002 – Our principal sources of cash consisted of thosederived from operations of $1,386 million and proceedsfrom the issuance of debt aggregating $1,739 million.Our primary uses of cash were for long-term debt repay-ments of $2,259 million and capital expenditures totaling$1,029 million.
Operating Activities2003 – Cash flows derived from operating activities were$1,805 million in 2003, an increase of $419 million from2002 cash derived from operating activities of $1,386 mil-lion, primarily as a result of improved operating resultspartially offset by increased pension contributions.
2002 – Cash flows derived from operating activities were$1,386 million in 2002, an increase of $300 million from2001 cash derived from operating activities of $1,086 mil-lion, primarily as a result of improved operating results.
Investing Activities2003 – Our capital investments of $1,099 million werethe principal use of cash for investing activities. We alsoacquired a water bottling and distribution company inEurope for a cash purchase price of approximately $13 million. Since our inception in 1986, we have acquirednumerous bottling companies in North America andwestern Europe for a total cost of approximately $14.6 bil-lion. Our proceeds from the disposal of capital assetstotaled $95 million in 2003, including proceeds from the sale of a hot-fill plant to TCCC of approximately $58 million.
2002 – Our capital investments of $1,029 million werethe principal use of cash for investing activities. We alsoacquired bottlers in North America for a total cost ofapproximately $30 million.
Financing Activities2003 – The following table presents issuances of long-term debt and payments on long-term debt as noted inour consolidated statements of cash flows for the yearended December 31, 2003 (in millions):
MaturityIssuances Date Rate
$250 million under SEC shelfregistration statement Sep 2006 2.50% $ 250
$250 million under SEC shelfregistration statement Sep 2010 4.25 250
$175 million British pound sterling note May 2006 4.13 276
French revolving credit facilities 71
Other issuances 66Total $ 913
MaturityPayments Date Rate
French franc notes Jan 2003 5.00% $ (27)Eurobonds Feb 2003 5.00 (160)$100 million Canadian
dollar note Mar 2003 5.30 (65)$175 million British
pound sterling note May 2003 6.50 (276)$175 million Canadian
dollar note July 2003 6.70 (129)Capital lease payments (17)Other payments (183)
(857)Net payments on
commercial paper (817)Total $(1,674)
We intend to refinance a portion of our currentmaturities of debt at December 31, 2003 with long-termdebt financings from either our shelf registration state-ment with the SEC, the EMTN, or CMTN and fund theremainder with cash from operations.
2002 – $500 million in notes matured in February 2002,approximately $225 million in Euro notes matured inMay 2002, approximately $500 million in Eurobondsmatured in September 2002, and approximately $246 mil-lion in Euro notes matured in October 2002. Approxi-mately $111 million in Canadian dollar notes maturedin October 2002 and approximately $64 million inCanadian dollar notes matured in November 2002.
Management’s Financial Review
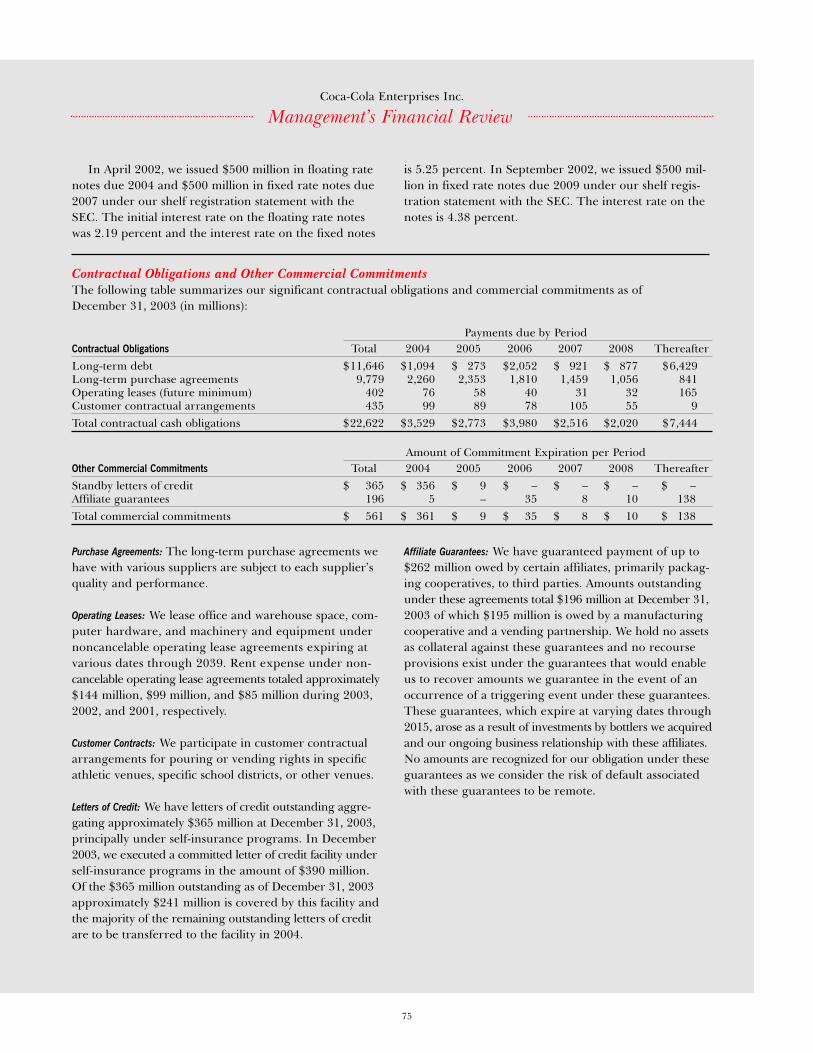
75
Contractual Obligations and Other Commercial CommitmentsThe following table summarizes our significant contractual obligations and commercial commitments as of December 31, 2003 (in millions):
Payments due by PeriodContractual Obligations Total 2004 2005 2006 2007 2008 ThereafterLong-term debt $11,646 $1,094 $ 273 $2,052 $ 921 $ 877 $6,429Long-term purchase agreements 9,779 2,260 2,353 1,810 1,459 1,056 841Operating leases (future minimum) 402 76 58 40 31 32 165Customer contractual arrangements 435 99 89 78 105 55 9Total contractual cash obligations $22,622 $3,529 $2,773 $3,980 $2,516 $2,020 $7,444
Amount of Commitment Expiration per PeriodOther Commercial Commitments Total 2004 2005 2006 2007 2008 ThereafterStandby letters of credit $ 365 $ 356 $ 9 $ – $ – $ – $ –Affiliate guarantees 196 5 – 35 8 10 138Total commercial commitments $ 561 $ 361 $ 9 $ 35 $ 8 $ 10 $ 138
Purchase Agreements: The long-term purchase agreements wehave with various suppliers are subject to each supplier’squality and performance.
Operating Leases: We lease office and warehouse space, com-puter hardware, and machinery and equipment undernoncancelable operating lease agreements expiring atvarious dates through 2039. Rent expense under non-cancelable operating lease agreements totaled approximately$144 million, $99 million, and $85 million during 2003,2002, and 2001, respectively.
Customer Contracts: We participate in customer contractualarrangements for pouring or vending rights in specificathletic venues, specific school districts, or other venues.
Letters of Credit: We have letters of credit outstanding aggre-gating approximately $365 million at December 31, 2003,principally under self-insurance programs. In December2003, we executed a committed letter of credit facility underself-insurance programs in the amount of $390 million.Of the $365 million outstanding as of December 31, 2003approximately $241 million is covered by this facility andthe majority of the remaining outstanding letters of creditare to be transferred to the facility in 2004.
Affiliate Guarantees: We have guaranteed payment of up to$262 million owed by certain affiliates, primarily packag-ing cooperatives, to third parties. Amounts outstandingunder these agreements total $196 million at December 31,2003 of which $195 million is owed by a manufacturingcooperative and a vending partnership. We hold no assetsas collateral against these guarantees and no recourseprovisions exist under the guarantees that would enableus to recover amounts we guarantee in the event of anoccurrence of a triggering event under these guarantees.These guarantees, which expire at varying dates through2015, arose as a result of investments by bottlers we acquiredand our ongoing business relationship with these affiliates.No amounts are recognized for our obligation under theseguarantees as we consider the risk of default associatedwith these guarantees to be remote.
In April 2002, we issued $500 million in floating ratenotes due 2004 and $500 million in fixed rate notes due2007 under our shelf registration statement with theSEC. The initial interest rate on the floating rate noteswas 2.19 percent and the interest rate on the fixed notes
is 5.25 percent. In September 2002, we issued $500 mil-lion in fixed rate notes due 2009 under our shelf regis-tration statement with the SEC. The interest rate on thenotes is 4.38 percent.
Coca-Cola Enterprises Inc.
Management’s Financial Review
76
Coca-Cola Enterprises Inc.
FINANCIAL POSITIONAssets2003 – Prepaid expenses and other current assetsincreased approximately 17 percent to $381 million atDecember 31, 2003 from $325 million at December 31,2002. This increase is primarily due to higher levels ofequipment parts and the effects of currency exchangerate changes. The $401 million increase in property,plant, and equipment, net of allowances for depreciation,resulted from 2003 capital expenditures of approximate-ly $1,099 million and the effects of currency exchange rate changes, offset by the impact of depreciation. Theincrease in license intangible assets resulted primarilyfrom currency exchange rate changes.
2002 – The increase from December 31, 2001 toDecember 31, 2002 of $325 million in our net licenseintangible assets was primarily due to approximately$300 million attributable to the effects of currencyexchange rate changes. The remaining increase inlicense intangible assets is primarily due to acquisitionscompleted in 2002. The change in our goodwill balancein 2002 of $9 million was due to adjustments to thevalue of goodwill acquired in acquisitions completed in2001 totaling $6 million and the recognition of $3 mil-lion in goodwill for acquisitions completed in 2002. The$187 million increase in property, plant, and equipment,net of allowances for depreciation, resulted from 2002capital expenditures of approximately $1,029 millionand the effects of currency exchange rate changes, offsetby depreciation. Our other noncurrent assets increased$167 million in 2002 primarily due to an increase in thefair value of interest rate swap agreements recorded asfair value hedges under FAS 133. An increase in this assetis offset by a corresponding increase in our debt balance.
Liabilities and Shareowners’ Equity2003 – The net decrease in long-term debt of $377 mil-lion in 2003 resulted primarily from the impact of netrepayments of $761 million offset by increases fromchanges in currency exchange rates of approximately$426 million. The decrease in deferred cash paymentsfrom TCCC results primarily from recognition in incomeof approximately $72 million of payments in 2003.
In 2003, changes in currency exchange rates resultedin a net gain recognized in comprehensive income of$486 million. This amount consists of the benefit ofapproximately $572 million in foreign currency transla-tion adjustments offset by the impact of net investmenthedges of $86 million. As foreign currency exchangerates change, translation of the income statements forour international businesses into U.S. dollars affects thecomparability of revenues and expenses between periods.
2002 – The net decrease in long-term debt of $146 mil-lion during 2002 resulted primarily from the impact ofnet debt repayments of $519 million, increases fromchanges in foreign currency exchange rates of approxi-mately $250 million, and an increase in debt balancesdue to fair value adjustments to our interest rate swapagreements. The decrease in deferred cash paymentsfrom TCCC results primarily from the income recogni-tion of approximately $77 million of payments in 2002.
In 2002, changes in foreign currency exchange ratesresulted in a net gain recognized in comprehensiveincome of $142 million. This amount consists of the ben-efit of approximately $219 million in foreign currencytranslation adjustments offset by the impact of netinvestment hedges of $77 million.
Interest Rate and Currency Risk ManagementInterest Rates: Interest rate risk is present with both fixedand floating rate debt. We are also exposed to interestrate risks in international currencies because of ourintent to finance the purchase and cash flow require-ments of our international subsidiaries with local bor-rowings. Interest rates in these markets typically differfrom those in the United States. We use interest rateswap agreements and other risk management instru-ments to manage our fixed/floating debt profile.
Interest rate swap agreements generally involveexchanges of interest payments based on fixed and float-ing interest rates without exchanges of underlying face(notional) amounts of the designated hedges. We con-tinually evaluate the credit quality of counterparties tointerest rate swap agreements and other risk manage-ment instruments and do not believe there is a significantrisk of nonperformance by any of the counterparties.
A one percent change in the interest costs of floatingrate debt outstanding at December 31, 2003 would
Management’s Financial Review
77
change interest expense on an annual basis by approxi-mately $30 million. This amount is determined by calcu-lating the effect of a hypothetical interest rate change onour floating rate debt after giving consideration to ourinterest rate swap agreements and other risk manage-ment instruments. This estimate does not include theeffects of other possible occurrences such as actions tomitigate this risk or changes in our financial structure.
Foreign Currency Exchange Rates: Our European operationsrepresented approximately 24 percent of consolidatedlong-lived assets at the end of 2003 and approximately27 percent of consolidated net operating revenues for 2003.We are exposed to translation risk because operations inCanada and Europe in local currency are translated intoU.S. dollars. As currency exchange rates fluctuate, trans-lation of the income statements of international businessesinto U.S. dollars will affect comparability of revenuesand expenses between years. We hedge a portion of ournet investments in international subsidiaries by creatingforeign denominated debt on the books of the parentcompany. Our revenues are denominated in each inter-national subsidiary’s local currency; thus, we are notexposed to currency transaction risk on our revenues.We are exposed to currency transaction risk on certainpurchases of raw materials made and certain obligationsof our international subsidiaries.
We currently use currency forward agreements andoption contracts to hedge a certain portion of the afore-mentioned raw material purchases. These forwardagreements and option contracts are scheduled to expirein 2004. For the years ended December 31, 2003, 2002,and 2001, the result of a hypothetical 10 percent adversemovement in foreign exchange rates applied to the hedgingagreements and underlying exposures would not havehad a material effect on our earnings on an annual basis.
CURRENT TRENDS AND UNCERTAINTIESContingenciesOur business practices are being reviewed by the EuropeanCommission in various jurisdictions for alleged abuses ofan alleged dominant position under Article 82 of the EUTreaty. We do not believe we have a dominant position inthe relevant markets, or that our current or past commer-cial practices violate EU law. Nonetheless, the Commissionhas considerable discretion in reaching conclusions andlevying fines, which are subject to judicial review. The
Commission has not notified us when it might reach any conclusions.
In addition, we are also the subject of investigationsby Belgian and French competition law authorities forour compliance with respect to competition laws. Theseproceedings are subject to further review and we intendto continue to vigorously defend against an unfavorableoutcome. At this time, it is not possible for us to deter-mine the ultimate outcome of this matter.
Our California subsidiary has been sued by severalcurrent and former employees over alleged violations ofstate wage and hour rules. Our California subsidiary isvigorously defending against the claims but at this time itis not possible to predict the outcome.
Our California subsidiary was also involved in anotherlawsuit by current and former employees over allegedviolations of state wage and hour rules that settled in2001. In late 2003, we received proceeds of approximately$21 million from our insurance carriers to reimburse usfor the cost of this settlement.
In 2000, CCE and TCCC were found by a Texas juryto be jointly liable in a combined amount of $15.2 millionto five plaintiffs, each a distributor of competing bever-age products. These distributors sued alleging that CCEand TCCC engaged in unfair marketing practices. Thetrial court's verdict was upheld by the Texas Court ofAppeals in July 2003; we and TCCC have applied to theTexas Supreme Court for leave to appeal to that court.We believe our accruals are adequate to cover the dam-ages awarded by the trial court if its verdict is allowed tostand. The claims of the three remaining plaintiffs in thiscase remain to be tried and four additional competitorshave filed similar claims against us. We have not providedfor any potential awards under these additional claims.We intend to vigorously defend against these claims.
In June 2003, Riverwood International Corporationfiled a patent infringement suit against MeadWestvacoCorporation in the United States District Court for theNorthern District of Georgia. We currently hold a multi-year supply contract with MeadWestvaco for the supplyof paperboard cartons, including the cartons known as the Fridge Pack. Riverwood’s suit sought to enjoinMeadWestvaco from supplying us with Fridge Pack pack-aging. An agreement related to this suit was reached inlate 2003 requiring us to pay approximately $4 millionto settle any and all claims related to this matter.
Coca-Cola Enterprises Inc.
Management’s Financial Review
78
Coca-Cola Enterprises Inc.
Under the Jumpstart programs with TCCC, we receivedpayments from TCCC for a portion of the cost of devel-oping the infrastructure (consisting primarily of peopleand systems) necessary to support accelerated placementsof cold drink equipment. We recognize the paymentsprimarily as cold drink equipment is placed, through 2008,and over the period we have the potential requirementto move equipment, through 2020. Should we not satisfythe provisions of the programs, the agreement providesfor the parties to meet to work out mutually agreeablesolutions. Should the parties be unable to agree on alter-native solutions, TCCC would be able to seek a partialrefund of amounts previously paid. No refunds haveever been paid under the programs and we believe theprobability of a partial refund of amounts previously paidunder the programs is remote. We believe we, in all cases,will be able to resolve any matters that might arise regard-ing these programs. In 2003, we did not meet certainrequirements for the allocation of purchases betweenvenders and coolers and minimum purchase requirementsin certain countries because of changes in the businessenvironment. However, in total we did purchase andplace the required minimums in both North America andEurope and TCCC has agreed to our compliance underthe Jumpstart programs through 2003.
Under the SGI agreement with TCCC, we are eligibleto receive up to $165 million of “Volume Growth Funding”in 2004 which is to be earned by attaining mutually estab-lished sales volume growth targets for brands owned byTCCC. The annual and quarterly target minimums areestablished for each program year through mutual agree-ments with TCCC. Sales volume growth is determinedthrough a formula with adjustments for brand conver-sions, brand acquisitions, new brand introductions, andperformance in excess of the previous year’s perform-ance. If these minimum targets are not met, penalties of $1 per equivalent case shortfalls to target are offsetagainst the Volume Growth Funding available under theprogram. Under the SGI agreement, quarterly fundingcommitments are advanced at the beginning of eachquarter less penalties for shortfalls to targets not previouslyoffset. We do not anticipate we will incur penalties that willbe offset against the $165 million Volume Growth Fundingavailable to us under the SGI agreement for 2004.
Our tax filings are routinely subjected to audit by taxauthorities in most jurisdictions where we conduct business.These audits may result in assessments of additional taxesthat are subsequently resolved with the authorities orpotentially through the courts. Currently, there areassessments or audits which may lead to assessmentsinvolving certain of our subsidiaries, including our sub-sidiary in Canada, that may not be resolved in the fore-seeable future. We believe we have substantial defenses tothe questions being raised and intend to pursue all legalremedies available if we are unable to reach a resolutionwith the authorities. We believe we have adequately pro-vided for any ultimate amounts that would result fromthese proceedings, however, it is too early to predict afinal outcome in these matters.
In December 2003, we settled our claims against our insurance carriers for the losses we incurred in the1999 Belgian recall. Under the agreement, we received$47.5 million upon the execution of a final settlementagreement in exchange for a release of our claims. Wedo not anticipate any additional recoveries associatedwith the product recall in Belgium.
At January 31, 2004, there were two federal and twostate superfund sites for which CCE and our bottlingsubsidiaries’ involvement or liability as a potentiallyresponsible party (PRP) was unresolved. We believe anyultimate liability under these PRP designations will nothave a material adverse effect on our financial position,cash flows, or results of operations. In addition, we orour bottling subsidiaries have been named PRPs at 35other federal and 10 other state superfund sites undercircumstances that have led us to conclude that either (i) we will have no further liability because we had noresponsibility for having deposited hazardous waste, (ii) our ultimate liability, if any, would be less than$100,000 per site, or (iii) payments made to date will be sufficient to satisfy all liability.
We are a defendant in various other matters of litigationgenerally arising out of the normal course of business.Although it is difficult to predict the ultimate outcome ofthese cases, management believes, based on discussions withcounsel, that any ultimate liability would not materially affectour financial position, results of operations, or liquidity.
Management’s Financial Review
79
OUR WORKFORCEApproximately 19,000 of our 63,000 North Americanemployees are covered by collective bargaining agreements.No single agreement covers more than 3 percent of ouremployees. These collective bargaining agreements expireat varying dates over the next seven years. Approximately8,000 of our 11,000 European employees are also sub-ject to local labor agreements consistent with commonindustry practice in our countries of operation. We believethat expiring labor agreements will be renegotiated onsatisfactory terms in the future and that if any workstoppages were to occur as contracts are being renegoti-ated, they will be limited in duration and would notmaterially impact our earnings or financial condition.
ACCOUNTING DEVELOPMENTSFASB Interpretation No. 46 (FIN 46), “Consolidation of Variable Interest Entities”In January 2003, the FASB issued Interpretation No. 46(FIN 46), “Consolidation of Variable Interest Entities.”FIN 46 requires variable interest entities to be consoli-dated by the primary beneficiary of the entity in certaininstances. FIN 46 is effective for all new variable interestentities created or acquired after January 31, 2003. For
variable interest entities created or acquired prior toFebruary 1, 2003, the provisions of FIN 46 are to beapplied by us in the first quarter of 2004. We participatein manufacturing cooperatives and have ownership in avending partnership. Amounts owed by these entities atDecember 31, 2003 total $240 million. We are currentlyevaluating the implications of the adoption of FIN 46 onour financial position, cash flows, and results of operations.Should we determine under FIN 46 we are required toconsolidate the manufacturing cooperatives and vendingpartnership, our debt balances will increase by theamounts then owed by these entities.
Financial Accounting Standard (FAS) 142, “Goodwilland Other Intangible Assets”As of January 1, 2002, we no longer amortize goodwilland license intangible assets with an indefinite life underFAS 142 but instead evaluate these assets for impairmentannually. The 2001 financial statements do not reflectthe adoption of FAS 142. Had we adopted FAS 142 onJanuary 1, 2001, net income (loss) and basic and dilutednet income (loss) per common share would have been asfollows: (in millions except per share data; per share datacalculated prior to rounding to millions.)
Coca-Cola Enterprises Inc.
Management’s Financial Review
We acquire license territories to expand our market.Prior to the adoption of Financial Accounting StandardNo. 141 (FAS 141), “Business Combinations,” we assignedall costs of acquisitions in excess of the value of tangiblenet assets acquired to license intangible assets with noamounts assigned to goodwill. FAS 141 specifically definesgoodwill and provides criteria to apply when recognizing
other intangible assets. Under FAS 141, beginning with theHerb acquisition in July 2001, we assigned specific valuesto assets, liabilities, and license and customer relationshipintangibles. The residual value represents goodwill whichprimarily results from the synergistic values of the acqui-sition and the establishment of deferred tax liabilities onlicense intangible assets not deductible for income taxes.
Add: LicenseIntangible Income Tax Adjusted
YEAR ENDED DECEMBER 31, 2001: As Reported Amortization Impact for FAS 142
Net income (loss) applicable to common shareowners $ (324) $ 391 $ (142) $ (75)Net income (loss) applicable to common
shareowners per basic and diluted common share $(0.75) $0.91 $(0.33) $(0.17)
80
Coca-Cola Enterprises Inc.
License agreements contain performance requirementsand convey to the licensee the rights to distribute and sellproducts of the licensor within specified territories. Ourdomestic cola license agreements with TCCC do not expire,reflecting a long and ongoing relationship. Our agreementswith TCCC covering our United States non-cola andEuropean and Canadian operations are periodically renew-able. TCCC does not grant perpetual license intangiblerights outside the United States, however, these agree-ments can be renewed with minimal cost for additionalterms at our request. We believe and expect these andother renewable licensor agreements will be renewed ateach expiration date. After evaluation of the renewalprovisions and our mutually beneficial relationship withThe Coca-Cola Company, all license intangible assetshave been assigned an indefinite life for accountingunder FAS 142.
Under FAS 142, we perform our impairment testingof goodwill at the North American and European Grouplevels, our reporting units. Under the provisions of EITFIssue No. 02-7, “Unit of Accounting for Testing Impairmentof Indefinite-Lived Intangible Assets,” we also performour impairment testing of license intangible assets at theNorth American and European group levels.
The fair values of the reporting units and their respec-tive license intangibles are determined using discountedcash flow models similar to those used internally by usfor evaluating acquisitions with comparisons to estimatedmarket values. Our discounted cash flow models for 2003utilize projections of cash flows for ten years, a perpetuityvaluation technique with an assumed long-term growthrate of approximately 2.5 percent, and discounted pro-jected cash flows and terminal values based on our targetednear-term weighted average cost of capital of 7.2 percent.Assumed average growth rates approximated 2 percentconsolidated volume growth, approximately 4.5 percentconsolidated revenue and cost of sales per case growth,approximately 4 percent consolidated administrativeexpense growth, and approximately 5 percent to 6 percentoperating income growth, which we consider conservativefor long-term projections, with differing rates in our NorthAmerican and European groups. Projected cash flows oflicense intangibles are reduced by an approximate 2 per-cent economic charge for workforce, customer relationship,working capital, and property, plant, and equipment assetsof the reporting units. Changes in these assumptions couldmaterially impact the fair value estimates.
Our impairment tests for goodwill and license intangi-ble assets compare the carrying amounts of these assetswith estimated fair values. The fair values of goodwill andlicense intangible assets exceed their carrying amountsand, therefore, the assets are not impaired. Had the carry-ing amounts of goodwill exceeded fair values, a secondstep in the impairment test would be required to measurethe amount of a goodwill impairment loss. This stepwould compare the implied fair values of the reportingunit’s goodwill with the carrying amount of goodwill. If thecarrying amount of the reporting unit goodwill exceedsthe implied fair value of goodwill, an impairment losswould be recognized in an amount equal to that excess.
We provide deferred income taxes on license intangi-ble assets not deductible for tax purposes under FAS 109.Prior to FAS 142, license intangible assets were amortizedover 40 years. As this amortization cost was recognized,the related deferred tax liability was recognized as adecrease in income tax expense. Under FAS 142, previ-ously recognized unamortized balances of license intangibleassets and associated deferred income tax liabilities remainunchanged except upon the recognized impairment inthe value of these assets or any ultimate sale of territories.At December 31, 2003 and 2002, we had approximately$5.0 billion and $4.6 billion of deferred tax liabilities,respectively, on license intangible assets. These deferredtax liabilities, while impacted by tax rate changes andcurrency translations, will decrease only for the reasonsabove but will increase for the effect of any tax deductionsrealized on tax deductible license intangible assets.
Goodwill and license intangible assets at December 31,2003 associated with acquisitions completed in 2003 maycontinue to be adjusted as the values of assets and liabilitiesacquired are finalized.
CRITICAL ACCOUNTING ESTIMATESManagement makes judgmental decisions and estimateswith underlying assumptions when applying accountingprinciples in the preparation of the Company’s financialstatements. Certain critical accounting policies requiringsignificant judgments, estimates, and assumptions aredetailed below. The development and selection of thesecritical accounting policies and the related disclosurehave been reviewed with the Audit Committee of theBoard of Directors.
Management’s Financial Review
81
Management believes the current assumptions andother considerations used to estimate amounts reflectedin our consolidated financial statements are appropriate.However, should actual experience differ from theassumptions and other considerations used in estimatingamounts in the Company’s financial statements, theimpact of these differences could have a material adverseeffect on the Company’s results of operations, and incertain situations, a material adverse effect on theCompany’s financial condition.
Impairment Testing of License Intangible Assets and Goodwill: UnderFAS 142, we test intangible assets with indefinite lives andgoodwill for impairment annually. The fair values of ourlicense intangibles and goodwill exceeded the carryingamounts, and no impairment is indicated. Fair values aredetermined using discounted cash flow models involvingseveral assumptions. These include anticipated growth ratesby geographic region, the long-term anticipated growthrate, estimates of capital charges for license intangibles,and the cash flows discount rate. Changes in our assump-tions could materially impact our fair value estimates.
Assumptions critical to our fair value estimates are: (1) our projected operating income growth rate used in themodel of approximately 5 percent to 6 percent, which man-agement views as conservative for long-term projections,(2) our projected long-term growth rate of 2.5 percent fordetermining terminal value, and (3) our discount rate of7.2 percent, representing our targeted near-term weightedaverage cost of capital (WACC). These and other assump-tions are impacted by economic conditions and expectationsof management and will change in the future based onperiod specific facts and circumstances. Our comparableoperating income growth was 9 percent and 23 percent for2003 and 2002, respectively, and our WACC was 6.8 percentat December 31, 2003. Factors inherent in determiningour WACC are: (1) the value of our common stock, (2) thevariability in the values of our common stock, (3) our inter-est costs on debt and debt market conditions, and (4) theamounts and relationships of debt and equity capital.
Pension Plan Valuations: Critical assumptions made in deter-mination of pension expense and pension plan liabilitiesprincipally are the expected long-term return on assets(EROA) and mortality and termination assumptions. Identification of the appropriate discount rate to be used in the valuations is primarily based on rates of high-
quality, long-term corporate bonds.The EROA is based on long-term expectations, gener-
ally a 30-year horizon, given current investment objectivesand historical results. In managing pension plan assets,we utilize a combination of active and passive fund man-agement in order to maximize pension returns withinestablished risk parameters. We periodically revise assetallocations, where appropriate, to improve returns. Wecomplete periodic studies that highlight historical EROA,the range of EROA that we might expect based on thecurrent allocation of pension assets, indications of poten-tial future funding requirements and pension expense.Consolidated pension expense in 2003 would havechanged by approximately $14 million had the EROAbeen 1 percent higher or lower than the average 8.3 per-cent used by CCE.
As outlined in Statement of Financial AccountingStandards No. 87 (FAS 87), “Employers’ Accounting forPensions,” we utilize the five-year asset smoothing techniqueto recognize market gains and losses for plans represent-ing 84 percent of North American assets. Cumulative losses,net of gains, associated with the North American assetsthat utilize asset smoothing totaling $174 million have beendeferred as of December 31, 2003. Pension expense associ-ated with these assets in 2004 will increase by $12 millionover the 2003 level as a result of recognizing previouslydeferred investment losses.
Other assumptions used in the calculation of pensionliability and expense include termination assumptions,expected payroll increases, and mortality assumptions.
Tax Accounting: Valuation allowances are recognized on taxnet operating losses when it is believed by managementthat some or all of the deferred tax assets will not berealized. Deferred tax assets associated with net operat-ing loss and tax credit carryforwards totaled $594 millionat December 31, 2003. Of this amount, approximately$548 million are associated with U.S. federal and statecarryforwards and $46 million are associated with Cana-dian carryforwards. Management believes the majority ofdeferred tax assets will be realized because of the rever-sal of certain significant timing differences and anticipat-ed future taxable income from operations. However, val-uation allowances of approximately $125 million havebeen provided against a portion of the U.S. federal andstate carryforwards.
Coca-Cola Enterprises Inc.
Management’s Financial Review
82
Coca-Cola Enterprises Inc.
At December 31, 2003 and 2002, our foreign subsid-iaries had approximately $536 million and $390 millionin distributable earnings, respectively. These earningsare exclusive of amounts that would result in little or notax under current laws if remitted in the future. Ourearnings from foreign subsidiaries are considered to beindefinitely reinvested and, therefore, no provision forU.S. federal and state income taxes has been made forthese earnings. Determination of the amount of anyunrecognized deferred income tax liability on theseundistributed earnings is not practicable. Upon distribu-tion of foreign subsidiary earnings in the form of divi-dends or otherwise, we would be subject to both U.S.income taxes, subject to an adjustment for foreign taxcredits, and withholding taxes payable to the variousforeign countries.
Jumpstart Funding Recognition: Beginning in 2001, we recognizesupport payments under the Jumpstart programs generallyas units of equipment are placed. The amount recognizedunder the programs will vary as units of equipment areplaced. We recognize approximately $500 for each unitof equipment placed per year. Our principal requirementunder the programs is the placement of equipment. Forexample, our inability to place 10,000 units of equipmentprojected to be placed in 2004 would reduce our recogni-tion of deferred cash payments from TCCC by $5 millionand possibly require us to refund cash payments previouslyreceived. At December 31, 2003, we have $435 million offunding deferred under this program. Other requirementsunder the programs are generally operating standardsof CCE performed in the normal course of business.Additionally, we believe we would in all cases be able to resolve any matters that might arise regarding theseprograms that could potentially result in a refund ofpayments previously received.
Significant assumptions and judgments made inmaking the computations included: (1) the population ofequipment that could potentially be moved, (2) the costsof moving equipment, (3) requirements of the programsthat are outside routine operations of CCE and couldpotentially be considered material obligations, and (4) theprobability of the assertion of refund rights by TCCC.
CAUTIONARY STATEMENTSCertain expectations and projections regarding the futureperformance of Coca-Cola Enterprises Inc. (“CCE,” “we,”“our,” “us,” or “the Company”) referenced in this AnnualReport and in other reports and proxy statements we filewith the SEC are forward-looking statements. Officersmay also make verbal statements to analysts, investors, themedia, and others that are “forward-looking.” Forward-looking statements include, but are not limited to:
• Projections of revenues, income, earnings per share,capital expenditures, dividends, capital structure orother financial measures;
• Descriptions of anticipated plans or objectives of ourmanagement for operations, products or services;
• Forecasts of performance; and• Assumptions regarding any of the foregoing.
Forward-looking statements involve matters which are not historical facts. Because these statements involveanticipated events or conditions, forward-looking state-ments often include words such as “anticipate,” “believe,”“estimate,” “expect,” “intend,” “plan,” “project,” “target,”“can,” “could,” “may,” “should,” “will,” “would” or simi-lar expressions. Do not unduly rely on forward-lookingstatements. They represent our expectations about thefuture and are not guarantees. Forward-looking state-ments are only as of the date they are made and theymight not be updated to reflect changes as they occurafter the forward-looking statements are made.
For example, in this report, we have forward-lookingstatements regarding our expectations for:
• volume growth;• operating income growth;• cash flows from operations;• net price per case growth;• cost of goods per case growth;• operating expense growth;• concentrate cost increases from
The Coca-Cola Company;• capital expenditures; and• developments in accounting standards.
Management’s Financial Review
83
There are several factors – many beyond our control –that could cause results to differ significantly from ourexpectations. Our expectations are based on then cur-rently available competitive, financial, and economic dataalong with our operating plans and are subject to futureevents and uncertainties. We caution readers that inaddition to the important factors described elsewhere inthis Annual Report, the following factors, among others,could cause our business, results of operations and/orfinancial condition in 2004 and thereafter to differ sig-nificantly from those expressed in any forward-lookingstatements. There are also other factors not described in this Annual Report that could cause results to differfrom our expectations.
Marketplace: The Company’s response to continued andincreased customer and competitor consolidations andmarketplace competition may result in lower than expectednet pricing of our products. In addition, competitive pres-sures may cause channel and product mix to shift frommore profitable cold drink channels and packages andadversely affect our overall pricing. Efforts to improve pric-ing in the future consumption channels of our business mayresult in lower than expected volume. In addition, weatherconditions, particularly in Europe, may have a significantimpact on our sales volume. Net pricing, volume, and costsof sales are the primary determinants of net earnings.
Cost Participation Payments from The Coca-Cola Company (TCCC):Material changes in levels of payments historically providedunder various programs with TCCC, or our inability tomeet the performance requirements for the anticipatedlevels of such support payments, could adversely affectfuture earnings. TCCC is under no obligation to partici-pate in future programs or continue past levels of paymentsinto the future. The current agreement designed to sup-port profitable growth in brands of TCCC in our territoriesmay be canceled by either party prior to the end of a fiscalyear with at least six months’ prior written notice.
The amount of infrastructure funding from TCCCrecognized as an offset to cost of sales in a given year isdependent upon the actual number of units placed inservice. Actual results may differ materially from projec-tions should placement levels be significantly different
than program requirements. Should we not satisfy theprovisions of the infrastructure funding programs andwe are unable to agree with TCCC on an alternativesolution, TCCC would be able to seek partial refund ofamounts previously paid.
Raw Materials: Our forecasts assume no unplanned increasesin the costs of raw materials, ingredients, packaging mate-rials, or supplies. If such increases occur, and we are unableto achieve an increase in pricing to customers by compa-rable amounts, earnings could be adversely affected.
Infrastructure Investment: Projected capacity levels of ourinfrastructure investments may differ from actual if ourvolume growth is not as anticipated. Significant changesfrom our expected timing of returns on cold drinkequipment and employee, fleet, and plant infrastructureinvestments could adversely impact our net income.
Financing Considerations: Changes from our expectations forinterest and currency exchange rates can have a materialimpact on our forecasts. We may not be able to completelymitigate the effect of significant interest rate or currencyexchange rate changes. Changes in our debt rating canhave a material adverse effect on interest costs and ourfinancing sources.
Legal Contingencies: Changes from expectations for theresolution of outstanding legal claims and assessments,including the investigation by the European Commission,could have a material impact on our forecasts andfinancial condition.
Legislative Risk: Our business model is dependent on theavailability of our products in multiple channels andlocations to better satisfy our customers’ needs. Lawsthat restrict our ability to distribute products in schoolsand other venues or materially impact our cash flowscould negatively impact our revenue and profit.
Tax Contingencies: An assessment of additional taxes resultingfrom audits conducted by the Canadian tax authoritiescould have a material impact on our earnings and financial condition.
Coca-Cola Enterprises Inc.
Management’s Financial Review
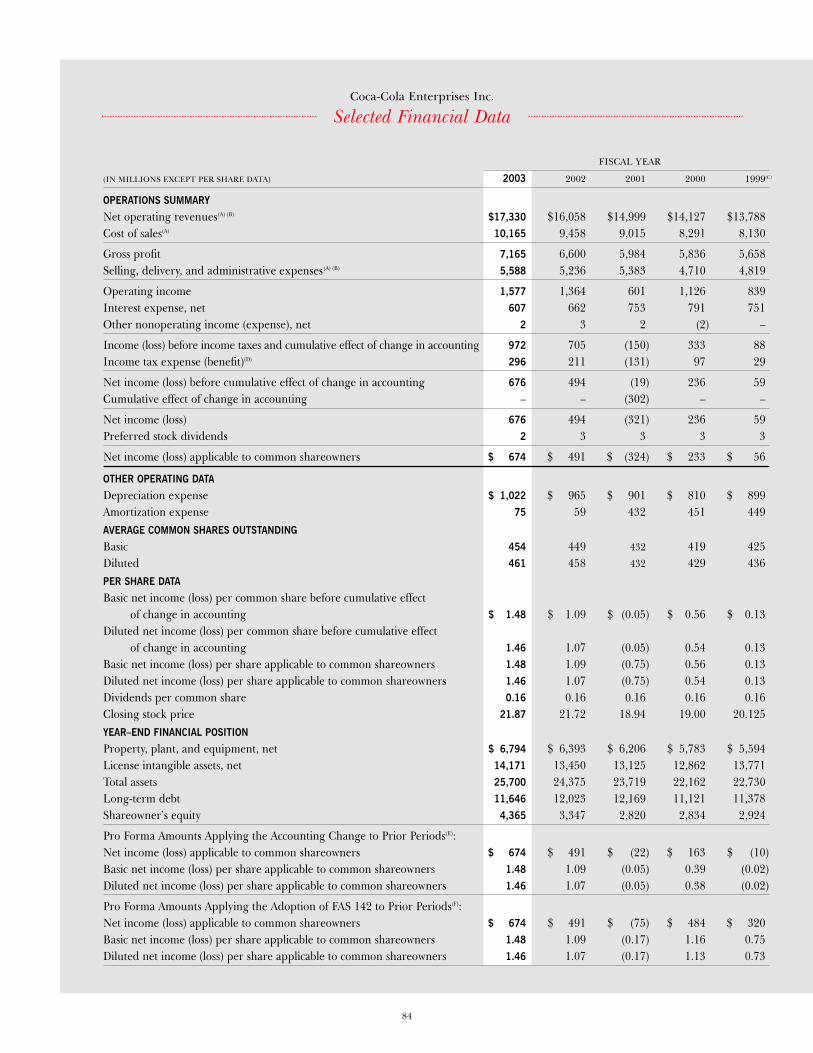
84
Coca-Cola Enterprises Inc.
Selected Financial Data
FISCAL YEAR
(IN MILLIONS EXCEPT PER SHARE DATA) 2003 2002 2001 2000 1999(C)
OPERATIONS SUMMARY
Net operating revenues(A) (B) $17,330 $16,058 $14,999 $14,127 $13,788Cost of sales(A) 10,165 9,458 9,015 8,291 8,130
Gross profit 7,165 6,600 5,984 5,836 5,658Selling, delivery, and administrative expenses(A) (B) 5,588 5,236 5,383 4,710 4,819
Operating income 1,577 1,364 601 1,126 839Interest expense, net 607 662 753 791 751Other nonoperating income (expense), net 2 3 2 (2) –
Income (loss) before income taxes and cumulative effect of change in accounting 972 705 (150) 333 88Income tax expense (benefit)(D) 296 211 (131) 97 29
Net income (loss) before cumulative effect of change in accounting 676 494 (19) 236 59Cumulative effect of change in accounting – – (302) – –
Net income (loss) 676 494 (321) 236 59Preferred stock dividends 2 3 3 3 3
Net income (loss) applicable to common shareowners $ 674 $ 491 $ (324) $ 233 $ 56
OTHER OPERATING DATA
Depreciation expense $ 1,022 $ 965 $ 901 $ 810 $ 899Amortization expense 75 59 432 451 449AVERAGE COMMON SHARES OUTSTANDING
Basic 454 449 432 419 425Diluted 461 458 432 429 436PER SHARE DATA
Basic net income (loss) per common share before cumulative effectof change in accounting $ 1.48 $ 1.09 $ (0.05) $ 0.56 $ 0.13
Diluted net income (loss) per common share before cumulative effectof change in accounting 1.46 1.07 (0.05) 0.54 0.13
Basic net income (loss) per share applicable to common shareowners 1.48 1.09 (0.75) 0.56 0.13Diluted net income (loss) per share applicable to common shareowners 1.46 1.07 (0.75) 0.54 0.13Dividends per common share 0.16 0.16 0.16 0.16 0.16Closing stock price 21.87 21.72 18.94 19.00 20.125YEAR–END FINANCIAL POSITION
Property, plant, and equipment, net $ 6,794 $ 6,393 $ 6,206 $ 5,783 $ 5,594License intangible assets, net 14,171 13,450 13,125 12,862 13,771Total assets 25,700 24,375 23,719 22,162 22,730Long-term debt 11,646 12,023 12,169 11,121 11,378Shareowner’s equity 4,365 3,347 2,820 2,834 2,924
Pro Forma Amounts Applying the Accounting Change to Prior Periods(E): Net income (loss) applicable to common shareowners $ 674 $ 491 $ (22) $ 163 $ (10)Basic net income (loss) per share applicable to common shareowners 1.48 1.09 (0.05) 0.39 (0.02)Diluted net income (loss) per share applicable to common shareowners 1.46 1.07 (0.05) 0.38 (0.02)
Pro Forma Amounts Applying the Adoption of FAS 142 to Prior Periods(F): Net income (loss) applicable to common shareowners $ 674 $ 491 $ (75) $ 484 $ 320Basic net income (loss) per share applicable to common shareowners 1.48 1.09 (0.17) 1.16 0.75Diluted net income (loss) per share applicable to common shareowners 1.46 1.07 (0.17) 1.13 0.73
85
Coca-Cola Enterprises Inc.
Notes – We made acquisitions in each year presented. Such transactions did not significantly affect our operating results in any one fiscal period. All acquisitions have been included in our consolidated operating results from their respective transaction dates.
(A) Balances reflect the adoption of Emerging Issues Task Force (EITF) No. 02-16, “Accounting by a Customer (Including a Reseller) for CashConsideration Received from a Vendor.” Upon adoption of EITF 02-16 in the first quarter of 2003, we classified the following amounts in the2002, 2001, 2000 and 1999 income statements as reductions in cost of sales: approximately $882 million, $651 million, $573 million, and$575 million, respectively, of direct marketing support from The Coca-Cola Company (TCCC) and other licensors previously included in net oper-ating revenues, and approximately $77 million, $74 million, $219 million and $310 million, respectively, of cold drink equipment placementfunding from TCCC previously included as a reduction in selling, delivery, and administrative expenses for the years ended December 31, 2002,2001, 2000 and 1999. We also classified in net operating revenues $51 million, $45 million, $41 million, and $40 million, respectively, of netpayments for dispensing equipment repair services received from TCCC, previously included in selling, delivery, and administrative expenses forthe years ended December 31, 2002, 2001, 2000 and 1999.
(B) Balances reflect the adoption of EITF No. 01-09, effective as of January 1, 2002. The adoption of this pronouncement resulted in the reclassificationto deductions from net operating revenues of approximately $95 million, $91 million, and $83 million in 2001, 2000, and 1999, respectively,previously classified as selling expenses.
(C) 1999 results include a one-time charge of $103 million ($0.16 per common share after tax) for costs associated with recalled product in certainparts of Europe. These costs were allocated $91 million to cost of sales and $12 million to selling, delivery, and administrative expenses.
(D) Income tax expense (benefit) includes expense associated with tax rate changes of approximately $23 million in 2003 and tax rate change benefits of$16 million in 2002, $56 million in 2001, and $8 million in 2000. Income tax expense (benefit) also includes benefits of approximately $25 millionrelated to the revaluation of various income tax obligations and $6 million related to other tax adjustments in 2003 and $4 million related to therevaluation of various income tax obligations in 2002.
(E) Pro forma amounts assume the accounting change for Jumpstart payments received from TCCC, adopted as of January 1, 2001, was appliedretroactively without regard to any changes in the business that could have resulted had the accounting been different in these periods.
(F) Pro forma amounts illustrate the impact of adoption of the non-amortization provisions of FAS 142 for all periods presented.
Selected Financial Data
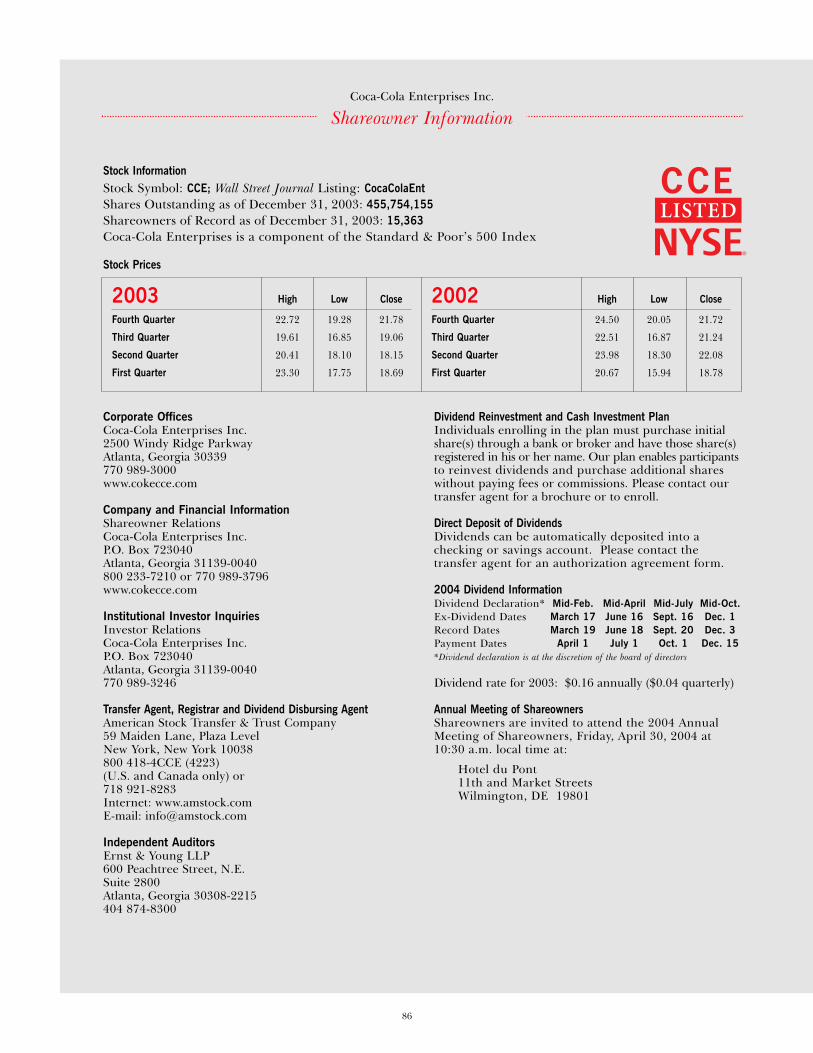
86
Shareowner InformationCoca-Cola Enterprises Inc.
Corporate OfficesCoca-Cola Enterprises Inc.2500 Windy Ridge ParkwayAtlanta, Georgia 30339770 989-3000www.cokecce.com
Company and Financial InformationShareowner Relations Coca-Cola Enterprises Inc.P.O. Box 723040Atlanta, Georgia 31139-0040800 233-7210 or 770 989-3796www.cokecce.com
Institutional Investor InquiriesInvestor Relations Coca-Cola Enterprises Inc.P.O. Box 723040Atlanta, Georgia 31139-0040770 989-3246
Transfer Agent, Registrar and Dividend Disbursing AgentAmerican Stock Transfer & Trust Company59 Maiden Lane, Plaza LevelNew York, New York 10038800 418-4CCE (4223)(U.S. and Canada only) or718 921-8283Internet: www.amstock.comE-mail: [email protected]
Independent AuditorsErnst & Young LLP600 Peachtree Street, N.E.Suite 2800Atlanta, Georgia 30308-2215404 874-8300
Dividend Reinvestment and Cash Investment PlanIndividuals enrolling in the plan must purchase initialshare(s) through a bank or broker and have those share(s)registered in his or her name. Our plan enables participantsto reinvest dividends and purchase additional shareswithout paying fees or commissions. Please contact ourtransfer agent for a brochure or to enroll.
Direct Deposit of DividendsDividends can be automatically deposited into achecking or savings account. Please contact thetransfer agent for an authorization agreement form.
2004 Dividend InformationDividend Declaration* Mid-Feb. Mid-April Mid-July Mid-Oct.Ex-Dividend Dates March 17 June 16 Sept. 16 Dec. 1Record Dates March 19 June 18 Sept. 20 Dec. 3Payment Dates April 1 July 1 Oct. 1 Dec. 15*Dividend declaration is at the discretion of the board of directors
Dividend rate for 2003: $0.16 annually ($0.04 quarterly)
Annual Meeting of ShareownersShareowners are invited to attend the 2004 AnnualMeeting of Shareowners, Friday, April 30, 2004 at10:30 a.m. local time at:
Hotel du Pont11th and Market StreetsWilmington, DE 19801
Stock InformationStock Symbol: CCE; Wall Street Journal Listing: CocaColaEntShares Outstanding as of December 31, 2003: 455,754,155Shareowners of Record as of December 31, 2003: 15,363Coca-Cola Enterprises is a component of the Standard & Poor’s 500 Index
Stock Prices
2003 High Low Close
Fourth Quarter 22.72 19.28 21.78
Third Quarter 19.61 16.85 19.06
Second Quarter 20.41 18.10 18.15
First Quarter 23.30 17.75 18.69
2002 High Low Close
Fourth Quarter 24.50 20.05 21.72
Third Quarter 22.51 16.87 21.24
Second Quarter 23.98 18.30 22.08
First Quarter 20.67 15.94 18.78
JOHN R. ALMPresident and Chief Executive Officer
LOWRY F. KLINEChairman of the Board
87
Coca-Cola Enterprises Inc.
Lowry F. KlineChairman of the Board
John R. AlmPresident and Chief Executive Officer
G. David Van Houten, Jr. Executive Vice President, Chief Operating Officer and President, North American Business Unit
Vicki R. Palmer Executive Vice President, Financial Services and Administration
Daniel S. Bowling, III Senior Vice President, Human Resources
John J. Culhane Senior Vice President and General Counsel
John H. Downs, Jr. Senior Vice President, Public Affairs and Communications
Robert F. Gray Senior Vice President, Operations and Capital Planning
Shaun B. Higgins Senior Vice President and Chief Strategy and Planning Officer
Patrick J. Mannelly Senior Vice President and Chief Financial Officer
Daniel G. MarrPresident, North American Sales
Dominique Reiniche Senior Vice President and President, European Group
Scott AnthonyVice President, Investor Relations
Carol A. BentonVice President, Internal Audit
E. Liston Bishop IIIVice President, Secretary, Deputy General Counsel and Director of Acquisitions
Margaret F. CartonVice President, Information Technology
Rick L. EngumVice President, Controller and Principal Accounting Officer
Rick A. FrazierVice President, Quality Assurance
Stephen C. HornVice President and Chief Marketing Officer, North America
Timothy W. JohnsonVice President, Labor and Employee Relations
Joyce King-LavinderVice President and Treasurer
Bernard P. KunerthVice President, Human Resources Processes
Gray McCalley, Jr.Vice President and Deputy General Counsel
Terrance M. MarksVice President and Chief Revenue Officer, North America
H. Lynn OliverVice President, Tax
William T. PlybonVice President and Deputy General Counsel
Terri L. PurcellVice President,Deputy General Counsel and Assistant Secretary
Edward L. Sutter Vice President and Chief Procurement Officer
Lori Taylor Vice President, Risk Management
S. Kim AdamsonAssistant Controller, Financial Reporting and Accounting
Officers of the Company
Environmental Policy StatementCoca-Cola Enterprises uses environmentally responsible packaging which continues to demonstrate our commitment to the environment and recycling in several ways. We use 100 percent recyclable packaging throughout our operations, all of our aluminum bever-age containers have 45 percent recycled content, and 80 percent of our plastic beverage resin has 10 percent recycled content. Furthermore, Coca-Cola Enterprises supports many local environmental groups and initiatives to promote curbside, drop-off, and away-from-home recycling programs throughout the many local communities in which our employees live and work.
Portions of this report printed on recycled paper.
© 2004 Coca-Cola Enterprises Inc.
“ Coca-Cola” is a trademark of The Coca-Cola Company.
Designed and produced by Corporate Reports Inc./Atlanta. www.corporatereport.com
Primary photography by Flip Chalfant and Philip Vullo.
E
2500 Windy Ridge ParkwayAtlanta, GA 30339
770-989-3000www.cokecce.com
Coca-Cola Enterprises Inc. (NYSE: CCE) is the world’s largest marketer, distributor, and producer of bottle and can liquid nonalcoholic refreshment.
Coca-Cola Enterprises sells approximately 80 percent of The Coca-Cola Company’s bottle and can volume in North America and is the sole licensed bottler for
products of The Coca-Cola Company in Belgium, France, Great Britain, Luxembourg, Monaco, and the Netherlands.