code composer studio ide v3.0 - white paper
TRANSCRIPT

Application ReportSPRAA08 - July 2004
1
Code Composer Studio IDE v3 White PaperJohn Stevenson Texas Instruments Incorporated
ABSTRACT
Designed for the Texas Instruments (TI) high performance TMS320C6000 (C6000) anddigital signal processor (DSP) platforms, the Code Composer Studio IDE is a developmentenvironment that tightly integrates the tools needed to create winning DSP applications.Version 3.0 (Tuning Edition) includes tuning tools for optimizing applications.
Key components of the Code Composer Studio IDE include:
• Tuning tools for optimizing applications• C/C++ Compiler, Assembly Optimizer and Linker (Code Generation Tools)• Real-Time Operating System (DSP/BIOS)• Ability to dynamically connect and disconnect from targets• Real-Time Data Exchange between host and target (RTDX)• Update Advisor• Instruction Set Simulator• Advanced Event Triggering• Data Visualization
The Code Composer Studio IDE Version 3.0 (Tuning Edition) integrates all host and targettools in a unified environment. It also simplifies DSP system configuration and applicationdesign to help designers get started faster than ever before.
Supported Operating Systems:
Windows 2000 or Windows XP, with Internet Explorer 5.5 or later
Contents
1 Introduction 3. . . . . . . . . . . . . . . . . . . . . . . . . . . . . . . . . . . . . . . . . . . . . . . . . . . . . . . . . . . . . . . . . . . . . . . . .
2 Development Flow 4. . . . . . . . . . . . . . . . . . . . . . . . . . . . . . . . . . . . . . . . . . . . . . . . . . . . . . . . . . . . . . . . . . .
3 Application Design 4. . . . . . . . . . . . . . . . . . . . . . . . . . . . . . . . . . . . . . . . . . . . . . . . . . . . . . . . . . . . . . . . . . 3.1 Code Composer Studio Setup 4. . . . . . . . . . . . . . . . . . . . . . . . . . . . . . . . . . . . . . . . . . . . . . . . . . . . . . 3.2 DSP/BIOS 6. . . . . . . . . . . . . . . . . . . . . . . . . . . . . . . . . . . . . . . . . . . . . . . . . . . . . . . . . . . . . . . . . . . . . . .
3.2.1 Real-Time Operating System 6. . . . . . . . . . . . . . . . . . . . . . . . . . . . . . . . . . . . . . . . . . . . . . . . 3.2.2 Configuration 7. . . . . . . . . . . . . . . . . . . . . . . . . . . . . . . . . . . . . . . . . . . . . . . . . . . . . . . . . . . . . . 3.2.3 Chip Support Library (CSL) 7. . . . . . . . . . . . . . . . . . . . . . . . . . . . . . . . . . . . . . . . . . . . . . . . . .
3.3 TMS320 DSP Algorithm Standard 7. . . . . . . . . . . . . . . . . . . . . . . . . . . . . . . . . . . . . . . . . . . . . . . . . .
Trademarks are the property of their respective owners.
TMS320C6000, C6000, TMS320C5000, C5000, Code Composer Studio, CodeMaestro, DSP/BIOS and RTDX aretrademarks of Texas Instruments.

SPRAA08
2 Code Composer Studio IDE v3 White Paper
4 Code and Build 8. . . . . . . . . . . . . . . . . . . . . . . . . . . . . . . . . . . . . . . . . . . . . . . . . . . . . . . . . . . . . . . . . . . . . . 4.1 Source Code Editor 8. . . . . . . . . . . . . . . . . . . . . . . . . . . . . . . . . . . . . . . . . . . . . . . . . . . . . . . . . . . . . . .
4.1.1 External Editor Support 10. . . . . . . . . . . . . . . . . . . . . . . . . . . . . . . . . . . . . . . . . . . . . . . . . . . . 4.2 Project Manager 11. . . . . . . . . . . . . . . . . . . . . . . . . . . . . . . . . . . . . . . . . . . . . . . . . . . . . . . . . . . . . . . . .
4.2.1 Project Configurations 11. . . . . . . . . . . . . . . . . . . . . . . . . . . . . . . . . . . . . . . . . . . . . . . . . . . . . 4.2.2 Multiple Project Support 11. . . . . . . . . . . . . . . . . . . . . . . . . . . . . . . . . . . . . . . . . . . . . . . . . . . . 4.2.3 Source Control 11. . . . . . . . . . . . . . . . . . . . . . . . . . . . . . . . . . . . . . . . . . . . . . . . . . . . . . . . . . . 4.2.4 Building Libraries 12. . . . . . . . . . . . . . . . . . . . . . . . . . . . . . . . . . . . . . . . . . . . . . . . . . . . . . . . . 4.2.5 Custom Build Steps 12. . . . . . . . . . . . . . . . . . . . . . . . . . . . . . . . . . . . . . . . . . . . . . . . . . . . . . . 4.2.6 Using External Makefiles 12. . . . . . . . . . . . . . . . . . . . . . . . . . . . . . . . . . . . . . . . . . . . . . . . . . . 4.2.7 Exporting Makefiles 13. . . . . . . . . . . . . . . . . . . . . . . . . . . . . . . . . . . . . . . . . . . . . . . . . . . . . . . 4.2.8 Command-Line Build Utility (timake.exe) 13. . . . . . . . . . . . . . . . . . . . . . . . . . . . . . . . . . . . . 4.2.9 Project Dependencies 13. . . . . . . . . . . . . . . . . . . . . . . . . . . . . . . . . . . . . . . . . . . . . . . . . . . . .
4.3 Code Generation Tools 13. . . . . . . . . . . . . . . . . . . . . . . . . . . . . . . . . . . . . . . . . . . . . . . . . . . . . . . . . . . 4.3.1 C6000 Code Generation Tools 13. . . . . . . . . . . . . . . . . . . . . . . . . . . . . . . . . . . . . . . . . . . . . .
5 Debug 14. . . . . . . . . . . . . . . . . . . . . . . . . . . . . . . . . . . . . . . . . . . . . . . . . . . . . . . . . . . . . . . . . . . . . . . . . . . . . 5.1 Debugger 14. . . . . . . . . . . . . . . . . . . . . . . . . . . . . . . . . . . . . . . . . . . . . . . . . . . . . . . . . . . . . . . . . . . . . . .
5.1.1 Probe Points 15. . . . . . . . . . . . . . . . . . . . . . . . . . . . . . . . . . . . . . . . . . . . . . . . . . . . . . . . . . . . . 5.2 Connect/Disconnect 15. . . . . . . . . . . . . . . . . . . . . . . . . . . . . . . . . . . . . . . . . . . . . . . . . . . . . . . . . . . . .
5.2.1 Parallel Debug Manager 15. . . . . . . . . . . . . . . . . . . . . . . . . . . . . . . . . . . . . . . . . . . . . . . . . . . 5.3 Real-Time Data Exchange (RTDX) 16. . . . . . . . . . . . . . . . . . . . . . . . . . . . . . . . . . . . . . . . . . . . . . . . . 5.4 Advanced Event Triggering (AET) 17. . . . . . . . . . . . . . . . . . . . . . . . . . . . . . . . . . . . . . . . . . . . . . . . .
6 Application Code Tuning 17. . . . . . . . . . . . . . . . . . . . . . . . . . . . . . . . . . . . . . . . . . . . . . . . . . . . . . . . . . . . 6.1 What It Does 17. . . . . . . . . . . . . . . . . . . . . . . . . . . . . . . . . . . . . . . . . . . . . . . . . . . . . . . . . . . . . . . . . . . .
6.1.1 Tuning Dashboard 17. . . . . . . . . . . . . . . . . . . . . . . . . . . . . . . . . . . . . . . . . . . . . . . . . . . . . . . . 6.1.2 Compiler Consultant 17. . . . . . . . . . . . . . . . . . . . . . . . . . . . . . . . . . . . . . . . . . . . . . . . . . . . . . . 6.1.3 CacheTune 18. . . . . . . . . . . . . . . . . . . . . . . . . . . . . . . . . . . . . . . . . . . . . . . . . . . . . . . . . . . . . . 6.1.4 CodeSizeTune 18. . . . . . . . . . . . . . . . . . . . . . . . . . . . . . . . . . . . . . . . . . . . . . . . . . . . . . . . . . . .
7 Data Visualization 19. . . . . . . . . . . . . . . . . . . . . . . . . . . . . . . . . . . . . . . . . . . . . . . . . . . . . . . . . . . . . . . . . . .
8 Real-Time Analysis 22. . . . . . . . . . . . . . . . . . . . . . . . . . . . . . . . . . . . . . . . . . . . . . . . . . . . . . . . . . . . . . . . .
9 General Extension Language (GEL) 23. . . . . . . . . . . . . . . . . . . . . . . . . . . . . . . . . . . . . . . . . . . . . . . . . .
10 Summary 23. . . . . . . . . . . . . . . . . . . . . . . . . . . . . . . . . . . . . . . . . . . . . . . . . . . . . . . . . . . . . . . . . . . . . . . . . . .
List of Figures
Figure 1 Development Flow 4. . . . . . . . . . . . . . . . . . . . . . . . . . . . . . . . . . . . . . . . . . . . . . . . . . . . . . . . . . . . Figure 2 Import Configuration Dialog Box 5. . . . . . . . . . . . . . . . . . . . . . . . . . . . . . . . . . . . . . . . . . . . . . . . Figure 3 Visually Configure Common Run-Time Objects 7. . . . . . . . . . . . . . . . . . . . . . . . . . . . . . . . . . . Figure 4 The left panel shows the editor window with Selection Margin turned on 9. . . . . . . . . . . . . Figure 5 External Editor Settings 10. . . . . . . . . . . . . . . . . . . . . . . . . . . . . . . . . . . . . . . . . . . . . . . . . . . . . . . Figure 6 The Status Bar Indicates When the Target is Connected or Disconnected 15. . . . . . . . . . . Figure 7 PDM Lets You Create Custom Groups of Targets and View Target Status 16. . . . . . . . . . . Figure 8 CacheTune Uses Colors to Distinguish Cache Hits From Misses.
It Graphs Symbols That Conflict in Memory. 18. . . . . . . . . . . . . . . . . . . . . . . . . . . . . . . . . . . . . Figure 9 CodeSizeTune lets you plot code size vs. performance.
It is part of the Tuning Tools for Optimizing Code 19. . . . . . . . . . . . . . . . . . . . . . . . . . . . . . . . .
SPRAA08
3 Code Composer Studio IDE v3 White Paper
Figure 10 FFT Waterfall 20. . . . . . . . . . . . . . . . . . . . . . . . . . . . . . . . . . . . . . . . . . . . . . . . . . . . . . . . . . . . . . . . Figure 11 Constellation Plot 20. . . . . . . . . . . . . . . . . . . . . . . . . . . . . . . . . . . . . . . . . . . . . . . . . . . . . . . . . . . . Figure 12 Eye Diagram 21. . . . . . . . . . . . . . . . . . . . . . . . . . . . . . . . . . . . . . . . . . . . . . . . . . . . . . . . . . . . . . . . Figure 13 Image Display 21. . . . . . . . . . . . . . . . . . . . . . . . . . . . . . . . . . . . . . . . . . . . . . . . . . . . . . . . . . . . . . . Figure 14 Find and Fix Subtle Real-Time Problems 22. . . . . . . . . . . . . . . . . . . . . . . . . . . . . . . . . . . . . . . . Figure 15 GEL Controls 23. . . . . . . . . . . . . . . . . . . . . . . . . . . . . . . . . . . . . . . . . . . . . . . . . . . . . . . . . . . . . . . .
1 Introduction
With the emergence of new converging products that feature wireless communication, speechrecognition, multimedia, and Internet telephony all in the same device, designers are relying onDSPs to provide the computing horsepower necessary for crucial real-time performance.Programmable DSPs provide software engineers with the ability to reduce time-to-market whilestill providing an optimized solution for the application at hand. But effective software is requiredto fully harness the power of DSPs.
The size of development teams working on embedded projects is growing dramatically ascompanies drive to produce products that integrate several technologies. This, combined withtoday’s acquisition strategies, serves to produce development teams that may be spread acrossdifferent sites or even different continents.
In spite of these complications, developers often overlook the availability of sophisticated andeasy-to-use development tools when selecting of a processor for a real-time system. Such toolscan have a large impact on meeting time-to-market requirements. A development system thatoffers users an expandable array of tools working seamlessly together empowers distributeddevelopment teams to focus on innovation, product differentiation, and time-to-market.
SPRAA08
4 Code Composer Studio IDE v3 White Paper
2 Development Flow
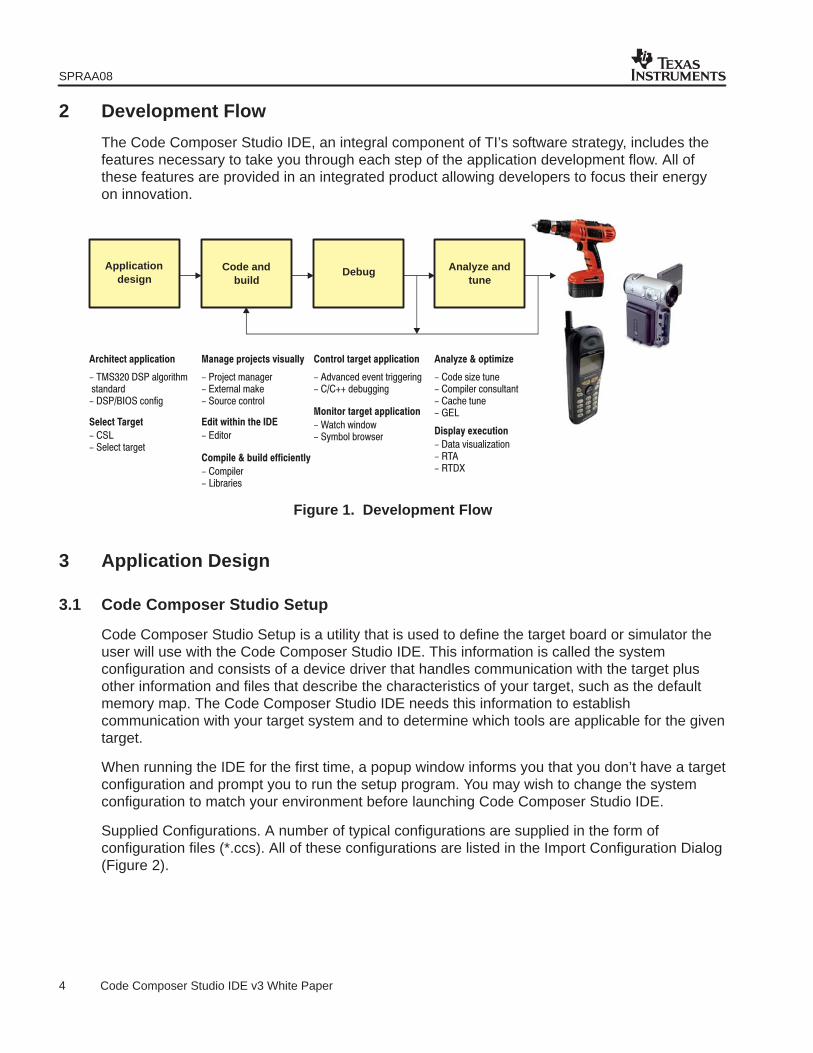
The Code Composer Studio IDE, an integral component of TI’s software strategy, includes thefeatures necessary to take you through each step of the application development flow. All ofthese features are provided in an integrated product allowing developers to focus their energyon innovation.
��������� ��������
� ������ �� �� ����� ������� ������� � ����
���� ������
� ���� ������ �����
������ ������� ������
� � ���� ������ !"����� �#�� � $��� � ��� �
���� ������ ��� ���
� !��� �
����� � ���� ����������
� � �%����� ��&�����
������ ������ ��������
� '�(���� �(��� ����������� ���)) ��&$�����
������� ������ ��������
� *��� +��� +� �,�& � &� +���
����!� � �����!�
� � �� ��-� �$��� � �%���� � ��$����� ���� �$��� .!�
����� �"�������
� �� (��$��-�� �� /�'� /��0
Applicationdesign
Code andbuild
Debug Analyze andtune
Figure 1. Development Flow
3 Application Design
3.1 Code Composer Studio Setup
Code Composer Studio Setup is a utility that is used to define the target board or simulator theuser will use with the Code Composer Studio IDE. This information is called the systemconfiguration and consists of a device driver that handles communication with the target plusother information and files that describe the characteristics of your target, such as the defaultmemory map. The Code Composer Studio IDE needs this information to establishcommunication with your target system and to determine which tools are applicable for the giventarget.
When running the IDE for the first time, a popup window informs you that you don’t have a targetconfiguration and prompt you to run the setup program. You may wish to change the systemconfiguration to match your environment before launching Code Composer Studio IDE.
Supplied Configurations. A number of typical configurations are supplied in the form ofconfiguration files (*.ccs). All of these configurations are listed in the Import Configuration Dialog(Figure 2).

SPRAA08
5 Code Composer Studio IDE v3 White Paper
Figure 2. Import Configuration Dialog Box
This dialog is shown when you first launch Code Composer Studio Setup, and can also beaccessed by selected “Import” from the “File” menu or by clicking on the “Import ConfigurationFile” link at the top of the right-most window pane.
Saving Configurations. Once you have your system configured the way you like, you can saveyour settings to a configuration file and share it with other developers. Saving files is also usefulif you are using more than one configuration and must switch between them.
Installing Device Drivers. If you are using an emulator or development board from aneXpressDSP third party, you may need to install the device driver for this target in CodeComposer Studio Setup. Some third parties may install the driver for you automatically.
Using a Custom board.dat File. The board data file contains information that describes thedevices on the scan path to the emulator. In Code Composer Studio IDE v.2 and later, it is a textfile that you can review. In previous versions, the board data file was a binary file. Either formatis accepted by Code Composer Studio IDE v.3. If you decide to use a custom board data fileinstead of one automatically generated by setup, information in the Processor Configuration tabwon’t be used to create a board data file. But the IDE still uses this information to determine thenumber and types of control windows to open.

SPRAA08
6 Code Composer Studio IDE v3 White Paper
Multiple Processors. Code Composer Studio IDE supports the debugging of multipleprocessors. When installing a board containing multiple processors, the developer can specifythe number and type of processors on the processor configuration tab.
The Code Composer Studio IDE also provides debug support for multiple processor cores ofdifferent ISAs (heterogeneous or co-emulation) connected on the same JTAG scan path. Theheterogeneous device driver provided with Code Composer Studio IDE v.3 allow you toconfigure the Code Composer Studio IDE to debug multiple CPUs of different ISAs located onthe same JTAG scan path. When the heterogeneous device driver is added to the CodeComposer Studio configuration, heterogeneous co-emulation can be performed on anycombination of CPU types for which an XDS510 device driver is installed.
GEL Startup Files. Startup files are used to configure the memory map of the debugger for thespecific processor that you are using.
3.2 DSP/BIOS
3.2.1 Real-Time Operating System
As DSP applications become more complex, it is important to structure them in an efficient,maintainable manner. This requires use of a real-time kernel that enables system functions to beallocated to different threads. The DSP/BIOS kernel provides an efficient set of kernel, real-timeanalysis, and peripheral configuration services, eliminating the need to develop and maintaincustom DSP operating systems. DSP/BIOS is an integral part of the Code Composer StudioIDE. The kernel object browser displays the state of operating system objects (such as tasksand semaphores), and provides data on stack usage and stack overflow/underflow. Thesecapabilities make it easier to debug applications and optimize usage of OS and systemresources.
DSP/BIOS consists of four parts: a real-time kernel, real-time analysis services, peripheralconfiguration libraries, and a graphical configuration tool.
DSP/BIOS provides a rich set of deterministic real-time kernel services, callable from C orassembler, which enable developers to create sophisticated applications without compromisingreal-time deadlines. To provide the fast response required by DSP applications, DSP/BIOSincludes Software Interrupts (SWIs) and Periodic Functions (PRDs), in addition to conventionaltasks. SWIs are lightweight preemptible threads that share a common stack, resulting in lowermemory overhead and faster context switch times. PRDs are time-triggered high-priority threadsthat can be easily set up to process samples of data arriving at fixed time intervals, simplifyingthe design of multi-rate systems. To facilitate the design of more complex applications,DSP/BIOS provides interrupt management, I/O mechanisms, and a rich set of inter-taskcommunication services, including semaphores, mailboxes, and queues.

SPRAA08
7 Code Composer Studio IDE v3 White Paper
3.2.2 Configuration
The Code Composer Studio IDE provides a graphical host-based configuration tool that makes iteasy to for developers to configure all the services provided by DSP/BIOS. All DSP/BIOSobjects may be statically configured using this tool. Static configuration shrinks the targetmemory footprint by removing the code required to perform run-time creation of DSP/BIOSservices. It also enables many configuration errors to be detected at build time.
Figure 3. Visually Configure Common Run-Time Objects
3.2.3 Chip Support Library (CSL)
For each supported processor, DSP/BIOS includes a set of peripheral management functionsand macros known as the Chip Support Library (CSL). The CSL supports on-chip peripherals forall TMS320C5000 and TMS320C6000 devices and is fully integrated into the DSP/BIOSConfiguration tool. Developer can use the CSL to shorten development time for device driverand initialization code. The CSL supports both graphical and programmatic peripheralconfiguration and control, eliminating the need to remember individual register flags settings orpainstakingly calculate bitmaps.
3.3 TMS320 DSP Algorithm Standard
Today’s highly complex system designs often require hardware and software tools with morecapabilities than those previously available. Code Composer Studio IDE’s open plug-inarchitecture (called “TMS320 DSP Algorithm Standard” or “XDAIS”) reduces time-consumingsystem integration for anyone trying to include algorithms into their DSP system. As of June,2004, more than 700 compliant algorithms are available on the TI’s third party network. Any ofthese algorithms can easily be integrated into applications using the Code Composer StudioIDE. For further information on the latest list of compliant algorithms visit www.dspvillage.comand select Third Party Compliant solutions.

SPRAA08
8 Code Composer Studio IDE v3 White Paper
XDAIS defines common programming rules and guidelines with a set of programming interfacesthat are used consistently by algorithms across a wide variety of applications. The IDE includeskey header files (i.e., ialg.h), several basic examples to illustrate use of the standard (e.g.,FIR/FIG algorithms and clients) documentation about the the standard itself (SPRU352) andapplication notes. A demonstration project runs on most TI low cost DSP Starter kits (DSK). Thisproject implements an audio player and recorder using compliant algorithms. To access thisdemonstration, visit www.ti.com/dummiesbook.
Several productivity tools assist in algorithm development and testing. A code generation wizardautomates the generation of algorithm-compliant code, and a QualiTI test tool identifies whetheran algorithm complies with the standard. To access these free tools, go to Help » WebResources » Application Software or go to www.dspvillage.com and choose Software.
4 Code and Build
4.1 Source Code Editor
The Code Composer Studio IDE includes fully integrated code editing environment tuned forwriting C, C++ and DSP assembly code. The editor provides standard editing features such as:keyword highlighting, printing, cut and paste, drag and drop, etc. The maximum number of linesper file is 2,147,483,648 and the maximum number of characters per line is 3500.
Floating toolbars support advanced operations such as finding the next matching brace andindenting text. The search and replace function makes it easy to change variable names. And toprovide users with the most customizable working environment possible, edit windows supporteither docking to, or floating outside, the parent window in any configuration. Fully integratedwith other facilities in the Code Composer Studio IDE like the debugger, the editor allowsdevelopers to easily edit code and see both source and disassembly at the same time.
Bookmarks. Use bookmarks to find and maintain key locations within your source files. Abookmark can be set on any line of any source file. Bookmarks are saved with a CodeComposer Studio workspace so that they can be recalled at any time.
The Bookmarks dialog box, as well as the bookmarks tab on the project view window, displaysthe complete list of bookmarks. Use the Bookmarks dialog box to manage all of your bookmarks.
Column Editing. Column editing is used when you want to select, cut, copy, paste, and deletecolumns of text. Then is very useful when manipulating data structures. To use column editingmode select Edit | Column Editing, or by pressing the keyboard sequence Ctrl + Shift + F8. Totoggle between column editing mode and regular mode hold the Alt key and highlight thecolumn. You can then cut, copy, paste, and delete the selected columns as desired.
Selection Margin. By default, a Selection Margin is displayed on the left-hand side of integratededitor and Disassembly windows. Colored icons in the Selection Margin indicate that abreakpoint (red) or Probe Point (blue) is set at this location. A yellow arrow identifies the locationof the Program Counter (PC).
In the editor, the Selection Margin can be used to set or clear breakpoints. You can also displaythe line number and marker points that are set for a given line. It is possible to turn off theselection margin using the Editor Properties tab in the Customize dialog box. In Figure 4, theright panel shows the editor with the Selection Margin turned on.

SPRAA08
9 Code Composer Studio IDE v3 White Paper
Figure 4. The left panel shows the editor window with Selection Margin turned on
Mixed Mode. The source code editor supports mixed mode viewing of source. This displaymode interleaves the source code with the disassembled instructions that are on the targetprocessor. This mode makes it possible to determine the actual instructions being executed.
A program compiled with “Symbolic Debug” information has a limitation of 65535 lines. Whenviewing a source file in Mixed Mode, if the file contains more than 65535 lines, the disassemblyassociated with lines above 65535 is displayed incorrectly. For example, the disassembly for line65536 is displayed under line 1 of the source code. To work around this problem, compile yourprogram using “Dwarf Debug” information.
Cursor Mode. The editor provides two modes of selecting text and inserting spaces, Streammode and Virtual Whitespace mode. In Stream mode, the editor provides text selection andinsertion similar to most word processors. By default, Stream mode is selected. In VirtualWhitespace mode, the mouse or the arrow keys can be used to move the cursor to any locationwithin the document window. When you begin typing, any whitespace between the end of lineand the cursor is automatically filled with spaces. Similarly, when selecting text, any areasbeyond the end of line are automatically filled with spaces.
Custom Keywords. The integrated editor features keyword highlighting. Keywords, comments,strings, assembler directives, and GEL commands are highlighted in different colors. Keywordhighlighting is available for C, C++, Assembly, and GEL files. When a source file is opened orsaved, the editor recognizes the file extension (.c, .cpp, .asm, .gel) and the appropriate keywordhighlighting is automatically applied. In addition, new sets of keywords can be created, or thedefault keyword sets can be customized and saved in keyword files (*.kwd).
Keyword highlighting can be customized according to the file type and the target processor.Keyword files are simple ASCII text files containing a set of keywords separated by carriagereturns. You can create a custom keyword file from scratch by using any text editor, or you maymake a copy of a default keyword file and then edit it as desired. Four default keyword files areprovided. If you installed the Code Composer Studio product in c:\CCStudio, the default keywordfiles can be found c:\CCStudio\cc\bin\Editor\Keywords\Base. Custom keyword files should becreated in c:\CCStudio\cc\bin\Editor\Keywords\Custom. You can add to the list of file extensionsthat are highlighted.

SPRAA08
10 Code Composer Studio IDE v3 White Paper
The Code Composer Studio file keyword.ini stores information about the installed keyword files.The keyword.ini file resides in the Editor folder. If CCStudio cannot find keyword.ini, it promptsyou to enable the default keyword highlighting feature.
4.1.1 External Editor Support
To configure an external editor for use with Code Composer Studio IDE, you need to specify anumber of command line parameters that the editor uses to perform common tasks such asopening a file. The commands can be specified through the Editors Properties tab in thecustomize dialog. The IDE includes default configuration settings for several popular editorswhich you can load and even customize. Once you have configured an editor you can save thesettings to a file to be shared with other members of your team.
Figure 5. External Editor Settings

SPRAA08
11 Code Composer Studio IDE v3 White Paper
4.2 Project Manager
The Project Management system has been broadened and improved to include multiproject/multi configuration support and source code control, as well as the ability to interface withexternal build processes. The new Project Manager can support projects containing thousandsof source files. These features were designed with large distributed development teams in mind.
The project manager organizes your files into folders for source, library, configuration, includeand generated files. The project manager automatically scans dependencies, making itunnecessary to add dependent files manually to a project. These files are shown in the includefolder in the project view window.
Project File. The project file itself is a text file that can be edited manually. This is useful forbatch environments or for generating the project file via a script. The project file stores buildoptions for each project configuration.
4.2.1 Project Configurations
The Code Composer Studio Project Manager supports multiple build configurations. Multiplebuild configurations allow (for example) different sets of build options without requiring the userto make changes to project options. Folder names match configuration names to make it easyto track where configuration−specific output files go. Build configurations can be saved and laterretrieved for bit exact rebuilds.
4.2.2 Multiple Project Support
It is not unusual for a developer to work on several projects at once. For instance, a developermay have an old project to maintain, a project that represents the next product release and atest project. The Code Composer Studio Project Manager allows you to keep multiple projectsopen simultaneously and switch between them easily. Larger more complex applications, forexample, might consist of several library subprojects, each with separate project files.
4.2.3 Source Control
Code Composer Studio IDE lets developers use source code control software applicationdirectly through the Project Manager or pull-down menus. The Code Composer Studio IDEsupports any source control provider that correctly implements the Microsoft SCC Interface. Thatincludes Rational’s ClearCase, Microsoft’s SourceSafe, Starbase StarTeam PVCS or MKS.Once the IDE connects to the source code control application, the project visually displayscheckout status. This integration simplifies the tasks of project management, revision control,branching, merging and backups.
The project view window lists all source files in a project’s source folder. Files that are ‘checkedout’ to the source control system have green checks to the left of the name. If a file is checkedout, it can be opened in an editor window and modified accordingly. Files that are ‘checked in’ tothe source code control system are indicated by red checks to the left of the name. The useronly has read−only access to “checked in” files.
Once the IDE is configured for a specific source control provider, the IDE will invoke theprovider’s tools for source control tasks. The IDE’s source control features might vary accordingto the capabilities of the provider.

SPRAA08
12 Code Composer Studio IDE v3 White Paper
4.2.4 Building Libraries
Code Composer Studio IDE supports the creation of archives. When creating a new project, youcan specify if the project is an executable or a library. Although both types of projects offer amultitude of build options for the developer, only executable projects allow the setting of linkeroptions. Instead of this, library projects allow the setting of archiver options.
4.2.5 Custom Build Steps
Custom build steps help to automate steps that are done before and/or after thecompiling/linking phase. An example of a post-build step would be converting the coff output fileto hex format file. An example of a step that could be automated either pre- or post-build iscopying files from one location to another.
If file-specific custom build options are required, they can be specified here in the file-specificBuild Options dialog box. For example, you may wish to exclude a particular file from a buildwhile still keeping it in the project. These options are used to override the standard build toolsand replace them with user-specific tools. Typically this is used in conjunction with externalmakefiles.
Exclude file from build. The selected file is excluded from the build process. By default, thisoption is turned off.
Use custom build step. Activate the Custom Build Setting fields. Choosing this option enablesyou to specify custom build commands. By default, this option is turned off.
Custom Build Setting. After selecting “Use custom build step”, you can specify custom buildcommands for the selected file.
Build Command. Enter the command line to be executed to complete a build.
Outputs. Enter a path and filename for the executable file and any intermediate files generatedby the build command.
Clean Command. Enter the command line to be executed to remove any files generated by thebuild command.
Important: If any custom build step involves launching Texas Instruments code generation tools,you must execute the batch file DosRun.bat to set up the necessary PATH and environmentvariables (C_DIR, A_DIR…). It is recommended that you execute DosRun.bat as the first step ofthe initial build steps. If Code Composer Studio IDE is installed in the default location, the batchfile is located in the directory the main installation directory, which is usually c:\CCStudio.
4.2.6 Using External Makefiles
This feature of the Project Manager allows the developer to use a makefile (*.mak) created for alegacy product development. If for instance you had an existing build process outside of CodeComposer Studio IDE and now you wanted to build within Code Composer Studio IDE, youwould use the “Use External Makefile” build option. The existing makefile is called from withinCode Composer Studio IDE, giving the effect of a fully integrated build environment. To launchthe make process, the user will need to specify the command to build the makefile and definehow to parse source files. This parsing is done with regular expressions.
A Code Composer Studio project is created that contains the external makefile. Now that aproject is associated with the makefile, the project and its contents can be displayed in theProject View window and the Project→Build and Project→Rebuild All commands can be used tobuild the project.

SPRAA08
13 Code Composer Studio IDE v3 White Paper
4.2.7 Exporting Makefiles
In some cases, the developer will need to create an application for other environments oroperating systems (such as Unix). A developer can create the application using CodeComposer Studio IDE and export the project to a standard makefile (by selecting Project ›Exportto a Makefile). This allows the developer to do final builds in other operating systems.
4.2.8 Command-Line Build Utility (timake.exe)
Code Composer Studio IDE provides an external build utility that allows projects (*.pjt) to be builtoutside of the IDE. This allows projects to be integrated into larger system builds. These systembuilds, for example, could include a host processor. Now the DSP and Host processor codebases can be built from one master makefile or batch file. The master makefile or batch file callsthe timake utility to build the DSP portion of the system. The timake.exe utility takes a *.pjt fileand other options and generates an output file specified by the options set in the *.pjt file.
4.2.9 Project Dependencies
Creating subprojects or dependency relationships between projects is often helpful fordebugging. For example, you can use dependent projects to group projects with the sameconfiguration settings. Or you can try one configuration with a particular subproject and anotherconfiguration without it for comparison purposes. To add a project dependency, drag an openproject over another open project in the project window. That will cause a new directory icon,Dependent Projects, to appear underneath the root project. You can switch projectconfigurations for a subproject by double-clicking underneath the Setting column within thatsame dialog window.
4.3 Code Generation Tools
In the past, developing high performance DSP code has required the developer to optimizeassembly code by hand and have an intimate knowledge of the particular DSP architecture.Because time-to-market is becoming increasingly important, while the time and skill to optimallycode a DSP are increasingly hard to find, there is a need for a more robust code developmentenvironment. The Code Composer Studio compile tools address this need by shifting the burdenof optimization from hand-coded assembly to the C Compiler. With these tools it is possible toexploit the high performance of TI’s DSP platforms without ever writing hand-coded assembly.
4.3.1 C6000 Code Generation Tools
For the embedded software developer, the C6000 Compile Tools — co-developed with the DSParchitecture — offer top performance with global view analysis and architecture-specificoptimizations such as interactive profiling, tuning and feedback.
One major focus for the C6000 compiler has been VLIW architecture-specific optimizations.Since the release 1.0 of the C6000 tools in Feb 1997, TI has continued to drive C performanceimprovements on key DSP MIPS intensive code. C6000−specific enhancements includesoftware pipelining, data path partitioning, inner and nested loop optimization, unrolling, andpredication.
SPRAA08
14 Code Composer Studio IDE v3 White Paper
5 Debug
5.1 Debugger
The Code Composer Studio debugger makes it easy to find and fix errors in real−timeembedded applications. For example, debugger commands enable you to control programexecution. Debugger windows and dialogs allow you to view source code and track the values ofprogram variables in memory and registers. Breakpoints enable you to stop execution at aspecified location and examine the current state of the program.
Memory Window. The Memory window allows you to view the contents of memory starting at aspecified address. Options enable you to format the Memory window display. You can also editthe contents of a selected memory location.
Registers Window. The Register windows enable you to view and edit the contents of the CPUregisters and the Peripheral Registers.
Disassembly Window. The Disassembly window displays disassembled instructions andsymbolic information needed for debugging. Disassembly reverses the assembly process andallows the contents of memory to be displayed as assembly language code. Symbolicinformation consists of symbols and strings of alphanumeric characters that representaddresses or values on the target.
Call Stack Window. Use the Call Stack window to examine the function calls that led to thecurrent location in the program that you are debugging. The call stack only works with Cprograms. Calling functions are determined by walking through the linked list of frame pointerson the runtime stack. Your program must have a stack section and a main function; otherwise,the call stack displays following the message: C source is not available.
Symbol Browser. The Symbol Browser displays all of the associated files, functions, globalvariables, types, and labels of a loaded COFF output file (*.out). From the Symbol Browser youcan open the source code for a file or function in the text editor. You can also use the SymbolBrowser to create a profile area. When creating a C++ application the Symbol Browser functionsas a C++ class browser.
Watch Window. When debugging a program, it is often helpful to understand how the value of avariable changes during program execution. The Watch window allows you to monitor the valuesof local and global variables and C/C++ expressions. The Watch Locals tab of the Watchwindow provides a special type of Watch window. In this window, the debugger automaticallydisplays the values of variables that are local to the currently executing function. You canchange the format used to display the value of a watch variable or expression. The defaultdisplay format is based on the type of the variable.
Command Window. The Command Window enables you to specify commands to the CodeComposer Studio debugger using the TI Debugger command syntax. Many of the commandsaccept C expressions as parameters. This allows the instruction set to be relatively small, yetpowerful. Because C expressions can have side effects (that is, the evaluation of some types ofexpressions can affect existing values) you can use the same command to display or change avalue.
SPRAA08
15 Code Composer Studio IDE v3 White Paper
5.1.1 Probe Points
A Probe Point can be set at any point in your algorithm (similar to the way a breakpoint is set).When the program reaches a Probe Point, the executing program updates the connected object(whether it be a file, graph, or memory window). After updating, execution will resume. ProbePoints can be enabled or disabled, just like breakpoints.
When a window is created, by default, it is updated at every breakpoint. However, you canchange this so the window is updated only when the program reaches the connected ProbePoint.
File I/O. The debugger allows you to stream, or transfer, data to or from the actual/simulatedtarget from a PC file. This is a great way to simulate your code using known sample values. TheFile I/O feature uses Probe Points , which allow you to extract/inject samples or take a snapshotof memory locations at a point you define (Probe Point). If you set a Probe Point at a specificpoint in your code and then connect a file to it, you can implement file I/O functionality. File I/Ocoupled with Probe Points are two excellent tools that can help developers automate test casesagainst a known set of resultant values.
5.2 Connect/Disconnect
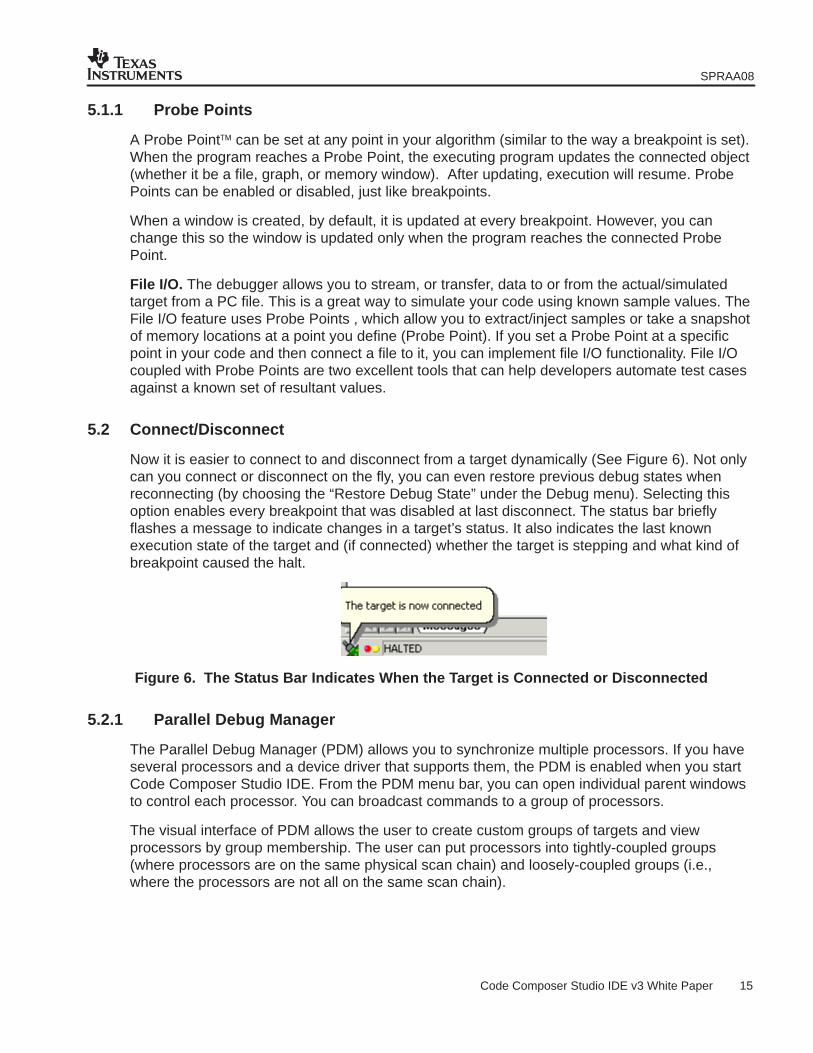
Now it is easier to connect to and disconnect from a target dynamically (See Figure 6). Not onlycan you connect or disconnect on the fly, you can even restore previous debug states whenreconnecting (by choosing the “Restore Debug State” under the Debug menu). Selecting thisoption enables every breakpoint that was disabled at last disconnect. The status bar brieflyflashes a message to indicate changes in a target’s status. It also indicates the last knownexecution state of the target and (if connected) whether the target is stepping and what kind ofbreakpoint caused the halt.
Figure 6. The Status Bar Indicates When the Target is Connected or Disconnected
5.2.1 Parallel Debug Manager
The Parallel Debug Manager (PDM) allows you to synchronize multiple processors. If you haveseveral processors and a device driver that supports them, the PDM is enabled when you startCode Composer Studio IDE. From the PDM menu bar, you can open individual parent windowsto control each processor. You can broadcast commands to a group of processors.
The visual interface of PDM allows the user to create custom groups of targets and viewprocessors by group membership. The user can put processors into tightly-coupled groups(where processors are on the same physical scan chain) and loosely-coupled groups (i.e.,where the processors are not all on the same scan chain).

SPRAA08
16 Code Composer Studio IDE v3 White Paper
Figure 7. PDM Lets You Create Custom Groups of Targets and View Target Status
Synchronized Commands. It is possible to broadcast commands via PDM to all targetprocessors in a tightly-controlled group. If the device driver supports synchronous operationthese commands are synchronized to start at the same time on each processor. The followingcommands are supported: Locked Step, StepOver, StepOut, Run, Halt and Animate.
Viewing Connection Status from PDM. PDM provides an easy way to view the status of eachtarget while the user is working in the IDE. For example, one can see the mode, CPU status andendianness of a target; one can also use the right-click menu to connect to the target or thedropdown menu to change an option for a target. One can also connect or disconnectdynamically to this target using PDM.
5.3 Real-Time Data Exchange (RTDX)
At one time DSP developers were able to exchange data snapshots with the host computer byusing breakpoints to stop their application. The use of these data snapshots, (called”stop−mode debugging”) often failed to provide an accurate view of a system’s real worldoperation.
RTDX offers one solution to this problem. This technology (invented by Texas Instruments) givesdesigners the industry’s first DSP system to provide real−time, continuous visibility about howtarget applications actually perform. RTDX allows developers to transfer data between the hostcomputer and DSP devices without stopping their target application. RTDX allows designers tomonitor continuously their systems and gain real−time insights into running applications. It alsoallows data to be streamed with ActiveX−compliant application such as Excel, LabVIEW orMATLAB. When displaying RTDX data, host applications can read either live or saved data. TheIDE also supports RTDX with multiple processors on either the same or different scan paths.RTDX has tools for diagnosis and configuration as well as a channel viewer for detecting andviewing target−declared channels. Developers can also run RTDX with the instruction simulator,allowing RTDX to be used before target hardware is available.
You can use High-speed RTDX (HSRTDX) to provide faster data logging rates and increasedresponsivness for RTDX-enabled host controlled applications than traditional RTDX. HSRTDXrequires a HSRTDX-enabled DSP and an XDS560 class emulation controller.

SPRAA08
17 Code Composer Studio IDE v3 White Paper
5.4 Advanced Event Triggering (AET)
Advanced Event Triggering is designed to simplify hardware analysis. AET is only available onnew hardware targets that have the appropriate analysis interface.
Event Analysis. Event Analysis uses a simple interface to help you configure commonhardware debug tasks called jobs. Setting breakpoints, action points, and counters is easy witha right-click menu and drag-and-drop jobs. You can access Event Analysis from the tools menu,or by right clicking in a source file.
Event Sequencer. Event Sequencer allows you to look for conditions to occur in your targetprogram and cause actions to occur when those conditions are detected. While the CPU ishalted, you define conditions and actions. When you run the target program, the sequenceprogram looks for the condition and performs the action you requested.
6 Application Code Tuning
6.1 What It Does
The Code Composer Studio IDE now offers a series of tools (called Tuning Tools) to helpdevelopers to optimize applications. These tools allow users to set goals and track progresstowards goals by collecting different sets of data. A new Advice Window provides on-the-flyrecommendations about how to make code meet user goals.
The IDE has two Layouts, (tuning layout and standard layout), which can be toggled from themain toolbar. Standard layout is the default, while tuning layout (represented by a tuning forkicon on the toolbar) opens advice windows on the left side. The tuning layout focuses attentionon the optimization needs of the user’s program. The advice window walks the user through theoptimization/tuning process specific to the DSP device and a selected goal.
Changing the layout does not require having to close or save your work. When you switchlayouts, the Control Window momentarily disappears and reappears in the new layout. Layoutsmainly affect the way windows are displayed in the Code Composer Studio IDE.
6.1.1 Tuning Dashboard
The Tuning Dashboard panel comes up on the left when the user switches to Tuning Layout (byselecting the Tuning Fork icon on the toolbar). This panel provides advice and allows the user tolaunch tuning tools (i.e., Advice Window, Goals Window, Profile Setup, and Profile Viewer).Tuning Tools can also be launched from the Profile menu.
6.1.2 Compiler Consultant
After analyzing source code and compiler build options, the Compiler Consultant recommendsways to improve code performance. The tool displays two types of information: Compile TimeLoop Information (created by the Compiler) and Run Time Loop Information (gathered byprofiling the application). Each time the application is compiled, Compiler Consultant analyzesthe code and creates suggestions for different optimization techniques to improve codeefficiency These suggestions include compiler optimization switches and pragmas to insert intothe code that give the compiler more application information.

SPRAA08
18 Code Composer Studio IDE v3 White Paper
6.1.3 CacheTune
By graphically representing cache memory accesses, CacheTune makes it easier to identifynon-optimal cache usage. This display of cache hit/miss data as a two-dimensional graph canbe used to improve performance in cache-based memory devices. All memory accesses arecolor-coded by type. Various filters, panning, and zoom features facilitate quick drill-down toview specific areas. This visual/temporal view of cache accesses enables quick identification ofproblem areas, such as areas related to conflict, capacity, or compulsory misses. All of thesefeatures help the user to improve an application’s overall cache efficiency.
Figure 8. CacheTune Uses Colors to Distinguish Cache Hits From Misses.It Graphs Symbols That Conflict in Memory.
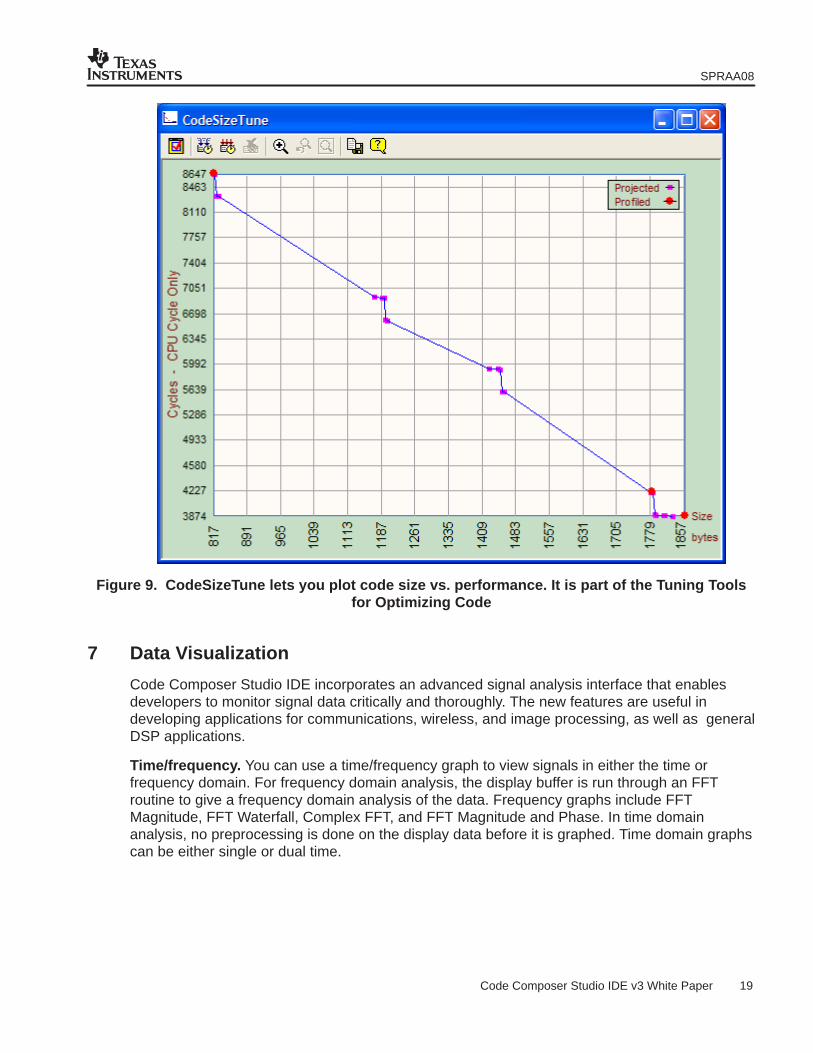
6.1.4 CodeSizeTune
CodeSizeTune (CST) replaces the Profile-based Compilation (PBC) tool from version 2.2 of theIDE. CST analyzes tradeoffs between code size and cycle count more quickly and easily thanbefore. Using a variety of profiling configurations, CodeSizeTune profiles the user’s application,collects data on individual functions, and determines the best combinations of compiler options.CST graphs function-specific options sets, permitting a choice of the configuration best suited forthe user’s needs.
SPRAA08
19 Code Composer Studio IDE v3 White Paper
Figure 9. CodeSizeTune lets you plot code size vs. performance. It is part of the Tuning Toolsfor Optimizing Code
7 Data Visualization
Code Composer Studio IDE incorporates an advanced signal analysis interface that enablesdevelopers to monitor signal data critically and thoroughly. The new features are useful indeveloping applications for communications, wireless, and image processing, as well as generalDSP applications.
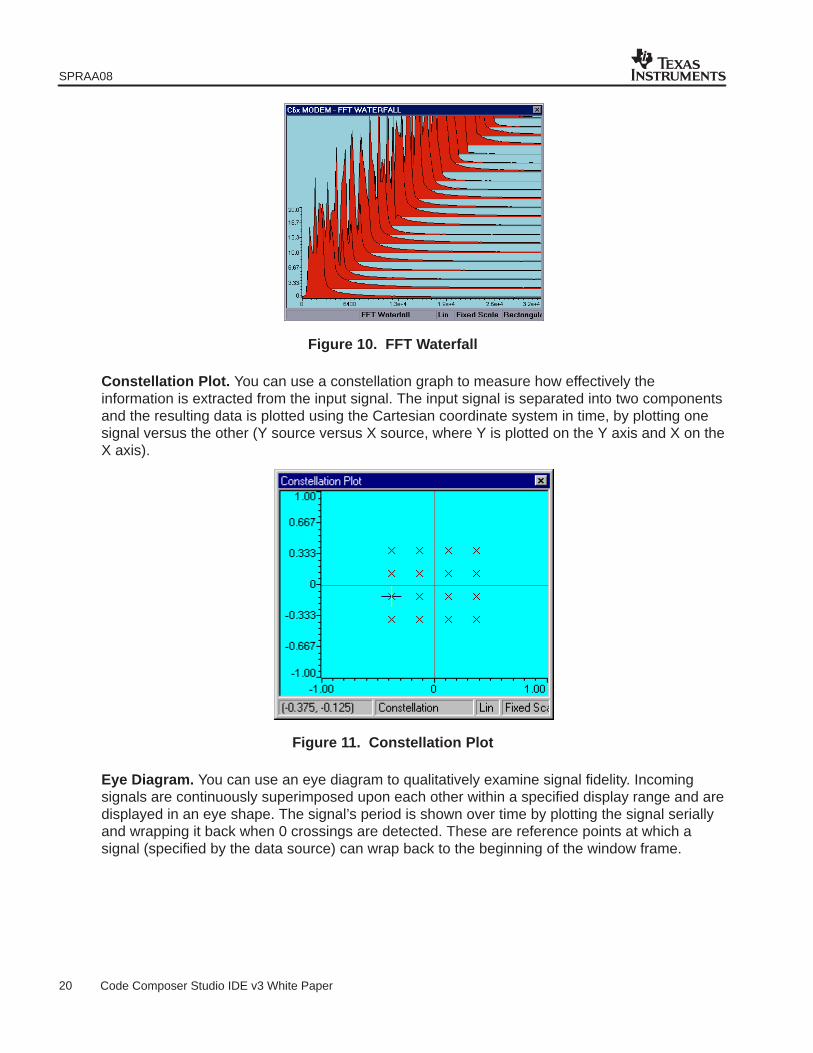
Time/frequency. You can use a time/frequency graph to view signals in either the time orfrequency domain. For frequency domain analysis, the display buffer is run through an FFTroutine to give a frequency domain analysis of the data. Frequency graphs include FFTMagnitude, FFT Waterfall, Complex FFT, and FFT Magnitude and Phase. In time domainanalysis, no preprocessing is done on the display data before it is graphed. Time domain graphscan be either single or dual time.
SPRAA08
20 Code Composer Studio IDE v3 White Paper
Figure 10. FFT Waterfall
Constellation Plot. You can use a constellation graph to measure how effectively theinformation is extracted from the input signal. The input signal is separated into two componentsand the resulting data is plotted using the Cartesian coordinate system in time, by plotting onesignal versus the other (Y source versus X source, where Y is plotted on the Y axis and X on theX axis).
Figure 11. Constellation Plot
Eye Diagram. You can use an eye diagram to qualitatively examine signal fidelity. Incomingsignals are continuously superimposed upon each other within a specified display range and aredisplayed in an eye shape. The signal’s period is shown over time by plotting the signal seriallyand wrapping it back when 0 crossings are detected. These are reference points at which asignal (specified by the data source) can wrap back to the beginning of the window frame.

SPRAA08
21 Code Composer Studio IDE v3 White Paper
Figure 12. Eye Diagram
Image Display. You can use an image graph to test image-processing algorithms. Image data isdisplayed based on RGB and YUV data streams.
Figure 13. Image Display
SPRAA08
22 Code Composer Studio IDE v3 White Paper
8 Real-Time Analysis
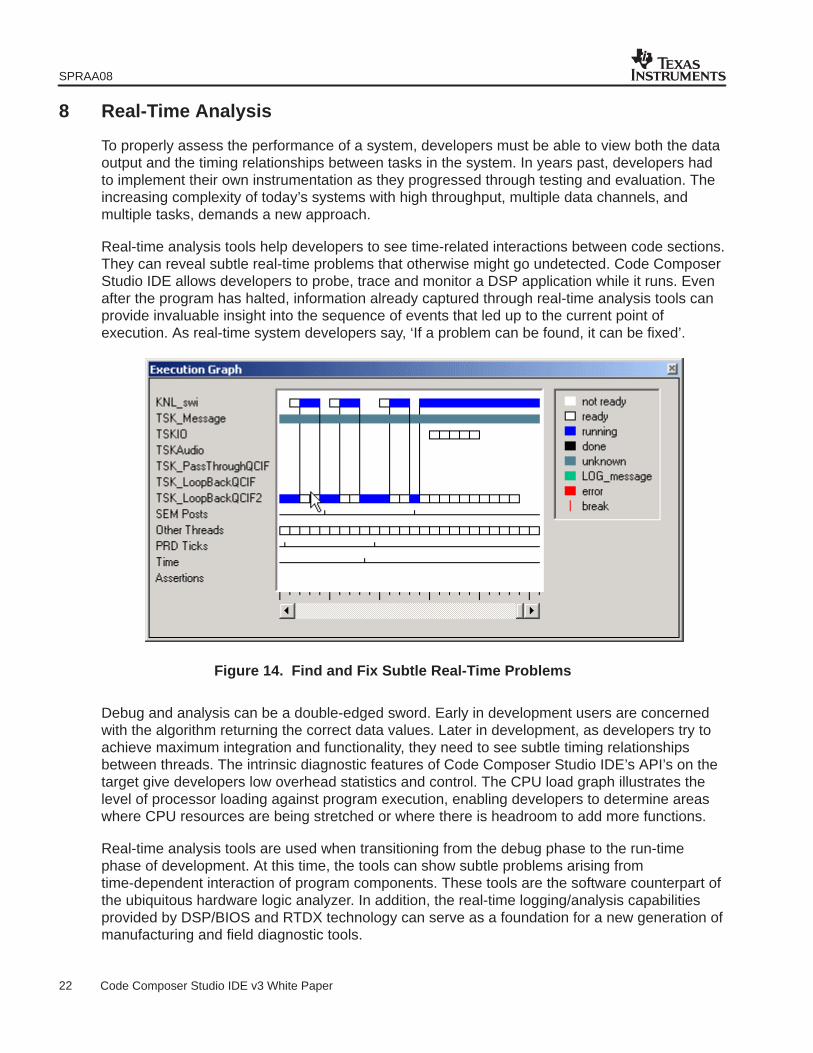
To properly assess the performance of a system, developers must be able to view both the dataoutput and the timing relationships between tasks in the system. In years past, developers hadto implement their own instrumentation as they progressed through testing and evaluation. Theincreasing complexity of today’s systems with high throughput, multiple data channels, andmultiple tasks, demands a new approach.
Real-time analysis tools help developers to see time-related interactions between code sections.They can reveal subtle real-time problems that otherwise might go undetected. Code ComposerStudio IDE allows developers to probe, trace and monitor a DSP application while it runs. Evenafter the program has halted, information already captured through real-time analysis tools canprovide invaluable insight into the sequence of events that led up to the current point ofexecution. As real-time system developers say, ‘If a problem can be found, it can be fixed’.
Figure 14. Find and Fix Subtle Real-Time Problems
Debug and analysis can be a double-edged sword. Early in development users are concernedwith the algorithm returning the correct data values. Later in development, as developers try toachieve maximum integration and functionality, they need to see subtle timing relationshipsbetween threads. The intrinsic diagnostic features of Code Composer Studio IDE’s API’s on thetarget give developers low overhead statistics and control. The CPU load graph illustrates thelevel of processor loading against program execution, enabling developers to determine areaswhere CPU resources are being stretched or where there is headroom to add more functions.
Real-time analysis tools are used when transitioning from the debug phase to the run-timephase of development. At this time, the tools can show subtle problems arising fromtime-dependent interaction of program components. These tools are the software counterpart ofthe ubiquitous hardware logic analyzer. In addition, the real-time logging/analysis capabilitiesprovided by DSP/BIOS and RTDX technology can serve as a foundation for a new generation ofmanufacturing and field diagnostic tools.
SPRAA08
23 Code Composer Studio IDE v3 White Paper
9 General Extension Language (GEL)
The General Extension Language (GEL) is an interpretive language similar to C that lets youcreate functions to extend Code Composer Studio IDE’s usefulness. After creating GELfunctions using the GEL grammar, you can load them into Code Composer Studio IDE. WithGEL, you can access actual/simulated target memory locations and add options to the IDE’sGEL menu. GEL is particularly useful for automated testing. You can call GEL functions fromanywhere that you can enter an expression. You can also add GEL functions to the Watchwindow so that they execute at every breakpoint.
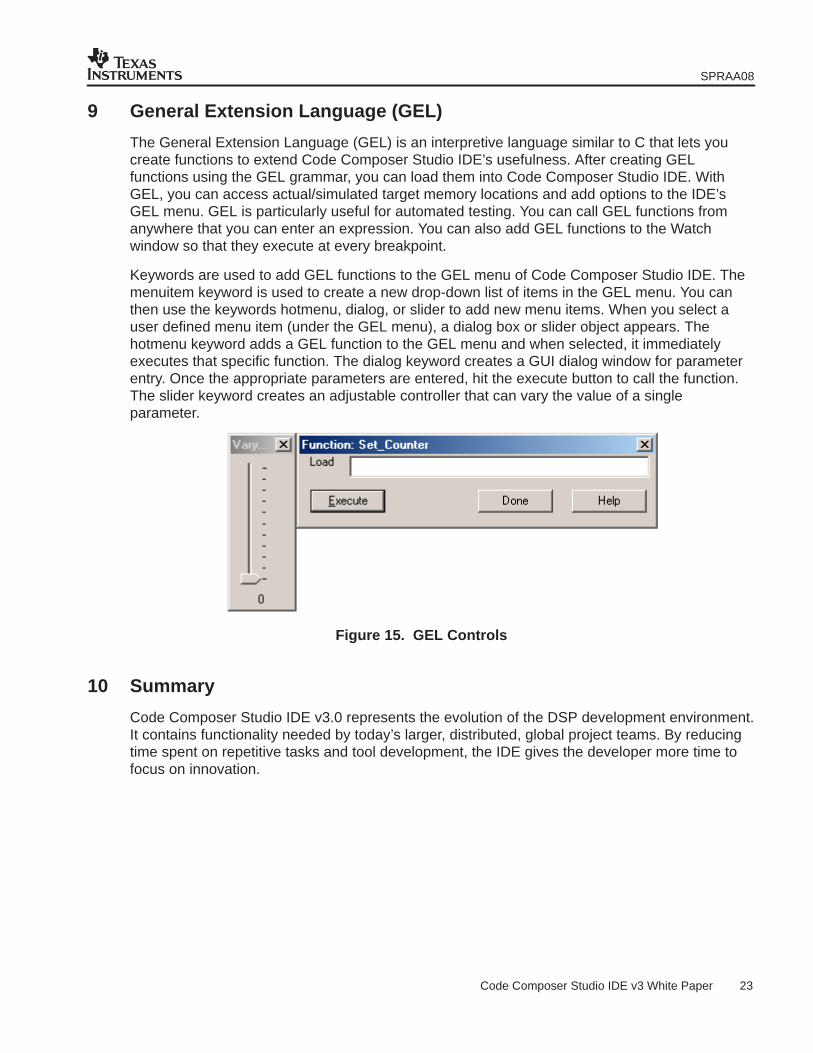
Keywords are used to add GEL functions to the GEL menu of Code Composer Studio IDE. Themenuitem keyword is used to create a new drop-down list of items in the GEL menu. You canthen use the keywords hotmenu, dialog, or slider to add new menu items. When you select auser defined menu item (under the GEL menu), a dialog box or slider object appears. Thehotmenu keyword adds a GEL function to the GEL menu and when selected, it immediatelyexecutes that specific function. The dialog keyword creates a GUI dialog window for parameterentry. Once the appropriate parameters are entered, hit the execute button to call the function.The slider keyword creates an adjustable controller that can vary the value of a singleparameter.
Figure 15. GEL Controls
10 Summary
Code Composer Studio IDE v3.0 represents the evolution of the DSP development environment.It contains functionality needed by today’s larger, distributed, global project teams. By reducingtime spent on repetitive tasks and tool development, the IDE gives the developer more time tofocus on innovation.
IMPORTANT NOTICE
Texas Instruments Incorporated and its subsidiaries (TI) reserve the right to make corrections, modifications,enhancements, improvements, and other changes to its products and services at any time and to discontinueany product or service without notice. Customers should obtain the latest relevant information before placingorders and should verify that such information is current and complete. All products are sold subject to TI’s termsand conditions of sale supplied at the time of order acknowledgment.
TI warrants performance of its hardware products to the specifications applicable at the time of sale inaccordance with TI’s standard warranty. Testing and other quality control techniques are used to the extent TIdeems necessary to support this warranty. Except where mandated by government requirements, testing of allparameters of each product is not necessarily performed.
TI assumes no liability for applications assistance or customer product design. Customers are responsible fortheir products and applications using TI components. To minimize the risks associated with customer productsand applications, customers should provide adequate design and operating safeguards.
TI does not warrant or represent that any license, either express or implied, is granted under any TI patent right,copyright, mask work right, or other TI intellectual property right relating to any combination, machine, or processin which TI products or services are used. Information published by TI regarding third-party products or servicesdoes not constitute a license from TI to use such products or services or a warranty or endorsement thereof.Use of such information may require a license from a third party under the patents or other intellectual propertyof the third party, or a license from TI under the patents or other intellectual property of TI.
Reproduction of information in TI data books or data sheets is permissible only if reproduction is withoutalteration and is accompanied by all associated warranties, conditions, limitations, and notices. Reproductionof this information with alteration is an unfair and deceptive business practice. TI is not responsible or liable forsuch altered documentation.
Resale of TI products or services with statements different from or beyond the parameters stated by TI for thatproduct or service voids all express and any implied warranties for the associated TI product or service andis an unfair and deceptive business practice. TI is not responsible or liable for any such statements.
Following are URLs where you can obtain information on other Texas Instruments products and applicationsolutions:
Products Applications
Amplifiers amplifier.ti.com Audio www.ti.com/audio
Data Converters dataconverter.ti.com Automotive www.ti.com/automotive
DSP dsp.ti.com Broadband www.ti.com/broadband
Interface interface.ti.com Digital Control www.ti.com/digitalcontrol
Logic logic.ti.com Military www.ti.com/military
Power Mgmt power.ti.com Optical Networking www.ti.com/opticalnetwork
Microcontrollers microcontroller.ti.com Security www.ti.com/security
Telephony www.ti.com/telephony
Video & Imaging www.ti.com/video
Wireless www.ti.com/wireless
Mailing Address: Texas Instruments
Post Office Box 655303 Dallas, Texas 75265
Copyright 2004, Texas Instruments Incorporated