cog (01/14) item 9.4 - northern lincolnshire and goole ... · cog need to be made aware of) ... the...
TRANSCRIPT
CoG (01/14) Item 9.4.3
DATE 22nd
January 2014
REPORT FOR Council of Governors
REPORT FROM Dr Jim Whittingham, Trust Chairman
CONTACT OFFICER Jeremy Daws, Assistant Head of Quality Assurance
SUBJECT
Monthly Mortality Report
BACKGROUND DOCUMENT (IF ANY)
Monthly Quality Report
EXECUTIVE COMMENT (INCLUDING KEY ISSUES OF NOTE OR, WHERE RELEVANT, CONCERN THAT THE COG NEED TO BE MADE AWARE OF)
The Monthly Mortality Report outlines progress towards meeting the Trust’s objective of reducing its mortality ratio as agreed by the Board.
COUNCIL ACTION REQUIRED
The Council is asked to note the contents of the Mortality Report
NLG (13) 463
DATE 17th
December 2013
REPORT FOR Trust Board of Directors – Part A
REPORT FROM Professor Carrock Sewell, Acting Medical Director
CONTACT OFFICER Jeremy Daws, Assistant Head of Quality Assurance
SUBJECT Monthly Mortality Report
BACKGROUND DOCUMENT (IF ANY) Monthly Quality Report
REPORT PREVIOUSLY CONSIDERED BY & DATE(S) Mortality Performance Committee – 3rd
December 2013
EXECUTIVE COMMENT (INCLUDING KEY ISSUES OF NOTE OR, WHERE RELEVANT, CONCERN AND / OR NED CHALLENGE THAT THE BOARD NEED TO BE MADE AWARE OF)
The Monthly Mortality Report outlines progress towards meeting the Trust‟s objective of reducing its mortality ratio as agreed by the Board.
HAVE THE STAFF SIDE BEEN CONSULTED ON THE PROPOSALS? N/A
HAVE THE RELEVANT SERVICE USERS/CARERS BEEN CONSULTED ON THE PROPOSALS? N/A
ARE THERE ANY FINANCIAL CONSEQUENCES ARISING FROM THE RECOMMENDATIONS?
N/A
IF YES, HAVE THESE BEEN AGREED WITH THE RELEVANT BUDGET HOLDER AND DIRECTOR OF FINANCE, AND HAVE ANY FUNDING ISSUES BEEN RESOLVED?
N/A
ARE THERE ANY LEGAL IMPLICATIONS ARISING FROM THIS PAPER THAT THE BOARD NEED TO BE MADE AWARE OF?
N/A
WHERE RELEVANT, HAS PROPER CONSIDERATION BEEN GIVEN TO THE NHS CONSTITUTION IN ANY DECISIONS OR ACTIONS PROPOSED?
N/A
WHERE RELEVANT, HAS PROPER CONSIDERATION BEEN GIVEN TO SUSTAINABILITY IMPLICATIONS (QUALITY & FINANCIAL) & CLIMATE CHANGE?
N/A
THE PROPOPSAL OR ARRANGEMENTS OUTLINED IN THIS PAPER SUPPORT THE ACHIEVEMENT OF THE TRUST OBJECTIVE(S) AND COMPLIANCE WITH THE REGULATORY STANDARDS LISTED
N/A
ACTION REQUIRED BY THE BOARD The Board is asked to note the contents of the Mortality Report
Directorate of Clinical & Quality Assurance, November 2013 Page 2 of 54
Directorate of Clinical & Quality Assurance
Monthly Mortality Report
November 2013

Directorate of Clinical & Quality Assurance, November 2013 Page 3 of 54
Board Report – Mortality Summary
November 2013
Contents
1.0 Introduction
4
2.0 Board Action 4
3.0 Recommendations 4
SUMMARY REPORT Mortality Improvement Progress 5
4.0 Mortality Indicators
9
5.0 Clinical Coding Indicators 30
6.0 Update on Mortality Trigger Tool Work 36
7.0 Update on Pathway Specific Mortality Action Groups 39
8.0 Nursing Staffing Levels 48
9.0 Glossary 54

Directorate of Clinical & Quality Assurance, November 2013 Page 4 of 54
1.0 INTRODUCTION
The monthly mortality report seeks to provide an update on the most recent information available to the Trust and the different work streams underway around this area to support the focus of reducing the Trust‟s current mortality ratio.
2.0 BOARD ACTION
The Board is asked to:
Review the performance against the range of targets/indicators included within the report.
3.0 RECOMMENDATIONS
At the Mortality Performance Committee (MPC) held on the 3rd December 2013, the committee agreed the following highlight report for assurance and overview purposes to the Quality & Patient Experience Committee (QPEC) and the Trust Board.
Continued improvement in the Trust‟s provisional HED SHMI to 107.8 (to July 2013) which is within the “as expected” range. The most recent data demonstrates a further move towards the average, and towards the 99.8% confidence interval (pages 6 and 15).
The continued difference in the provisional SHMI between DPoW (111) and SGH (106) noting that DPoW has improved to within the “as expected” range and that the “gap” between the 2 hospitals is closing. SGH has improved previously and therefore further improvement needs to be largely on the Pathway Mortality Improvement Projects currently underway (page 16).
Continued concern about the gap between the in-hospital and out-of-hospital SHMI. The gap remains greatest at DPoW (page 23).
Need to remain focussed on the weekend vs weekday mortality performance (page 21).
Following the recent publication of the Dr Foster HSMR position, contained within section 4.10, the most recent HSMR data is demonstrated which shows further improvement (page 29).

Directorate of Clinical & Quality Assurance, November 2013 Page 5 of 54
Mortality Improvement – Summary Progress Report
November 2013: (Data to July 2013)
This summary sets out the Trust‟s latest position in terms of mortality improvement. The report measures mortality performance using the Summary Hospital Level Mortality Indicator (SHMI) – the official Department of Health measure used to measure risk adjusted mortality. This compares the actual mortality position of the Trust, based on the number of deaths in hospital and in the 30 days following admission, with a calculated „expected deaths‟ rate. The SHMI is usually based on a full year of data and is recalculated every six months. There are three bandings in the SHMI, with mortality rates classed as lower than expected, as expected and higher than expected. If a Trust is in the „higher than expected‟ range it is classed as an „outlier‟.
The official national data publications are released quarterly, six months after the event. The Trust therefore reports its performance to its Board every month using provisional data published by the University of Birmingham through its Hospital Evaluation Data system (HED). This is normally three months behind the current position, and has been validated as virtually identical to the official published data.
Current SHMI mortality position:
The Trust‟s latest SHMI position (using the HED system for the period August 2012 to July 2013) is a score of 107.8. This is within the „as expected‟ range, and is an improvement on the July 2012 to June 2013 position (108.8), which was also in the „as expected‟ range. This continues a run of month on month improvements that have moved the Trust away from the „higher than expected‟ band into the „as expected‟ band. We can now use the HED system to show where each of our three hospitals sit in these bandings – all three are now in the „as expected‟ band for this time period.
The trend over recent months is set out in the following graph:
SU
MM
AR
Y R
EP
OR
T

Directorate of Clinical & Quality Assurance, November 2013 Page 6 of 54
NLAG - relative mortality performance:
This performance leaves the Trust 22nd worst of the 142 NHS provider organisations included within the mortality data set. This is still some way from where the Trust wishes to be – but demonstrates that it is delivering successful improvements at pace. The following “funnel plot” graphically represents this:
Site breakdown of mortality performance
The Trust has analysed the performance between sites. The position is shown in the following trend graph:
Of the three hospitals Grimsby‟s mortality rate is the highest at 111 but it has improved sufficiently to be banded „as expected‟ rather than „higher than expected‟ and its rate continues on a downward trajectory. Scunthorpe also shows improvement at 106, and is moving close to the national average position. Goole has demonstrated major improvements following the changes made to the medical service at Goole in the summer of 2012, giving it one of the best mortality rates in the country at 27.
SU
MM
AR
Y R
EP
OR
T

Directorate of Clinical & Quality Assurance, November 2013 Page 7 of 54
The following table shows the provisional SHMI, using the HED system, for the year to July 2013 split by hospital site:
Site Patient Spells Deaths
Expected Deaths
Variation from
Expected SHMI
Grimsby 29865 1158 1043 115 111
Scunthorpe 26783 1069 1012 57 106
Goole 985 4 15 -11 27
Grand Total 57633 2231 2070 161 108
The „variation from expected‟ figure is what is often referred to as „excess deaths‟. This figure is the difference between the actual number of deaths and the number predicted by the SHMI model. This figure does not represent deaths that were preventable and should not be interpreted as measure of avoidable deaths. Sir Bruce Keogh, the NHS Medical director, has previously stated that it is “clinically meaningless and academically reckless” to treat such figures as a measure of avoidable deaths.”
Mortality performance breakdown by high level diagnosis group:
The following high level groups have been derived by combining the numerous official SHMI diagnoses into a more manageable number of high level groupings. This process was undertaken with clinical input.
The following table shows the top 10 high level diagnosis groups for „variation from expected deaths‟ for the provisional SHMI moving annual total to July 2013 at Trust level, based primarily on the diagnosis on admission.
Trust “Top Ten” SHMI high level diagnosis groups (SHMI year to July 2013):
Diagnosis Group Patient Spells Deaths
Expected Deaths
Variation from
Expected SHMI
Respiratory 6475 671 595 76 113
Infection 4483 265 217 48 122
Renal 827 147 115 32 127
Gastroenterology 6869 268 242 26 111
Stroke 1358 143 128 15 111
DVT/PE 271 16 7 9 217
Trauma & Orthopaedics 4643 139 132 7 105
Neurological 974 28 22 6 129
Urinary Tract 1862 19 15 4 125
Diabetes and Endocrine 696 26 23 3 112
This highlights the major clinical areas where the Trust is focusing attention on delivering improvements. Some of the diagnosis groups have a small number of patients. This can have a misleading impact on the SHMI score, as a very low number of deaths can cause a very high SHMI figure. In these cases, the Trust must consider a variety of other factors to see if there are any issues that need further investigation.
SU
MM
AR
Y R
EP
OR
T

Directorate of Clinical & Quality Assurance, November 2013 Page 8 of 54
Improvement projects:
Key developments in November included:
● Launch and consolidation of 24/7 hyperacute stroke service at Scunthorpe hospital, meaning thrombolysis treatment is now available around the clock, all week, instead of just 8am to 8pm Monday to Friday.
● The pneumonia care pathway was introduced. This will help ensure patients admitted with community acquired pneumonia are managed in line with evidenced-based best practice. The pathway is being piloted at Scunthorpe and Grimsby hospitals for patients admitted via A&E or via their GP.
● Work has begun to draft a pathway for chronic obstructive pulmonary disease (COPD) for patients admitted to the Trust with this respiratory condition.
● Twenty-two Spanish nurses have now joined Grimsby hospital and an additional group are due to arrive from Spain in December, helping to fill the Trust‟s nursing vacancies and reduce reliance on bank and agency staff.
SU
MM
AR
Y R
EP
OR
T

Directorate of Clinical & Quality Assurance, November 2013 Page 9 of 54
This section…
4.0 MORTALITY INDICATORS
4.1 Mortality Indicators Dashboard 4.2 Crude Mortality and Number of Deaths
4.3 Summary Hospital-Level Mortality Indicator (SHMI) – Nationally Published Data
4.4 Summary Hospital-Level Mortality Indicator (SHMI) – H.E.D Provisional Data
4.5 Weekday & Weekend Mortality for Non Elective Admissions
4.6 Elective and Non Elective SHMI
4.7 Risk Adjusted Mortality Index (RAMI)
4.8 Hospital Standardised Mortality Ration (HSMR)
5.0 Clinical Coding Indicators
6.0 Update on Mortality Trigger Tool Work
7.0 Update on Pathway Specific Mortality Action Groups
8.0 Nursing Staffing Levels
9.0 Glossary

Directorate of Clinical & Quality Assurance, November 2013 Page 10 of 54
4.0 MORTALITY INDICATORS
The following section of the Trust‟s Mortality Report is compiled by Information Services. It contains high level analysis of NLAG‟s crude mortality, Summary Hospital Level Mortality Indicator (SHMI), Risk Adjusted Mortality Index (RAMI) and Hospital Standardised Mortality Ratio (HSMR).
Executive Summary:
The data contained within this section illustrates:
The Trust‟s Crude Mortality Rate (moving annual total) is reducing marginally – from 1.60% for the year to September 2012 to 1.54% for the year to September 2013. It is slightly lower than the peer average – the peer for the year to September 2013 was 1.55%.
The majority of deaths are non-elective. The Trust‟s Non Elective Crude Mortality Rate (moving annual total) is reducing marginally – from 3.45% for the year to September 2012 to 3.35% for the year to September 2013. It is, however, higher than the peer average – the peer for the year to September 2013 was 3.12%.
The most recent Summary Hospital-Level Mortality Indicator (SHMI) for the period of April 2013 – March 2013, which includes community deaths within 30 days of discharge, was 111 – which has reduced from the score of 115 in the previous publication (for the period January 2012 – December 2012).
The Trust‟s provisional SHMI (moving annual total) for the year to July 2013 is 108. Grimsby‟s score is 111, Scunthorpe‟s score is 106 and Goole‟s is 27. The „as expected‟ figure is 100. The score of 108 is within the “as expected” range and is the 22nd worst national score.
The top five high level diagnosis groups with the highest variation from the expected number of deaths are respiratory, infection, renal, gastroenterology and stroke. These are, in the main, the diagnoses on admission.
The provisional SHMI for weekend admissions is 10 points higher than the SHMI for weekday admissions (115 v 105).
The provisional SHMI for non-elective admissions is 108 – this is 8 points higher than the score for elective admissions.
The provisional In Hospital SHMI is 103. The Out of Hospital SHMI being 121.
The Trust‟s Risk Adjusted Mortality Indicator (moving annual total) for the year to September 2013 was 91 – no change from the previous score. Note the national average was 92.
The Dr Foster Hospital Guide, published in November 2012, indicated the Trust‟s HSMR was 118, placing the Trust within the „higher than expected‟ banding. Using local data, the HSMR for the twelve months to August 2013 is 105.
Much of the following analysis is benchmarked against a similar group of peer trusts. Peer average benchmarks referred to in this document relate to these Trusts, unless otherwise stated. We have also included the national benchmark where possible.
Mo
rta
lity
In
dic
ato
rs

Directorate of Clinical & Quality Assurance, November 2013 Page 11 of 54
4.1 Mortality Indicators Dashboard
Source: Information Services
Oct12-
Sept13
Prev 12
mths Annual Change Peer
Compared
to Peer
CRUDE MORTALITY
Trust 1.54% 1.60% -0.07% -0.01%
DPOW 1.67% 1.70% -0.03% 0.12%
SGH 1.57% 1.60% -0.03% 0.02%
GDH 0.12% 0.83% -0.71% -1.43%
Trust 3.35% 3.45% -0.10% 0.23%
DPOW 3.55% 3.52% 0.03% 0.43%
SGH 3.16% 3.25% -0.09% 0.04%
GDH 2.62% 7.39% -4.77% -0.50%
Trust 1568 1621 -53
DPOW 832 846 -14
SGH 729 722 7
GDH 7 53 -46
Trust 102038 101136 902
DPOW 49775 49777 -2
SGH 46437 44996 1441
GDH 5826 6363 -537
Apr12-
Mar13 SHMI
National
Position
Jan12-Dec12
SHMI
National
Position
Change in
National
Position
Nationally Published SHMI
Aug12-
July13
Prev 12
mths Annual Change
National
Peer
Compared
to Peer
Provisional SHMI (HED sourced)
Trust 108 116 -8 8
DPOW 111 123 -12 11
SGH 106 108 -3 6
GDH 27 123 -96 -73
Oct12-
Sept13
Prev 12
mths Annual Change Peer
Compared
to Peer
RAMI
Trust 91 111 -20 -7
DPOW 87 110 -22 -11
SGH 99 110 -11 1
GDH 22 165 -144 -76
Sep12-
Aug13
Prev 12
mths Annual Change Peer
Compared
to Peer
HSMR
MORTALITY INDICATORS SUMMARY DASHBOARD: NOVEMBER 2013
M3
Indicator
M1 Crude Mortality Rate 1.55%
M2Non Elective Crude
Mortality Rate3.12%
n/aNumber of Deaths n/a
M7
Risk Adjusted
Mortality Index
(RAMI) - All
Conditions
98
M4Number of
Admissionsn/a
Indicator
M6 Provisional SHMI 100
Indicator
n/a
10 places
Indicator
M5
Summary Hospital
Level Mortality
Indicator (SHMI)
Trust 111 15th worst 115 5th worst
5
Indicator
M8
Hospital
Standardised
Mortality Ratio
(HSMR)
100Trust 105 115 -9

Directorate of Clinical & Quality Assurance, November 2013 Page 12 of 54
4.2 Crude Mortality and Number of Deaths
NLAG Moving Annual Total (MAT) Crude Mortality Rate v Peer
The first graph in this crude mortality section shows the Moving Annual Totals (MAT) for the NLAG crude mortality rate against peer. This includes all deaths. A MAT is the sum of the individual twelve monthly figures up to and including the reporting month e.g. twelve months to September 2013. This methodology helps to obtain a trend with less variance. A crude mortality rate is simply the number of deaths divided by the number of discharges expressed as a percentage.
Source: Information Services
Comment: For the twelve months to September 2013, the crude mortality rate for the Trust was 1.54%, a decrease of 0.07% compared to the twelve months to September 2012. Note that the performance gap between NLAG and our peer group has closed. However, the gap to the national peer is still evident. For the twelve months to September 2013 there were 1568 deaths in hospital.
NLAG Monthly Crude Mortality Rate v Peer
The following graph shows the monthly trend of Trust wide crude mortality rates against peer.
Source: Information Services

Directorate of Clinical & Quality Assurance, November 2013 Page 13 of 54
Comment: Note the peaks for the months of January across the years in the graph; higher mortality rates are expected in winter months. The crude rate in September 2013 was 1.39%, an increase 0.03% from the rate of 1.36% in September 2012.
Non Elective Crude Mortality
As the majority of deaths occur within non elective patient admissions, the following section looks at non elective crude mortality.
NLAG Moving Annual Total (MAT) Non Elective Crude Mortality Rate v Peer
The following graph shows the Moving Annual Totals (MAT) for the NLAG non elective crude mortality rate against peer.
Source: Information Services
Comment: Note that for all months NLAG‟s non elective crude mortality rate has been above peer. The rate is decreasing over time. The crude non elective rate for the twelve months to September 2013 was 3.35%, a decrease of 0.10% (when rounded to two decimal places) from the rate of 3.45% for the twelve months to September 2012. For the twelve months to September 2013 there were 1528 non elective deaths.
NLAG Monthly Non Elective Crude Mortality Rate v Peer The following graph shows the monthly trend of Trust wide non elective crude mortality rates against peer.
Source: Information Services

Directorate of Clinical & Quality Assurance, November 2013 Page 14 of 54
Comment: Note the peaks for the months of January in the years graphed; higher mortality rates are expected in winter months. The crude rate in September 2013 was 2.99%, a decrease of 0.05% on the rate of 2.94% in September 2012.
4.3 Summary Hospital-Level Mortality Indicator (SHMI) – Nationally Published Data
The most recent Summary Hospital Level Mortality Indicator (SHMI) was published in October 2013. The Trust‟s SHMI score was 111 – the 15th worst national SHMI score out of the 142 NHS provider organisations included in data set – but is now officially within the “expected range”. In the previous quarter‟s SHMI release NLAG was the 5th worst national performer, with a score of 115. The SHMI includes all deaths in hospital and those deaths that occurred within thirty days of discharge. The indicator uses data that is normally around six months out of date, for example the October 2013 release covered the period April 2012 – March 2013.
NLAG‟s SHMI in National Context
The following chart illustrates the Trust‟s most recent SHMI score in relation to those of all Trusts nationally.
In and Out of Hospital Split
One of the SHMI contextual indicators that are published is the rate of SHMI deaths that occurred in and out of hospital. NLAG had 72.2% of SHMI deaths occurring in hospital – the national rate was 73.3%. The SHMI indicator is not solely a hospital based mortality indicator, but is influenced by wider community-based healthcare also.

Directorate of Clinical & Quality Assurance, November 2013 Page 15 of 54
4.4 Summary Hospital-Level Mortality Indicator (SHMI) – H.E.D. Provisional Data
Following the acquisition of the University of Birmingham Hospitals‟ Healthcare Evaluation Data (HED) reporting product, we can now report on more up to date SHMI data. You will note that the October 2013 nationally published SHMI contained data up to March 2013; the HED data currently shows data to the end of July 2013.
Data in this analysis should be treated as provisional. From reconciliation work, we know that this data source reflects previous SHMI publications.
NLAG‟s Provisional SHMI in National Context
Using the provisional data for the twelve months to July 2013, the Trust is the 22nd worst performer nationally out of the 142 NHS provider organisations included within the mortality data set, with a score of 108. This takes the Trust further into the “within expected range” banding. The following funnel plot graphically represents this.
Source: Information Services
Provisional SHMI by site for the twelve months to July 2013
The following table shows the provisional SHMI for the twelve months to July 2013 split by hospital site.
Site Patient Spells Deaths
Expected Deaths
Variation from
Expected SHMI
SHMI Lower CI 95%
SHMI Upper CI
95%
Grimsby 29865 1158 1043 115 111 104.69 117.58
Scunthorpe 26783 1069 1012 57 106 99.41 112.17
Goole 985 4 15 -11 27 7.37 70.14
Grand Total 57633 2231 2070 161 108 103.36 112.36
Source: Information Services
Directorate of Clinical & Quality Assurance, November 2013 Page 16 of 54
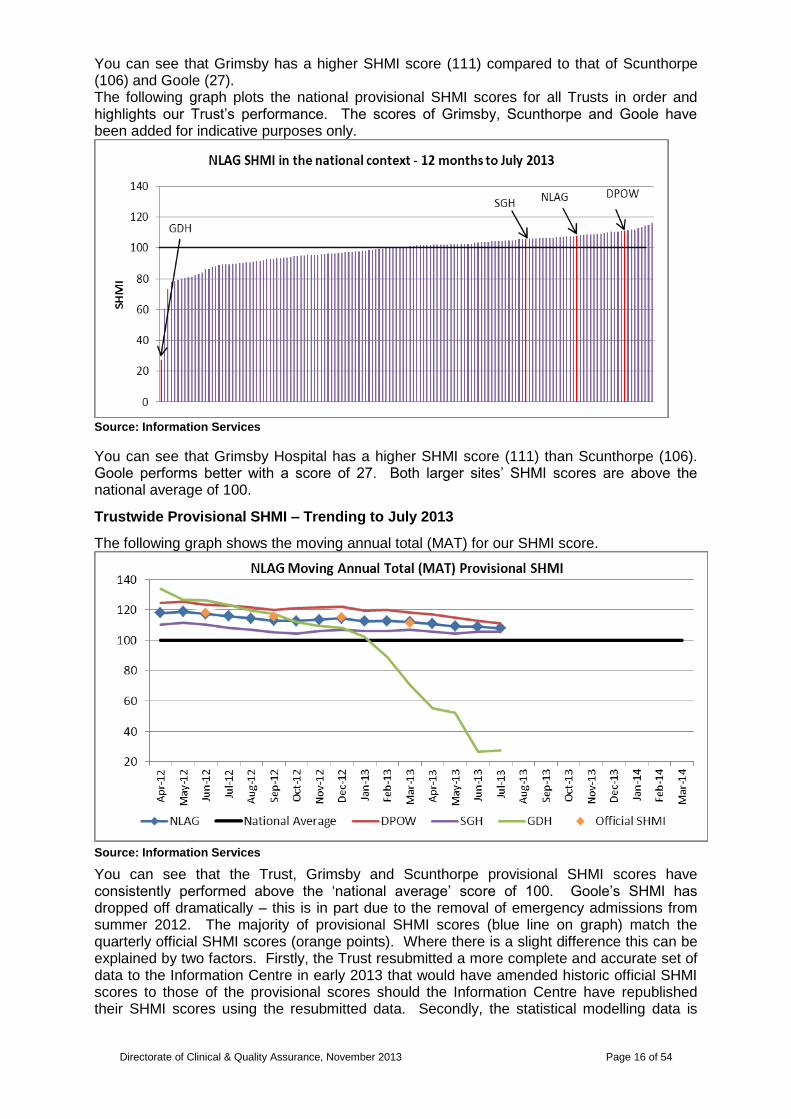
You can see that Grimsby has a higher SHMI score (111) compared to that of Scunthorpe (106) and Goole (27). The following graph plots the national provisional SHMI scores for all Trusts in order and highlights our Trust‟s performance. The scores of Grimsby, Scunthorpe and Goole have been added for indicative purposes only.
Source: Information Services
You can see that Grimsby Hospital has a higher SHMI score (111) than Scunthorpe (106). Goole performs better with a score of 27. Both larger sites‟ SHMI scores are above the national average of 100.
Trustwide Provisional SHMI – Trending to July 2013
The following graph shows the moving annual total (MAT) for our SHMI score.
Source: Information Services
You can see that the Trust, Grimsby and Scunthorpe provisional SHMI scores have consistently performed above the „national average‟ score of 100. Goole‟s SHMI has dropped off dramatically – this is in part due to the removal of emergency admissions from summer 2012. The majority of provisional SHMI scores (blue line on graph) match the quarterly official SHMI scores (orange points). Where there is a slight difference this can be explained by two factors. Firstly, the Trust resubmitted a more complete and accurate set of data to the Information Centre in early 2013 that would have amended historic official SHMI scores to those of the provisional scores should the Information Centre have republished their SHMI scores using the resubmitted data. Secondly, the statistical modelling data is
Directorate of Clinical & Quality Assurance, November 2013 Page 17 of 54
more up to date on the provisional SHMI than it is for some of the more historic official SHMI statistics. This can have the effect of minimally changing the more historic provisional SHMI scores.
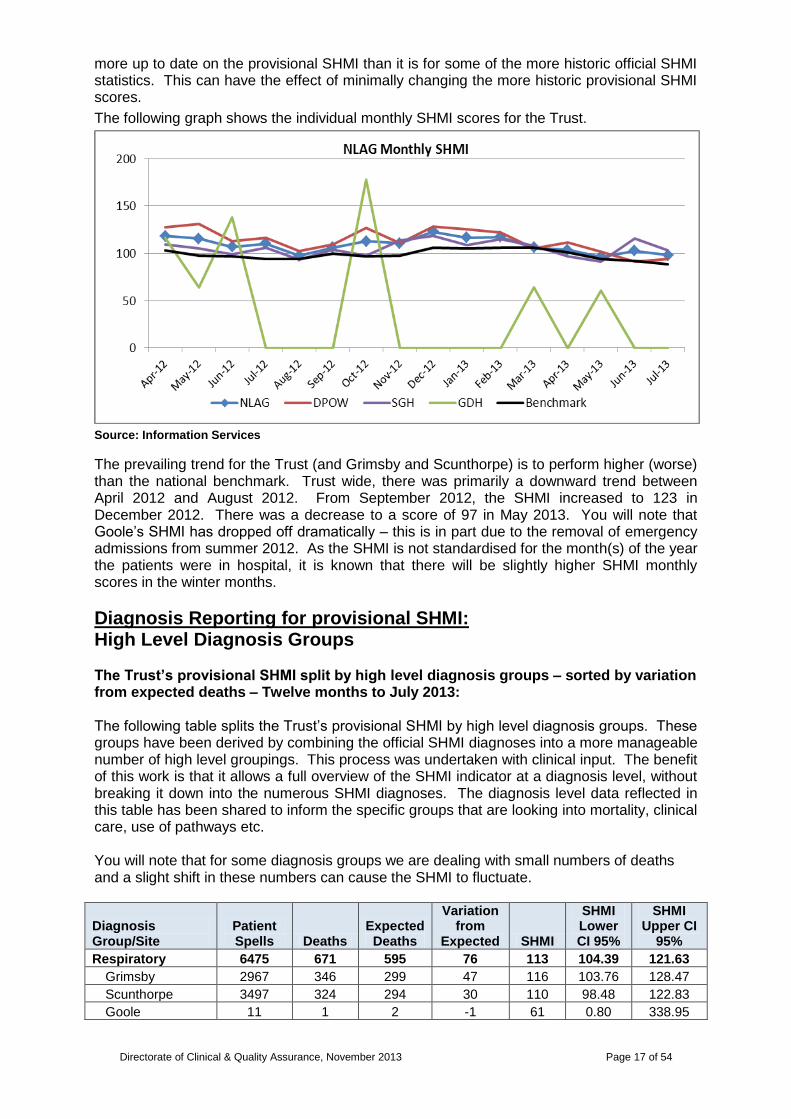
The following graph shows the individual monthly SHMI scores for the Trust.
Source: Information Services
The prevailing trend for the Trust (and Grimsby and Scunthorpe) is to perform higher (worse) than the national benchmark. Trust wide, there was primarily a downward trend between April 2012 and August 2012. From September 2012, the SHMI increased to 123 in December 2012. There was a decrease to a score of 97 in May 2013. You will note that Goole‟s SHMI has dropped off dramatically – this is in part due to the removal of emergency admissions from summer 2012. As the SHMI is not standardised for the month(s) of the year the patients were in hospital, it is known that there will be slightly higher SHMI monthly scores in the winter months.
Diagnosis Reporting for provisional SHMI: High Level Diagnosis Groups The Trust‟s provisional SHMI split by high level diagnosis groups – sorted by variation from expected deaths – Twelve months to July 2013: The following table splits the Trust‟s provisional SHMI by high level diagnosis groups. These groups have been derived by combining the official SHMI diagnoses into a more manageable number of high level groupings. This process was undertaken with clinical input. The benefit of this work is that it allows a full overview of the SHMI indicator at a diagnosis level, without breaking it down into the numerous SHMI diagnoses. The diagnosis level data reflected in this table has been shared to inform the specific groups that are looking into mortality, clinical care, use of pathways etc. You will note that for some diagnosis groups we are dealing with small numbers of deaths and a slight shift in these numbers can cause the SHMI to fluctuate.
Diagnosis Group/Site
Patient Spells Deaths
Expected Deaths
Variation from
Expected SHMI
SHMI Lower CI 95%
SHMI Upper CI
95%
Respiratory 6475 671 595 76 113 104.39 121.63
Grimsby 2967 346 299 47 116 103.76 128.47
Scunthorpe 3497 324 294 30 110 98.48 122.83
Goole 11 1 2 -1 61 0.80 338.95

Directorate of Clinical & Quality Assurance, November 2013 Page 18 of 54
Diagnosis Group/Site
Patient Spells Deaths
Expected Deaths
Variation from
Expected SHMI
SHMI Lower CI 95%
SHMI Upper CI
95%
Infection 4483 265 217 48 122 107.84 137.72
Grimsby 2172 142 120 22 118 99.67 139.47
Scunthorpe 2281 122 96 26 127 105.38 151.53
Goole 30 1 1 0 111 1.45 616.00
Renal 827 147 115 32 127 107.61 149.70
Grimsby 349 64 51 13 127 97.45 161.60
Scunthorpe 471 83 64 19 130 103.29 160.76
Goole 7 0 1 -1 0 - -
Gastroenterology 6869 268 242 26 111 97.74 124.65
Grimsby 3456 153 131 22 117 99.34 137.28
Scunthorpe 3356 115 111 4 103 85.31 124.04
Goole 57 0 0 0 0 - -
Stroke 1358 143 128 15 111 93.85 131.17
Grimsby 725 87 71 16 123 98.46 151.63
Scunthorpe 620 56 55 1 102 77.33 132.95
Goole 13 0 3 -3 0 - -
DVT/PE 271 16 7 9 217 124.14 352.94
Grimsby 189 13 5 8 238 126.78 407.61
Scunthorpe 80 3 2 1 157 31.62 459.68
Goole 2 0 0 0 0 - -
Trauma and Orthopaedics 4643 139 132 7 105 88.55 124.38
Grimsby 2445 73 66 7 110 86.37 138.55
Scunthorpe 2072 66 64 2 103 79.74 131.18
Goole 126 0 2 -2 0 - -
Neurological 974 28 22 6 129 85.87 186.81
Grimsby 465 12 10 2 118 61.13 206.92
Scunthorpe 498 16 11 5 144 82.21 233.74
Goole 11 0 0 0 0 - -
Miscellaneous* 1862 19 15 4 125 75.07 194.82
Grimsby 941 11 8 3 141 70.34 252.50
Scunthorpe 879 8 7 1 110 47.38 216.84
Goole 42 0 0 0 0 - -
Diabetes and Endocrine 696 26 23 3 112 73.43 164.75
Grimsby 295 11 9 2 122 60.57 217.43
Scunthorpe 398 15 14 1 108 60.29 177.82
Goole 3 0 0 0 0 - -
Urinary Tract 1332 14 11 3 124 67.91 208.59
Grimsby 599 5 4 1 117 37.74 273.28
Scunthorpe 668 9 7 2 131 59.88 249.14
Goole 65 0 0 0 0 - -
Vascular 408 31 29 2 106 71.97 150.39
Grimsby 234 19 16 3 116 69.55 180.49
Scunthorpe 170 12 12 0 102 52.51 177.75
Goole 4 0 1 -1 0 - -
Rheumatoid 2862 21 21 0 101 62.40 154.17
Grimsby 1327 7 8 -1 83 33.26 171.09
Scunthorpe 1098 14 11 3 122 66.63 204.68
Goole 437 0 1 -1 0 - -
Psychological 531 20 21 -1 97 59.23 149.82
Grimsby 258 7 7 0 104 41.78 214.88
Scunthorpe 272 13 14 -1 94 50.13 161.17

Directorate of Clinical & Quality Assurance, November 2013 Page 19 of 54
Diagnosis Group/Site
Patient Spells Deaths
Expected Deaths
Variation from
Expected SHMI
SHMI Lower CI 95%
SHMI Upper CI
95%
Goole 1 0 0 0 0 - -
Gynaecology 14136 2 3 -1 71 7.93 254.92
Grimsby 8706 0 1 -1 0 - -
Scunthorpe 5348 2 1 1 135 15.11 485.90
Goole 82 0 0 0 0 - -
Digestive 347 3 5 -2 60 12.13 176.29
Grimsby 149 3 2 1 137 27.46 399.27
Scunthorpe 198 0 3 -3 0 - -
Haematology 182 3 5 -2 57 11.49 167.08
Grimsby 73 2 2 0 106 11.91 382.89
Scunthorpe 109 1 3 -2 30 0.39 165.57
Neonatal 1365 3 12 -9 26 5.20 75.65
Grimsby 690 2 6 -4 32 3.56 114.52
Scunthorpe 674 1 5 -4 19 0.25 105.38
Goole 1 0 0 0 0 - -
Cardiology 5049 205 219 -14 93 81.11 107.18
Grimsby 2340 100 107 -7 93 75.75 113.24
Scunthorpe 2705 104 111 -7 93 76.31 113.17
Goole 4 1 1 0 177 2.32 986.50
Cancer 2963 207 246 -39 84 73.00 96.32
Grimsby 1485 101 118 -17 85 69.45 103.61
Scunthorpe 1389 105 125 -20 84 68.57 101.50
Goole 89 1 3 -2 39 0.51 216.78
Grand Total 57633 2231 2070 161 108 103.36 112.36
* includes patients admitted with a primary diagnosis that was non-specific, malaise, non-specific poisoning etc. Source: Information Services
Diagnosis Reporting for provisional SHMI: Trend Graphs for Top Five High Level Diagnosis Groups The Trust‟s provisional SHMI for the top five high level diagnosis groups – trend graphs – Twelve months to July 2013
The Goole SHMI MAT trends for the top five high level diagnosis groups are not represented graphically as we are dealing with very low numbers of deaths and a slight shift in these numbers causes the SHMI to fluctuate.

Directorate of Clinical & Quality Assurance, November 2013 Page 20 of 54
Source: Information Services
Source: Information Services
Source: Information Services

Directorate of Clinical & Quality Assurance, November 2013 Page 21 of 54
Source: Information Services
Source: Information Services
4.5 Weekday & Weekend SHMI
Provisional SHMI by admission period – 12 months to July 2013
The following table shows the SHMI by weekday v weekend admissions for the last twelve months.
Admission Period/Site
Patient Spells Deaths
Expected Deaths
Variation from
Expected SHMI Score
SHMI Lower CI
95%
SHMI Upper CI
95%
Weekday 45541 1655 1570 85 105 100.41 110.63
Grimsby 23561 844 780 64 108 101.06 115.79
Scunthorpe 21036 808 777 31 104 96.97 111.45
Goole 944 3 13 -10 23 4.54 65.97
Weekend 12092 576 500 76 115 105.99 125.02
Grimsby 6304 314 264 50 119 106.34 133.10
Scunthorpe 5747 261 235 26 111 97.94 125.32
Goole 41 1 1 0 76 1.00 423.62
Grand Total 57633 2231 2070 161 108 103.36 112.36
Source: Information Services
Comment: You can see there is a higher SHMI for weekend admissions – a difference of 10 points between the two periods at trust level. Grimsby has an 11 point difference and

Directorate of Clinical & Quality Assurance, November 2013 Page 22 of 54
Scunthorpe a 7 point difference. Goole‟s difference is more pronounced due to the small number of deaths. Note that because the SHMI model is not standardised by weekday v weekend admissions, the national average SHMI is not 100 when split by admission period. The national average SHMI for the weekday admission period is 98 and for the weekend admission period is 106; a difference of 8 points. Both of the larger hospitals sites‟ SHMI scores are higher than the weekday and the weekend national average SHMI scores.
4.6 Provisional SHMI: Elective and Non Elective split
Provisional SHMI by admission type – 12 months to July 2013
The following table shows the SHMI by admission type for the last twelve months.
Admission Type/Site
Patient Spells Deaths
Expected Deaths
Variation from
Expected SHMI Score
SHMI Lower CI
95%
SHMI Upper CI
95%
Non-elective 48594 2155 1993 162 108 103.59 112.77
Grimsby 25079 1125 1010 115 111 105.00 118.12
Scunthorpe 23370 1028 972 56 106 99.39 112.43
Goole 145 2 12 -10 17 1.92 61.71
Elective 9039 76 76 0 100 78.46 124.65
Grimsby 4786 33 34 -1 98 67.75 138.25
Scunthorpe 3413 41 40 1 103 73.75 139.43
Goole 840 2 3 -1 69 7.75 249.04
Grand Total 57633 2231 2070 161 108 103.36 112.36
Source: Information Services
Comment: You can see that at trust level there is a higher SHMI for non-elective admissions. Note the number of elective deaths is small compared to the non-elective cohort and a slight change in numbers can affect the elective SHMI score. Full collection of co-morbidities should be stressed to elective services, such as surgery, to ensure the Trust has an accurate number of expected deaths.
4.7 Provisional SHMI: In and Out of Hospital Split
Provisional SHMI: Deaths split by In/Out of Hospital – 12 months to July 2013
The following table shows the split of SHMI deaths by in and out of hospital for the last twelve months.
Site Deaths In Hospital Deaths Out of Hospital Deaths % In Hospital
Grimsby 1158 824 334 71.2%
Scunthorpe 1069 745 324 69.7%
Goole 4 3 1 75.0%
Grand Total 2231 1572 659 70.5%
Source: Information Services
Comment: You can see that around 70% of all the SHMI deaths for the year to July 2013 occurred in hospital. The remainder occurred within 30 days of discharge from the Trust. The number of deaths at the Goole site is small and this can, in turn, cause the in hospital percentage to fluctuate. The national average for in hospital deaths was 73% for the year April 2012 – March 2013.

Directorate of Clinical & Quality Assurance, November 2013 Page 23 of 54
Provisional SHMI: Score split by In/Out of Hospital SHMI – 12 months to July 2013
The following table shows the full SHMI score for the last twelve months split into in and out of hospital components.
Site Full SHMI In Hospital SHMI Out of Hospital SHMI
Grimsby 111 106 125
Scunthorpe 106 101 119
Goole 27 28 25
Grand Total 108 103 121
Source: Information Services
Comment: The full SHMI is a health community measure. Practice in our hospitals is not the only factor influencing the SHMI score. The split of the SHMI into the in and out of hospital components gives us an indication of the SHMI performance for these two elements of the health community. The methodology used for the split of the full SHMI is the same as the one used in the Boston Consulting Group SHMI analysis undertaken on behalf of our commissioners in early 2013. You can see that there is a higher out of hospital SHMI for the Trust and the two larger sites. The number of deaths at the Goole site is small and this can, in turn, cause the SHMI scores to fluctuate.
Provisional SHMI: In/Out of Hospital SHMI Score Trending Graph
The following graph shows the moving annual total scores for the full SHMI, the in hospital SHMI and the out of hospital SHMI for the Trust.
Source: Information Services
Comment: The reduction in the in hospital element of the SHMI mirrors the reduction of the full SHMI itself. Note this improvement is not shown by the out of hospital SHMI, stressed by the widening gap on the graph.
Directorate of Clinical & Quality Assurance, November 2013 Page 24 of 54
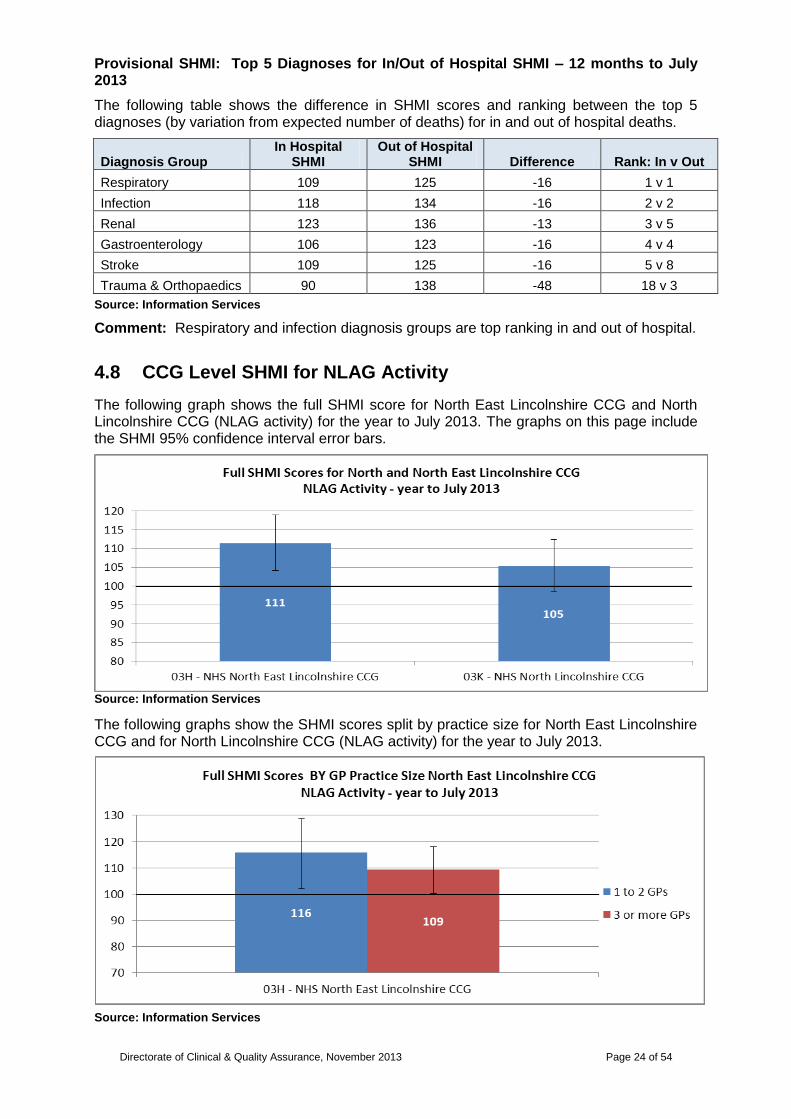
Provisional SHMI: Top 5 Diagnoses for In/Out of Hospital SHMI – 12 months to July 2013
The following table shows the difference in SHMI scores and ranking between the top 5 diagnoses (by variation from expected number of deaths) for in and out of hospital deaths.
Diagnosis Group In Hospital
SHMI Out of Hospital
SHMI Difference Rank: In v Out
Respiratory 109 125 -16 1 v 1
Infection 118 134 -16 2 v 2
Renal 123 136 -13 3 v 5
Gastroenterology 106 123 -16 4 v 4
Stroke 109 125 -16 5 v 8
Trauma & Orthopaedics 90 138 -48 18 v 3
Source: Information Services
Comment: Respiratory and infection diagnosis groups are top ranking in and out of hospital.
4.8 CCG Level SHMI for NLAG Activity
The following graph shows the full SHMI score for North East Lincolnshire CCG and North Lincolnshire CCG (NLAG activity) for the year to July 2013. The graphs on this page include the SHMI 95% confidence interval error bars.
Source: Information Services
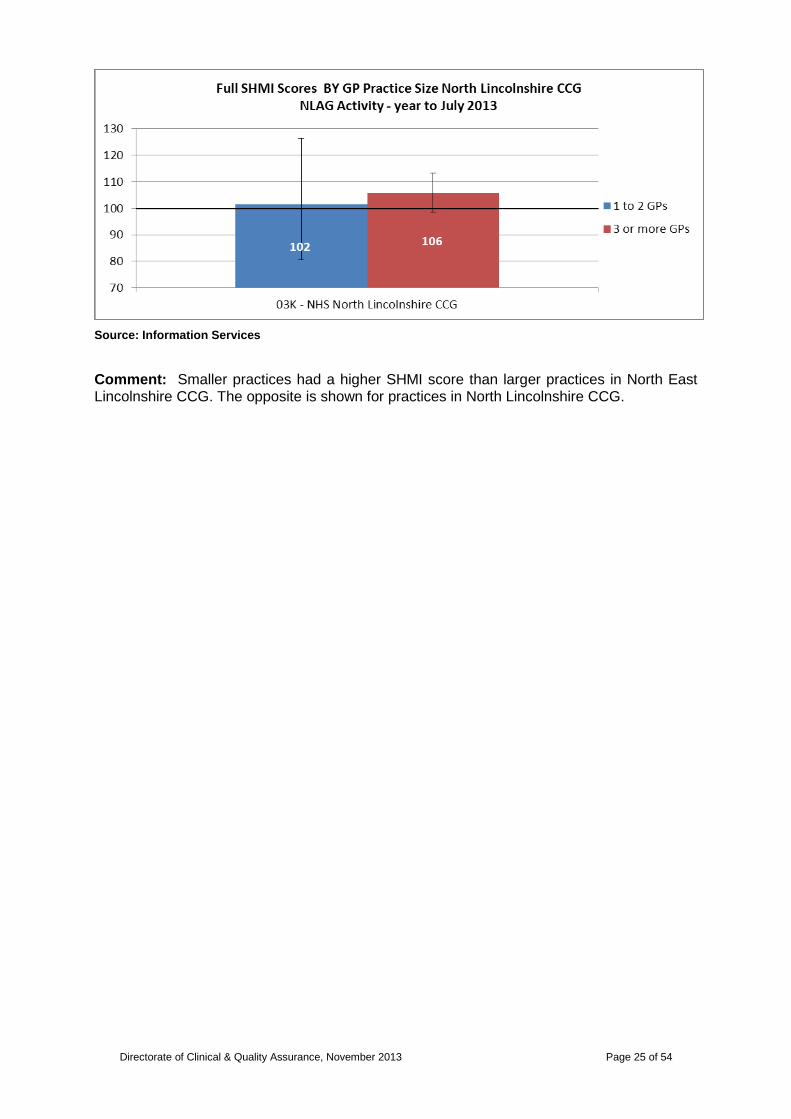
The following graphs show the SHMI scores split by practice size for North East Lincolnshire CCG and for North Lincolnshire CCG (NLAG activity) for the year to July 2013.
Source: Information Services
Directorate of Clinical & Quality Assurance, November 2013 Page 25 of 54
Source: Information Services
Comment: Smaller practices had a higher SHMI score than larger practices in North East Lincolnshire CCG. The opposite is shown for practices in North Lincolnshire CCG.
Directorate of Clinical & Quality Assurance, November 2013 Page 26 of 54
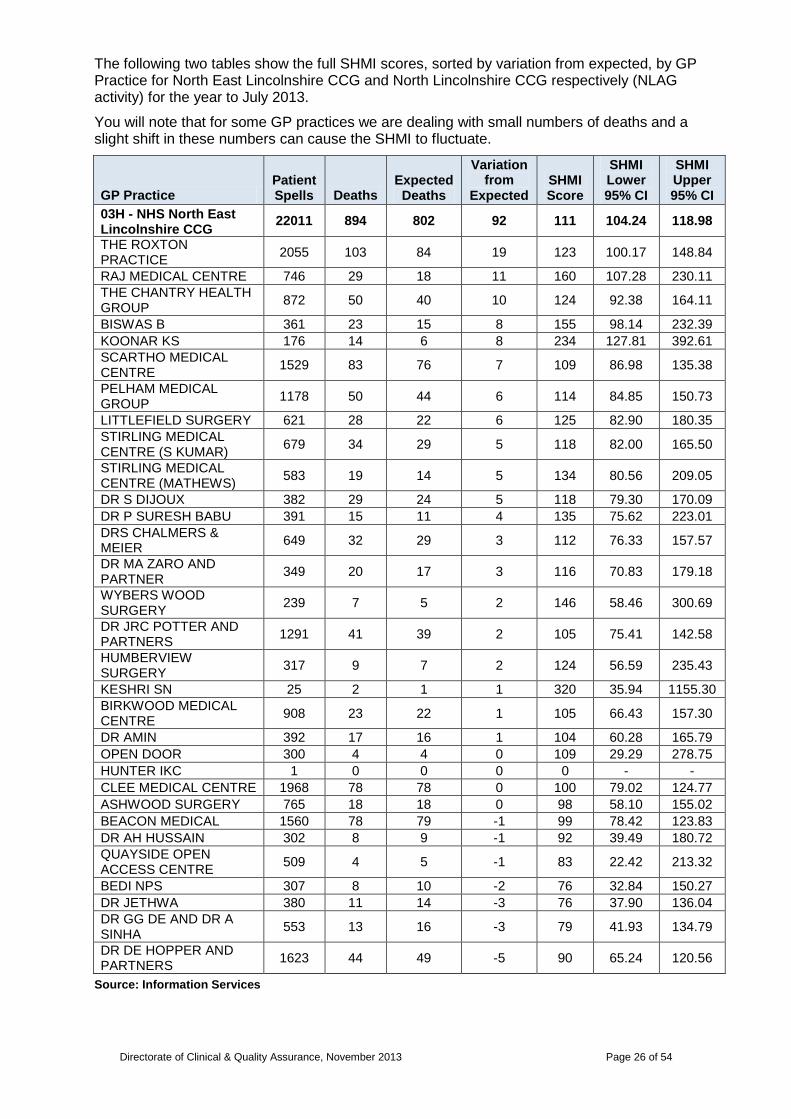
The following two tables show the full SHMI scores, sorted by variation from expected, by GP Practice for North East Lincolnshire CCG and North Lincolnshire CCG respectively (NLAG activity) for the year to July 2013.
You will note that for some GP practices we are dealing with small numbers of deaths and a slight shift in these numbers can cause the SHMI to fluctuate.
GP Practice Patient Spells Deaths
Expected Deaths
Variation from
Expected SHMI Score
SHMI Lower 95% CI
SHMI Upper 95% CI
03H - NHS North East Lincolnshire CCG
22011 894 802 92 111 104.24 118.98
THE ROXTON PRACTICE
2055 103 84 19 123 100.17 148.84
RAJ MEDICAL CENTRE 746 29 18 11 160 107.28 230.11
THE CHANTRY HEALTH GROUP
872 50 40 10 124 92.38 164.11
BISWAS B 361 23 15 8 155 98.14 232.39
KOONAR KS 176 14 6 8 234 127.81 392.61
SCARTHO MEDICAL CENTRE
1529 83 76 7 109 86.98 135.38
PELHAM MEDICAL GROUP
1178 50 44 6 114 84.85 150.73
LITTLEFIELD SURGERY 621 28 22 6 125 82.90 180.35
STIRLING MEDICAL CENTRE (S KUMAR)
679 34 29 5 118 82.00 165.50
STIRLING MEDICAL CENTRE (MATHEWS)
583 19 14 5 134 80.56 209.05
DR S DIJOUX 382 29 24 5 118 79.30 170.09
DR P SURESH BABU 391 15 11 4 135 75.62 223.01
DRS CHALMERS & MEIER
649 32 29 3 112 76.33 157.57
DR MA ZARO AND PARTNER
349 20 17 3 116 70.83 179.18
WYBERS WOOD SURGERY
239 7 5 2 146 58.46 300.69
DR JRC POTTER AND PARTNERS
1291 41 39 2 105 75.41 142.58
HUMBERVIEW SURGERY
317 9 7 2 124 56.59 235.43
KESHRI SN 25 2 1 1 320 35.94 1155.30
BIRKWOOD MEDICAL CENTRE
908 23 22 1 105 66.43 157.30
DR AMIN 392 17 16 1 104 60.28 165.79
OPEN DOOR 300 4 4 0 109 29.29 278.75
HUNTER IKC 1 0 0 0 0 - -
CLEE MEDICAL CENTRE 1968 78 78 0 100 79.02 124.77
ASHWOOD SURGERY 765 18 18 0 98 58.10 155.02
BEACON MEDICAL 1560 78 79 -1 99 78.42 123.83
DR AH HUSSAIN 302 8 9 -1 92 39.49 180.72
QUAYSIDE OPEN ACCESS CENTRE
509 4 5 -1 83 22.42 213.32
BEDI NPS 307 8 10 -2 76 32.84 150.27
DR JETHWA 380 11 14 -3 76 37.90 136.04
DR GG DE AND DR A SINHA
553 13 16 -3 79 41.93 134.79
DR DE HOPPER AND PARTNERS
1623 44 49 -5 90 65.24 120.56
Source: Information Services

Directorate of Clinical & Quality Assurance, November 2013 Page 27 of 54
GP Practice Patient Spells Deaths
Expected Deaths
Variation from
Expected SHMI Score
SHMI Lower 95% CI
SHMI Upper 95% CI
03K - NHS North Lincolnshire CCG
22845 882 838 44 105 98.47 112.49
RIVERSIDE SURGERY 1667 93 81 12 114 92.14 139.86
TRENT VIEW MEDICAL PRACTICE
1662 76 65 11 116 91.42 145.24
DR RM JAGGS-FOWLER & PARTNERS
1538 58 48 10 120 90.99 154.92
BRIDGE STREET SURGERY
801 45 36 9 126 91.75 168.34
CEDAR MEDICAL PRACTICE
962 51 42 9 121 90.17 159.24
WINTERTON MEDICAL PRACTICE
1242 53 45 8 117 87.95 153.60
KIRTON LINDSEY SURGERY
576 29 21 8 136 91.12 195.46
SOUTH AXHOLME PRACTICE
1147 53 46 7 114 85.38 149.10
VORA A 256 15 11 4 143 79.77 235.26
KENNEDY JCBS 2765 103 99 4 104 84.70 125.86
DR SHAMBHU & UGARGOL
612 19 17 2 111 66.75 173.23
BASU DK 3 0 0 0 0 - -
CHURCH LANE MEDICAL CENTRE
1264 53 53 0 100 74.53 130.16
WEST TOWN SURGERY 180 4 4 0 91 24.39 232.14
BHORCHI GR 150 3 4 -1 77 15.39 223.74
THE OSWALD ROAD MEDICAL SURGERY
647 19 20 -1 94 56.70 147.14
WEST COMMON LANE TEACHING PRACTICE
810 20 22 -2 89 54.28 137.31
BALASANTHIRAN S 443 20 23 -3 88 53.90 136.35
ASHBY TURN PRIMARY CARE PARTNERS
1877 71 74 -3 96 75.17 121.42
MARKET HILL 8 TO 8 CENTRE
762 3 9 -6 35 6.97 101.28
THE BIRCHES MEDICAL PRACTICE
1178 21 30 -9 71 43.89 108.42
CAMBRIDGE AVENUE MEDICAL CENTRE
2303 73 86 -13 85 66.90 107.32
Source: Information Services

Directorate of Clinical & Quality Assurance, November 2013 Page 28 of 54
4.9 Risk Adjusted Mortality Index (RAMI)
NLAG RAMI Score in National Context
The Trust now uses the SHMI as its key standardised mortality ratio (SMR), however it is prudent to monitor performance on other indicators if we have them available to us. The Trust has access to the CHKS Signpost product to monitor other areas of performance such as emergency readmission rates, outpatient did not attend (dna) rates and new to review ratios. Signpost also gives us access to Risk Adjusted Mortality Index (RAMI).
The RAMI is a standardised mortality ratio that is case mix adjusted. It uses a different methodology from SHMI. Where possible, a RAMI score should be compared to a peer value as the older the statistical model is a score of 100 is not necessarily the „norm‟. CHKS update, or rebase, the model once a year.
The graph below shows the Trust‟s most recent 12 months‟ RAMI score in comparison with other national Trusts.
NLAG‟s RAMI score in comparison with other national Trusts – 12 months to September 2013
Source: CHKS.
Comment: NLAG has a RAMI score of 91. The national average RAMI score is 92.
A section on the Trust‟s HSMR position follows.

Directorate of Clinical & Quality Assurance, November 2013 Page 29 of 54
4.10 Hospital Standardised Mortality Ratio (HSMR)
The Dr Foster Hospital Guide is released each November/December. The November 2012 release showed NLAG with an overall HSMR score of 118. This was in the „higher than expected‟ banding. The HSMR was also provided for emergency weekend and weekday admissions. These figures showed a higher HSMR (of 128) for weekend emergency admissions than for those on a weekday (HSMR of 119). Both HSMRs were in the „higher than expected‟ banding. Two other mortality indicators that were published were in the „in expected range‟ banding – these were deaths after surgery and mortality in low risk diagnosis groups.
In terms of more recent data, the following, sourced from the Healthcare Evaluation Data (HED) toolkit shows the Trust‟s most recent 12 months‟ HSMR score in comparison with other national Trusts.
Source: Information Services
Comment: NLAG has a HSMR of 105 for the twelve months to August 2013, the national average being 100. It is expected that the next Hospital Guide publication (December 2013), covering the time period April 2012 to March 2013, will show a HSMR of 109.
Directorate of Clinical & Quality Assurance, November 2013 Page 30 of 54
4.0 Mortality Indicators
This section…
5.0 CLINICAL CODING INDICATORS
5.1 Depth of Coding
5.2 Recording of Co-morbidity Codes
5.3 Signs and Symptoms “R” Codes
5.4 Palliative Care Coding
6.0 Update on Mortality Trigger Tool Work
7.0 Update on Pathway Specific Mortality Action Groups
8.0 Nursing Staffing Levels
9.0 Glossary

Directorate of Clinical & Quality Assurance, November 2013 Page 31 of 54
5.0 CLINICAL CODING INDICATORS
The following report outlining coding indicators is compiled by Information Services. It contains analysis of NLAG‟s performance in relation to those coding indicators that have an impact on mortality indicators such as SHMI, RAMI and HSMR.
Executive Summary:
The data contained within this section illustrates:
During the last year, the average depth of coding has improved in the trust and is better than the peer average. In October 2013 there were 5.0 diagnoses per coded episode compared to a peer of 4.4.
Over the last twelve months, the number of co-morbidities recorded and coded has increased. In October 2013 there were 8935 co-morbidity codes. The continued full collection and recording of co-morbidities should be reasserted to clinicians.
Over the last year, the percentage of admissions with an R signs and symptoms code has decreased – 6.6% in October 2013 compared to 9.2% in October 2012. The percentage of first episodes with an R code as a primary diagnosis has been better than peer since October 2012. In September 2013, the trust had 5.8% of first episodes with a primary diagnosis R code – the peer average was 10.5%. There was a worsening trend of a higher percentage of admissions with the R codes since December 2012; however this has plateaued in recent months. Continued Clinical Coding input with clinicians on recording appropriate, specific, diagnoses should continue.
With regards to coded palliative care (Z515 code), the trust performs slightly better than peer for the percentage of episodes with a palliative care code (Trust 0.8% v peer 0.7%).
A lot of work has been invested into improving the recording in, and subsequent coding of, clinical case notes. Pro-active work continues to take place in the communication between clinical staff delivering care and the coding team to ensure what is recorded on the data systems within the Trust is as accurate and in-depth as possible.
C
lin
ica
l C
od
ing
In
dic
ato
rs

Directorate of Clinical & Quality Assurance, November 2013 Page 32 of 54
5.1 Depth of Coding
Depth of coding is the average number of diagnosis codes per episode of care. A high depth of coding reflects a wide source of clinical information captured in the case notes that then goes on to be coded. It is widely recognised that a high depth of coding may be an advantage in relation to mortality indicators such as SHMI, RAMI and HSMR as it helps to accurately reflect the total number of “expected deaths”. This said, the quality of the source diagnoses in the case notes is also important – having many non-specific diagnoses will not benefit the Trust in relation to mortality indicators.
Depth of Coding – April 2011 to present
The following graph shows the depth of coding for all episodes of care from April 2011 to present.
Source: Information Services
Comment: You will see that since the beginning of 2012, Grimsby has performed above the peer average. Scunthorpe has been improving and since December 2012 has matched or beaten the peer average. Of late, Goole has performed slightly better than the peer performance. The Trust has increased its depth of coding from 4.3 diagnoses per coded episode of care in October 2012 to 5.0 in October 2013. In the most recent month there were 51,651 diagnoses coded across the trust.
An analysis of the recording of co-morbidity codes, which can positively affect the „expected number‟ of deaths in mortality ratios, such as SHMI, follows.
2.5
3.0
3.5
4.0
4.5
5.0
5.5
6.0
Ap
r
May Jun
Jul
Au
g
Sep
Oct
No
v
De
c
Jan
Feb
Mar
Ap
r
May Jun
Jul
Au
g
Sep
Oct
No
v
De
c
Jan
Feb
Mar
Ap
r
May Jun
Jul
Au
g
Sep
Oct
2011 2012 2013
Depth of Coding Trend - All Episodes
DPOW SGH GDH Peer

Directorate of Clinical & Quality Assurance, November 2013 Page 33 of 54
5.2 Recording of Co-Morbidity Codes
The recording and coding of co-morbidities is important to monitor as they affect the risk given to the patient in the SHMI statistical model. If co-morbidities are not recorded this could be reducing the “expected number of deaths” and therefore potentially raising our SHMI score. Fully recording co-morbidities also benefits RAMI and HSMR.
The following graph shows the number of co-morbidity codes coded.
Number of co-morbidity codes coded
Source: Information Services
Comment: The amount of co-morbidities coded has increased over the last year. The continued collection of co-morbidities, which should be supported by clinical management, should be stressed to help to continue to improve the amount of co-morbidities collected and coded. We have no benchmarking data to derive a peer comparison. There were 8935 co-morbidity codes collected in October 2013 across the Trust.
An analysis of the recording of signs and symptoms codes, which can adversely affect the „expected number‟ of deaths in mortality ratios, such as SHMI, follows.
0
1000
2000
3000
4000
5000
6000
Ap
r
May Jun
Jul
Au
g
Sep
Oct
No
v
De
c
Jan
Feb
Mar
Ap
r
May Jun
Jul
Au
g
Sep
Oct
No
v
De
c
Jan
Feb
Mar
Ap
r
May Jun
Jul
Au
g
Sep
Oct
2011 2012 2013
Number of Co-morbidities Trend - All Episodes
DPOW SGH GDH

Directorate of Clinical & Quality Assurance, November 2013 Page 34 of 54
5.3 Signs and Symptoms “R” Codes
The recording and coding of primary diagnoses is important as this is one of the data items that affects the risk attached to the patient in the SHMI statistical model. If a diagnosis is recorded as a query or is not specific, then this is coded as an R signs and symptoms code. These R codes hold a lower risk, this is turn reduces the expected number of deaths having the outcome of a higher SHMI score. A reduction in R codes will also benefit RAMI and HSMR.
Percentage of patient admissions with an R code as a primary diagnosis
The following graph shows a site level trend of the percentage of patient admissions with an R code as a primary diagnosis.
* where multi episode spell has a primary diagnosis of an R Code in the first two episodes or where a single episode spell has a primary diagnosis of an R code in that single episode.
Comment: The percentage rate of admissions with an R code signs and symptoms diagnosis has showed a slight increase over recent months. A reduction will be achieved by clinicians recording appropriate, specific, diagnoses upon admission. From October 2012, there was a substantial drop in the percentage of admissions with an R code signs and symptoms diagnosis. This reflects the work that was been carried out with clinicians by Clinical Coding. The Trust level percentage has dropped to 6.6% in October 2013 from 9.2% in October 2012. Numerically, there were 593 admissions with an R code in October 2013 – this has dropped from 835 in October 2012.
Use of Signs and Symptoms R Codes – Benchmarked Position
Using the CHKS benchmarking system, we can benchmark our use of R codes against a peer average. The following graph shows the percentage of first episodes with a primary diagnosis of an R code.
0.0%
2.0%
4.0%
6.0%
8.0%
10.0%
12.0%
14.0%
Ap
r
May Jun
Jul
Au
g
Sep
Oct
No
v
De
c
Jan
Feb
Mar
Ap
r
May Jun
Jul
Au
g
Sep
Oct
No
v
De
c
Jan
Feb
Mar
Ap
r
May Jun
Jul
Au
g
Sep
Oct
2011 2012 2013
Percentage of admissions with an R Code Diagnosis*
DPOW SGH GDH

Directorate of Clinical & Quality Assurance, November 2013 Page 35 of 54
The percentage of first episodes with a primary diagnosis of an R code
Source: Information Services
Comment: The graph shows that since October 2012, our rate against peer average for the percentage of first episodes of care with an R code as a primary diagnosis has improved (dropped). Our rate in September 2013 was 5.8% compared to a peer value of 10.5%. It is worth noting a slight increasing trend since December 2012; however this has plateaued in recent months.
5.4 Palliative Care Coding
The recording and coding of palliative care (Z515 code) for appropriate patients will exclude these patients from the RAMI indicator. The code is also used to adjust the Dr Foster HSMR statistic. Presently, the SHMI indicator makes no adjustment for palliative care.
Percentage of episodes with a Z515 palliative care code – Benchmarked Position
The following graph shows the percentage of episodes of care which were coded with a Z515 palliative care code against the peer average.
Comment: In the main the trust has largely performed better than peer in the coding of palliative care when looking at all episodes of care. In September 2013, the trust coded 0.8% of episodes with the code v a peer average of 0.7%. The monthly numerical average is c. 70 episodes with this clinical code.

Directorate of Clinical & Quality Assurance, November 2013 Page 36 of 54
4.0 Mortality Indicators
5.0 Clinical Coding Indicators
This section…
6.0 MORTALITY TRIGGER TOOL WORK
6.1 Overview of the Process
7.0 Update on Pathway Specific Mortality Action Groups
8.0 Nursing Staffing Levels
9.0 Glossary
Directorate of Clinical & Quality Assurance, November 2013 Page 37 of 54
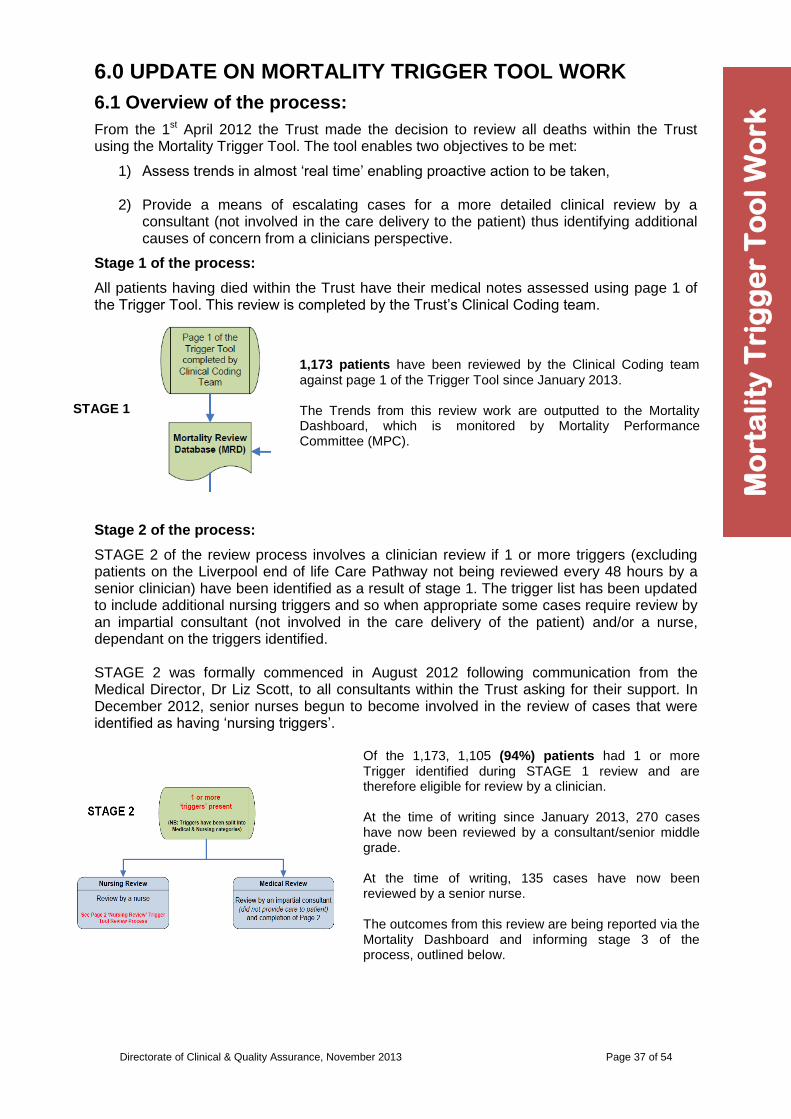
6.0 UPDATE ON MORTALITY TRIGGER TOOL WORK
6.1 Overview of the process:
From the 1st April 2012 the Trust made the decision to review all deaths within the Trust using the Mortality Trigger Tool. The tool enables two objectives to be met:
1) Assess trends in almost „real time‟ enabling proactive action to be taken,
2) Provide a means of escalating cases for a more detailed clinical review by a consultant (not involved in the care delivery to the patient) thus identifying additional causes of concern from a clinicians perspective.
Stage 1 of the process:
All patients having died within the Trust have their medical notes assessed using page 1 of the Trigger Tool. This review is completed by the Trust‟s Clinical Coding team.
STAGE 1
1,173 patients have been reviewed by the Clinical Coding team against page 1 of the Trigger Tool since January 2013. The Trends from this review work are outputted to the Mortality Dashboard, which is monitored by Mortality Performance Committee (MPC).
Stage 2 of the process:
STAGE 2 of the review process involves a clinician review if 1 or more triggers (excluding patients on the Liverpool end of life Care Pathway not being reviewed every 48 hours by a senior clinician) have been identified as a result of stage 1. The trigger list has been updated to include additional nursing triggers and so when appropriate some cases require review by an impartial consultant (not involved in the care delivery of the patient) and/or a nurse, dependant on the triggers identified. STAGE 2 was formally commenced in August 2012 following communication from the Medical Director, Dr Liz Scott, to all consultants within the Trust asking for their support. In December 2012, senior nurses begun to become involved in the review of cases that were identified as having „nursing triggers‟.
Of the 1,173, 1,105 (94%) patients had 1 or more Trigger identified during STAGE 1 review and are therefore eligible for review by a clinician. At the time of writing since January 2013, 270 cases have now been reviewed by a consultant/senior middle grade. At the time of writing, 135 cases have now been reviewed by a senior nurse. The outcomes from this review are being reported via the Mortality Dashboard and informing stage 3 of the process, outlined below.
Mo
rta
lity
Tri
gg
er
To
ol
Wo
rk
Directorate of Clinical & Quality Assurance, November 2013 Page 38 of 54
Stage 3 of the process – Medical Review:
Where learning points have been identified as a result of a senior doctor review, these cases are:
Reviewed by the Medical Director/Group‟s Clinical Director,
Significant concerns can then be escalated to the Executive Team,
Cases offering learning will then be presented/discussed at a specific specialty specific Mortality Review Meeting (chaired by the Medical Director, senior medical member of the Mortality Performance Committee (MPC) or the Group‟s Clinical Director).
Stage 3 of the process – Nursing Review:
Where learning points have been identified as a result of the nursing review, these cases are:
Reviewed by the Chief Nurse,
Significant concerns can then be escalated to the Executive Team,
Cases offering learning will then be presented/discussed at a specific nursing Mortality Review Meeting (chaired by the Chief Nurse).
Stage 4 of the process: The outcomes from the mortality review discussions will be fed into the specialty group‟s Clinical Governance Meeting framework for their monitoring of resulting action plans. The above process is being evaluated at the current time in order to ascertain an improved method of merging learning from medical and nursing reviews into one specialty focussing Morbidity and Mortality meeting. This will be discussed in more detail by the Mortality Performance Committee.

Directorate of Clinical & Quality Assurance, November 2013 Page 39 of 54
4.0 Mortality Indicators
5.0 Clinical Coding Indicators
6.0 Update on Mortality Trigger Tool Work
This section…
7.0 UPDATE ON PATHWAY SPECIFIC MORTALITY ACTION GROUPS
7.1 Acting on „Themes‟ Identified
7.2 FOCUS ON: Stroke Mortality Improvement Project
8.0 Nursing Staffing Levels
9.0 Glossary

Directorate of Clinical & Quality Assurance, November 2013 Page 40 of 54
7.0 UPDATE ON PATHWAY SPECIFIC MORTALITY ACTION GROUPS
7.1 Acting on the „Themes‟ identified
Section 4 of this report provides a detailed summary of mortality performance at „pathway‟ level. This information is supported by the „action themes‟ from the Trigger Tool mortality review process. In order to act on this information clinically-led teams have been set up to focus on taking action to improve specific pathway areas ensuring that pathways of care are clearly defined and followed. These groups will be accountable to the Mortality Performance Committee. The pathway groups are as follows:
Stroke Services
Respiratory Medicine
Gastroenterology
Hospital Acquired Pneumonia
Fluid Management
Cardiac Arrests
Sepsis
Haematology/Oncology
Diabetes & Endocrine Supported by more general action groups focussing on:
Safe staffing levels
Data
Emergency Services The focus of these groups will be to act with the support of quality evaluation methods designed to measure the impact of such interventions. Each month, one of these areas will be focussed on in more detail to outline the work being taken. This month, this report features the Stroke Services improvement group.
Pa
thw
ay
Sp
ec
ific
Mo
rta
lity
Ac
tio
n G
rou
ps

Directorate of Clinical & Quality Assurance, November 2013 Page 41 of 54
7.2 FOCUS ON: Stroke Services
1. BACKGROUND TO THIS PATHWAY IMPROVEMENT PLAN
Acute provision of stroke services has been provided by the Trust on both of the main hospital sites at Grimsby and Scunthorpe. This service model provided stroke patients with limited hyper-acute stroke care within day time hours.
From a review of mortality data within the Trust, stroke services at both sites were identified as outlying. As a result of this, the stroke services pathway improvement plan was initiated.
The improvement action plan comprised of 3 distinct improvement sections:
24/7 hyper acute stroke service provision,
Improved access to CT Scanning to support the delivery of 24/7 hyper acute care,
Improved access to TIA services.
The key actions that comprise this improvement plan are summarised over the next few pages.
Directorate of Clinical & Quality Assurance, November 2013 Page 42 of 54
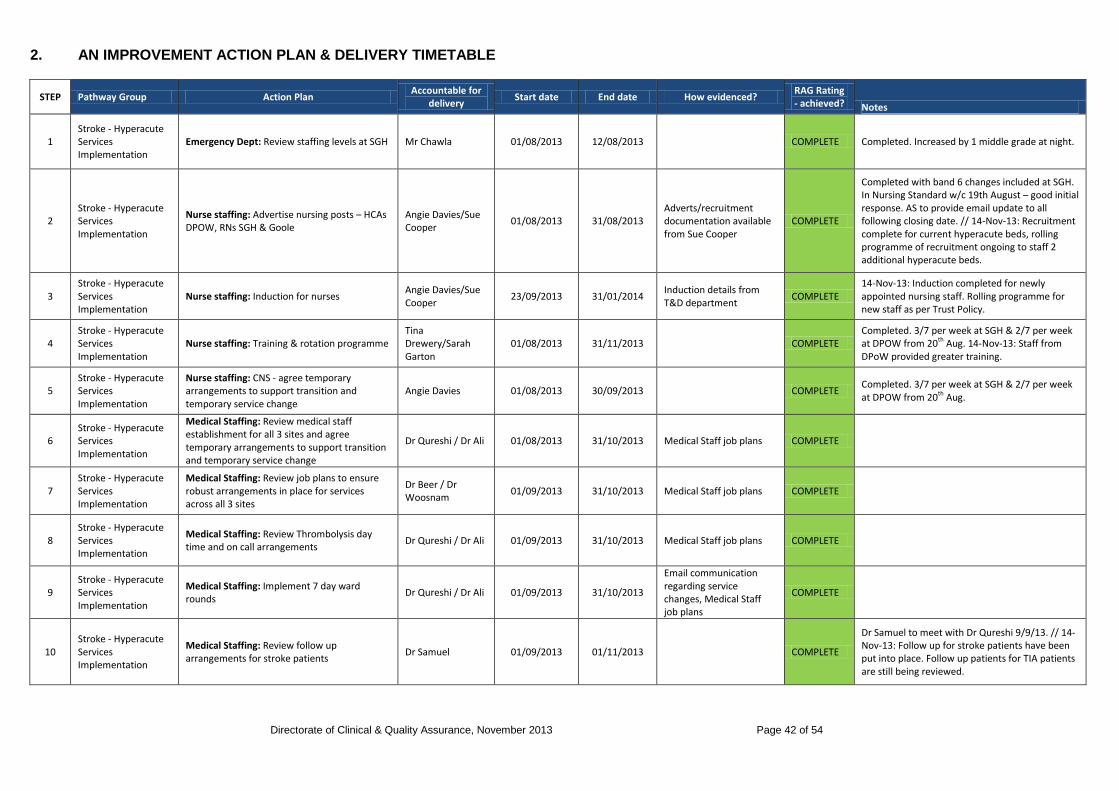
2. AN IMPROVEMENT ACTION PLAN & DELIVERY TIMETABLE
STEP Pathway Group Action Plan Accountable for
delivery Start date End date How evidenced?
RAG Rating - achieved? Notes
1 Stroke - Hyperacute Services Implementation
Emergency Dept: Review staffing levels at SGH Mr Chawla 01/08/2013 12/08/2013 COMPLETE Completed. Increased by 1 middle grade at night.
2 Stroke - Hyperacute Services Implementation
Nurse staffing: Advertise nursing posts – HCAs DPOW, RNs SGH & Goole
Angie Davies/Sue Cooper
01/08/2013 31/08/2013 Adverts/recruitment documentation available from Sue Cooper
COMPLETE
Completed with band 6 changes included at SGH. In Nursing Standard w/c 19th August – good initial response. AS to provide email update to all following closing date. // 14-Nov-13: Recruitment complete for current hyperacute beds, rolling programme of recruitment ongoing to staff 2 additional hyperacute beds.
3 Stroke - Hyperacute Services Implementation
Nurse staffing: Induction for nurses Angie Davies/Sue Cooper
23/09/2013 31/01/2014 Induction details from T&D department
COMPLETE 14-Nov-13: Induction completed for newly appointed nursing staff. Rolling programme for new staff as per Trust Policy.
4 Stroke - Hyperacute Services Implementation
Nurse staffing: Training & rotation programme Tina Drewery/Sarah Garton
01/08/2013 31/11/2013 COMPLETE Completed. 3/7 per week at SGH & 2/7 per week at DPOW from 20th Aug. 14-Nov-13: Staff from DPoW provided greater training.
5 Stroke - Hyperacute Services Implementation
Nurse staffing: CNS - agree temporary arrangements to support transition and temporary service change
Angie Davies 01/08/2013 30/09/2013 COMPLETE Completed. 3/7 per week at SGH & 2/7 per week at DPOW from 20th Aug.
6 Stroke - Hyperacute Services Implementation
Medical Staffing: Review medical staff establishment for all 3 sites and agree temporary arrangements to support transition and temporary service change
Dr Qureshi / Dr Ali 01/08/2013 31/10/2013 Medical Staff job plans COMPLETE
7 Stroke - Hyperacute Services Implementation
Medical Staffing: Review job plans to ensure robust arrangements in place for services across all 3 sites
Dr Beer / Dr Woosnam
01/09/2013 31/10/2013 Medical Staff job plans COMPLETE
8 Stroke - Hyperacute Services Implementation
Medical Staffing: Review Thrombolysis day time and on call arrangements
Dr Qureshi / Dr Ali 01/09/2013 31/10/2013 Medical Staff job plans COMPLETE
9 Stroke - Hyperacute Services Implementation
Medical Staffing: Implement 7 day ward rounds
Dr Qureshi / Dr Ali 01/09/2013 31/10/2013
Email communication regarding service changes, Medical Staff job plans
COMPLETE
10 Stroke - Hyperacute Services Implementation
Medical Staffing: Review follow up arrangements for stroke patients
Dr Samuel 01/09/2013 01/11/2013 COMPLETE
Dr Samuel to meet with Dr Qureshi 9/9/13. // 14-Nov-13: Follow up for stroke patients have been put into place. Follow up patients for TIA patients are still being reviewed.

Directorate of Clinical & Quality Assurance, November 2013 Page 43 of 54
STEP Pathway Group Action Plan Accountable for
delivery Start date End date How evidenced?
RAG Rating - achieved? Notes
11 Stroke - Hyperacute Services Implementation
Medical Staffing: Review TIA clinic configuration
Dr Qureshi / Dr Ali 01/09/2013 01/11/2013 COMPLETE Dr Samuel to meet with Dr Qureshi 9/9/13. // 14-Nov-13: Review completed. Now in the process of implementing actions.
12 Stroke - Hyperacute Services Implementation
Medical Staffing: Implement TIA clinic configuration
Dr Qureshi / Dr Ali 01/11/2013 02/12/2013 Green 14-Nov-13: On course for implementation by 2nd December.
13 Stroke - Hyperacute Services Implementation
Ambulance Service: Agree protocols for direct access to Scunthorpe
Greg Cox 01/08/2013 01/11/2013 See relevant policy COMPLETE
14 Stroke - Hyperacute Services Implementation
Ambulance Service: Agree protocols for transfer from Grimsby to Scunthorpe (or other site) for patients self-presenting to Grimsby
Greg Cox 01/08/2013 01/11/2013 See relevant policy COMPLETE
15 Stroke - Hyperacute Services Implementation
Ambulance Service: Agree protocols for transfer out of Scunthorpe to Grimsby post 72 hours
Greg Cox 01/08/2013 01/11/2013 See relevant policy COMPLETE
16 Stroke - Hyperacute Services Implementation
Therapy staffing: Review therapy staffing Karen Fanthorpe 01/08/2013 31/08/2013 COMPLETE Completed. Plan for rotation of staff in place.
17 Stroke - Hyperacute Services Implementation
Imaging: Complete training for all staff to deliver 24/7 CT head & model rota for SGH
Karen Griffiths 01/10/2013 30/10/2013 Radiology action plan for 24/7 CT scan.
COMPLETE See attached action plans.
18 Stroke - Hyperacute Services Implementation
Specialist Neurovascular: Ensure protocols in place with HEY
Denise Smith 01/08/2013 01/11/2013 Protocols in place with HEY.
Amber
14-Nov-13: HEY consultant has requested further discussions with CCGs of not being able to offer Surgery 7 days, therefore query value in 7 day carotid doppler. Meeting to be arranged, commissioner reps required. Still waiting for meeting. Meeting confirmed for 25th November 2013.
19 Stroke - Hyperacute Services Implementation
Communications: Internal comms plan for all staff affected by changes across all 3 sites
Sarah Mainprize 01/08/2013 01/11/2013 See series of communications to all staff.
COMPLETE
20 Stroke - Hyperacute Services Implementation
Communications: Internal comms for all other staff
Sarah Mainprize 01/08/2013 01/11/2013 See series of communications to all staff.
COMPLETE

Directorate of Clinical & Quality Assurance, November 2013 Page 44 of 54
STEP Pathway Group Action Plan Accountable for
delivery Start date End date How evidenced?
RAG Rating - achieved? Notes
21 Stroke - Hyperacute Services Implementation
Communications: External comms plan for stakeholders, including public
Sarah Mainprize 01/08/2013 01/11/2013
Radio interviews, local press, HealthWatch communications, fact sheets
COMPLETE 14-Nov-13: pdated following Healthwatch feedback has been completed.
22 Stroke - Hyperacute Services Implementation
Project Planning: Establish project planning arrangements
Angie Smithson 01/08/2013 27/09/2013 Project support in post to end of year.
COMPLETE
23 Stroke - Hyperacute Services Implementation
Governance: Ensure robust governance arrangements in place with regular review
Angie Smithson 01/08/2013 01/11/2013
On-going evaluation of service changes being undertaken. Weekly MDT between consultants and radiology. Weekly operational review meetings in place.
COMPLETE
24 Stroke - Hyperacute Services Implementation
Governance: Review reporting arrangements with feedback to ET/Mortality Performance Committee/Mortality Action Group on a monthly basis
Angie Smithson 01/08/2013 31/01/2014 Minutes of July - November meetings
Green
Updates provided to Exec Team, Community Mortality Action Group, Northern Lincolnshire Stroke Steering Group and Trust Board (see minutes of July-Nov meetings). Process in place.
25 Stroke - Hyperacute Services Implementation
Infrastructure: Order additional monitors & network points for Scunthorpe
Denise Smith 01/08/2013 01/11/2013 Infrastructure changes visible.
COMPLETE
26 Stroke - Hyperacute Services Implementation
Infrastructure: Review equipment requirements
Denise Smith 01/08/2013 01/11/2013 Equipment in place. COMPLETE
27 Stroke - Hyperacute Services Implementation
Infrastructure: Review telemedicine equipment requirements
Denise Smith 01/08/2013 01/11/2013 Tele-medicine equipment now available.
COMPLETE
28 Stroke - CT Scan
Radiographer led Referral Guidelines to be produced: Using guidelines from other Trusts sites, develop local guidelines in order that referrals can be received promptly into the CT Department and no delays are experienced from vetting and accepting the referral
Jackie Carpus/Ruth Kent
01/08/2013 01/11/2013 see Diagnostics Imaging policy in place, issued 14.1113
COMPLETE used to inform local work
29 Stroke - CT Scan
General radiographers that cannot currently undertake CT Stroke Head scanning to be identified: Discuss this action plan with general radiographers at team and individual ADR meetings to ensure they are away of the strategy for stroke services and local work required. Understand numbers to be trained on either site in CT Stroke head scanning
Jackie Carpus/Ruth Kent
01/08/2013 01/11/2013 Training needs analysis records
COMPLETE Internal training programme will be a continuous development

Directorate of Clinical & Quality Assurance, November 2013 Page 45 of 54
STEP Pathway Group Action Plan Accountable for
delivery Start date End date How evidenced?
RAG Rating - achieved? Notes
30 Stroke - CT Scan
Develop and agree a local training package for CT Head scanning for use by General Radiographers: Draft package to be agreed for cross site use
Jackie Carpus/Ruth Kent
01/08/2013 31/08/2013 Agreed training package in place
COMPLETE
31 Stroke - CT Scan
After having identified the number of radiographers required to participate and be competent in CT Head scanning, commence a rotation to CT in order competency can be gained: Active rotation from General to CT to support Head scanning
Jackie Carpus/Ruth Kent
01/08/2013 31/08/2013
Completed and signed off competency packages COMPLETE
32 Stroke - CT Scan
Commence new rotas that see general radiographers moving away from an on call system to a shift system. A night shift will be worked on site that will see a general radiographer work in CT at night to perform a CT Head scan for stroke only. New Establishments agreed with Director of Diagnostics and Therapeutics: Recruit sufficient numbers to move away from on call to a shift system. Co-hort Recruitment started June 2013. Consultation completed with existing staff to move away from on call to a shift system
Tim Mawson/Verne Cranston
01/10/2013 31/10/2013 New rotas working in the workplace
COMPLETE
33 Stroke - CT Scan
Evaluation of operational working and workloads: Develop a means to understand if the new rotas and model of care is working effectively
Jackie Carpus/Ruth Kent/Tim Mawson/ Verne/Cranston/ Tracey Broom
01/10/2013 31/10/2013 new rotas embedded and working. Accurate datat collection for KPIs
Amber
34 Stroke - CT Scan
Working with the Stroke teams evaluate if the 45 minute scan and image report time has been achieved: Data collection method developed and agreed
Tracey Broom/Stroke Steering Group Members
01/09/2013 30/09/2013 Data available for Audit Amber need to participaate in regular monitoring meetings
35 Stroke - CT Scan
Ensure All Consultant Radiologists and external provider ( who provide reports 11pm-7am) are aware of the need to provide a report within 30 minutes: Support any additional home viewing resources Audit turnaround from external provider monthly. Reflect to see if current on call models are supporting the meeting of this requirement and are sustainable.
Karen Griffiths/ Ajay Dabra/Joeseph Alex
01/08/2013 31/08/2013
external provider audit report. Local Radiologists able to cope with additional workload from Grimsby
Amber

Directorate of Clinical & Quality Assurance, November 2013 Page 46 of 54
STEP Pathway Group Action Plan Accountable for
delivery Start date End date How evidenced?
RAG Rating - achieved? Notes
36 Stroke - Vascular Ultrasound TIA
Referral Guidelines to be produced: Recommendation by HEY for access via Stroke Physicians, Neurology, Vascular and Ophthalmology only. To include clinical situations where by not appropriate to scan e.g. carotid bruit in an asymptomatic patient, VBI, syncope, diplopia, migraine etc
Head of Diagnostics & Governance/ Clinical Lead for Physiological Measurements
01/09/2013 30/09/2013
Referral guidelines accepted through Governance and circulated.
COMPLETE 01.08.13 Draft referral guidelines, protocol and reporting guidelines completed. To be circulated for comments.
37 Stroke - Vascular Ultrasound TIA
Dedicated Carotid Referral Form to be designed in paper and electronic format to ensure quality information: Tick box style referral to include TIA, AF and CVA as reasons for referral. Referral form needs to include symptoms to include which side of body affected or eye or dysphasia etc
Clinical Lead for Physiological Measurements
01/08/2013 31/08/2013 New paper and electronic form in situ.
COMPLETE
38 Stroke - Vascular Ultrasound TIA
Re-evaluate service opening hours for Carotid Scanning: HEY recommend Mon-Fri service 9-5 by sonographers & consider including Phys Meas staff in the rota. OOH scans – consider whether they could be done by cons Radiologists if unstable patient & if positive carotid i.e. >70% stenosis contact Hull surgeon on call. Hull generally does not operate on carotids at w/ends or out of hours , only occasionally for e.g. crescendo TIA’s as uses non vascular theatres & non vascular theatre staff etc.
Head of Ultrasound DPOW & Head of Ultrasound SGH
01/08/2013 31/08/2013 Minutes/email clarification of agreement
Amber
Stroke Steering Group received letter from HEY re service model for discussion with steering group, meeting to be established; meeting arranged for 25th November 2013.
39 Stroke - Vascular Ultrasound TIA
Identify the number of sonographers required to participate and be competent in carotid scanning: HEY recommend a maximum of 6 Sonographers would be required. 2 Phys Meas (cross site) 2DPOW Radiology, 2 SGH Radiology
Clinical Lead for Physiological Measurements
01/08/2013 31/08/2013 Discussion with Head of Ultrasound at DPOW and SGH
COMPLETE 01.08.13 Activity review complete. Confirms 6 sonographers required with 200 cases per year each to keep competency levels.
40 Stroke - Vascular Ultrasound TIA
Amendment to the Diagnostics Reporting Guidelines to be considered: HEY recommend that when a patient is found to have the criteria for intervention i.e >70% stenosis that immediate contact is made with them via the on-call Clinician. This will ensure the quickest route to successful treatment by contact with the on call Vascular surgeon
Clinical Lead for Physiological Measurements
01/08/2013 31/08/2013 Reporting Guidelines include criteria for urgent reports
COMPLETE
Directorate of Clinical & Quality Assurance, November 2013 Page 47 of 54
STEP Pathway Group Action Plan Accountable for
delivery Start date End date How evidenced?
RAG Rating - achieved? Notes
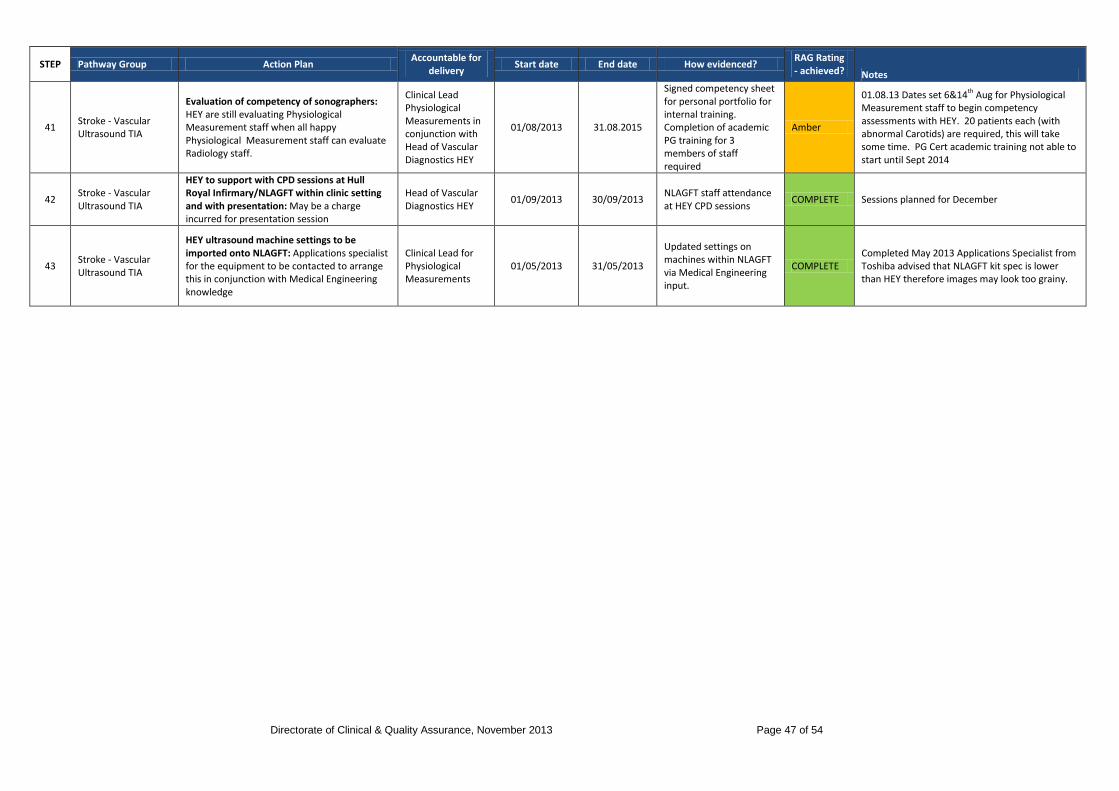
41 Stroke - Vascular Ultrasound TIA
Evaluation of competency of sonographers: HEY are still evaluating Physiological Measurement staff when all happy Physiological Measurement staff can evaluate Radiology staff.
Clinical Lead Physiological Measurements in conjunction with Head of Vascular Diagnostics HEY
01/08/2013 31.08.2015
Signed competency sheet for personal portfolio for internal training. Completion of academic PG training for 3 members of staff required
Amber
01.08.13 Dates set 6&14th Aug for Physiological Measurement staff to begin competency assessments with HEY. 20 patients each (with abnormal Carotids) are required, this will take some time. PG Cert academic training not able to start until Sept 2014
42 Stroke - Vascular Ultrasound TIA
HEY to support with CPD sessions at Hull Royal Infirmary/NLAGFT within clinic setting and with presentation: May be a charge incurred for presentation session
Head of Vascular Diagnostics HEY
01/09/2013 30/09/2013 NLAGFT staff attendance at HEY CPD sessions
COMPLETE Sessions planned for December
43 Stroke - Vascular Ultrasound TIA
HEY ultrasound machine settings to be imported onto NLAGFT: Applications specialist for the equipment to be contacted to arrange this in conjunction with Medical Engineering knowledge
Clinical Lead for Physiological Measurements
01/05/2013 31/05/2013
Updated settings on machines within NLAGFT via Medical Engineering input.
COMPLETE Completed May 2013 Applications Specialist from Toshiba advised that NLAGFT kit spec is lower than HEY therefore images may look too grainy.

Directorate of Clinical & Quality Assurance, November 2013 Page 48 of 54
4.0 Mortality Indicators
5.0 Clinical Coding Indicators
6.0 Update on Mortality Trigger Tool Work
7.0 Update on Pathway Specific Mortality Action Groups
This section…
8.0 NURSING STAFFING LEVELS
8.1 Safe Nursing Levels as Monitored by E-Roster (Health Roster)
8.2 Acuity and Dependency Score
9.0 Glossary

Directorate of Clinical & Quality Assurance, November 2013 Page 49 of 54
8.0 NURSING STAFFING LEVELS
8.1 Safe Nursing Levels As Monitored By E-Roster (Health Roster) The Trust has invested in Health Roster or as it is commonly referred to as e-rostering. This system and its roll out within the Trust has enabled nursing rosters to be centrally monitored and allows for operational matrons to access and quickly assure themselves that nursing rotas are safe. The system is also a useful tool for the Trust to determine if safe staffing principles are being adhered to. From the system it is possible for current and historical performance to be measured in terms of:
1. Shifts without charge cover, 2. Percentage of registered skill mix, 3. Percentage of rosters unfilled.
The indicators above are recognised as being numerical measures of nursing quality and offer an insight into the performance of the use of e-rostering which will directly affect the patient experience of care. The measure of shifts without charge cover has proven difficult to gain reliable information on. Many managers will prioritise covering shifts with appropriately experienced staff but will not always prioritise updating the e-rostering system. Work continues on this and this measure will be used and reported upon when it can be done with confidence. Over the past two years the e-rostering system has been embedded within the practice of producing nursing rosters for the Trust. Initially the focus was upon getting Managers to use the system. Over the past year since the restructure was completed the focus has moved to enabling the Operational Matrons to take their part in confirming and challenging what is put upon nursing rosters in order to ensure that the valuable nursing resource is deployed in a manner that optimises safety and efficiency at the same time. Their work continues as it constitutes a step change in nursing practice.
Nu
rsin
g S
taff
ing
Le
ve
ls
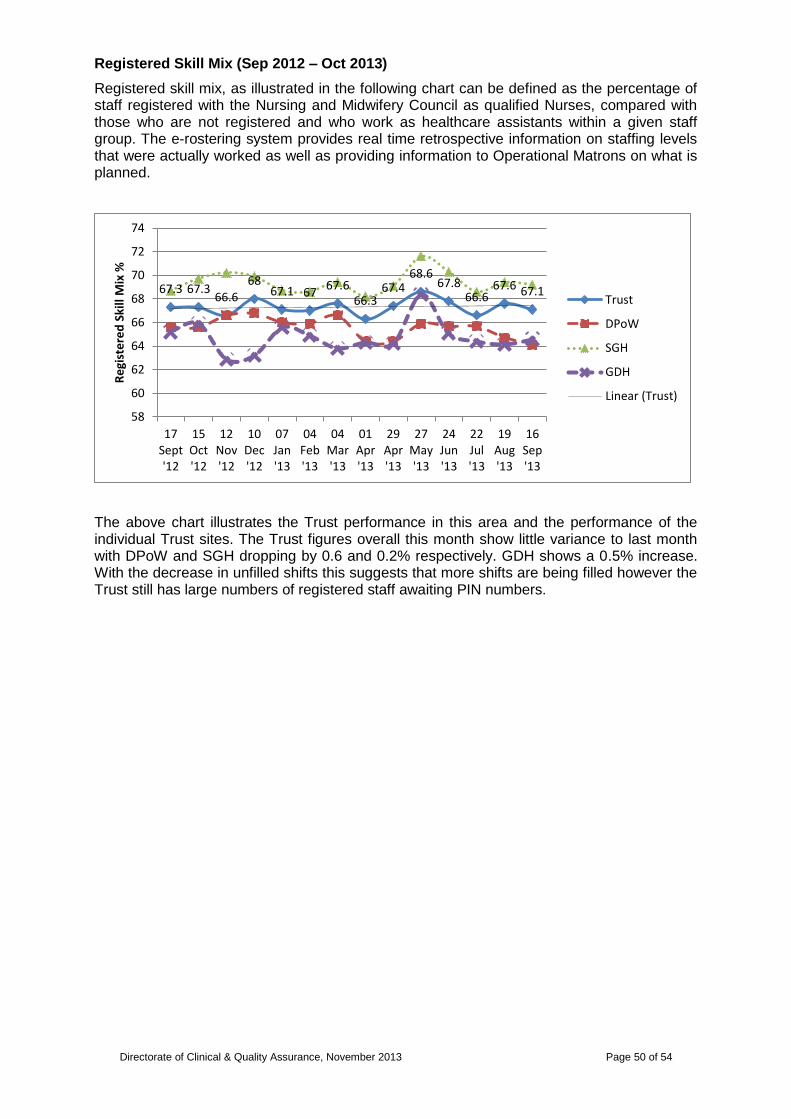
Directorate of Clinical & Quality Assurance, November 2013 Page 50 of 54
Registered Skill Mix (Sep 2012 – Oct 2013)
Registered skill mix, as illustrated in the following chart can be defined as the percentage of staff registered with the Nursing and Midwifery Council as qualified Nurses, compared with those who are not registered and who work as healthcare assistants within a given staff group. The e-rostering system provides real time retrospective information on staffing levels that were actually worked as well as providing information to Operational Matrons on what is planned.
The above chart illustrates the Trust performance in this area and the performance of the individual Trust sites. The Trust figures overall this month show little variance to last month with DPoW and SGH dropping by 0.6 and 0.2% respectively. GDH shows a 0.5% increase. With the decrease in unfilled shifts this suggests that more shifts are being filled however the Trust still has large numbers of registered staff awaiting PIN numbers.
67.3 67.3 66.6
68 67.1 67
67.6 66.3
67.4 68.6
67.8 66.6
67.6 67.1
58
60
62
64
66
68
70
72
74
17Sept'12
15Oct'12
12Nov'12
10Dec'12
07Jan'13
04Feb'13
04Mar'13
01Apr'13
29Apr'13
27May'13
24Jun'13
22Jul'13
19Aug'13
16Sep'13
Re
gist
ere
d S
kill
Mix
%
Trust
DPoW
SGH
GDH
Linear (Trust)

Directorate of Clinical & Quality Assurance, November 2013 Page 51 of 54
Rosters Unfilled (Sep 2012 – Oct 2013)
Rosters unfilled, as expressed in the following chart by the percentage of rosters unfilled, can be defined as the number of shifts that have been deemed necessary to provide effective care on a particular ward that have not been filled. The majority of ward areas have undergone a review process to identify the number of shifts that are required in order to provide safe and effective care. This figure can be influenced by staff shortages due to vacancies, maternity leave, annual leave and study time allocated to a particular roster. Operational Matrons review rosters before they are published to enable a conscious decision to be made to fill the gap with additional hours, bank or agency therefore ensuring that care is safe. Where rosters are fully established and the KPI‟s are adhered to headroom allowance within all budgets should enable none or very little of the roster to remain unfilled.
The above chart illustrates the Trust‟s overall performance against this measure and that of the individual Trust sites. Overall this month the Trust as a whole shows a further 1.7% decrease this month. Figures for DPoW and SGH show a reduction of 1.3% and 0.7% respectively this reflects the increase staff numbers available to these sites. As expected the figures for GDH show the largest reduction due to increased occupancy in the main medical ward there.
29.9
24.8
32.4
36.4
18.5 19.9 20.1 20.1 20.1
21.8
25.1 24 25.7
19.3
0
5
10
15
20
25
30
35
40
17Sept'12
15Oct'12
12Nov'12
10Dec'12
07Jan'13
04Feb'13
04Mar'13
01Apr'13
29Apr'13
27May'13
24Jun'13
22Jul'13
19Aug'13
16Sep'13
% o
f ro
ste
rs u
nfi
lled
Trust
DPoW
SGH
GDH
Linear (Trust)
Linear (GDH)
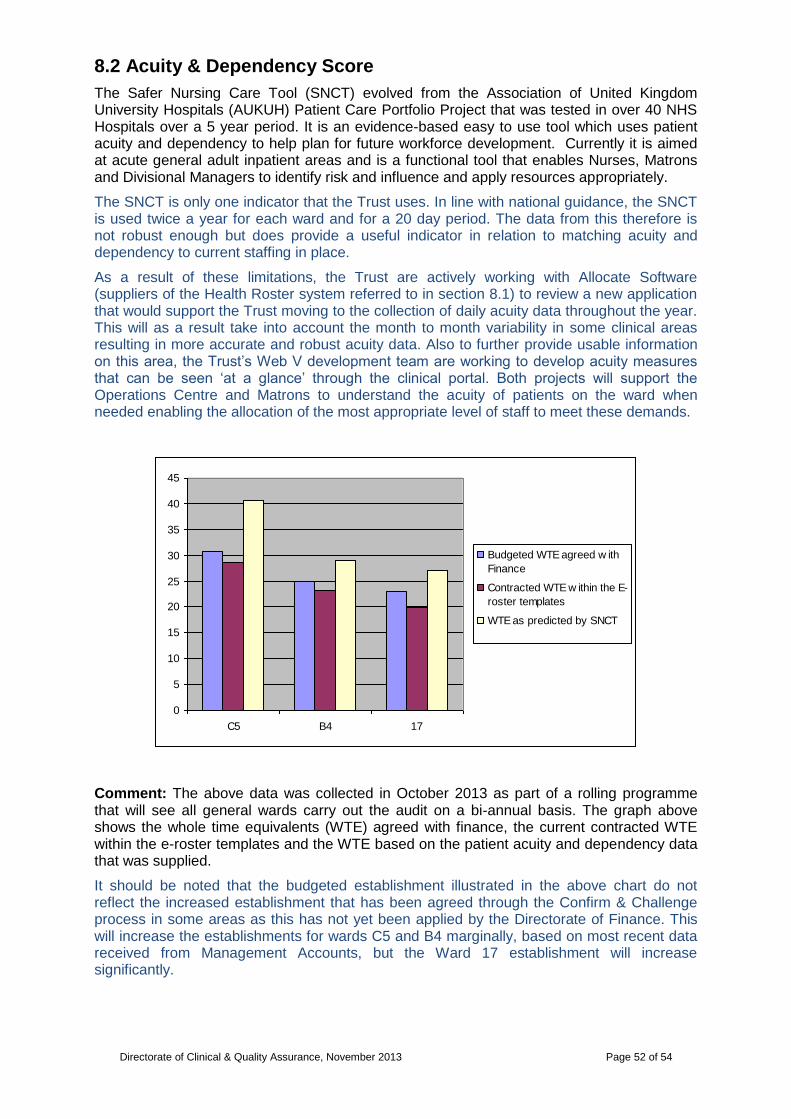
Directorate of Clinical & Quality Assurance, November 2013 Page 52 of 54
8.2 Acuity & Dependency Score
The Safer Nursing Care Tool (SNCT) evolved from the Association of United Kingdom University Hospitals (AUKUH) Patient Care Portfolio Project that was tested in over 40 NHS Hospitals over a 5 year period. It is an evidence-based easy to use tool which uses patient acuity and dependency to help plan for future workforce development. Currently it is aimed at acute general adult inpatient areas and is a functional tool that enables Nurses, Matrons and Divisional Managers to identify risk and influence and apply resources appropriately.
The SNCT is only one indicator that the Trust uses. In line with national guidance, the SNCT is used twice a year for each ward and for a 20 day period. The data from this therefore is not robust enough but does provide a useful indicator in relation to matching acuity and dependency to current staffing in place.
As a result of these limitations, the Trust are actively working with Allocate Software (suppliers of the Health Roster system referred to in section 8.1) to review a new application that would support the Trust moving to the collection of daily acuity data throughout the year. This will as a result take into account the month to month variability in some clinical areas resulting in more accurate and robust acuity data. Also to further provide usable information on this area, the Trust‟s Web V development team are working to develop acuity measures that can be seen „at a glance‟ through the clinical portal. Both projects will support the Operations Centre and Matrons to understand the acuity of patients on the ward when needed enabling the allocation of the most appropriate level of staff to meet these demands.
Comment: The above data was collected in October 2013 as part of a rolling programme that will see all general wards carry out the audit on a bi-annual basis. The graph above shows the whole time equivalents (WTE) agreed with finance, the current contracted WTE within the e-roster templates and the WTE based on the patient acuity and dependency data that was supplied.
It should be noted that the budgeted establishment illustrated in the above chart do not reflect the increased establishment that has been agreed through the Confirm & Challenge process in some areas as this has not yet been applied by the Directorate of Finance. This will increase the establishments for wards C5 and B4 marginally, based on most recent data received from Management Accounts, but the Ward 17 establishment will increase significantly.
0
5
10
15
20
25
30
35
40
45
C5 B4 17
Budgeted WTE agreed w ith
Finance
Contracted WTE w ithin the E-
roster templates
WTE as predicted by SNCT
Directorate of Clinical & Quality Assurance, November 2013 Page 53 of 54
From this information and from internal escalation processes, Ward C5 will be assessed for a further month using the SNCT tool to support the Operational Matrons work closely with the ward manager to cover any immediate staffing concerns that have been compounded by sickness absence.
Ward B4 is a surgical ward and so the acuity of patients on this ward is likely to fluctuate dependant on the nature of surgical procedures being undertaken and the number of medical outliers.
On Ward 17, an increased number of staff have been deployed on the evening and night shifts in response to the review of establishments. This may not yet be demonstrated in the above chart due to these not being permanently contracted posts to the ward.

Directorate of Clinical & Quality Assurance, November 2013 Page 54 of 54
9.0 Glossary Benchmark Peer Group: Calderdale and Huddersfield NHS Foundation Trust, Chesterfield & North Derbyshire Royal Hospital NHS Trust, Countess of Chester NHS Foundation Trust, County Durham and Darlington NHS Foundation Trust, Doncaster and Bassetlaw Hospitals NHS Trust, North Cumbria University Hospitals NHS Trust, North Tees & Hartlepool NHS Trust, Rotherham NHS Foundation Trust, Royal Bolton Hospital NHS Foundation Trust, The Pennine Acute Hospitals NHS Trust, University Hospitals of Morecambe Bay NHS Trust
Cardiac bundle: The new bundle is comprised of the following HRG4 subchapters:
Procedures: Catheter 19 years and over, Pace 1 - Single chamber or Implantable Diagnostic Device, Pace 2 - Dual Chamber, Percutaneous Coronary Intervention (0-2 Stents), Complex Echocardiogram (include Congenital Transoesophageal and Fetal Echocardiography), Simple Echocardiogram, Electrocardiogram Monitoring and stress testing, Percutaneous Coronary Intervention (0-2 stents) and Catheterisation, Minor Cardiac Procedures, Other Non-Complex Cardiac Surgery + Catheterisation, Pace 1 - Single chamber or Implantable Diagnostic Device and other (Catheterisation; EP; Ablation; Percutaneous Coronary Intervention), Congenital Interventions: Other including Septostomy Embolisations Non-coronary Stents and Energy Moderated Perforation, Pacemaker Procedure without Generator Implant (includes resiting and removal of cardiac pacemaker system), Percutaneous Coronary Interventions with 3 or more Stents, Implantation of Cardioverter - Defibrillator only, Percutaneous Coronary Interventions with 3 or more Stents and Catheterisation, and Intermediate Congenital Surgery.
Cardiac Disorders: Non interventional acquired cardiac conditions 19 years and over, Arrhythmia or Conduction Disorders without CC, Syncope or Collapse without CC, Actual or Suspected Myocardial Infarction, Heart Failure or Shock without CC, Deep Vein Thrombosis, Syncope or Collapse with CC, Heart Failure or Shock with CC, Hypertension without CC, Arrhythmia or Conduction Disorders with CC, Cardiac Valve Disorders, Hypertension with CC, Endocarditis, Cardiac Arrest, and Non-Interventional Congenital Cardiac Conditions.
Common Cause Variation: an inherent part of the process, stable and “in control”. We can make predictions about the future behaviour of the process within limits. When a system is stable, displaying only common cause variation, only a change in the system will have an impact.
Control Limits: indicate the range of plausible variation within a process. They provide an additional tool for detecting special cause variation. A stable process will operate within the range set by the upper and lower control limits which are determined mathematically (3 standard deviations above and below the mean). The upper control limit is displayed in blue throughout this report. The lower control limit is displayed in teal throughout this report.
Crude Mortality Rate: The crude mortality rate is based on actual numbers. Unlike the HSMR which features adjustment based on population demographics and related mortality expectations.
The local benchmarking rate for crude mortality is adjusted quarterly. The latest adjustment reflects January 2010 data.
Hospital Standardised Mortality Rate (HSMR): The HSMR is a method of comparing mortality levels in different years, or between different hospitals. The ratio is of observed to expected deaths, multiplied conventionally by 100. Thus, if mortality levels are higher in the population being studied than would be expected, the HSMR will be greater than 100. This methodology allows comparison between outcomes achieved in different trusts, and facilitates benchmarking.
Mortality by Diagnosis Group: These comparisons can be and are made for a large number of conditions and operations. The three chosen are common conditions affecting many people.
Some people with acute myocardial infarction (heart attack), fractured neck of femur (broken hip) and stroke die before they can be admitted to hospital. However, there are variations in hospital death rates among those who survive long enough to be admitted.
Some of these deaths may be potentially preventable through faster ambulance response times and effective early treatments, so these figures may be considered as indicative of the overall outcome of care in the Trust.
Moving Annual Total (MAT): The most recent months performance with the previous 11 months included thus providing an annual average. This is an effective way of presenting monthly performance data in a way that reduces some of the expected variation in the system i.e. seasonal factors providing a much smoother view of performance allowing trends to be more easily discerned.
Risk Adjusted Mortality Indicator (RAMI): This is a risk adjusted standardised mortality ratio used by CHKS software which has been purchased by the Trust to monitor and analyse it‟s data.
Summary Hospital-Level Mortality Indicator (SHMI): The most recently developed mortality ratio designed to be used to allow comparison between NHS organisations.
Sigma: A sigma value is a description of how far a sample or point of data is away from its mean, expressed in standard deviations usually with the Greek letter σ or lower case s. A data point with a higher sigma value will have a higher standard deviation, meaning it is further away from the mean.
Special Cause Variation: the pattern of variation is due to irregular or unnatural causes. Unexpected or unplanned events (such as extreme weather recently experienced) can result in special cause variation. Systems which display special cause variation are said to be unstable and unpredictable. When systems display special cause variation, the process needs sorting out to stabilise it. This report includes two types of special cause variation, trends and outliers. If a trend, the process has changed in someway and we need to understand and adopt if the change is beneficial or act if the change is a deterioration. The outlier is a one-off condition which should not result in a process change. These must be understood and dealt with on their own (i.e. response to a major incident).
Standard Deviation: Standard deviation is a widely used measurement of variability or diversity used in statistics and probability theory. It shows how much variation or "dispersion" there is from the "average" (mean, or expected/budgeted value). A low standard deviation indicates that the data points tend to be very close to the mean, whereas high standard deviation indicates that the data are spread out over a large range of values.
Glo
ss
ary