colby drechsel may 8, 2008
TRANSCRIPT

Colby DrechselMay 8, 2008

WPAExpansion issuesProposed projectsClimate change – impact to Natural GasOpportunities

Board of Directors appointed by GovernorMission (i) to promote the infrastructure necessary to produce oil and gas assets of the state and (ii) to promote access to high value marketsIf it can move in a pipeline, its within our charter Not a regulatory, enforcement, rate making or policy setting body
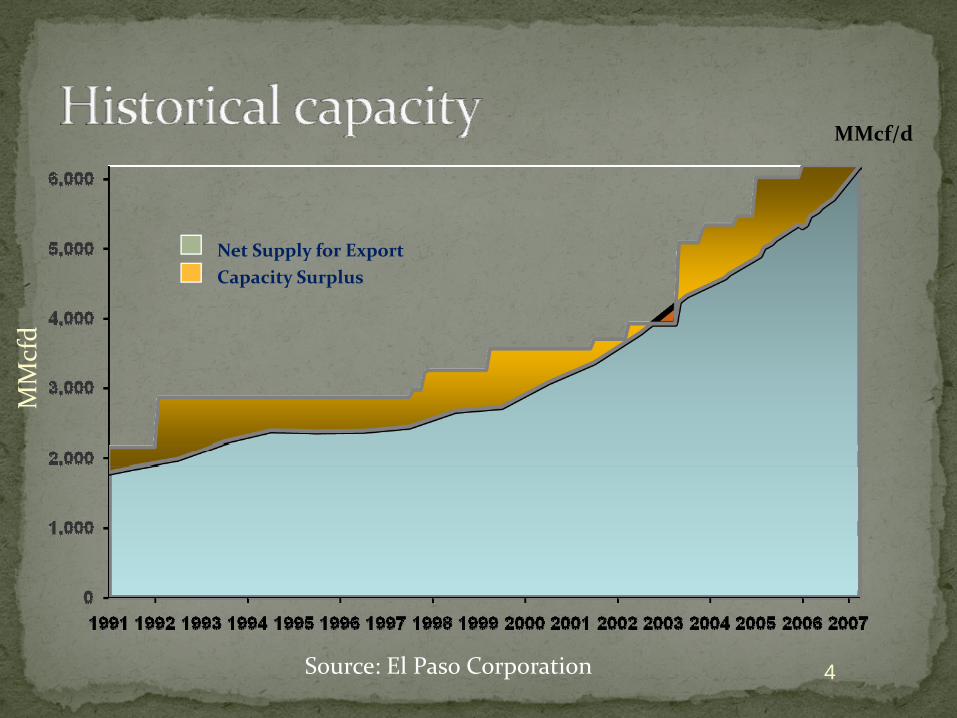
MMcf/d
4
Net Supply for ExportCapacity Surplus
MMcfd
Source: El Paso Corporation

5

2002 – Probable ReservesRocky Mtn Region – 55 TcfWyoming – 20 Tcf
2006 –Rocky Mtn Region – 75.6 TcfWyoming – 25 Tcf


Rockies Express Pipeline‐In‐service
Rockies Express Pipeline‐REX East
Lease of Overthrust Pipeline Capacity
Natural Gas Pipeline Company of America
Kinder Morgan Interstate Gas Transmission
TransColorado Gas Transmission
Trailblazer Pipeline
REX Compressor Station
REX East Compressor Station
Hub
Opal
Kanda Wamsutter
GreasewoodMeeker
Blanco
CheyenneLebanon
Clarington
OVER-THRUST
CAPACITYLEASE
R O C K I E S E X P R E S S P I P E L I N E
REX EASTREXIN-SERVICE
1,800,000 Dth/d - 7/20091,500,000 Dth/d - 2/2008 1,600,000 Dth/d - 1/2009
PIPELINE – 1,679 MILES COMPRESSION – 460,000 Hp


10
Forecast by 2016:
High Case 13,278 Mid Case 11,860Low Case 10,442
3.3 Bcf/d ofgrowth 2006‐2016
MM
cfd
Source: El Paso Corporation

Pipeline/producer conundrum – who writes the check?Public lack of accurate information/researchGrowing opposition to access and development
Wind River Range, Bridger Teton National ForestAir Quality issues, Jonah/PinedaleAnimal habitat
Winter range, ONEOKSage grouse, Powder River Basin

Pipelines not built on speculationLong term commitments to pay for capacity requiredSometimes market pull, sometimes supply pushMulti‐year lead time to design constructPlanning costs are growing
12

We’re creating our own constraint problem by allowing more drilling in the Rockies . . . Exporting gas to Canada . . . This is not your father’s boom


February 28, 2008, Casper Star TribuneApril 3, 2008, Pinedale Roundup

Federal legislation ‐S. 2879, designed to slow down production on the Roan Plateau, COS. 2229, withdraw federal land from the Wyoming Range, retire ‘select’ leasesNEPA paralysis for the BTNF

9 Tcf recoverable natural gasEst. 4 million homes for 20 years

918 Bcf39 MMBO57.3 MMB NGL
Source: USGS, February 2004
Undiscovered potential


32%
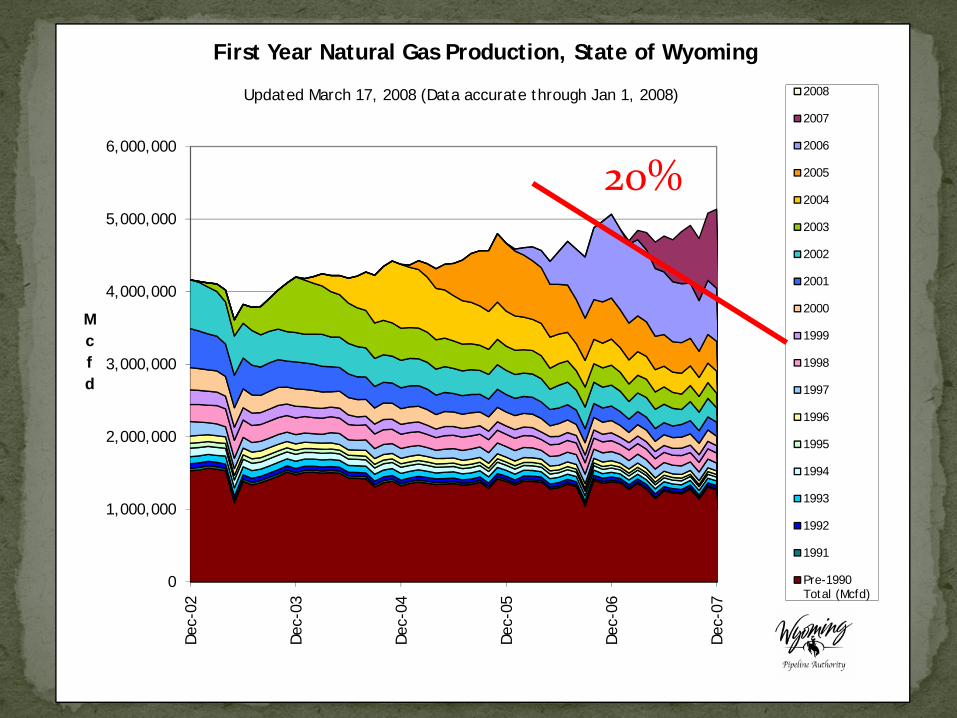
0
1,000,000
2,000,000
3,000,000
4,000,000
5,000,000
6,000,000
Dec
-02
Dec
-03
Dec
-04
Dec
-05
Dec
-06
Dec
-07
Mcfd
First Year Natural Gas Production, State of Wyoming
2008
2007
2006
2005
2004
2003
2002
2001
2000
1999
1998
1997
1996
1995
1994
1993
1992
1991
Pre-1990 Total (Mcfd)
Updated March 17, 2008 (Data accurate through Jan 1, 2008)
20%


Committed capacityCredit support, constitutional amendmentIncentive programMatch maker and marketer

To Oregon . . .
Kern River, ex, 0.145Spectra, Bronco, 1.000El Paso, Ruby, 1.200Williams/TransCanada, Sunstone, 1.200
KM, REX/Chicago, s iAlliance/Questar, Rockies Alliance, s iNorthern Border, Bison, 0.400TransCanada, Pathfinder, 1.200
Chicago and beyond . . .
In total, 5+

The obvious driver: lbs per billion Btu inputEmission Natural Gas Oil Coal
CO2 117,000 164,000 208,000
CO 40 33 208
NO2 92 448 457
SO2 1 1122 2591
Particulates 7 84 2744
Hg 0.000 0.007 0.016
Source: EIA

Enhanced oil recoveryWind powerDefining a regulatory frameworkMore options for coal

Source: WyEORI

‐
20,000.00
40,000.00
60,000.00
80,000.00
100,000.00
120,000.00
140,000.00
0 1 2 3 4 5 6 7 8
Energy Pot
ential (M
W)
Wind Class #
Wind Potential for Wyoming (MW)
NW
SW
N Central
NE
Central, SE
Class, 14‐20 mphWind Generating utilization, 33‐54%450 MW = 0.036 Bcfd /day22,000 MW or 1.8 Bcfdconsumption
Source: WinDS 2006 study and Wyoming Infrastructure Authority

Wind: 700 MWGas: 1,400 MW
Wind: 1,500 MW
Wind: 11,000 MWCoal: 110 MW
Wind:8,000MW
Coal: 750 MW
Wind: 700 MWGas: 500 MW
Identification of Generation Development Projects in Wyoming(note that all MW’s are currently undedicated)

Wyoming HB 90 Carbon Storage and SequestrationEstablishes a permit program for CCSDefines regulatory authorities
Wyoming HB 89 Pore Space OwnershipBelongs to the surface ownerCan be severed from the surface owner and sold separately
Voluntary participation in the Climate Registry – www.theclimateregistry.org

Bonding procedure and financial assurance for sequestration projectsReal physical storage when the wind isn’t blowingImprovements in technology – rigs and waterwww.212resources.com or http://emitwater.com/Drilling rig emissions, Tier IV and beyond (currently tested in Pinedale)

$0
$10
$20
$30
$40
$50
$60
0
2,000
4,000
6,000
8,000
10,000
12,000
1997 1998 1999 2000 2001 2002 2003 2004 2005 2006 2007
US$
Bill
ions
Mill
ions
of M
MB
tue
Year
Production and Price Comparison of Wyoming Coal, Coal Gasified into Methane1 after 1997, and Natural Gas
Energy EquivalentsCoal (Million MMBtue)
Methane (Million MMBtue)
Methane Value (US$Billions)
Coal Value (US$Billions)
Coal Value in terms of methane price (US$Billions)$ Derivatives from

Colby Drechsel
www.wyopipeline.com