colin fox, ccim from dirt to disposition transaction power tools
TRANSCRIPT

Colin Fox, CCIM
www.colinfox.com
From Dirt to Disposition Transaction Power Tools
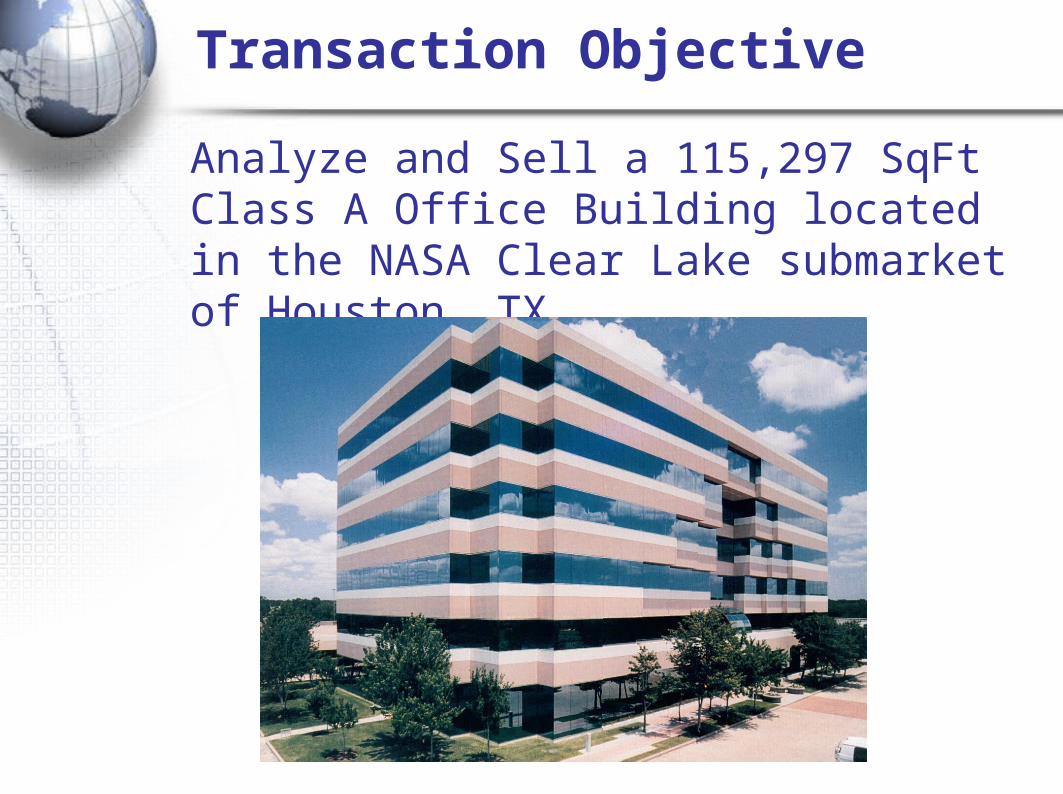
Transaction Objective
Analyze and Sell a 115,297 SqFt Class A Office Building located in the NASA Clear Lake submarket of Houston, TX
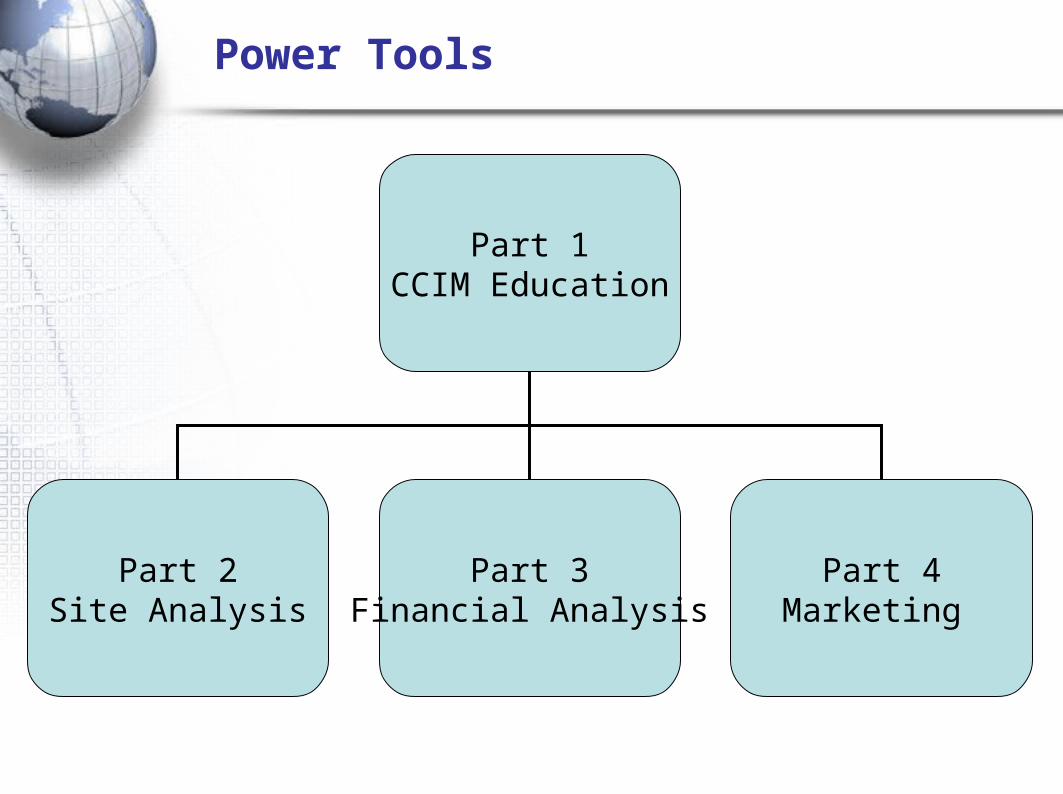
Power Tools
Part 1CCIM Education
Part 2Site Analysis
Part 3Financial Analysis
Part 4Marketing

•The CCIM Professional
Part 1 – CCIM Education
CCIM Designation -
A Certified Commercial Investment Member (CCIM) is a recognized expert in the disciplines of commercial and investment real estate.
The CCIM Institute is an affiliate of NAR, the largest trade association in the world.

•The CCIM Professional
Part 1 - CCIM Education
The CCIM Professional
“Until I went through CCIM training, I didn’t know what I didn’t know.”

Investment Real Estate Education
• Introduction to Commercial Investment Real state Analysis
• Financial Analysis 101
• Market Analysis 102
• User Decision Analysis 103
• Investment Analysis 104

Global Influence of CCIM Education
• Over 180 Course Offerings Annually
• Primary and Secondary Markets
• 7,000 Students
• 30 Countries
• Three Continents
• 20% of New Designees are International

The Fortunate 1000

The Making of a CCIM
• 200 Classroom Hours
• Portfolio of Transactions $$$$
• Elective Credits
• 8-hour Comprehensive Exam

CCIM – The Green Factor
CCIM members conduct more than
$400 billion
in transactions
annually.

Broker
Property Manager
Asset Manager
Corporate Real Estate
Developer/Investor
Appraiser
Other
CCIM Profile
$400 Billion
annually

Knowledge is Power – Francis Bacon
• Updated Course Material• Publications and Articles• Specialty Chat Rooms • Financing Rate Sheets and Resourses• Google like Search Engine
Coming Soon -
Knowledge Management System


Part 2 – Site Analysis
The real estate industry has always known geography matters—after all, real estate practitioners coined the phrase "location, location, location."
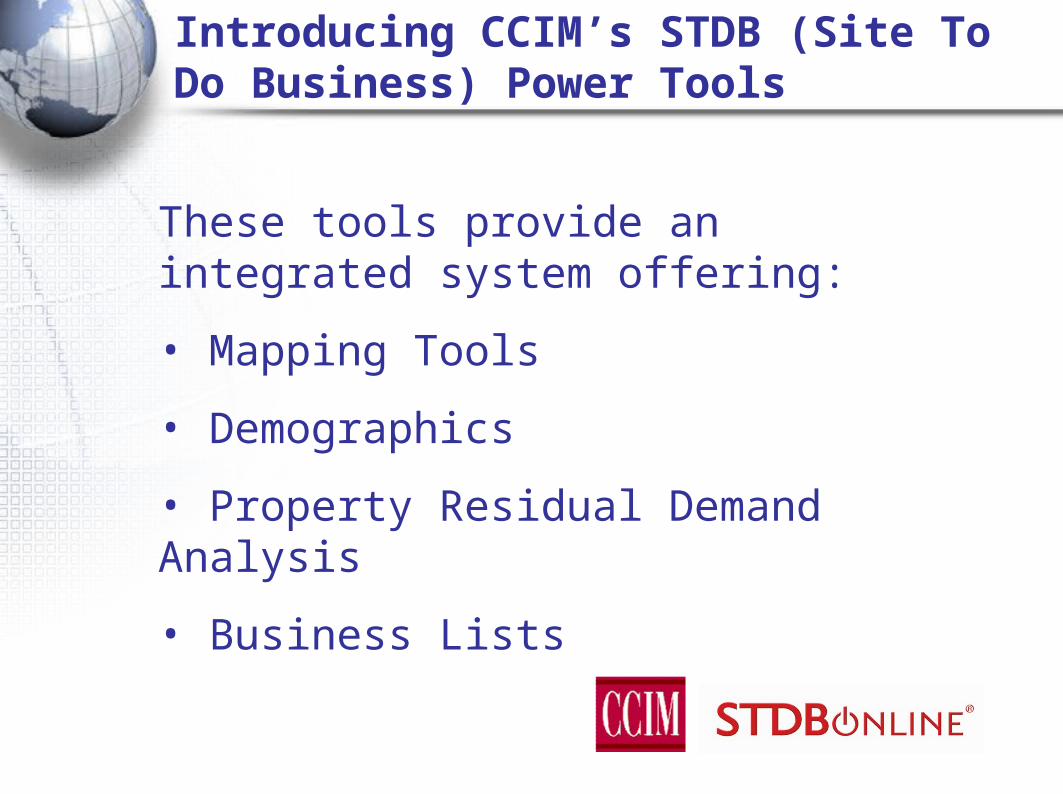
These tools provide an integrated system offering:
• Mapping Tools
• Demographics
• Property Residual Demand Analysis
• Business Lists
Introducing CCIM’s STDB (Site To Do Business) Power Tools
Mapping Tools – The Power of GIS
A Geographic Information System (GIS) is a set of computerized tools (including both hardware and software) for collecting, storing, retrieving, transforming, and displaying spatial data.
GIS is essentially a marriage between computerized mapping and database management systems.
Better Business Decisions
GIS intelligence systems bring marketing analysis tools and demographic data products together to offer powerful ways to compete in today's business strategies.
GIS provides essential marketing and customer intelligence solutions that lead to better business decisions.
Understanding the Data with GIS
One of the most important methods of evaluating the present and future value of real estate requires analyzing underlying population and economic factors.
To help clients easily visualize demographic and economic data, we can now use a GIS format that provides demographic thematically colored maps that may include additional information such as retail consumer spending and traffic counts.
Site specific areas can be studied using circles, polygons or drive-times.
Simply stated:
Think of GIS as a powerful presentation tool. A GIS creates high quality maps that communicate considerable amounts of information in an efficient and attention-getting manner.
"A picture is worth a thousand words."
Getting the Picture with GIS

Aerial Photographs provided byGoogle (Orthorectified & Geocoded)

High Impact Value of GIS
Example of the high impact value of GIS involving a landfill environmental problem using ESRI ArcScene and ArcGIS 3D Analyst
Please pause for the video to start

CCIMNet – Property Flyover
Please pause for video to start

Development Planning with GIS
Interactive solution for office and retail selection

Demographics
These tools allow an analyst to easily:
• Compare market areas• Analyze competition • Provide sophisticated exhibits for use in
appraisal and consulting assignments.

Where does the data come from?
• Applied Geographic Solutions provides the majority of data from the 2000 Census and retains a core variable set from the 1990, 1980 and 1970 Census.
Getting Started – Selecting Geography
The next several slides depict screen shots from the STDB.
The selecting of geography is the first step in obtaining demographics.

STDB Web Site

Types of Geographies – MSAs

Types of Geographies – States

Types of Geographies – Counties/Boroughs
Juneau, Alaska

Types of Geographies – US Cities
Woonsocket, RI

Types of Geographies – Zip Codes
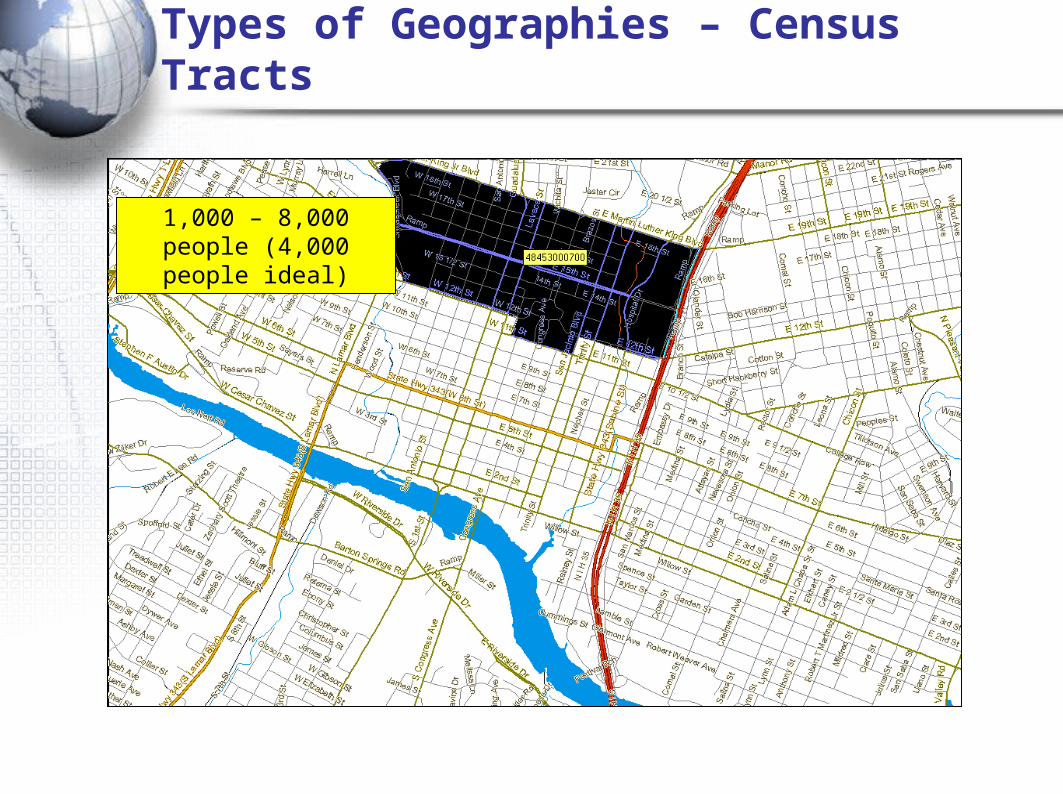
Types of Geographies – Census Tracts
1,000 – 8,000 people (4,000 people ideal)

Types of Geographies – Block Groups
300 – 3,000 people (1,500 people ideal)

Types of Geographies – Radii
Data from 0 to 1 mile from center
Data from 1-3 miles around center
Data from 0 to 5 miles from
center
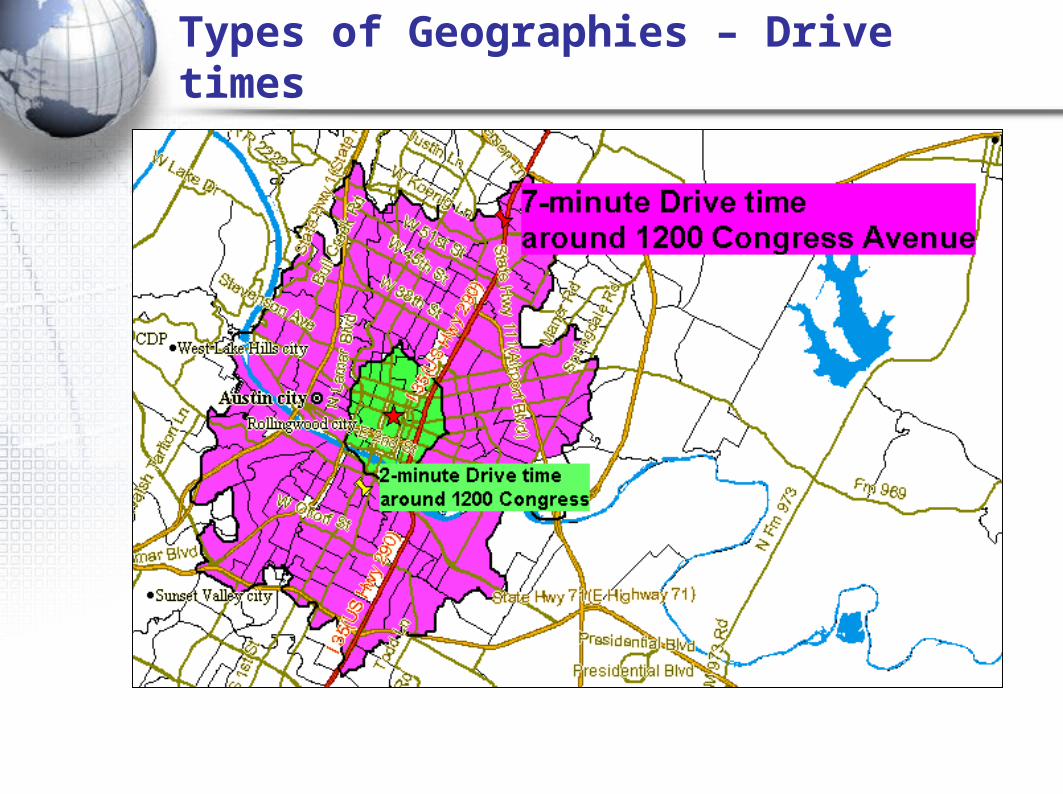
Types of Geographies – Drive times

Types of Geographies – Polygons
Demographics Reports
• Comprehensive Demographics (±9500 variables)
• Numerous Geographical Areas
• Summary, Comparison, and Ranking Reports (Customizable)

Demographic Express Packages
To make life easier STDB has created site analysis express package templates for the following property types:
• Office• Industrial• Multi-Family• Senior Housing / Single Family• Self-Storage• Retail• Hotel / Motel
Note: Templates are customizable
Office Express Package
This package contains 13 reports, including 7 maps:
• Executive Demographic• Business Summary• Demographic Snapshot • Household Detail • Income• Population & Education• MOSAIC Summary with Chart
Maps Reports:• 2004 Employee Density Map• 2004 Median Household Income Map• 2004 Owner Occupied Units Map• 2004 Population Density Map• 2009 Average Household Income Map• 2009 Population Density Map

Office Express Package
Executive Demographic Report
The current year population in this selected geography is 135,349. The 2000 Census revealed a population of 123,659, and in 1990 it was 88,807 representing a 39.24% change. It is estimated that the population in this area will be 149,251 in 2009, representing a change of 10.27% from 2004.
The current population is 50.46% male and 49.54% female. In 2004, the median age of the population in this area was 35.4, compared to the MSA_3360 median age which was 32.8. The population density in your area is 1,723.3 people per square mile.

Office Express Package
Business Summary Report

Office Express Package
Population and Education Report

Office Express Package
MOSAIC Summary with Chart

Sample Maps – 2004 Employee Density

Sample Maps – Avg Household Networth

Office Residual Demand Analysis
• Look at supply side information from local office market. • Determine demand.• Examine interaction between supply and demand.• Project what net over or under supply will be five years from now.
Note: Residual Demand Reports also available for:
• Multi-family • Retail• Industrial• Subdivision (Coming Soon)• Single Family (Coming Soon)
Supply Factors Data Source
Data based on 1st Quarter 2005 market survey by Colliers International and could vary if another source was used such as CoStar, Cushman and Wakefield, CBRE or Property & Portfolio Research.

Supply Factors Data Source
Sample of Property & Portfolio Research Report

Supply Factors Report
Net office space leased in Houston

Supply Factors Report
Vacancy factor for submarket

Supply Factors Report
Vacancy factor for submarket by Class

Demand Analysis
Population Households Housing
Income Buying Power Retail SF
Jobs % Use Office Office SF
Jobs % Use Industrial Industrial SF
What Creates Demand?

Office Residual Demand Template
The Site to Do Business has built-in templates so that the *pertinent demographic information on the demand side self-populates. Saves time and input errors.
*Pertinent information relates to jobs and is included in the Business Summary Report.

Office Residual Demand Report Input Screen

Office Residual Demand Report
Current Year + 5 Years
Total Employment 2,104,916 2,345,494Percent Occupying Office Space 34% 34%Total Employed in Office Space 715,671 797,468Average Square Feet per Employee 245 245Total Office Demand in Square Feet 175,339,503 195,379,650Estimated Percent Capture NASA/ Clear Lake 3.13% 3.13%Total Demand in Square Feet From Employees in NASA/ Clear Lake Area 5,488,126 6,115,383Estimated Percentage Demand for Class A Buildings 17.4% 17.4%Estimated Total Demand for Class A Building in NASA/ Clear Lake Area 954,934 1,064,077Frictional Vacancy 5% 5%Total Demand by Building Type 1,005,194 1,120,081Current Competitive Square Feet 1,081,000 1,081,000Estimated New Construction 0 0Supply to be Removed (Demolition) 0 0Net (Excess) Shortage (75,806) 39,081
Office Residual Demand Analysis
Current year data is for the year 2004, 5 year projected data is for the year 2009.
Demographic data © 2004 by Experian/Applied Geographic Solutions.

Office Residual Demand Report
Conclusion:
Residual demand analysis shows currently an oversupply in the market equal to about a 7% vacancy rate.
Projection over next 5 years: as long as no new supply is brought into area market there will be about a 39,000 square foot shortage.
Occupancies will be high and rents will be increasing.
This data serves as the basis of the financial analysis.

Business List – Grocery Store

Map Showing Grocery Stores
Des Moines, Iowa

Part 3- Financial Analysis
ARGUS
Build Fortunes, Not Spreadsheets

Consistency. Transparency. Efficiency
ARGUS will increase productivity within your organization by providing consistent standards for the critical processes that drive real estate transactions.
With that consistency, you will achieve the asset and market transparency necessary to be competitive in today’s real estate industry, which ultimately provides more efficient access to investors and lenders worldwide.

ARGUS
• Quickly and accurately analyze commercial real estate assets and transactions • Understand market realities and risks
• Develop leasing strategies, business and marketing plans
• Forecast property and portfolio cash flows
• Calculate investment values and returns • Share asset and transactional data with clients, partners and colleagues
• Navigate complex international deal structures
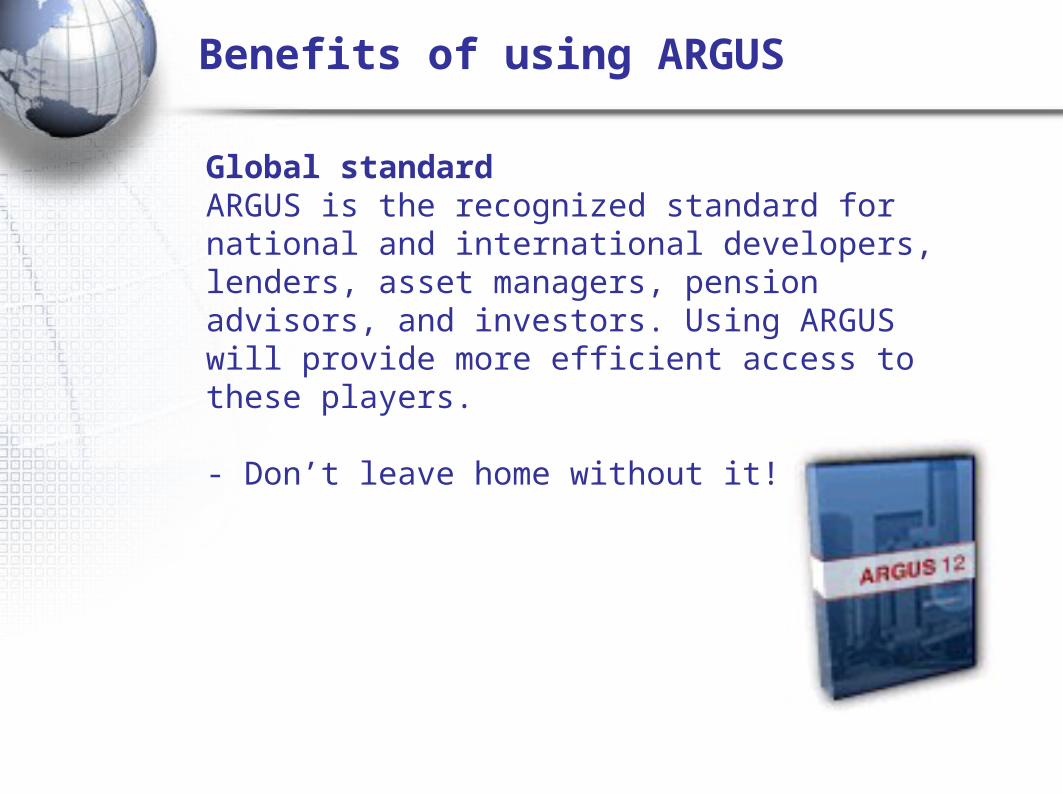
Benefits of using ARGUS
Global standardARGUS is the recognized standard for national and international developers, lenders, asset managers, pension advisors, and investors. Using ARGUS will provide more efficient access to these players.
- Don’t leave home without it!

Benefits of using ARGUS
Understandable and audit worthyARGUS documents your assumptions and supports your financial conclusions with its standard reporting of all input data, property and portfolio level summary reports and detailed tenant by tenant supporting schedules.
• ARGUS is the only financial analysis program that is called valuation software and is the number 1 choice for appraisers

Dashboard – key Performance Indicators

Property Summary

Rent Roll
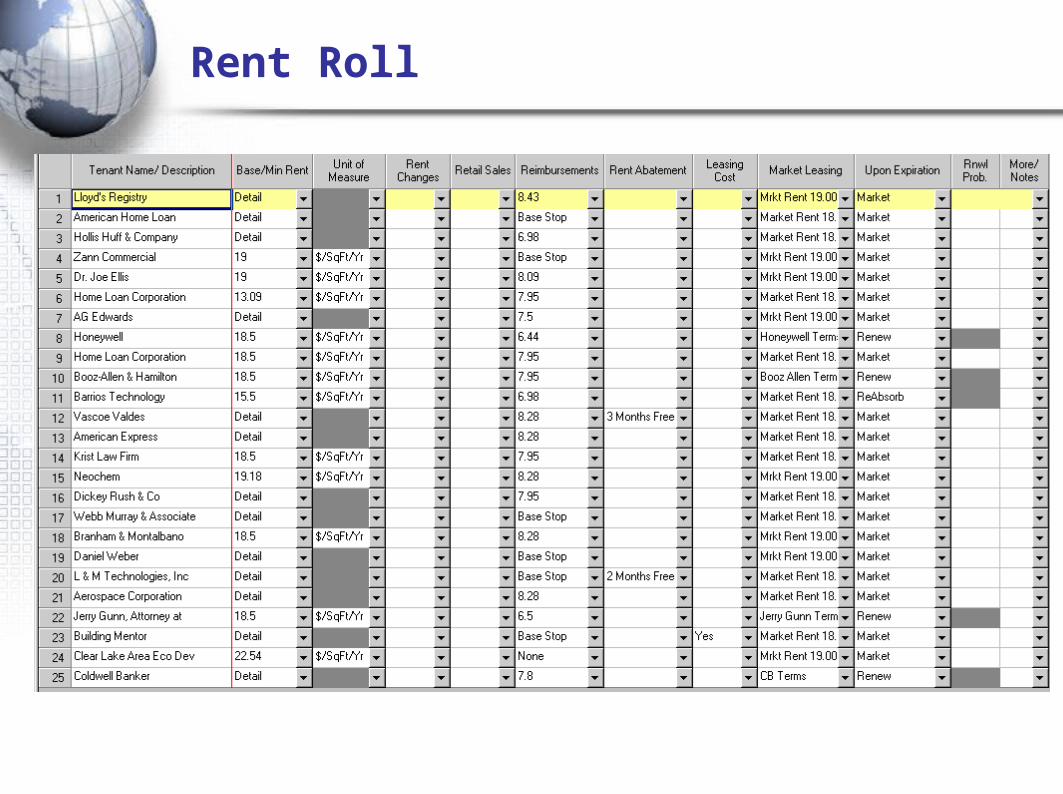
Rent Roll
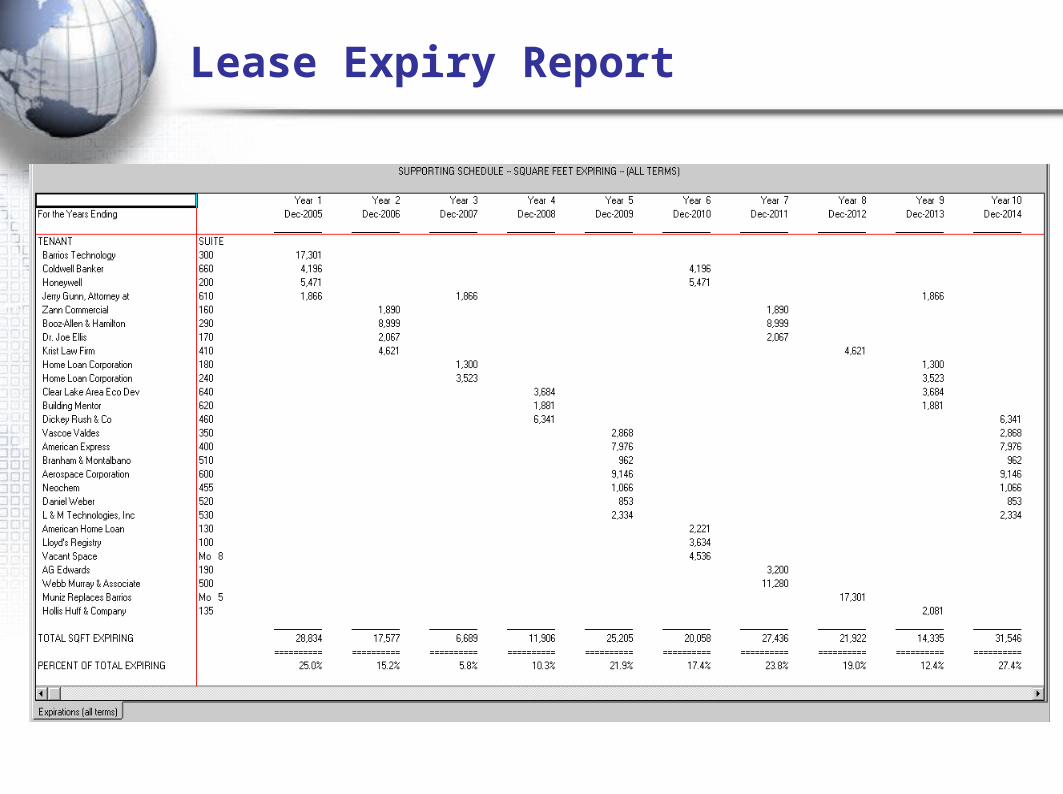
Lease Expiry Report

Market Leasing Assumptions

Presentation Rent Roll

Individual Loan & Debt Summary

Schedule of Cash Flow

Schedule of Cash Flow (Continued)

Part 4 – Marketing
Online Marketing Packages that include:• More than 200 fields of information, tailored to each property type
• Multiple photos with captions
• Audio/video files, 360-degree tours and flyover movies
• Site maps, blueprints, floor plans, site plans, plat maps, topo maps and aerials
• Password-protected documents
• Suite availability and tenant profiles
• Geo-coded street maps

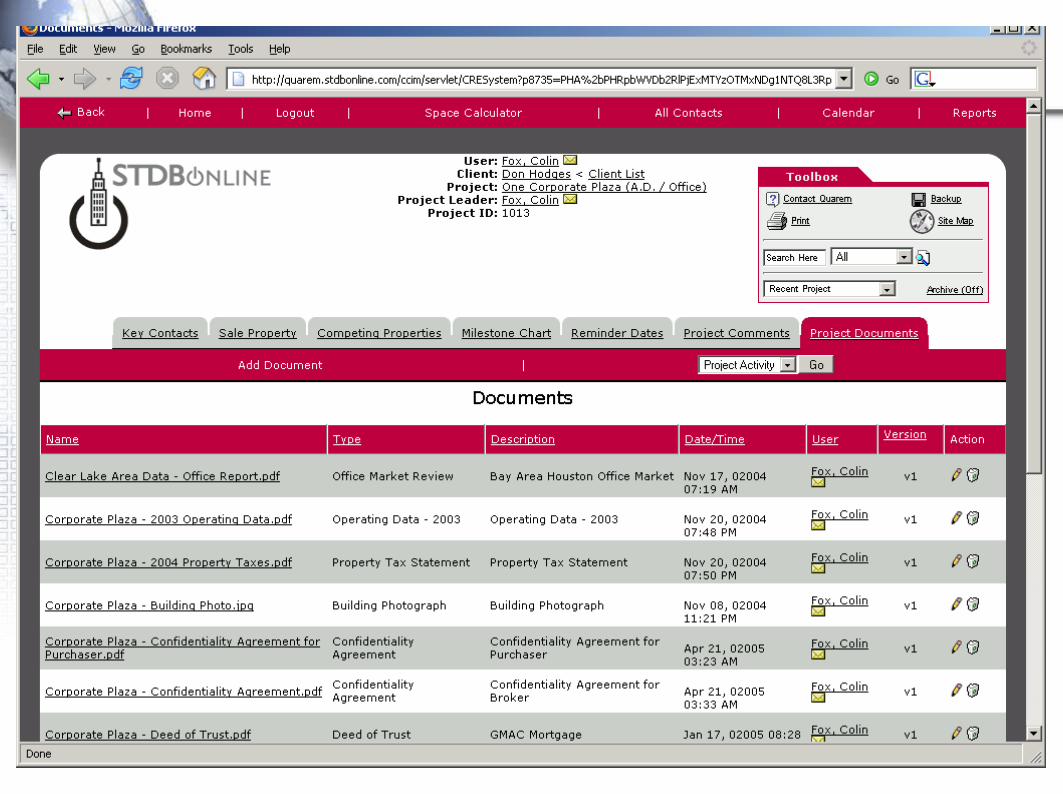
CCIMNet
One Click. Maximum Exposure. Enter your property listings one time and market them on multiple Web sites:
• CCIMNet
• More than fifty CCIM Chapter Web sites
• Local Commercial Information Exchanges (CIEs)
• Your Web site (SiteLink)

CCIMNet
Fastest CIE Solution in the Country

The Cityfeet Network
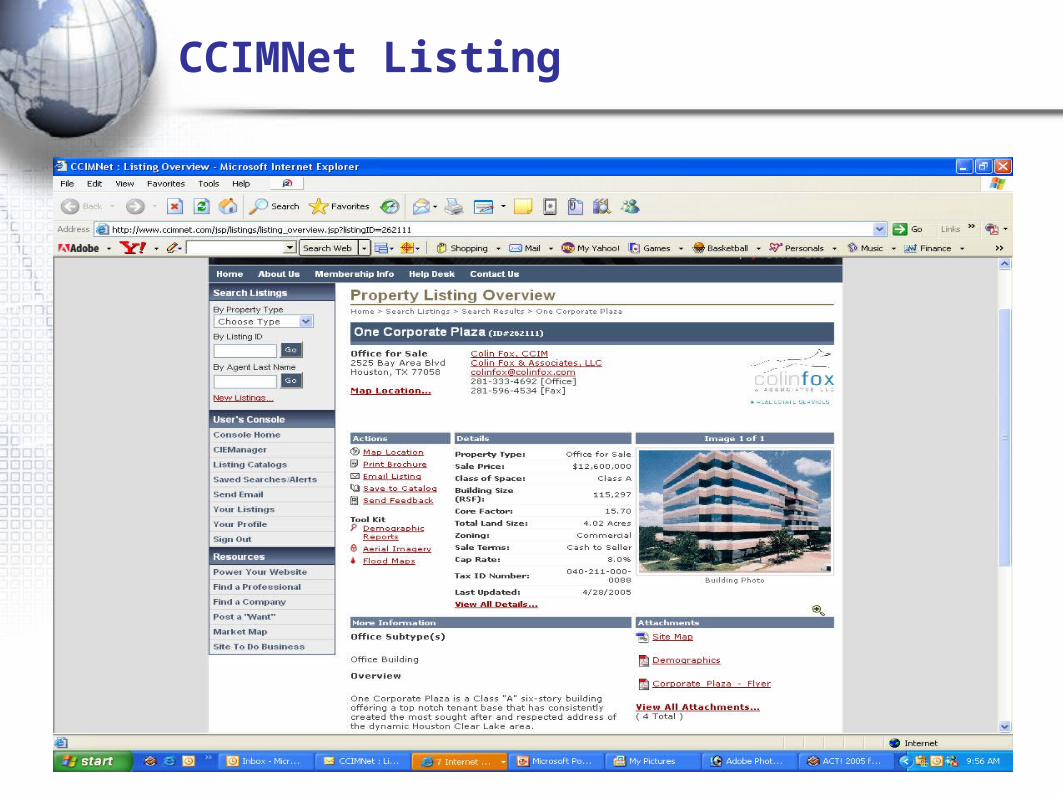
CCIMNet Listing

CCIMNet (SiteLink)

Transaction Management System
Provides a totally integrated solution for all parties involved in the real estate transaction to collaborate and coordinate, not only with each other, but most importantly, with your client.
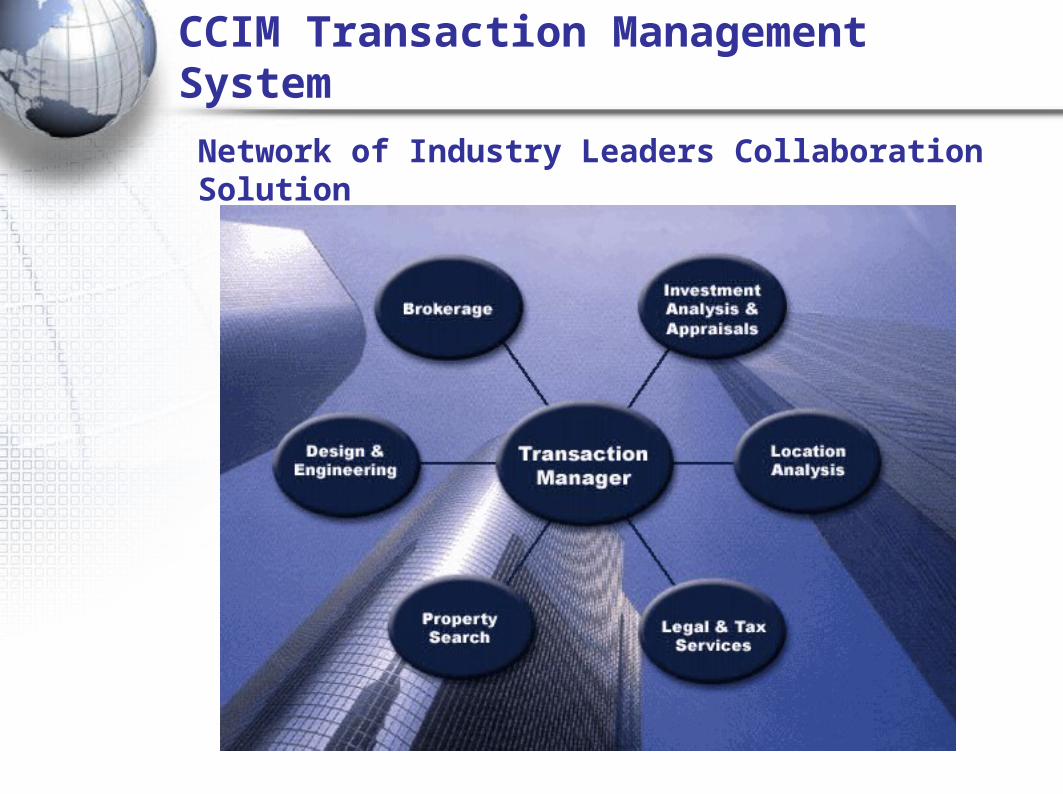
CCIM Transaction Management System
Network of Industry Leaders Collaboration Solution


Conclusion
“As this momentum continues, the localities, currencies, and time constraints of buyers and sellers will continue to diversify and even the most old fashioned commercial real estate professional will have to lie down at the altar of technology.”
Colin Fox, CCIM