collection and analysis of rate data dr. akm shafiqul islam
TRANSCRIPT
Collection and Analysis of Collection and Analysis of Rate DataRate Data
Dr. AKM Shafiqul IslamDr. AKM Shafiqul Islam
Types of Chemical Types of Chemical ReactionsReactions
Two types of reaction for rate dataTwo types of reaction for rate data The Batch reactor, which is used The Batch reactor, which is used
primarily for homogenous reactionprimarily for homogenous reaction The Differential reactor, which is used The Differential reactor, which is used
for solid-fluid heterogeneous reactionsfor solid-fluid heterogeneous reactions
Batch ReactionBatch Reaction
In Batch reaction experiments, concentration, In Batch reaction experiments, concentration, pressure, and or volume are usually measured pressure, and or volume are usually measured and recorded at the different times during the and recorded at the different times during the course of reaction. course of reaction.
Measurements on the differential reactor are Measurements on the differential reactor are made during steady-state operation. The product made during steady-state operation. The product concentrations are monitored for different sets of concentrations are monitored for different sets of feed conditionsfeed conditions
Rate lawRate law
A BA B rA = the rate of formation of species A per unit rA = the rate of formation of species A per unit
volumevolume
-rA = the rate of a disappearance of species A per -rA = the rate of a disappearance of species A per unit volumeunit volume
rB = the rate of formation of species B per unit rB = the rate of formation of species B per unit volume volume
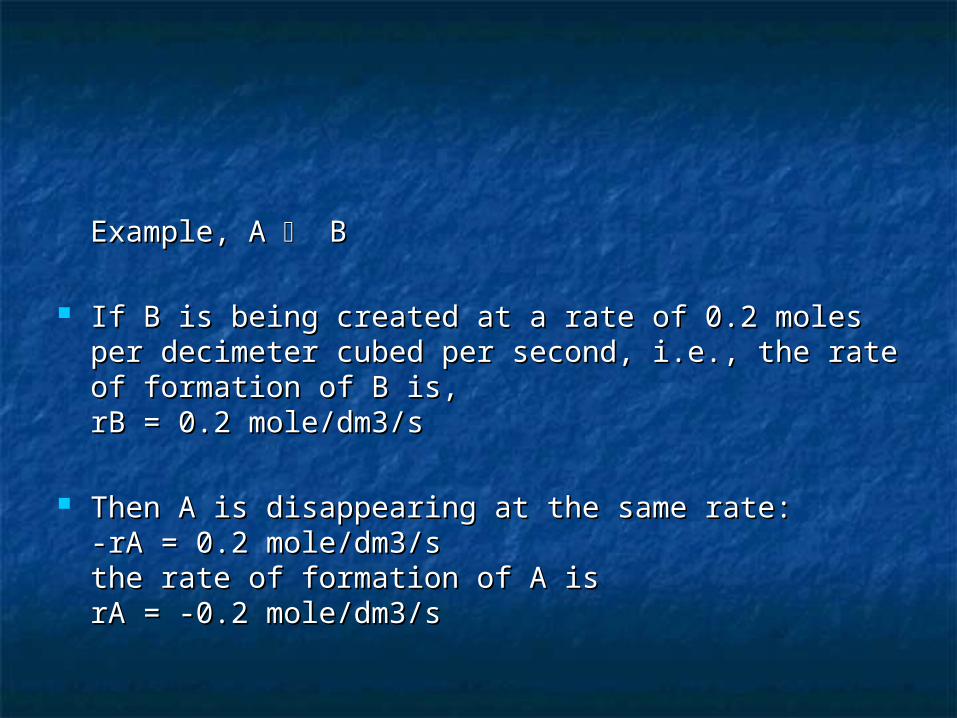
Example, A Example, A B B
If B is being created at a rate of 0.2 moles per If B is being created at a rate of 0.2 moles per decimeter cubed per second, i.e., the rate of decimeter cubed per second, i.e., the rate of formation of B is,formation of B is,rB = 0.2 mole/dm3/srB = 0.2 mole/dm3/s
Then A is disappearing at the same rate:Then A is disappearing at the same rate:-rA = 0.2 mole/dm3/s-rA = 0.2 mole/dm3/sthe rate of formation of A isthe rate of formation of A isrA = -0.2 mole/dm3/s rA = -0.2 mole/dm3/s
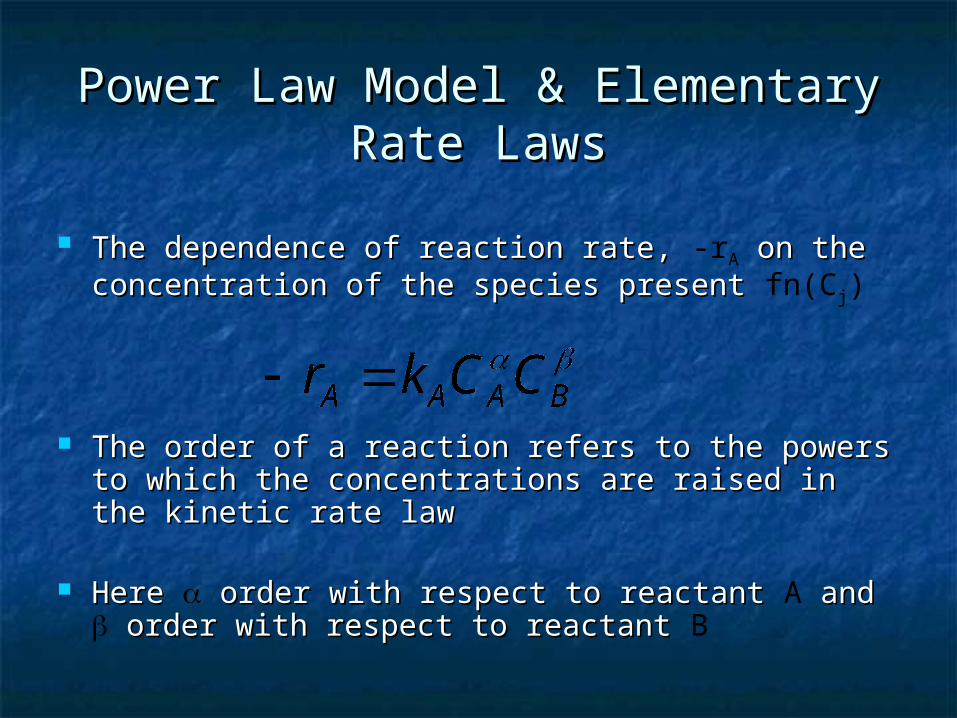
Power Law Model & Elementary Power Law Model & Elementary Rate LawsRate Laws
The dependence of reaction rate, The dependence of reaction rate, -rA on the on the concentration of the species present concentration of the species present fn(Cj)
The order of a reaction refers to the powers to The order of a reaction refers to the powers to which the concentrations are raised in the kinetic which the concentrations are raised in the kinetic rate lawrate law
Here Here order with respect to reactant order with respect to reactant A and and order with respect to reactant order with respect to reactant B
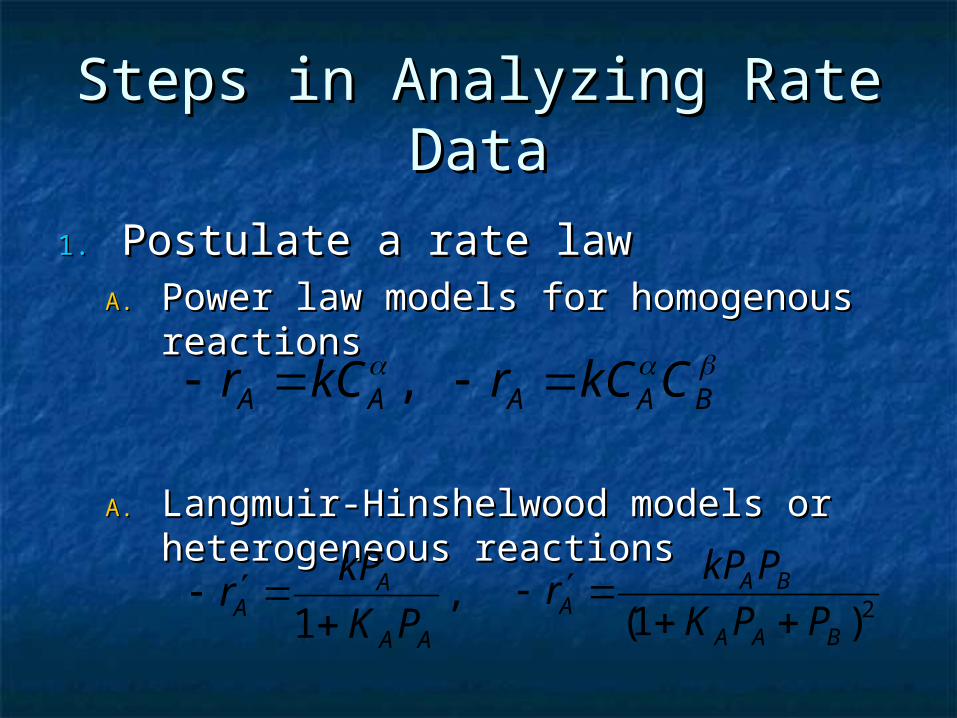
Steps in Analyzing Rate Steps in Analyzing Rate DataData
1.1. Postulate a rate lawPostulate a rate lawA.A. Power law models for homogenous Power law models for homogenous
reactionsreactions
A.A. Langmuir-Hinshelwood models or Langmuir-Hinshelwood models or heterogeneous reactionsheterogeneous reactions
,AA kCr
BAA CkCr
,1 AA
AA PK
kPr
2)1( BAA
BAA PPK
PkPr
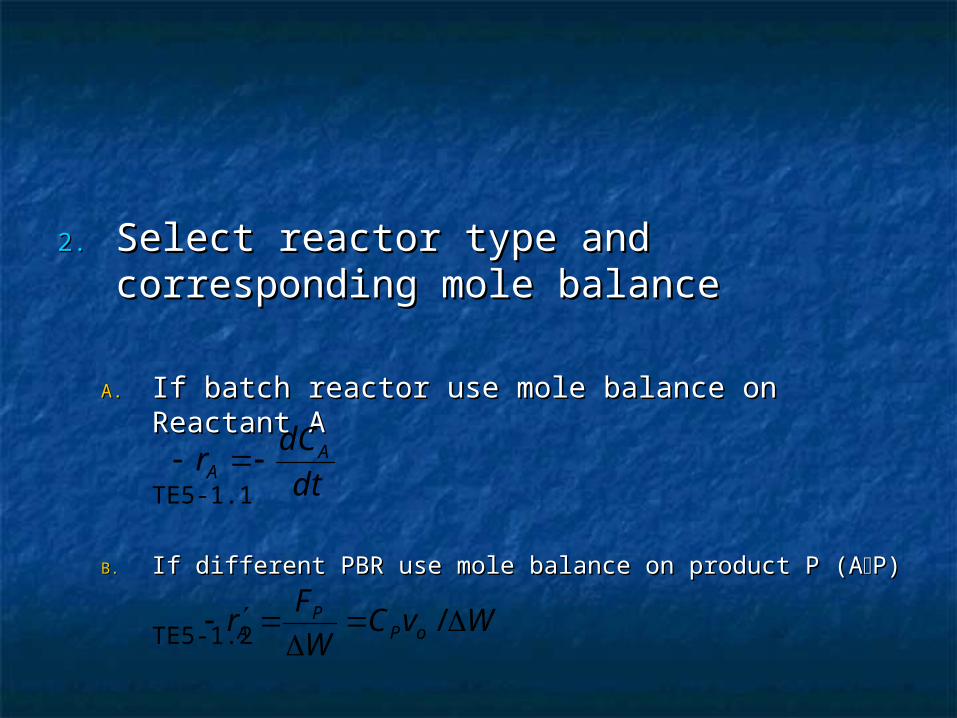
2.2. Select reactor type and corresponding Select reactor type and corresponding mole balancemole balance
A.A. If batch reactor use mole balance on Reactant AIf batch reactor use mole balance on Reactant A
TE5-1.1
B.B. If different PBR use mole balance on product P (AIf different PBR use mole balance on product P (AP)P)
TE5-1.2
dt
dCr AA
WvCW
Fr oP
PA
/
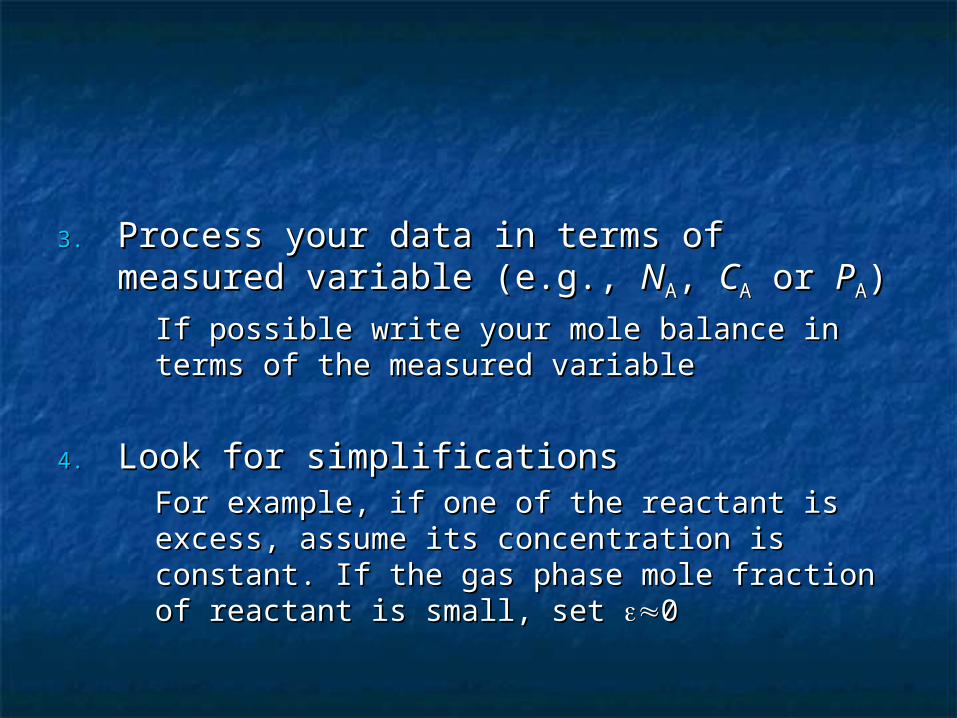
3.3. Process your data in terms of measured Process your data in terms of measured variable (e.g., variable (e.g., NNAA, , CCAA or or PPAA))
If possible write your mole balance in terms of If possible write your mole balance in terms of the measured variablethe measured variable
4.4. Look for simplificationsLook for simplificationsFor example, if one of the reactant is excess, For example, if one of the reactant is excess, assume its concentration is constant. If the gas assume its concentration is constant. If the gas phase mole fraction of reactant is small, set phase mole fraction of reactant is small, set 00
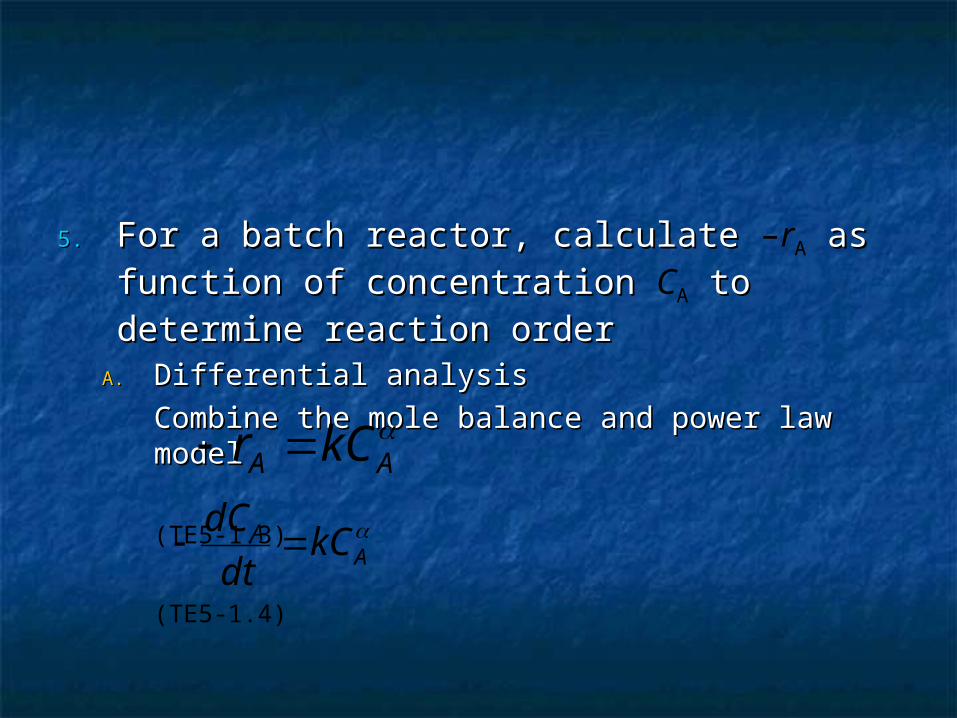
5.5. For a batch reactor, calculate For a batch reactor, calculate –rA as function as function of concentration of concentration CA to determine reaction to determine reaction orderorder
A.A. Differential analysisDifferential analysis
Combine the mole balance and power law modelCombine the mole balance and power law model
(TE5-1.3)
(TE5-1.4)
AA kCr
A
A kCdt
dC
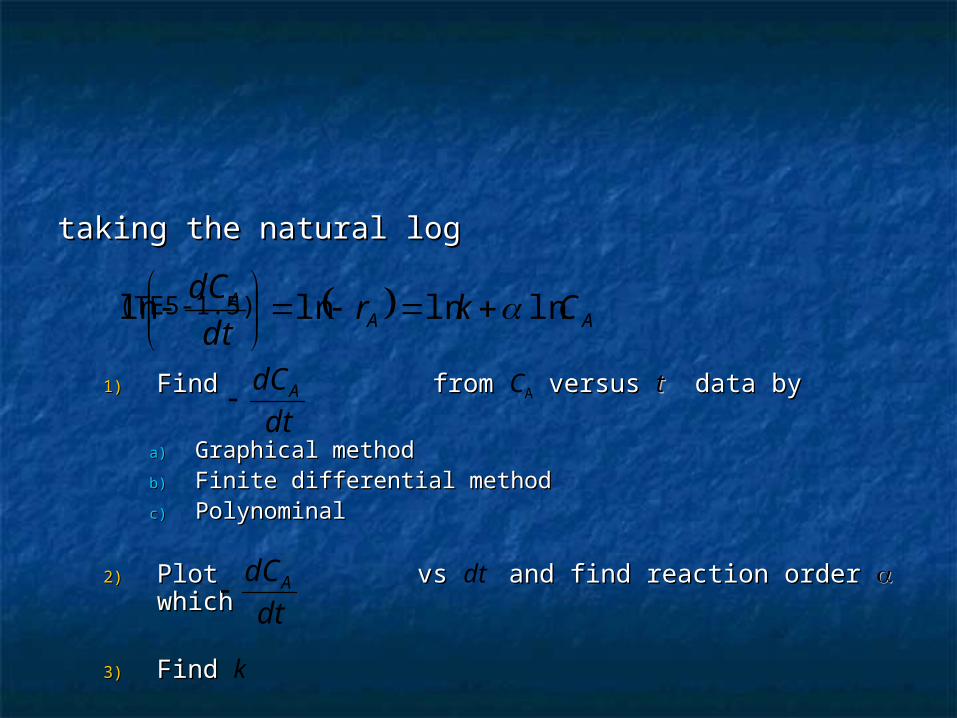
taking the natural logtaking the natural log
(TE5-1.5)
1)1) Find from Find from CA versus versus tt data by data by
a)a) Graphical methodGraphical methodb)b) Finite differential methodFinite differential methodc)c) Polynominal Polynominal
2)2) Plot vs Plot vs dt and find reaction order and find reaction order which which
3)3) Find Find k
AAA Ckr
dt
dClnlnlnln
dt
dCA
dt
dCA
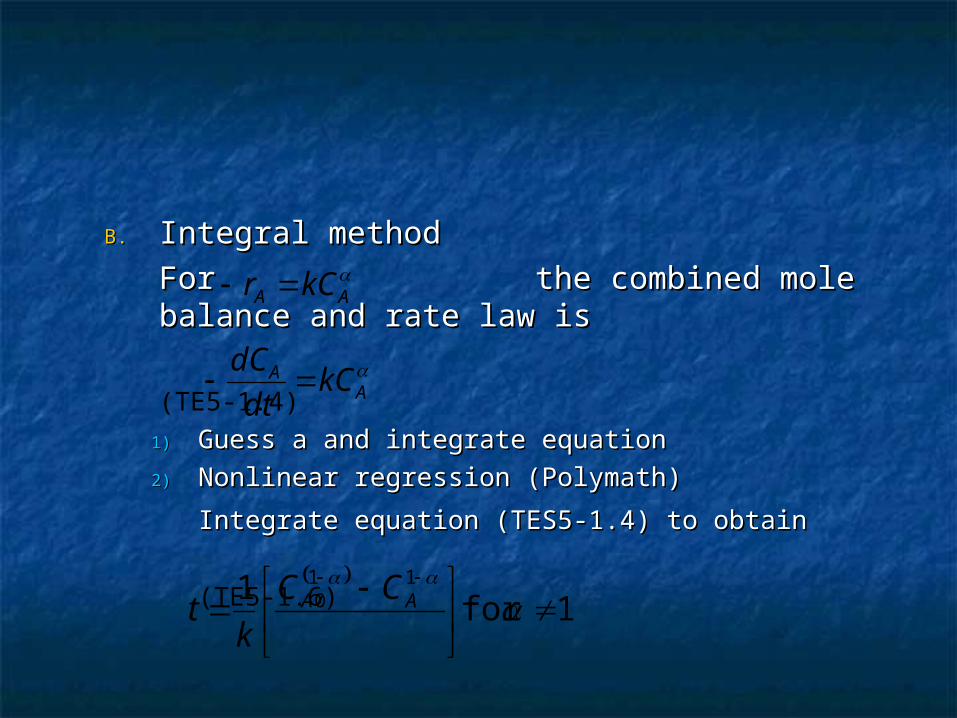
B.B. Integral methodIntegral method
For the combined mole balance For the combined mole balance and rate law isand rate law is
(TE5-1.4)
1)1) Guess a and integrate equationGuess a and integrate equation
2)2) Nonlinear regression (Polymath) Nonlinear regression (Polymath)
Integrate equation (TES5-1.4) to obtainIntegrate equation (TES5-1.4) to obtain
(TE5-1.6)
AA kCr
A
A kCdt
dC
1for
1 110
AA CC
kt
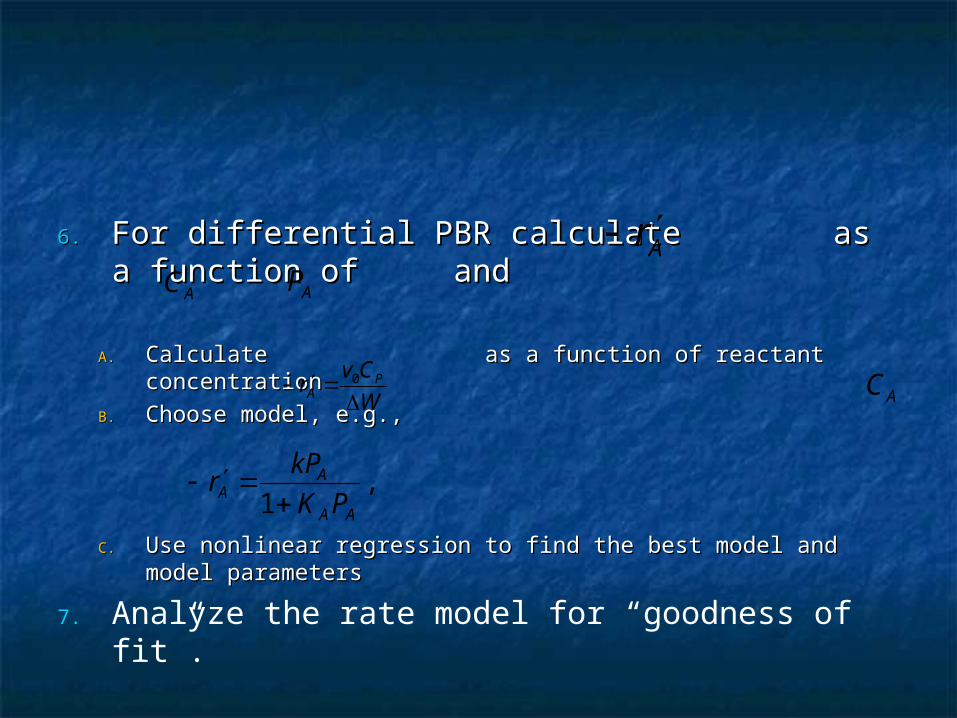
6.6. For differential PBR calculate as a For differential PBR calculate as a function of andfunction of and
A.A. Calculate as a function of reactant concentrationCalculate as a function of reactant concentration
B.B. Choose model, e.g., Choose model, e.g.,
C.C. Use nonlinear regression to find the best model and model Use nonlinear regression to find the best model and model parametersparameters
7. Analyze the rate model for “goodness of fit”.
W
Cvr PA 0
ArAC AP
AC
,1 AA
AA PK
kPr
Batch Reactor DataBatch Reactor Data
Batch reactors are used primarily to determine Batch reactors are used primarily to determine rate law parameters for homogeneous reactionsrate law parameters for homogeneous reactions
Determination is achieved by measuring Determination is achieved by measuring concentration as a function of timeconcentration as a function of time
Use differential, integral and nonlinear regression Use differential, integral and nonlinear regression method of data analysis to determine reaction method of data analysis to determine reaction order, order, and specific reaction rate constant, and specific reaction rate constant, k
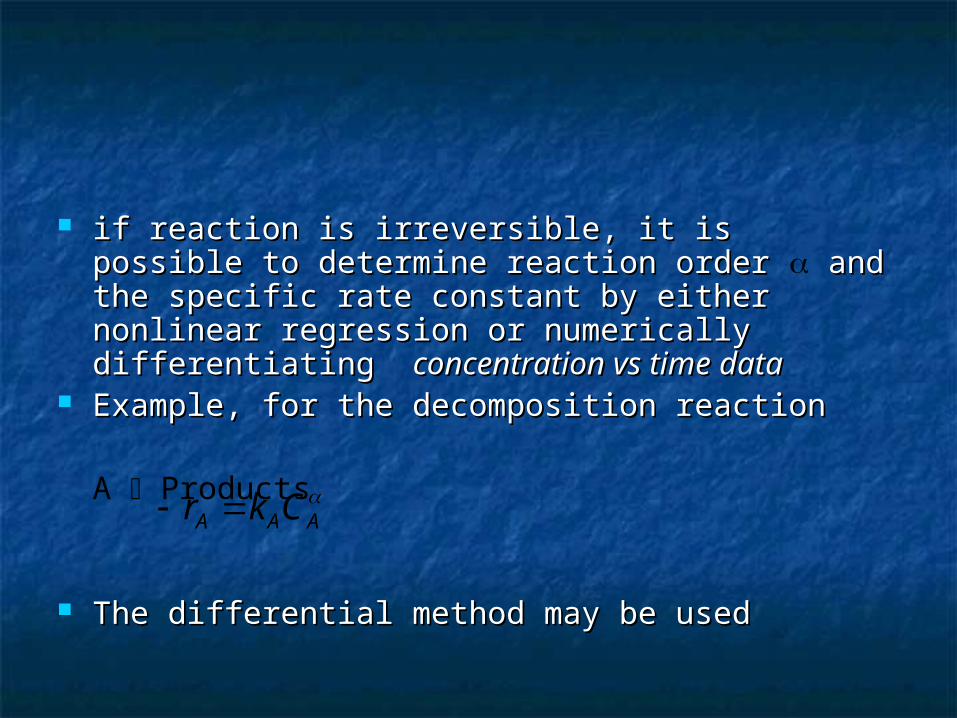
if reaction is irreversible, it is possible to if reaction is irreversible, it is possible to determine reaction order determine reaction order and the specific rate and the specific rate constant by either nonlinear regression or constant by either nonlinear regression or numerically differentiating numerically differentiating concentration vs time concentration vs time datadata
Example, for the decomposition reactionExample, for the decomposition reaction
A Products
The differential method may be usedThe differential method may be used
AAA Ckr
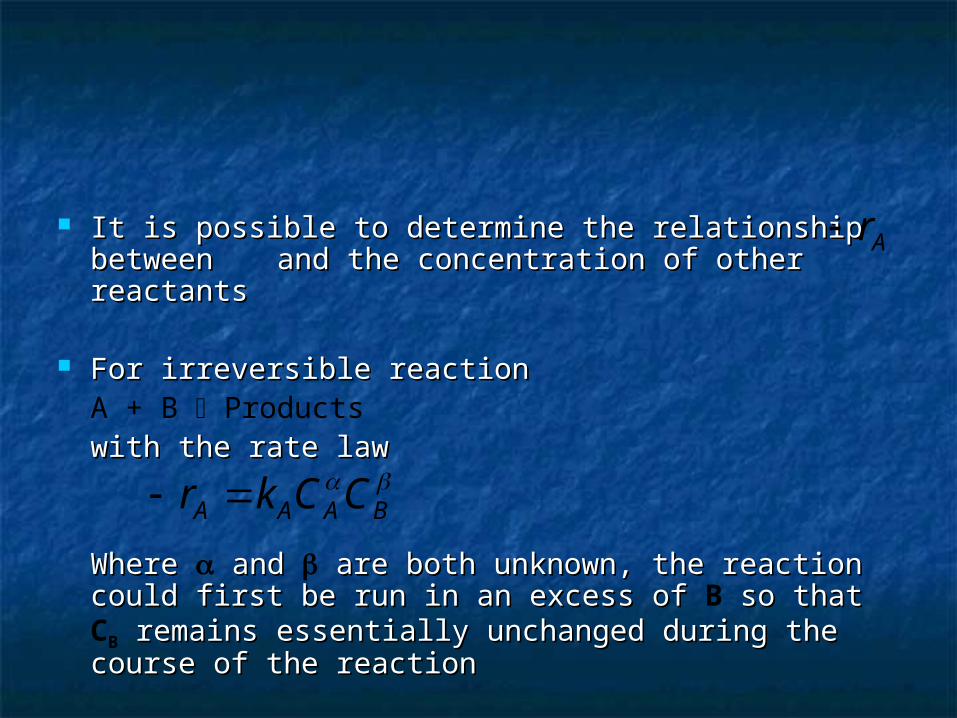
It is possible to determine the relationship between It is possible to determine the relationship between and the concentration of other reactantsand the concentration of other reactants
For irreversible reactionFor irreversible reactionA + B Products
with the rate lawwith the rate law
Where Where and and are both unknown, the reaction are both unknown, the reaction could first be run in an excess of could first be run in an excess of B so that so that CB remains essentially unchanged during the course remains essentially unchanged during the course of the reactionof the reaction
Ar
BAAA CCkr
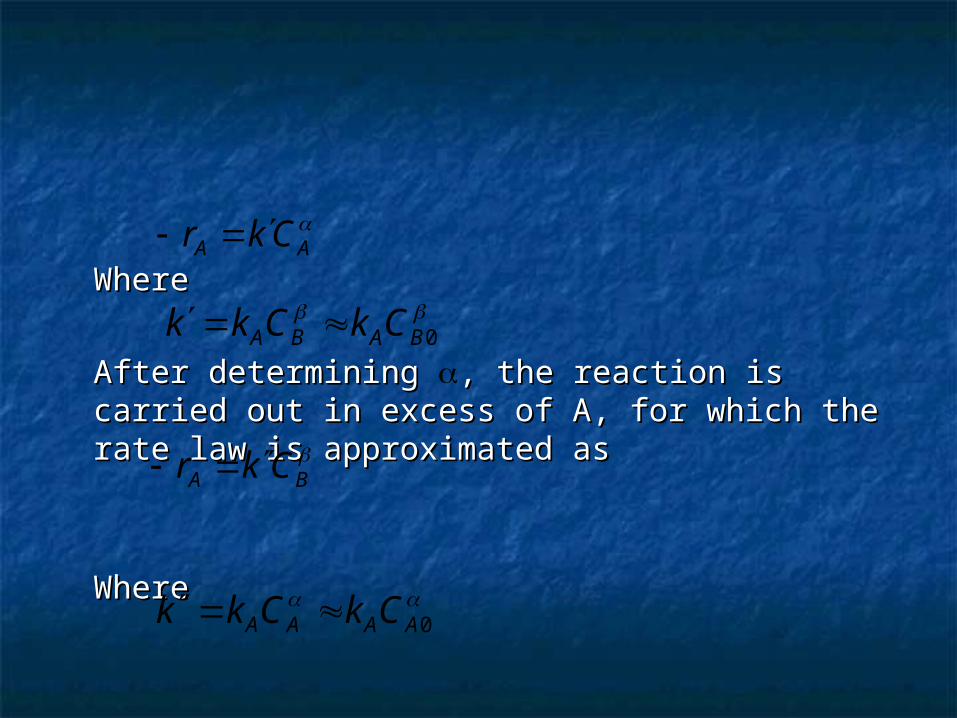
WhereWhere
After determining After determining , the reaction is carried out in , the reaction is carried out in excess of A, for which the rate law is excess of A, for which the rate law is approximated asapproximated as
Where Where
AA Ckr
0BABA CkCkk
BA Ckr
0AAAA CkCkk
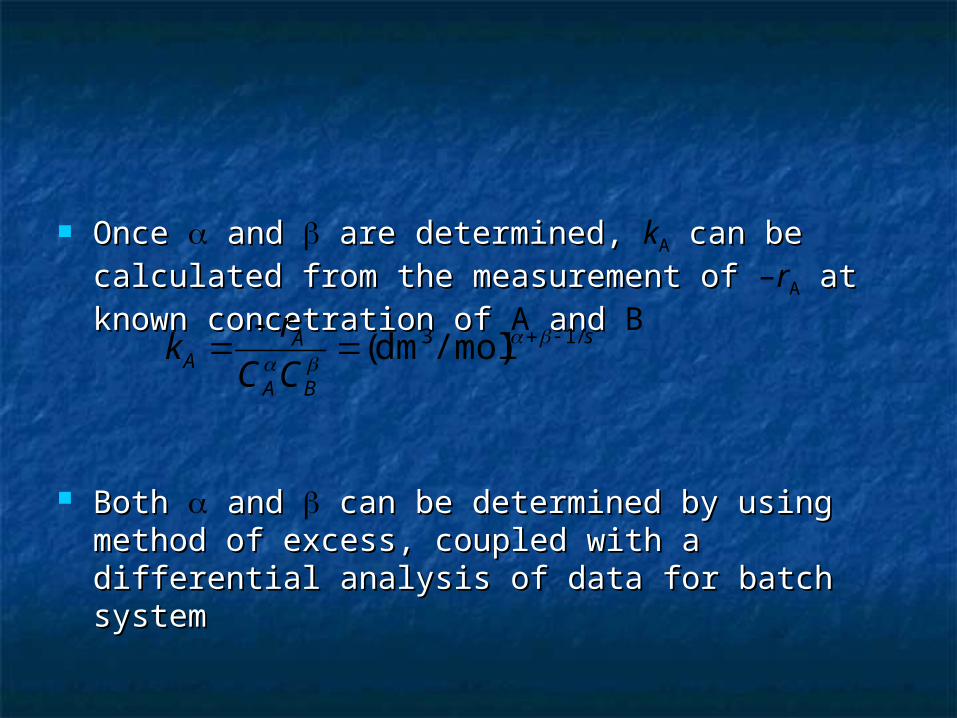
Once Once and and are determined, are determined, kA can be calculated can be calculated from the measurement of from the measurement of –rA at known at known concetration of concetration of A and and B
Both Both and and can be determined by using method can be determined by using method of excess, coupled with a differential analysis of of excess, coupled with a differential analysis of data for batch systemdata for batch system
s
BA
AA CC
rk /13 )/moldm(
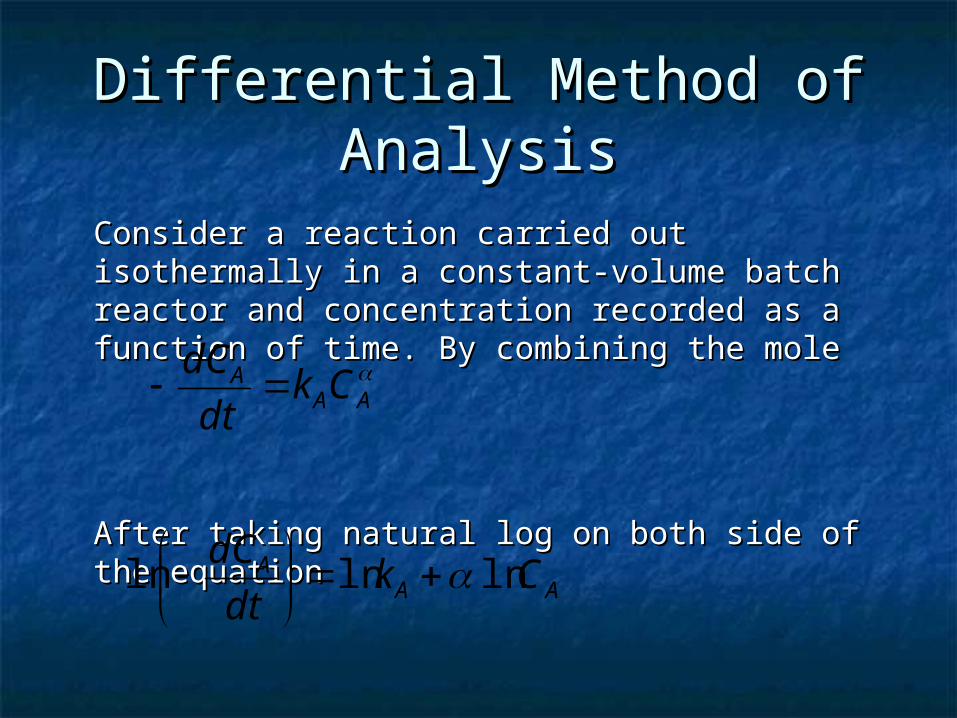
Differential Method of Differential Method of AnalysisAnalysis
Consider a reaction carried out isothermally in a Consider a reaction carried out isothermally in a constant-volume batch reactor and concentration constant-volume batch reactor and concentration recorded as a function of time. By combining the recorded as a function of time. By combining the mole mole
After taking natural log on both side of the After taking natural log on both side of the equationequation
AA
A Ckdt
dC
AAA Ck
dt
dClnlnln
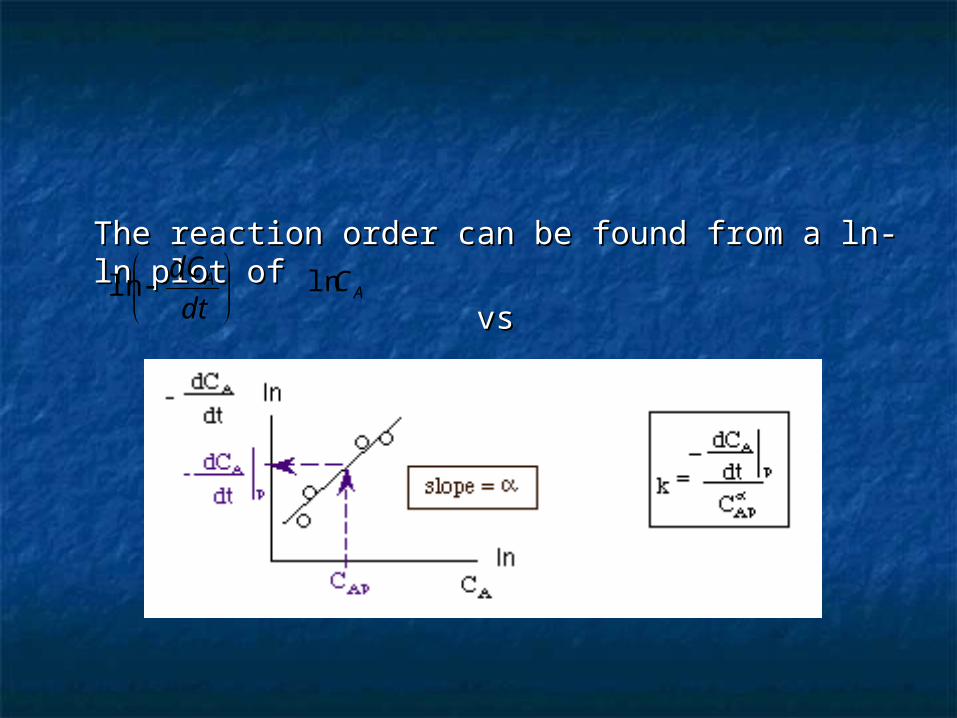
The reaction order can be found from a ln-ln plot The reaction order can be found from a ln-ln plot of of
vs vs
dt
dCAln ACln
Three Ways to Determine (-dCThree Ways to Determine (-dCAA/dt) from /dt) from Concentration-Time Data Concentration-Time Data Graphical differentiationGraphical differentiation Numerical differentiationNumerical differentiation Differentiation of a Polynomial fit to the dataDifferentiation of a Polynomial fit to the data
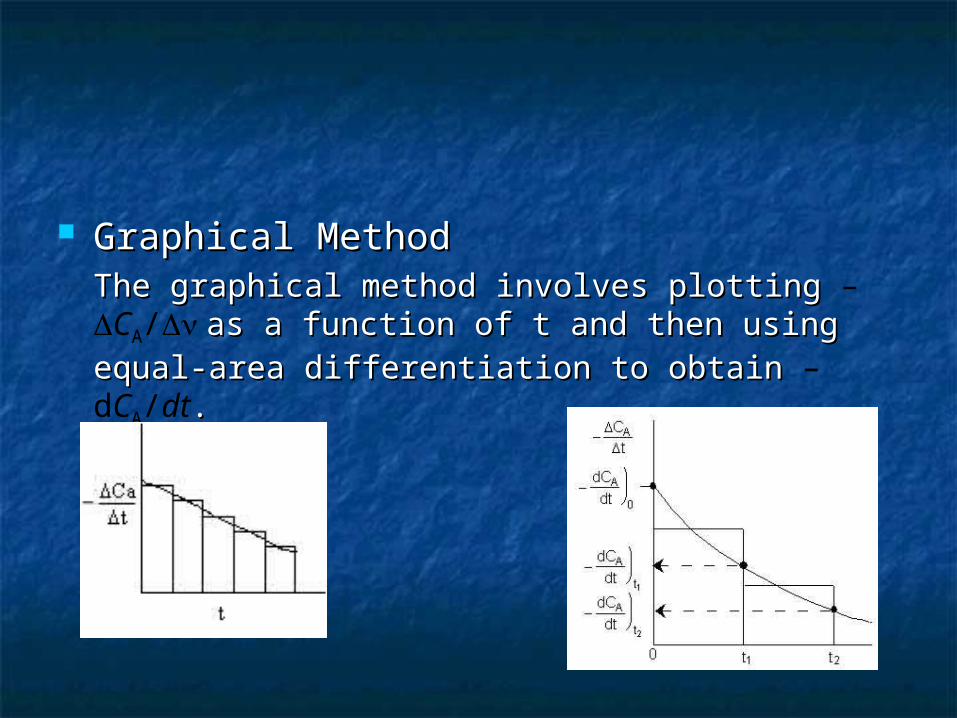
Graphical Method Graphical Method The graphical method involves plotting The graphical method involves plotting –CA/ as as a function of t and then using equal-area a function of t and then using equal-area differentiation to obtain differentiation to obtain –dCA/dt. .
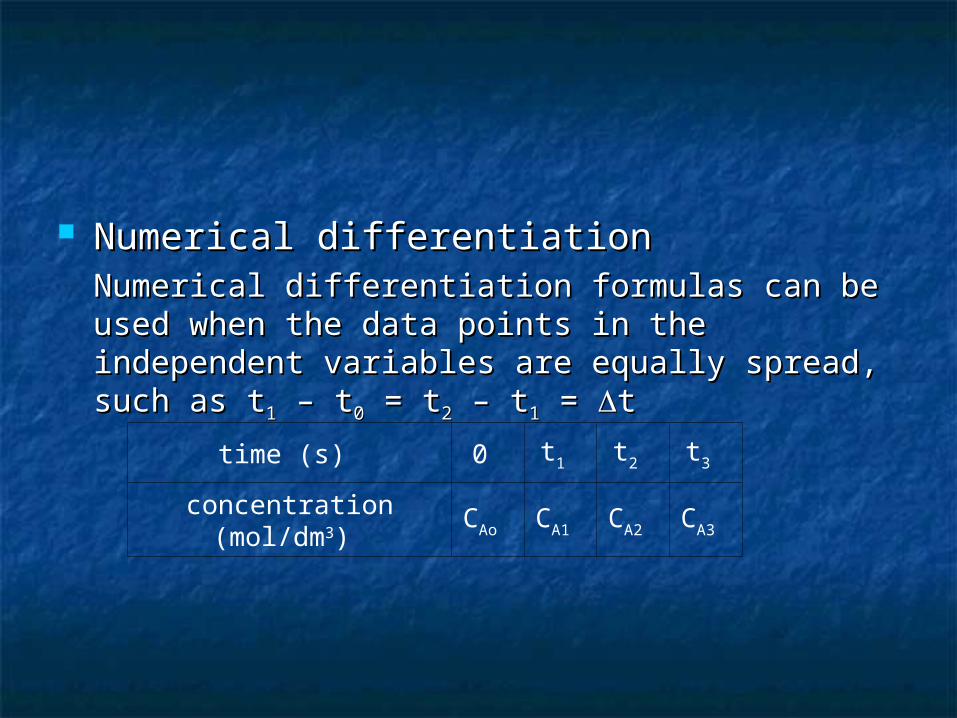
Numerical differentiationNumerical differentiationNumerical differentiation formulas can be used Numerical differentiation formulas can be used when the data points in the independent when the data points in the independent variables are equally spread, such as tvariables are equally spread, such as t11 – t – t00 = t = t22 – – tt11 = = tt
time (s) 0 t1 t2 t3
concentration (mol/dm3)
CAo CA1 CA2 CA3
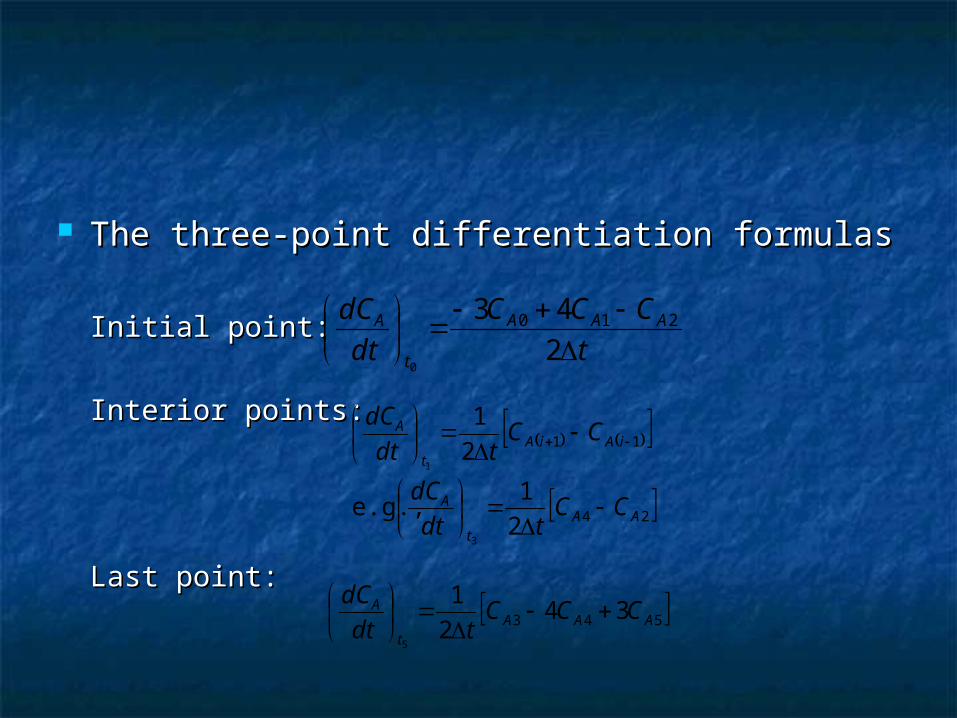
The three-point differentiation formulasThe three-point differentiation formulas
Initial point:Initial point:
Interior points:Interior points:
Last point:Last point:
t
CCC
dt
dC AAA
t
A
2
43 210
0
112
1
1
iAiAt
A CCtdt
dC
242
1e.g.,
3
AAt
A CCtdt
dC
543 342
1
5
AAAt
A CCCtdt
dC
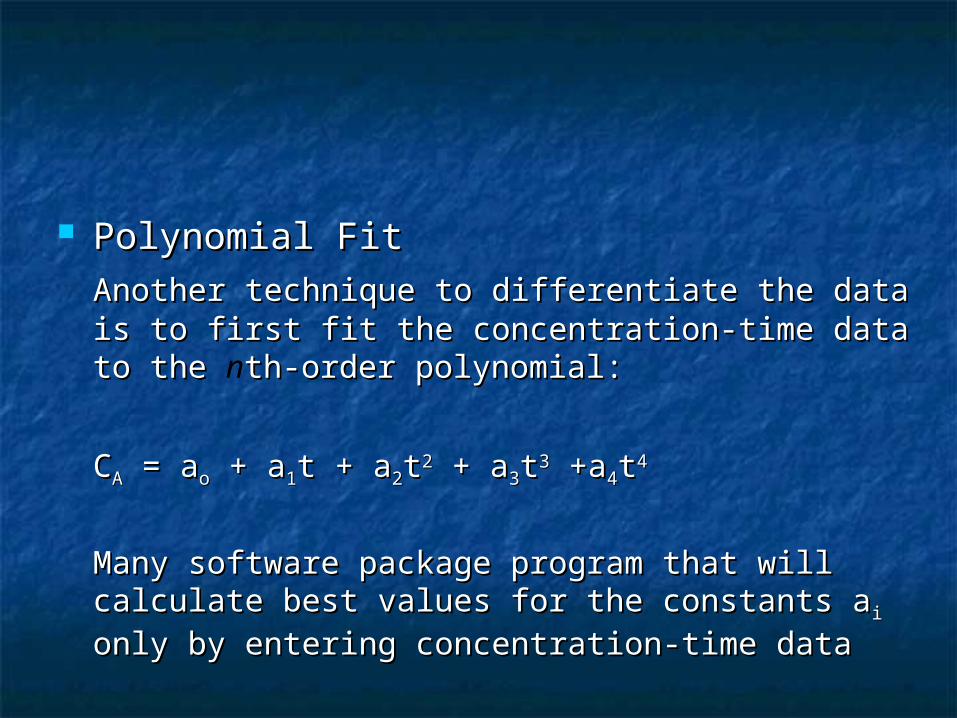
Polynomial FitPolynomial FitAnother technique to differentiate the data is to Another technique to differentiate the data is to first fit the concentration-time data to the first fit the concentration-time data to the nth-order th-order polynomial:polynomial:
CCAA = a = aoo + a + a11t + at + a22tt22 + a + a33tt33 +a +a44tt44
Many software package program that will calculate Many software package program that will calculate best values for the constants abest values for the constants aii only by entering only by entering concentration-time dataconcentration-time data
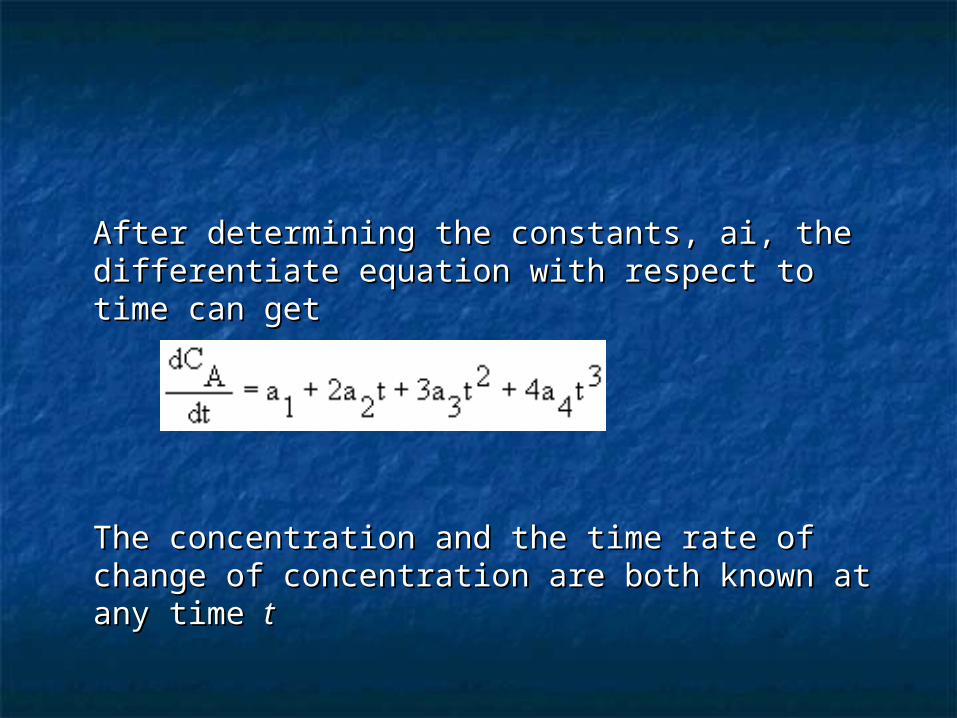
After determining the constants, ai, the After determining the constants, ai, the differentiate equation with respect to time can differentiate equation with respect to time can get get
The concentration and the time rate of change of The concentration and the time rate of change of concentration are both known at any time concentration are both known at any time tt