colombians in boston
TRANSCRIPT

imagine
all the
people C
olom
bian
s
CITY OF BOSTON
Martin J. Walsh
Mayor 2016
Colombians in Boston “imagine all the people” is a series of publications
produced by the Boston Redevelopment Authority
for the Mayor’s Office of Immigrant Advancement.
The series provides a comprehensive profile of Bos-
ton’s diverse immigrant communities and their nu-
merous contributions to the city’s social, cultural and
economic landscape. It is part of an ongoing effort to
celebrate immigrants and gain insight into how they
shape our city.
Photos: Fernandito Bossa

2
Significant emigration from Colombia began in the 1960s because of economic problems, but later increased due to violence and political instability. Between 1996 and 2003, 1.6 million Colombians left their country and did not return. Nearly half migrated between 1999 and 2001, which corresponded with a sig-nificant drop in Colombia’s gross domestic product and a surge in its unem-ployment rate.1 Colombian migration to the United States has slowed since the Recession of 2008-2009 in part due to changes in the U.S. economy but also in response to the Colombian government’s attempts to keep migrants connected to the country and facilitate return migration.2
Venezuela, the United States, and Spain are the leading destinations of Colom-bian migration.3 Massachusetts has the sixth largest share of foreign-born Co-lombians living in the United States (3 percent). States with the largest con-centrations of Colombians include Florida (35 percent), New York (14 percent), New Jersey (10 percent), Texas (6 percent), and California (6 percent).4
Source: U.S. Census Bureau, 2014 American Community Survey, PUMS, BRA Research Division
Share of Foreign-Born Colombian Population by State
Of the 21,9685 foreign-born Colombians residing in Massachusetts in 2014, approximately 4,8516 reside in Boston. This makes Colombia the 8th largest country of origin among Boston’s foreign-born population. Overall, foreign-born Colombians in Boston constitute 2.8 percent of the city’s total foreign-born residents.
Boston’s foreign-born Colombians mostly live in the neighborhood of East Boston (75 percent). Smaller shares of the population live in Dor-chester (3 percent), Jamaica Plain (3 percent) and the South End (2 per-cent).7

3
75% of
Colombians in
Boston live in East
Boston.
Educational Attainment for the Population
25 Years and Older
Demographics and Education
The U.S. Census Bureau’s ACS Public Use Microdata Sample (PUMS) allows for the detailed socio-economic analysis of specific populations. For smaller populations like foreign-born Colombians in Boston, a 5-year sample is re-quired to limit variation due to sampling error. The analysis that follows uses 2009-2013 ACS PUMS data.
Unlike many other foreign-born populations in Boston, Colombians have more males, and 54 percent of foreign-born Colombians are male com-pared to 48 percent of all foreign born. Approximately 36 percent of for-eign-born Colombians are married and 23 percent are widowed, separated, or divorced. Slightly less than 55 percent of all foreign-born Colombians are between the ages of 35 and 64, and the median age of the population is 39 years. A greater share of foreign-born Colombians in Boston arrived in the United States after 2000 (47 percent) compared to all foreign born (43 per-cent). The majority of foreign-born Colombians (74 percent) are not natu-ralized U.S. citizens.
Similar to other foreign-born populations in Boston, 27 percent of foreign-born Colombians age 25 or older lack a high school education and 45 per-cent have a completed high school as their highest educational attainment. Approximately 29 percent of foreign-born Colombians have attended col-lege, with slightly more than 17 percent having completed at least a bache-lor’s degree, compared with 29 percent of the entire foreign-born popula-tion and 52 percent of the native-born. Only 8 percent of Colombians living in Boston hold a graduate or professional degree, compared with 14 per-cent of all foreign-born and 22 percent of the native-born.
U.S. Census Bureau, 2009-2013 American Community Survey, PUMS, BRA Research Division Analysis

4
The labor force participation rate8 of Colombians is 81 percent compared to 68 percent for all foreign born and 69 percent for the native-born popu-lation. A disproportionate share of foreign-born Colombians living in Bos-ton are employed in service-related occupations.9 Over two-thirds work in service occupations, compared to 48 percent of all foreign born. Of all for-eign-born Colombians who work in this broad services category, 34 percent work in food preparation and serving occupations and 12 percent work in building and grounds cleaning and maintenance occupations. Colombians are underrepresented in white-collar occupations compared to both the native born and all foreign born. A greater share of foreign-born Colombi-ans work in blue-collar occupations compared to the native born, but a smaller share do when compared to all foreign born.
Occupations by Nativity
Labor Force Participation
U.S. Census Bureau, 2009-2013 American Community Survey, PUMS, BRA Research Division Analysis
5
76% of
Colombians
work for
private for-profit
companies,
mostly in service
occupations.
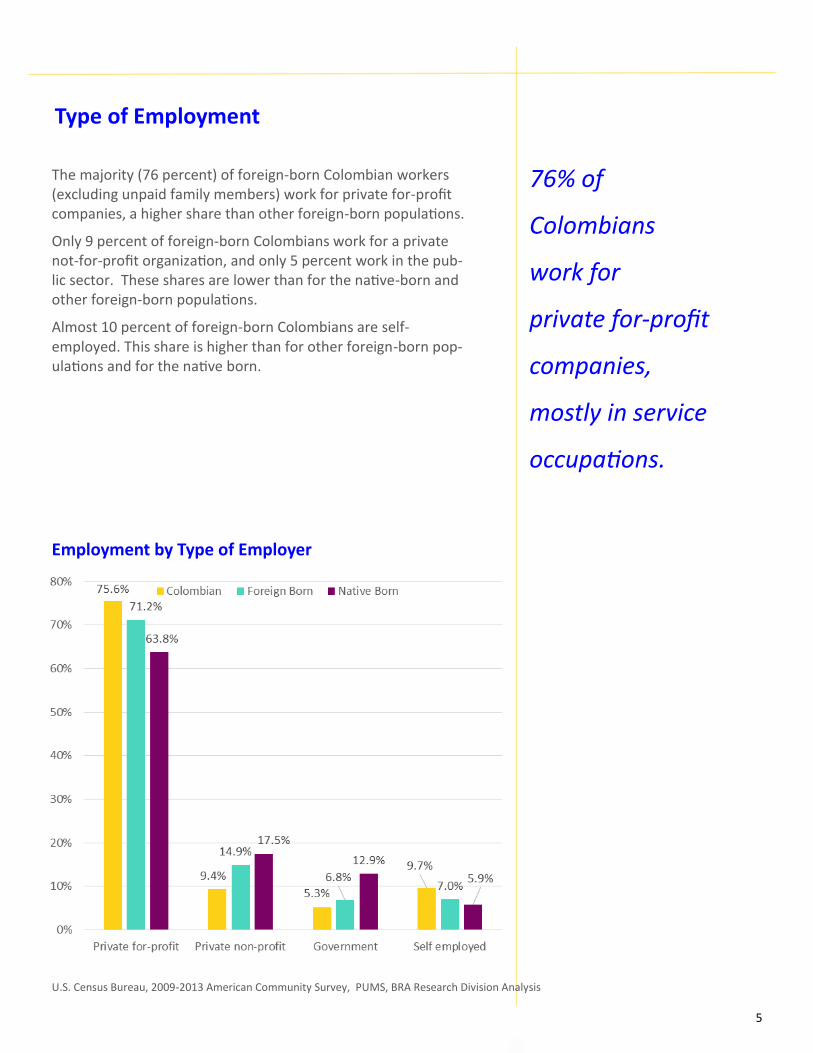
The majority (76 percent) of foreign-born Colombian workers (excluding unpaid family members) work for private for-profit companies, a higher share than other foreign-born populations.
Only 9 percent of foreign-born Colombians work for a private not-for-profit organization, and only 5 percent work in the pub-lic sector. These shares are lower than for the native-born and other foreign-born populations.
Almost 10 percent of foreign-born Colombians are self-employed. This share is higher than for other foreign-born pop-ulations and for the native born.
Employment by Type of Employer
U.S. Census Bureau, 2009-2013 American Community Survey, PUMS, BRA Research Division Analysis
Type of Employment

6
Gender
Marital Status
Source: U.S. Census Bureau, 2009-2013 American Community Survey, PUMS, BRA Research Division Analysis
Imagine all the people:
Age

7
Medical Uninsurance
Housing Tenure*
Housing Costs*
*Housing data are based on the householder’s nativity.

8

9
Over half of
adult (age 25+)
Colombians lack
a high school
diploma or
English
proficiency.
Approximately 23 percent of foreign-born Colombians have achieved a mid-dle class standard of living, compared with 45 percent of Boston’s native-born population, and 29 percent of all foreign born. A family income four times the poverty level is used as a proxy for a middle-class standard of liv-ing. The actual income needed to achieve this standard depends on the size and composition of the family. For a two-person family in 2014, a middle class income would be at least $62,920. In contrast, only slightly less than 13 percent of foreign-born Colombians live below the federal poverty level compared to 20 percent for the city’s population.
Low educational attainment and lack of English proficiency appear to be hin-dering foreign-born Colombians’ standard of living.10 Over half of foreign-born adult Colombians lack a high school diploma or English proficiency. Nearly 21 percent of Boston’s adult foreign-born Colombian population lack a high school diploma and have limited English proficiency compared to 18 percent for all foreign born.
Educational Attainment and English Proficiency
Population 25 Years or Older
Standard of Living
U.S. Census Bureau, 2009-2013 American Community Survey, PUMS, BRA Research Division Analysis

10
Economic Impact
Foreign-born Colombians contribute to the local economy through their la-bor and consumer spending. The total value of their economic contributions was estimated using a Regional Economic Model (REMI) that calculated the value of goods and services consumed on each dollar spent. Foreign-born Colombians in Boston generated total expenditures of nearly $110 million in 2014.11 These annual expenditures contributed slightly less than $66 million to the regional product and generated $3.6 million in state and local taxes.12 In total, these expenditures supported 475 jobs in the Massachusetts econo-my.13
Conclusion
Foreign-born Colombians have developed a strong presence in East Boston. There they actively contribute to the economic, cultural, and civic life of the neighborhood. Even though foreign-born Colombians have lower levels of educational attainment, they have high labor force participation. With their concentration of employment in the service sector, they serve a vital role in the Boston labor market. Even though these service sector jobs may not pay high wages, their high labor force participation helps Colombians have a smaller population share living below the federal poverty level than the population as a whole.
Colombian restaurant in East Boston—Arley M.

11
1From the Global Migrant Origin Database at the Development Research Center on Migration, Globilisation and Poverty: http://www.migrationdrc.org/research/typesofmigration/global_migrant_origin_database.html
2Bérubé, M., Colombia: In the Crossfire. Migration Policy Institute (MPI) (2005). 3UNICEF Migration Profiles, 2013. 4Bérubé, M., Colombian Diaspora in the United States. MPI (2005). 5American Factfinder website Table B05006 reports 21,588 Colombians in Massa-chusetts with a margin of error of +/- 3,305 in 2014. The 21,968 estimate reported for this analysis was tabulated from 2014 U.S. Census Bureau Public Use Microdata Sample data. Both estimates contain a margin of error due to sampling methodolo-gy. Lower survey response rates due to language or documentation issues may re-sult in an undercount of the population.
Lower survey response rates due to language or documentation issues may result in
an undercount of the population.
For more information on American Fact Finder please see http://factfinder.census.gov/home/saff/main.html?_lang=en. 6American Factfinder website Table B05006 reports 4,864 Colombians in Boston with a margin of error of +/- 1,451 in 2014. The 2014 U.S. Census Bureau Public Use Microdata Sample data estimates 4,851 foreign-born Colombians for Boston. 7 U.S. Census Bureau, 2009-2013 American Community Survey, American Factfinder, BRA Research Analysis (2016). 8 Defined as the share of the working-age population that is either currently em-ployed or seeking work. U.S. Department of Labor, BLS. (2016).
9 For a smaller population like foreign-born Colombians in Boston, occupations fall into three broad categories. White collar includes managerial & professional, health care, education, and arts, design entertainment, sports & media occupa-tions. Service includes service, sales, office & administrative support, community & social service occupations. Blue collar includes construction, farming, fishing, and forestry, and production occupations. Military specific occupations and long-term unemployed are excluded from the analysis. 10 The Limited English Proficient includes immigrant adults who do not speak English at all or who do not speak it well. 11 BRA Research Division Analysis, 2014, Regional Economic Model, Inc., REMI calcu-lations.
12 BRA Research Division Analysis, 2014, Regional Economic Model, Inc., REMI calcu-lations. 13 BRA Research Division Analysis, 2014, Regional Economic Model, Inc., REMI calcu-lations.
12
Produced by BRA Research Division
Alvaro Lima – Director of Research
Jonathan Lee– Deputy Director
Christina Kim – Research Manager
Phillip Granberry – Senior Researcher/Demographer
Matthew Resseger – Senior Researcher/Economist
Kevin Kang – Research Associate
Kevin Wandrei – Research Assistant
Interns:
Xiaoxiao Ma
Michael Bratsis
Map by BRA Digital Cartography & GIS Alla Ziskin
Brian P. Golden, Director