colorado river basin water supply and demand study: moving forward municipal and industrial water...
TRANSCRIPT

Colorado River Basin Water Supply and Demand Study: Moving Forward
Municipal and Industrial Water Conservation and Reuse
Workgroup
Marc Waage, Manager of Water Resources Planning, Denver Water
Colorado River Water Users Association Conference December 11, 2014

WorkgroupCo-chairs
– Kathleen Ferris, Arizona Municipal Water Users Association– Jack Safely, The Metropolitan Water District of Southern California– Marc Waage, Denver Water
Lead Consultant: Armin Munévar, CH2M Hill
John Stomp, Albuquerque-Bernalillo County W.U.A.Jenny Hoffner, American RiversCarol Ward-Morris, Arizona Municipal Water Users Association (alt chair)Robert Lotts, Arizona Public ServiceScott Miller, Arizona Public ServiceKen Nowak, Bureau of ReclamationPaula Silva, CH2M HILL (contractor team)Brian Skeens, CH2M HILL (contractor team)Clint Bassett, Cheyenne Board of Public UtilitiesBrad Hill, City of FlagstaffRick Carpenter, City of Santa FeAngela Rashid, Colorado River Board of CaliforniaJohn Currier, Colorado River Water Conservation District
Scott Winter, Colorado Springs Utilities
Kevin Reidy, Colorado Water Conservation BoardElizabeth Lovsted, Eastern Municipal Water DistrictRich Atwater, Environmental Defense FundBen Bracken, Green River-Rock Springs-Sweetwater County Joint Powers Water BoardBart Forsyth, Jordan Valley Water Conservancy DistrictPenny Falcon, Los Angeles Department of Water & PowerJohn Longworth, New Mexico Office of the State EngineerMike Greene, Public Service Company of New MexicoDan Denhan, San Diego County Water AuthorityThomas Maher, Southern Nevada Water AuthorityErin Young, City of Flagstaff Michael Cohen, Independent Consultant
Workgroup participants:

Tasks
1 Quantify water savings to date
2 Highlight successful, innovative water savings programs
3 Compile projected future savings
4 Evaluate the impact of savings on Colorado River use
5 Identify future opportunities and challenges

Metropolitan Areas Receiving Colorado River Water
Metropolitan Areas Receiving Colorado River
Water

Municipal use• Per capita use decreased by 12 percent to 38 percent since 1990 • Uses ranges from 153 GPCD to 314 GPCD. • At least 1.7 MAFY saved as compared to 1990 per capita levels
Municipal and industrial reuse• 700 KAFY reuse in 2012. • A significant portion of treated wastewater flows are used for non-
municipals uses including groundwater recharge, agricultural uses, and wetland habitats.
• In some metropolitan areas, greater than 90 percent of the reusable supply is currently being reused
Accounting for both changes in per capita use and water reuse, M&I water use could have been nearly 2.4 MAFY higher in 2010.
1) Savings

Categories • Metering and billing• Public education• System water loss characterization and reduction • Residential indoor water conservation • Commercial, industrial, and institutional conservation• Outdoor landscaping water conservation • Reuse
2) Innovative Conservation and Reuse Programs
Over 400 conservation and reuse programs reviewed Selected 34 programs as case studies

3) Projected Additional Savings by 2030
• Conservation: 700 KAFY* • Reuse: 400 KAFY
* for the water providers for which numeric targets were identified compared to 2010 per capita water use rates

Municipal providers in the metropolitan areas receiving CR water manage their water supplies conjunctively and many must use surface water supplies first to protect groundwater or prevent groundwater mining and its consequences. Additional M&I conservation and reuse has the potential to reduce the amount of future development of CR water. However, in many regions, conservation and reuse may not result in substantial reductions in diversions of CR water because conservation is typically used to either meet future growth or offset/delay the need for future water supplies. Municipal water providers are planning to use their full entitlements to CR water.
4) Impact of savings on Colorado River use

5) Categories of Potential Opportunities
1. Outdoor use
2. Social norming with water customers
3. Integration of water/energy conservation programs
4. Integration of land and water use planning
5. Goal setting for conservation and reuse programs
6. Funding and resources for conservation programs
7. Water system losses
8. Partnerships with commercial, institutional and industrial users
9. Conservation oriented water rates and incentive programs
10. Regulations and ordinances

The End

Use Trends: Front Range and Wasatch
0
500,000
1,000,000
1,500,000
2,000,000
2,500,000
3,000,000
0
100,000
200,000
300,000
400,000
500,000
600,000
700,000
1980
1982
1984
1986
1988
1990
1992
1994
1996
1998
2000
2002
2004
2006
2008
2010
2012
Popu
latio
n
Wat
er D
eliv
ery
(Acr
e Fe
et)
Population ServedTotal Annual Water Production
Front Range
0
50
100
150
200
250
300
1980
1982
1984
1986
1988
1990
1992
1994
1996
1998
2000
2002
2004
2006
2008
2010
2012
Per C
apita
Wat
er U
se (G
PCD
)
Front Range
Actual 1990 Mean 2000 Mean 2010 Mean
227 218 (-4%)
178 (-22%,-18%)
0
200,000
400,000
600,000
800,000
1,000,000
1,200,000
0
50,000
100,000
150,000
200,000
250,000
300,000
1980
1982
1984
1986
1988
1990
1992
1994
1996
1998
2000
2002
2004
2006
2008
2010
2012
Popu
latio
n
Wat
er D
eliv
ery
(Acr
e Fe
et)
Population ServedTotal Annual Water Production
Wasatch Front
0
50
100
150
200
250
300
1980
1982
1984
1986
1988
1990
1992
1994
1996
1998
2000
2002
2004
2006
2008
2010
2012
Per C
apita
Wat
er U
se (G
PCD
)
Wasatch Front
Actual 1990 Mean 2000 Mean 2010 Mean
262
224 (-15%)

0
100,000
200,000
300,000
400,000
500,000
600,000
700,000
800,000
0
20,000
40,000
60,000
80,000
100,000
120,000
140,000
160,000
1980
1982
1984
1986
1988
1990
1992
1994
1996
1998
2000
2002
2004
2006
2008
2010
2012
Popu
latio
n
Wat
er D
eliv
ery
(Acr
e Fe
et)
Population ServedTotal Annual Water Production
Middle Rio Grande
0
50
100
150
200
250
300
1980
1982
1984
1986
1988
1990
1992
1994
1996
1998
2000
2002
2004
2006
2008
2010
2012
Per C
apita
Wat
er U
se (G
PCD
)
Middle Rio Grande
Actual 1990 Mean 2000 Mean 2010 Mean
243 201 (-17%)
152 (-37%,-24%)
Use Trends: Middle Rio Grande and Southern Nevada
0
500,000
1,000,000
1,500,000
2,000,000
2,500,000
0
100,000
200,000
300,000
400,000
500,000
600,000
1980
1982
1984
1986
1988
1990
1992
1994
1996
1998
2000
2002
2004
2006
2008
2010
2012
Popu
latio
n
Wat
er D
eliv
ery
(Acr
e Fe
et)
Population ServedTotal Annual Water Production
Southern Nevada
0
50
100
150
200
250
300
350
400
1980
1982
1984
1986
1988
1990
1992
1994
1996
1998
2000
2002
2004
2006
2008
2010
2012
Per C
apita
Wat
er U
se (G
PCD
)
Southern Nevada
Actual 1990 Mean 2000 Mean 2010 Mean
338 309 (-9%)
228 (-33%,-26%)

0
1,000,000
2,000,000
3,000,000
4,000,000
5,000,000
6,000,000
0
200,000
400,000
600,000
800,000
1,000,000
1,200,000
1980
1982
1984
1986
1988
1990
1992
1994
1996
1998
2000
2002
2004
2006
2008
2010
2012
Popu
latio
n
Wat
er D
eliv
ery
(Acr
e Fe
et)
Population ServedTotal Annual Water Production
Central Arizona
0
50
100
150
200
250
300
1980
1982
1984
1986
1988
1990
1992
1994
1996
1998
2000
2002
2004
2006
2008
2010
2012
Per C
apita
Wat
er U
se (G
PCD
)
Central Arizona
Actual 1990 Mean 2000 Mean 2010 Mean
227 228 (0.4%)
195 (-14%,-15%)
Use Trends: Central Arizona and Coastal Southern California
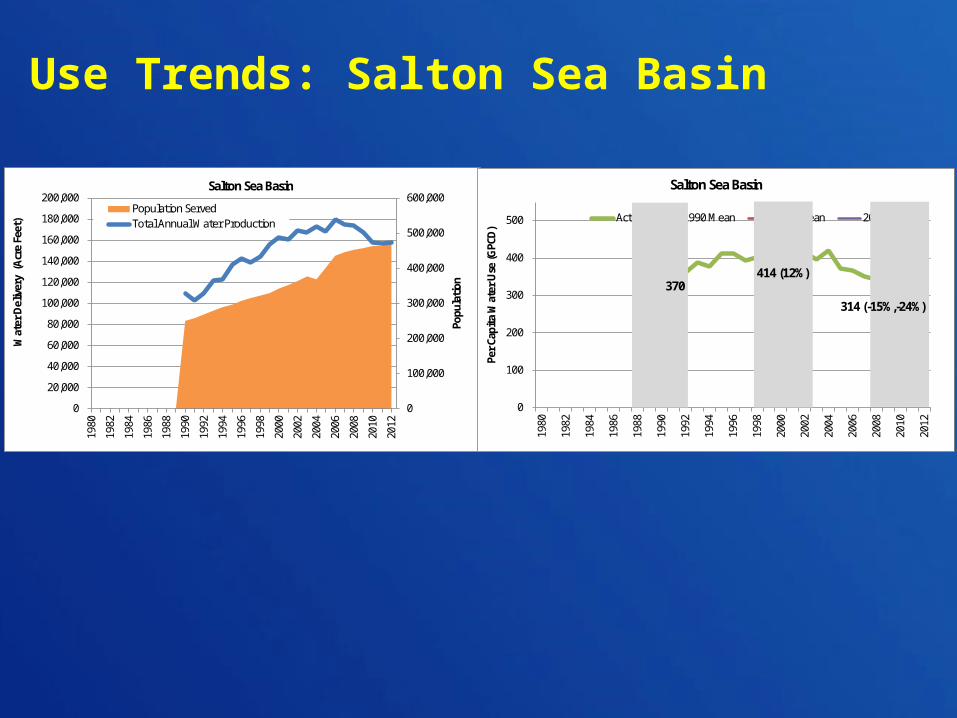
Use Trends: Salton Sea Basin
0
100,000
200,000
300,000
400,000
500,000
600,000
0
20,000
40,000
60,000
80,000
100,000
120,000
140,000
160,000
180,000
200,000
1980
1982
1984
1986
1988
1990
1992
1994
1996
1998
2000
2002
2004
2006
2008
2010
2012
Popu
latio
n
Wat
er D
eliv
ery
(Acr
e Fe
et)
Population ServedTotal Annual Water Production
Salton Sea Basin
0
100
200
300
400
500
1980
1982
1984
1986
1988
1990
1992
1994
1996
1998
2000
2002
2004
2006
2008
2010
2012
Per C
apita
Wat
er U
se (G
PCD
)
Salton Sea Basin
Actual 1990 Mean 2000 Mean 2010 Mean
370 414 (12%)
314 (-15%,-24%)

Metropolitan Areas Receiving Colorado River Water